Santa Claus, GA Map & Demographics
Santa Claus Map
Santa Claus Overview
$31,535
PER CAPITA INCOME
$70,833
AVG FAMILY INCOME
$46,250
AVG HOUSEHOLD INCOME
38.7%
WAGE / INCOME GAP [ % ]
61.3¢/ $1
WAGE / INCOME GAP [ $ ]
0.46
INEQUALITY / GINI INDEX
146
TOTAL POPULATION
66
MALE POPULATION
80
FEMALE POPULATION
82.50
MALES / 100 FEMALES
121.21
FEMALES / 100 MALES
47.5
MEDIAN AGE
2.8
AVG FAMILY SIZE
2.1
AVG HOUSEHOLD SIZE
61
LABOR FORCE [ PEOPLE ]
53.0%
PERCENT IN LABOR FORCE
3.3%
UNEMPLOYMENT RATE
Income in Santa Claus
Income Overview in Santa Claus
Per Capita Income in Santa Claus is $31,535, while median incomes of families and households are $70,833 and $46,250 respectively.
| Characteristic | Number | Measure |
| Per Capita Income | 146 | $31,535 |
| Median Family Income | 42 | $70,833 |
| Mean Family Income | 42 | $93,212 |
| Median Household Income | 69 | $46,250 |
| Mean Household Income | 69 | $65,916 |
| Income Deficit | 42 | $0 |
| Wage / Income Gap (%) | 146 | 38.67% |
| Wage / Income Gap ($) | 146 | 61.33¢ per $1 |
| Gini / Inequality Index | 146 | 0.46 |
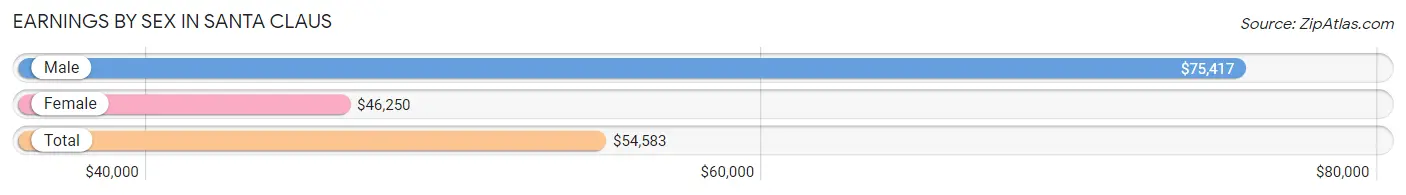
Earnings by Sex in Santa Claus
Average Earnings in Santa Claus are $54,583, $75,417 for men and $46,250 for women, a difference of 38.7%.
| Sex | Number | Average Earnings |
| Male | 30 (50.8%) | $75,417 |
| Female | 29 (49.1%) | $46,250 |
| Total | 59 (100.0%) | $54,583 |
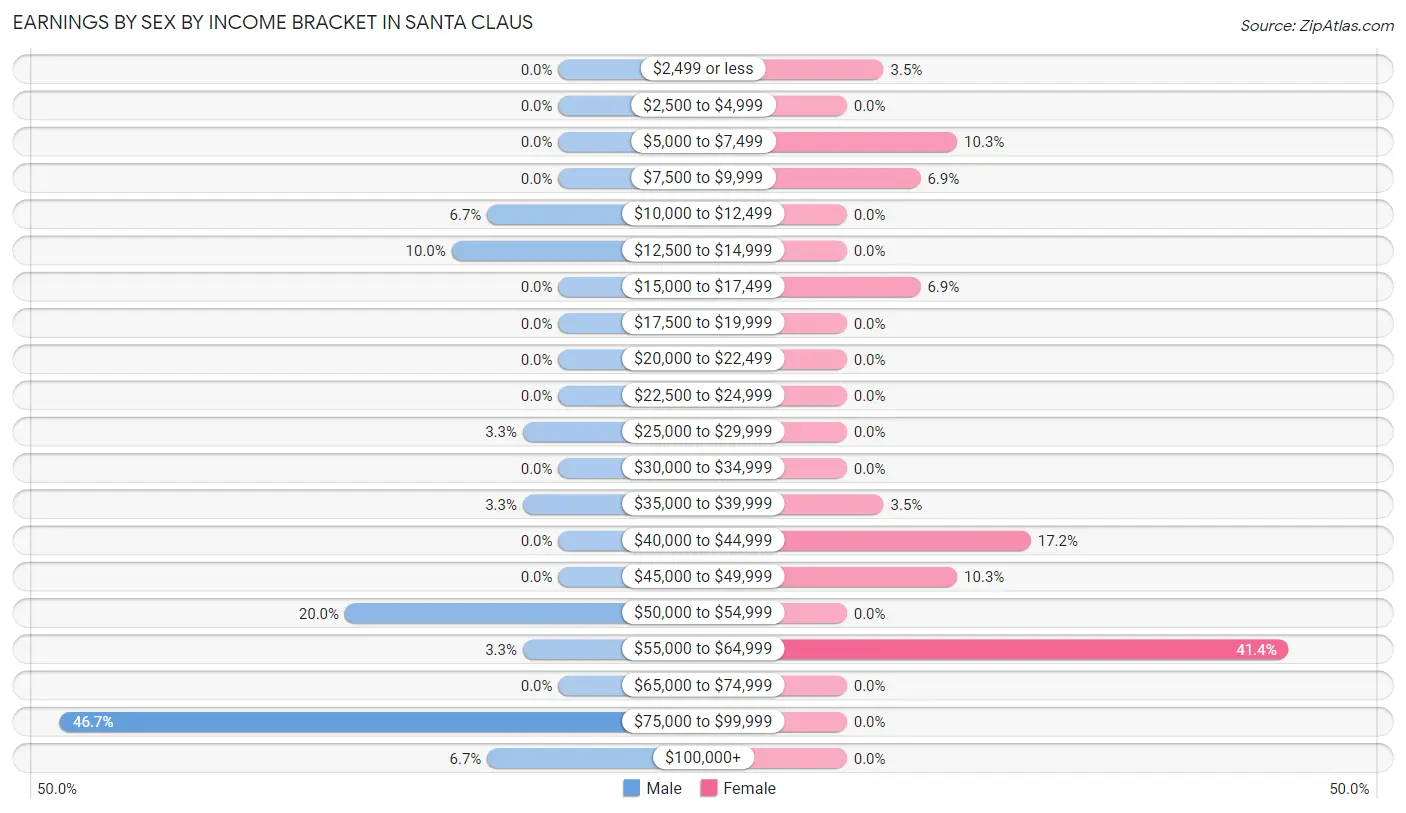
Earnings by Sex by Income Bracket in Santa Claus
The most common earnings brackets in Santa Claus are $75,000 to $99,999 for men (14 | 46.7%) and $55,000 to $64,999 for women (12 | 41.4%).
| Income | Male | Female |
| $2,499 or less | 0 (0.0%) | 1 (3.5%) |
| $2,500 to $4,999 | 0 (0.0%) | 0 (0.0%) |
| $5,000 to $7,499 | 0 (0.0%) | 3 (10.3%) |
| $7,500 to $9,999 | 0 (0.0%) | 2 (6.9%) |
| $10,000 to $12,499 | 2 (6.7%) | 0 (0.0%) |
| $12,500 to $14,999 | 3 (10.0%) | 0 (0.0%) |
| $15,000 to $17,499 | 0 (0.0%) | 2 (6.9%) |
| $17,500 to $19,999 | 0 (0.0%) | 0 (0.0%) |
| $20,000 to $22,499 | 0 (0.0%) | 0 (0.0%) |
| $22,500 to $24,999 | 0 (0.0%) | 0 (0.0%) |
| $25,000 to $29,999 | 1 (3.3%) | 0 (0.0%) |
| $30,000 to $34,999 | 0 (0.0%) | 0 (0.0%) |
| $35,000 to $39,999 | 1 (3.3%) | 1 (3.5%) |
| $40,000 to $44,999 | 0 (0.0%) | 5 (17.2%) |
| $45,000 to $49,999 | 0 (0.0%) | 3 (10.3%) |
| $50,000 to $54,999 | 6 (20.0%) | 0 (0.0%) |
| $55,000 to $64,999 | 1 (3.3%) | 12 (41.4%) |
| $65,000 to $74,999 | 0 (0.0%) | 0 (0.0%) |
| $75,000 to $99,999 | 14 (46.7%) | 0 (0.0%) |
| $100,000+ | 2 (6.7%) | 0 (0.0%) |
| Total | 30 (100.0%) | 29 (100.0%) |
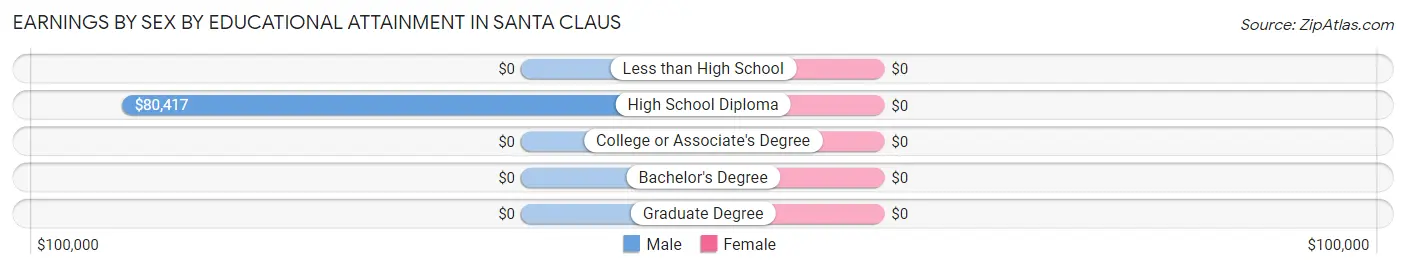
Earnings by Sex by Educational Attainment in Santa Claus
| Educational Attainment | Male Income | Female Income |
| Less than High School | - | - |
| High School Diploma | $80,417 | $0 |
| College or Associate's Degree | - | - |
| Bachelor's Degree | - | - |
| Graduate Degree | - | - |
| Total | $56,250 | $47,500 |
Family Income in Santa Claus
Family Income Brackets in Santa Claus
According to the Santa Claus family income data, there are 12 families falling into the $50,000 to $74,999 income range, which is the most common income bracket and makes up 28.6% of all families.
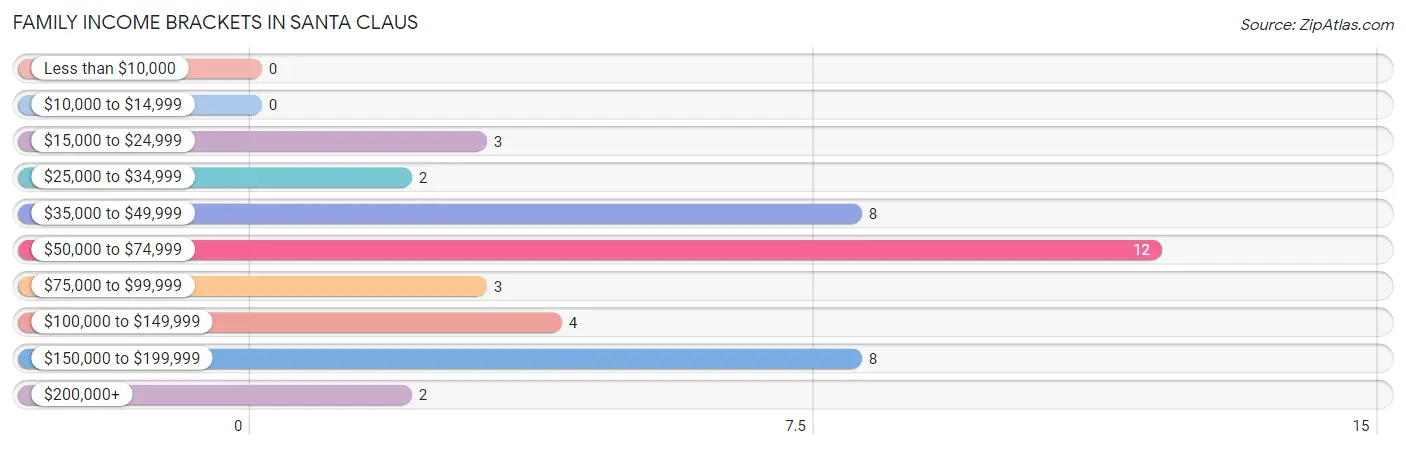
| Income Bracket | # Families | % Families |
| Less than $10,000 | 0 | 0.0% |
| $10,000 to $14,999 | 0 | 0.0% |
| $15,000 to $24,999 | 3 | 7.1% |
| $25,000 to $34,999 | 2 | 4.8% |
| $35,000 to $49,999 | 8 | 19.0% |
| $50,000 to $74,999 | 12 | 28.6% |
| $75,000 to $99,999 | 3 | 7.1% |
| $100,000 to $149,999 | 4 | 9.5% |
| $150,000 to $199,999 | 8 | 19.0% |
| $200,000+ | 2 | 4.8% |
Family Income by Famaliy Size in Santa Claus
3-person families (14 | 33.3%) account for the highest median family income in Santa Claus with $156,250 per family, while 3-person families (14 | 33.3%) have the highest median income of $52,083 per family member.
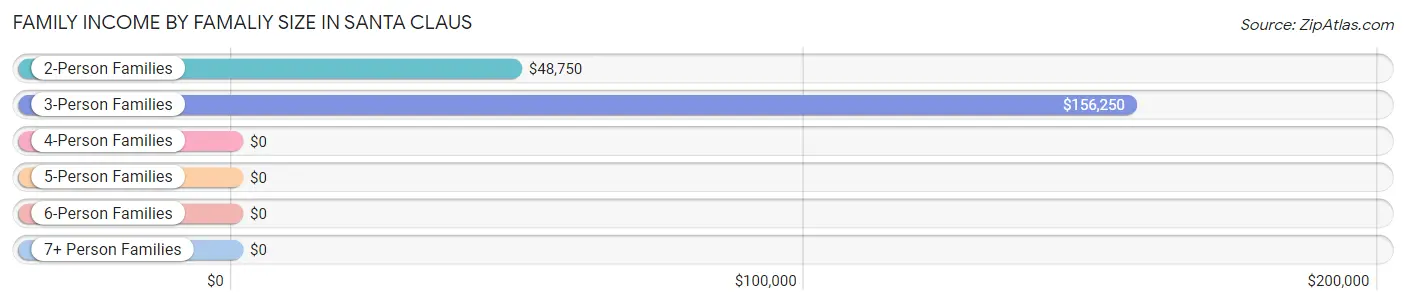
| Income Bracket | # Families | Median Income |
| 2-Person Families | 16 (38.1%) | $48,750 |
| 3-Person Families | 14 (33.3%) | $156,250 |
| 4-Person Families | 10 (23.8%) | $0 |
| 5-Person Families | 2 (4.8%) | $0 |
| 6-Person Families | 0 (0.0%) | $0 |
| 7+ Person Families | 0 (0.0%) | $0 |
| Total | 42 (100.0%) | $70,833 |
Family Income by Number of Earners in Santa Claus
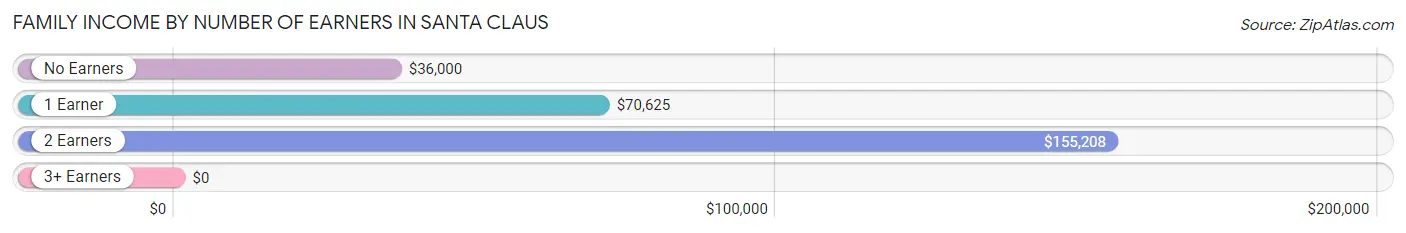
| Number of Earners | # Families | Median Income |
| No Earners | 14 (33.3%) | $36,000 |
| 1 Earner | 11 (26.2%) | $70,625 |
| 2 Earners | 15 (35.7%) | $155,208 |
| 3+ Earners | 2 (4.8%) | $0 |
| Total | 42 (100.0%) | $70,833 |
Household Income in Santa Claus
Household Income Brackets in Santa Claus
With 15 households falling in the category, the $50,000 to $74,999 income range is the most frequent in Santa Claus, accounting for 21.7% of all households. In contrast, only 2 households (2.9%) fall into the $200,000+ income bracket, making it the least populous group.
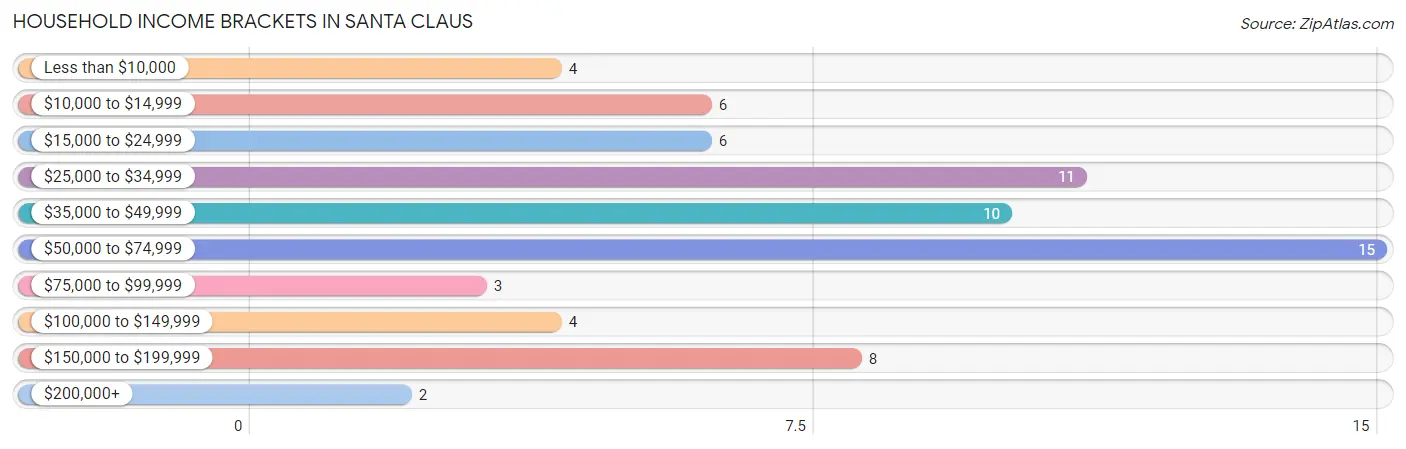
| Income Bracket | # Households | % Households |
| Less than $10,000 | 4 | 5.8% |
| $10,000 to $14,999 | 6 | 8.7% |
| $15,000 to $24,999 | 6 | 8.7% |
| $25,000 to $34,999 | 11 | 15.9% |
| $35,000 to $49,999 | 10 | 14.5% |
| $50,000 to $74,999 | 15 | 21.7% |
| $75,000 to $99,999 | 3 | 4.3% |
| $100,000 to $149,999 | 4 | 5.8% |
| $150,000 to $199,999 | 8 | 11.6% |
| $200,000+ | 2 | 2.9% |
Household Income by Householder Age in Santa Claus
The median household income in Santa Claus is $46,250, with the highest median household income of $71,250 found in the 25 to 44 years age bracket for the primary householder. A total of 14 households (20.3%) fall into this category. Meanwhile, the 15 to 24 years age bracket for the primary householder has the lowest median household income of $0, with 1 households (1.5%) in this group.
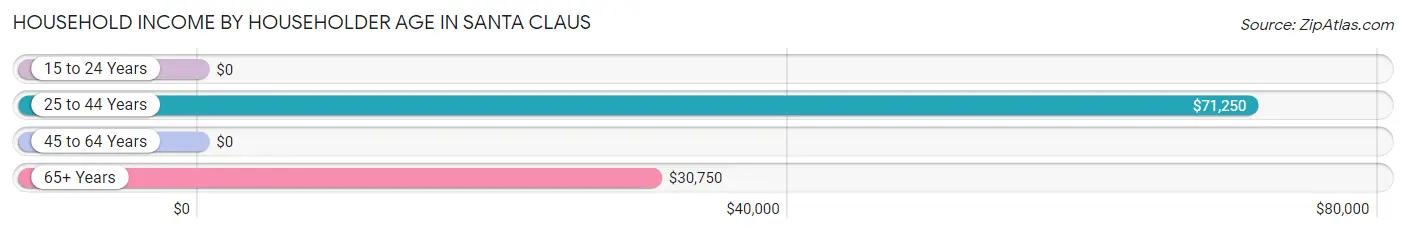
| Income Bracket | # Households | Median Income |
| 15 to 24 Years | 1 (1.5%) | $0 |
| 25 to 44 Years | 14 (20.3%) | $71,250 |
| 45 to 64 Years | 19 (27.5%) | $0 |
| 65+ Years | 35 (50.7%) | $30,750 |
| Total | 69 (100.0%) | $46,250 |
Poverty in Santa Claus
Income Below Poverty by Sex and Age in Santa Claus
With 3.0% poverty level for males and 18.8% for females among the residents of Santa Claus, 5 year old males and 18 to 24 year old females are the most vulnerable to poverty, with 2 males (100.0%) and 1 females (100.0%) in their respective age groups living below the poverty level.
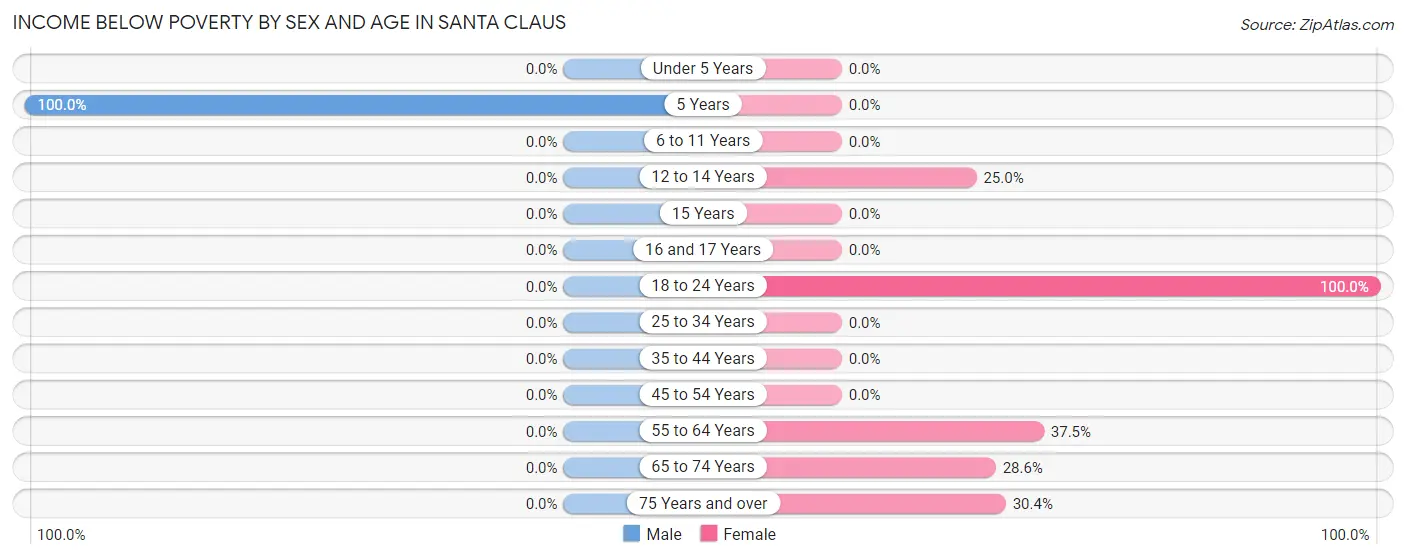
| Age Bracket | Male | Female |
| Under 5 Years | 0 (0.0%) | 0 (0.0%) |
| 5 Years | 2 (100.0%) | 0 (0.0%) |
| 6 to 11 Years | 0 (0.0%) | 0 (0.0%) |
| 12 to 14 Years | 0 (0.0%) | 2 (25.0%) |
| 15 Years | 0 (0.0%) | 0 (0.0%) |
| 16 and 17 Years | 0 (0.0%) | 0 (0.0%) |
| 18 to 24 Years | 0 (0.0%) | 1 (100.0%) |
| 25 to 34 Years | 0 (0.0%) | 0 (0.0%) |
| 35 to 44 Years | 0 (0.0%) | 0 (0.0%) |
| 45 to 54 Years | 0 (0.0%) | 0 (0.0%) |
| 55 to 64 Years | 0 (0.0%) | 3 (37.5%) |
| 65 to 74 Years | 0 (0.0%) | 2 (28.6%) |
| 75 Years and over | 0 (0.0%) | 7 (30.4%) |
| Total | 2 (3.0%) | 15 (18.8%) |
Income Above Poverty by Sex and Age in Santa Claus
According to the poverty statistics in Santa Claus, males aged under 5 years and females aged 5 years are the age groups that are most secure financially, with 100.0% of males and 100.0% of females in these age groups living above the poverty line.
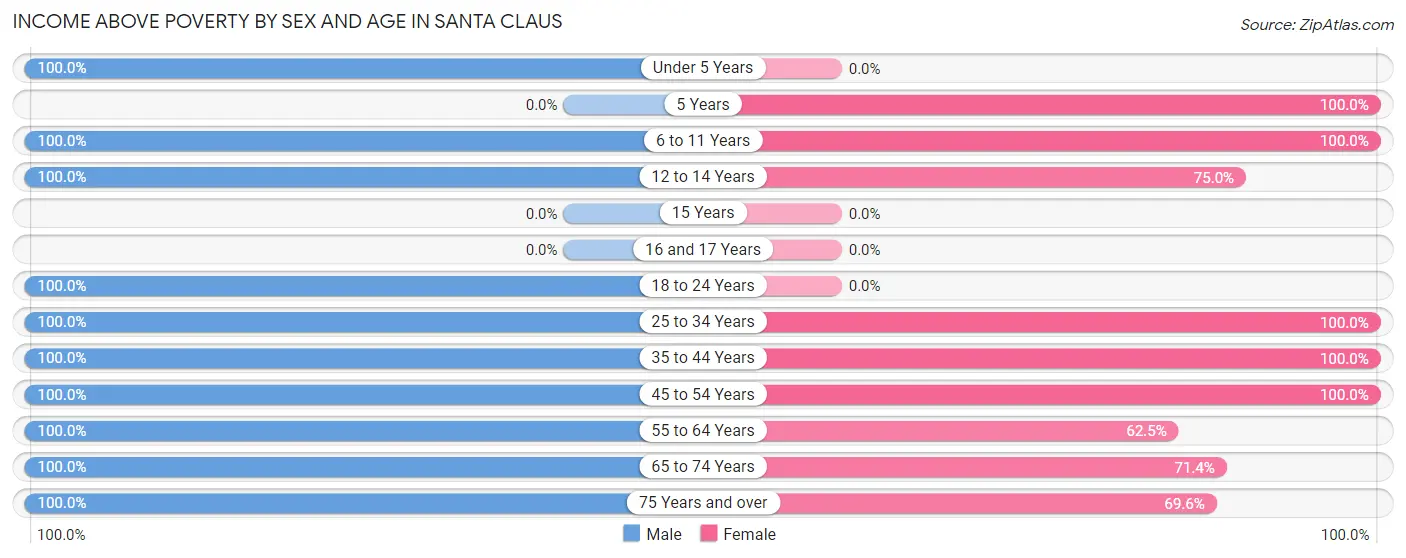
| Age Bracket | Male | Female |
| Under 5 Years | 2 (100.0%) | 0 (0.0%) |
| 5 Years | 0 (0.0%) | 1 (100.0%) |
| 6 to 11 Years | 5 (100.0%) | 6 (100.0%) |
| 12 to 14 Years | 7 (100.0%) | 6 (75.0%) |
| 15 Years | 0 (0.0%) | 0 (0.0%) |
| 16 and 17 Years | 0 (0.0%) | 0 (0.0%) |
| 18 to 24 Years | 8 (100.0%) | 0 (0.0%) |
| 25 to 34 Years | 6 (100.0%) | 9 (100.0%) |
| 35 to 44 Years | 3 (100.0%) | 10 (100.0%) |
| 45 to 54 Years | 9 (100.0%) | 7 (100.0%) |
| 55 to 64 Years | 5 (100.0%) | 5 (62.5%) |
| 65 to 74 Years | 10 (100.0%) | 5 (71.4%) |
| 75 Years and over | 9 (100.0%) | 16 (69.6%) |
| Total | 64 (97.0%) | 65 (81.2%) |
Income Below Poverty Among Married-Couple Families in Santa Claus
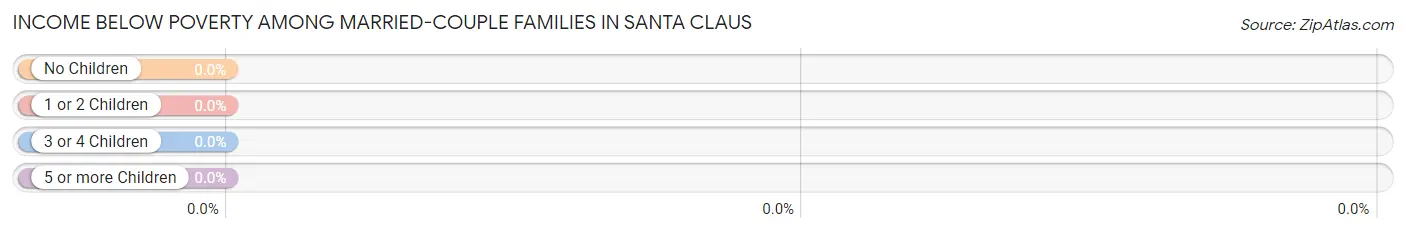
| Children | Above Poverty | Below Poverty |
| No Children | 17 (100.0%) | 0 (0.0%) |
| 1 or 2 Children | 4 (100.0%) | 0 (0.0%) |
| 3 or 4 Children | 2 (100.0%) | 0 (0.0%) |
| 5 or more Children | 0 (0.0%) | 0 (0.0%) |
| Total | 23 (100.0%) | 0 (0.0%) |
Income Below Poverty Among Single-Parent Households in Santa Claus
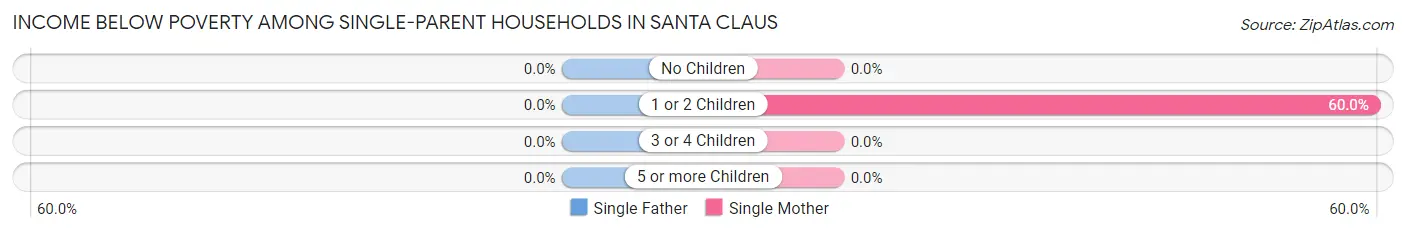
| Children | Single Father | Single Mother |
| No Children | 0 (0.0%) | 0 (0.0%) |
| 1 or 2 Children | 0 (0.0%) | 3 (60.0%) |
| 3 or 4 Children | 0 (0.0%) | 0 (0.0%) |
| 5 or more Children | 0 (0.0%) | 0 (0.0%) |
| Total | 0 (0.0%) | 3 (20.0%) |
Income Below Poverty Among Married-Couple vs Single-Parent Households in Santa Claus
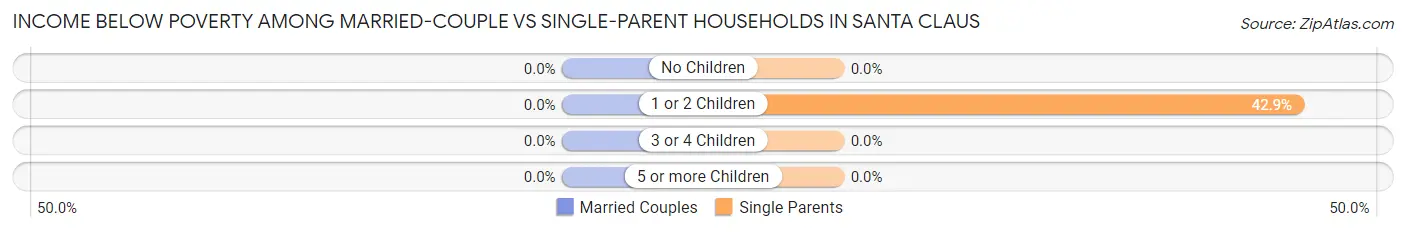
| Children | Married-Couple Families | Single-Parent Households |
| No Children | 0 (0.0%) | 0 (0.0%) |
| 1 or 2 Children | 0 (0.0%) | 3 (42.9%) |
| 3 or 4 Children | 0 (0.0%) | 0 (0.0%) |
| 5 or more Children | 0 (0.0%) | 0 (0.0%) |
| Total | 0 (0.0%) | 3 (15.8%) |
Race in Santa Claus
The most populous races in Santa Claus are White / Caucasian (143 | 98.0%), Two or more Races (3 | 2.1%), and Hispanic or Latino (1 | 0.7%).
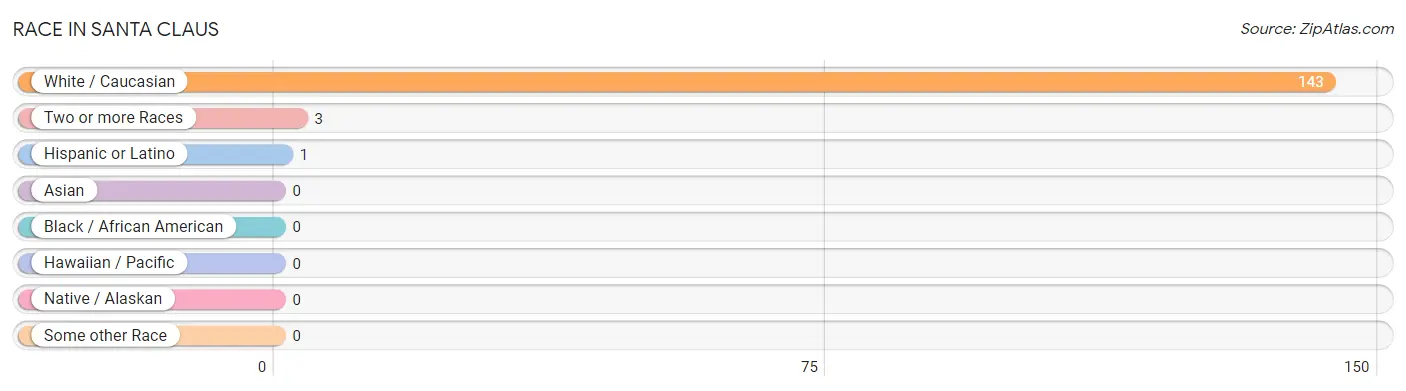
| Race | # Population | % Population |
| Asian | 0 | 0.0% |
| Black / African American | 0 | 0.0% |
| Hawaiian / Pacific | 0 | 0.0% |
| Hispanic or Latino | 1 | 0.7% |
| Native / Alaskan | 0 | 0.0% |
| White / Caucasian | 143 | 98.0% |
| Two or more Races | 3 | 2.1% |
| Some other Race | 0 | 0.0% |
| Total | 146 | 100.0% |
Ancestry in Santa Claus
The most populous ancestries reported in Santa Claus are Irish (25 | 17.1%), Norwegian (21 | 14.4%), American (12 | 8.2%), English (12 | 8.2%), and Dutch (11 | 7.5%), together accounting for 55.5% of all Santa Claus residents.
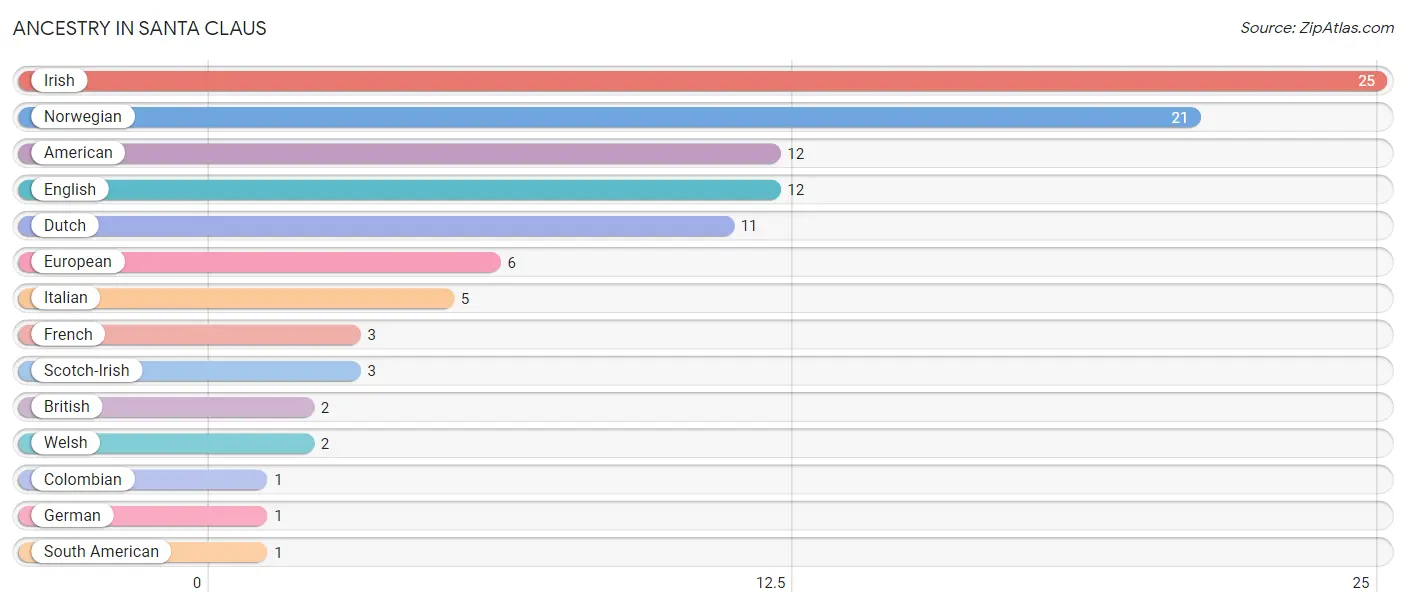
| Ancestry | # Population | % Population |
| American | 12 | 8.2% |
| British | 2 | 1.4% |
| Colombian | 1 | 0.7% |
| Dutch | 11 | 7.5% |
| English | 12 | 8.2% |
| European | 6 | 4.1% |
| French | 3 | 2.1% |
| German | 1 | 0.7% |
| Irish | 25 | 17.1% |
| Italian | 5 | 3.4% |
| Norwegian | 21 | 14.4% |
| Scotch-Irish | 3 | 2.1% |
| South American | 1 | 0.7% |
| Welsh | 2 | 1.4% | View All 14 Rows |
Immigrants in Santa Claus
The most numerous immigrant groups reported in Santa Claus came from Colombia (1 | 0.7%), Latin America (1 | 0.7%), and South America (1 | 0.7%), together accounting for 2.0% of all Santa Claus residents.
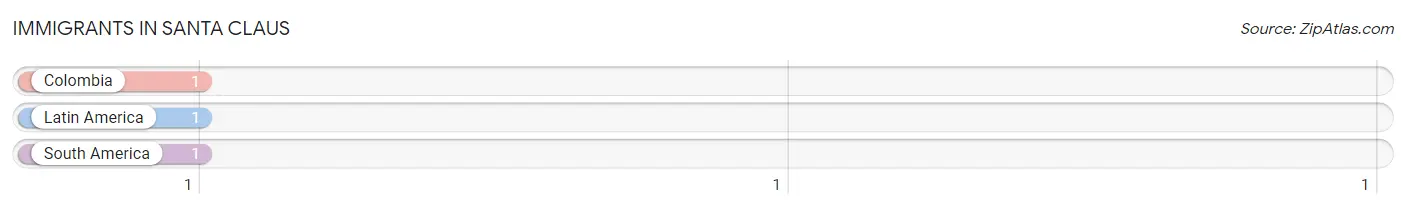
| Immigration Origin | # Population | % Population |
| Colombia | 1 | 0.7% |
| Latin America | 1 | 0.7% |
| South America | 1 | 0.7% | View All 3 Rows |
Sex and Age in Santa Claus
Sex and Age in Santa Claus
The most populous age groups in Santa Claus are 5 to 9 Years (7 | 10.6%) for men and 75 to 79 Years (16 | 20.0%) for women.
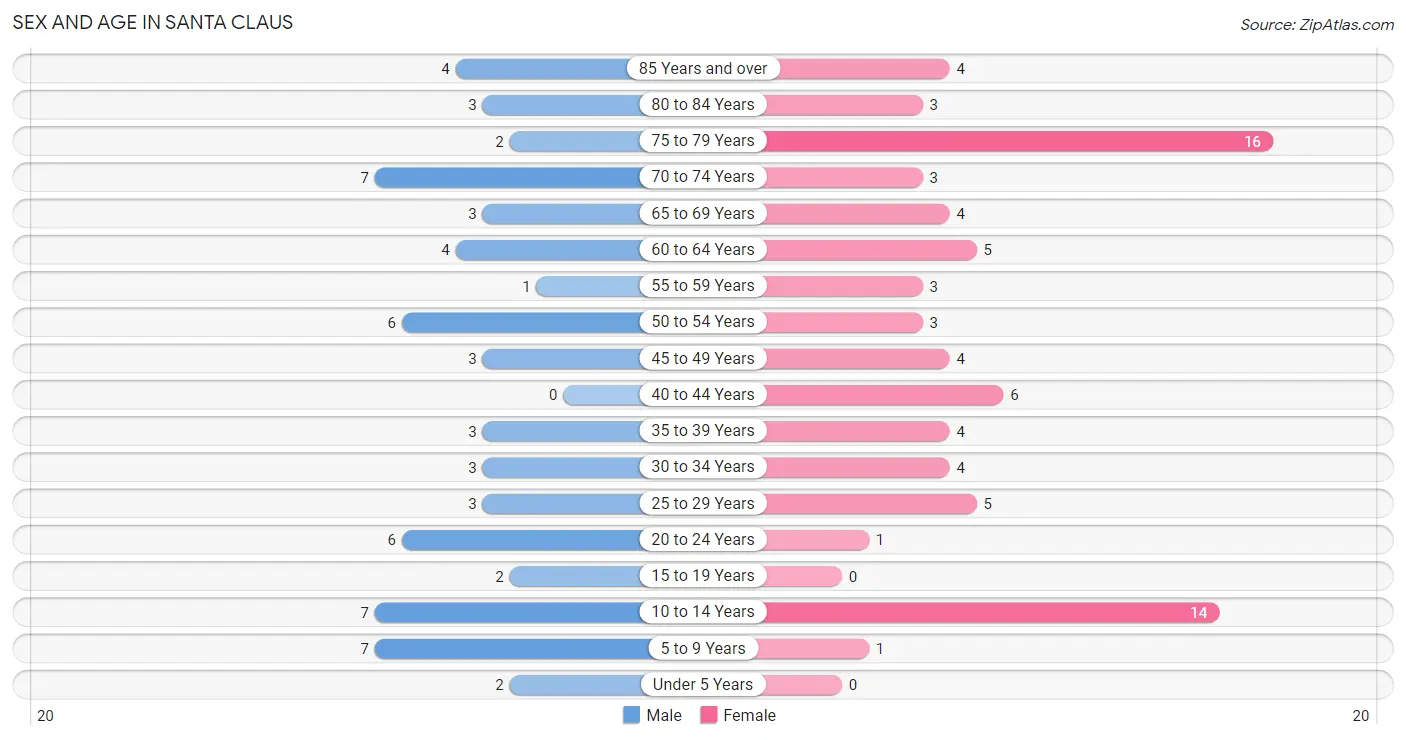
| Age Bracket | Male | Female |
| Under 5 Years | 2 (3.0%) | 0 (0.0%) |
| 5 to 9 Years | 7 (10.6%) | 1 (1.3%) |
| 10 to 14 Years | 7 (10.6%) | 14 (17.5%) |
| 15 to 19 Years | 2 (3.0%) | 0 (0.0%) |
| 20 to 24 Years | 6 (9.1%) | 1 (1.3%) |
| 25 to 29 Years | 3 (4.5%) | 5 (6.2%) |
| 30 to 34 Years | 3 (4.5%) | 4 (5.0%) |
| 35 to 39 Years | 3 (4.5%) | 4 (5.0%) |
| 40 to 44 Years | 0 (0.0%) | 6 (7.5%) |
| 45 to 49 Years | 3 (4.5%) | 4 (5.0%) |
| 50 to 54 Years | 6 (9.1%) | 3 (3.7%) |
| 55 to 59 Years | 1 (1.5%) | 3 (3.7%) |
| 60 to 64 Years | 4 (6.1%) | 5 (6.2%) |
| 65 to 69 Years | 3 (4.5%) | 4 (5.0%) |
| 70 to 74 Years | 7 (10.6%) | 3 (3.7%) |
| 75 to 79 Years | 2 (3.0%) | 16 (20.0%) |
| 80 to 84 Years | 3 (4.5%) | 3 (3.7%) |
| 85 Years and over | 4 (6.1%) | 4 (5.0%) |
| Total | 66 (100.0%) | 80 (100.0%) |
Families and Households in Santa Claus
Median Family Size in Santa Claus
The median family size in Santa Claus is 2.83 persons per family, with single male/father families (4 | 9.5%) accounting for the largest median family size of 3 persons per family. On the other hand, married-couple families (23 | 54.8%) represent the smallest median family size with 2.70 persons per family.
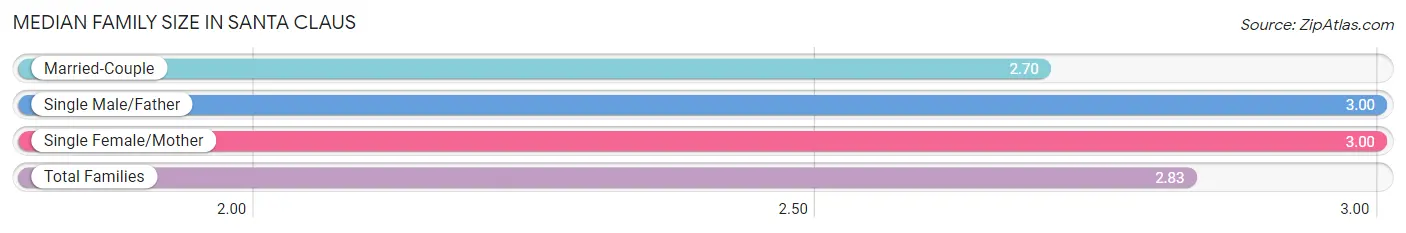
| Family Type | # Families | Family Size |
| Married-Couple | 23 (54.8%) | 2.70 |
| Single Male/Father | 4 (9.5%) | 3.00 |
| Single Female/Mother | 15 (35.7%) | 3.00 |
| Total Families | 42 (100.0%) | 2.83 |
Median Household Size in Santa Claus
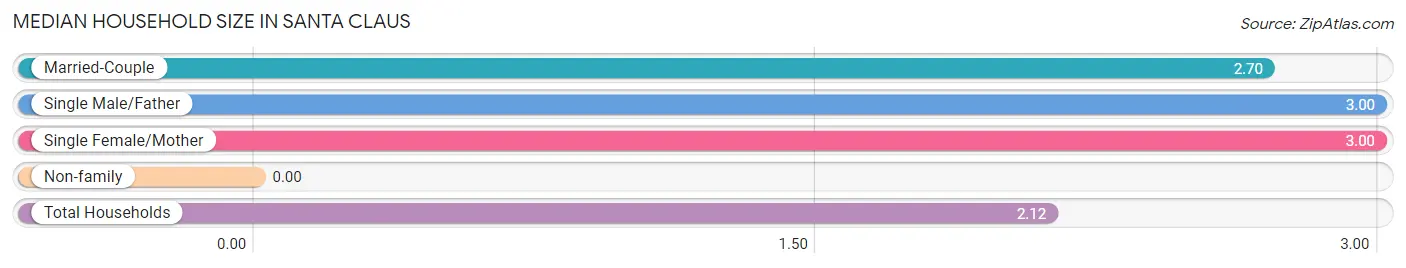
| Household Type | # Households | Household Size |
| Married-Couple | 23 (33.3%) | 2.70 |
| Single Male/Father | 4 (5.8%) | 3.00 |
| Single Female/Mother | 15 (21.7%) | 3.00 |
| Non-family | 27 (39.1%) | - |
| Total Households | 69 (100.0%) | 2.12 |
Household Size by Marriage Status in Santa Claus
Out of a total of 69 households in Santa Claus, 42 (60.9%) are family households, while 27 (39.1%) are nonfamily households. The most numerous type of family households are 2-person households, comprising 16, and the most common type of nonfamily households are 1-person households, comprising 27.
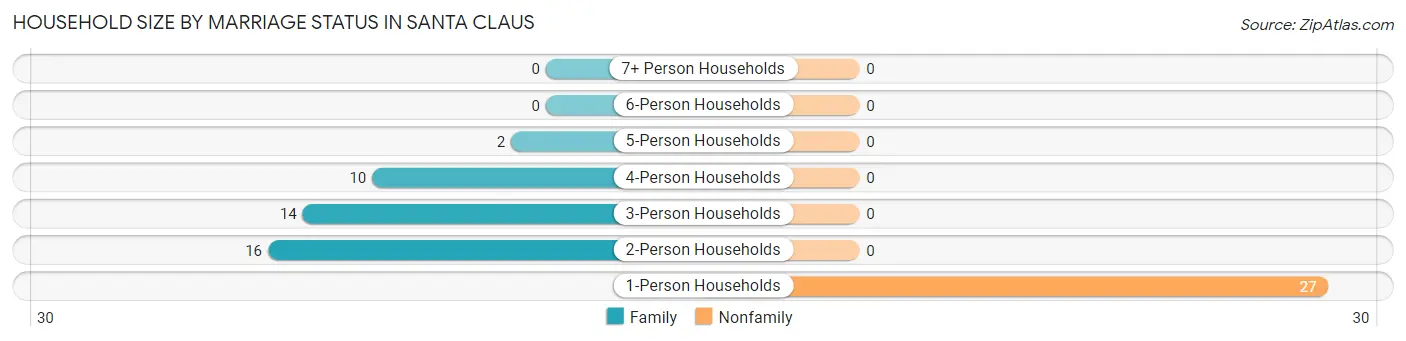
| Household Size | Family Households | Nonfamily Households |
| 1-Person Households | - | 27 (39.1%) |
| 2-Person Households | 16 (23.2%) | 0 (0.0%) |
| 3-Person Households | 14 (20.3%) | 0 (0.0%) |
| 4-Person Households | 10 (14.5%) | 0 (0.0%) |
| 5-Person Households | 2 (2.9%) | 0 (0.0%) |
| 6-Person Households | 0 (0.0%) | 0 (0.0%) |
| 7+ Person Households | 0 (0.0%) | 0 (0.0%) |
| Total | 42 (60.9%) | 27 (39.1%) |
Female Fertility in Santa Claus
Fertility by Age in Santa Claus
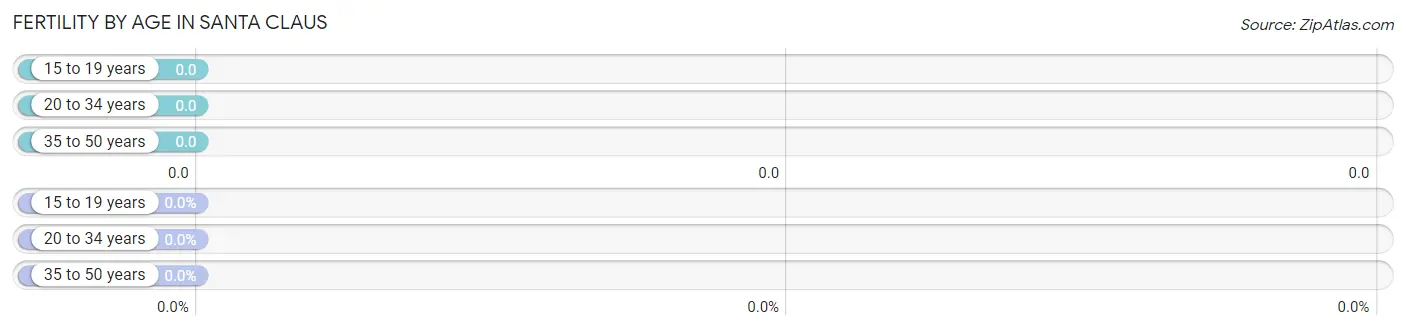
| Age Bracket | Women with Births | Births / 1,000 Women |
| 15 to 19 years | 0 (0.0%) | 0.0 |
| 20 to 34 years | 0 (0.0%) | 0.0 |
| 35 to 50 years | 0 (0.0%) | 0.0 |
| Total | 0 (0.0%) | 0.0 |
Fertility by Age by Marriage Status in Santa Claus
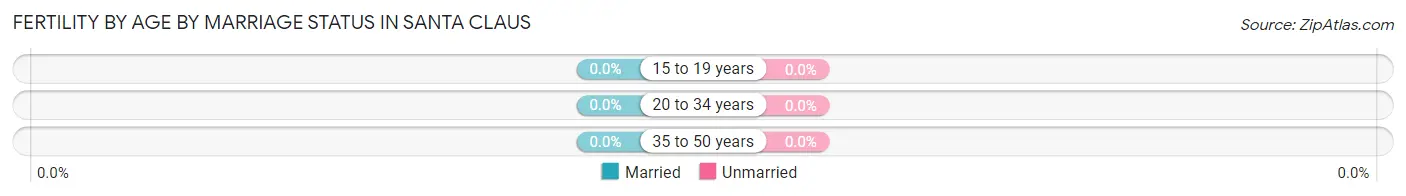
| Age Bracket | Married | Unmarried |
| 15 to 19 years | 0 (0.0%) | 0 (0.0%) |
| 20 to 34 years | 0 (0.0%) | 0 (0.0%) |
| 35 to 50 years | 0 (0.0%) | 0 (0.0%) |
| Total | 0 (0.0%) | 0 (0.0%) |
Fertility by Education in Santa Claus
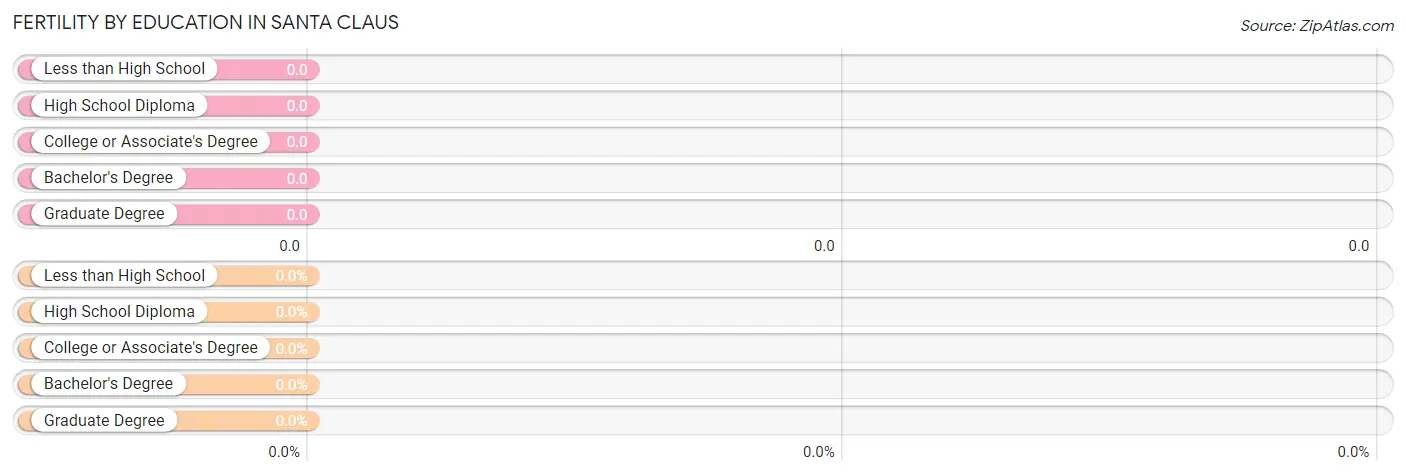
| Educational Attainment | Women with Births | Births / 1,000 Women |
| Less than High School | 0 (0.0%) | 0.0 |
| High School Diploma | 0 (0.0%) | 0.0 |
| College or Associate's Degree | 0 (0.0%) | 0.0 |
| Bachelor's Degree | 0 (0.0%) | 0.0 |
| Graduate Degree | 0 (0.0%) | 0.0 |
| Total | 0 (0.0%) | 0.0 |
Fertility by Education by Marriage Status in Santa Claus
| Educational Attainment | Married | Unmarried |
| Less than High School | 0 (0.0%) | 0 (0.0%) |
| High School Diploma | 0 (0.0%) | 0 (0.0%) |
| College or Associate's Degree | 0 (0.0%) | 0 (0.0%) |
| Bachelor's Degree | 0 (0.0%) | 0 (0.0%) |
| Graduate Degree | 0 (0.0%) | 0 (0.0%) |
| Total | 0 (0.0%) | 0 (0.0%) |
Employment Characteristics in Santa Claus
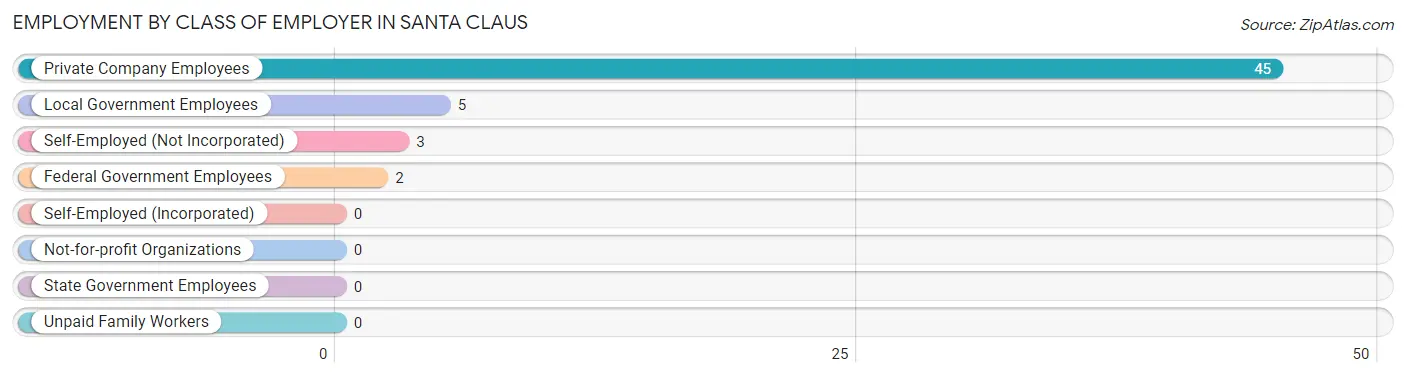
Employment by Class of Employer in Santa Claus
Among the 55 employed individuals in Santa Claus, private company employees (45 | 81.8%), local government employees (5 | 9.1%), and self-employed (not incorporated) (3 | 5.4%) make up the most common classes of employment.
| Employer Class | # Employees | % Employees |
| Private Company Employees | 45 | 81.8% |
| Self-Employed (Incorporated) | 0 | 0.0% |
| Self-Employed (Not Incorporated) | 3 | 5.4% |
| Not-for-profit Organizations | 0 | 0.0% |
| Local Government Employees | 5 | 9.1% |
| State Government Employees | 0 | 0.0% |
| Federal Government Employees | 2 | 3.6% |
| Unpaid Family Workers | 0 | 0.0% |
| Total | 55 | 100.0% |
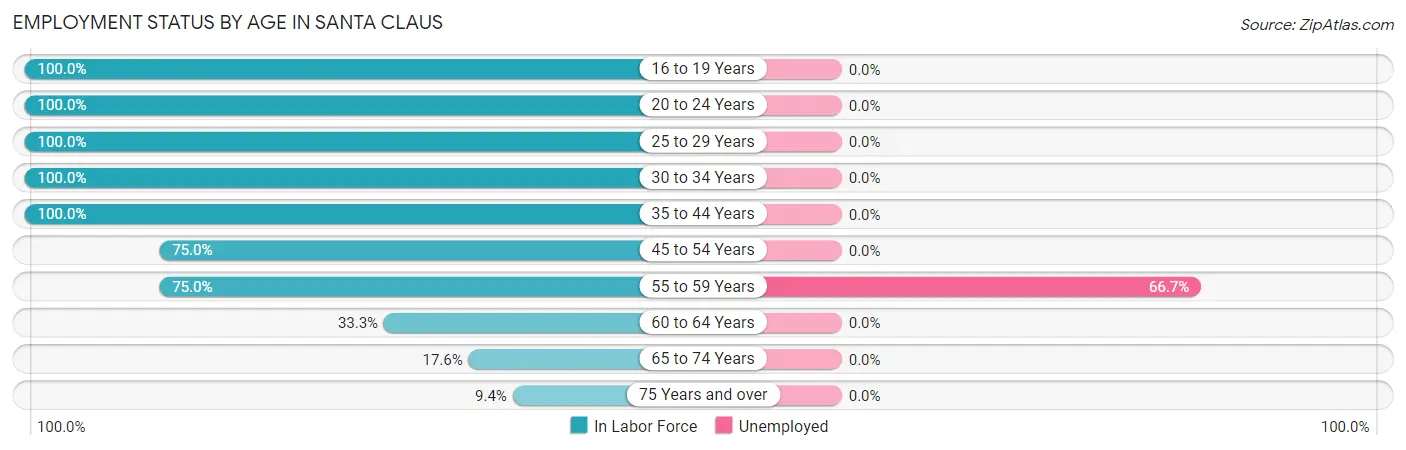
Employment Status by Age in Santa Claus
According to the labor force statistics for Santa Claus, out of the total population over 16 years of age (115), 53.0% or 61 individuals are in the labor force, with 3.3% or 2 of them unemployed. The age group with the highest labor force participation rate is 16 to 19 years, with 100.0% or 2 individuals in the labor force. Within the labor force, the 55 to 59 years age range has the highest percentage of unemployed individuals, with 66.7% or 2 of them being unemployed.
| Age Bracket | In Labor Force | Unemployed |
| 16 to 19 Years | 2 (100.0%) | 0 (0.0%) |
| 20 to 24 Years | 7 (100.0%) | 0 (0.0%) |
| 25 to 29 Years | 8 (100.0%) | 0 (0.0%) |
| 30 to 34 Years | 7 (100.0%) | 0 (0.0%) |
| 35 to 44 Years | 13 (100.0%) | 0 (0.0%) |
| 45 to 54 Years | 12 (75.0%) | 0 (0.0%) |
| 55 to 59 Years | 3 (75.0%) | 2 (66.7%) |
| 60 to 64 Years | 3 (33.3%) | 0 (0.0%) |
| 65 to 74 Years | 3 (17.6%) | 0 (0.0%) |
| 75 Years and over | 3 (9.4%) | 0 (0.0%) |
| Total | 61 (53.0%) | 2 (3.3%) |
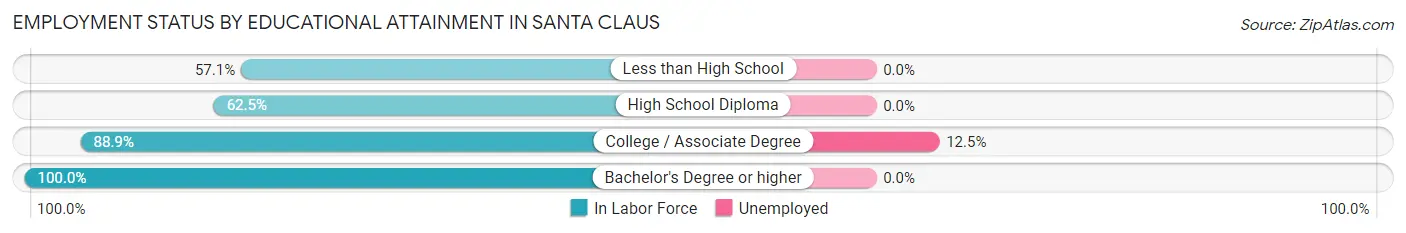
Employment Status by Educational Attainment in Santa Claus
According to labor force statistics for Santa Claus, 80.7% of individuals (46) out of the total population between 25 and 64 years of age (57) are in the labor force, with 4.3% or 2 of them being unemployed. The group with the highest labor force participation rate are those with the educational attainment of bachelor's degree or higher, with 100.0% or 16 individuals in the labor force. Within the labor force, individuals with college / associate degree education have the highest percentage of unemployment, with 12.5% or 2 of them being unemployed.
| Educational Attainment | In Labor Force | Unemployed |
| Less than High School | 4 (57.1%) | 0 (0.0%) |
| High School Diploma | 10 (62.5%) | 0 (0.0%) |
| College / Associate Degree | 16 (88.9%) | 2 (12.5%) |
| Bachelor's Degree or higher | 16 (100.0%) | 0 (0.0%) |
| Total | 46 (80.7%) | 2 (4.3%) |
Employment Occupations by Sex in Santa Claus
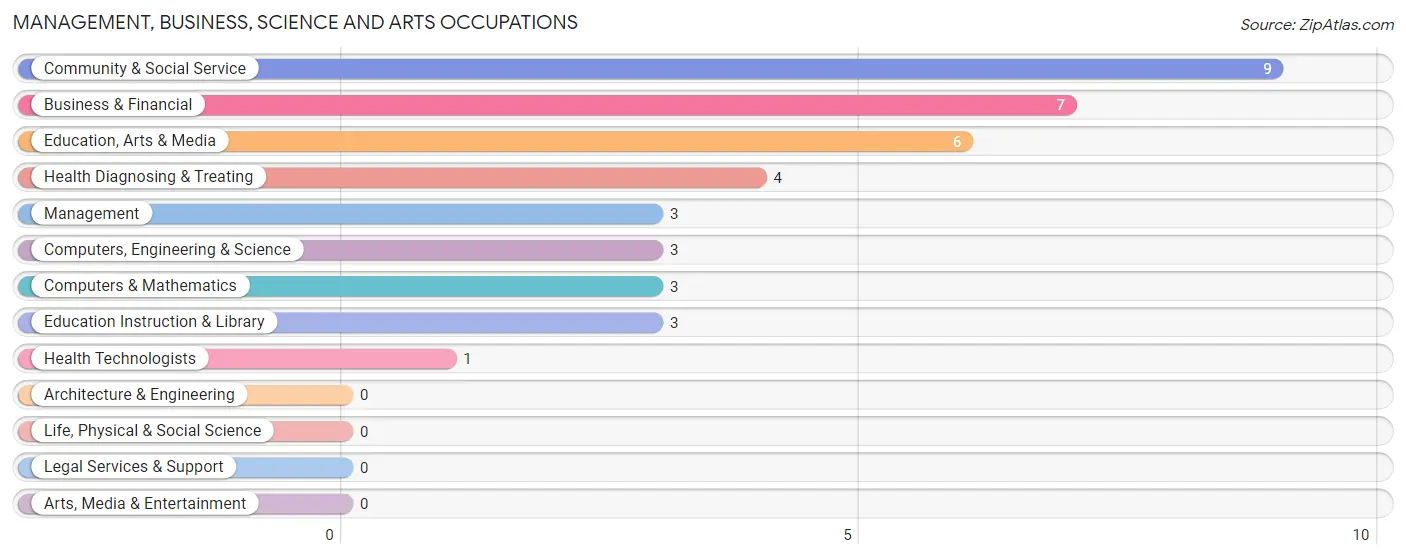
Management, Business, Science and Arts Occupations
The most common Management, Business, Science and Arts occupations in Santa Claus are Community & Social Service (9 | 15.2%), Business & Financial (7 | 11.9%), Education, Arts & Media (6 | 10.2%), Health Diagnosing & Treating (4 | 6.8%), and Management (3 | 5.1%).
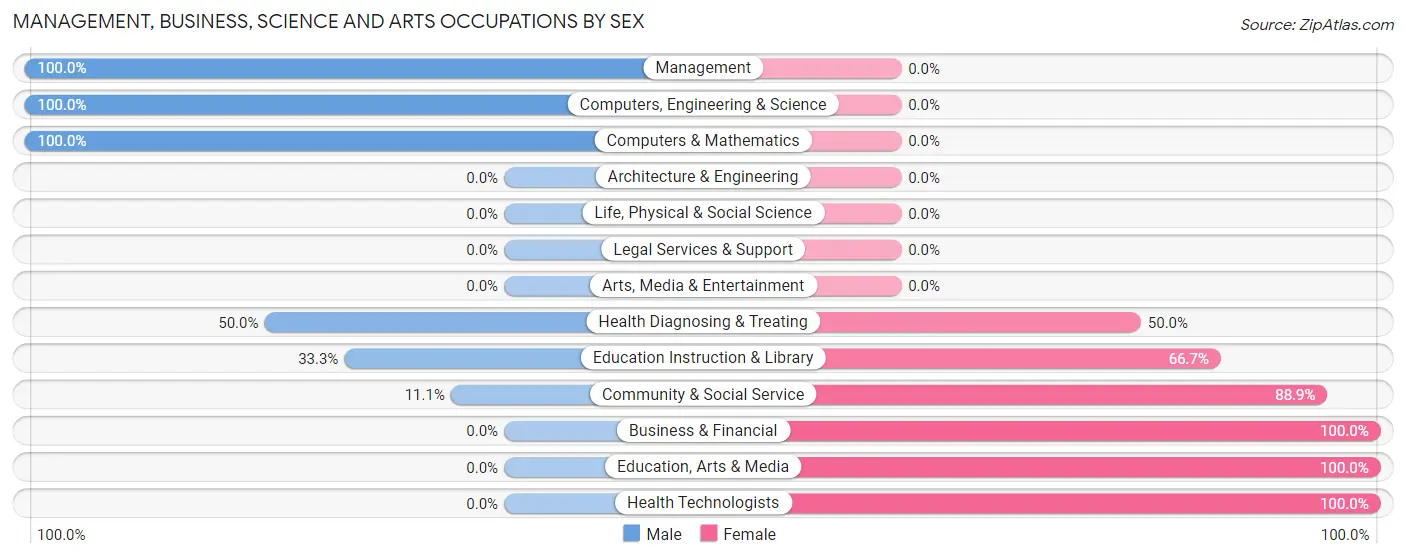
Management, Business, Science and Arts Occupations by Sex
Within the Management, Business, Science and Arts occupations in Santa Claus, the most male-oriented occupations are Management (100.0%), Computers, Engineering & Science (100.0%), and Computers & Mathematics (100.0%), while the most female-oriented occupations are Business & Financial (100.0%), Education, Arts & Media (100.0%), and Health Technologists (100.0%).
| Occupation | Male | Female |
| Management | 3 (100.0%) | 0 (0.0%) |
| Business & Financial | 0 (0.0%) | 7 (100.0%) |
| Computers, Engineering & Science | 3 (100.0%) | 0 (0.0%) |
| Computers & Mathematics | 3 (100.0%) | 0 (0.0%) |
| Architecture & Engineering | 0 (0.0%) | 0 (0.0%) |
| Life, Physical & Social Science | 0 (0.0%) | 0 (0.0%) |
| Community & Social Service | 1 (11.1%) | 8 (88.9%) |
| Education, Arts & Media | 0 (0.0%) | 6 (100.0%) |
| Legal Services & Support | 0 (0.0%) | 0 (0.0%) |
| Education Instruction & Library | 1 (33.3%) | 2 (66.7%) |
| Arts, Media & Entertainment | 0 (0.0%) | 0 (0.0%) |
| Health Diagnosing & Treating | 2 (50.0%) | 2 (50.0%) |
| Health Technologists | 0 (0.0%) | 1 (100.0%) |
| Total (Category) | 9 (34.6%) | 17 (65.4%) |
| Total (Overall) | 30 (50.8%) | 29 (49.1%) |
Services Occupations
Services Occupations by Sex
| Occupation | Male | Female |
| Healthcare Support | 0 (0.0%) | 0 (0.0%) |
| Security & Protection | 0 (0.0%) | 0 (0.0%) |
| Firefighting & Prevention | 0 (0.0%) | 0 (0.0%) |
| Law Enforcement | 0 (0.0%) | 0 (0.0%) |
| Food Preparation & Serving | 0 (0.0%) | 0 (0.0%) |
| Cleaning & Maintenance | 0 (0.0%) | 0 (0.0%) |
| Personal Care & Service | 0 (0.0%) | 0 (0.0%) |
| Total (Category) | 0 (0.0%) | 0 (0.0%) |
| Total (Overall) | 30 (50.8%) | 29 (49.1%) |
Sales and Office Occupations
The most common Sales and Office occupations in Santa Claus are Office & Administration (11 | 18.6%), and Sales & Related (3 | 5.1%).
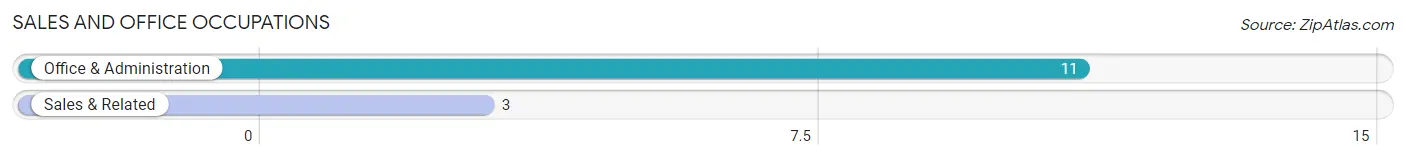
Sales and Office Occupations by Sex
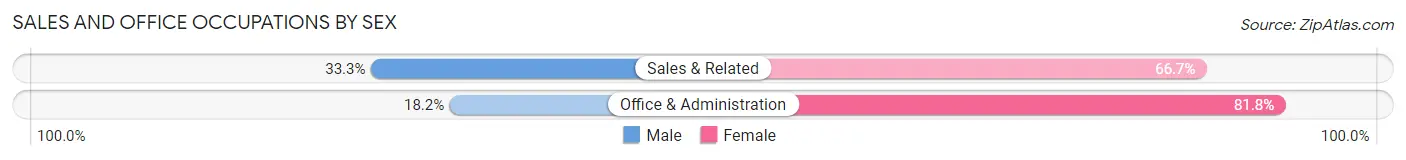
| Occupation | Male | Female |
| Sales & Related | 1 (33.3%) | 2 (66.7%) |
| Office & Administration | 2 (18.2%) | 9 (81.8%) |
| Total (Category) | 3 (21.4%) | 11 (78.6%) |
| Total (Overall) | 30 (50.8%) | 29 (49.1%) |
Natural Resources, Construction and Maintenance Occupations
The most common Natural Resources, Construction and Maintenance occupations in Santa Claus are , and Installation, Maintenance & Repair (6 | 10.2%).
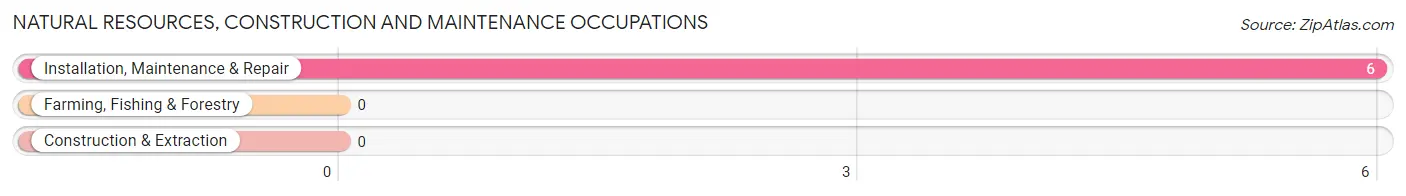
Natural Resources, Construction and Maintenance Occupations by Sex
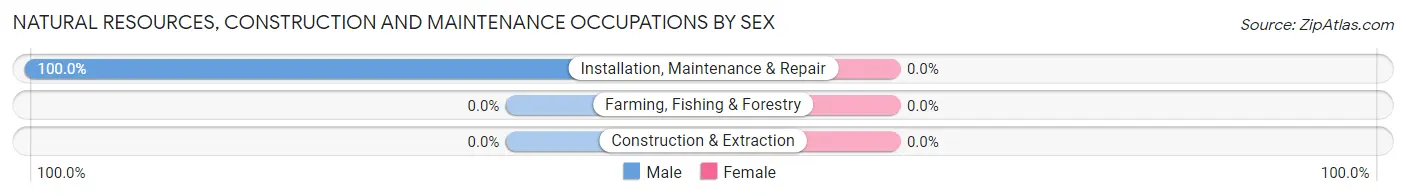
| Occupation | Male | Female |
| Farming, Fishing & Forestry | 0 (0.0%) | 0 (0.0%) |
| Construction & Extraction | 0 (0.0%) | 0 (0.0%) |
| Installation, Maintenance & Repair | 6 (100.0%) | 0 (0.0%) |
| Total (Category) | 6 (100.0%) | 0 (0.0%) |
| Total (Overall) | 30 (50.8%) | 29 (49.1%) |
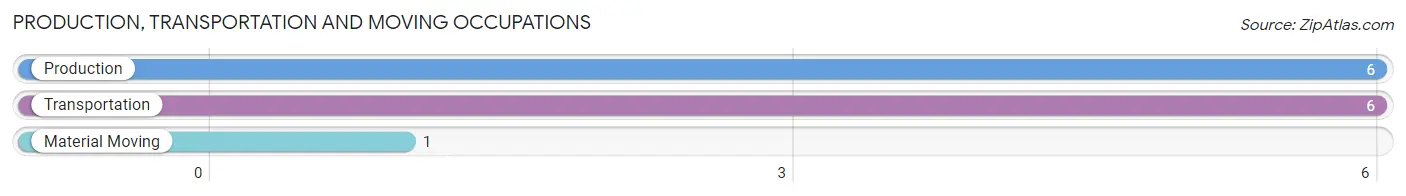
Production, Transportation and Moving Occupations
The most common Production, Transportation and Moving occupations in Santa Claus are Production (6 | 10.2%), Transportation (6 | 10.2%), and Material Moving (1 | 1.7%).
Production, Transportation and Moving Occupations by Sex
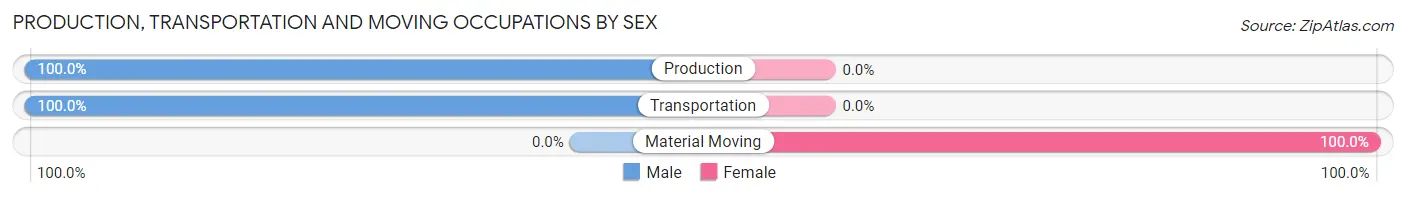
| Occupation | Male | Female |
| Production | 6 (100.0%) | 0 (0.0%) |
| Transportation | 6 (100.0%) | 0 (0.0%) |
| Material Moving | 0 (0.0%) | 1 (100.0%) |
| Total (Category) | 12 (92.3%) | 1 (7.7%) |
| Total (Overall) | 30 (50.8%) | 29 (49.1%) |
Employment Industries by Sex in Santa Claus
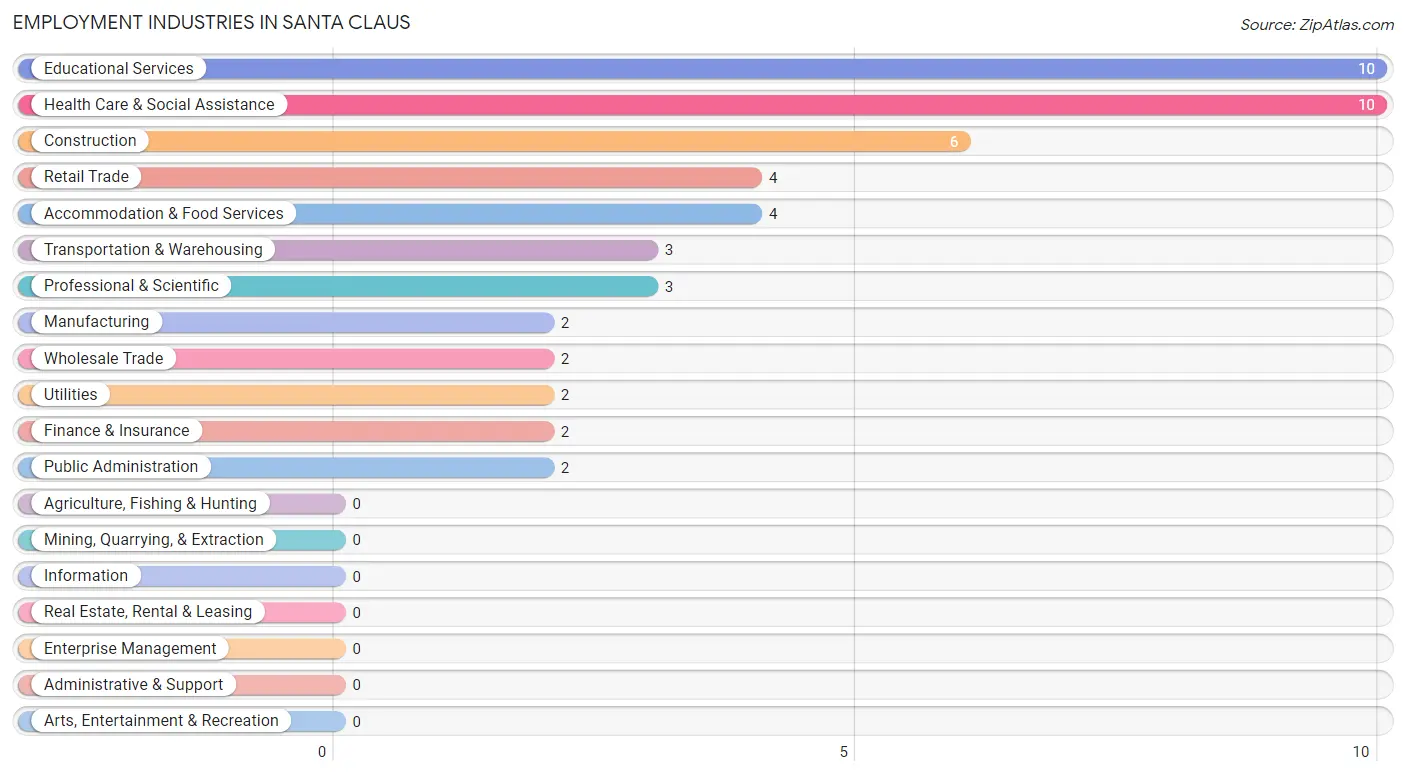
Employment Industries in Santa Claus
The major employment industries in Santa Claus include Educational Services (10 | 17.0%), Health Care & Social Assistance (10 | 17.0%), Construction (6 | 10.2%), Retail Trade (4 | 6.8%), and Accommodation & Food Services (4 | 6.8%).
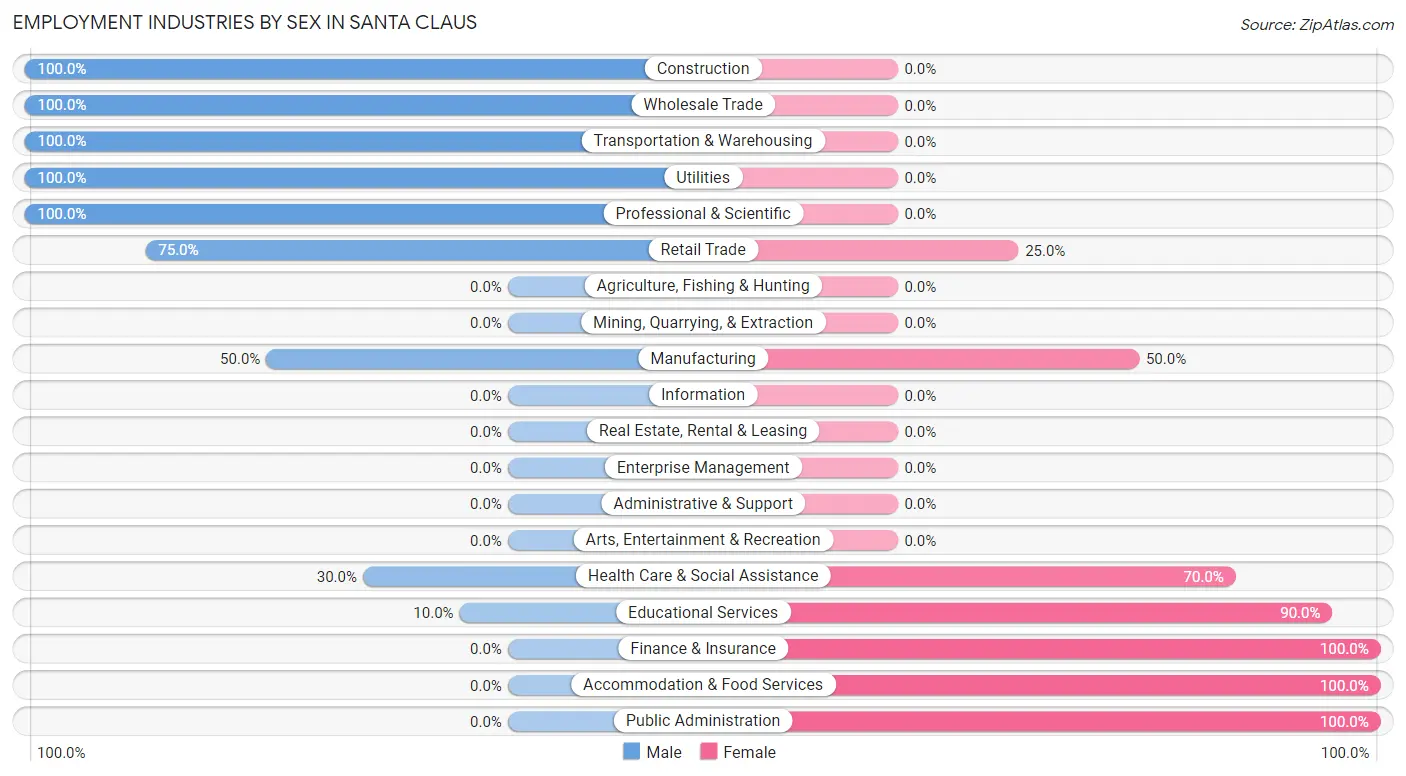
Employment Industries by Sex in Santa Claus
The Santa Claus industries that see more men than women are Construction (100.0%), Wholesale Trade (100.0%), and Transportation & Warehousing (100.0%), whereas the industries that tend to have a higher number of women are Finance & Insurance (100.0%), Accommodation & Food Services (100.0%), and Public Administration (100.0%).
| Industry | Male | Female |
| Agriculture, Fishing & Hunting | 0 (0.0%) | 0 (0.0%) |
| Mining, Quarrying, & Extraction | 0 (0.0%) | 0 (0.0%) |
| Construction | 6 (100.0%) | 0 (0.0%) |
| Manufacturing | 1 (50.0%) | 1 (50.0%) |
| Wholesale Trade | 2 (100.0%) | 0 (0.0%) |
| Retail Trade | 3 (75.0%) | 1 (25.0%) |
| Transportation & Warehousing | 3 (100.0%) | 0 (0.0%) |
| Utilities | 2 (100.0%) | 0 (0.0%) |
| Information | 0 (0.0%) | 0 (0.0%) |
| Finance & Insurance | 0 (0.0%) | 2 (100.0%) |
| Real Estate, Rental & Leasing | 0 (0.0%) | 0 (0.0%) |
| Professional & Scientific | 3 (100.0%) | 0 (0.0%) |
| Enterprise Management | 0 (0.0%) | 0 (0.0%) |
| Administrative & Support | 0 (0.0%) | 0 (0.0%) |
| Educational Services | 1 (10.0%) | 9 (90.0%) |
| Health Care & Social Assistance | 3 (30.0%) | 7 (70.0%) |
| Arts, Entertainment & Recreation | 0 (0.0%) | 0 (0.0%) |
| Accommodation & Food Services | 0 (0.0%) | 4 (100.0%) |
| Public Administration | 0 (0.0%) | 2 (100.0%) |
| Total | 30 (50.8%) | 29 (49.1%) |
Education in Santa Claus
School Enrollment in Santa Claus
The most common levels of schooling among the 40 students in Santa Claus are high school (13 | 32.5%), middle school (8 | 20.0%), and college / undergraduate (8 | 20.0%).
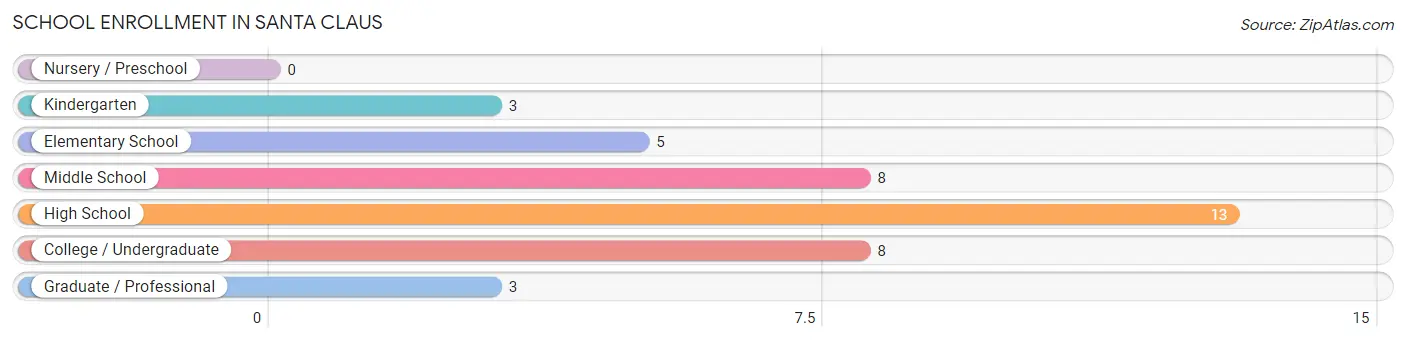
| School Level | # Students | % Students |
| Nursery / Preschool | 0 | 0.0% |
| Kindergarten | 3 | 7.5% |
| Elementary School | 5 | 12.5% |
| Middle School | 8 | 20.0% |
| High School | 13 | 32.5% |
| College / Undergraduate | 8 | 20.0% |
| Graduate / Professional | 3 | 7.5% |
| Total | 40 | 100.0% |
School Enrollment by Age by Funding Source in Santa Claus
Out of a total of 40 students who are enrolled in schools in Santa Claus, 6 (15.0%) attend a private institution, while the remaining 34 (85.0%) are enrolled in public schools. The age group of 35 years and over has the highest likelihood of being enrolled in private schools, with 2 (66.7% in the age bracket) enrolled. Conversely, the age group of 18 to 19 year olds has the lowest likelihood of being enrolled in a private school, with 2 (100.0% in the age bracket) attending a public institution.
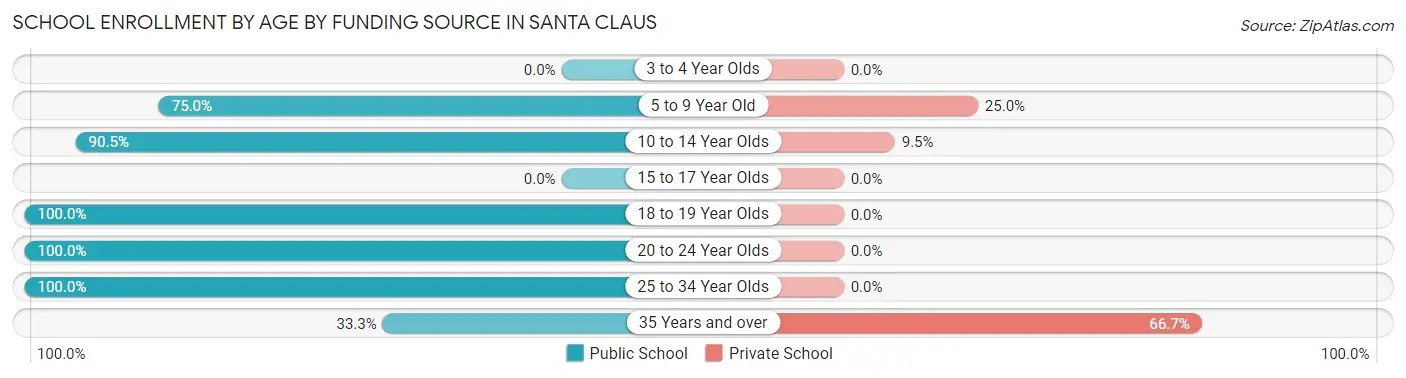
| Age Bracket | Public School | Private School |
| 3 to 4 Year Olds | 0 (0.0%) | 0 (0.0%) |
| 5 to 9 Year Old | 6 (75.0%) | 2 (25.0%) |
| 10 to 14 Year Olds | 19 (90.5%) | 2 (9.5%) |
| 15 to 17 Year Olds | 0 (0.0%) | 0 (0.0%) |
| 18 to 19 Year Olds | 2 (100.0%) | 0 (0.0%) |
| 20 to 24 Year Olds | 1 (100.0%) | 0 (0.0%) |
| 25 to 34 Year Olds | 5 (100.0%) | 0 (0.0%) |
| 35 Years and over | 1 (33.3%) | 2 (66.7%) |
| Total | 34 (85.0%) | 6 (15.0%) |
Educational Attainment by Field of Study in Santa Claus
Business (9 | 37.5%), arts & humanities (7 | 29.2%), liberal arts & history (4 | 16.7%), psychology (2 | 8.3%), and education (2 | 8.3%) are the most common fields of study among 24 individuals in Santa Claus who have obtained a bachelor's degree or higher.
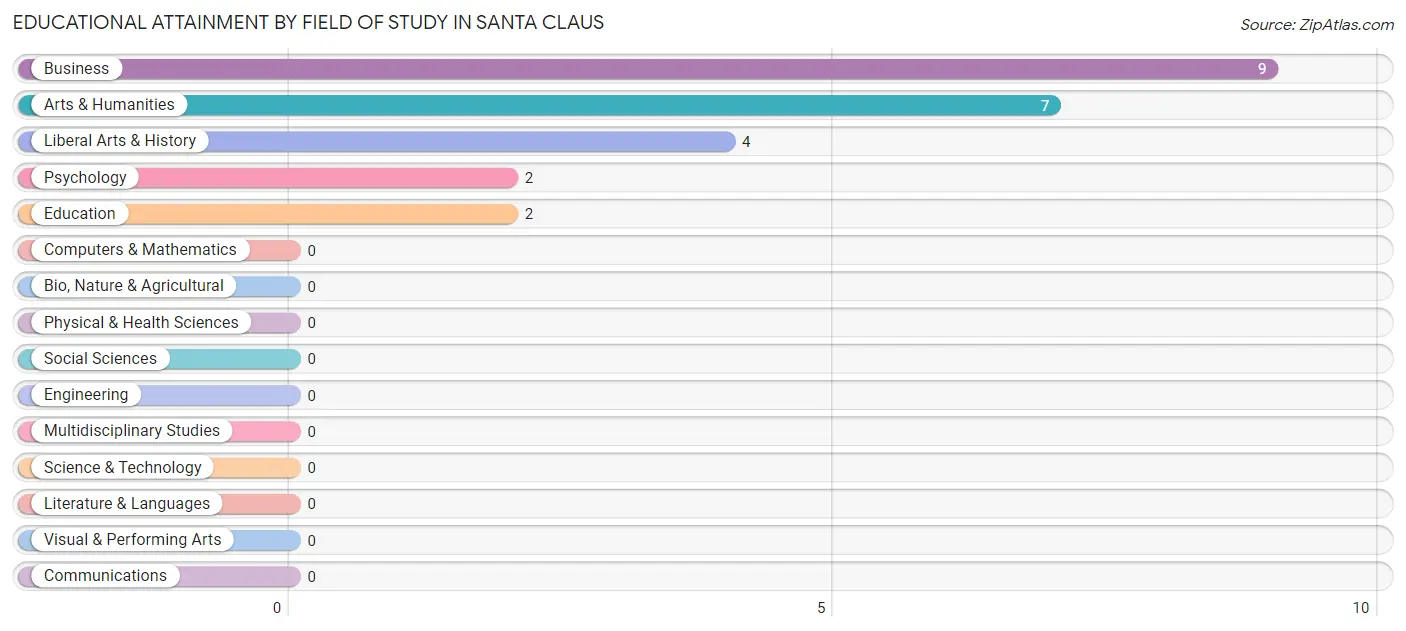
| Field of Study | # Graduates | % Graduates |
| Computers & Mathematics | 0 | 0.0% |
| Bio, Nature & Agricultural | 0 | 0.0% |
| Physical & Health Sciences | 0 | 0.0% |
| Psychology | 2 | 8.3% |
| Social Sciences | 0 | 0.0% |
| Engineering | 0 | 0.0% |
| Multidisciplinary Studies | 0 | 0.0% |
| Science & Technology | 0 | 0.0% |
| Business | 9 | 37.5% |
| Education | 2 | 8.3% |
| Literature & Languages | 0 | 0.0% |
| Liberal Arts & History | 4 | 16.7% |
| Visual & Performing Arts | 0 | 0.0% |
| Communications | 0 | 0.0% |
| Arts & Humanities | 7 | 29.2% |
| Total | 24 | 100.0% |
Transportation & Commute in Santa Claus
Vehicle Availability by Sex in Santa Claus
The most prevalent vehicle ownership categories in Santa Claus are males with 3 vehicles (15, accounting for 55.6%) and females with 3 vehicles (0, making up 53.6%).
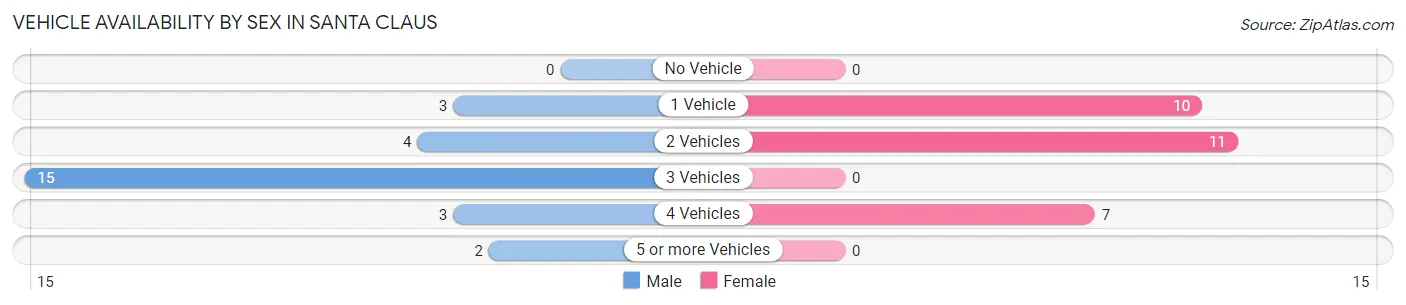
| Vehicles Available | Male | Female |
| No Vehicle | 0 (0.0%) | 0 (0.0%) |
| 1 Vehicle | 3 (11.1%) | 10 (35.7%) |
| 2 Vehicles | 4 (14.8%) | 11 (39.3%) |
| 3 Vehicles | 15 (55.6%) | 0 (0.0%) |
| 4 Vehicles | 3 (11.1%) | 7 (25.0%) |
| 5 or more Vehicles | 2 (7.4%) | 0 (0.0%) |
| Total | 27 (100.0%) | 28 (100.0%) |
Commute Time in Santa Claus
The most frequently occuring commute durations in Santa Claus are 5 to 9 minutes (12 commuters, 24.0%), 60 to 89 minutes (10 commuters, 20.0%), and 15 to 19 minutes (6 commuters, 12.0%).
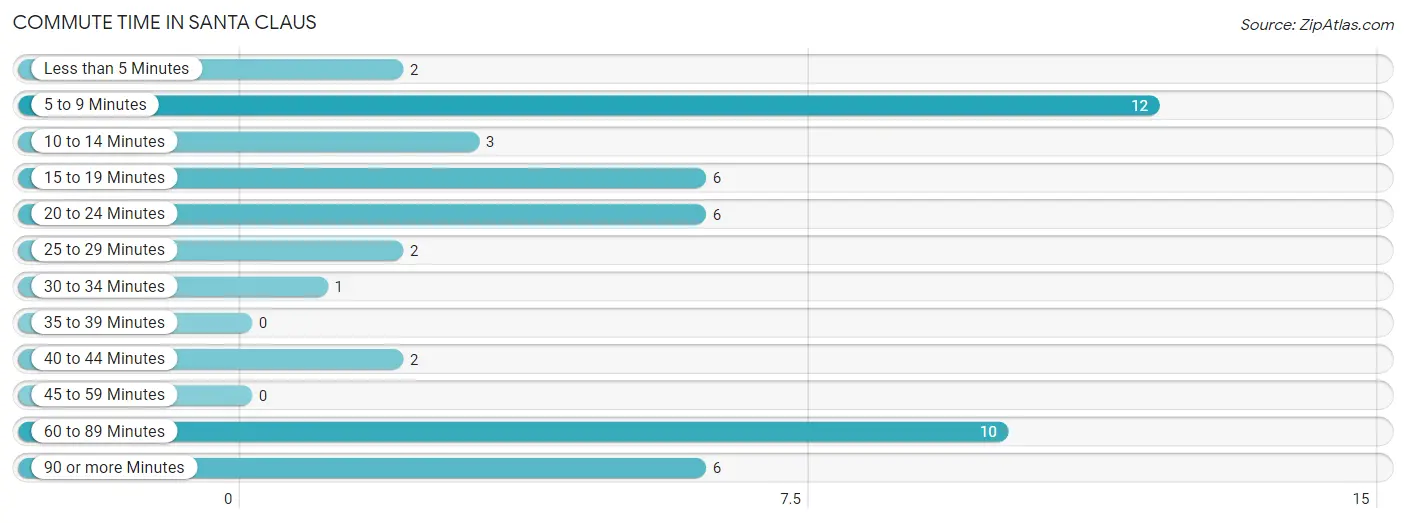
| Commute Time | # Commuters | % Commuters |
| Less than 5 Minutes | 2 | 4.0% |
| 5 to 9 Minutes | 12 | 24.0% |
| 10 to 14 Minutes | 3 | 6.0% |
| 15 to 19 Minutes | 6 | 12.0% |
| 20 to 24 Minutes | 6 | 12.0% |
| 25 to 29 Minutes | 2 | 4.0% |
| 30 to 34 Minutes | 1 | 2.0% |
| 35 to 39 Minutes | 0 | 0.0% |
| 40 to 44 Minutes | 2 | 4.0% |
| 45 to 59 Minutes | 0 | 0.0% |
| 60 to 89 Minutes | 10 | 20.0% |
| 90 or more Minutes | 6 | 12.0% |
Commute Time by Sex in Santa Claus
The most common commute times in Santa Claus are 5 to 9 minutes (7 commuters, 29.2%) for males and 60 to 89 minutes (8 commuters, 30.8%) for females.
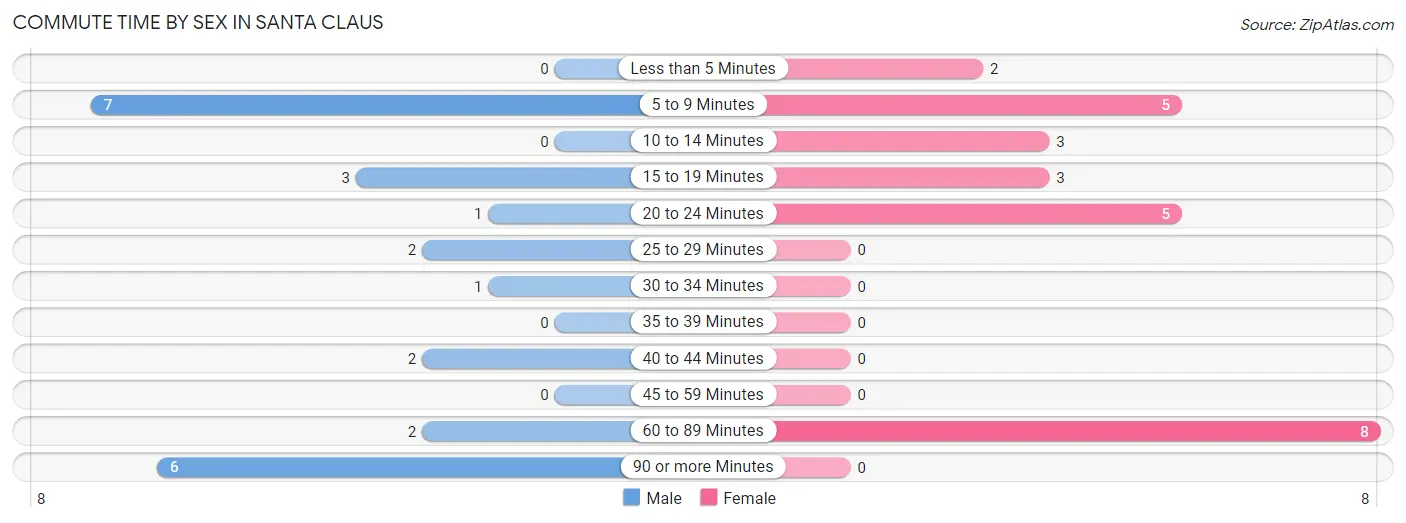
| Commute Time | Male | Female |
| Less than 5 Minutes | 0 (0.0%) | 2 (7.7%) |
| 5 to 9 Minutes | 7 (29.2%) | 5 (19.2%) |
| 10 to 14 Minutes | 0 (0.0%) | 3 (11.5%) |
| 15 to 19 Minutes | 3 (12.5%) | 3 (11.5%) |
| 20 to 24 Minutes | 1 (4.2%) | 5 (19.2%) |
| 25 to 29 Minutes | 2 (8.3%) | 0 (0.0%) |
| 30 to 34 Minutes | 1 (4.2%) | 0 (0.0%) |
| 35 to 39 Minutes | 0 (0.0%) | 0 (0.0%) |
| 40 to 44 Minutes | 2 (8.3%) | 0 (0.0%) |
| 45 to 59 Minutes | 0 (0.0%) | 0 (0.0%) |
| 60 to 89 Minutes | 2 (8.3%) | 8 (30.8%) |
| 90 or more Minutes | 6 (25.0%) | 0 (0.0%) |
Time of Departure to Work by Sex in Santa Claus
The most frequent times of departure to work in Santa Claus are 6:00 AM to 6:29 AM (15, 62.5%) for males and 9:00 AM to 9:59 AM (9, 34.6%) for females.
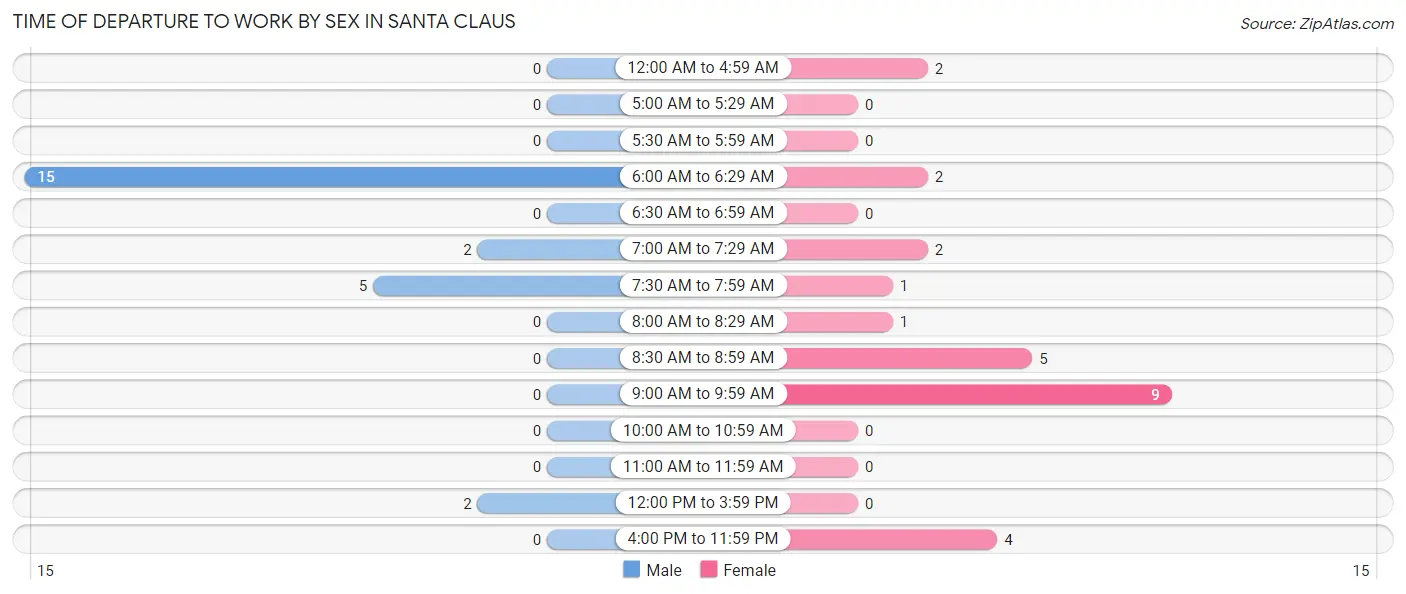
| Time of Departure | Male | Female |
| 12:00 AM to 4:59 AM | 0 (0.0%) | 2 (7.7%) |
| 5:00 AM to 5:29 AM | 0 (0.0%) | 0 (0.0%) |
| 5:30 AM to 5:59 AM | 0 (0.0%) | 0 (0.0%) |
| 6:00 AM to 6:29 AM | 15 (62.5%) | 2 (7.7%) |
| 6:30 AM to 6:59 AM | 0 (0.0%) | 0 (0.0%) |
| 7:00 AM to 7:29 AM | 2 (8.3%) | 2 (7.7%) |
| 7:30 AM to 7:59 AM | 5 (20.8%) | 1 (3.8%) |
| 8:00 AM to 8:29 AM | 0 (0.0%) | 1 (3.8%) |
| 8:30 AM to 8:59 AM | 0 (0.0%) | 5 (19.2%) |
| 9:00 AM to 9:59 AM | 0 (0.0%) | 9 (34.6%) |
| 10:00 AM to 10:59 AM | 0 (0.0%) | 0 (0.0%) |
| 11:00 AM to 11:59 AM | 0 (0.0%) | 0 (0.0%) |
| 12:00 PM to 3:59 PM | 2 (8.3%) | 0 (0.0%) |
| 4:00 PM to 11:59 PM | 0 (0.0%) | 4 (15.4%) |
| Total | 24 (100.0%) | 26 (100.0%) |
Housing Occupancy in Santa Claus
Occupancy by Ownership in Santa Claus
Of the total 69 dwellings in Santa Claus, owner-occupied units account for 46 (66.7%), while renter-occupied units make up 23 (33.3%).
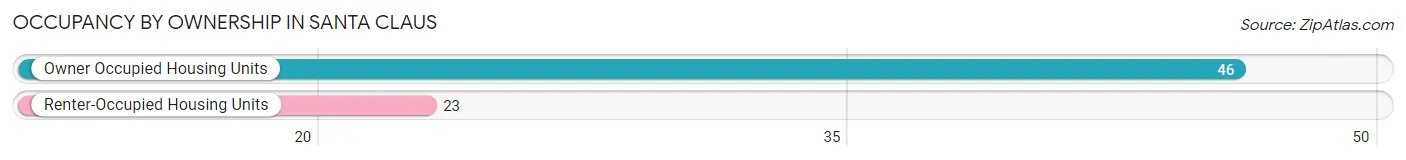
| Occupancy | # Housing Units | % Housing Units |
| Owner Occupied Housing Units | 46 | 66.7% |
| Renter-Occupied Housing Units | 23 | 33.3% |
| Total Occupied Housing Units | 69 | 100.0% |
Occupancy by Household Size in Santa Claus
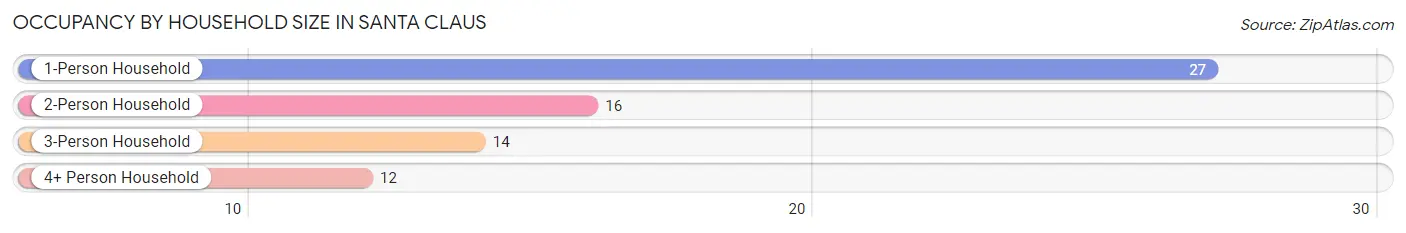
| Household Size | # Housing Units | % Housing Units |
| 1-Person Household | 27 | 39.1% |
| 2-Person Household | 16 | 23.2% |
| 3-Person Household | 14 | 20.3% |
| 4+ Person Household | 12 | 17.4% |
| Total Housing Units | 69 | 100.0% |
Occupancy by Ownership by Household Size in Santa Claus
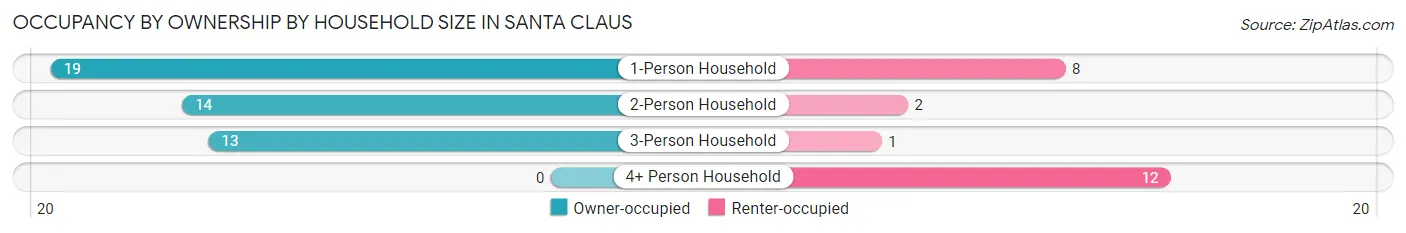
| Household Size | Owner-occupied | Renter-occupied |
| 1-Person Household | 19 (70.4%) | 8 (29.6%) |
| 2-Person Household | 14 (87.5%) | 2 (12.5%) |
| 3-Person Household | 13 (92.9%) | 1 (7.1%) |
| 4+ Person Household | 0 (0.0%) | 12 (100.0%) |
| Total Housing Units | 46 (66.7%) | 23 (33.3%) |
Occupancy by Educational Attainment in Santa Claus
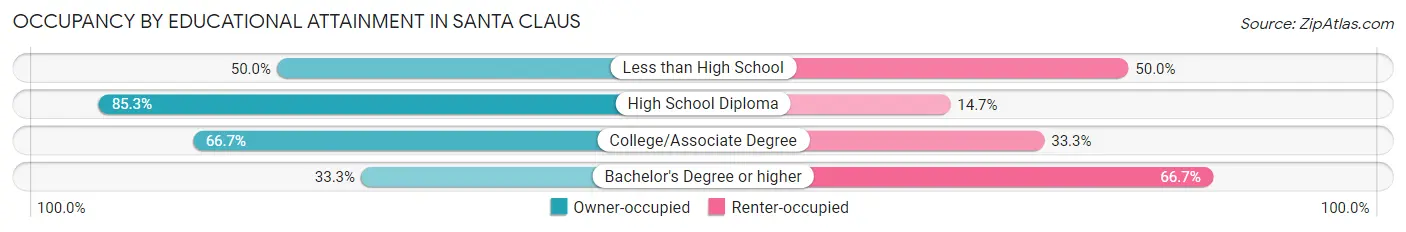
| Household Size | Owner-occupied | Renter-occupied |
| Less than High School | 7 (50.0%) | 7 (50.0%) |
| High School Diploma | 29 (85.3%) | 5 (14.7%) |
| College/Associate Degree | 6 (66.7%) | 3 (33.3%) |
| Bachelor's Degree or higher | 4 (33.3%) | 8 (66.7%) |
Occupancy by Age of Householder in Santa Claus
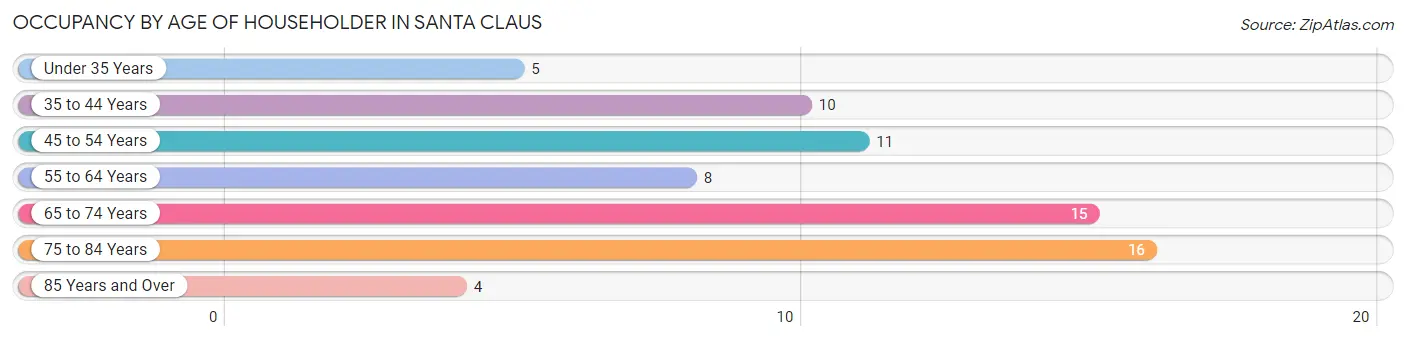
| Age Bracket | # Households | % Households |
| Under 35 Years | 5 | 7.2% |
| 35 to 44 Years | 10 | 14.5% |
| 45 to 54 Years | 11 | 15.9% |
| 55 to 64 Years | 8 | 11.6% |
| 65 to 74 Years | 15 | 21.7% |
| 75 to 84 Years | 16 | 23.2% |
| 85 Years and Over | 4 | 5.8% |
| Total | 69 | 100.0% |
Housing Finances in Santa Claus
Median Income by Occupancy in Santa Claus
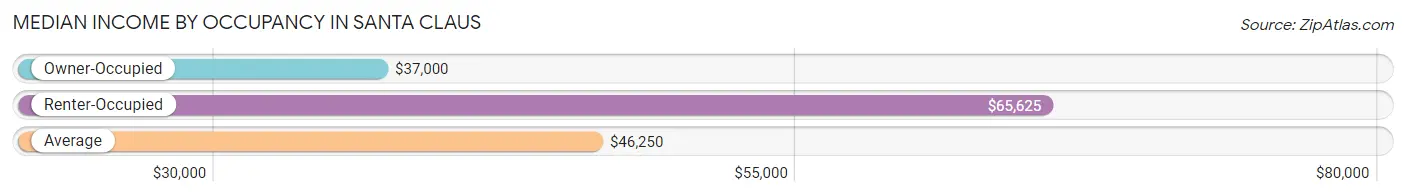
| Occupancy Type | # Households | Median Income |
| Owner-Occupied | 46 (66.7%) | $37,000 |
| Renter-Occupied | 23 (33.3%) | $65,625 |
| Average | 69 (100.0%) | $46,250 |
Occupancy by Householder Income Bracket in Santa Claus
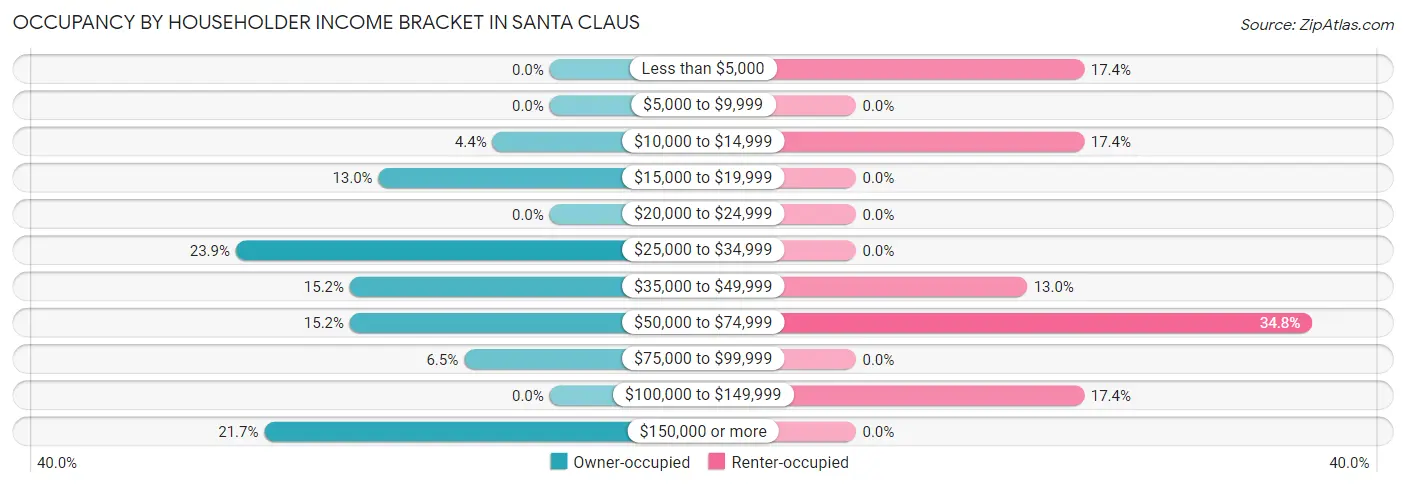
| Income Bracket | Owner-occupied | Renter-occupied |
| Less than $5,000 | 0 (0.0%) | 4 (17.4%) |
| $5,000 to $9,999 | 0 (0.0%) | 0 (0.0%) |
| $10,000 to $14,999 | 2 (4.3%) | 4 (17.4%) |
| $15,000 to $19,999 | 6 (13.0%) | 0 (0.0%) |
| $20,000 to $24,999 | 0 (0.0%) | 0 (0.0%) |
| $25,000 to $34,999 | 11 (23.9%) | 0 (0.0%) |
| $35,000 to $49,999 | 7 (15.2%) | 3 (13.0%) |
| $50,000 to $74,999 | 7 (15.2%) | 8 (34.8%) |
| $75,000 to $99,999 | 3 (6.5%) | 0 (0.0%) |
| $100,000 to $149,999 | 0 (0.0%) | 4 (17.4%) |
| $150,000 or more | 10 (21.7%) | 0 (0.0%) |
| Total | 46 (100.0%) | 23 (100.0%) |
Monthly Housing Cost Tiers in Santa Claus
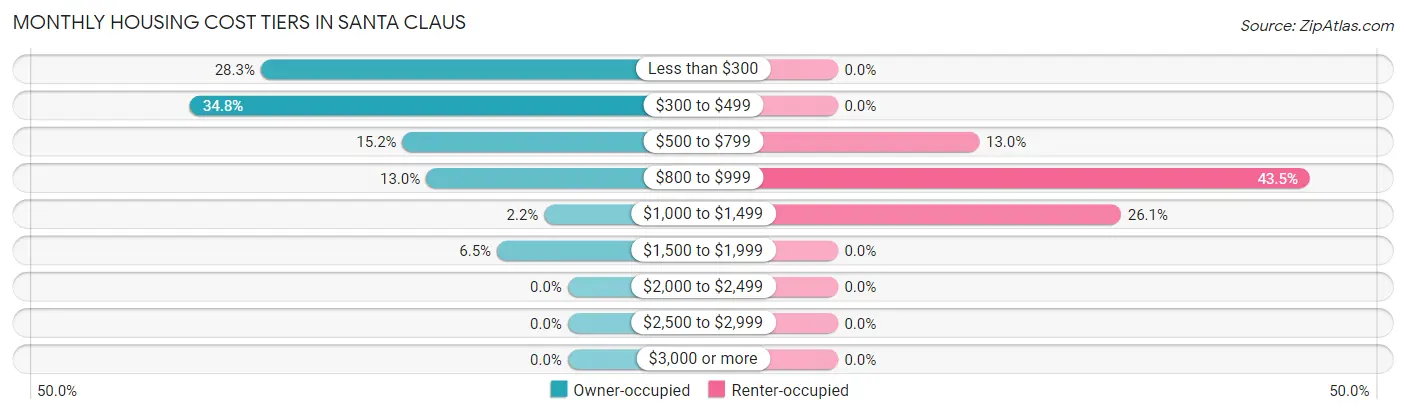
| Monthly Cost | Owner-occupied | Renter-occupied |
| Less than $300 | 13 (28.3%) | 0 (0.0%) |
| $300 to $499 | 16 (34.8%) | 0 (0.0%) |
| $500 to $799 | 7 (15.2%) | 3 (13.0%) |
| $800 to $999 | 6 (13.0%) | 10 (43.5%) |
| $1,000 to $1,499 | 1 (2.2%) | 6 (26.1%) |
| $1,500 to $1,999 | 3 (6.5%) | 0 (0.0%) |
| $2,000 to $2,499 | 0 (0.0%) | 0 (0.0%) |
| $2,500 to $2,999 | 0 (0.0%) | 0 (0.0%) |
| $3,000 or more | 0 (0.0%) | 0 (0.0%) |
| Total | 46 (100.0%) | 23 (100.0%) |
Physical Housing Characteristics in Santa Claus
Housing Structures in Santa Claus
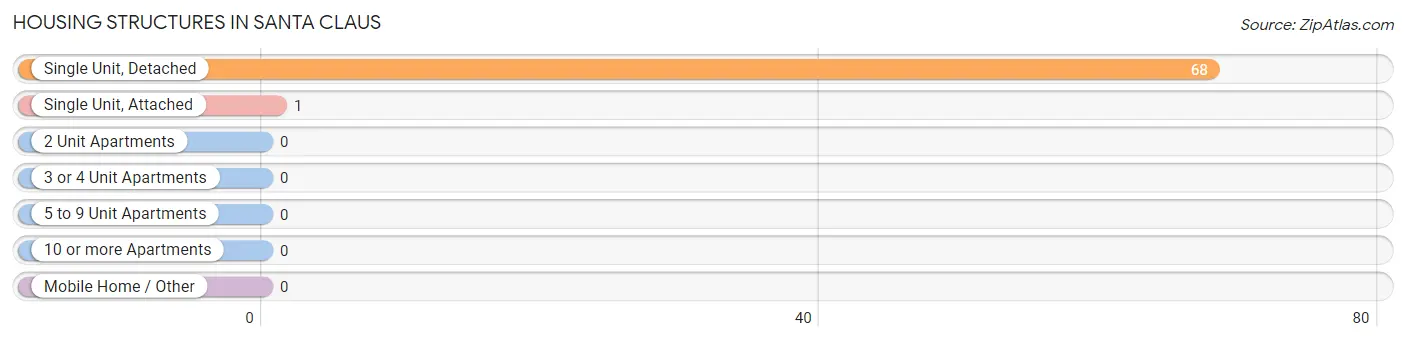
| Structure Type | # Housing Units | % Housing Units |
| Single Unit, Detached | 68 | 98.6% |
| Single Unit, Attached | 1 | 1.5% |
| 2 Unit Apartments | 0 | 0.0% |
| 3 or 4 Unit Apartments | 0 | 0.0% |
| 5 to 9 Unit Apartments | 0 | 0.0% |
| 10 or more Apartments | 0 | 0.0% |
| Mobile Home / Other | 0 | 0.0% |
| Total | 69 | 100.0% |
Housing Structures by Occupancy in Santa Claus
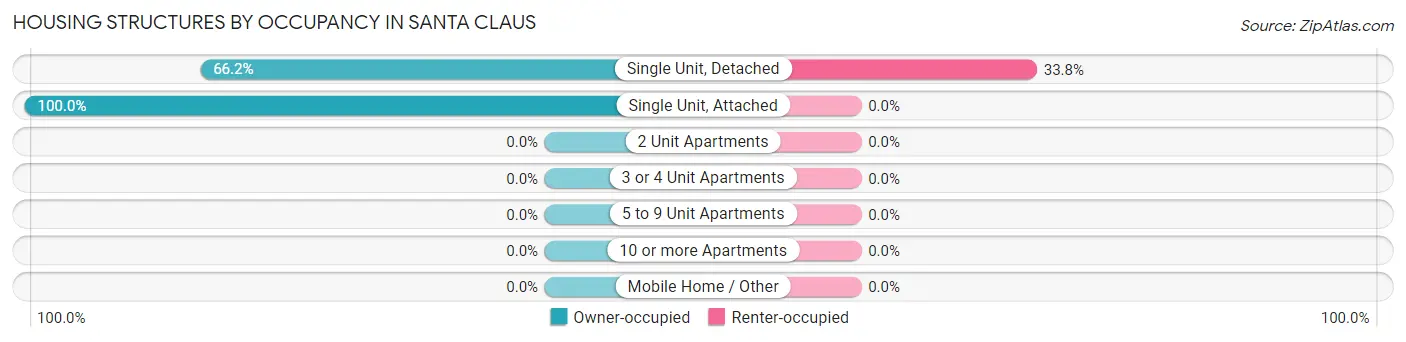
| Structure Type | Owner-occupied | Renter-occupied |
| Single Unit, Detached | 45 (66.2%) | 23 (33.8%) |
| Single Unit, Attached | 1 (100.0%) | 0 (0.0%) |
| 2 Unit Apartments | 0 (0.0%) | 0 (0.0%) |
| 3 or 4 Unit Apartments | 0 (0.0%) | 0 (0.0%) |
| 5 to 9 Unit Apartments | 0 (0.0%) | 0 (0.0%) |
| 10 or more Apartments | 0 (0.0%) | 0 (0.0%) |
| Mobile Home / Other | 0 (0.0%) | 0 (0.0%) |
| Total | 46 (66.7%) | 23 (33.3%) |
Housing Structures by Number of Rooms in Santa Claus
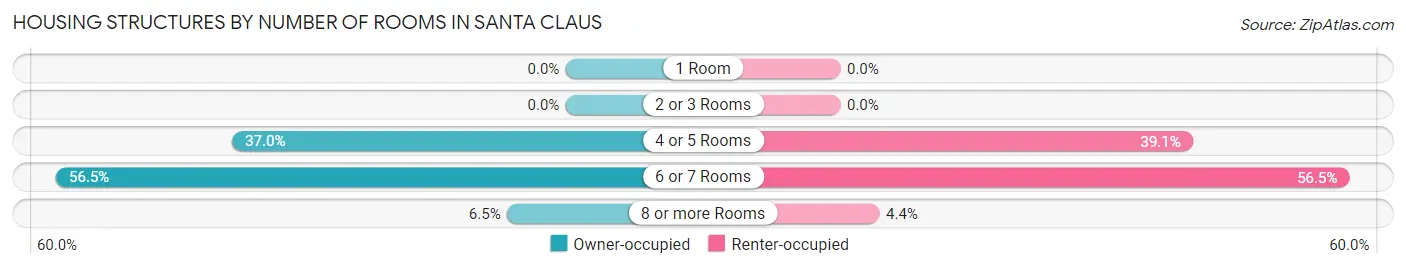
| Number of Rooms | Owner-occupied | Renter-occupied |
| 1 Room | 0 (0.0%) | 0 (0.0%) |
| 2 or 3 Rooms | 0 (0.0%) | 0 (0.0%) |
| 4 or 5 Rooms | 17 (37.0%) | 9 (39.1%) |
| 6 or 7 Rooms | 26 (56.5%) | 13 (56.5%) |
| 8 or more Rooms | 3 (6.5%) | 1 (4.3%) |
| Total | 46 (100.0%) | 23 (100.0%) |
Housing Structure by Heating Type in Santa Claus
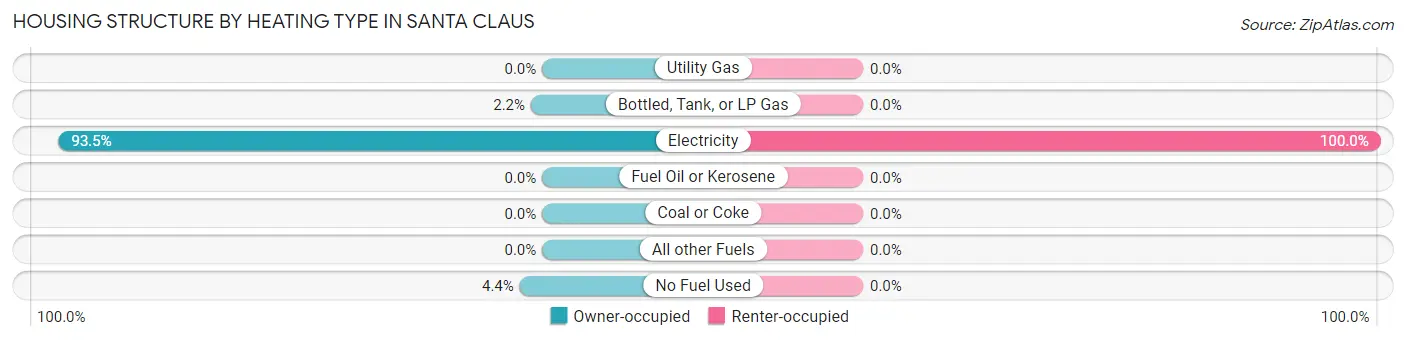
| Heating Type | Owner-occupied | Renter-occupied |
| Utility Gas | 0 (0.0%) | 0 (0.0%) |
| Bottled, Tank, or LP Gas | 1 (2.2%) | 0 (0.0%) |
| Electricity | 43 (93.5%) | 23 (100.0%) |
| Fuel Oil or Kerosene | 0 (0.0%) | 0 (0.0%) |
| Coal or Coke | 0 (0.0%) | 0 (0.0%) |
| All other Fuels | 0 (0.0%) | 0 (0.0%) |
| No Fuel Used | 2 (4.3%) | 0 (0.0%) |
| Total | 46 (100.0%) | 23 (100.0%) |
Household Vehicle Usage in Santa Claus
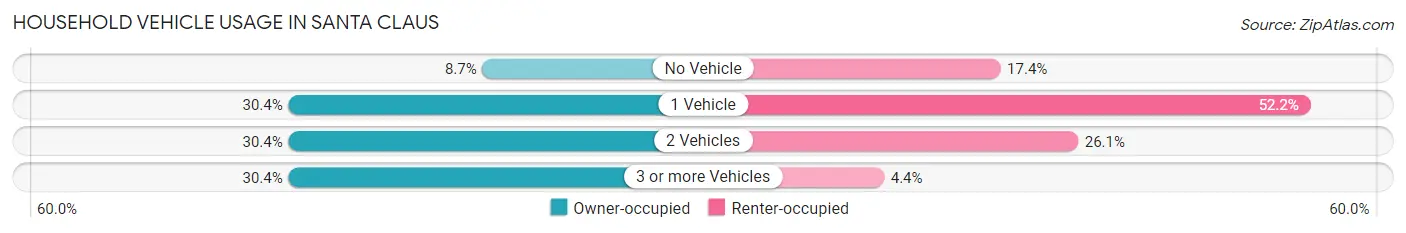
| Vehicles per Household | Owner-occupied | Renter-occupied |
| No Vehicle | 4 (8.7%) | 4 (17.4%) |
| 1 Vehicle | 14 (30.4%) | 12 (52.2%) |
| 2 Vehicles | 14 (30.4%) | 6 (26.1%) |
| 3 or more Vehicles | 14 (30.4%) | 1 (4.3%) |
| Total | 46 (100.0%) | 23 (100.0%) |
Real Estate & Mortgages in Santa Claus
Real Estate and Mortgage Overview in Santa Claus
| Characteristic | Without Mortgage | With Mortgage |
| Housing Units | 31 | 15 |
| Median Property Value | $71,700 | $94,200 |
| Median Household Income | $32,083 | $8 |
| Monthly Housing Costs | $313 | $0 |
| Real Estate Taxes | $625 | $0 |
Property Value by Mortgage Status in Santa Claus
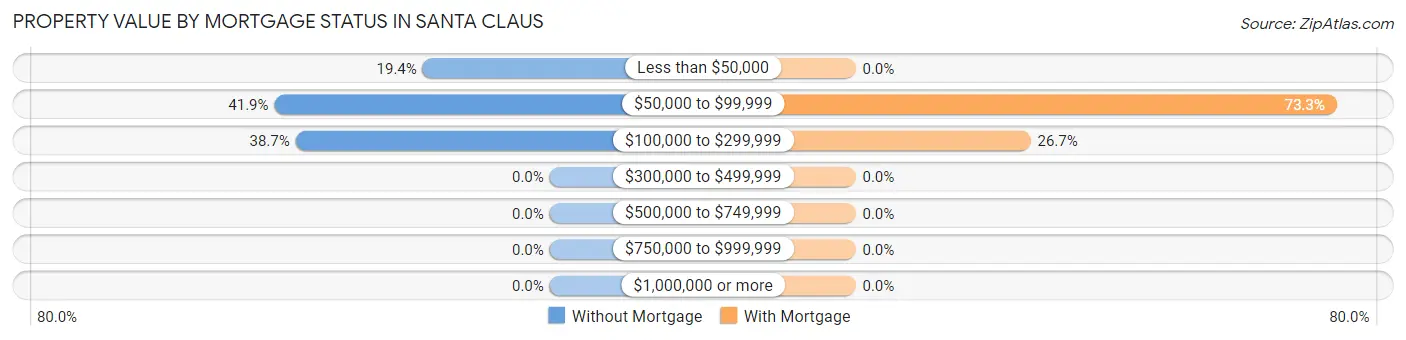
| Property Value | Without Mortgage | With Mortgage |
| Less than $50,000 | 6 (19.4%) | 0 (0.0%) |
| $50,000 to $99,999 | 13 (41.9%) | 11 (73.3%) |
| $100,000 to $299,999 | 12 (38.7%) | 4 (26.7%) |
| $300,000 to $499,999 | 0 (0.0%) | 0 (0.0%) |
| $500,000 to $749,999 | 0 (0.0%) | 0 (0.0%) |
| $750,000 to $999,999 | 0 (0.0%) | 0 (0.0%) |
| $1,000,000 or more | 0 (0.0%) | 0 (0.0%) |
| Total | 31 (100.0%) | 15 (100.0%) |
Household Income by Mortgage Status in Santa Claus
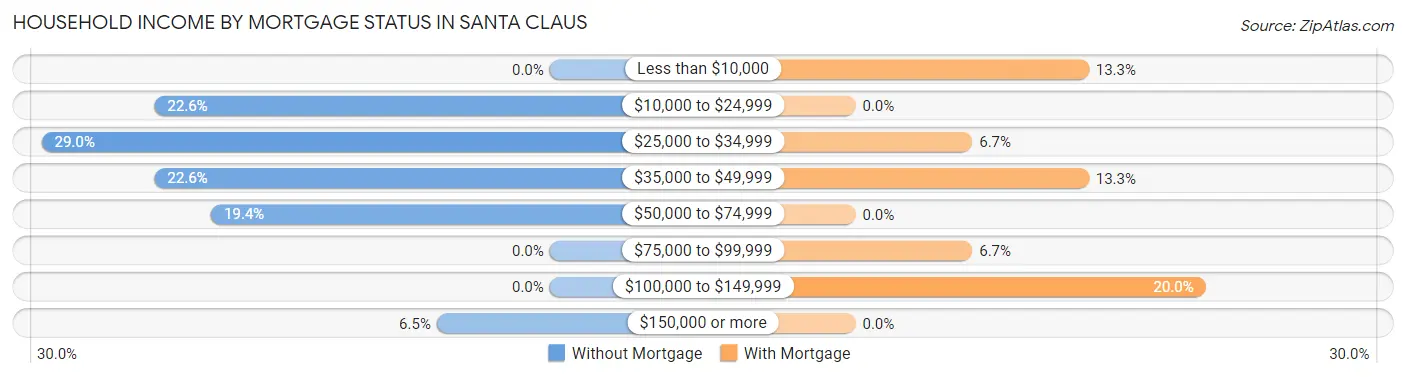
| Household Income | Without Mortgage | With Mortgage |
| Less than $10,000 | 0 (0.0%) | 2 (13.3%) |
| $10,000 to $24,999 | 7 (22.6%) | 0 (0.0%) |
| $25,000 to $34,999 | 9 (29.0%) | 1 (6.7%) |
| $35,000 to $49,999 | 7 (22.6%) | 2 (13.3%) |
| $50,000 to $74,999 | 6 (19.4%) | 0 (0.0%) |
| $75,000 to $99,999 | 0 (0.0%) | 1 (6.7%) |
| $100,000 to $149,999 | 0 (0.0%) | 3 (20.0%) |
| $150,000 or more | 2 (6.5%) | 0 (0.0%) |
| Total | 31 (100.0%) | 15 (100.0%) |
Property Value to Household Income Ratio in Santa Claus
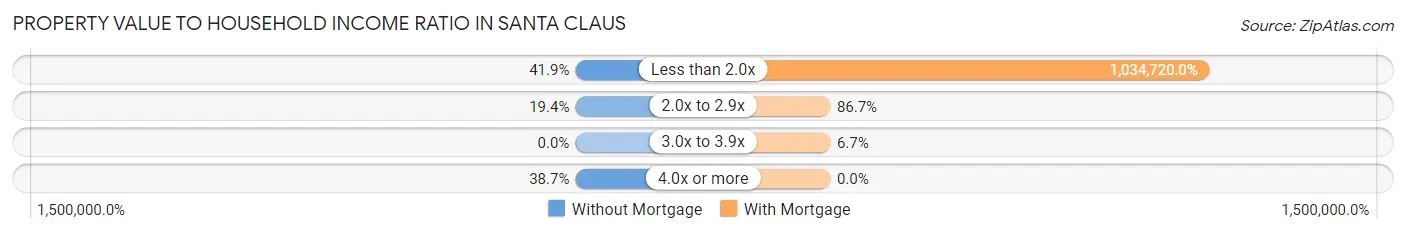
| Value-to-Income Ratio | Without Mortgage | With Mortgage |
| Less than 2.0x | 13 (41.9%) | 155,208 (1,034,720.0%) |
| 2.0x to 2.9x | 6 (19.4%) | 13 (86.7%) |
| 3.0x to 3.9x | 0 (0.0%) | 1 (6.7%) |
| 4.0x or more | 12 (38.7%) | 0 (0.0%) |
| Total | 31 (100.0%) | 15 (100.0%) |
Real Estate Taxes by Mortgage Status in Santa Claus
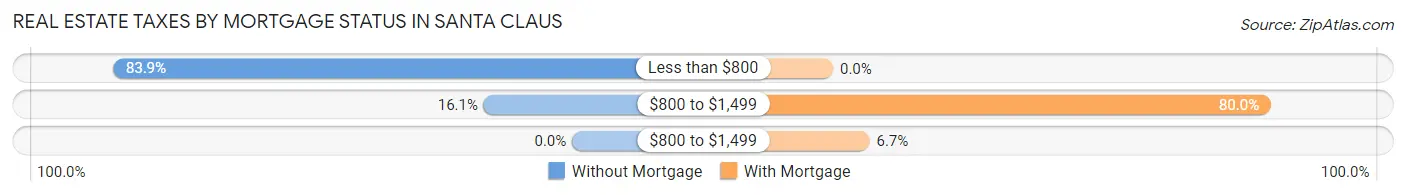
| Property Taxes | Without Mortgage | With Mortgage |
| Less than $800 | 26 (83.9%) | 0 (0.0%) |
| $800 to $1,499 | 5 (16.1%) | 12 (80.0%) |
| $800 to $1,499 | 0 (0.0%) | 1 (6.7%) |
| Total | 31 (100.0%) | 15 (100.0%) |
Health & Disability in Santa Claus
Health Insurance Coverage by Age in Santa Claus
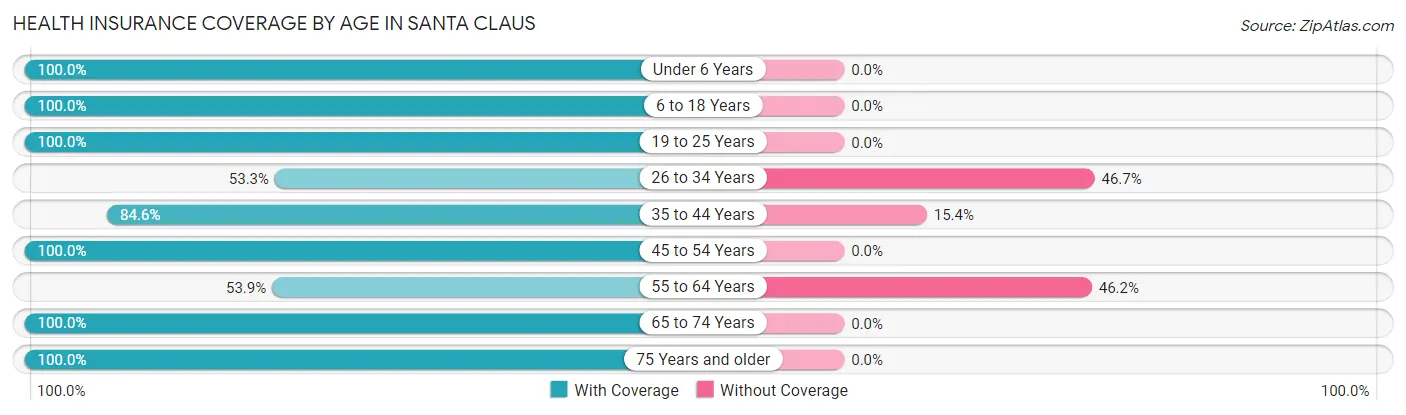
| Age Bracket | With Coverage | Without Coverage |
| Under 6 Years | 5 (100.0%) | 0 (0.0%) |
| 6 to 18 Years | 26 (100.0%) | 0 (0.0%) |
| 19 to 25 Years | 9 (100.0%) | 0 (0.0%) |
| 26 to 34 Years | 8 (53.3%) | 7 (46.7%) |
| 35 to 44 Years | 11 (84.6%) | 2 (15.4%) |
| 45 to 54 Years | 16 (100.0%) | 0 (0.0%) |
| 55 to 64 Years | 7 (53.8%) | 6 (46.2%) |
| 65 to 74 Years | 17 (100.0%) | 0 (0.0%) |
| 75 Years and older | 32 (100.0%) | 0 (0.0%) |
| Total | 131 (89.7%) | 15 (10.3%) |
Health Insurance Coverage by Citizenship Status in Santa Claus
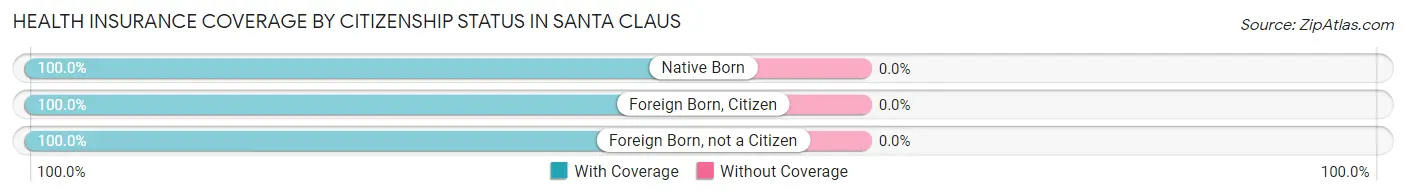
| Citizenship Status | With Coverage | Without Coverage |
| Native Born | 5 (100.0%) | 0 (0.0%) |
| Foreign Born, Citizen | 26 (100.0%) | 0 (0.0%) |
| Foreign Born, not a Citizen | 9 (100.0%) | 0 (0.0%) |
Health Insurance Coverage by Household Income in Santa Claus
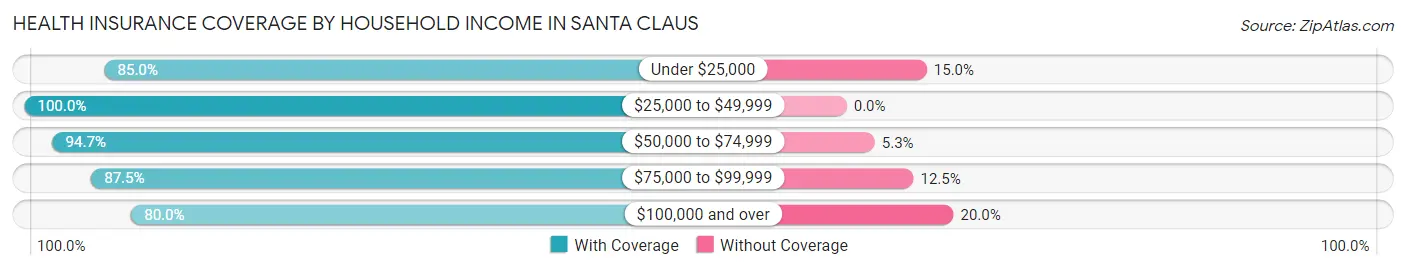
| Household Income | With Coverage | Without Coverage |
| Under $25,000 | 17 (85.0%) | 3 (15.0%) |
| $25,000 to $49,999 | 35 (100.0%) | 0 (0.0%) |
| $50,000 to $74,999 | 36 (94.7%) | 2 (5.3%) |
| $75,000 to $99,999 | 7 (87.5%) | 1 (12.5%) |
| $100,000 and over | 36 (80.0%) | 9 (20.0%) |
Public vs Private Health Insurance Coverage by Age in Santa Claus
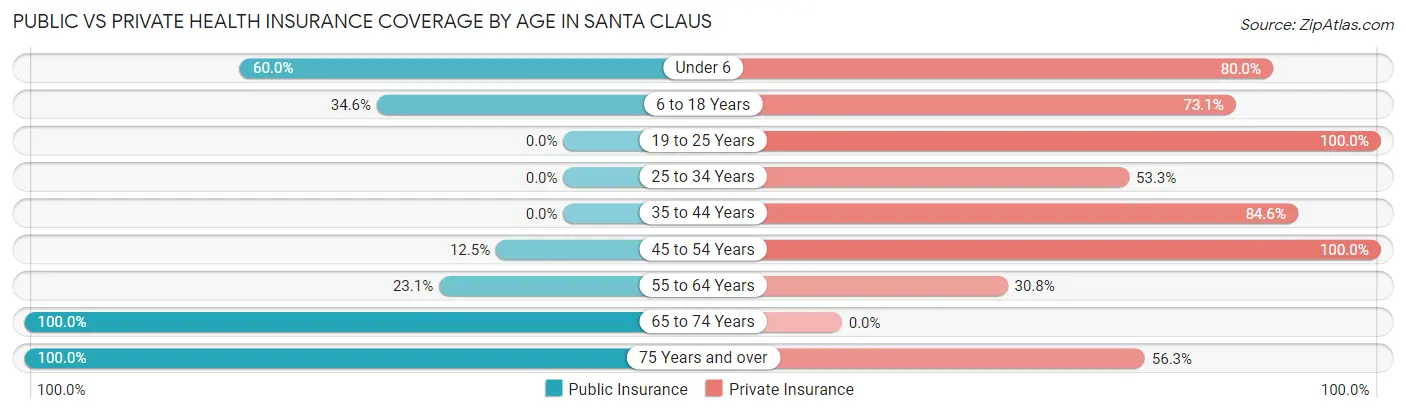
| Age Bracket | Public Insurance | Private Insurance |
| Under 6 | 3 (60.0%) | 4 (80.0%) |
| 6 to 18 Years | 9 (34.6%) | 19 (73.1%) |
| 19 to 25 Years | 0 (0.0%) | 9 (100.0%) |
| 25 to 34 Years | 0 (0.0%) | 8 (53.3%) |
| 35 to 44 Years | 0 (0.0%) | 11 (84.6%) |
| 45 to 54 Years | 2 (12.5%) | 16 (100.0%) |
| 55 to 64 Years | 3 (23.1%) | 4 (30.8%) |
| 65 to 74 Years | 17 (100.0%) | 0 (0.0%) |
| 75 Years and over | 32 (100.0%) | 18 (56.2%) |
| Total | 66 (45.2%) | 89 (61.0%) |
Disability Status by Sex by Age in Santa Claus
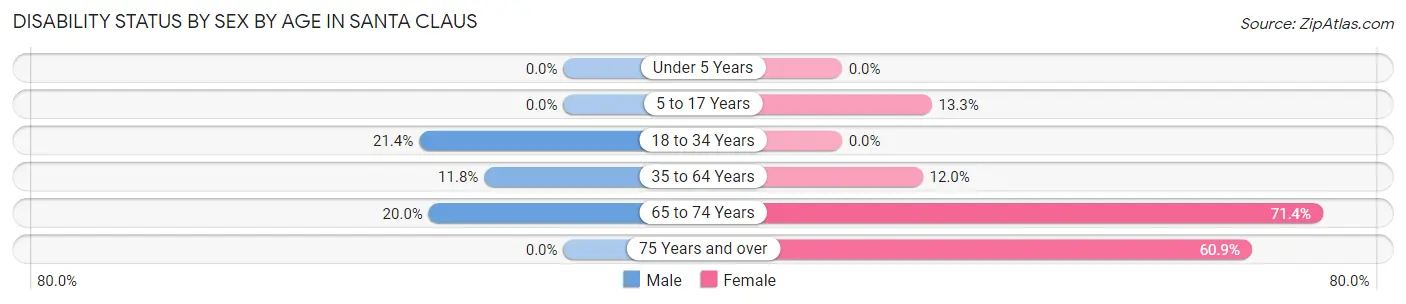
| Age Bracket | Male | Female |
| Under 5 Years | 0 (0.0%) | 0 (0.0%) |
| 5 to 17 Years | 0 (0.0%) | 2 (13.3%) |
| 18 to 34 Years | 3 (21.4%) | 0 (0.0%) |
| 35 to 64 Years | 2 (11.8%) | 3 (12.0%) |
| 65 to 74 Years | 2 (20.0%) | 5 (71.4%) |
| 75 Years and over | 0 (0.0%) | 14 (60.9%) |
Disability Class by Sex by Age in Santa Claus
Disability Class: Hearing Difficulty
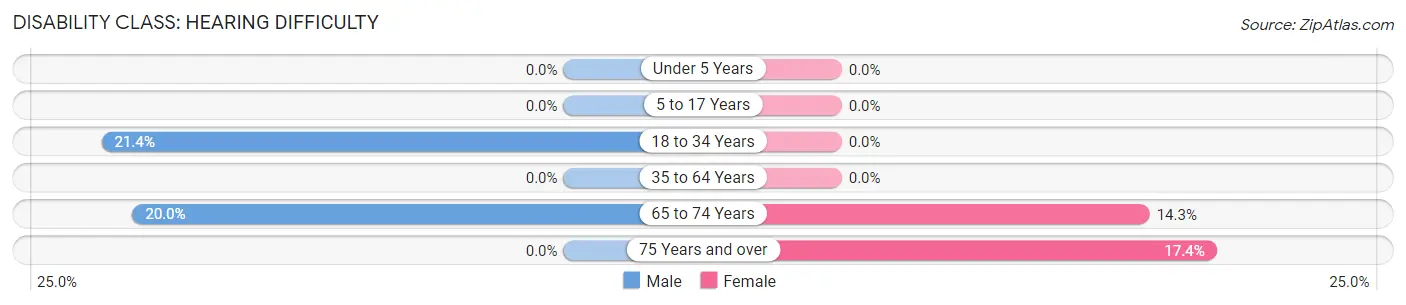
| Age Bracket | Male | Female |
| Under 5 Years | 0 (0.0%) | 0 (0.0%) |
| 5 to 17 Years | 0 (0.0%) | 0 (0.0%) |
| 18 to 34 Years | 3 (21.4%) | 0 (0.0%) |
| 35 to 64 Years | 0 (0.0%) | 0 (0.0%) |
| 65 to 74 Years | 2 (20.0%) | 1 (14.3%) |
| 75 Years and over | 0 (0.0%) | 4 (17.4%) |
Disability Class: Vision Difficulty
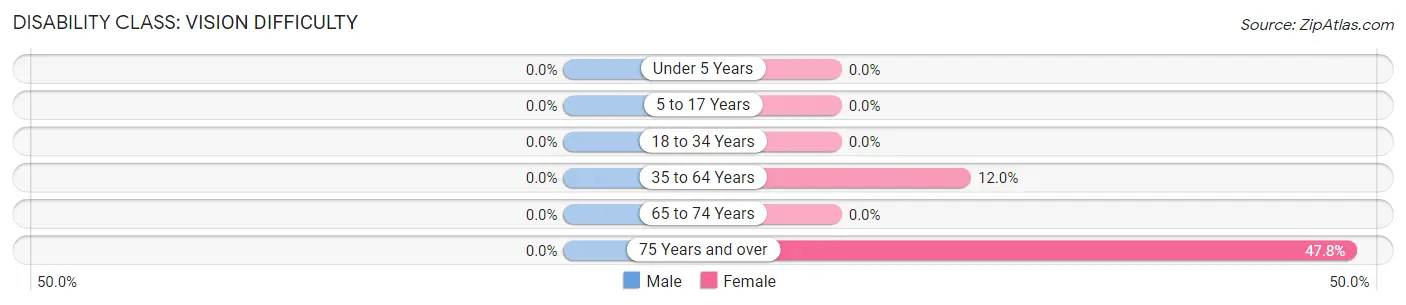
| Age Bracket | Male | Female |
| Under 5 Years | 0 (0.0%) | 0 (0.0%) |
| 5 to 17 Years | 0 (0.0%) | 0 (0.0%) |
| 18 to 34 Years | 0 (0.0%) | 0 (0.0%) |
| 35 to 64 Years | 0 (0.0%) | 3 (12.0%) |
| 65 to 74 Years | 0 (0.0%) | 0 (0.0%) |
| 75 Years and over | 0 (0.0%) | 11 (47.8%) |
Disability Class: Cognitive Difficulty
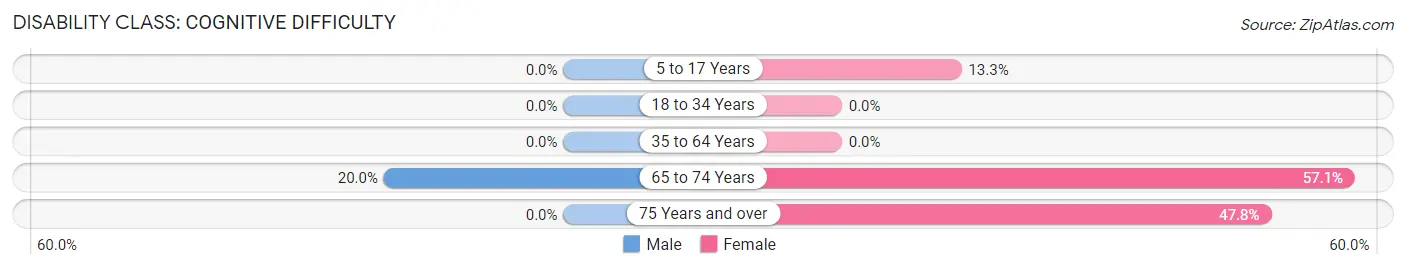
| Age Bracket | Male | Female |
| 5 to 17 Years | 0 (0.0%) | 2 (13.3%) |
| 18 to 34 Years | 0 (0.0%) | 0 (0.0%) |
| 35 to 64 Years | 0 (0.0%) | 0 (0.0%) |
| 65 to 74 Years | 2 (20.0%) | 4 (57.1%) |
| 75 Years and over | 0 (0.0%) | 11 (47.8%) |
Disability Class: Ambulatory Difficulty
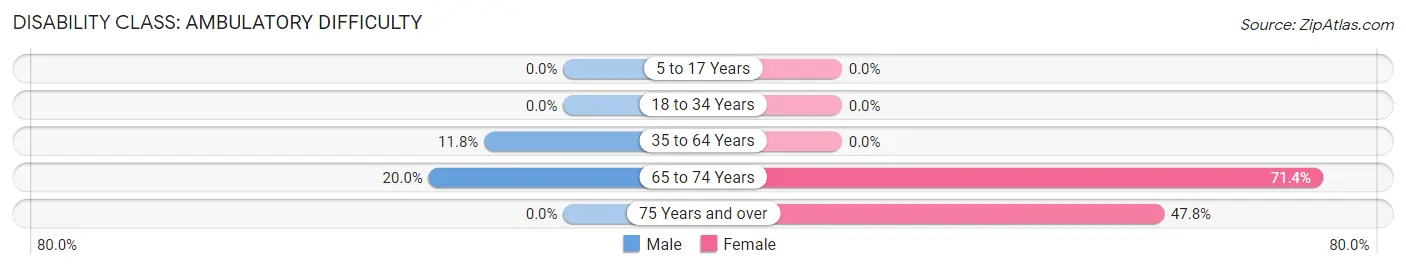
| Age Bracket | Male | Female |
| 5 to 17 Years | 0 (0.0%) | 0 (0.0%) |
| 18 to 34 Years | 0 (0.0%) | 0 (0.0%) |
| 35 to 64 Years | 2 (11.8%) | 0 (0.0%) |
| 65 to 74 Years | 2 (20.0%) | 5 (71.4%) |
| 75 Years and over | 0 (0.0%) | 11 (47.8%) |
Disability Class: Self-Care Difficulty
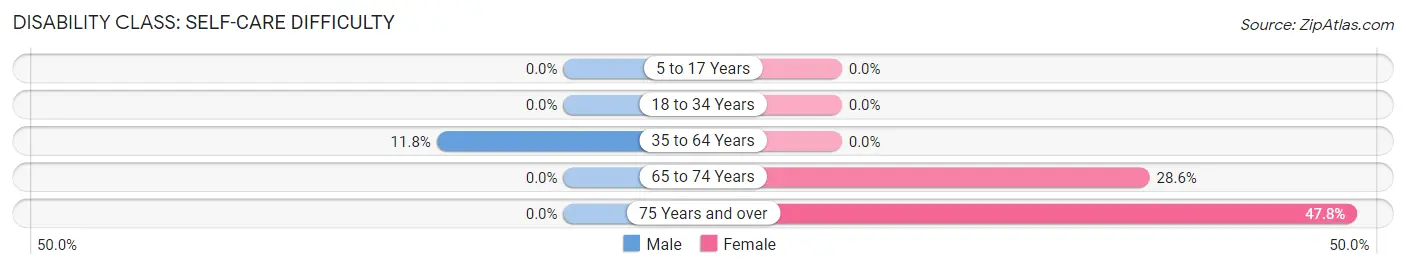
| Age Bracket | Male | Female |
| 5 to 17 Years | 0 (0.0%) | 0 (0.0%) |
| 18 to 34 Years | 0 (0.0%) | 0 (0.0%) |
| 35 to 64 Years | 2 (11.8%) | 0 (0.0%) |
| 65 to 74 Years | 0 (0.0%) | 2 (28.6%) |
| 75 Years and over | 0 (0.0%) | 11 (47.8%) |
Technology Access in Santa Claus
Computing Device Access in Santa Claus
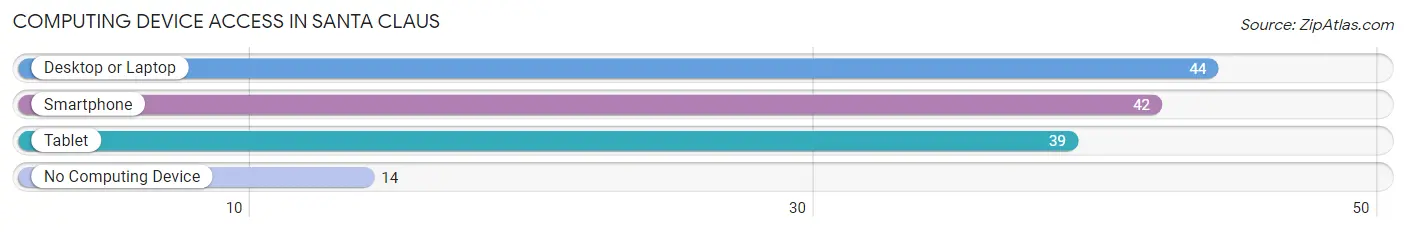
| Device Type | # Households | % Households |
| Desktop or Laptop | 44 | 63.8% |
| Smartphone | 42 | 60.9% |
| Tablet | 39 | 56.5% |
| No Computing Device | 14 | 20.3% |
| Total | 69 | 100.0% |
Internet Access in Santa Claus
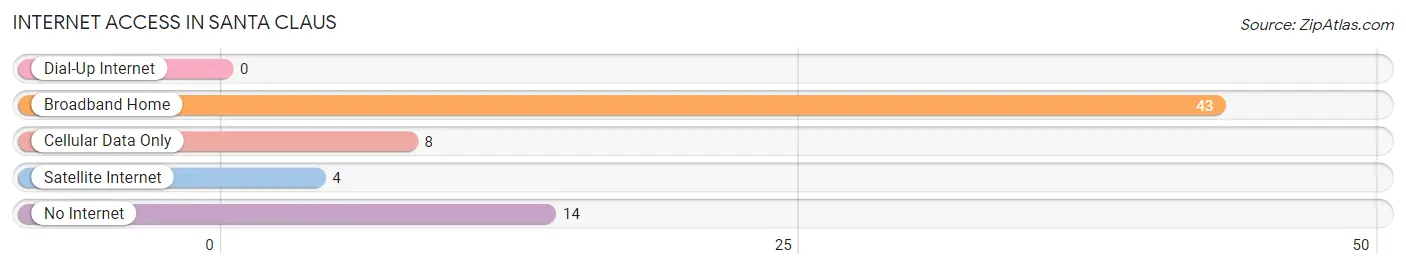
| Internet Type | # Households | % Households |
| Dial-Up Internet | 0 | 0.0% |
| Broadband Home | 43 | 62.3% |
| Cellular Data Only | 8 | 11.6% |
| Satellite Internet | 4 | 5.8% |
| No Internet | 14 | 20.3% |
| Total | 69 | 100.0% |
Santa Claus Summary
Santa Claus, Georgia is a small town located in Toombs County, Georgia. It is situated on the banks of the Ohoopee River, approximately 30 miles south of Vidalia and about 50 miles north of Savannah. The town was founded in 1856 and was named after the legendary figure of Santa Claus. The town has a population of approximately 500 people and is known for its rural charm and friendly atmosphere.
History
Santa Claus, Georgia was founded in 1856 by a group of settlers from South Carolina. The town was named after the legendary figure of Santa Claus, and the settlers hoped to bring a bit of Christmas cheer to the area. The town was originally a farming community, and the settlers grew cotton, corn, and other crops. The town was also home to a number of sawmills and gristmills, which provided lumber and grain for the local population.
In the late 19th century, the town began to grow and prosper. The railroad arrived in 1887, and the town was connected to the larger cities of Savannah and Vidalia. This allowed the town to become a trading center for the surrounding area. The town also became a popular tourist destination, as visitors came to enjoy the rural charm and friendly atmosphere.
Geography
Santa Claus, Georgia is located in Toombs County, Georgia. It is situated on the banks of the Ohoopee River, approximately 30 miles south of Vidalia and about 50 miles north of Savannah. The town is located in a rural area, and the surrounding landscape is mostly flat with rolling hills. The town is surrounded by forests and farmland, and the Ohoopee River provides a scenic backdrop.
Economy
The economy of Santa Claus, Georgia is largely based on agriculture and tourism. The town is home to a number of farms, which produce cotton, corn, and other crops. The town is also home to a number of sawmills and gristmills, which provide lumber and grain for the local population.
Tourism is also an important part of the local economy. The town is a popular destination for visitors who come to enjoy the rural charm and friendly atmosphere. The town is also home to a number of historic sites, including the Santa Claus Museum and the Santa Claus House.
Demographics
As of the 2010 census, the population of Santa Claus, Georgia was 498. The racial makeup of the town was 97.2% White, 0.6% African American, 0.2% Native American, 0.2% Asian, 0.2% from other races, and 1.8% from two or more races. The median household income was $30,000, and the median family income was $35,000. The per capita income was $14,000.
Conclusion
Santa Claus, Georgia is a small town located in Toombs County, Georgia. It is situated on the banks of the Ohoopee River, approximately 30 miles south of Vidalia and about 50 miles north of Savannah. The town was founded in 1856 and was named after the legendary figure of Santa Claus. The town has a population of approximately 500 people and is known for its rural charm and friendly atmosphere. The economy of Santa Claus, Georgia is largely based on agriculture and tourism. The town is home to a number of farms, which produce cotton, corn, and other crops. The town is also home to a number of sawmills and gristmills, which provide lumber and grain for the local population. Tourism is also an important part of the local economy. The town is a popular destination for visitors who come to enjoy the rural charm and friendly atmosphere. As of the 2010 census, the population of Santa Claus, Georgia was 498. The racial makeup of the town was 97.2% White, 0.6% African American, 0.2% Native American, 0.2% Asian, 0.2% from other races, and 1.8% from two or more races. The median household income was $30,000, and the median family income was $35,000. The per capita income was $14,000.
Common Questions
What is Per Capita Income in Santa Claus?
Per Capita income in Santa Claus is $31,535.
What is the Median Family Income in Santa Claus?
Median Family Income in Santa Claus is $70,833.
What is the Median Household income in Santa Claus?
Median Household Income in Santa Claus is $46,250.
What is Income or Wage Gap in Santa Claus?
Income or Wage Gap in Santa Claus is 38.7%.
Women in Santa Claus earn 61.3 cents for every dollar earned by a man.
What is Inequality or Gini Index in Santa Claus?
Inequality or Gini Index in Santa Claus is 0.46.
What is the Total Population of Santa Claus?
Total Population of Santa Claus is 146.
What is the Total Male Population of Santa Claus?
Total Male Population of Santa Claus is 66.
What is the Total Female Population of Santa Claus?
Total Female Population of Santa Claus is 80.
What is the Ratio of Males per 100 Females in Santa Claus?
There are 82.50 Males per 100 Females in Santa Claus.
What is the Ratio of Females per 100 Males in Santa Claus?
There are 121.21 Females per 100 Males in Santa Claus.
What is the Median Population Age in Santa Claus?
Median Population Age in Santa Claus is 47.5 Years.
What is the Average Family Size in Santa Claus
Average Family Size in Santa Claus is 2.8 People.
What is the Average Household Size in Santa Claus
Average Household Size in Santa Claus is 2.1 People.
How Large is the Labor Force in Santa Claus?
There are 61 People in the Labor Forcein in Santa Claus.
What is the Percentage of People in the Labor Force in Santa Claus?
53.0% of People are in the Labor Force in Santa Claus.
What is the Unemployment Rate in Santa Claus?
Unemployment Rate in Santa Claus is 3.3%.