Allenhurst, GA Map & Demographics
Allenhurst Map
Allenhurst Overview
$29,821
PER CAPITA INCOME
$59,250
AVG FAMILY INCOME
$51,667
AVG HOUSEHOLD INCOME
19.9%
WAGE / INCOME GAP [ % ]
80.1¢/ $1
WAGE / INCOME GAP [ $ ]
0.41
INEQUALITY / GINI INDEX
515
TOTAL POPULATION
263
MALE POPULATION
252
FEMALE POPULATION
104.37
MALES / 100 FEMALES
95.82
FEMALES / 100 MALES
39.8
MEDIAN AGE
2.7
AVG FAMILY SIZE
2.2
AVG HOUSEHOLD SIZE
261
LABOR FORCE [ PEOPLE ]
60.3%
PERCENT IN LABOR FORCE
5.9%
UNEMPLOYMENT RATE
Allenhurst Zip Codes
Allenhurst Area Codes
Income in Allenhurst
Income Overview in Allenhurst
Per Capita Income in Allenhurst is $29,821, while median incomes of families and households are $59,250 and $51,667 respectively.
| Characteristic | Number | Measure |
| Per Capita Income | 515 | $29,821 |
| Median Family Income | 155 | $59,250 |
| Mean Family Income | 155 | $72,065 |
| Median Household Income | 230 | $51,667 |
| Mean Household Income | 230 | $65,303 |
| Income Deficit | 155 | $0 |
| Wage / Income Gap (%) | 515 | 19.92% |
| Wage / Income Gap ($) | 515 | 80.08¢ per $1 |
| Gini / Inequality Index | 515 | 0.41 |
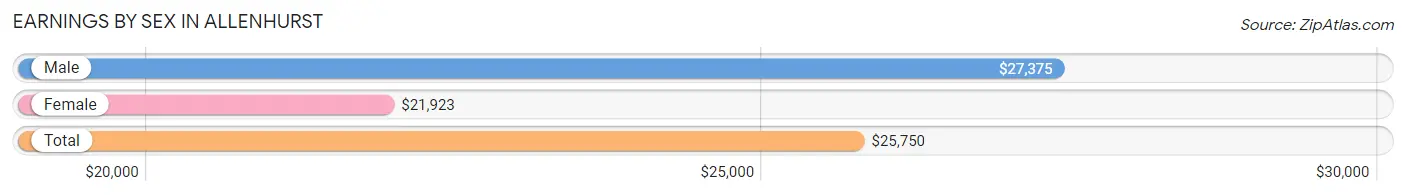
Earnings by Sex in Allenhurst
Average Earnings in Allenhurst are $25,750, $27,375 for men and $21,923 for women, a difference of 19.9%.
| Sex | Number | Average Earnings |
| Male | 148 (52.5%) | $27,375 |
| Female | 134 (47.5%) | $21,923 |
| Total | 282 (100.0%) | $25,750 |
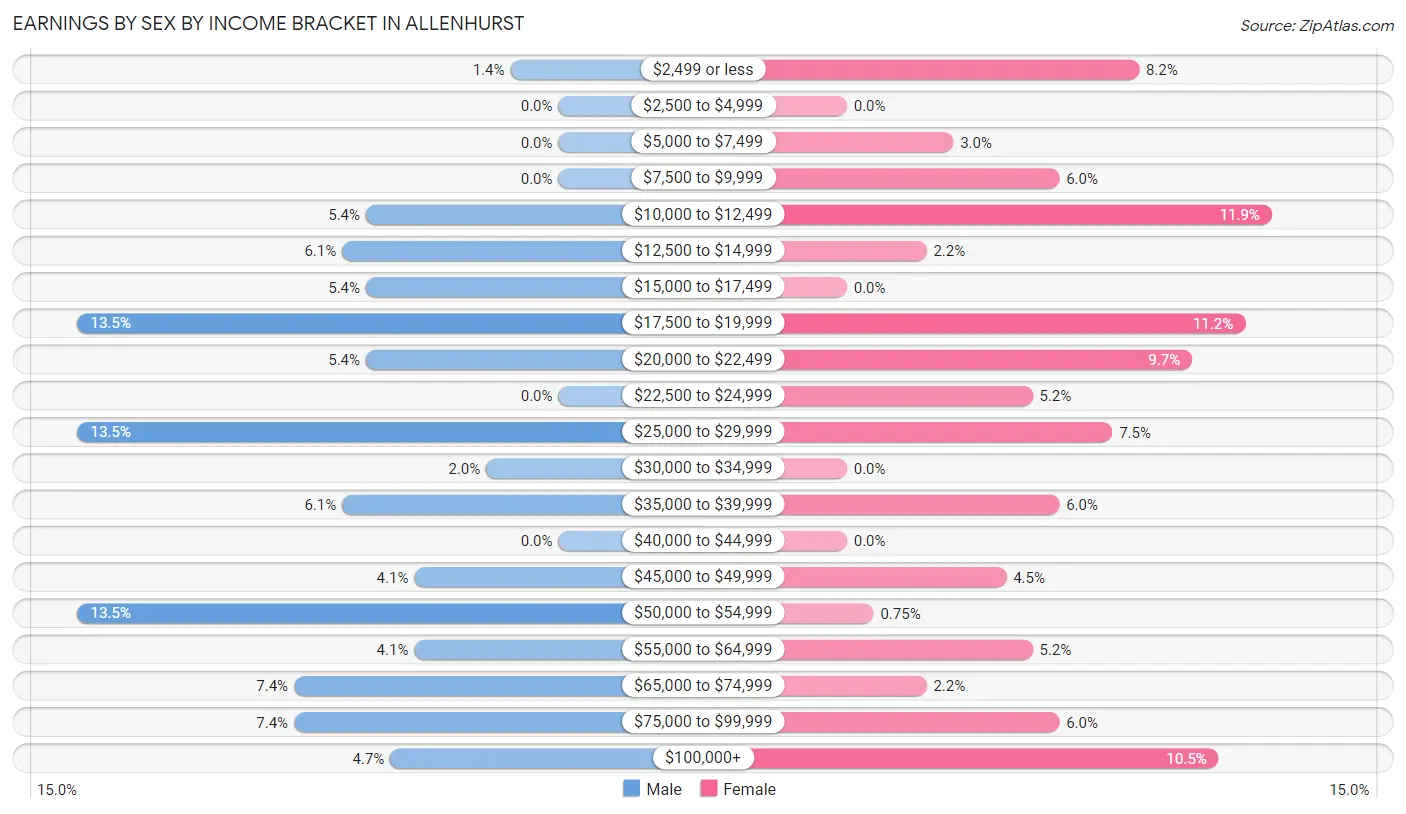
Earnings by Sex by Income Bracket in Allenhurst
The most common earnings brackets in Allenhurst are $17,500 to $19,999 for men (20 | 13.5%) and $10,000 to $12,499 for women (16 | 11.9%).
| Income | Male | Female |
| $2,499 or less | 2 (1.3%) | 11 (8.2%) |
| $2,500 to $4,999 | 0 (0.0%) | 0 (0.0%) |
| $5,000 to $7,499 | 0 (0.0%) | 4 (3.0%) |
| $7,500 to $9,999 | 0 (0.0%) | 8 (6.0%) |
| $10,000 to $12,499 | 8 (5.4%) | 16 (11.9%) |
| $12,500 to $14,999 | 9 (6.1%) | 3 (2.2%) |
| $15,000 to $17,499 | 8 (5.4%) | 0 (0.0%) |
| $17,500 to $19,999 | 20 (13.5%) | 15 (11.2%) |
| $20,000 to $22,499 | 8 (5.4%) | 13 (9.7%) |
| $22,500 to $24,999 | 0 (0.0%) | 7 (5.2%) |
| $25,000 to $29,999 | 20 (13.5%) | 10 (7.5%) |
| $30,000 to $34,999 | 3 (2.0%) | 0 (0.0%) |
| $35,000 to $39,999 | 9 (6.1%) | 8 (6.0%) |
| $40,000 to $44,999 | 0 (0.0%) | 0 (0.0%) |
| $45,000 to $49,999 | 6 (4.1%) | 6 (4.5%) |
| $50,000 to $54,999 | 20 (13.5%) | 1 (0.7%) |
| $55,000 to $64,999 | 6 (4.1%) | 7 (5.2%) |
| $65,000 to $74,999 | 11 (7.4%) | 3 (2.2%) |
| $75,000 to $99,999 | 11 (7.4%) | 8 (6.0%) |
| $100,000+ | 7 (4.7%) | 14 (10.4%) |
| Total | 148 (100.0%) | 134 (100.0%) |
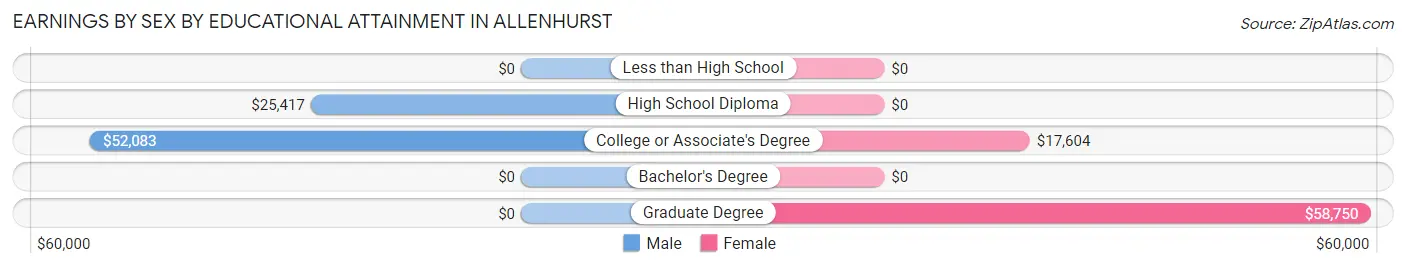
Earnings by Sex by Educational Attainment in Allenhurst
Average earnings in Allenhurst are $39,643 for men and $21,094 for women, a difference of 46.8%. Men with an educational attainment of college or associate's degree enjoy the highest average annual earnings of $52,083, while those with high school diploma education earn the least with $25,417. Women with an educational attainment of graduate degree earn the most with the average annual earnings of $58,750, while those with college or associate's degree education have the smallest earnings of $17,604.
| Educational Attainment | Male Income | Female Income |
| Less than High School | - | - |
| High School Diploma | $25,417 | $0 |
| College or Associate's Degree | $52,083 | $17,604 |
| Bachelor's Degree | - | - |
| Graduate Degree | - | - |
| Total | $39,643 | $21,094 |
Family Income in Allenhurst
Family Income Brackets in Allenhurst
According to the Allenhurst family income data, there are 36 families falling into the $100,000 to $149,999 income range, which is the most common income bracket and makes up 23.2% of all families.
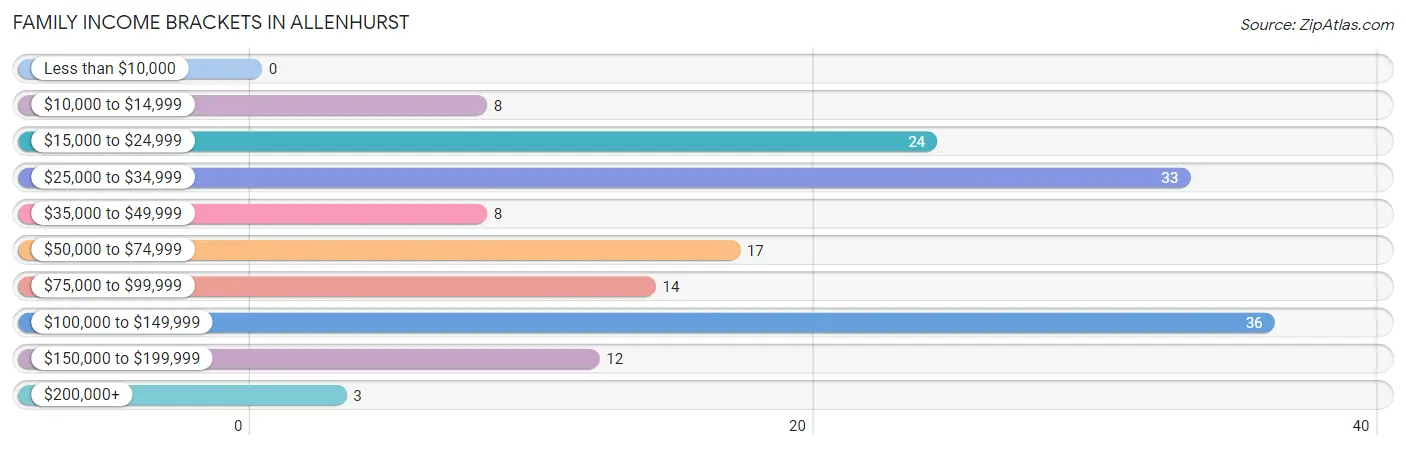
| Income Bracket | # Families | % Families |
| Less than $10,000 | 0 | 0.0% |
| $10,000 to $14,999 | 8 | 5.2% |
| $15,000 to $24,999 | 24 | 15.5% |
| $25,000 to $34,999 | 33 | 21.3% |
| $35,000 to $49,999 | 8 | 5.2% |
| $50,000 to $74,999 | 17 | 11.0% |
| $75,000 to $99,999 | 14 | 9.0% |
| $100,000 to $149,999 | 36 | 23.2% |
| $150,000 to $199,999 | 12 | 7.7% |
| $200,000+ | 3 | 1.9% |
Family Income by Famaliy Size in Allenhurst
2-person families (94 | 60.7%) account for the highest median family income in Allenhurst with $82,500 per family, while 2-person families (94 | 60.7%) have the highest median income of $41,250 per family member.
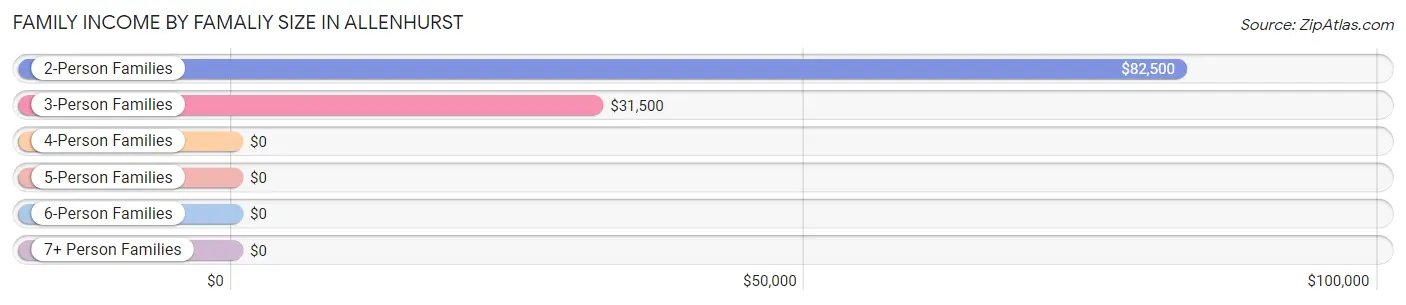
| Income Bracket | # Families | Median Income |
| 2-Person Families | 94 (60.7%) | $82,500 |
| 3-Person Families | 40 (25.8%) | $31,500 |
| 4-Person Families | 19 (12.3%) | $0 |
| 5-Person Families | 2 (1.3%) | $0 |
| 6-Person Families | 0 (0.0%) | $0 |
| 7+ Person Families | 0 (0.0%) | $0 |
| Total | 155 (100.0%) | $59,250 |
Family Income by Number of Earners in Allenhurst
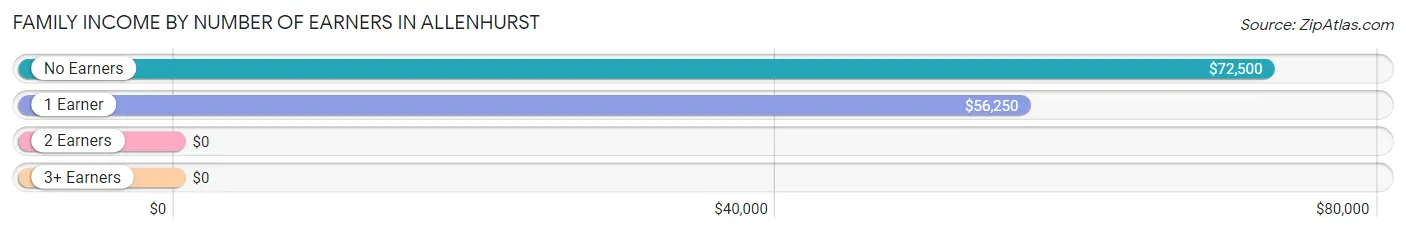
| Number of Earners | # Families | Median Income |
| No Earners | 18 (11.6%) | $72,500 |
| 1 Earner | 80 (51.6%) | $56,250 |
| 2 Earners | 51 (32.9%) | $0 |
| 3+ Earners | 6 (3.9%) | $0 |
| Total | 155 (100.0%) | $59,250 |
Household Income in Allenhurst
Household Income Brackets in Allenhurst
With 50 households falling in the category, the $100,000 to $149,999 income range is the most frequent in Allenhurst, accounting for 21.7% of all households. In contrast, only 3 households (1.3%) fall into the $200,000+ income bracket, making it the least populous group.
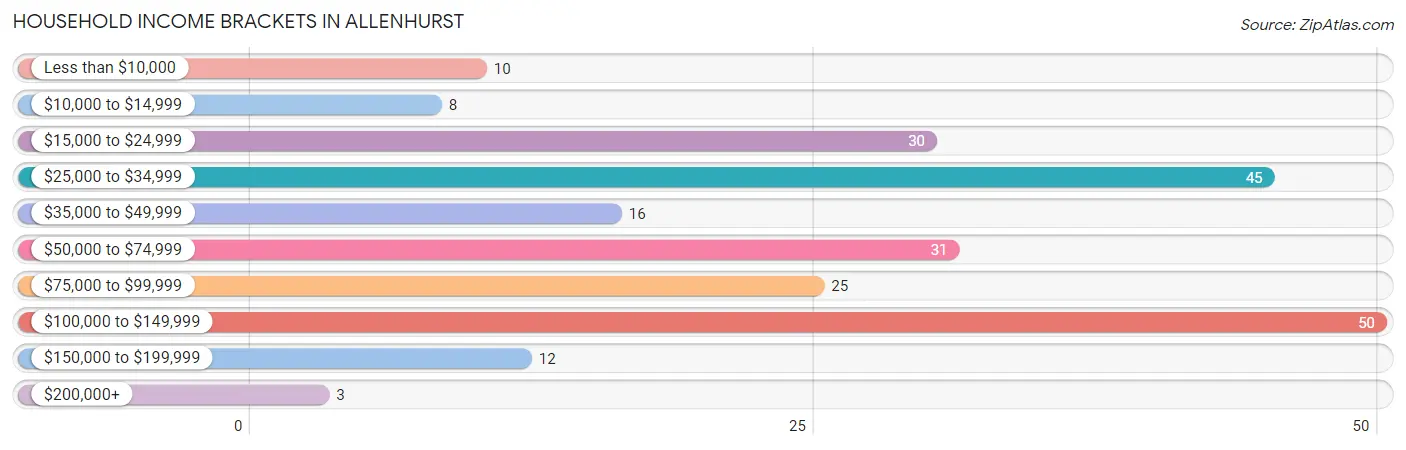
| Income Bracket | # Households | % Households |
| Less than $10,000 | 10 | 4.3% |
| $10,000 to $14,999 | 8 | 3.5% |
| $15,000 to $24,999 | 30 | 13.0% |
| $25,000 to $34,999 | 45 | 19.6% |
| $35,000 to $49,999 | 16 | 7.0% |
| $50,000 to $74,999 | 31 | 13.5% |
| $75,000 to $99,999 | 25 | 10.9% |
| $100,000 to $149,999 | 50 | 21.7% |
| $150,000 to $199,999 | 12 | 5.2% |
| $200,000+ | 3 | 1.3% |
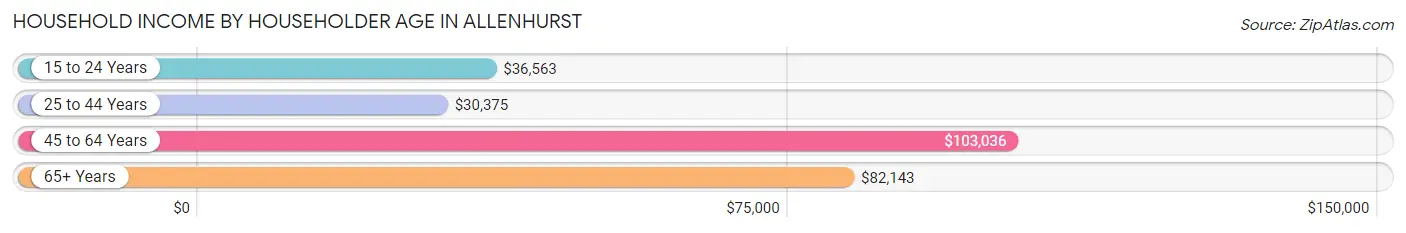
Household Income by Householder Age in Allenhurst
The median household income in Allenhurst is $51,667, with the highest median household income of $103,036 found in the 45 to 64 years age bracket for the primary householder. A total of 100 households (43.5%) fall into this category. Meanwhile, the 25 to 44 years age bracket for the primary householder has the lowest median household income of $30,375, with 70 households (30.4%) in this group.
| Income Bracket | # Households | Median Income |
| 15 to 24 Years | 18 (7.8%) | $36,563 |
| 25 to 44 Years | 70 (30.4%) | $30,375 |
| 45 to 64 Years | 100 (43.5%) | $103,036 |
| 65+ Years | 42 (18.3%) | $82,143 |
| Total | 230 (100.0%) | $51,667 |
Poverty in Allenhurst
Income Below Poverty by Sex and Age in Allenhurst
With 18.2% poverty level for males and 19.1% for females among the residents of Allenhurst, 12 to 14 year old males and 15 year old females are the most vulnerable to poverty, with 6 males (100.0%) and 3 females (100.0%) in their respective age groups living below the poverty level.
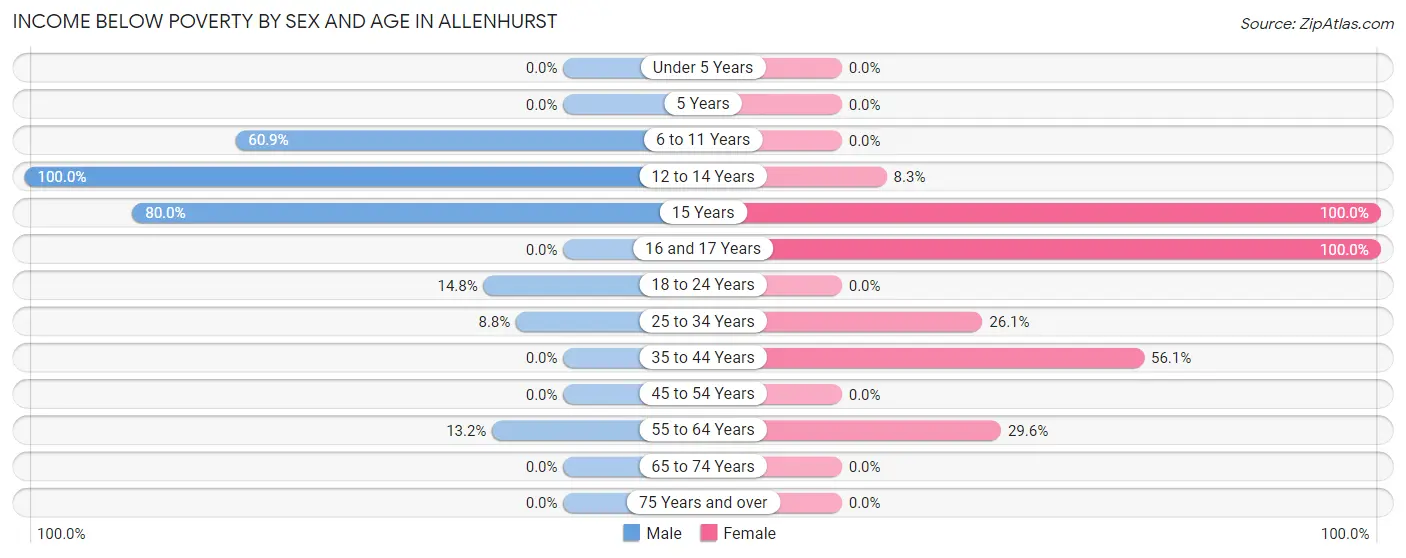
| Age Bracket | Male | Female |
| Under 5 Years | 0 (0.0%) | 0 (0.0%) |
| 5 Years | 0 (0.0%) | 0 (0.0%) |
| 6 to 11 Years | 14 (60.9%) | 0 (0.0%) |
| 12 to 14 Years | 6 (100.0%) | 1 (8.3%) |
| 15 Years | 12 (80.0%) | 3 (100.0%) |
| 16 and 17 Years | 0 (0.0%) | 2 (100.0%) |
| 18 to 24 Years | 4 (14.8%) | 0 (0.0%) |
| 25 to 34 Years | 5 (8.8%) | 6 (26.1%) |
| 35 to 44 Years | 0 (0.0%) | 23 (56.1%) |
| 45 to 54 Years | 0 (0.0%) | 0 (0.0%) |
| 55 to 64 Years | 7 (13.2%) | 13 (29.5%) |
| 65 to 74 Years | 0 (0.0%) | 0 (0.0%) |
| 75 Years and over | 0 (0.0%) | 0 (0.0%) |
| Total | 48 (18.2%) | 48 (19.1%) |
Income Above Poverty by Sex and Age in Allenhurst
According to the poverty statistics in Allenhurst, males aged under 5 years and females aged under 5 years are the age groups that are most secure financially, with 100.0% of males and 100.0% of females in these age groups living above the poverty line.
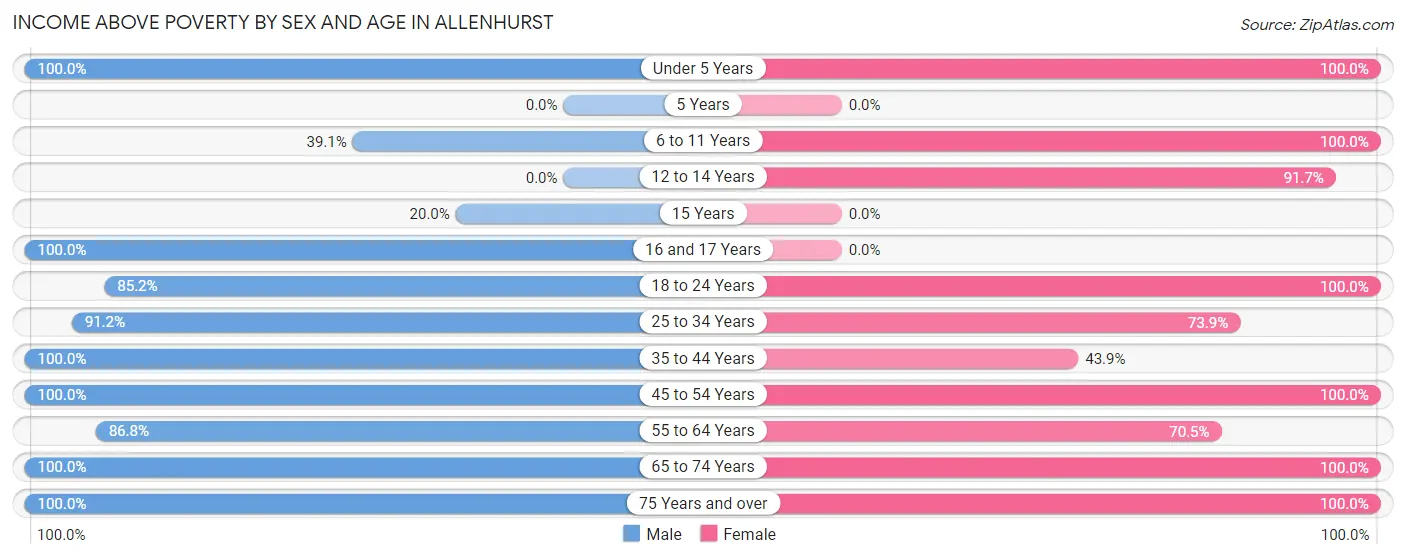
| Age Bracket | Male | Female |
| Under 5 Years | 7 (100.0%) | 5 (100.0%) |
| 5 Years | 0 (0.0%) | 0 (0.0%) |
| 6 to 11 Years | 9 (39.1%) | 11 (100.0%) |
| 12 to 14 Years | 0 (0.0%) | 11 (91.7%) |
| 15 Years | 3 (20.0%) | 0 (0.0%) |
| 16 and 17 Years | 11 (100.0%) | 0 (0.0%) |
| 18 to 24 Years | 23 (85.2%) | 25 (100.0%) |
| 25 to 34 Years | 52 (91.2%) | 17 (73.9%) |
| 35 to 44 Years | 21 (100.0%) | 18 (43.9%) |
| 45 to 54 Years | 20 (100.0%) | 51 (100.0%) |
| 55 to 64 Years | 46 (86.8%) | 31 (70.5%) |
| 65 to 74 Years | 21 (100.0%) | 28 (100.0%) |
| 75 Years and over | 2 (100.0%) | 7 (100.0%) |
| Total | 215 (81.8%) | 204 (80.9%) |
Income Below Poverty Among Married-Couple Families in Allenhurst
The poverty statistics for married-couple families in Allenhurst show that 2.4% or 2 of the total 84 families live below the poverty line. Families with no children have the highest poverty rate of 2.9%, comprising of 2 families. On the other hand, families with 1 or 2 children have the lowest poverty rate of 0.0%, which includes 0 families.
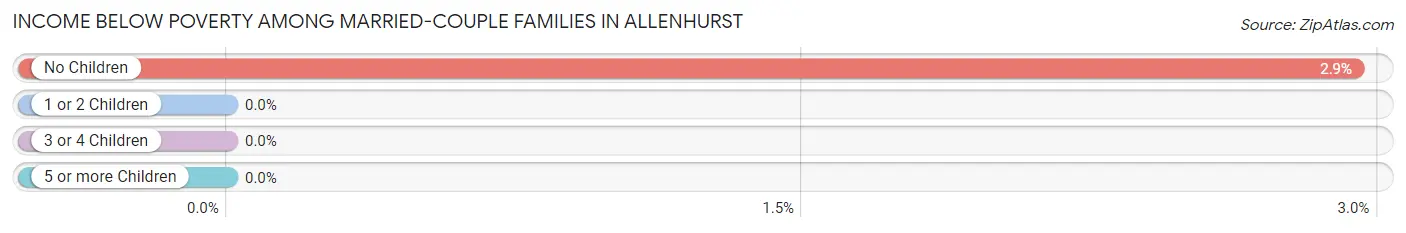
| Children | Above Poverty | Below Poverty |
| No Children | 66 (97.1%) | 2 (2.9%) |
| 1 or 2 Children | 16 (100.0%) | 0 (0.0%) |
| 3 or 4 Children | 0 (0.0%) | 0 (0.0%) |
| 5 or more Children | 0 (0.0%) | 0 (0.0%) |
| Total | 82 (97.6%) | 2 (2.4%) |
Income Below Poverty Among Single-Parent Households in Allenhurst
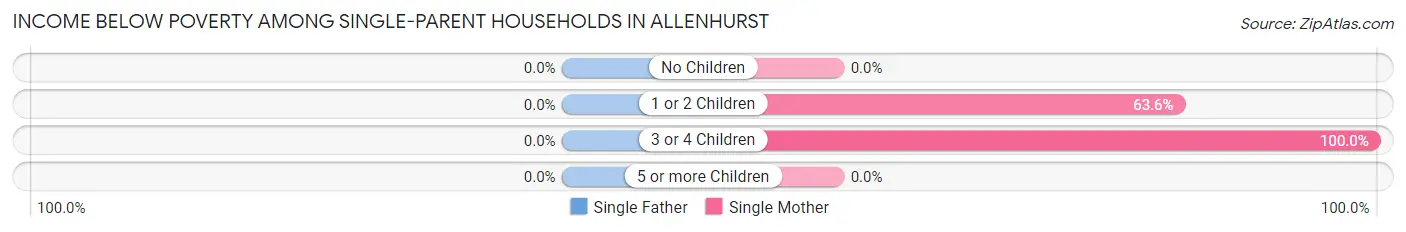
| Children | Single Father | Single Mother |
| No Children | 0 (0.0%) | 0 (0.0%) |
| 1 or 2 Children | 0 (0.0%) | 14 (63.6%) |
| 3 or 4 Children | 0 (0.0%) | 3 (100.0%) |
| 5 or more Children | 0 (0.0%) | 0 (0.0%) |
| Total | 0 (0.0%) | 17 (44.7%) |
Income Below Poverty Among Married-Couple vs Single-Parent Households in Allenhurst
The poverty data for Allenhurst shows that 2 of the married-couple family households (2.4%) and 17 of the single-parent households (23.9%) are living below the poverty level. Within the married-couple family households, those with no children have the highest poverty rate, with 2 households (2.9%) falling below the poverty line. Among the single-parent households, those with 3 or 4 children have the highest poverty rate, with 3 household (100.0%) living below poverty.
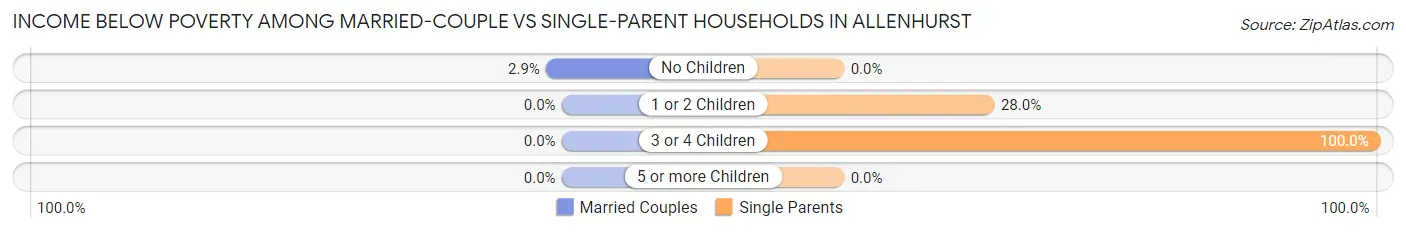
| Children | Married-Couple Families | Single-Parent Households |
| No Children | 2 (2.9%) | 0 (0.0%) |
| 1 or 2 Children | 0 (0.0%) | 14 (28.0%) |
| 3 or 4 Children | 0 (0.0%) | 3 (100.0%) |
| 5 or more Children | 0 (0.0%) | 0 (0.0%) |
| Total | 2 (2.4%) | 17 (23.9%) |
Race in Allenhurst
The most populous races in Allenhurst are Black / African American (260 | 50.5%), White / Caucasian (173 | 33.6%), and Two or more Races (74 | 14.4%).
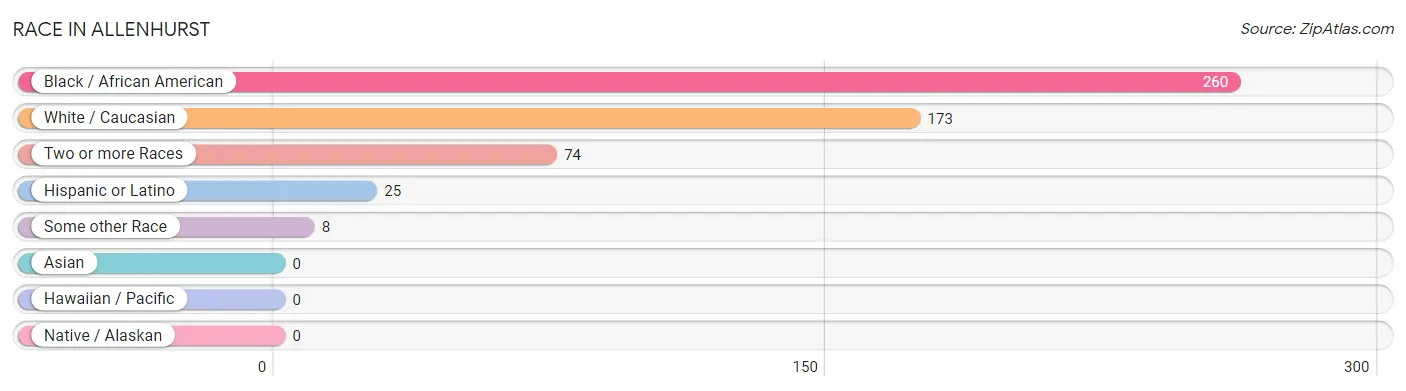
| Race | # Population | % Population |
| Asian | 0 | 0.0% |
| Black / African American | 260 | 50.5% |
| Hawaiian / Pacific | 0 | 0.0% |
| Hispanic or Latino | 25 | 4.9% |
| Native / Alaskan | 0 | 0.0% |
| White / Caucasian | 173 | 33.6% |
| Two or more Races | 74 | 14.4% |
| Some other Race | 8 | 1.5% |
| Total | 515 | 100.0% |
Ancestry in Allenhurst
The most populous ancestries reported in Allenhurst are German (106 | 20.6%), Irish (57 | 11.1%), Jamaican (25 | 4.9%), American (22 | 4.3%), and Puerto Rican (22 | 4.3%), together accounting for 45.0% of all Allenhurst residents.
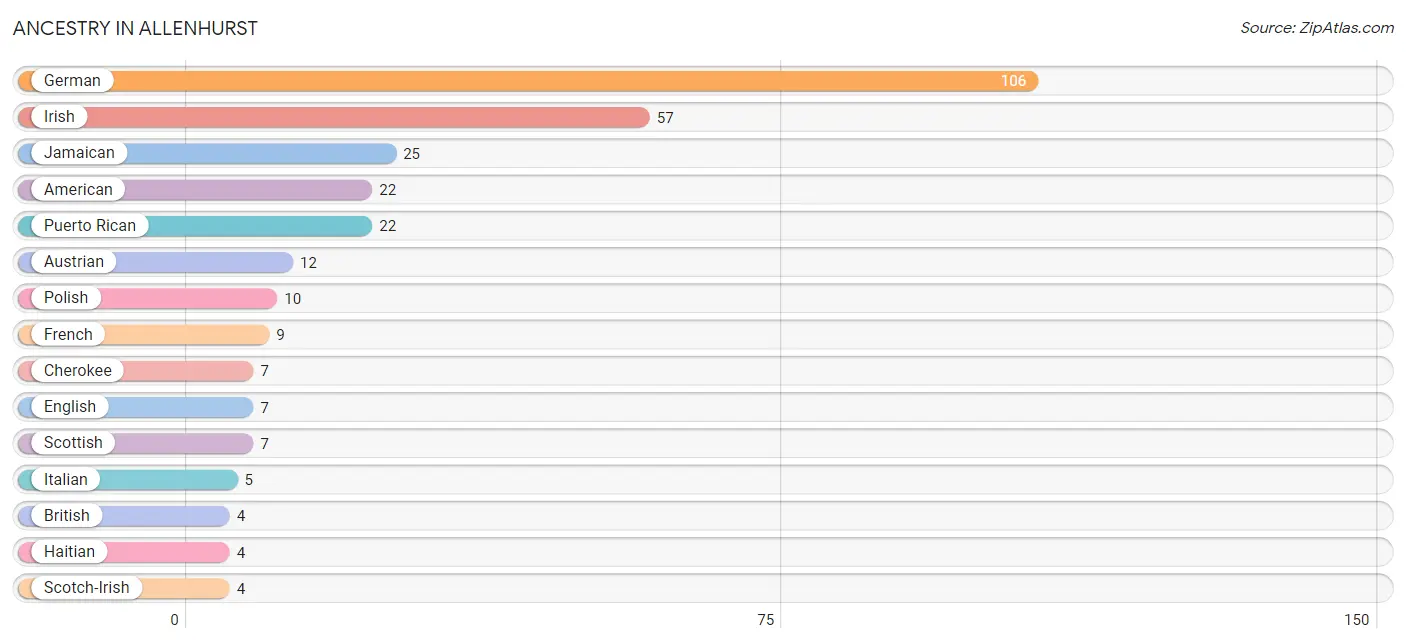
| Ancestry | # Population | % Population |
| American | 22 | 4.3% |
| Austrian | 12 | 2.3% |
| British | 4 | 0.8% |
| Cherokee | 7 | 1.4% |
| English | 7 | 1.4% |
| European | 3 | 0.6% |
| French | 9 | 1.8% |
| German | 106 | 20.6% |
| Haitian | 4 | 0.8% |
| Irish | 57 | 11.1% |
| Italian | 5 | 1.0% |
| Jamaican | 25 | 4.9% |
| Mexican | 3 | 0.6% |
| Polish | 10 | 1.9% |
| Puerto Rican | 22 | 4.3% |
| Scotch-Irish | 4 | 0.8% |
| Scottish | 7 | 1.4% |
| Swiss | 3 | 0.6% | View All 18 Rows |
Immigrants in Allenhurst
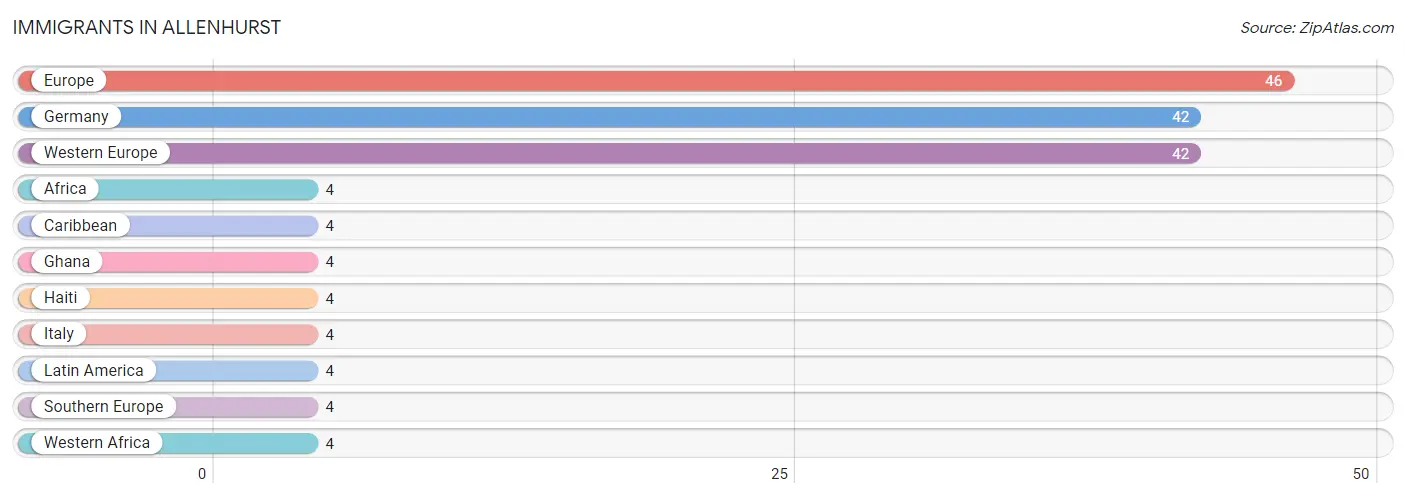
The most numerous immigrant groups reported in Allenhurst came from Europe (46 | 8.9%), Germany (42 | 8.2%), Western Europe (42 | 8.2%), Africa (4 | 0.8%), and Caribbean (4 | 0.8%), together accounting for 26.8% of all Allenhurst residents.
| Immigration Origin | # Population | % Population |
| Africa | 4 | 0.8% |
| Caribbean | 4 | 0.8% |
| Europe | 46 | 8.9% |
| Germany | 42 | 8.2% |
| Ghana | 4 | 0.8% |
| Haiti | 4 | 0.8% |
| Italy | 4 | 0.8% |
| Latin America | 4 | 0.8% |
| Southern Europe | 4 | 0.8% |
| Western Africa | 4 | 0.8% |
| Western Europe | 42 | 8.2% | View All 11 Rows |
Sex and Age in Allenhurst
Sex and Age in Allenhurst
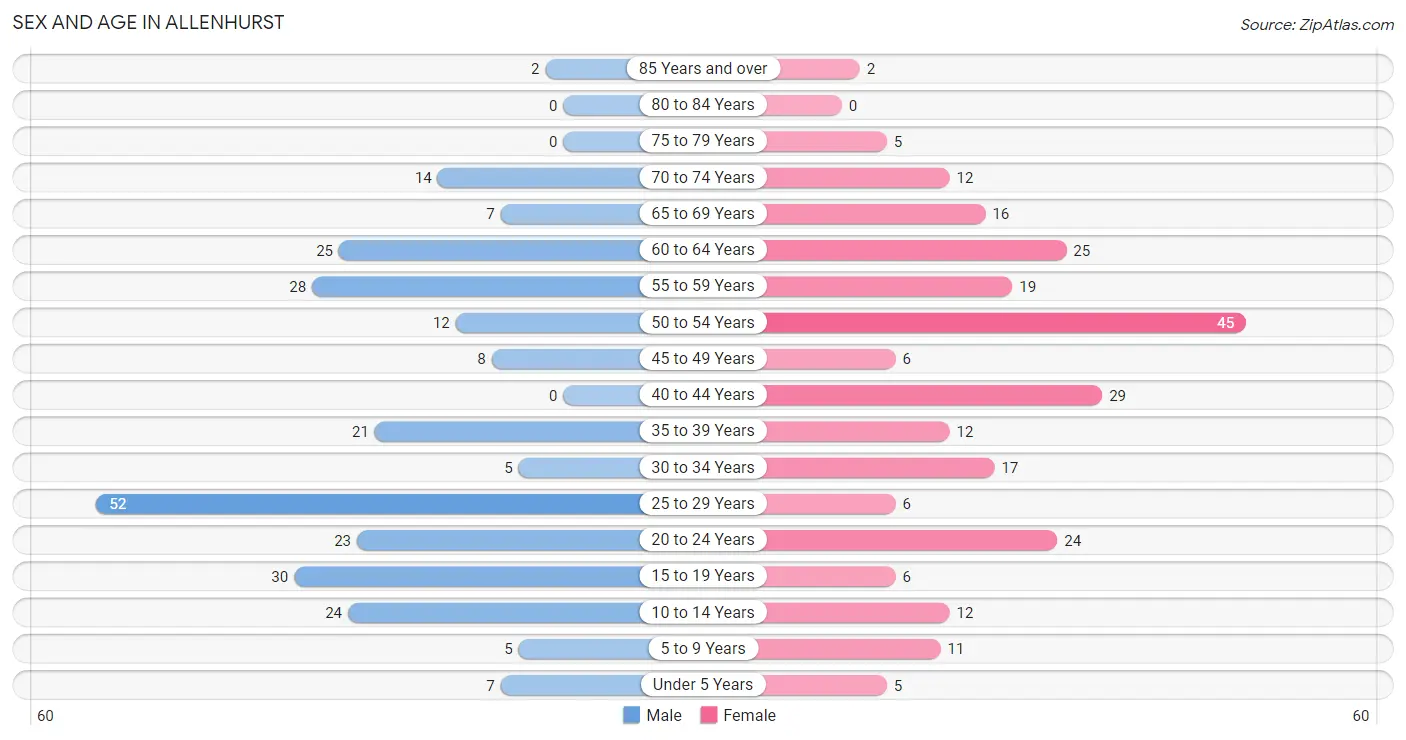
The most populous age groups in Allenhurst are 25 to 29 Years (52 | 19.8%) for men and 50 to 54 Years (45 | 17.9%) for women.
| Age Bracket | Male | Female |
| Under 5 Years | 7 (2.7%) | 5 (2.0%) |
| 5 to 9 Years | 5 (1.9%) | 11 (4.4%) |
| 10 to 14 Years | 24 (9.1%) | 12 (4.8%) |
| 15 to 19 Years | 30 (11.4%) | 6 (2.4%) |
| 20 to 24 Years | 23 (8.7%) | 24 (9.5%) |
| 25 to 29 Years | 52 (19.8%) | 6 (2.4%) |
| 30 to 34 Years | 5 (1.9%) | 17 (6.8%) |
| 35 to 39 Years | 21 (8.0%) | 12 (4.8%) |
| 40 to 44 Years | 0 (0.0%) | 29 (11.5%) |
| 45 to 49 Years | 8 (3.0%) | 6 (2.4%) |
| 50 to 54 Years | 12 (4.6%) | 45 (17.9%) |
| 55 to 59 Years | 28 (10.6%) | 19 (7.5%) |
| 60 to 64 Years | 25 (9.5%) | 25 (9.9%) |
| 65 to 69 Years | 7 (2.7%) | 16 (6.4%) |
| 70 to 74 Years | 14 (5.3%) | 12 (4.8%) |
| 75 to 79 Years | 0 (0.0%) | 5 (2.0%) |
| 80 to 84 Years | 0 (0.0%) | 0 (0.0%) |
| 85 Years and over | 2 (0.8%) | 2 (0.8%) |
| Total | 263 (100.0%) | 252 (100.0%) |
Families and Households in Allenhurst
Median Family Size in Allenhurst
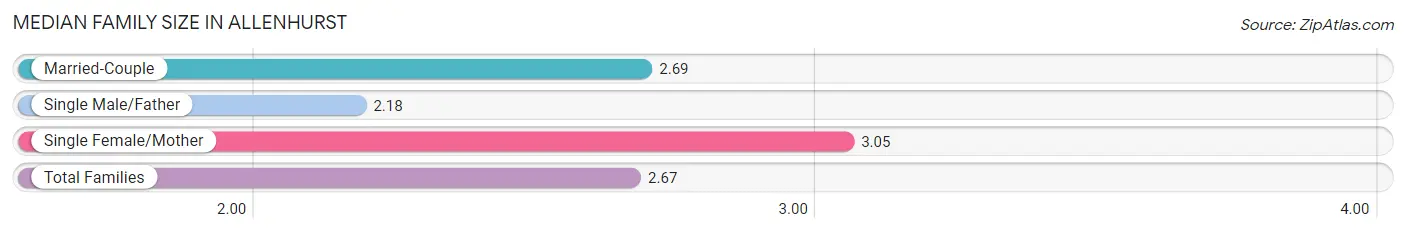
The median family size in Allenhurst is 2.67 persons per family, with single female/mother families (38 | 24.5%) accounting for the largest median family size of 3.05 persons per family. On the other hand, single male/father families (33 | 21.3%) represent the smallest median family size with 2.18 persons per family.
| Family Type | # Families | Family Size |
| Married-Couple | 84 (54.2%) | 2.69 |
| Single Male/Father | 33 (21.3%) | 2.18 |
| Single Female/Mother | 38 (24.5%) | 3.05 |
| Total Families | 155 (100.0%) | 2.67 |
Median Household Size in Allenhurst
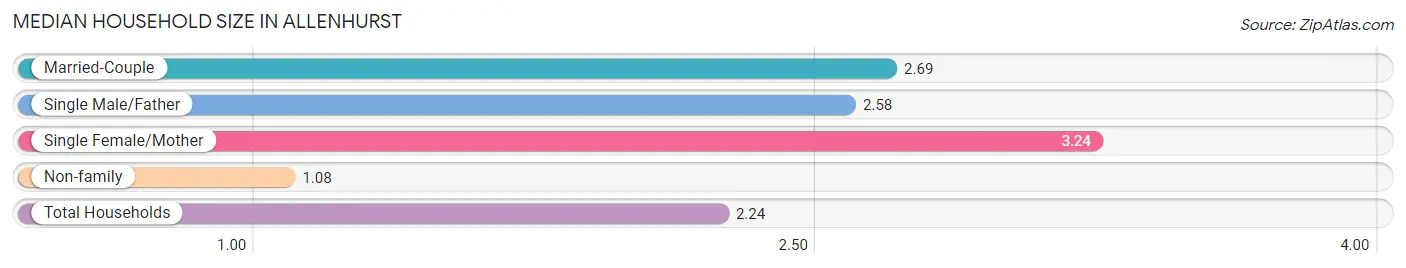
The median household size in Allenhurst is 2.24 persons per household, with single female/mother households (38 | 16.5%) accounting for the largest median household size of 3.24 persons per household. non-family households (75 | 32.6%) represent the smallest median household size with 1.08 persons per household.
| Household Type | # Households | Household Size |
| Married-Couple | 84 (36.5%) | 2.69 |
| Single Male/Father | 33 (14.3%) | 2.58 |
| Single Female/Mother | 38 (16.5%) | 3.24 |
| Non-family | 75 (32.6%) | 1.08 |
| Total Households | 230 (100.0%) | 2.24 |
Household Size by Marriage Status in Allenhurst
Out of a total of 230 households in Allenhurst, 155 (67.4%) are family households, while 75 (32.6%) are nonfamily households. The most numerous type of family households are 2-person households, comprising 79, and the most common type of nonfamily households are 1-person households, comprising 71.
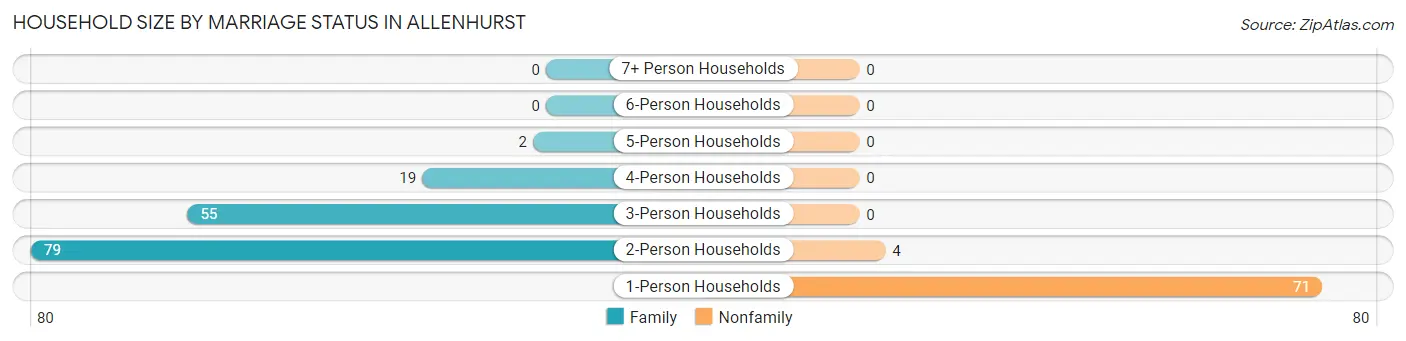
| Household Size | Family Households | Nonfamily Households |
| 1-Person Households | - | 71 (30.9%) |
| 2-Person Households | 79 (34.4%) | 4 (1.7%) |
| 3-Person Households | 55 (23.9%) | 0 (0.0%) |
| 4-Person Households | 19 (8.3%) | 0 (0.0%) |
| 5-Person Households | 2 (0.9%) | 0 (0.0%) |
| 6-Person Households | 0 (0.0%) | 0 (0.0%) |
| 7+ Person Households | 0 (0.0%) | 0 (0.0%) |
| Total | 155 (67.4%) | 75 (32.6%) |
Female Fertility in Allenhurst
Fertility by Age in Allenhurst
Average fertility rate in Allenhurst is 46.0 births per 1,000 women. Women in the age bracket of 20 to 34 years have the highest fertility rate with 106.0 births per 1,000 women. Women in the age bracket of 20 to 34 years acount for 100.0% of all women with births.
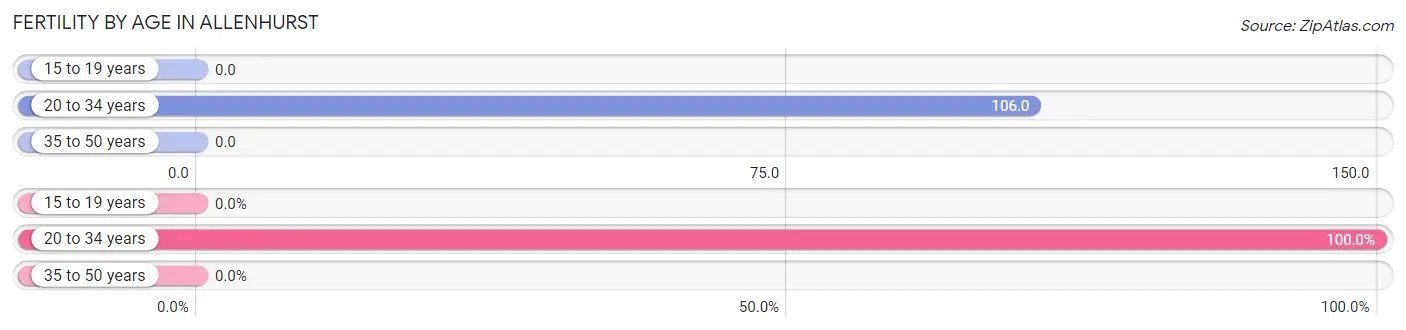
| Age Bracket | Women with Births | Births / 1,000 Women |
| 15 to 19 years | 0 (0.0%) | 0.0 |
| 20 to 34 years | 5 (100.0%) | 106.0 |
| 35 to 50 years | 0 (0.0%) | 0.0 |
| Total | 5 (100.0%) | 46.0 |
Fertility by Age by Marriage Status in Allenhurst
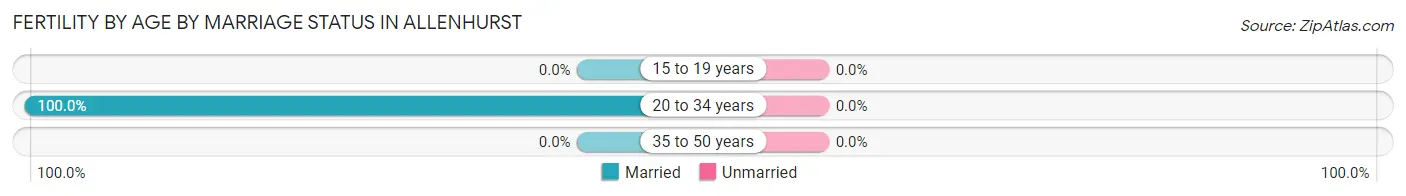
| Age Bracket | Married | Unmarried |
| 15 to 19 years | 0 (0.0%) | 0 (0.0%) |
| 20 to 34 years | 5 (100.0%) | 0 (0.0%) |
| 35 to 50 years | 0 (0.0%) | 0 (0.0%) |
| Total | 5 (100.0%) | 0 (0.0%) |
Fertility by Education in Allenhurst
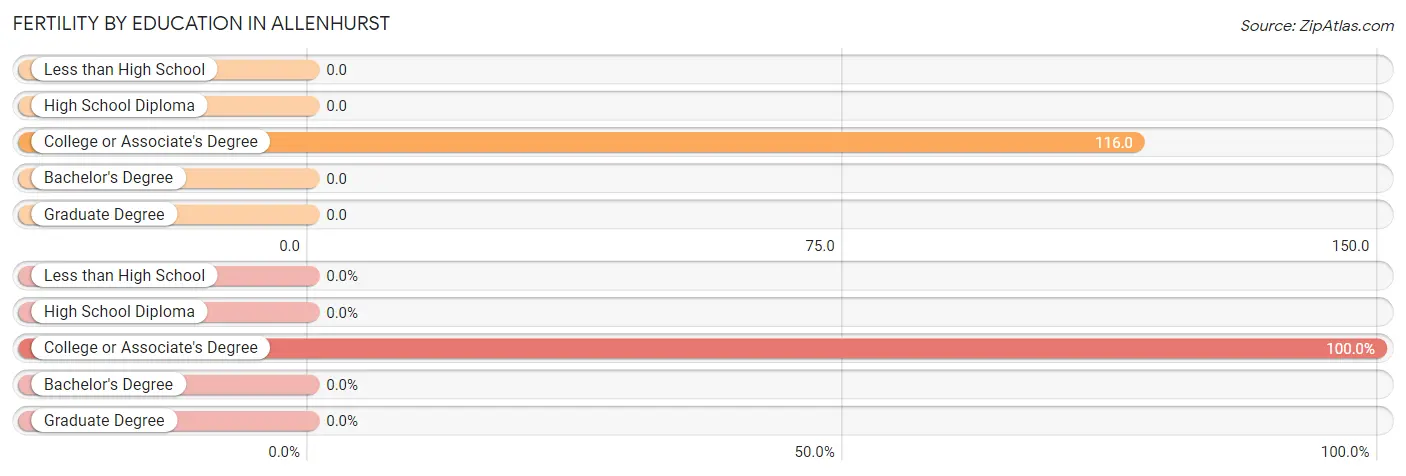
| Educational Attainment | Women with Births | Births / 1,000 Women |
| Less than High School | 0 (0.0%) | 0.0 |
| High School Diploma | 0 (0.0%) | 0.0 |
| College or Associate's Degree | 5 (100.0%) | 116.0 |
| Bachelor's Degree | 0 (0.0%) | 0.0 |
| Graduate Degree | 0 (0.0%) | 0.0 |
| Total | 5 (100.0%) | 46.0 |
Fertility by Education by Marriage Status in Allenhurst
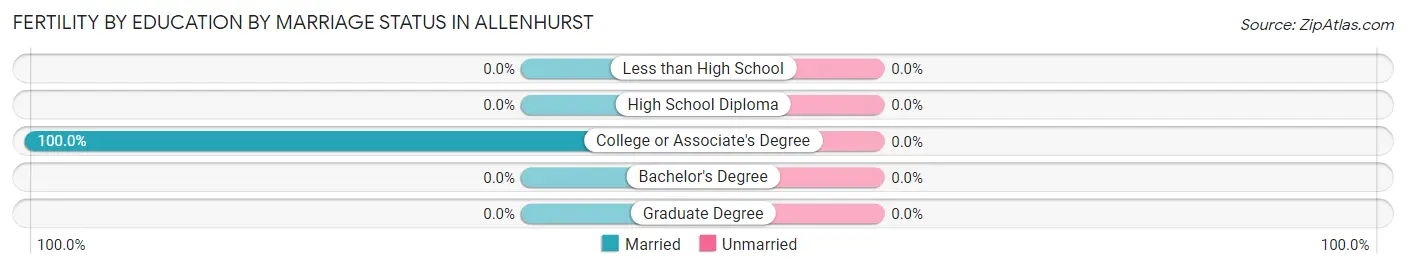
| Educational Attainment | Married | Unmarried |
| Less than High School | 0 (0.0%) | 0 (0.0%) |
| High School Diploma | 0 (0.0%) | 0 (0.0%) |
| College or Associate's Degree | 5 (100.0%) | 0 (0.0%) |
| Bachelor's Degree | 0 (0.0%) | 0 (0.0%) |
| Graduate Degree | 0 (0.0%) | 0 (0.0%) |
| Total | 5 (100.0%) | 0 (0.0%) |
Employment Characteristics in Allenhurst
Employment by Class of Employer in Allenhurst
Among the 227 employed individuals in Allenhurst, private company employees (130 | 57.3%), state government employees (31 | 13.7%), and local government employees (26 | 11.5%) make up the most common classes of employment.
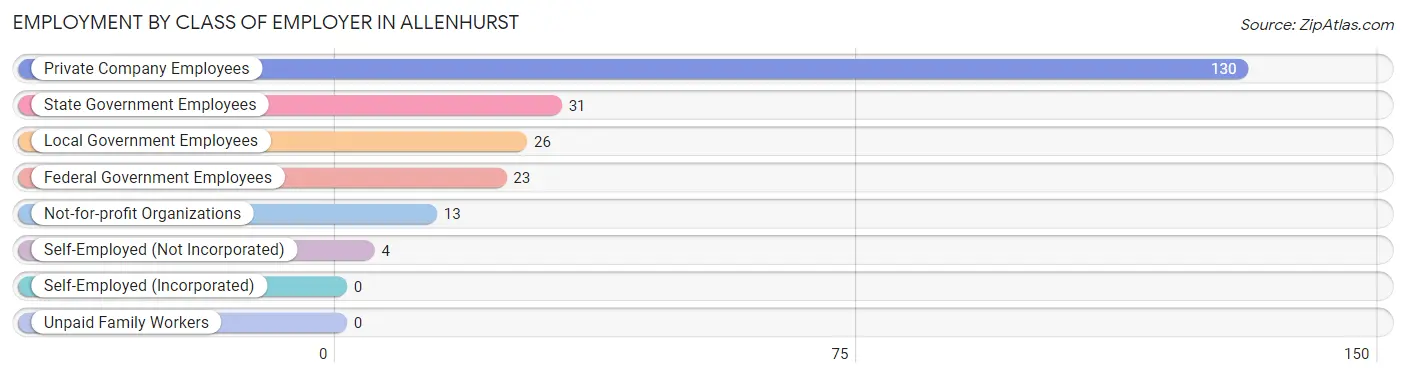
| Employer Class | # Employees | % Employees |
| Private Company Employees | 130 | 57.3% |
| Self-Employed (Incorporated) | 0 | 0.0% |
| Self-Employed (Not Incorporated) | 4 | 1.8% |
| Not-for-profit Organizations | 13 | 5.7% |
| Local Government Employees | 26 | 11.5% |
| State Government Employees | 31 | 13.7% |
| Federal Government Employees | 23 | 10.1% |
| Unpaid Family Workers | 0 | 0.0% |
| Total | 227 | 100.0% |
Employment Status by Age in Allenhurst
According to the labor force statistics for Allenhurst, out of the total population over 16 years of age (433), 60.3% or 261 individuals are in the labor force, with 5.9% or 15 of them unemployed. The age group with the highest labor force participation rate is 30 to 34 years, with 100.0% or 22 individuals in the labor force. Within the labor force, the 30 to 34 years age range has the highest percentage of unemployed individuals, with 68.2% or 15 of them being unemployed.
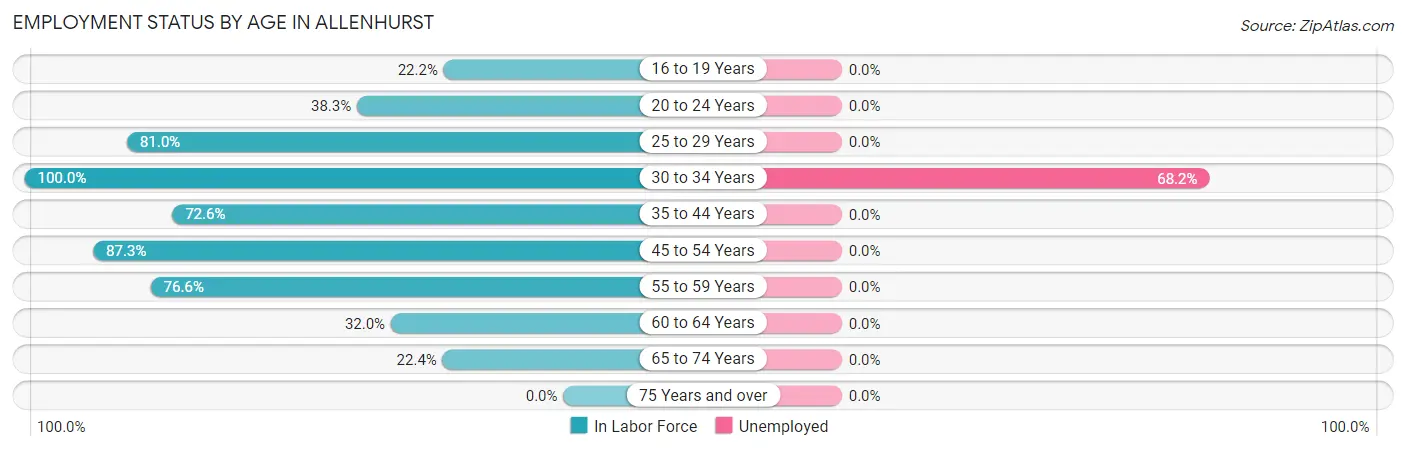
| Age Bracket | In Labor Force | Unemployed |
| 16 to 19 Years | 4 (22.2%) | 0 (0.0%) |
| 20 to 24 Years | 18 (38.3%) | 0 (0.0%) |
| 25 to 29 Years | 47 (81.0%) | 0 (0.0%) |
| 30 to 34 Years | 22 (100.0%) | 15 (68.2%) |
| 35 to 44 Years | 45 (72.6%) | 0 (0.0%) |
| 45 to 54 Years | 62 (87.3%) | 0 (0.0%) |
| 55 to 59 Years | 36 (76.6%) | 0 (0.0%) |
| 60 to 64 Years | 16 (32.0%) | 0 (0.0%) |
| 65 to 74 Years | 11 (22.4%) | 0 (0.0%) |
| 75 Years and over | 0 (0.0%) | 0 (0.0%) |
| Total | 261 (60.3%) | 15 (5.9%) |
Employment Status by Educational Attainment in Allenhurst
According to labor force statistics for Allenhurst, 73.5% of individuals (228) out of the total population between 25 and 64 years of age (310) are in the labor force, with 6.6% or 15 of them being unemployed. The group with the highest labor force participation rate are those with the educational attainment of bachelor's degree or higher, with 87.3% or 48 individuals in the labor force. Within the labor force, individuals with high school diploma education have the highest percentage of unemployment, with 16.7% or 10 of them being unemployed.
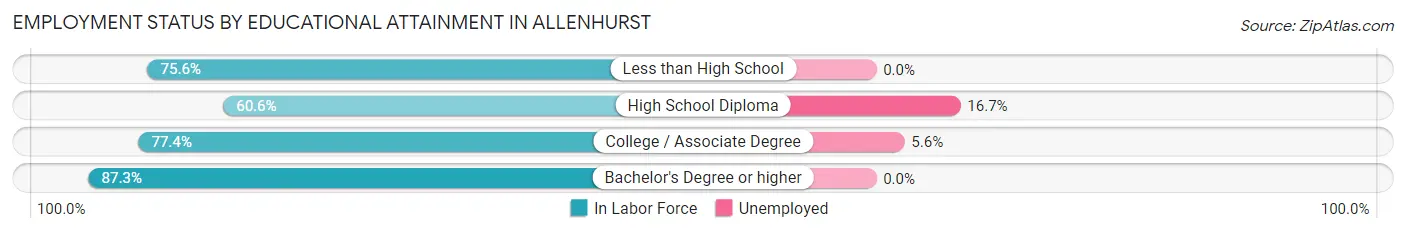
| Educational Attainment | In Labor Force | Unemployed |
| Less than High School | 31 (75.6%) | 0 (0.0%) |
| High School Diploma | 60 (60.6%) | 17 (16.7%) |
| College / Associate Degree | 89 (77.4%) | 6 (5.6%) |
| Bachelor's Degree or higher | 48 (87.3%) | 0 (0.0%) |
| Total | 228 (73.5%) | 20 (6.6%) |
Employment Occupations by Sex in Allenhurst
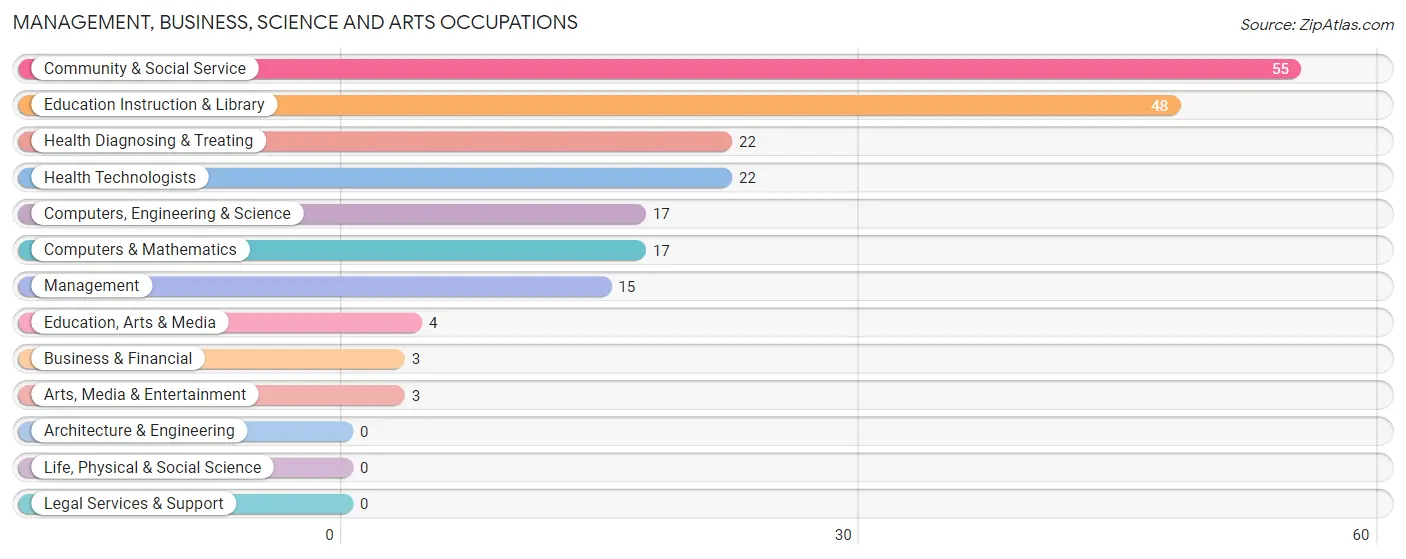
Management, Business, Science and Arts Occupations
The most common Management, Business, Science and Arts occupations in Allenhurst are Community & Social Service (55 | 22.8%), Education Instruction & Library (48 | 19.9%), Health Diagnosing & Treating (22 | 9.1%), Health Technologists (22 | 9.1%), and Computers, Engineering & Science (17 | 7.0%).
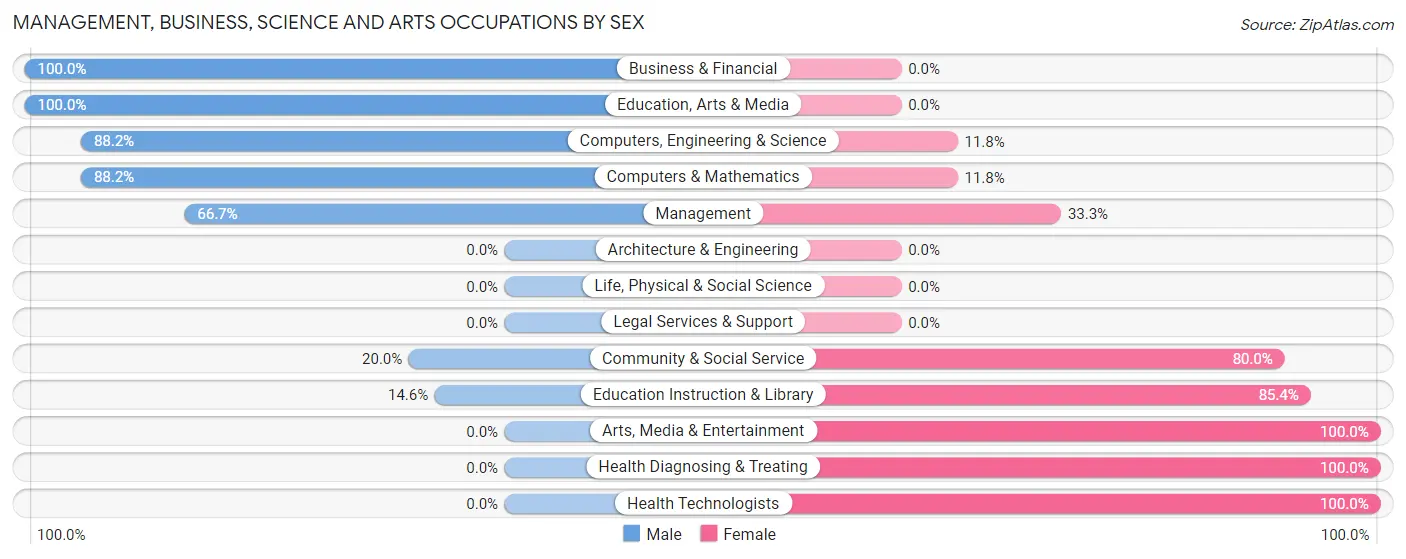
Management, Business, Science and Arts Occupations by Sex
Within the Management, Business, Science and Arts occupations in Allenhurst, the most male-oriented occupations are Business & Financial (100.0%), Education, Arts & Media (100.0%), and Computers, Engineering & Science (88.2%), while the most female-oriented occupations are Arts, Media & Entertainment (100.0%), Health Diagnosing & Treating (100.0%), and Health Technologists (100.0%).
| Occupation | Male | Female |
| Management | 10 (66.7%) | 5 (33.3%) |
| Business & Financial | 3 (100.0%) | 0 (0.0%) |
| Computers, Engineering & Science | 15 (88.2%) | 2 (11.8%) |
| Computers & Mathematics | 15 (88.2%) | 2 (11.8%) |
| Architecture & Engineering | 0 (0.0%) | 0 (0.0%) |
| Life, Physical & Social Science | 0 (0.0%) | 0 (0.0%) |
| Community & Social Service | 11 (20.0%) | 44 (80.0%) |
| Education, Arts & Media | 4 (100.0%) | 0 (0.0%) |
| Legal Services & Support | 0 (0.0%) | 0 (0.0%) |
| Education Instruction & Library | 7 (14.6%) | 41 (85.4%) |
| Arts, Media & Entertainment | 0 (0.0%) | 3 (100.0%) |
| Health Diagnosing & Treating | 0 (0.0%) | 22 (100.0%) |
| Health Technologists | 0 (0.0%) | 22 (100.0%) |
| Total (Category) | 39 (34.8%) | 73 (65.2%) |
| Total (Overall) | 122 (50.6%) | 119 (49.4%) |
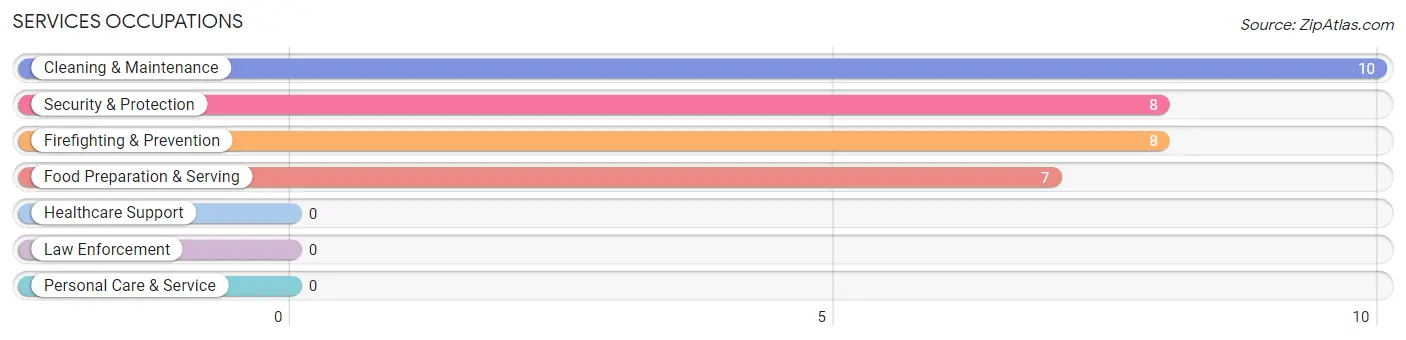
Services Occupations
The most common Services occupations in Allenhurst are Cleaning & Maintenance (10 | 4.2%), Security & Protection (8 | 3.3%), Firefighting & Prevention (8 | 3.3%), and Food Preparation & Serving (7 | 2.9%).
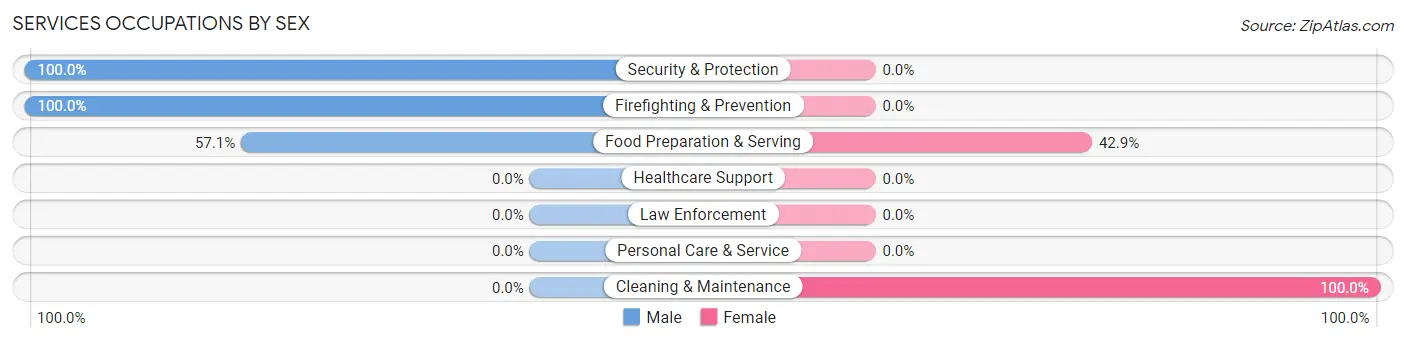
Services Occupations by Sex
Within the Services occupations in Allenhurst, the most male-oriented occupations are Security & Protection (100.0%), Firefighting & Prevention (100.0%), and Food Preparation & Serving (57.1%), while the most female-oriented occupations are Cleaning & Maintenance (100.0%), and Food Preparation & Serving (42.9%).
| Occupation | Male | Female |
| Healthcare Support | 0 (0.0%) | 0 (0.0%) |
| Security & Protection | 8 (100.0%) | 0 (0.0%) |
| Firefighting & Prevention | 8 (100.0%) | 0 (0.0%) |
| Law Enforcement | 0 (0.0%) | 0 (0.0%) |
| Food Preparation & Serving | 4 (57.1%) | 3 (42.9%) |
| Cleaning & Maintenance | 0 (0.0%) | 10 (100.0%) |
| Personal Care & Service | 0 (0.0%) | 0 (0.0%) |
| Total (Category) | 12 (48.0%) | 13 (52.0%) |
| Total (Overall) | 122 (50.6%) | 119 (49.4%) |
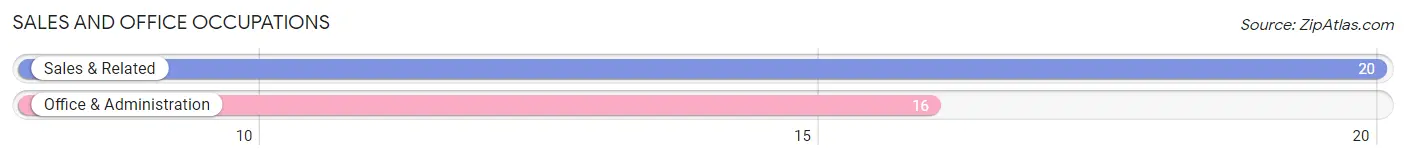
Sales and Office Occupations
The most common Sales and Office occupations in Allenhurst are Sales & Related (20 | 8.3%), and Office & Administration (16 | 6.6%).
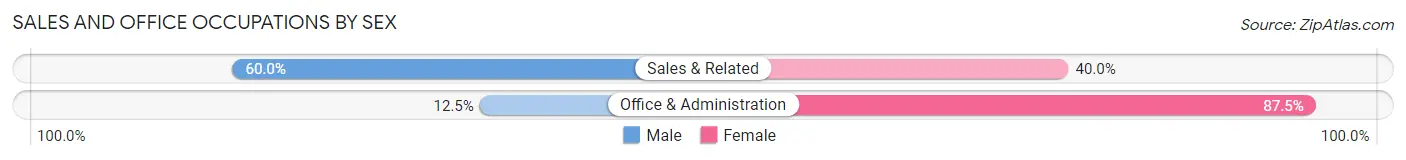
Sales and Office Occupations by Sex
| Occupation | Male | Female |
| Sales & Related | 12 (60.0%) | 8 (40.0%) |
| Office & Administration | 2 (12.5%) | 14 (87.5%) |
| Total (Category) | 14 (38.9%) | 22 (61.1%) |
| Total (Overall) | 122 (50.6%) | 119 (49.4%) |
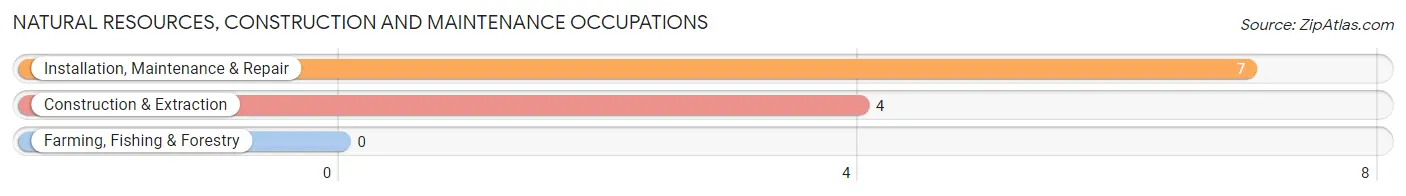
Natural Resources, Construction and Maintenance Occupations
The most common Natural Resources, Construction and Maintenance occupations in Allenhurst are Installation, Maintenance & Repair (7 | 2.9%), and Construction & Extraction (4 | 1.7%).
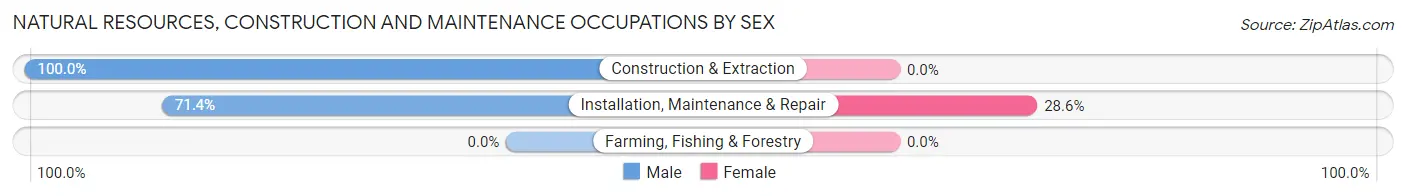
Natural Resources, Construction and Maintenance Occupations by Sex
| Occupation | Male | Female |
| Farming, Fishing & Forestry | 0 (0.0%) | 0 (0.0%) |
| Construction & Extraction | 4 (100.0%) | 0 (0.0%) |
| Installation, Maintenance & Repair | 5 (71.4%) | 2 (28.6%) |
| Total (Category) | 9 (81.8%) | 2 (18.2%) |
| Total (Overall) | 122 (50.6%) | 119 (49.4%) |
Production, Transportation and Moving Occupations
The most common Production, Transportation and Moving occupations in Allenhurst are Material Moving (37 | 15.3%), Production (10 | 4.2%), and Transportation (10 | 4.2%).
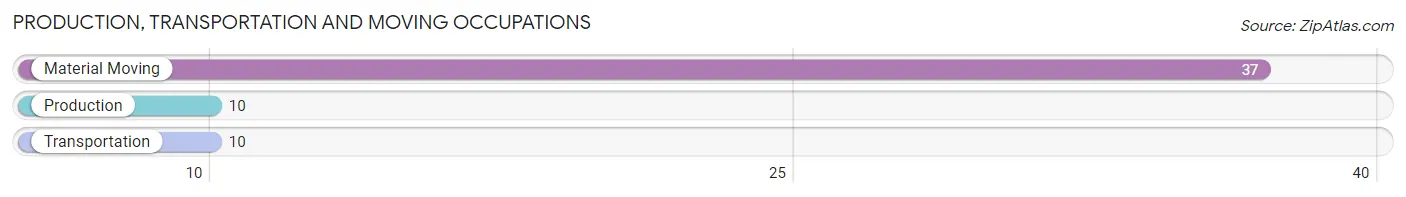
Production, Transportation and Moving Occupations by Sex
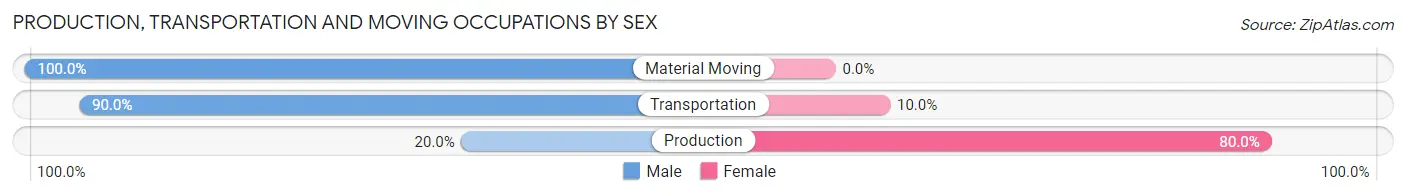
| Occupation | Male | Female |
| Production | 2 (20.0%) | 8 (80.0%) |
| Transportation | 9 (90.0%) | 1 (10.0%) |
| Material Moving | 37 (100.0%) | 0 (0.0%) |
| Total (Category) | 48 (84.2%) | 9 (15.8%) |
| Total (Overall) | 122 (50.6%) | 119 (49.4%) |
Employment Industries by Sex in Allenhurst
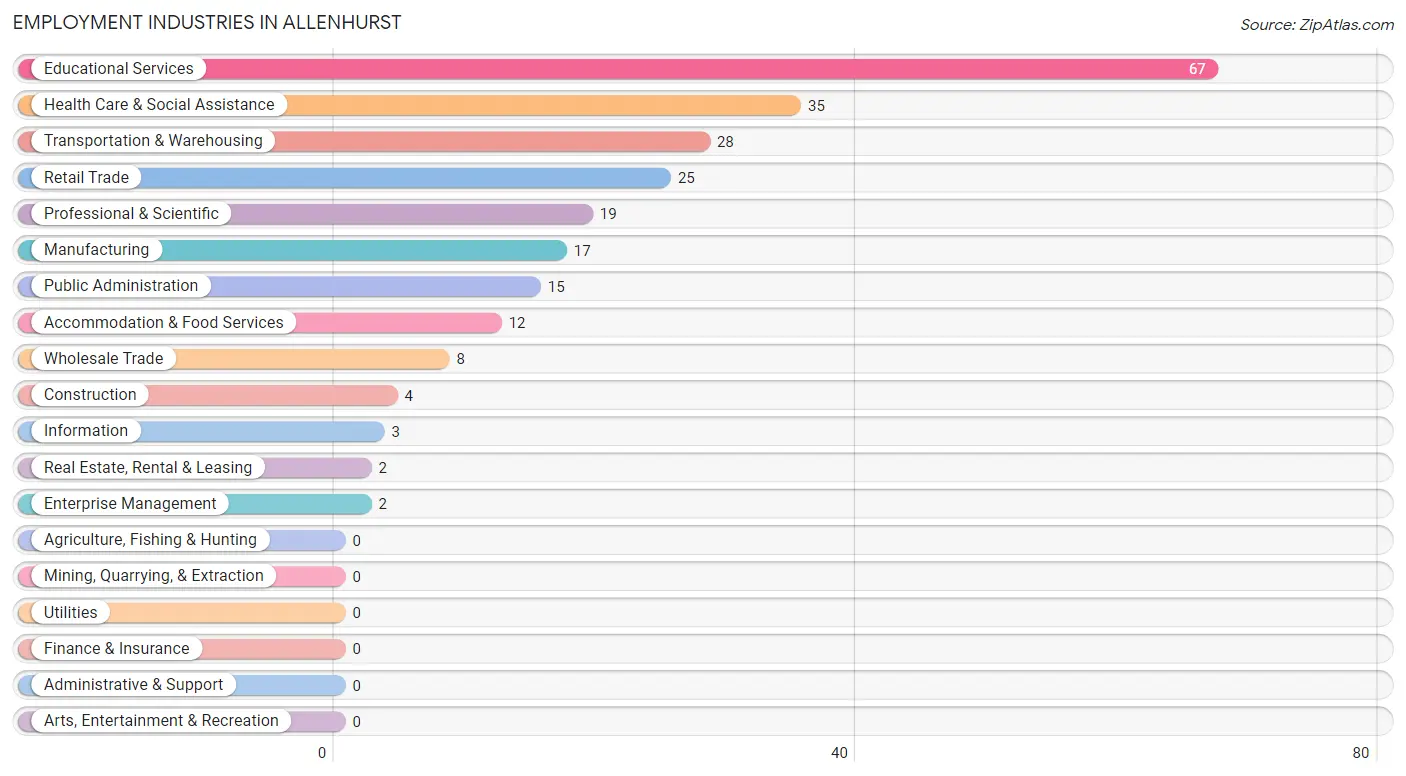
Employment Industries in Allenhurst
The major employment industries in Allenhurst include Educational Services (67 | 27.8%), Health Care & Social Assistance (35 | 14.5%), Transportation & Warehousing (28 | 11.6%), Retail Trade (25 | 10.4%), and Professional & Scientific (19 | 7.9%).
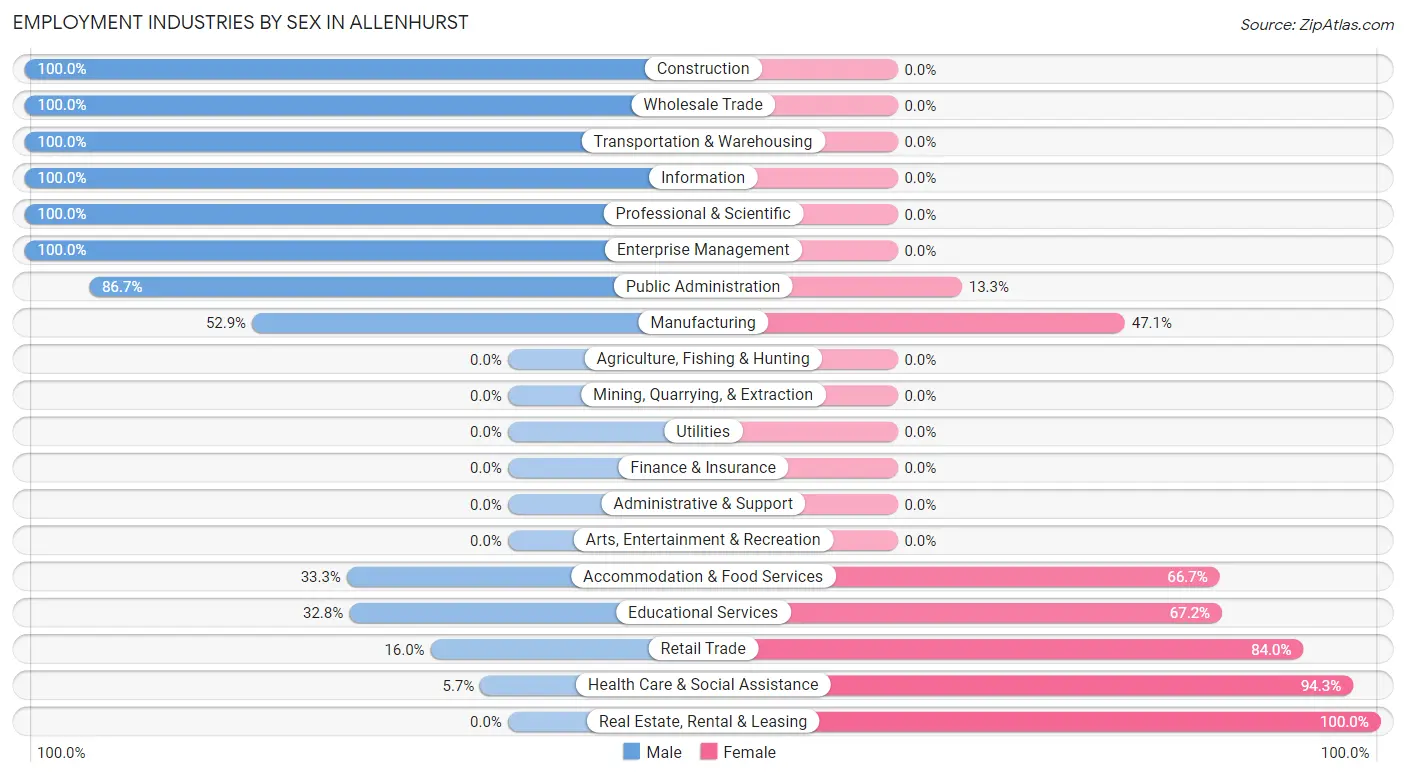
Employment Industries by Sex in Allenhurst
The Allenhurst industries that see more men than women are Construction (100.0%), Wholesale Trade (100.0%), and Transportation & Warehousing (100.0%), whereas the industries that tend to have a higher number of women are Real Estate, Rental & Leasing (100.0%), Health Care & Social Assistance (94.3%), and Retail Trade (84.0%).
| Industry | Male | Female |
| Agriculture, Fishing & Hunting | 0 (0.0%) | 0 (0.0%) |
| Mining, Quarrying, & Extraction | 0 (0.0%) | 0 (0.0%) |
| Construction | 4 (100.0%) | 0 (0.0%) |
| Manufacturing | 9 (52.9%) | 8 (47.1%) |
| Wholesale Trade | 8 (100.0%) | 0 (0.0%) |
| Retail Trade | 4 (16.0%) | 21 (84.0%) |
| Transportation & Warehousing | 28 (100.0%) | 0 (0.0%) |
| Utilities | 0 (0.0%) | 0 (0.0%) |
| Information | 3 (100.0%) | 0 (0.0%) |
| Finance & Insurance | 0 (0.0%) | 0 (0.0%) |
| Real Estate, Rental & Leasing | 0 (0.0%) | 2 (100.0%) |
| Professional & Scientific | 19 (100.0%) | 0 (0.0%) |
| Enterprise Management | 2 (100.0%) | 0 (0.0%) |
| Administrative & Support | 0 (0.0%) | 0 (0.0%) |
| Educational Services | 22 (32.8%) | 45 (67.2%) |
| Health Care & Social Assistance | 2 (5.7%) | 33 (94.3%) |
| Arts, Entertainment & Recreation | 0 (0.0%) | 0 (0.0%) |
| Accommodation & Food Services | 4 (33.3%) | 8 (66.7%) |
| Public Administration | 13 (86.7%) | 2 (13.3%) |
| Total | 122 (50.6%) | 119 (49.4%) |
Education in Allenhurst
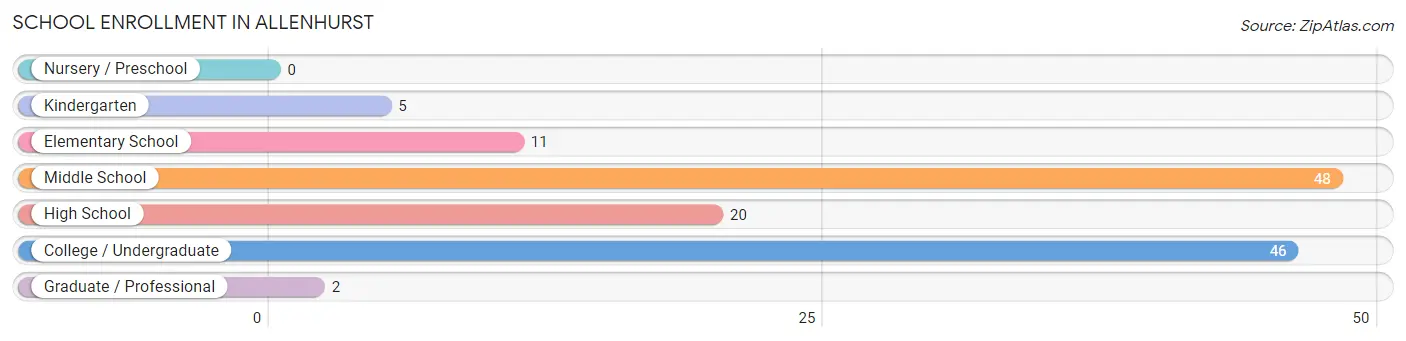
School Enrollment in Allenhurst
The most common levels of schooling among the 132 students in Allenhurst are middle school (48 | 36.4%), college / undergraduate (46 | 34.8%), and high school (20 | 15.1%).
| School Level | # Students | % Students |
| Nursery / Preschool | 0 | 0.0% |
| Kindergarten | 5 | 3.8% |
| Elementary School | 11 | 8.3% |
| Middle School | 48 | 36.4% |
| High School | 20 | 15.1% |
| College / Undergraduate | 46 | 34.8% |
| Graduate / Professional | 2 | 1.5% |
| Total | 132 | 100.0% |
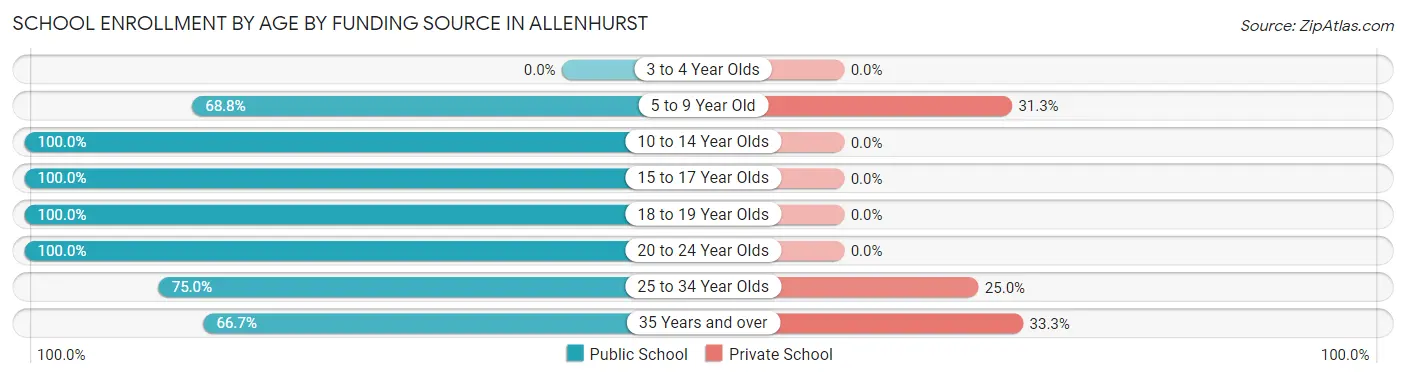
School Enrollment by Age by Funding Source in Allenhurst
Out of a total of 132 students who are enrolled in schools in Allenhurst, 9 (6.8%) attend a private institution, while the remaining 123 (93.2%) are enrolled in public schools. The age group of 35 years and over has the highest likelihood of being enrolled in private schools, with 1 (33.3% in the age bracket) enrolled. Conversely, the age group of 10 to 14 year olds has the lowest likelihood of being enrolled in a private school, with 36 (100.0% in the age bracket) attending a public institution.
| Age Bracket | Public School | Private School |
| 3 to 4 Year Olds | 0 (0.0%) | 0 (0.0%) |
| 5 to 9 Year Old | 11 (68.8%) | 5 (31.2%) |
| 10 to 14 Year Olds | 36 (100.0%) | 0 (0.0%) |
| 15 to 17 Year Olds | 28 (100.0%) | 0 (0.0%) |
| 18 to 19 Year Olds | 5 (100.0%) | 0 (0.0%) |
| 20 to 24 Year Olds | 32 (100.0%) | 0 (0.0%) |
| 25 to 34 Year Olds | 9 (75.0%) | 3 (25.0%) |
| 35 Years and over | 2 (66.7%) | 1 (33.3%) |
| Total | 123 (93.2%) | 9 (6.8%) |
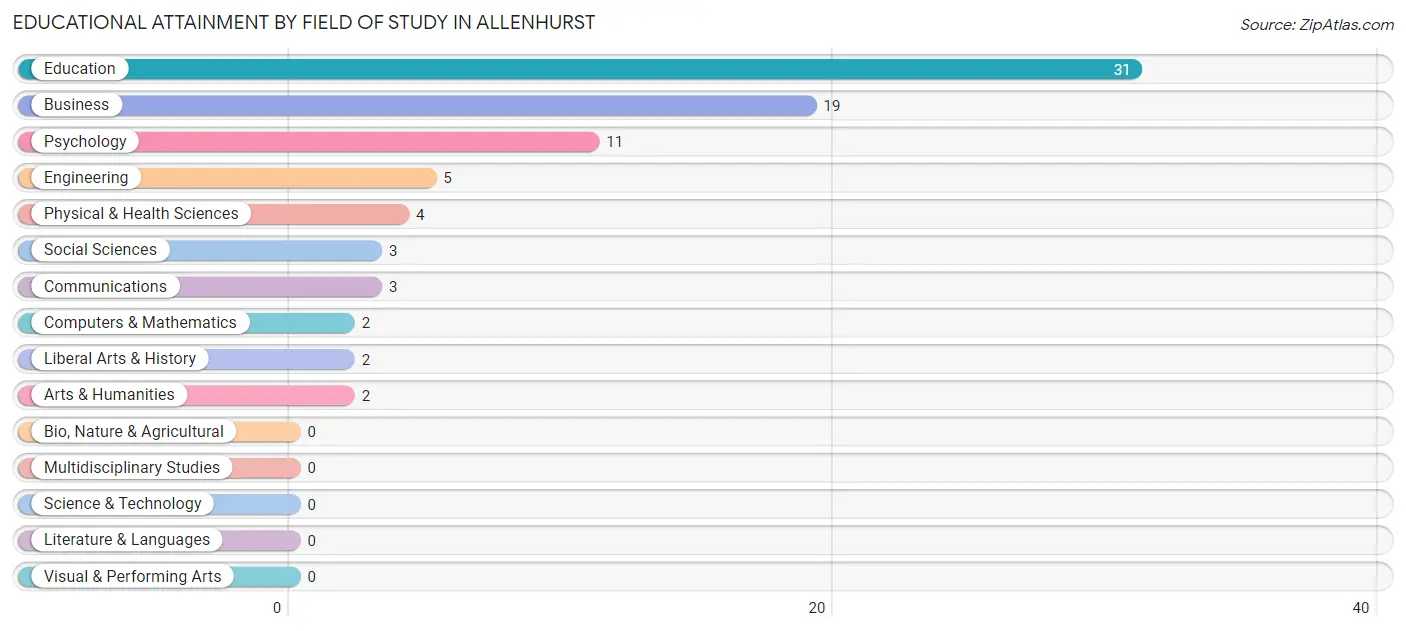
Educational Attainment by Field of Study in Allenhurst
Education (31 | 37.8%), business (19 | 23.2%), psychology (11 | 13.4%), engineering (5 | 6.1%), and physical & health sciences (4 | 4.9%) are the most common fields of study among 82 individuals in Allenhurst who have obtained a bachelor's degree or higher.
| Field of Study | # Graduates | % Graduates |
| Computers & Mathematics | 2 | 2.4% |
| Bio, Nature & Agricultural | 0 | 0.0% |
| Physical & Health Sciences | 4 | 4.9% |
| Psychology | 11 | 13.4% |
| Social Sciences | 3 | 3.7% |
| Engineering | 5 | 6.1% |
| Multidisciplinary Studies | 0 | 0.0% |
| Science & Technology | 0 | 0.0% |
| Business | 19 | 23.2% |
| Education | 31 | 37.8% |
| Literature & Languages | 0 | 0.0% |
| Liberal Arts & History | 2 | 2.4% |
| Visual & Performing Arts | 0 | 0.0% |
| Communications | 3 | 3.7% |
| Arts & Humanities | 2 | 2.4% |
| Total | 82 | 100.0% |
Transportation & Commute in Allenhurst
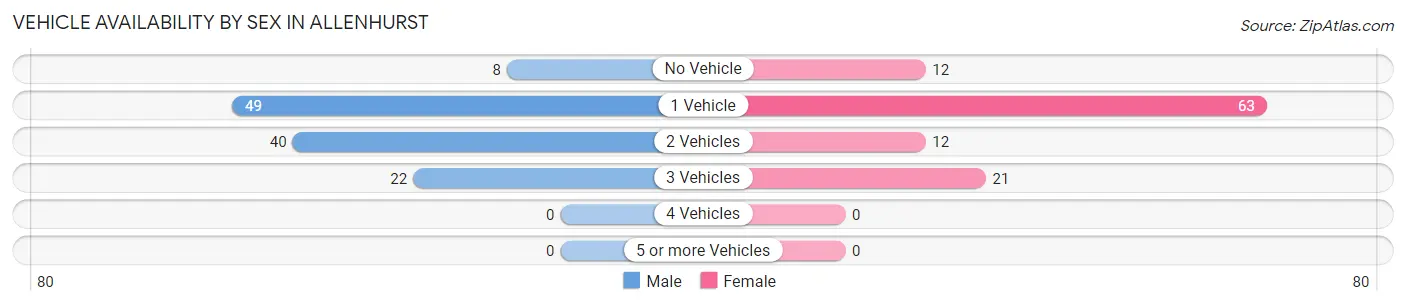
Vehicle Availability by Sex in Allenhurst
The most prevalent vehicle ownership categories in Allenhurst are males with 1 vehicle (49, accounting for 41.2%) and females with 1 vehicle (63, making up 45.4%).
| Vehicles Available | Male | Female |
| No Vehicle | 8 (6.7%) | 12 (11.1%) |
| 1 Vehicle | 49 (41.2%) | 63 (58.3%) |
| 2 Vehicles | 40 (33.6%) | 12 (11.1%) |
| 3 Vehicles | 22 (18.5%) | 21 (19.4%) |
| 4 Vehicles | 0 (0.0%) | 0 (0.0%) |
| 5 or more Vehicles | 0 (0.0%) | 0 (0.0%) |
| Total | 119 (100.0%) | 108 (100.0%) |
Commute Time in Allenhurst
The most frequently occuring commute durations in Allenhurst are 10 to 14 minutes (47 commuters, 22.4%), 20 to 24 minutes (46 commuters, 21.9%), and 5 to 9 minutes (31 commuters, 14.8%).
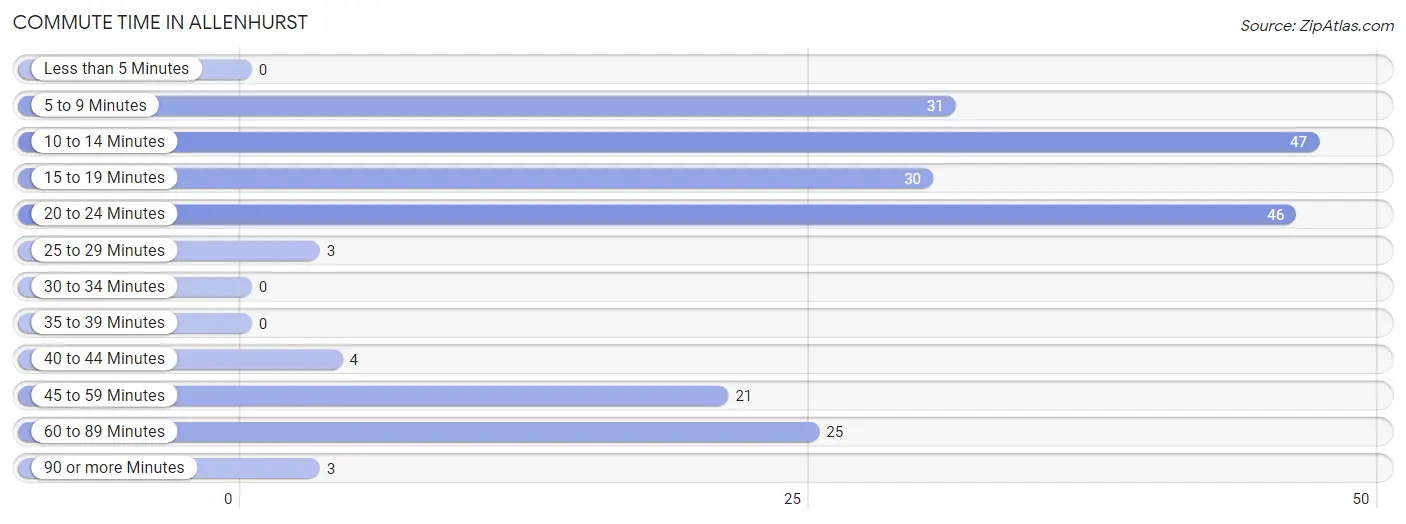
| Commute Time | # Commuters | % Commuters |
| Less than 5 Minutes | 0 | 0.0% |
| 5 to 9 Minutes | 31 | 14.8% |
| 10 to 14 Minutes | 47 | 22.4% |
| 15 to 19 Minutes | 30 | 14.3% |
| 20 to 24 Minutes | 46 | 21.9% |
| 25 to 29 Minutes | 3 | 1.4% |
| 30 to 34 Minutes | 0 | 0.0% |
| 35 to 39 Minutes | 0 | 0.0% |
| 40 to 44 Minutes | 4 | 1.9% |
| 45 to 59 Minutes | 21 | 10.0% |
| 60 to 89 Minutes | 25 | 11.9% |
| 90 or more Minutes | 3 | 1.4% |
Commute Time by Sex in Allenhurst
The most common commute times in Allenhurst are 20 to 24 minutes (45 commuters, 38.8%) for males and 10 to 14 minutes (30 commuters, 31.9%) for females.
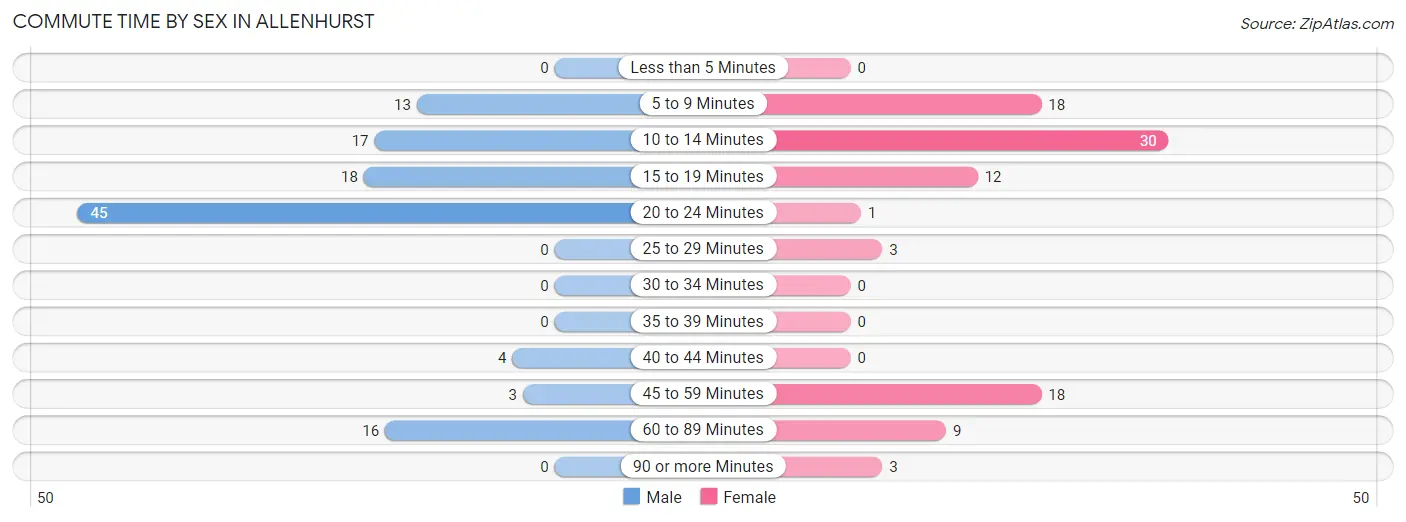
| Commute Time | Male | Female |
| Less than 5 Minutes | 0 (0.0%) | 0 (0.0%) |
| 5 to 9 Minutes | 13 (11.2%) | 18 (19.2%) |
| 10 to 14 Minutes | 17 (14.7%) | 30 (31.9%) |
| 15 to 19 Minutes | 18 (15.5%) | 12 (12.8%) |
| 20 to 24 Minutes | 45 (38.8%) | 1 (1.1%) |
| 25 to 29 Minutes | 0 (0.0%) | 3 (3.2%) |
| 30 to 34 Minutes | 0 (0.0%) | 0 (0.0%) |
| 35 to 39 Minutes | 0 (0.0%) | 0 (0.0%) |
| 40 to 44 Minutes | 4 (3.5%) | 0 (0.0%) |
| 45 to 59 Minutes | 3 (2.6%) | 18 (19.2%) |
| 60 to 89 Minutes | 16 (13.8%) | 9 (9.6%) |
| 90 or more Minutes | 0 (0.0%) | 3 (3.2%) |
Time of Departure to Work by Sex in Allenhurst
The most frequent times of departure to work in Allenhurst are 12:00 AM to 4:59 AM (21, 18.1%) for males and 6:00 AM to 6:29 AM (24, 25.5%) for females.
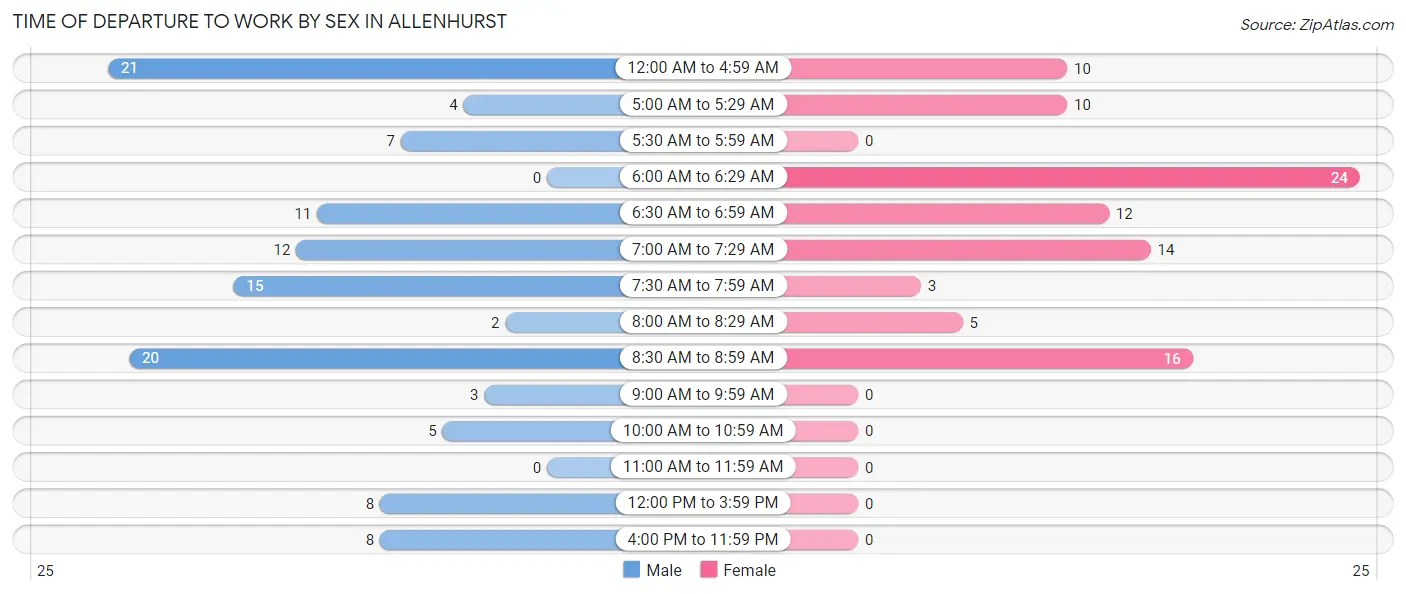
| Time of Departure | Male | Female |
| 12:00 AM to 4:59 AM | 21 (18.1%) | 10 (10.6%) |
| 5:00 AM to 5:29 AM | 4 (3.5%) | 10 (10.6%) |
| 5:30 AM to 5:59 AM | 7 (6.0%) | 0 (0.0%) |
| 6:00 AM to 6:29 AM | 0 (0.0%) | 24 (25.5%) |
| 6:30 AM to 6:59 AM | 11 (9.5%) | 12 (12.8%) |
| 7:00 AM to 7:29 AM | 12 (10.3%) | 14 (14.9%) |
| 7:30 AM to 7:59 AM | 15 (12.9%) | 3 (3.2%) |
| 8:00 AM to 8:29 AM | 2 (1.7%) | 5 (5.3%) |
| 8:30 AM to 8:59 AM | 20 (17.2%) | 16 (17.0%) |
| 9:00 AM to 9:59 AM | 3 (2.6%) | 0 (0.0%) |
| 10:00 AM to 10:59 AM | 5 (4.3%) | 0 (0.0%) |
| 11:00 AM to 11:59 AM | 0 (0.0%) | 0 (0.0%) |
| 12:00 PM to 3:59 PM | 8 (6.9%) | 0 (0.0%) |
| 4:00 PM to 11:59 PM | 8 (6.9%) | 0 (0.0%) |
| Total | 116 (100.0%) | 94 (100.0%) |
Housing Occupancy in Allenhurst
Occupancy by Ownership in Allenhurst
Of the total 230 dwellings in Allenhurst, owner-occupied units account for 136 (59.1%), while renter-occupied units make up 94 (40.9%).
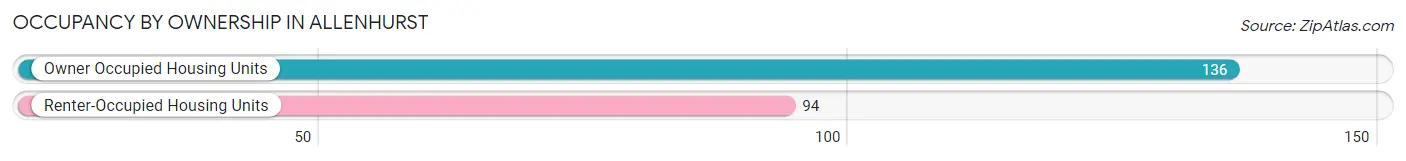
| Occupancy | # Housing Units | % Housing Units |
| Owner Occupied Housing Units | 136 | 59.1% |
| Renter-Occupied Housing Units | 94 | 40.9% |
| Total Occupied Housing Units | 230 | 100.0% |
Occupancy by Household Size in Allenhurst
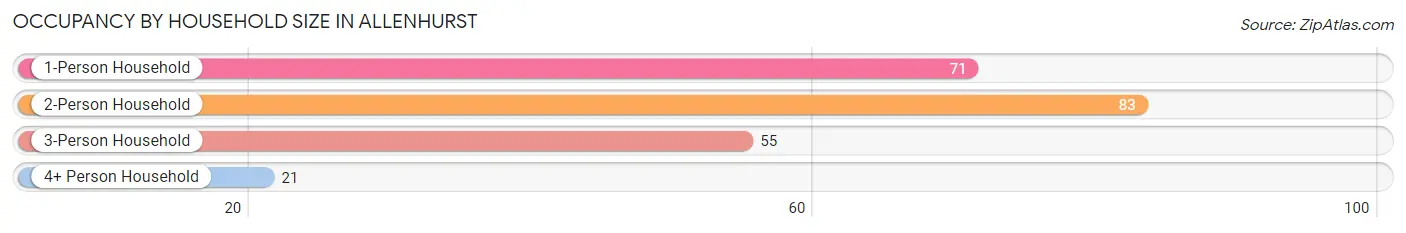
| Household Size | # Housing Units | % Housing Units |
| 1-Person Household | 71 | 30.9% |
| 2-Person Household | 83 | 36.1% |
| 3-Person Household | 55 | 23.9% |
| 4+ Person Household | 21 | 9.1% |
| Total Housing Units | 230 | 100.0% |
Occupancy by Ownership by Household Size in Allenhurst
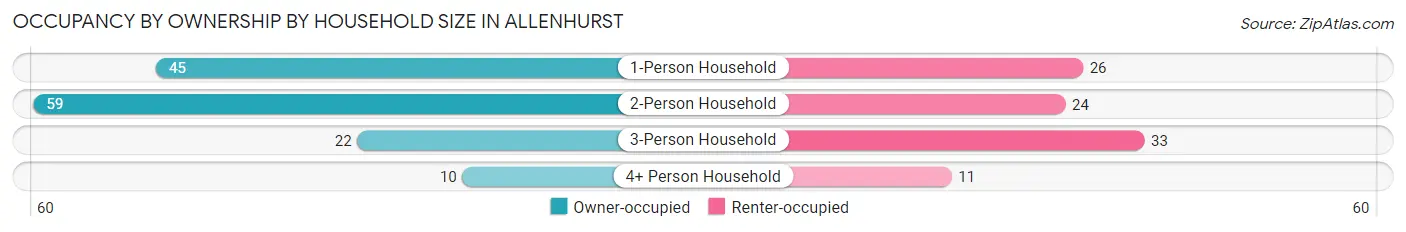
| Household Size | Owner-occupied | Renter-occupied |
| 1-Person Household | 45 (63.4%) | 26 (36.6%) |
| 2-Person Household | 59 (71.1%) | 24 (28.9%) |
| 3-Person Household | 22 (40.0%) | 33 (60.0%) |
| 4+ Person Household | 10 (47.6%) | 11 (52.4%) |
| Total Housing Units | 136 (59.1%) | 94 (40.9%) |
Occupancy by Educational Attainment in Allenhurst
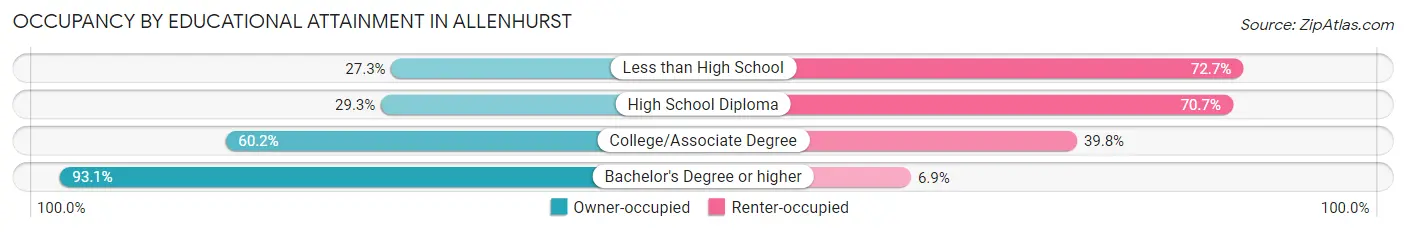
| Household Size | Owner-occupied | Renter-occupied |
| Less than High School | 3 (27.3%) | 8 (72.7%) |
| High School Diploma | 17 (29.3%) | 41 (70.7%) |
| College/Associate Degree | 62 (60.2%) | 41 (39.8%) |
| Bachelor's Degree or higher | 54 (93.1%) | 4 (6.9%) |
Occupancy by Age of Householder in Allenhurst
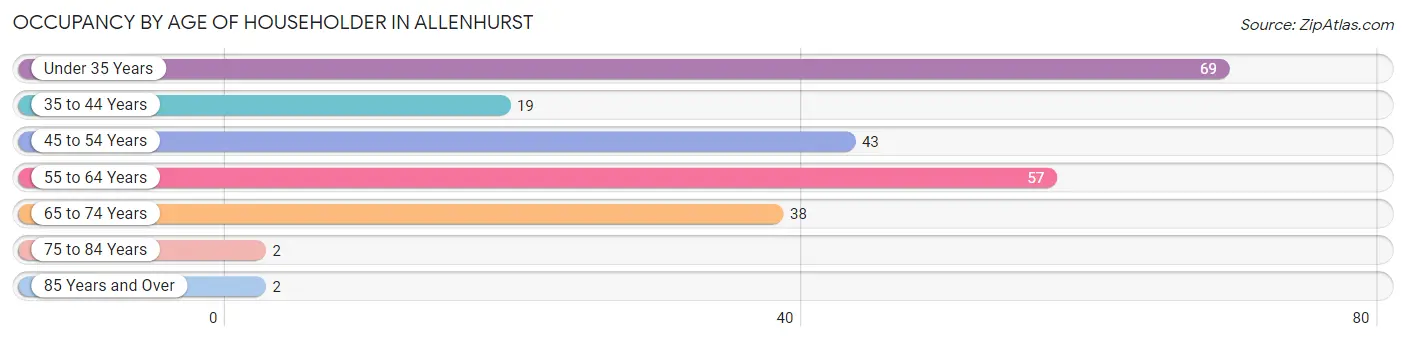
| Age Bracket | # Households | % Households |
| Under 35 Years | 69 | 30.0% |
| 35 to 44 Years | 19 | 8.3% |
| 45 to 54 Years | 43 | 18.7% |
| 55 to 64 Years | 57 | 24.8% |
| 65 to 74 Years | 38 | 16.5% |
| 75 to 84 Years | 2 | 0.9% |
| 85 Years and Over | 2 | 0.9% |
| Total | 230 | 100.0% |
Housing Finances in Allenhurst
Median Income by Occupancy in Allenhurst
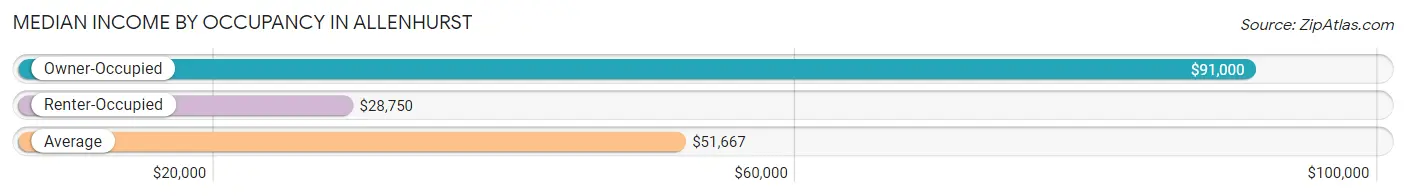
| Occupancy Type | # Households | Median Income |
| Owner-Occupied | 136 (59.1%) | $91,000 |
| Renter-Occupied | 94 (40.9%) | $28,750 |
| Average | 230 (100.0%) | $51,667 |
Occupancy by Householder Income Bracket in Allenhurst
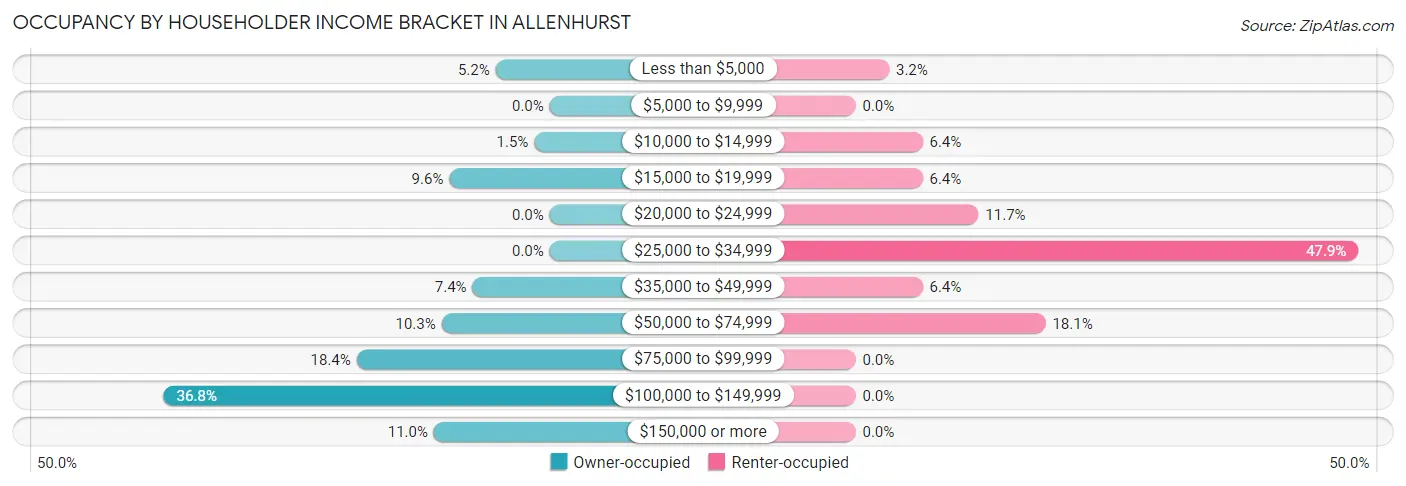
| Income Bracket | Owner-occupied | Renter-occupied |
| Less than $5,000 | 7 (5.1%) | 3 (3.2%) |
| $5,000 to $9,999 | 0 (0.0%) | 0 (0.0%) |
| $10,000 to $14,999 | 2 (1.5%) | 6 (6.4%) |
| $15,000 to $19,999 | 13 (9.6%) | 6 (6.4%) |
| $20,000 to $24,999 | 0 (0.0%) | 11 (11.7%) |
| $25,000 to $34,999 | 0 (0.0%) | 45 (47.9%) |
| $35,000 to $49,999 | 10 (7.3%) | 6 (6.4%) |
| $50,000 to $74,999 | 14 (10.3%) | 17 (18.1%) |
| $75,000 to $99,999 | 25 (18.4%) | 0 (0.0%) |
| $100,000 to $149,999 | 50 (36.8%) | 0 (0.0%) |
| $150,000 or more | 15 (11.0%) | 0 (0.0%) |
| Total | 136 (100.0%) | 94 (100.0%) |
Monthly Housing Cost Tiers in Allenhurst
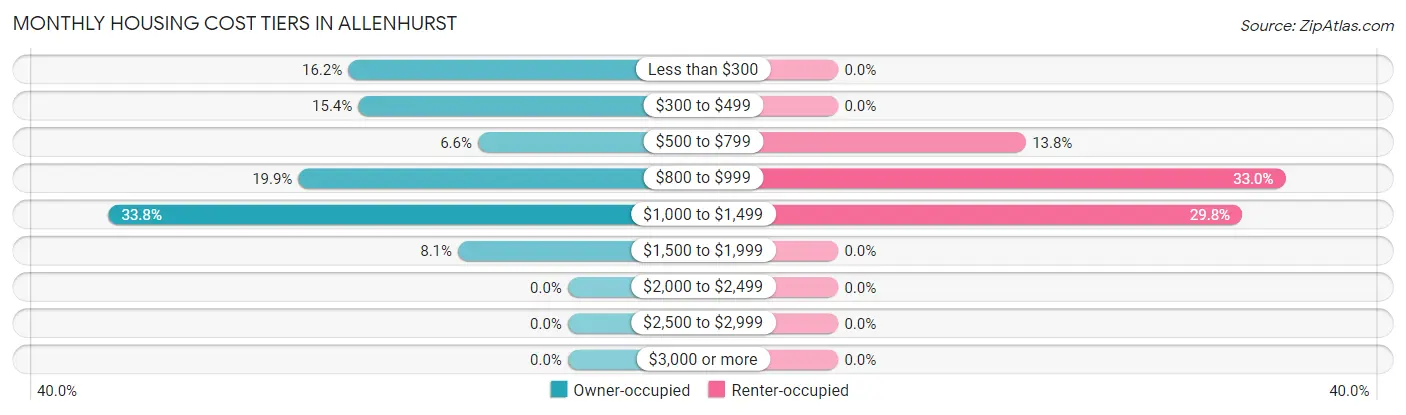
| Monthly Cost | Owner-occupied | Renter-occupied |
| Less than $300 | 22 (16.2%) | 0 (0.0%) |
| $300 to $499 | 21 (15.4%) | 0 (0.0%) |
| $500 to $799 | 9 (6.6%) | 13 (13.8%) |
| $800 to $999 | 27 (19.9%) | 31 (33.0%) |
| $1,000 to $1,499 | 46 (33.8%) | 28 (29.8%) |
| $1,500 to $1,999 | 11 (8.1%) | 0 (0.0%) |
| $2,000 to $2,499 | 0 (0.0%) | 0 (0.0%) |
| $2,500 to $2,999 | 0 (0.0%) | 0 (0.0%) |
| $3,000 or more | 0 (0.0%) | 0 (0.0%) |
| Total | 136 (100.0%) | 94 (100.0%) |
Physical Housing Characteristics in Allenhurst
Housing Structures in Allenhurst
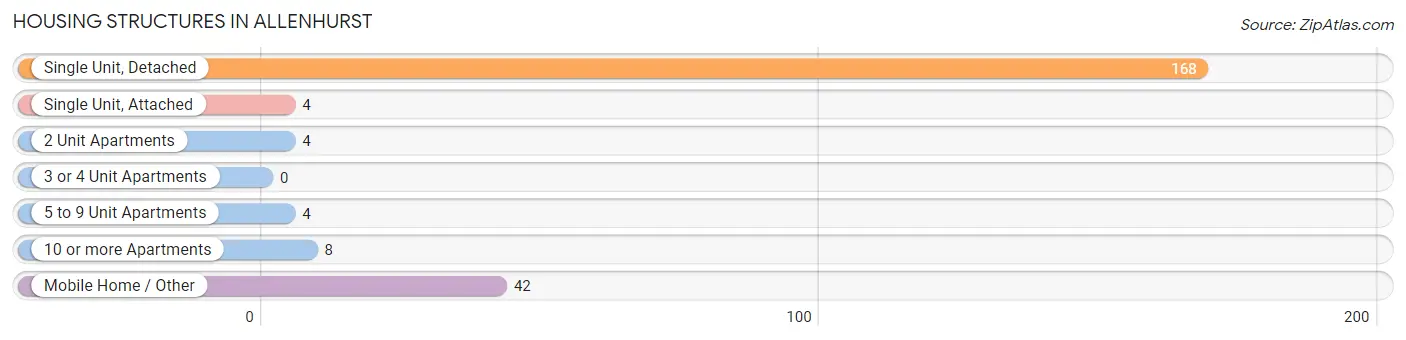
| Structure Type | # Housing Units | % Housing Units |
| Single Unit, Detached | 168 | 73.0% |
| Single Unit, Attached | 4 | 1.7% |
| 2 Unit Apartments | 4 | 1.7% |
| 3 or 4 Unit Apartments | 0 | 0.0% |
| 5 to 9 Unit Apartments | 4 | 1.7% |
| 10 or more Apartments | 8 | 3.5% |
| Mobile Home / Other | 42 | 18.3% |
| Total | 230 | 100.0% |
Housing Structures by Occupancy in Allenhurst
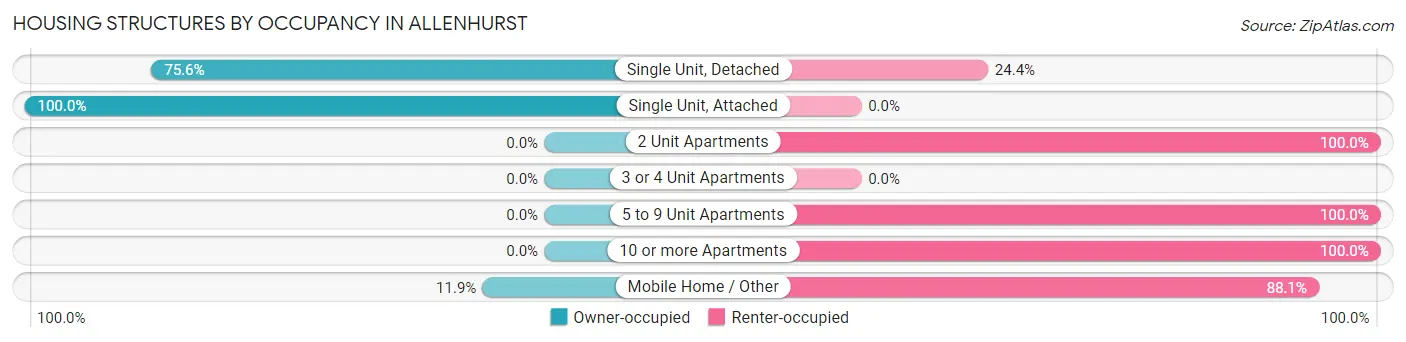
| Structure Type | Owner-occupied | Renter-occupied |
| Single Unit, Detached | 127 (75.6%) | 41 (24.4%) |
| Single Unit, Attached | 4 (100.0%) | 0 (0.0%) |
| 2 Unit Apartments | 0 (0.0%) | 4 (100.0%) |
| 3 or 4 Unit Apartments | 0 (0.0%) | 0 (0.0%) |
| 5 to 9 Unit Apartments | 0 (0.0%) | 4 (100.0%) |
| 10 or more Apartments | 0 (0.0%) | 8 (100.0%) |
| Mobile Home / Other | 5 (11.9%) | 37 (88.1%) |
| Total | 136 (59.1%) | 94 (40.9%) |
Housing Structures by Number of Rooms in Allenhurst
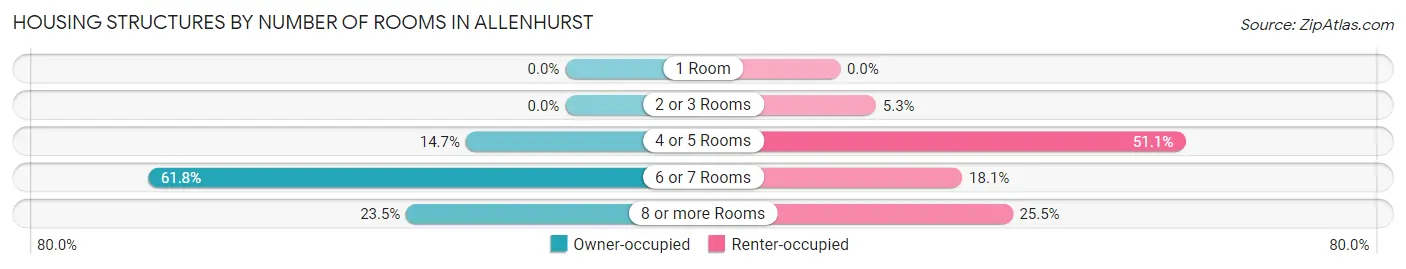
| Number of Rooms | Owner-occupied | Renter-occupied |
| 1 Room | 0 (0.0%) | 0 (0.0%) |
| 2 or 3 Rooms | 0 (0.0%) | 5 (5.3%) |
| 4 or 5 Rooms | 20 (14.7%) | 48 (51.1%) |
| 6 or 7 Rooms | 84 (61.8%) | 17 (18.1%) |
| 8 or more Rooms | 32 (23.5%) | 24 (25.5%) |
| Total | 136 (100.0%) | 94 (100.0%) |
Housing Structure by Heating Type in Allenhurst
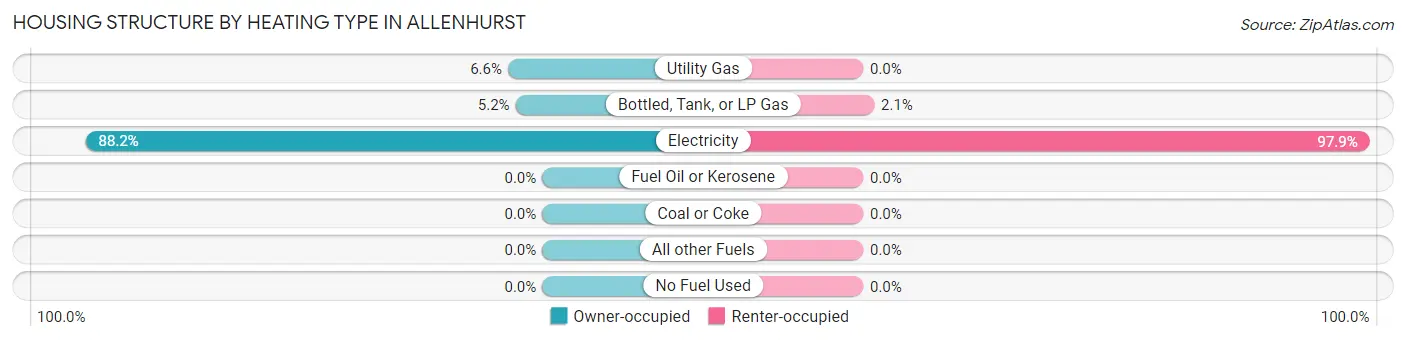
| Heating Type | Owner-occupied | Renter-occupied |
| Utility Gas | 9 (6.6%) | 0 (0.0%) |
| Bottled, Tank, or LP Gas | 7 (5.1%) | 2 (2.1%) |
| Electricity | 120 (88.2%) | 92 (97.9%) |
| Fuel Oil or Kerosene | 0 (0.0%) | 0 (0.0%) |
| Coal or Coke | 0 (0.0%) | 0 (0.0%) |
| All other Fuels | 0 (0.0%) | 0 (0.0%) |
| No Fuel Used | 0 (0.0%) | 0 (0.0%) |
| Total | 136 (100.0%) | 94 (100.0%) |
Household Vehicle Usage in Allenhurst
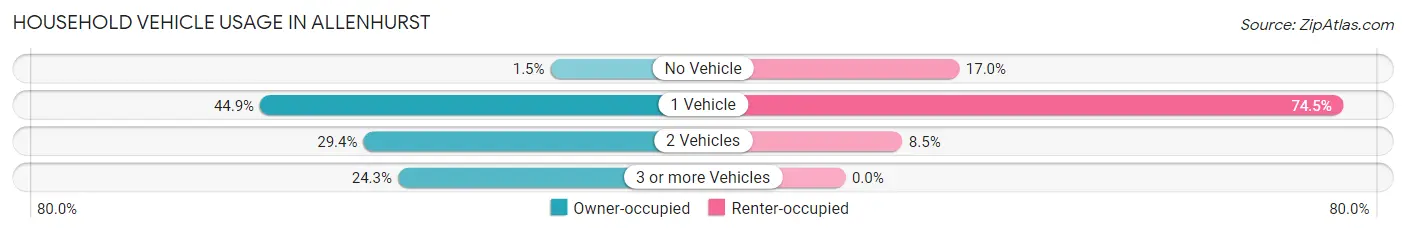
| Vehicles per Household | Owner-occupied | Renter-occupied |
| No Vehicle | 2 (1.5%) | 16 (17.0%) |
| 1 Vehicle | 61 (44.9%) | 70 (74.5%) |
| 2 Vehicles | 40 (29.4%) | 8 (8.5%) |
| 3 or more Vehicles | 33 (24.3%) | 0 (0.0%) |
| Total | 136 (100.0%) | 94 (100.0%) |
Real Estate & Mortgages in Allenhurst
Real Estate and Mortgage Overview in Allenhurst
| Characteristic | Without Mortgage | With Mortgage |
| Housing Units | 53 | 83 |
| Median Property Value | $189,800 | $162,100 |
| Median Household Income | $76,875 | $13 |
| Monthly Housing Costs | $388 | $0 |
| Real Estate Taxes | $1,818 | $3 |
Property Value by Mortgage Status in Allenhurst
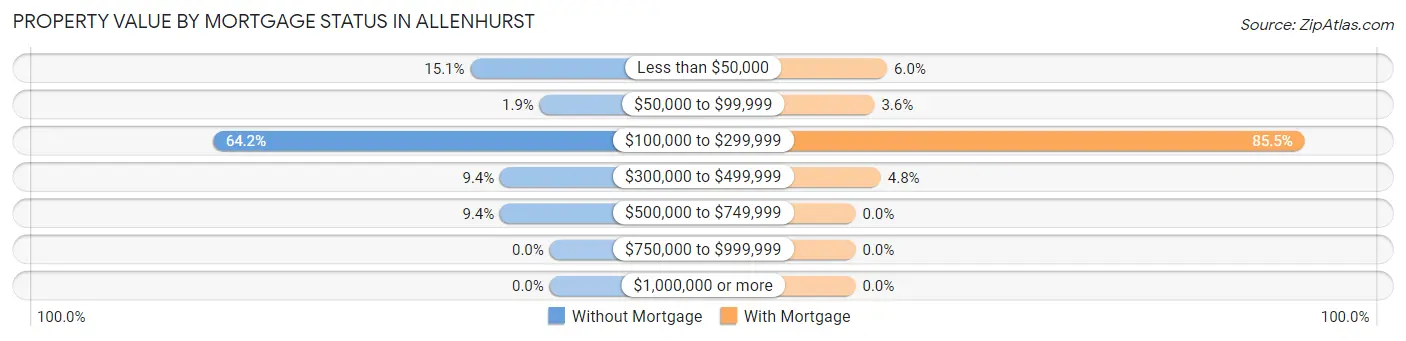
| Property Value | Without Mortgage | With Mortgage |
| Less than $50,000 | 8 (15.1%) | 5 (6.0%) |
| $50,000 to $99,999 | 1 (1.9%) | 3 (3.6%) |
| $100,000 to $299,999 | 34 (64.1%) | 71 (85.5%) |
| $300,000 to $499,999 | 5 (9.4%) | 4 (4.8%) |
| $500,000 to $749,999 | 5 (9.4%) | 0 (0.0%) |
| $750,000 to $999,999 | 0 (0.0%) | 0 (0.0%) |
| $1,000,000 or more | 0 (0.0%) | 0 (0.0%) |
| Total | 53 (100.0%) | 83 (100.0%) |
Household Income by Mortgage Status in Allenhurst
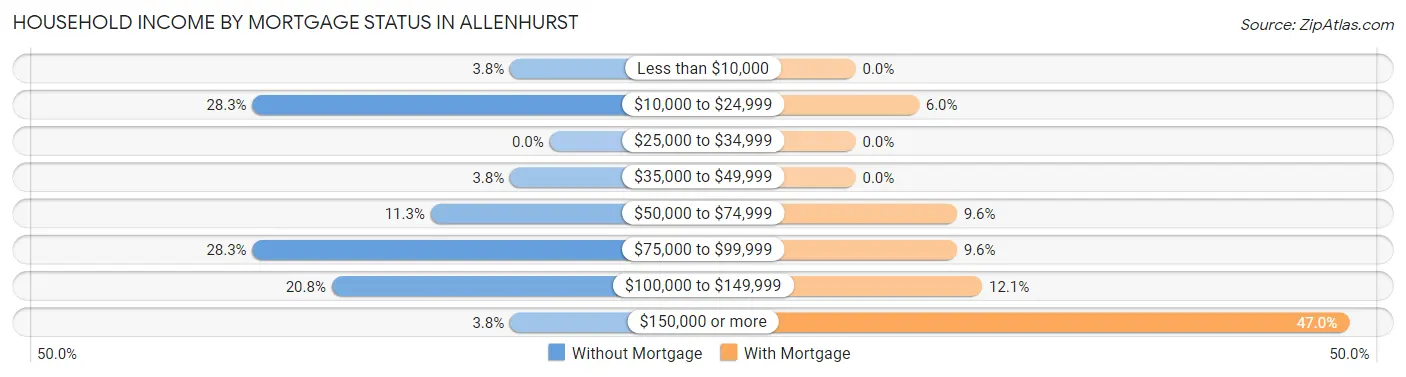
| Household Income | Without Mortgage | With Mortgage |
| Less than $10,000 | 2 (3.8%) | 0 (0.0%) |
| $10,000 to $24,999 | 15 (28.3%) | 5 (6.0%) |
| $25,000 to $34,999 | 0 (0.0%) | 0 (0.0%) |
| $35,000 to $49,999 | 2 (3.8%) | 0 (0.0%) |
| $50,000 to $74,999 | 6 (11.3%) | 8 (9.6%) |
| $75,000 to $99,999 | 15 (28.3%) | 8 (9.6%) |
| $100,000 to $149,999 | 11 (20.7%) | 10 (12.0%) |
| $150,000 or more | 2 (3.8%) | 39 (47.0%) |
| Total | 53 (100.0%) | 83 (100.0%) |
Property Value to Household Income Ratio in Allenhurst
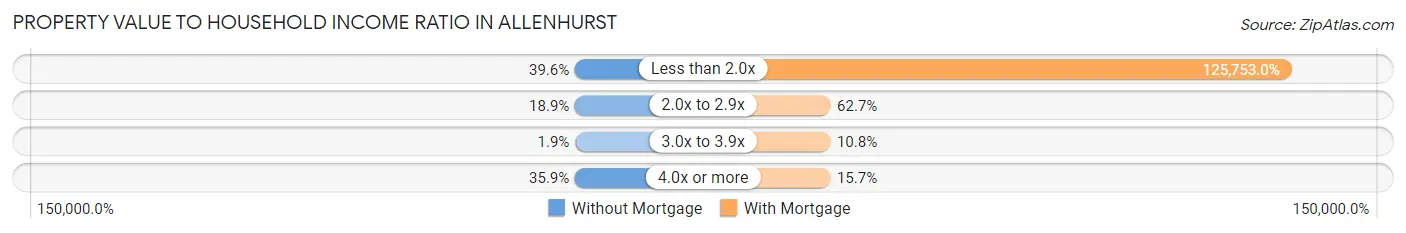
| Value-to-Income Ratio | Without Mortgage | With Mortgage |
| Less than 2.0x | 21 (39.6%) | 104,375 (125,753.0%) |
| 2.0x to 2.9x | 10 (18.9%) | 52 (62.6%) |
| 3.0x to 3.9x | 1 (1.9%) | 9 (10.8%) |
| 4.0x or more | 19 (35.8%) | 13 (15.7%) |
| Total | 53 (100.0%) | 83 (100.0%) |
Real Estate Taxes by Mortgage Status in Allenhurst
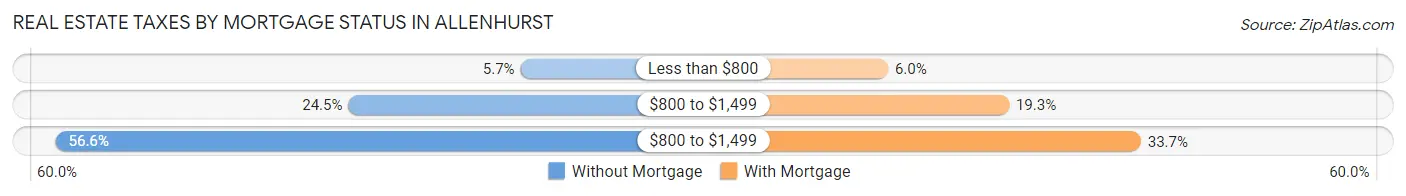
| Property Taxes | Without Mortgage | With Mortgage |
| Less than $800 | 3 (5.7%) | 5 (6.0%) |
| $800 to $1,499 | 13 (24.5%) | 16 (19.3%) |
| $800 to $1,499 | 30 (56.6%) | 28 (33.7%) |
| Total | 53 (100.0%) | 83 (100.0%) |
Health & Disability in Allenhurst
Health Insurance Coverage by Age in Allenhurst
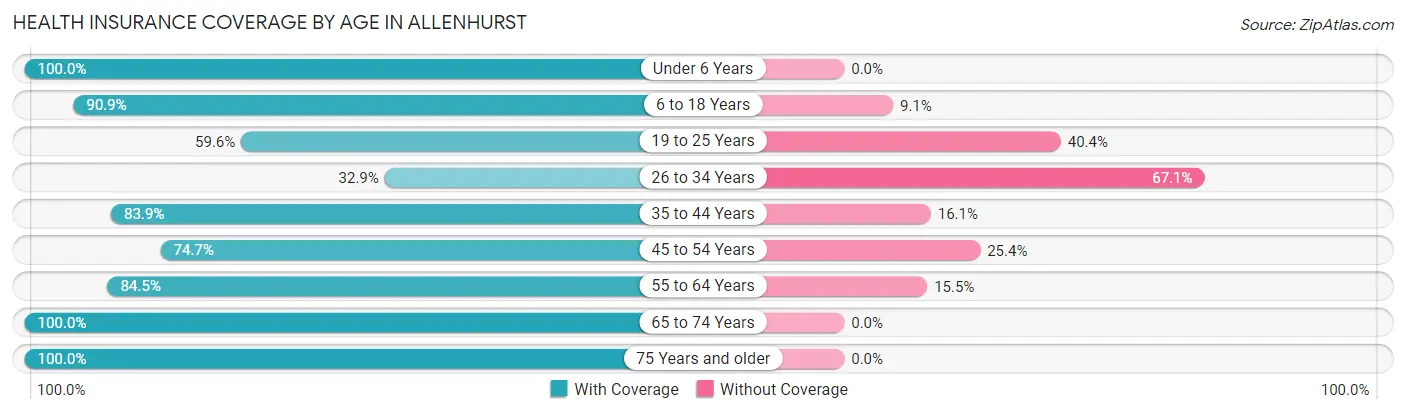
| Age Bracket | With Coverage | Without Coverage |
| Under 6 Years | 12 (100.0%) | 0 (0.0%) |
| 6 to 18 Years | 80 (90.9%) | 8 (9.1%) |
| 19 to 25 Years | 31 (59.6%) | 21 (40.4%) |
| 26 to 34 Years | 23 (32.9%) | 47 (67.1%) |
| 35 to 44 Years | 52 (83.9%) | 10 (16.1%) |
| 45 to 54 Years | 53 (74.7%) | 18 (25.4%) |
| 55 to 64 Years | 82 (84.5%) | 15 (15.5%) |
| 65 to 74 Years | 49 (100.0%) | 0 (0.0%) |
| 75 Years and older | 9 (100.0%) | 0 (0.0%) |
| Total | 391 (76.7%) | 119 (23.3%) |
Health Insurance Coverage by Citizenship Status in Allenhurst
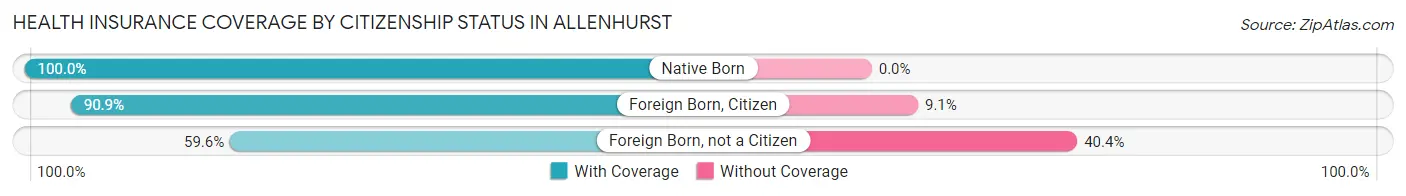
| Citizenship Status | With Coverage | Without Coverage |
| Native Born | 12 (100.0%) | 0 (0.0%) |
| Foreign Born, Citizen | 80 (90.9%) | 8 (9.1%) |
| Foreign Born, not a Citizen | 31 (59.6%) | 21 (40.4%) |
Health Insurance Coverage by Household Income in Allenhurst
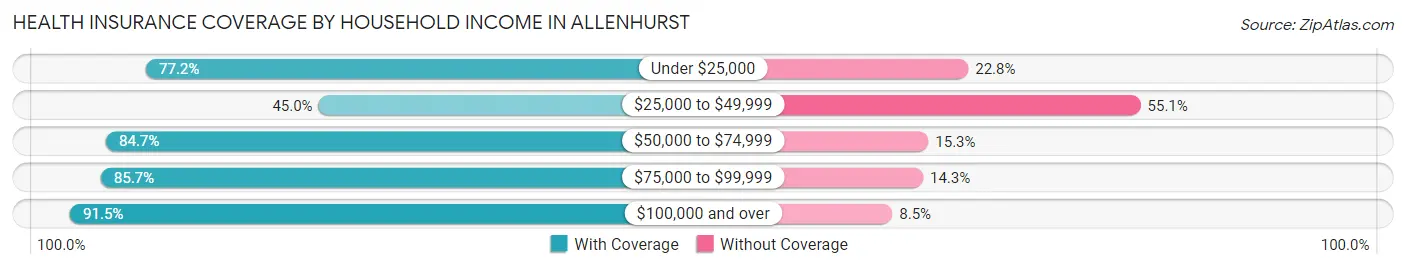
| Household Income | With Coverage | Without Coverage |
| Under $25,000 | 95 (77.2%) | 28 (22.8%) |
| $25,000 to $49,999 | 49 (45.0%) | 60 (55.0%) |
| $50,000 to $74,999 | 61 (84.7%) | 11 (15.3%) |
| $75,000 to $99,999 | 36 (85.7%) | 6 (14.3%) |
| $100,000 and over | 150 (91.5%) | 14 (8.5%) |
Public vs Private Health Insurance Coverage by Age in Allenhurst
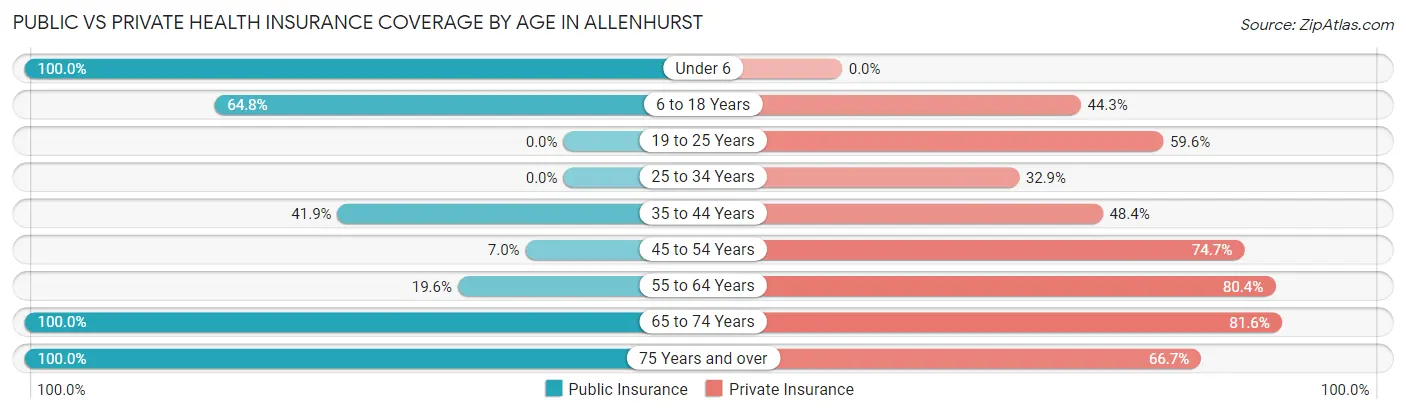
| Age Bracket | Public Insurance | Private Insurance |
| Under 6 | 12 (100.0%) | 0 (0.0%) |
| 6 to 18 Years | 57 (64.8%) | 39 (44.3%) |
| 19 to 25 Years | 0 (0.0%) | 31 (59.6%) |
| 25 to 34 Years | 0 (0.0%) | 23 (32.9%) |
| 35 to 44 Years | 26 (41.9%) | 30 (48.4%) |
| 45 to 54 Years | 5 (7.0%) | 53 (74.7%) |
| 55 to 64 Years | 19 (19.6%) | 78 (80.4%) |
| 65 to 74 Years | 49 (100.0%) | 40 (81.6%) |
| 75 Years and over | 9 (100.0%) | 6 (66.7%) |
| Total | 177 (34.7%) | 300 (58.8%) |
Disability Status by Sex by Age in Allenhurst
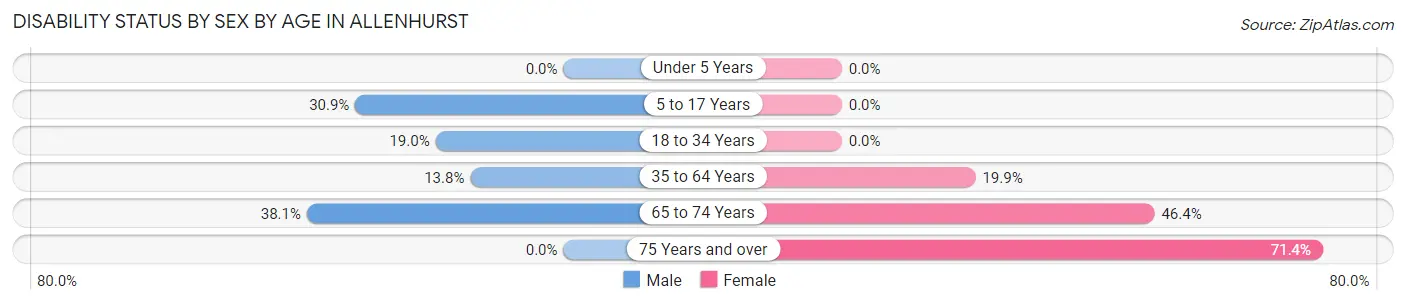
| Age Bracket | Male | Female |
| Under 5 Years | 0 (0.0%) | 0 (0.0%) |
| 5 to 17 Years | 17 (30.9%) | 0 (0.0%) |
| 18 to 34 Years | 15 (19.0%) | 0 (0.0%) |
| 35 to 64 Years | 13 (13.8%) | 27 (19.9%) |
| 65 to 74 Years | 8 (38.1%) | 13 (46.4%) |
| 75 Years and over | 0 (0.0%) | 5 (71.4%) |
Disability Class by Sex by Age in Allenhurst
Disability Class: Hearing Difficulty
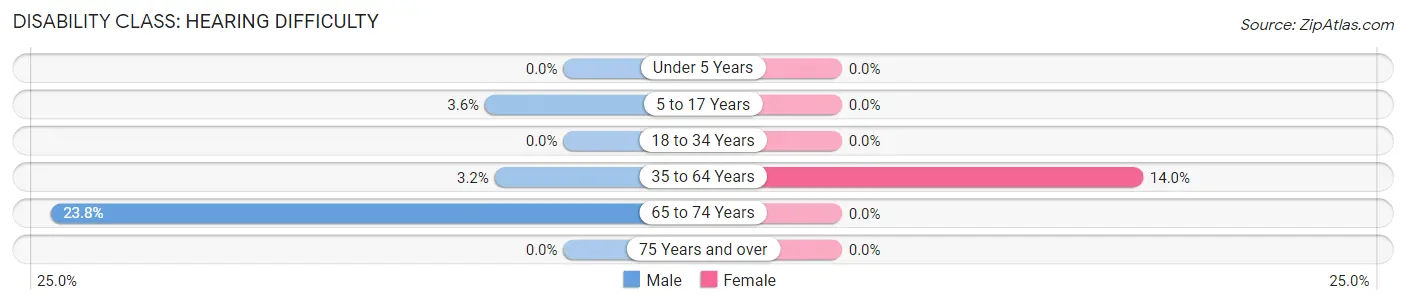
| Age Bracket | Male | Female |
| Under 5 Years | 0 (0.0%) | 0 (0.0%) |
| 5 to 17 Years | 2 (3.6%) | 0 (0.0%) |
| 18 to 34 Years | 0 (0.0%) | 0 (0.0%) |
| 35 to 64 Years | 3 (3.2%) | 19 (14.0%) |
| 65 to 74 Years | 5 (23.8%) | 0 (0.0%) |
| 75 Years and over | 0 (0.0%) | 0 (0.0%) |
Disability Class: Vision Difficulty
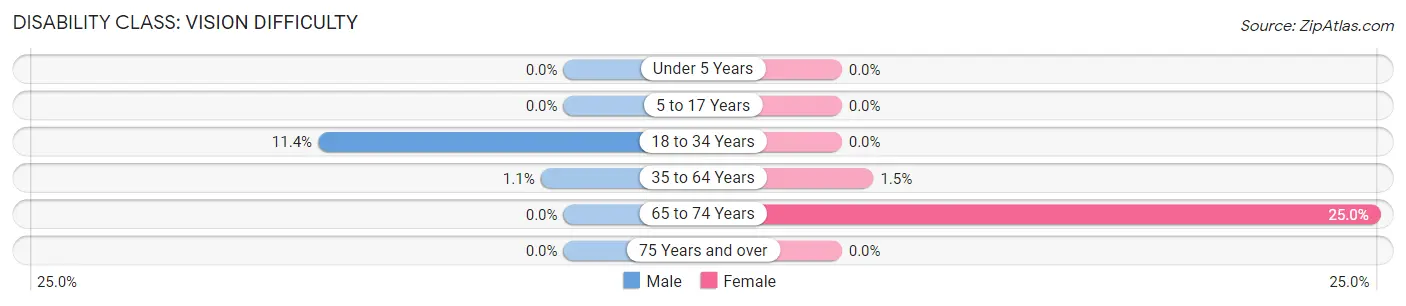
| Age Bracket | Male | Female |
| Under 5 Years | 0 (0.0%) | 0 (0.0%) |
| 5 to 17 Years | 0 (0.0%) | 0 (0.0%) |
| 18 to 34 Years | 9 (11.4%) | 0 (0.0%) |
| 35 to 64 Years | 1 (1.1%) | 2 (1.5%) |
| 65 to 74 Years | 0 (0.0%) | 7 (25.0%) |
| 75 Years and over | 0 (0.0%) | 0 (0.0%) |
Disability Class: Cognitive Difficulty
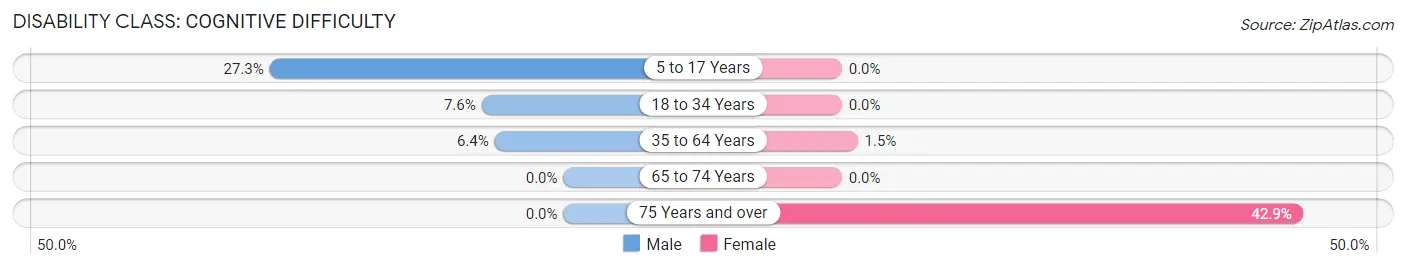
| Age Bracket | Male | Female |
| 5 to 17 Years | 15 (27.3%) | 0 (0.0%) |
| 18 to 34 Years | 6 (7.6%) | 0 (0.0%) |
| 35 to 64 Years | 6 (6.4%) | 2 (1.5%) |
| 65 to 74 Years | 0 (0.0%) | 0 (0.0%) |
| 75 Years and over | 0 (0.0%) | 3 (42.9%) |
Disability Class: Ambulatory Difficulty
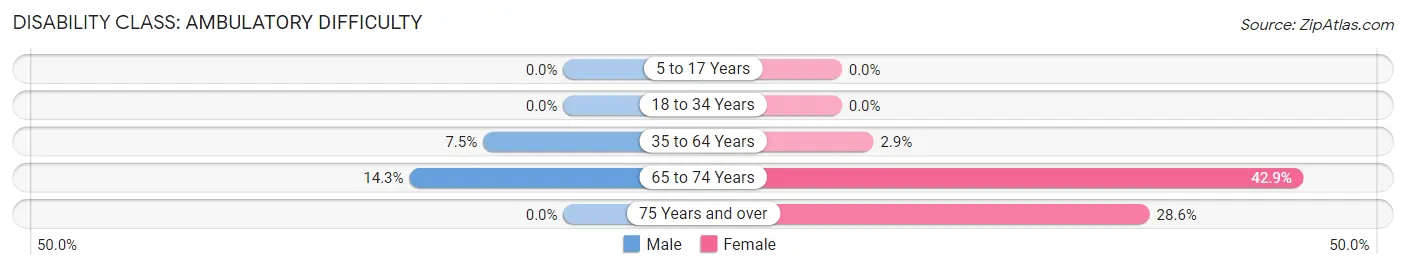
| Age Bracket | Male | Female |
| 5 to 17 Years | 0 (0.0%) | 0 (0.0%) |
| 18 to 34 Years | 0 (0.0%) | 0 (0.0%) |
| 35 to 64 Years | 7 (7.4%) | 4 (2.9%) |
| 65 to 74 Years | 3 (14.3%) | 12 (42.9%) |
| 75 Years and over | 0 (0.0%) | 2 (28.6%) |
Disability Class: Self-Care Difficulty
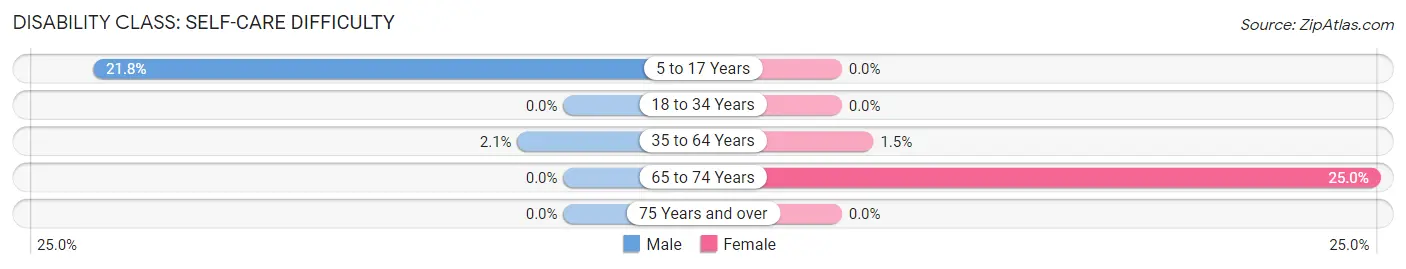
| Age Bracket | Male | Female |
| 5 to 17 Years | 12 (21.8%) | 0 (0.0%) |
| 18 to 34 Years | 0 (0.0%) | 0 (0.0%) |
| 35 to 64 Years | 2 (2.1%) | 2 (1.5%) |
| 65 to 74 Years | 0 (0.0%) | 7 (25.0%) |
| 75 Years and over | 0 (0.0%) | 0 (0.0%) |
Technology Access in Allenhurst
Computing Device Access in Allenhurst
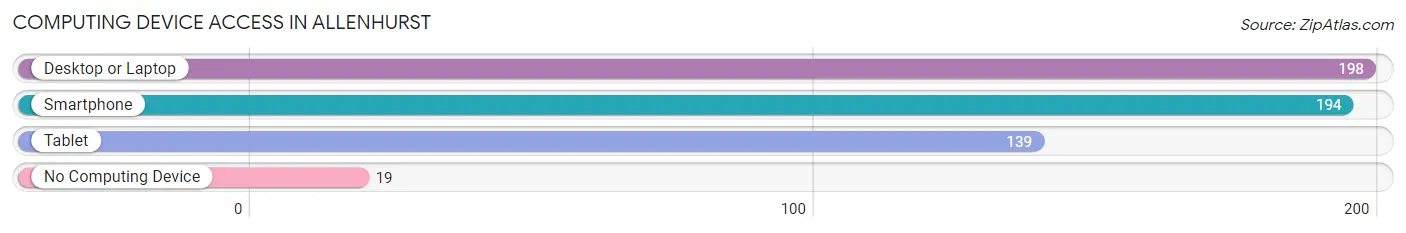
| Device Type | # Households | % Households |
| Desktop or Laptop | 198 | 86.1% |
| Smartphone | 194 | 84.4% |
| Tablet | 139 | 60.4% |
| No Computing Device | 19 | 8.3% |
| Total | 230 | 100.0% |
Internet Access in Allenhurst
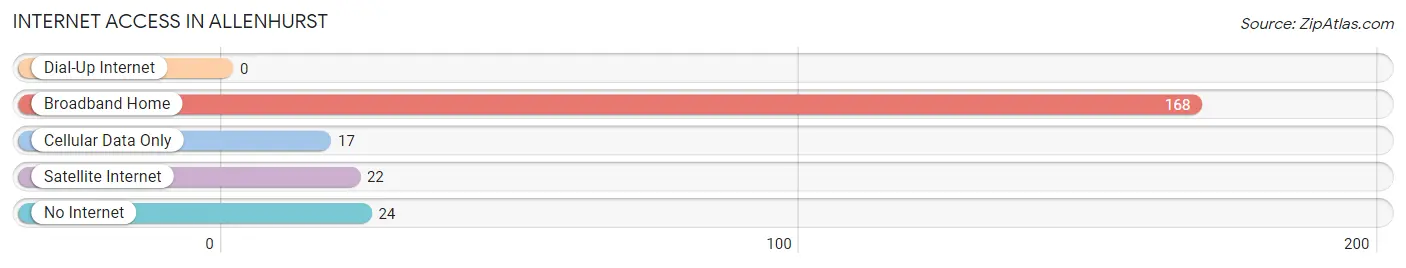
| Internet Type | # Households | % Households |
| Dial-Up Internet | 0 | 0.0% |
| Broadband Home | 168 | 73.0% |
| Cellular Data Only | 17 | 7.4% |
| Satellite Internet | 22 | 9.6% |
| No Internet | 24 | 10.4% |
| Total | 230 | 100.0% |
Allenhurst Summary
Allenhurst is a small city located in Liberty County, Georgia, United States. It is situated on the Atlantic coast, approximately 30 miles south of Savannah. The city has a population of 1,845 as of the 2010 census, and is part of the Hinesville-Fort Stewart metropolitan statistical area.
History
Allenhurst was founded in 1891 by the Allen family, who had purchased the land from the state of Georgia. The town was named after the family, and was incorporated in 1895. The town was originally a resort community, and was known for its large beachfront hotels and resorts.
In the early 1900s, the town began to experience a decline in tourism due to the Great Depression and World War II. The town was also affected by the Civil Rights Movement, and many of the hotels and resorts were closed or sold.
In the late 1960s, the town began to experience a resurgence in tourism, and the town was revitalized. The town was also home to a number of military bases, including Fort Stewart, which is located just outside of town.
Geography
Allenhurst is located in Liberty County, Georgia, on the Atlantic coast. The city is situated on the mainland, approximately 30 miles south of Savannah. The city has a total area of 1.3 square miles, all of which is land.
The city is bordered by the Atlantic Ocean to the east, and is located near the Ogeechee River. The city is also located near the cities of Hinesville and Richmond Hill.
Economy
The economy of Allenhurst is largely based on tourism and the military. The city is home to a number of military bases, including Fort Stewart, which is located just outside of town. The city is also home to a number of hotels and resorts, which attract tourists from all over the world.
The city is also home to a number of small businesses, including restaurants, retail stores, and other services. The city is also home to a number of manufacturing companies, which produce a variety of products, including furniture, clothing, and electronics.
Demographics
As of the 2010 census, Allenhurst had a population of 1,845. The racial makeup of the city was 79.2% White, 15.2% African American, 0.3% Native American, 0.7% Asian, 0.1% Pacific Islander, and 4.5% from other races. Hispanic or Latino of any race were 4.2% of the population.
The median income for a household in the city was $37,917, and the median income for a family was $45,625. The per capita income for the city was $19,945. About 11.2% of families and 14.2% of the population were below the poverty line, including 19.2% of those under age 18 and 8.2% of those age 65 or over.
Common Questions
What is Per Capita Income in Allenhurst?
Per Capita income in Allenhurst is $29,821.
What is the Median Family Income in Allenhurst?
Median Family Income in Allenhurst is $59,250.
What is the Median Household income in Allenhurst?
Median Household Income in Allenhurst is $51,667.
What is Income or Wage Gap in Allenhurst?
Income or Wage Gap in Allenhurst is 19.9%.
Women in Allenhurst earn 80.1 cents for every dollar earned by a man.
What is Inequality or Gini Index in Allenhurst?
Inequality or Gini Index in Allenhurst is 0.41.
What is the Total Population of Allenhurst?
Total Population of Allenhurst is 515.
What is the Total Male Population of Allenhurst?
Total Male Population of Allenhurst is 263.
What is the Total Female Population of Allenhurst?
Total Female Population of Allenhurst is 252.
What is the Ratio of Males per 100 Females in Allenhurst?
There are 104.37 Males per 100 Females in Allenhurst.
What is the Ratio of Females per 100 Males in Allenhurst?
There are 95.82 Females per 100 Males in Allenhurst.
What is the Median Population Age in Allenhurst?
Median Population Age in Allenhurst is 39.8 Years.
What is the Average Family Size in Allenhurst
Average Family Size in Allenhurst is 2.7 People.
What is the Average Household Size in Allenhurst
Average Household Size in Allenhurst is 2.2 People.
How Large is the Labor Force in Allenhurst?
There are 261 People in the Labor Forcein in Allenhurst.
What is the Percentage of People in the Labor Force in Allenhurst?
60.3% of People are in the Labor Force in Allenhurst.
What is the Unemployment Rate in Allenhurst?
Unemployment Rate in Allenhurst is 5.9%.