Covington, GA Map & Demographics
Covington Map
Covington Overview
$27,797
PER CAPITA INCOME
$64,353
AVG FAMILY INCOME
$47,278
AVG HOUSEHOLD INCOME
4.9%
WAGE / INCOME GAP [ % ]
95.1¢/ $1
WAGE / INCOME GAP [ $ ]
$13,215
FAMILY INCOME DEFICIT
0.44
INEQUALITY / GINI INDEX
14,190
TOTAL POPULATION
6,832
MALE POPULATION
7,358
FEMALE POPULATION
92.85
MALES / 100 FEMALES
107.70
FEMALES / 100 MALES
34.8
MEDIAN AGE
3.0
AVG FAMILY SIZE
2.5
AVG HOUSEHOLD SIZE
7,232
LABOR FORCE [ PEOPLE ]
64.5%
PERCENT IN LABOR FORCE
6.1%
UNEMPLOYMENT RATE
Income in Covington
Income Overview in Covington
Per Capita Income in Covington is $27,797, while median incomes of families and households are $64,353 and $47,278 respectively.
| Characteristic | Number | Measure |
| Per Capita Income | 14,190 | $27,797 |
| Median Family Income | 3,607 | $64,353 |
| Mean Family Income | 3,607 | $77,626 |
| Median Household Income | 5,481 | $47,278 |
| Mean Household Income | 5,481 | $69,394 |
| Income Deficit | 3,607 | $13,215 |
| Wage / Income Gap (%) | 14,190 | 4.86% |
| Wage / Income Gap ($) | 14,190 | 95.14¢ per $1 |
| Gini / Inequality Index | 14,190 | 0.44 |
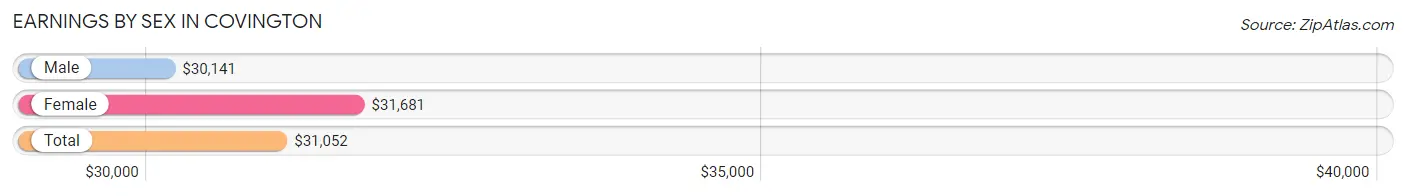
Earnings by Sex in Covington
Average Earnings in Covington are $31,052, $30,141 for men and $31,681 for women, a difference of 4.9%.
| Sex | Number | Average Earnings |
| Male | 3,753 (48.8%) | $30,141 |
| Female | 3,936 (51.2%) | $31,681 |
| Total | 7,689 (100.0%) | $31,052 |
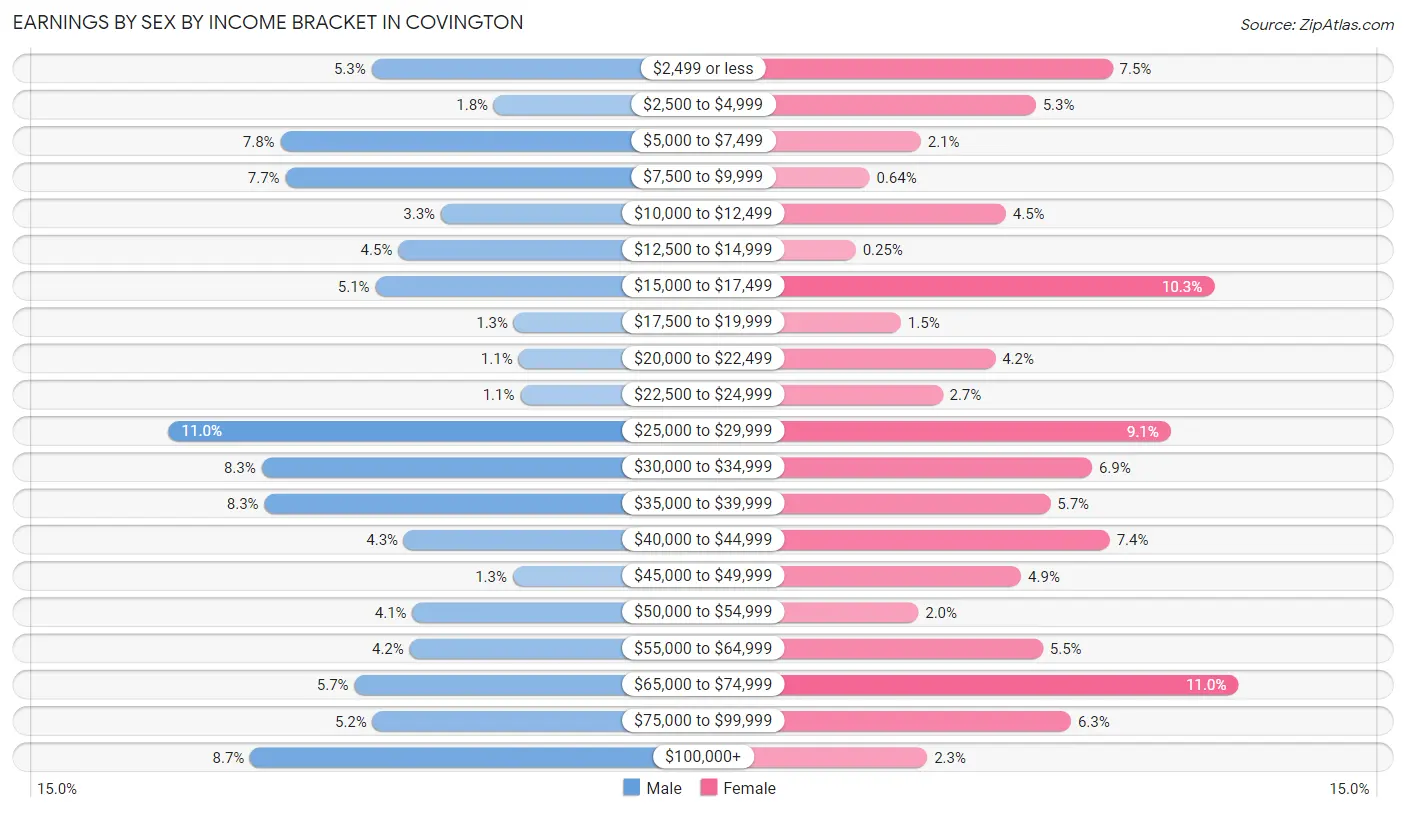
Earnings by Sex by Income Bracket in Covington
The most common earnings brackets in Covington are $25,000 to $29,999 for men (411 | 11.0%) and $65,000 to $74,999 for women (433 | 11.0%).
| Income | Male | Female |
| $2,499 or less | 197 (5.2%) | 294 (7.5%) |
| $2,500 to $4,999 | 68 (1.8%) | 209 (5.3%) |
| $5,000 to $7,499 | 293 (7.8%) | 82 (2.1%) |
| $7,500 to $9,999 | 288 (7.7%) | 25 (0.6%) |
| $10,000 to $12,499 | 124 (3.3%) | 176 (4.5%) |
| $12,500 to $14,999 | 169 (4.5%) | 10 (0.3%) |
| $15,000 to $17,499 | 193 (5.1%) | 406 (10.3%) |
| $17,500 to $19,999 | 47 (1.3%) | 60 (1.5%) |
| $20,000 to $22,499 | 42 (1.1%) | 164 (4.2%) |
| $22,500 to $24,999 | 40 (1.1%) | 106 (2.7%) |
| $25,000 to $29,999 | 411 (11.0%) | 358 (9.1%) |
| $30,000 to $34,999 | 313 (8.3%) | 271 (6.9%) |
| $35,000 to $39,999 | 310 (8.3%) | 225 (5.7%) |
| $40,000 to $44,999 | 163 (4.3%) | 291 (7.4%) |
| $45,000 to $49,999 | 48 (1.3%) | 193 (4.9%) |
| $50,000 to $54,999 | 154 (4.1%) | 79 (2.0%) |
| $55,000 to $64,999 | 157 (4.2%) | 217 (5.5%) |
| $65,000 to $74,999 | 215 (5.7%) | 433 (11.0%) |
| $75,000 to $99,999 | 196 (5.2%) | 248 (6.3%) |
| $100,000+ | 325 (8.7%) | 89 (2.3%) |
| Total | 3,753 (100.0%) | 3,936 (100.0%) |
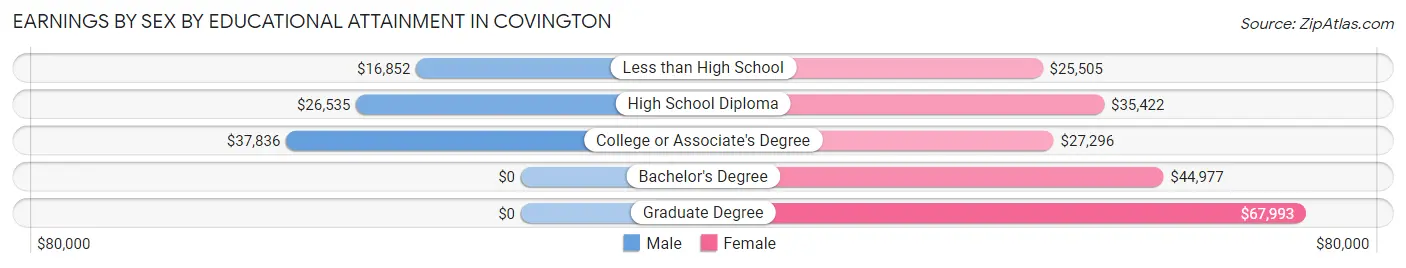
Earnings by Sex by Educational Attainment in Covington
Average earnings in Covington are $34,206 for men and $35,984 for women, a difference of 4.9%. Men with an educational attainment of college or associate's degree enjoy the highest average annual earnings of $37,836, while those with less than high school education earn the least with $16,852. Women with an educational attainment of graduate degree earn the most with the average annual earnings of $67,993, while those with less than high school education have the smallest earnings of $25,505.
| Educational Attainment | Male Income | Female Income |
| Less than High School | $16,852 | $25,505 |
| High School Diploma | $26,535 | $35,422 |
| College or Associate's Degree | $37,836 | $27,296 |
| Bachelor's Degree | - | - |
| Graduate Degree | - | - |
| Total | $34,206 | $35,984 |
Family Income in Covington
Family Income Brackets in Covington
According to the Covington family income data, there are 909 families falling into the $100,000 to $149,999 income range, which is the most common income bracket and makes up 25.2% of all families. Conversely, the $10,000 to $14,999 income bracket is the least frequent group with only 40 families (1.1%) belonging to this category.
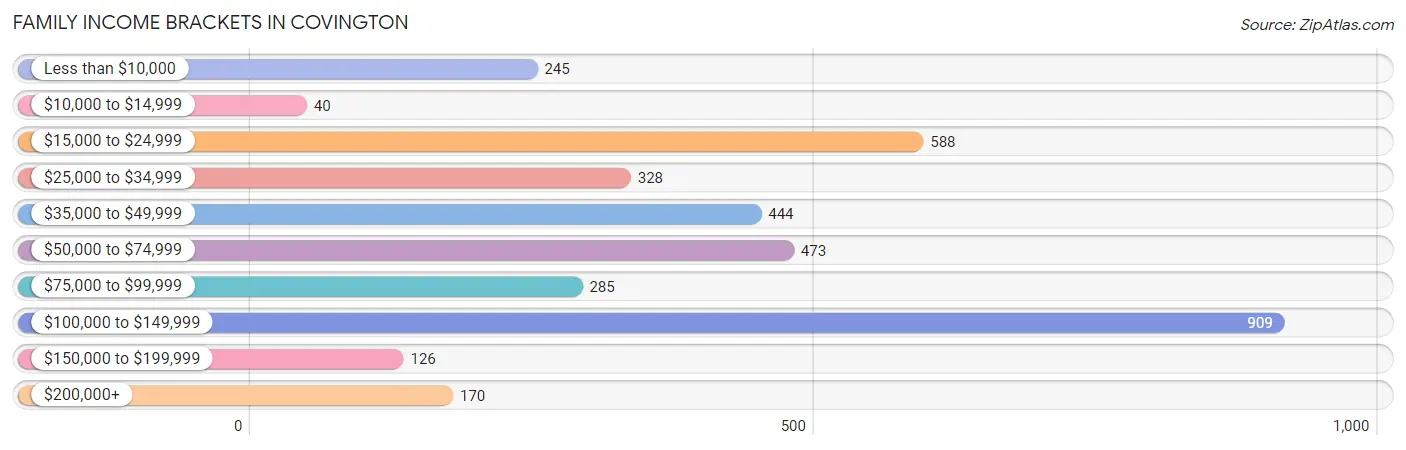
| Income Bracket | # Families | % Families |
| Less than $10,000 | 245 | 6.8% |
| $10,000 to $14,999 | 40 | 1.1% |
| $15,000 to $24,999 | 588 | 16.3% |
| $25,000 to $34,999 | 328 | 9.1% |
| $35,000 to $49,999 | 444 | 12.3% |
| $50,000 to $74,999 | 473 | 13.1% |
| $75,000 to $99,999 | 285 | 7.9% |
| $100,000 to $149,999 | 909 | 25.2% |
| $150,000 to $199,999 | 126 | 3.5% |
| $200,000+ | 170 | 4.7% |
Family Income by Famaliy Size in Covington
4-person families (424 | 11.7%) account for the highest median family income in Covington with $101,079 per family, while 4-person families (424 | 11.7%) have the highest median income of $25,270 per family member.
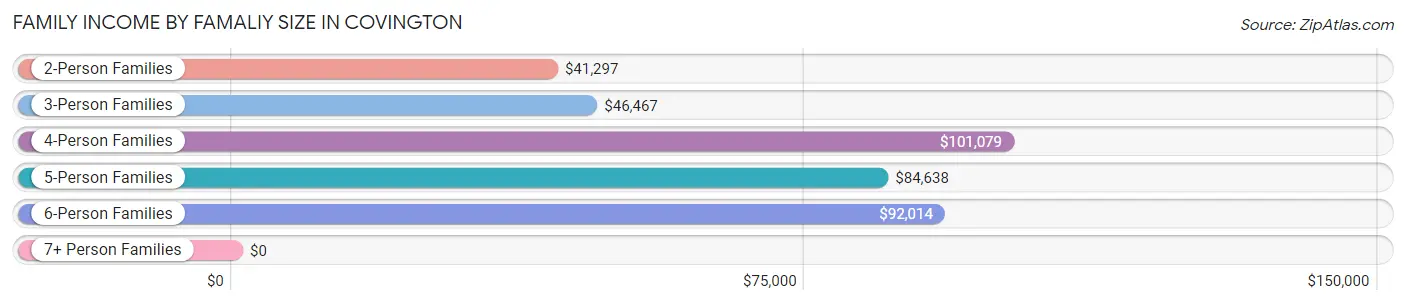
| Income Bracket | # Families | Median Income |
| 2-Person Families | 1,625 (45.1%) | $41,297 |
| 3-Person Families | 1,037 (28.7%) | $46,467 |
| 4-Person Families | 424 (11.7%) | $101,079 |
| 5-Person Families | 299 (8.3%) | $84,638 |
| 6-Person Families | 184 (5.1%) | $92,014 |
| 7+ Person Families | 38 (1.1%) | $0 |
| Total | 3,607 (100.0%) | $64,353 |
Family Income by Number of Earners in Covington
The median family income in Covington is $64,353, with families comprising 3+ earners (413) having the highest median family income of $101,932, while families with 1 earner (1,450) have the lowest median family income of $33,235, accounting for 11.5% and 40.2% of families, respectively.
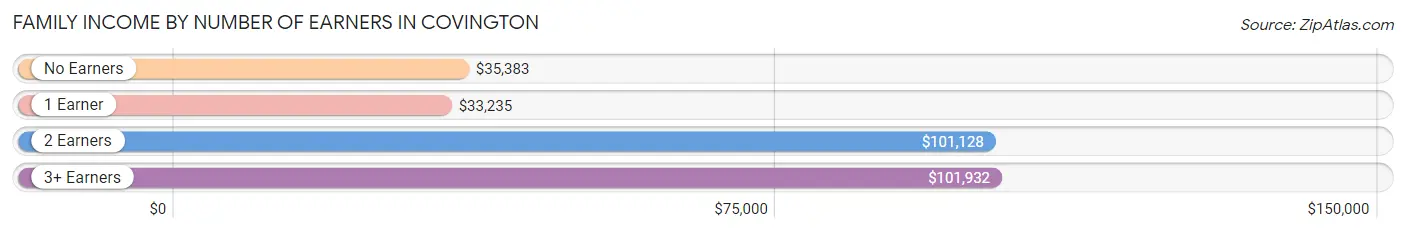
| Number of Earners | # Families | Median Income |
| No Earners | 501 (13.9%) | $35,383 |
| 1 Earner | 1,450 (40.2%) | $33,235 |
| 2 Earners | 1,243 (34.5%) | $101,128 |
| 3+ Earners | 413 (11.5%) | $101,932 |
| Total | 3,607 (100.0%) | $64,353 |
Household Income in Covington
Household Income Brackets in Covington
With 1,085 households falling in the category, the $100,000 to $149,999 income range is the most frequent in Covington, accounting for 19.8% of all households. In contrast, only 143 households (2.6%) fall into the $150,000 to $199,999 income bracket, making it the least populous group.
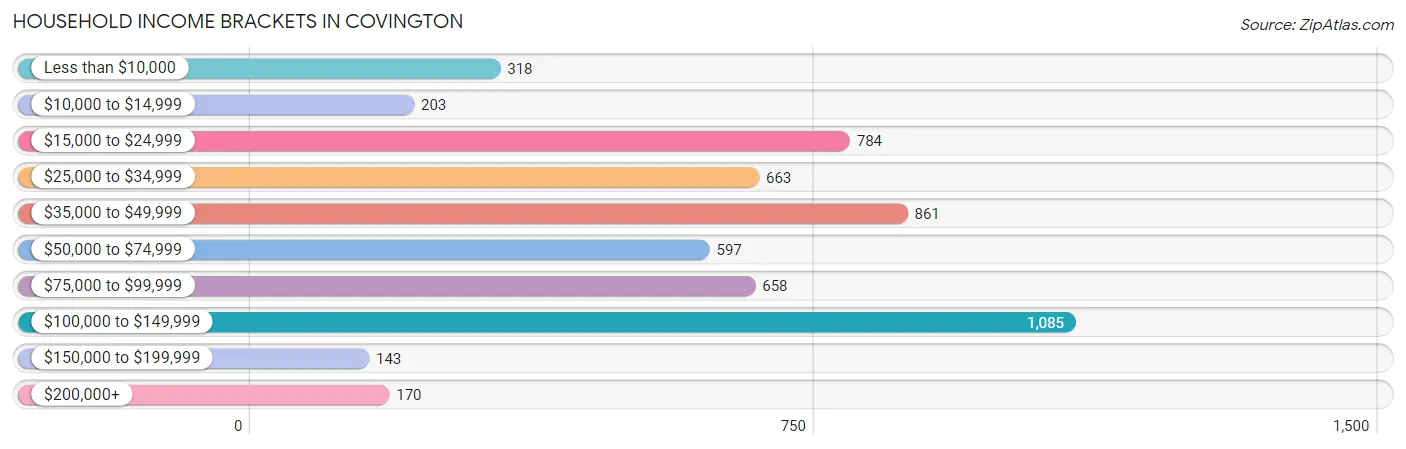
| Income Bracket | # Households | % Households |
| Less than $10,000 | 318 | 5.8% |
| $10,000 to $14,999 | 203 | 3.7% |
| $15,000 to $24,999 | 784 | 14.3% |
| $25,000 to $34,999 | 663 | 12.1% |
| $35,000 to $49,999 | 861 | 15.7% |
| $50,000 to $74,999 | 597 | 10.9% |
| $75,000 to $99,999 | 658 | 12.0% |
| $100,000 to $149,999 | 1,085 | 19.8% |
| $150,000 to $199,999 | 143 | 2.6% |
| $200,000+ | 170 | 3.1% |
Household Income by Householder Age in Covington
The median household income in Covington is $47,278, with the highest median household income of $77,975 found in the 45 to 64 years age bracket for the primary householder. A total of 1,677 households (30.6%) fall into this category. Meanwhile, the 15 to 24 years age bracket for the primary householder has the lowest median household income of $0, with 135 households (2.5%) in this group.
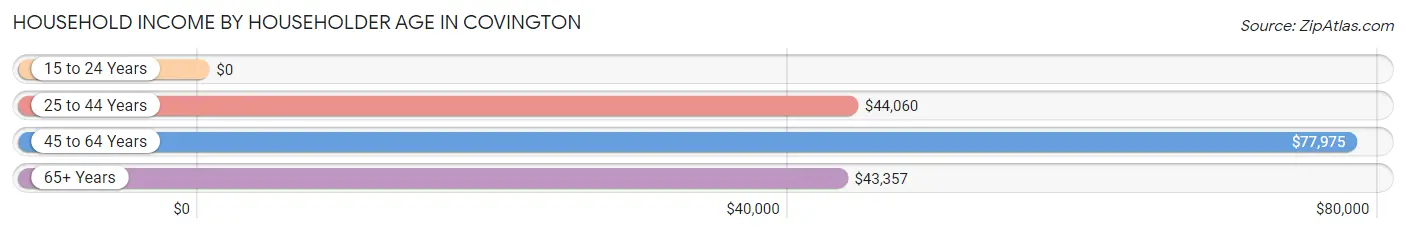
| Income Bracket | # Households | Median Income |
| 15 to 24 Years | 135 (2.5%) | $0 |
| 25 to 44 Years | 2,257 (41.2%) | $44,060 |
| 45 to 64 Years | 1,677 (30.6%) | $77,975 |
| 65+ Years | 1,412 (25.8%) | $43,357 |
| Total | 5,481 (100.0%) | $47,278 |
Poverty in Covington
Income Below Poverty by Sex and Age in Covington
With 19.1% poverty level for males and 21.7% for females among the residents of Covington, 15 year old males and 6 to 11 year old females are the most vulnerable to poverty, with 79 males (71.2%) and 229 females (62.6%) in their respective age groups living below the poverty level.
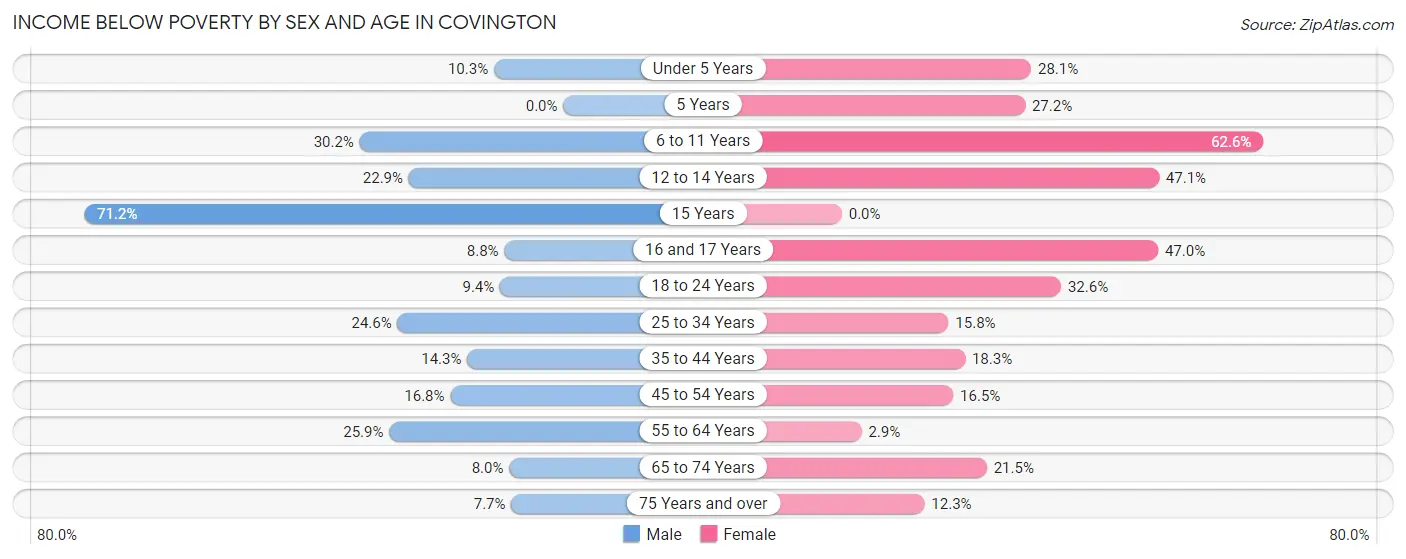
| Age Bracket | Male | Female |
| Under 5 Years | 38 (10.3%) | 129 (28.1%) |
| 5 Years | 0 (0.0%) | 34 (27.2%) |
| 6 to 11 Years | 235 (30.2%) | 229 (62.6%) |
| 12 to 14 Years | 100 (22.9%) | 89 (47.1%) |
| 15 Years | 79 (71.2%) | 0 (0.0%) |
| 16 and 17 Years | 23 (8.7%) | 100 (46.9%) |
| 18 to 24 Years | 55 (9.4%) | 193 (32.6%) |
| 25 to 34 Years | 242 (24.6%) | 199 (15.8%) |
| 35 to 44 Years | 93 (14.3%) | 171 (18.3%) |
| 45 to 54 Years | 148 (16.8%) | 170 (16.5%) |
| 55 to 64 Years | 137 (25.9%) | 20 (2.9%) |
| 65 to 74 Years | 38 (8.0%) | 133 (21.5%) |
| 75 Years and over | 21 (7.7%) | 67 (12.3%) |
| Total | 1,209 (19.1%) | 1,534 (21.7%) |
Income Above Poverty by Sex and Age in Covington
According to the poverty statistics in Covington, males aged 5 years and females aged 15 years are the age groups that are most secure financially, with 100.0% of males and 100.0% of females in these age groups living above the poverty line.
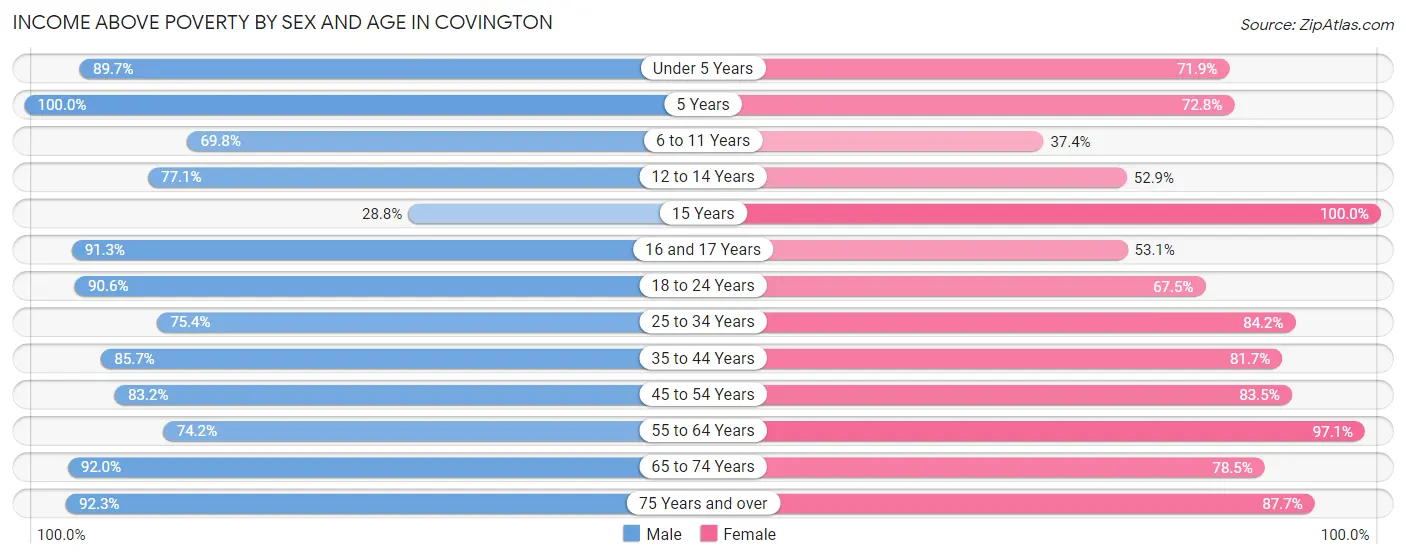
| Age Bracket | Male | Female |
| Under 5 Years | 331 (89.7%) | 330 (71.9%) |
| 5 Years | 9 (100.0%) | 91 (72.8%) |
| 6 to 11 Years | 542 (69.8%) | 137 (37.4%) |
| 12 to 14 Years | 336 (77.1%) | 100 (52.9%) |
| 15 Years | 32 (28.8%) | 41 (100.0%) |
| 16 and 17 Years | 240 (91.2%) | 113 (53.0%) |
| 18 to 24 Years | 531 (90.6%) | 400 (67.4%) |
| 25 to 34 Years | 741 (75.4%) | 1,058 (84.2%) |
| 35 to 44 Years | 559 (85.7%) | 764 (81.7%) |
| 45 to 54 Years | 734 (83.2%) | 858 (83.5%) |
| 55 to 64 Years | 393 (74.2%) | 666 (97.1%) |
| 65 to 74 Years | 435 (92.0%) | 485 (78.5%) |
| 75 Years and over | 251 (92.3%) | 479 (87.7%) |
| Total | 5,134 (80.9%) | 5,522 (78.3%) |
Income Below Poverty Among Married-Couple Families in Covington
The poverty statistics for married-couple families in Covington show that 4.2% or 77 of the total 1,820 families live below the poverty line. Families with 3 or 4 children have the highest poverty rate of 14.1%, comprising of 25 families. On the other hand, families with 1 or 2 children have the lowest poverty rate of 2.5%, which includes 17 families.
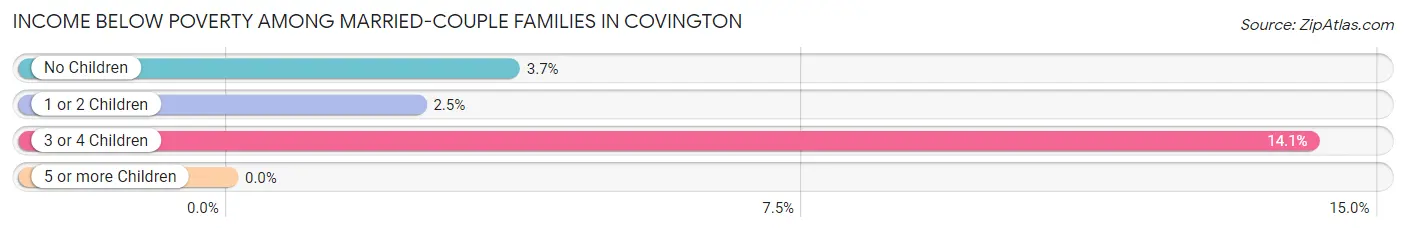
| Children | Above Poverty | Below Poverty |
| No Children | 916 (96.3%) | 35 (3.7%) |
| 1 or 2 Children | 675 (97.5%) | 17 (2.5%) |
| 3 or 4 Children | 152 (85.9%) | 25 (14.1%) |
| 5 or more Children | 0 (0.0%) | 0 (0.0%) |
| Total | 1,743 (95.8%) | 77 (4.2%) |
Income Below Poverty Among Single-Parent Households in Covington
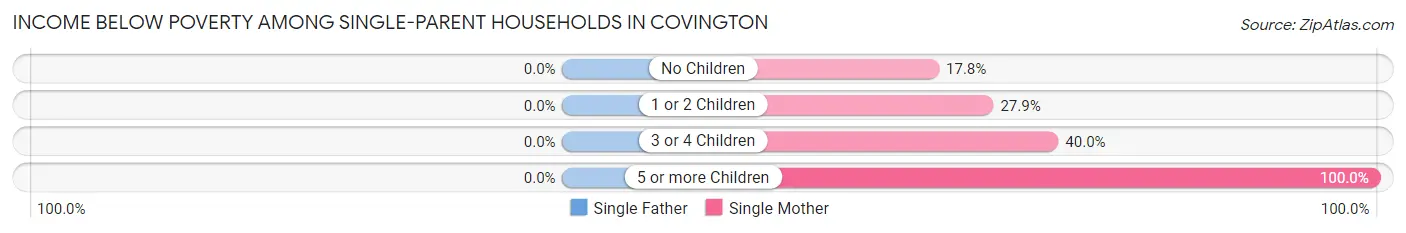
| Children | Single Father | Single Mother |
| No Children | 0 (0.0%) | 69 (17.8%) |
| 1 or 2 Children | 0 (0.0%) | 303 (27.9%) |
| 3 or 4 Children | 0 (0.0%) | 18 (40.0%) |
| 5 or more Children | 0 (0.0%) | 76 (100.0%) |
| Total | 0 (0.0%) | 466 (29.2%) |
Income Below Poverty Among Married-Couple vs Single-Parent Households in Covington
The poverty data for Covington shows that 77 of the married-couple family households (4.2%) and 466 of the single-parent households (26.1%) are living below the poverty level. Within the married-couple family households, those with 3 or 4 children have the highest poverty rate, with 25 households (14.1%) falling below the poverty line. Among the single-parent households, those with 5 or more children have the highest poverty rate, with 76 household (100.0%) living below poverty.
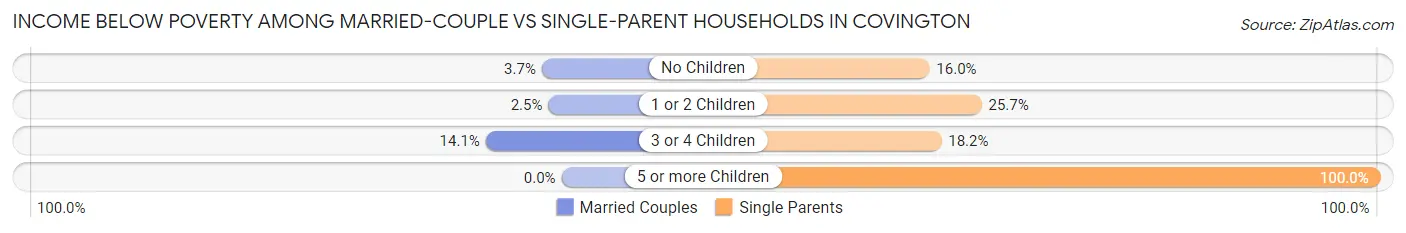
| Children | Married-Couple Families | Single-Parent Households |
| No Children | 35 (3.7%) | 69 (16.0%) |
| 1 or 2 Children | 17 (2.5%) | 303 (25.7%) |
| 3 or 4 Children | 25 (14.1%) | 18 (18.2%) |
| 5 or more Children | 0 (0.0%) | 76 (100.0%) |
| Total | 77 (4.2%) | 466 (26.1%) |
Race in Covington
The most populous races in Covington are Black / African American (7,062 | 49.8%), White / Caucasian (6,007 | 42.3%), and Hispanic or Latino (1,008 | 7.1%).
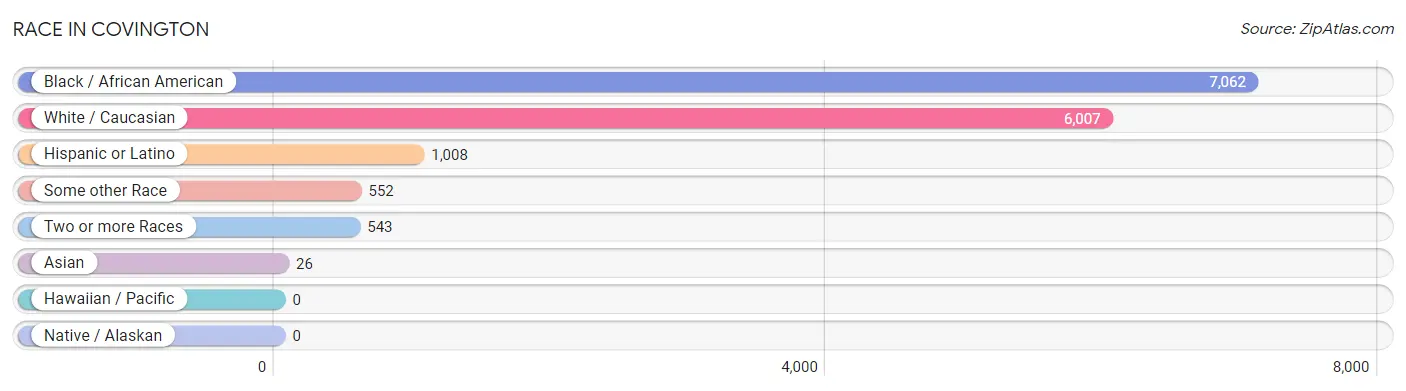
| Race | # Population | % Population |
| Asian | 26 | 0.2% |
| Black / African American | 7,062 | 49.8% |
| Hawaiian / Pacific | 0 | 0.0% |
| Hispanic or Latino | 1,008 | 7.1% |
| Native / Alaskan | 0 | 0.0% |
| White / Caucasian | 6,007 | 42.3% |
| Two or more Races | 543 | 3.8% |
| Some other Race | 552 | 3.9% |
| Total | 14,190 | 100.0% |
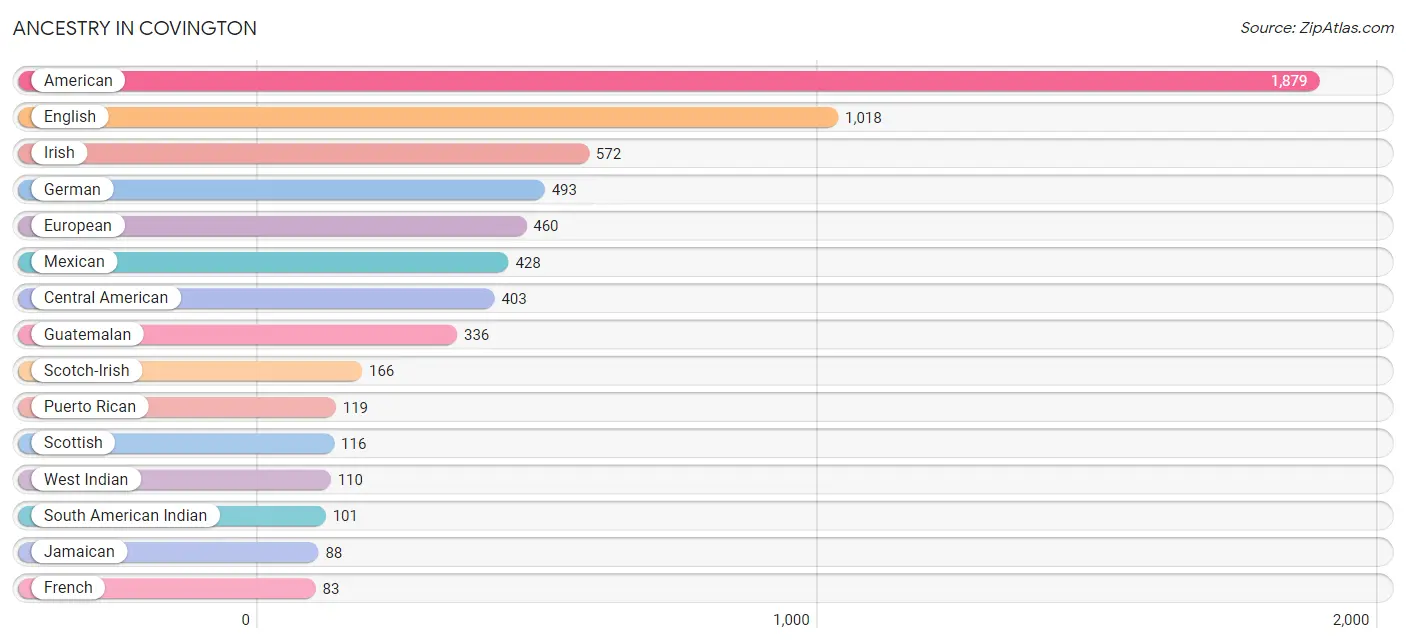
Ancestry in Covington
The most populous ancestries reported in Covington are American (1,879 | 13.2%), English (1,018 | 7.2%), Irish (572 | 4.0%), German (493 | 3.5%), and European (460 | 3.2%), together accounting for 31.1% of all Covington residents.
| Ancestry | # Population | % Population |
| African | 66 | 0.5% |
| American | 1,879 | 13.2% |
| Barbadian | 15 | 0.1% |
| Belgian | 6 | 0.0% |
| Belizean | 18 | 0.1% |
| Bhutanese | 9 | 0.1% |
| British | 61 | 0.4% |
| Bulgarian | 6 | 0.0% |
| Central American | 403 | 2.8% |
| Cherokee | 24 | 0.2% |
| Colombian | 7 | 0.1% |
| Cuban | 11 | 0.1% |
| Czech | 23 | 0.2% |
| Danish | 69 | 0.5% |
| Dominican | 18 | 0.1% |
| Dutch | 48 | 0.3% |
| English | 1,018 | 7.2% |
| European | 460 | 3.2% |
| French | 83 | 0.6% |
| French Canadian | 6 | 0.0% |
| German | 493 | 3.5% |
| Greek | 21 | 0.2% |
| Guatemalan | 336 | 2.4% |
| Honduran | 13 | 0.1% |
| Inupiat | 7 | 0.1% |
| Irish | 572 | 4.0% |
| Italian | 27 | 0.2% |
| Jamaican | 88 | 0.6% |
| Korean | 71 | 0.5% |
| Lithuanian | 6 | 0.0% |
| Mexican | 428 | 3.0% |
| Norwegian | 30 | 0.2% |
| Panamanian | 54 | 0.4% |
| Polish | 71 | 0.5% |
| Portuguese | 23 | 0.2% |
| Puerto Rican | 119 | 0.8% |
| Scandinavian | 10 | 0.1% |
| Scotch-Irish | 166 | 1.2% |
| Scottish | 116 | 0.8% |
| South American | 29 | 0.2% |
| South American Indian | 101 | 0.7% |
| Subsaharan African | 68 | 0.5% |
| Swedish | 22 | 0.2% |
| Thai | 26 | 0.2% |
| Tongan | 7 | 0.1% |
| Trinidadian and Tobagonian | 28 | 0.2% |
| Ugandan | 2 | 0.0% |
| Ukrainian | 16 | 0.1% |
| Venezuelan | 22 | 0.2% |
| Welsh | 36 | 0.3% |
| West Indian | 110 | 0.8% | View All 51 Rows |
Immigrants in Covington
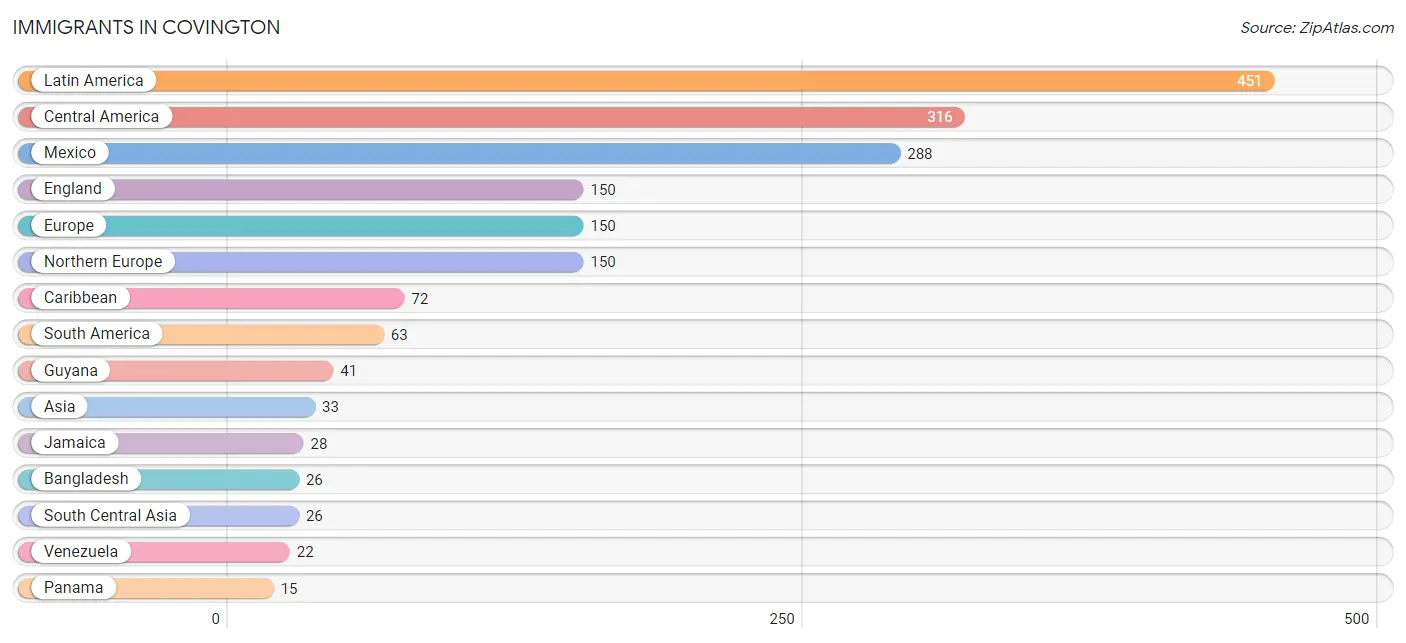
The most numerous immigrant groups reported in Covington came from Latin America (451 | 3.2%), Central America (316 | 2.2%), Mexico (288 | 2.0%), England (150 | 1.1%), and Europe (150 | 1.1%), together accounting for 9.6% of all Covington residents.
| Immigration Origin | # Population | % Population |
| Asia | 33 | 0.2% |
| Bangladesh | 26 | 0.2% |
| Caribbean | 72 | 0.5% |
| Central America | 316 | 2.2% |
| Cuba | 11 | 0.1% |
| England | 150 | 1.1% |
| Europe | 150 | 1.1% |
| Guyana | 41 | 0.3% |
| Haiti | 7 | 0.1% |
| Honduras | 13 | 0.1% |
| Jamaica | 28 | 0.2% |
| Latin America | 451 | 3.2% |
| Lebanon | 7 | 0.1% |
| Mexico | 288 | 2.0% |
| Northern Europe | 150 | 1.1% |
| Panama | 15 | 0.1% |
| South America | 63 | 0.4% |
| South Central Asia | 26 | 0.2% |
| Venezuela | 22 | 0.2% |
| Western Asia | 7 | 0.1% | View All 20 Rows |
Sex and Age in Covington
Sex and Age in Covington
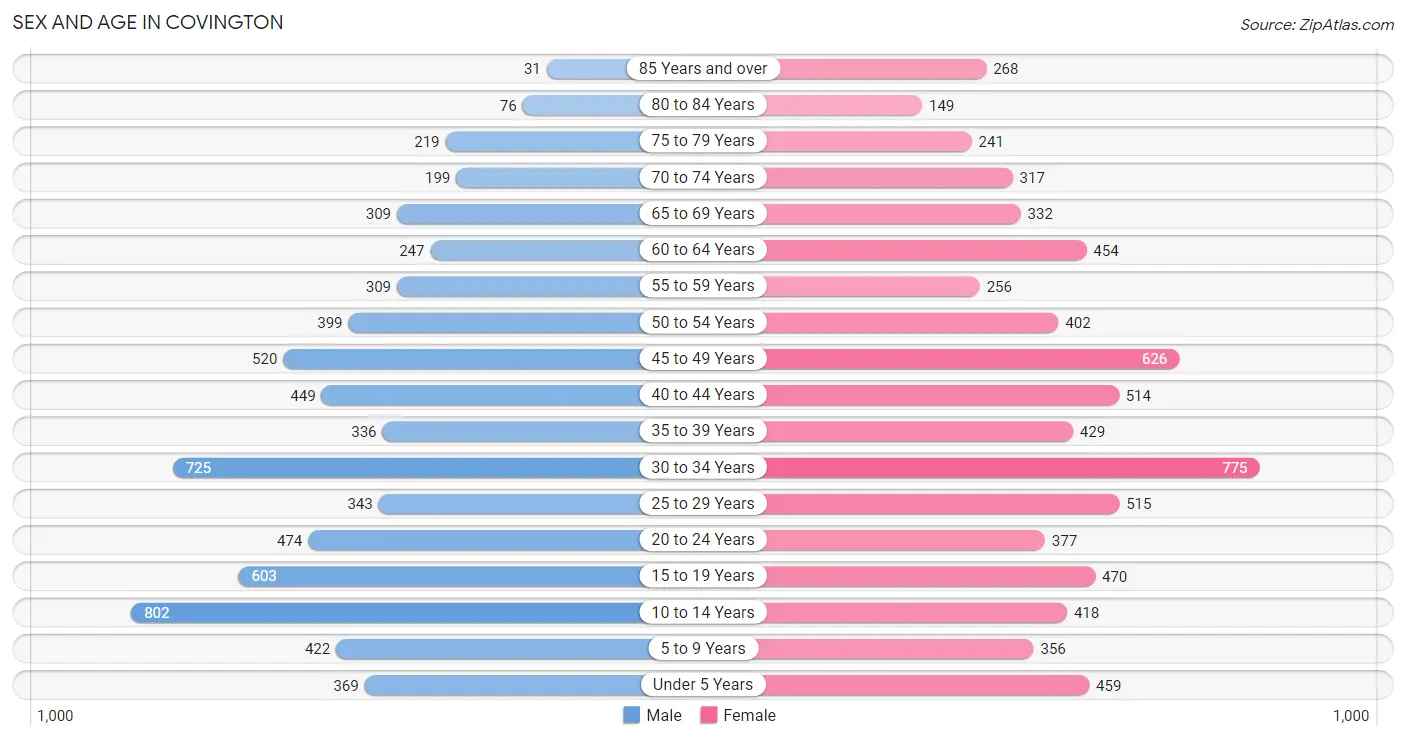
The most populous age groups in Covington are 10 to 14 Years (802 | 11.7%) for men and 30 to 34 Years (775 | 10.5%) for women.
| Age Bracket | Male | Female |
| Under 5 Years | 369 (5.4%) | 459 (6.2%) |
| 5 to 9 Years | 422 (6.2%) | 356 (4.8%) |
| 10 to 14 Years | 802 (11.7%) | 418 (5.7%) |
| 15 to 19 Years | 603 (8.8%) | 470 (6.4%) |
| 20 to 24 Years | 474 (6.9%) | 377 (5.1%) |
| 25 to 29 Years | 343 (5.0%) | 515 (7.0%) |
| 30 to 34 Years | 725 (10.6%) | 775 (10.5%) |
| 35 to 39 Years | 336 (4.9%) | 429 (5.8%) |
| 40 to 44 Years | 449 (6.6%) | 514 (7.0%) |
| 45 to 49 Years | 520 (7.6%) | 626 (8.5%) |
| 50 to 54 Years | 399 (5.8%) | 402 (5.5%) |
| 55 to 59 Years | 309 (4.5%) | 256 (3.5%) |
| 60 to 64 Years | 247 (3.6%) | 454 (6.2%) |
| 65 to 69 Years | 309 (4.5%) | 332 (4.5%) |
| 70 to 74 Years | 199 (2.9%) | 317 (4.3%) |
| 75 to 79 Years | 219 (3.2%) | 241 (3.3%) |
| 80 to 84 Years | 76 (1.1%) | 149 (2.0%) |
| 85 Years and over | 31 (0.4%) | 268 (3.6%) |
| Total | 6,832 (100.0%) | 7,358 (100.0%) |
Families and Households in Covington
Median Family Size in Covington
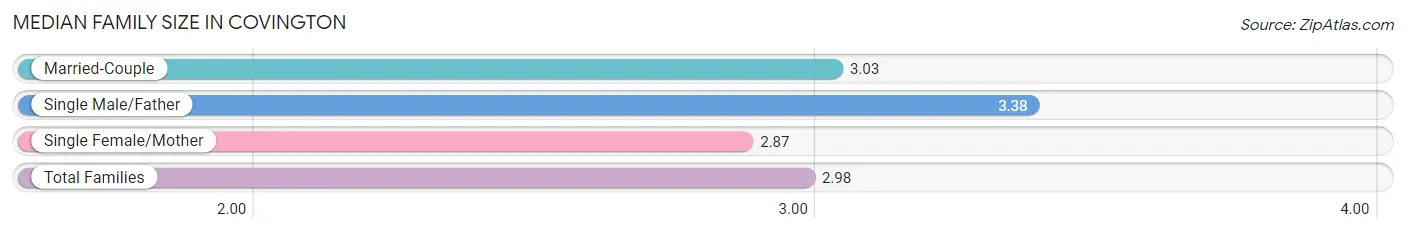
The median family size in Covington is 2.98 persons per family, with single male/father families (192 | 5.3%) accounting for the largest median family size of 3.38 persons per family. On the other hand, single female/mother families (1,595 | 44.2%) represent the smallest median family size with 2.87 persons per family.
| Family Type | # Families | Family Size |
| Married-Couple | 1,820 (50.5%) | 3.03 |
| Single Male/Father | 192 (5.3%) | 3.38 |
| Single Female/Mother | 1,595 (44.2%) | 2.87 |
| Total Families | 3,607 (100.0%) | 2.98 |
Median Household Size in Covington
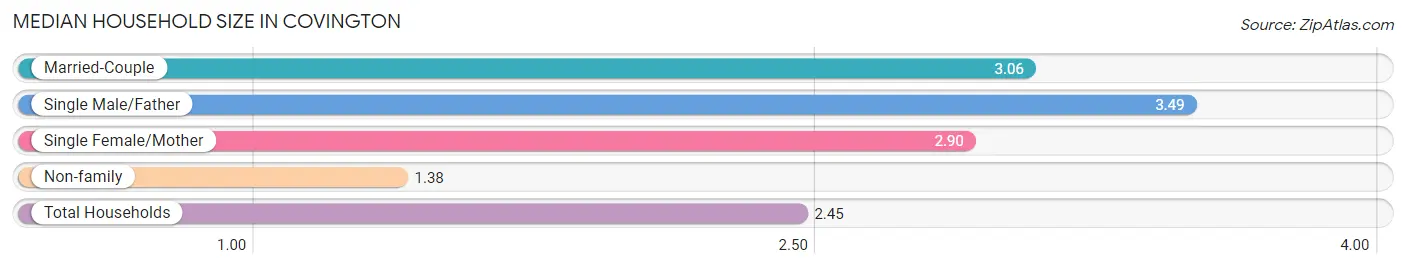
The median household size in Covington is 2.45 persons per household, with single male/father households (192 | 3.5%) accounting for the largest median household size of 3.49 persons per household. non-family households (1,874 | 34.2%) represent the smallest median household size with 1.38 persons per household.
| Household Type | # Households | Household Size |
| Married-Couple | 1,820 (33.2%) | 3.06 |
| Single Male/Father | 192 (3.5%) | 3.49 |
| Single Female/Mother | 1,595 (29.1%) | 2.90 |
| Non-family | 1,874 (34.2%) | 1.38 |
| Total Households | 5,481 (100.0%) | 2.45 |
Household Size by Marriage Status in Covington
Out of a total of 5,481 households in Covington, 3,607 (65.8%) are family households, while 1,874 (34.2%) are nonfamily households. The most numerous type of family households are 2-person households, comprising 1,567, and the most common type of nonfamily households are 1-person households, comprising 1,481.
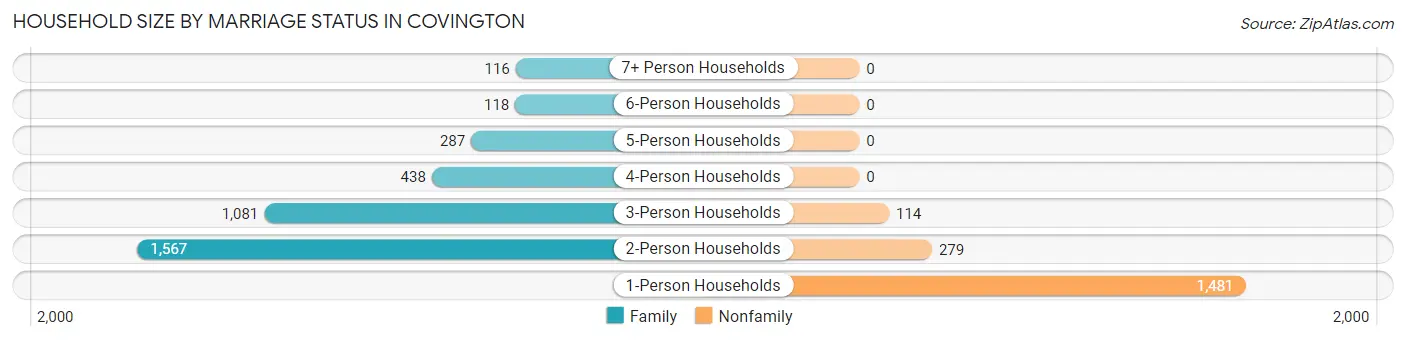
| Household Size | Family Households | Nonfamily Households |
| 1-Person Households | - | 1,481 (27.0%) |
| 2-Person Households | 1,567 (28.6%) | 279 (5.1%) |
| 3-Person Households | 1,081 (19.7%) | 114 (2.1%) |
| 4-Person Households | 438 (8.0%) | 0 (0.0%) |
| 5-Person Households | 287 (5.2%) | 0 (0.0%) |
| 6-Person Households | 118 (2.1%) | 0 (0.0%) |
| 7+ Person Households | 116 (2.1%) | 0 (0.0%) |
| Total | 3,607 (65.8%) | 1,874 (34.2%) |
Female Fertility in Covington
Fertility by Age in Covington
Average fertility rate in Covington is 61.0 births per 1,000 women. Women in the age bracket of 20 to 34 years have the highest fertility rate with 67.0 births per 1,000 women. Women in the age bracket of 20 to 34 years acount for 49.1% of all women with births.
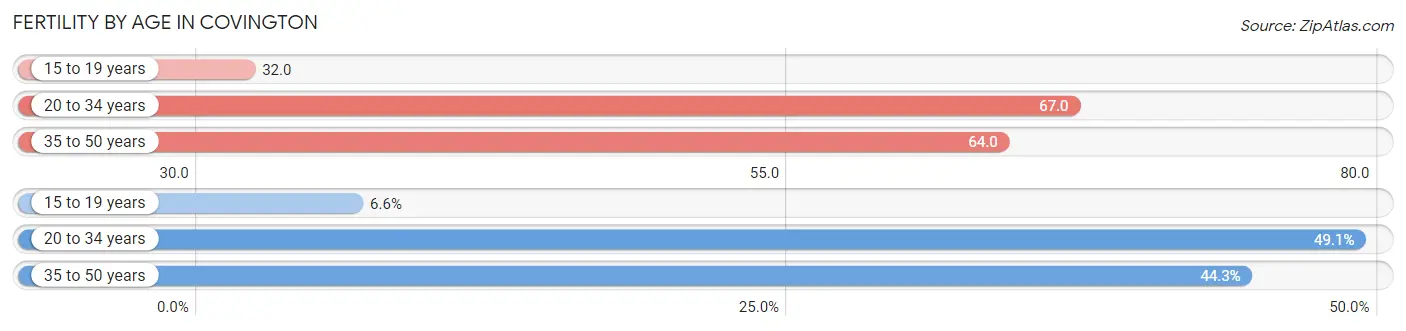
| Age Bracket | Women with Births | Births / 1,000 Women |
| 15 to 19 years | 15 (6.6%) | 32.0 |
| 20 to 34 years | 112 (49.1%) | 67.0 |
| 35 to 50 years | 101 (44.3%) | 64.0 |
| Total | 228 (100.0%) | 61.0 |
Fertility by Age by Marriage Status in Covington
30.3% of women with births (228) in Covington are married. The highest percentage of unmarried women with births falls into 15 to 19 years age bracket with 100.0% of them unmarried at the time of birth, while the lowest percentage of unmarried women with births belong to 20 to 34 years age bracket with 38.4% of them unmarried.
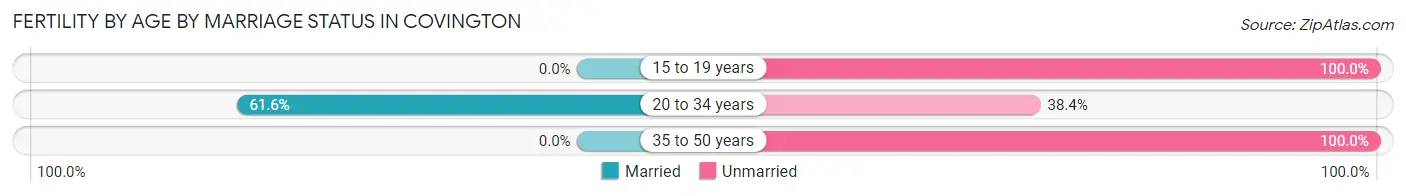
| Age Bracket | Married | Unmarried |
| 15 to 19 years | 0 (0.0%) | 15 (100.0%) |
| 20 to 34 years | 69 (61.6%) | 43 (38.4%) |
| 35 to 50 years | 0 (0.0%) | 101 (100.0%) |
| Total | 69 (30.3%) | 159 (69.7%) |
Fertility by Education in Covington
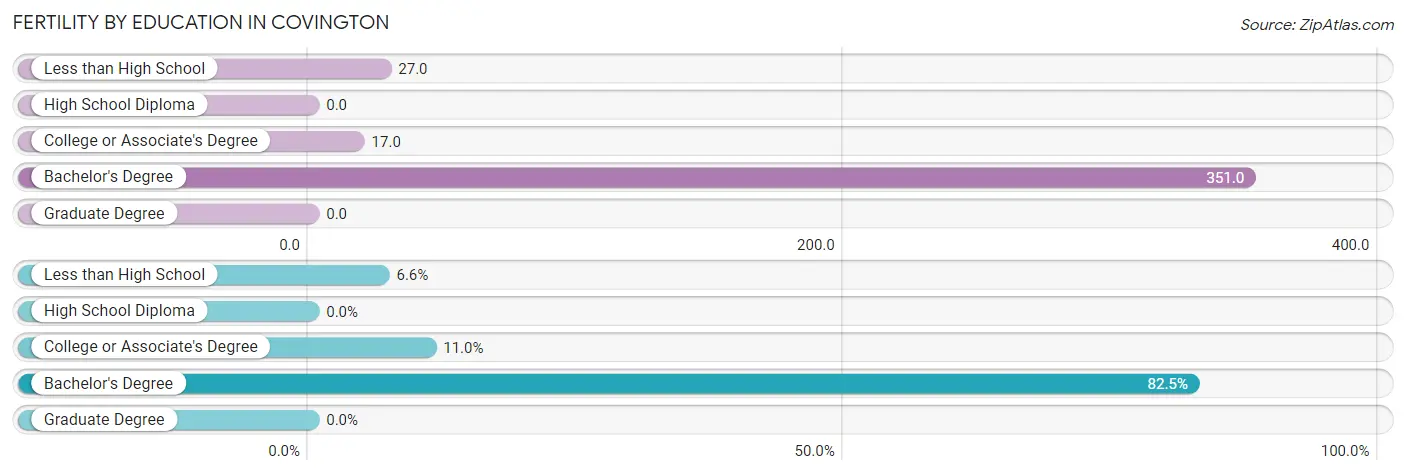
| Educational Attainment | Women with Births | Births / 1,000 Women |
| Less than High School | 15 (6.6%) | 27.0 |
| High School Diploma | 0 (0.0%) | 0.0 |
| College or Associate's Degree | 25 (11.0%) | 17.0 |
| Bachelor's Degree | 188 (82.5%) | 351.0 |
| Graduate Degree | 0 (0.0%) | 0.0 |
| Total | 228 (100.0%) | 61.0 |
Fertility by Education by Marriage Status in Covington
69.7% of women with births in Covington are unmarried. Women with the educational attainment of college or associate's degree are most likely to be married with 100.0% of them married at childbirth, while women with the educational attainment of less than high school are least likely to be married with 100.0% of them unmarried at childbirth.
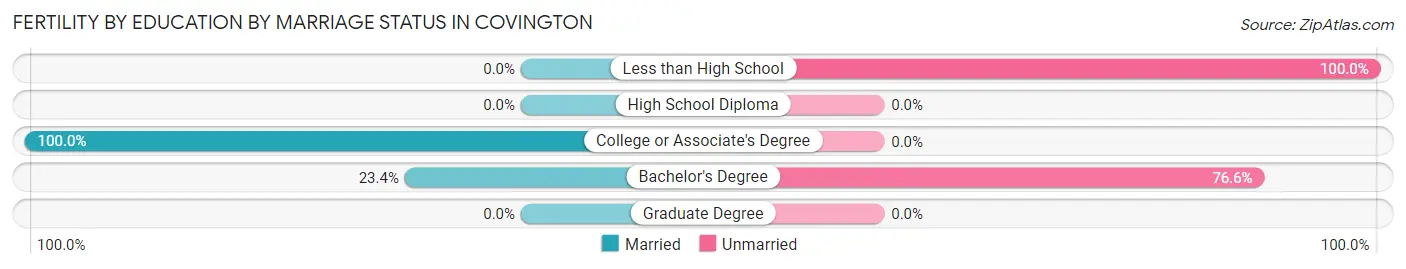
| Educational Attainment | Married | Unmarried |
| Less than High School | 0 (0.0%) | 15 (100.0%) |
| High School Diploma | 0 (0.0%) | 0 (0.0%) |
| College or Associate's Degree | 25 (100.0%) | 0 (0.0%) |
| Bachelor's Degree | 44 (23.4%) | 144 (76.6%) |
| Graduate Degree | 0 (0.0%) | 0 (0.0%) |
| Total | 69 (30.3%) | 159 (69.7%) |
Employment Characteristics in Covington
Employment by Class of Employer in Covington
Among the 6,619 employed individuals in Covington, private company employees (4,465 | 67.5%), local government employees (777 | 11.7%), and not-for-profit organizations (380 | 5.7%) make up the most common classes of employment.
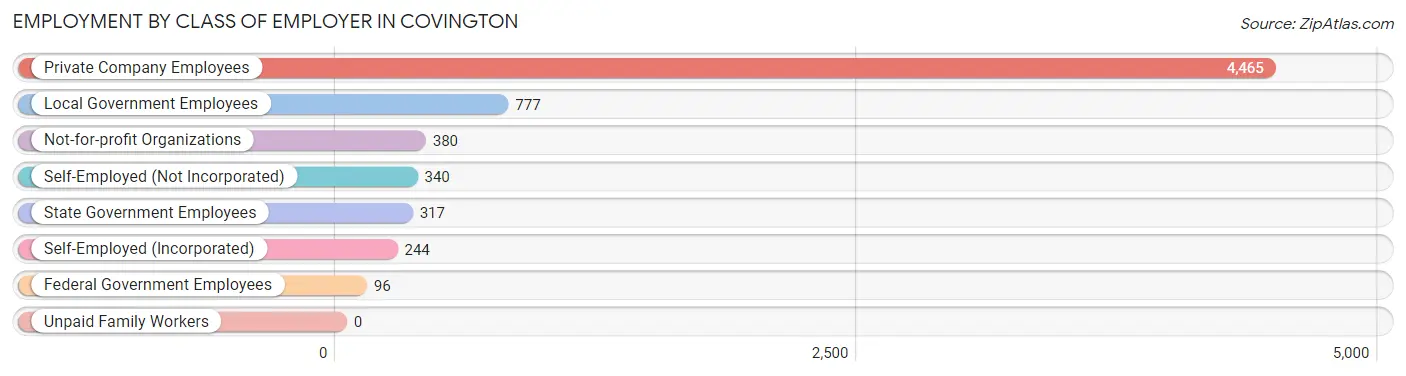
| Employer Class | # Employees | % Employees |
| Private Company Employees | 4,465 | 67.5% |
| Self-Employed (Incorporated) | 244 | 3.7% |
| Self-Employed (Not Incorporated) | 340 | 5.1% |
| Not-for-profit Organizations | 380 | 5.7% |
| Local Government Employees | 777 | 11.7% |
| State Government Employees | 317 | 4.8% |
| Federal Government Employees | 96 | 1.5% |
| Unpaid Family Workers | 0 | 0.0% |
| Total | 6,619 | 100.0% |
Employment Status by Age in Covington
According to the labor force statistics for Covington, out of the total population over 16 years of age (11,212), 64.5% or 7,232 individuals are in the labor force, with 6.1% or 441 of them unemployed. The age group with the highest labor force participation rate is 30 to 34 years, with 90.1% or 1,352 individuals in the labor force. Within the labor force, the 30 to 34 years age range has the highest percentage of unemployed individuals, with 18.1% or 245 of them being unemployed.
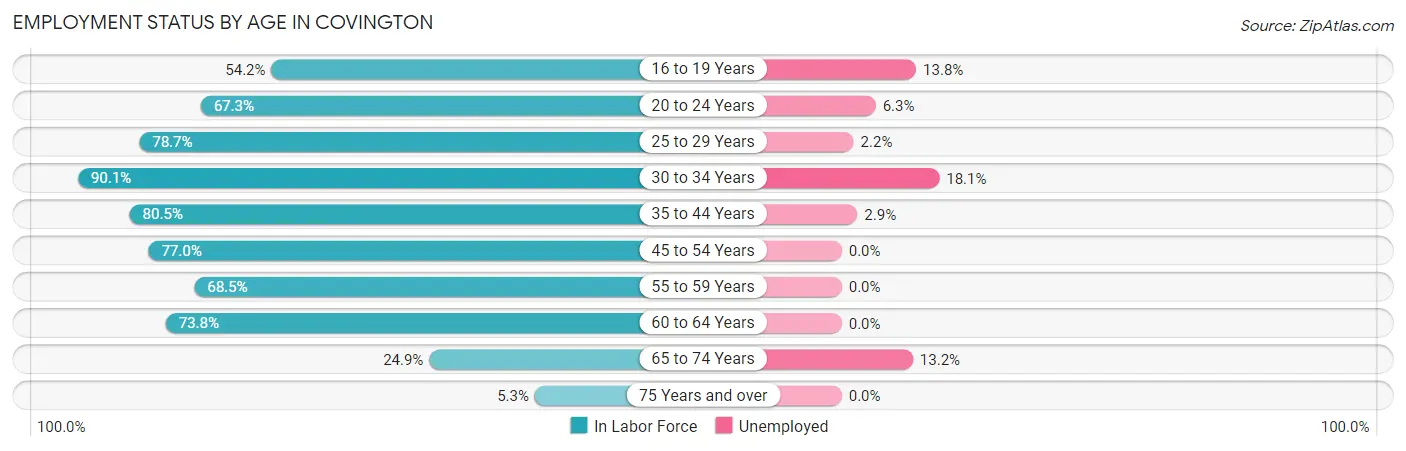
| Age Bracket | In Labor Force | Unemployed |
| 16 to 19 Years | 499 (54.2%) | 69 (13.8%) |
| 20 to 24 Years | 573 (67.3%) | 36 (6.3%) |
| 25 to 29 Years | 675 (78.7%) | 15 (2.2%) |
| 30 to 34 Years | 1,352 (90.1%) | 245 (18.1%) |
| 35 to 44 Years | 1,391 (80.5%) | 40 (2.9%) |
| 45 to 54 Years | 1,499 (77.0%) | 0 (0.0%) |
| 55 to 59 Years | 387 (68.5%) | 0 (0.0%) |
| 60 to 64 Years | 517 (73.8%) | 0 (0.0%) |
| 65 to 74 Years | 288 (24.9%) | 38 (13.2%) |
| 75 Years and over | 52 (5.3%) | 0 (0.0%) |
| Total | 7,232 (64.5%) | 441 (6.1%) |
Employment Status by Educational Attainment in Covington
According to labor force statistics for Covington, 79.8% of individuals (5,825) out of the total population between 25 and 64 years of age (7,299) are in the labor force, with 5.1% or 297 of them being unemployed. The group with the highest labor force participation rate are those with the educational attainment of college / associate degree, with 86.5% or 2,389 individuals in the labor force. Within the labor force, individuals with less than high school education have the highest percentage of unemployment, with 21.1% or 40 of them being unemployed.
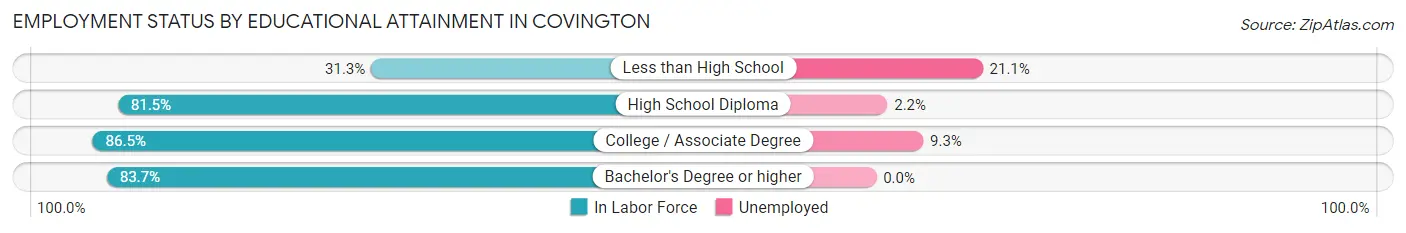
| Educational Attainment | In Labor Force | Unemployed |
| Less than High School | 190 (31.3%) | 128 (21.1%) |
| High School Diploma | 1,663 (81.5%) | 45 (2.2%) |
| College / Associate Degree | 2,389 (86.5%) | 257 (9.3%) |
| Bachelor's Degree or higher | 1,582 (83.7%) | 0 (0.0%) |
| Total | 5,825 (79.8%) | 372 (5.1%) |
Employment Occupations by Sex in Covington
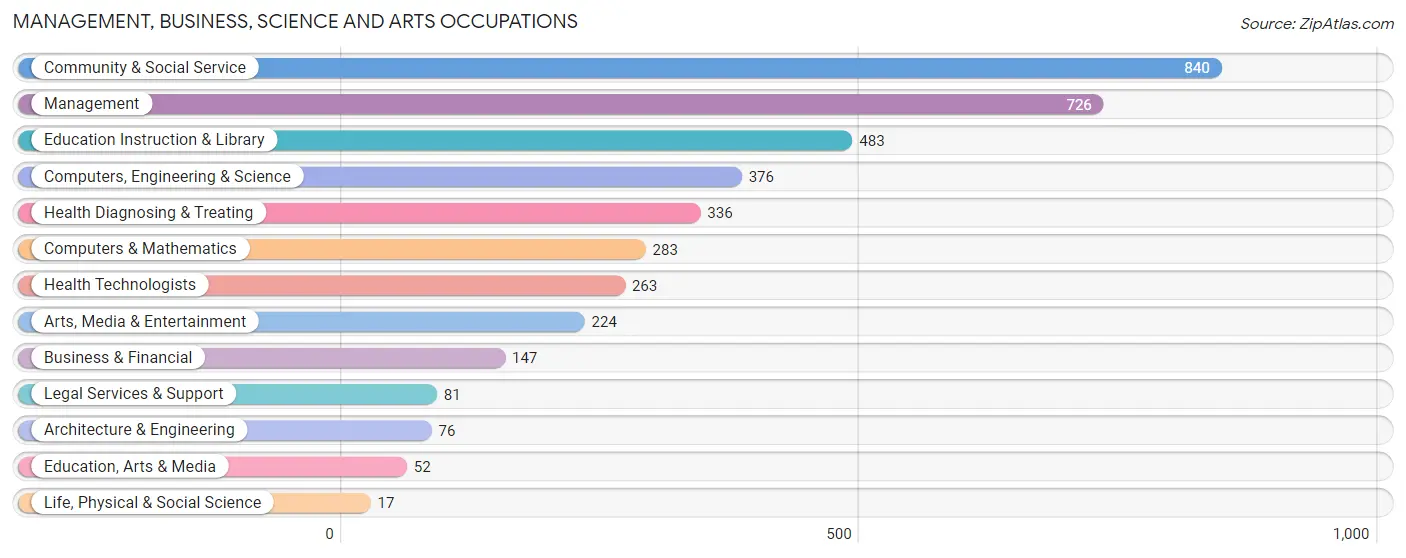
Management, Business, Science and Arts Occupations
The most common Management, Business, Science and Arts occupations in Covington are Community & Social Service (840 | 12.4%), Management (726 | 10.7%), Education Instruction & Library (483 | 7.1%), Computers, Engineering & Science (376 | 5.6%), and Health Diagnosing & Treating (336 | 5.0%).
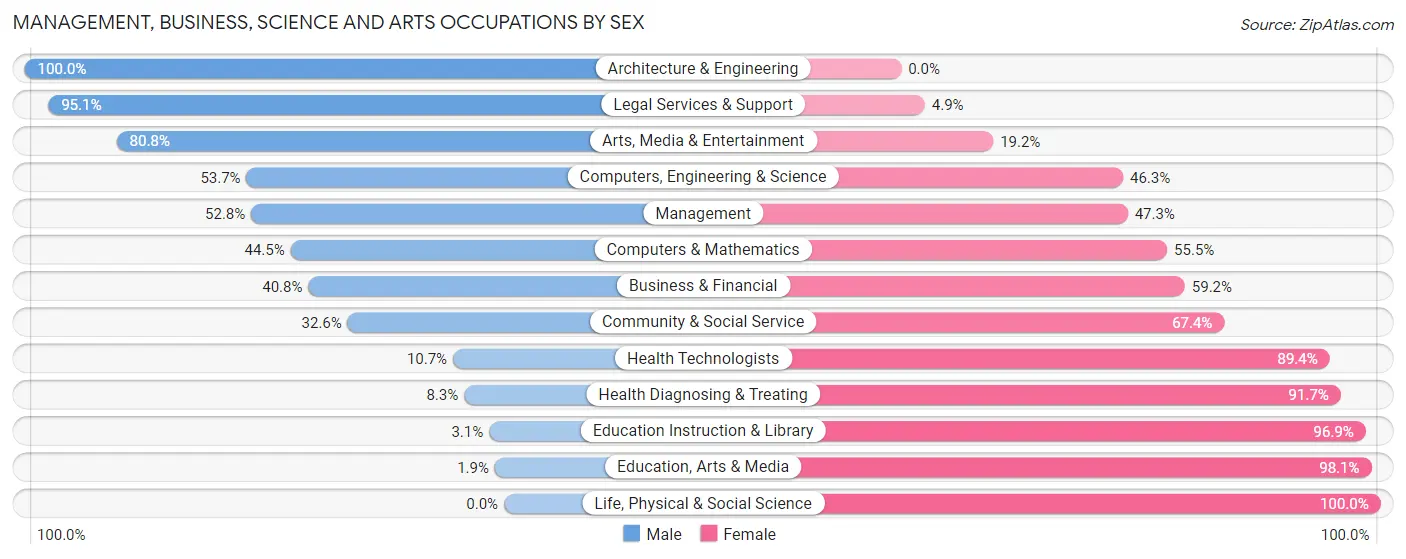
Management, Business, Science and Arts Occupations by Sex
Within the Management, Business, Science and Arts occupations in Covington, the most male-oriented occupations are Architecture & Engineering (100.0%), Legal Services & Support (95.1%), and Arts, Media & Entertainment (80.8%), while the most female-oriented occupations are Life, Physical & Social Science (100.0%), Education, Arts & Media (98.1%), and Education Instruction & Library (96.9%).
| Occupation | Male | Female |
| Management | 383 (52.7%) | 343 (47.2%) |
| Business & Financial | 60 (40.8%) | 87 (59.2%) |
| Computers, Engineering & Science | 202 (53.7%) | 174 (46.3%) |
| Computers & Mathematics | 126 (44.5%) | 157 (55.5%) |
| Architecture & Engineering | 76 (100.0%) | 0 (0.0%) |
| Life, Physical & Social Science | 0 (0.0%) | 17 (100.0%) |
| Community & Social Service | 274 (32.6%) | 566 (67.4%) |
| Education, Arts & Media | 1 (1.9%) | 51 (98.1%) |
| Legal Services & Support | 77 (95.1%) | 4 (4.9%) |
| Education Instruction & Library | 15 (3.1%) | 468 (96.9%) |
| Arts, Media & Entertainment | 181 (80.8%) | 43 (19.2%) |
| Health Diagnosing & Treating | 28 (8.3%) | 308 (91.7%) |
| Health Technologists | 28 (10.6%) | 235 (89.3%) |
| Total (Category) | 947 (39.1%) | 1,478 (61.0%) |
| Total (Overall) | 3,112 (46.0%) | 3,659 (54.0%) |
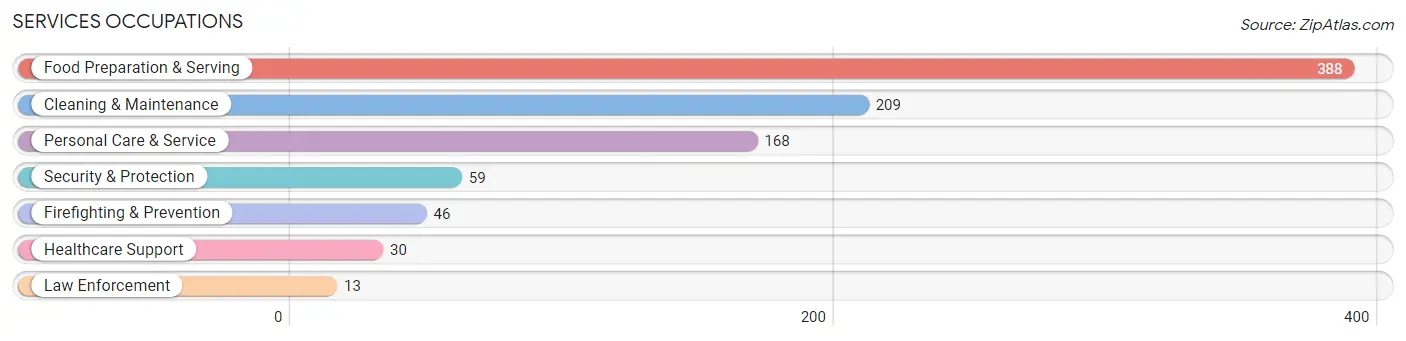
Services Occupations
The most common Services occupations in Covington are Food Preparation & Serving (388 | 5.7%), Cleaning & Maintenance (209 | 3.1%), Personal Care & Service (168 | 2.5%), Security & Protection (59 | 0.9%), and Firefighting & Prevention (46 | 0.7%).
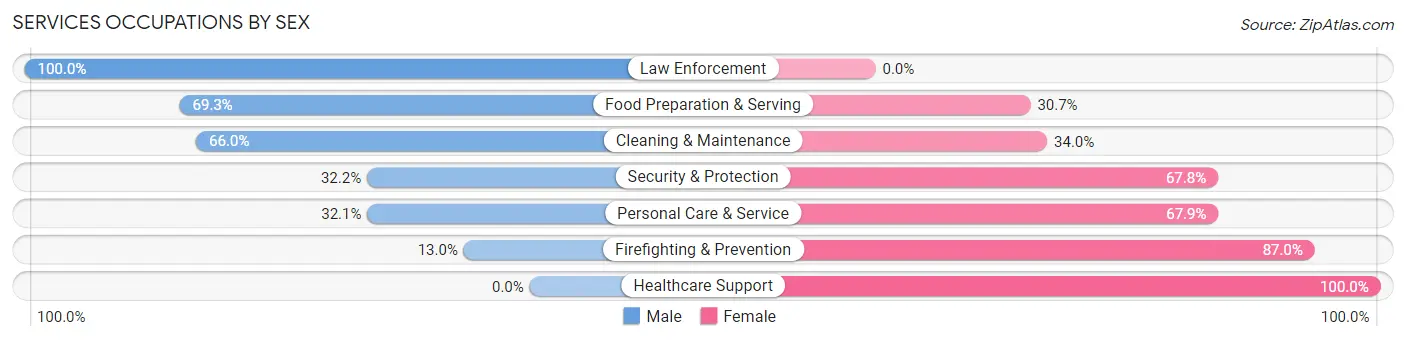
Services Occupations by Sex
Within the Services occupations in Covington, the most male-oriented occupations are Law Enforcement (100.0%), Food Preparation & Serving (69.3%), and Cleaning & Maintenance (66.0%), while the most female-oriented occupations are Healthcare Support (100.0%), Firefighting & Prevention (87.0%), and Personal Care & Service (67.9%).
| Occupation | Male | Female |
| Healthcare Support | 0 (0.0%) | 30 (100.0%) |
| Security & Protection | 19 (32.2%) | 40 (67.8%) |
| Firefighting & Prevention | 6 (13.0%) | 40 (87.0%) |
| Law Enforcement | 13 (100.0%) | 0 (0.0%) |
| Food Preparation & Serving | 269 (69.3%) | 119 (30.7%) |
| Cleaning & Maintenance | 138 (66.0%) | 71 (34.0%) |
| Personal Care & Service | 54 (32.1%) | 114 (67.9%) |
| Total (Category) | 480 (56.2%) | 374 (43.8%) |
| Total (Overall) | 3,112 (46.0%) | 3,659 (54.0%) |
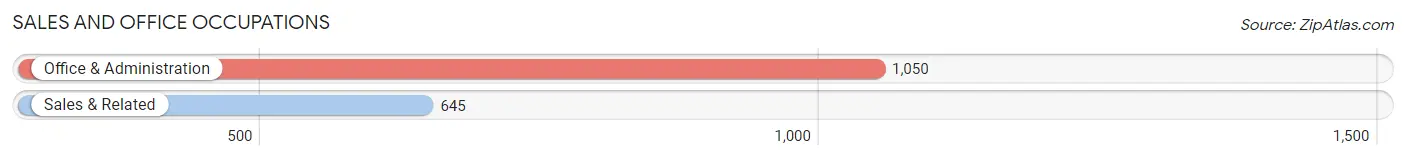
Sales and Office Occupations
The most common Sales and Office occupations in Covington are Office & Administration (1,050 | 15.5%), and Sales & Related (645 | 9.5%).
Sales and Office Occupations by Sex
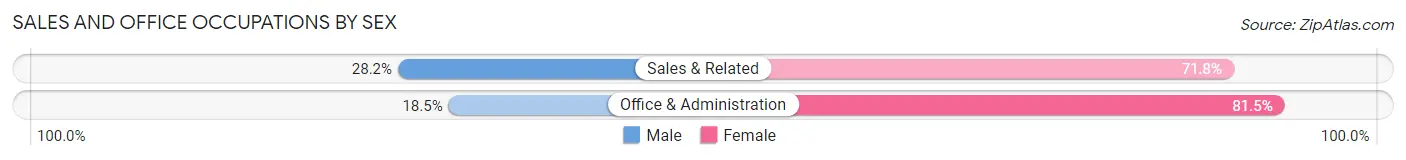
| Occupation | Male | Female |
| Sales & Related | 182 (28.2%) | 463 (71.8%) |
| Office & Administration | 194 (18.5%) | 856 (81.5%) |
| Total (Category) | 376 (22.2%) | 1,319 (77.8%) |
| Total (Overall) | 3,112 (46.0%) | 3,659 (54.0%) |
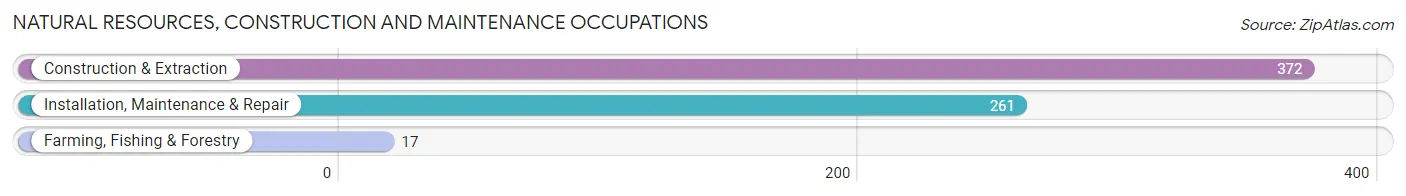
Natural Resources, Construction and Maintenance Occupations
The most common Natural Resources, Construction and Maintenance occupations in Covington are Construction & Extraction (372 | 5.5%), Installation, Maintenance & Repair (261 | 3.8%), and Farming, Fishing & Forestry (17 | 0.3%).
Natural Resources, Construction and Maintenance Occupations by Sex
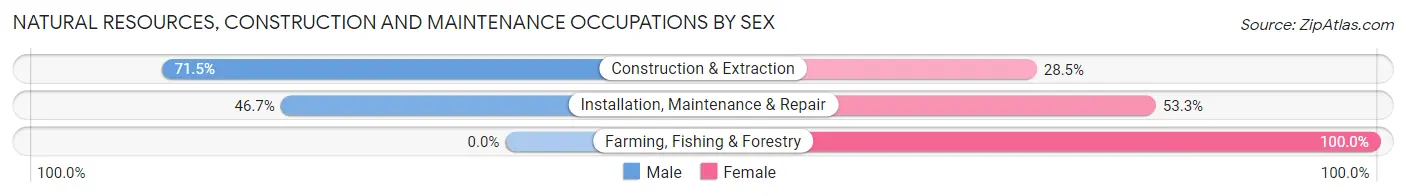
| Occupation | Male | Female |
| Farming, Fishing & Forestry | 0 (0.0%) | 17 (100.0%) |
| Construction & Extraction | 266 (71.5%) | 106 (28.5%) |
| Installation, Maintenance & Repair | 122 (46.7%) | 139 (53.3%) |
| Total (Category) | 388 (59.7%) | 262 (40.3%) |
| Total (Overall) | 3,112 (46.0%) | 3,659 (54.0%) |
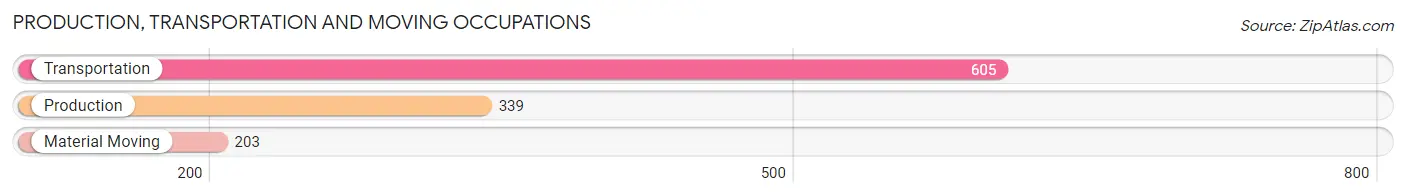
Production, Transportation and Moving Occupations
The most common Production, Transportation and Moving occupations in Covington are Transportation (605 | 8.9%), Production (339 | 5.0%), and Material Moving (203 | 3.0%).
Production, Transportation and Moving Occupations by Sex
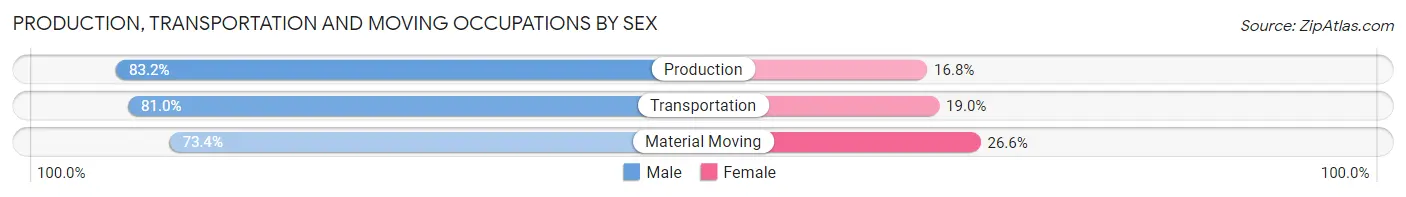
| Occupation | Male | Female |
| Production | 282 (83.2%) | 57 (16.8%) |
| Transportation | 490 (81.0%) | 115 (19.0%) |
| Material Moving | 149 (73.4%) | 54 (26.6%) |
| Total (Category) | 921 (80.3%) | 226 (19.7%) |
| Total (Overall) | 3,112 (46.0%) | 3,659 (54.0%) |
Employment Industries by Sex in Covington
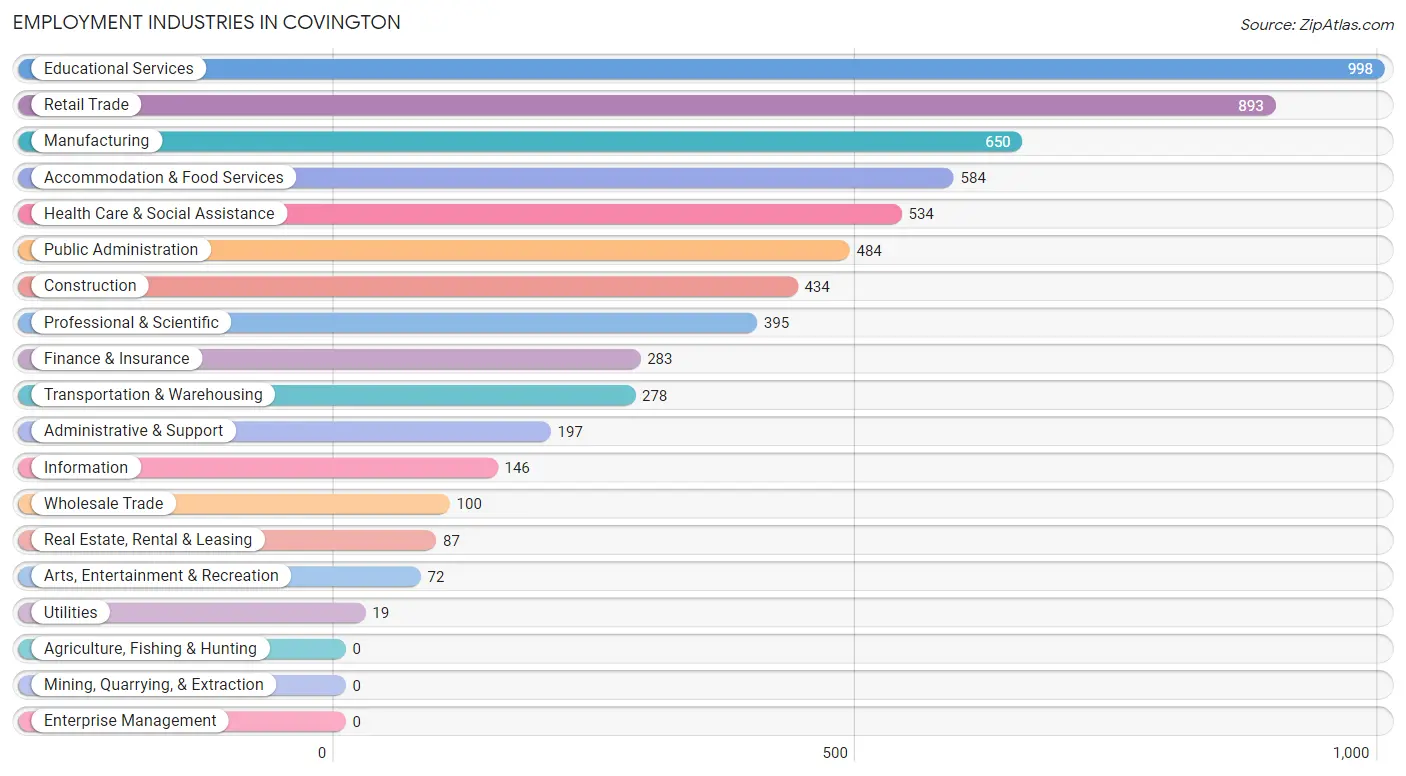
Employment Industries in Covington
The major employment industries in Covington include Educational Services (998 | 14.7%), Retail Trade (893 | 13.2%), Manufacturing (650 | 9.6%), Accommodation & Food Services (584 | 8.6%), and Health Care & Social Assistance (534 | 7.9%).
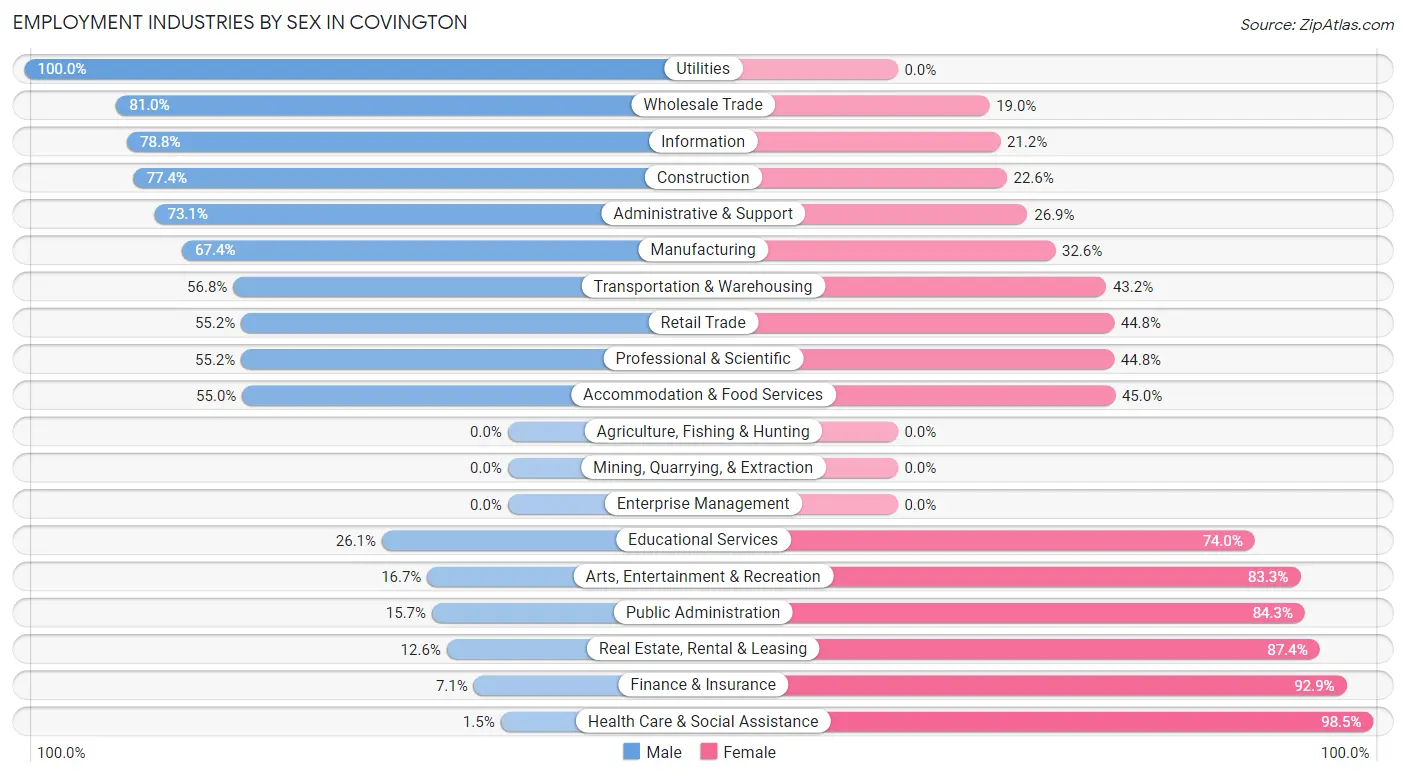
Employment Industries by Sex in Covington
The Covington industries that see more men than women are Utilities (100.0%), Wholesale Trade (81.0%), and Information (78.8%), whereas the industries that tend to have a higher number of women are Health Care & Social Assistance (98.5%), Finance & Insurance (92.9%), and Real Estate, Rental & Leasing (87.4%).
| Industry | Male | Female |
| Agriculture, Fishing & Hunting | 0 (0.0%) | 0 (0.0%) |
| Mining, Quarrying, & Extraction | 0 (0.0%) | 0 (0.0%) |
| Construction | 336 (77.4%) | 98 (22.6%) |
| Manufacturing | 438 (67.4%) | 212 (32.6%) |
| Wholesale Trade | 81 (81.0%) | 19 (19.0%) |
| Retail Trade | 493 (55.2%) | 400 (44.8%) |
| Transportation & Warehousing | 158 (56.8%) | 120 (43.2%) |
| Utilities | 19 (100.0%) | 0 (0.0%) |
| Information | 115 (78.8%) | 31 (21.2%) |
| Finance & Insurance | 20 (7.1%) | 263 (92.9%) |
| Real Estate, Rental & Leasing | 11 (12.6%) | 76 (87.4%) |
| Professional & Scientific | 218 (55.2%) | 177 (44.8%) |
| Enterprise Management | 0 (0.0%) | 0 (0.0%) |
| Administrative & Support | 144 (73.1%) | 53 (26.9%) |
| Educational Services | 260 (26.1%) | 738 (74.0%) |
| Health Care & Social Assistance | 8 (1.5%) | 526 (98.5%) |
| Arts, Entertainment & Recreation | 12 (16.7%) | 60 (83.3%) |
| Accommodation & Food Services | 321 (55.0%) | 263 (45.0%) |
| Public Administration | 76 (15.7%) | 408 (84.3%) |
| Total | 3,112 (46.0%) | 3,659 (54.0%) |
Education in Covington
School Enrollment in Covington
The most common levels of schooling among the 3,575 students in Covington are middle school (1,083 | 30.3%), elementary school (801 | 22.4%), and high school (750 | 21.0%).
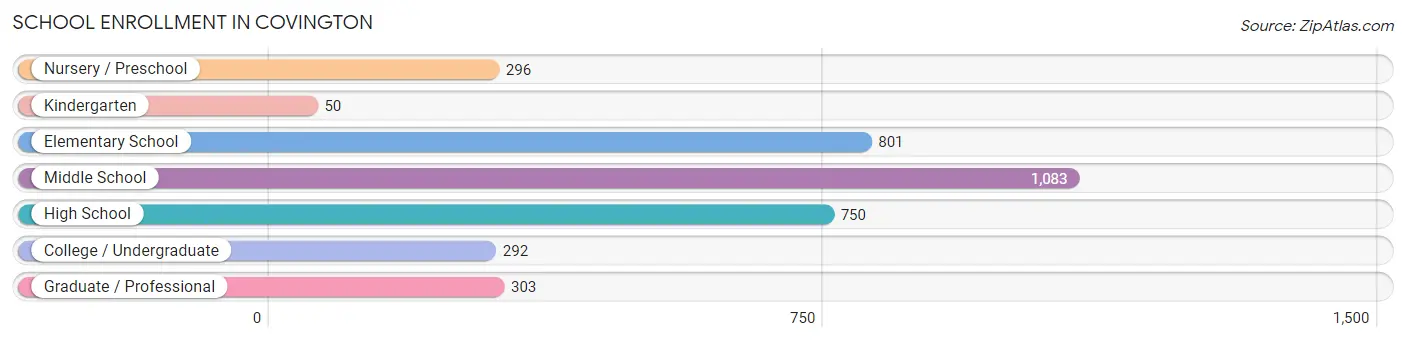
| School Level | # Students | % Students |
| Nursery / Preschool | 296 | 8.3% |
| Kindergarten | 50 | 1.4% |
| Elementary School | 801 | 22.4% |
| Middle School | 1,083 | 30.3% |
| High School | 750 | 21.0% |
| College / Undergraduate | 292 | 8.2% |
| Graduate / Professional | 303 | 8.5% |
| Total | 3,575 | 100.0% |
School Enrollment by Age by Funding Source in Covington
Out of a total of 3,575 students who are enrolled in schools in Covington, 265 (7.4%) attend a private institution, while the remaining 3,310 (92.6%) are enrolled in public schools. The age group of 25 to 34 year olds has the highest likelihood of being enrolled in private schools, with 62 (48.8% in the age bracket) enrolled. Conversely, the age group of 5 to 9 year old has the lowest likelihood of being enrolled in a private school, with 758 (99.1% in the age bracket) attending a public institution.
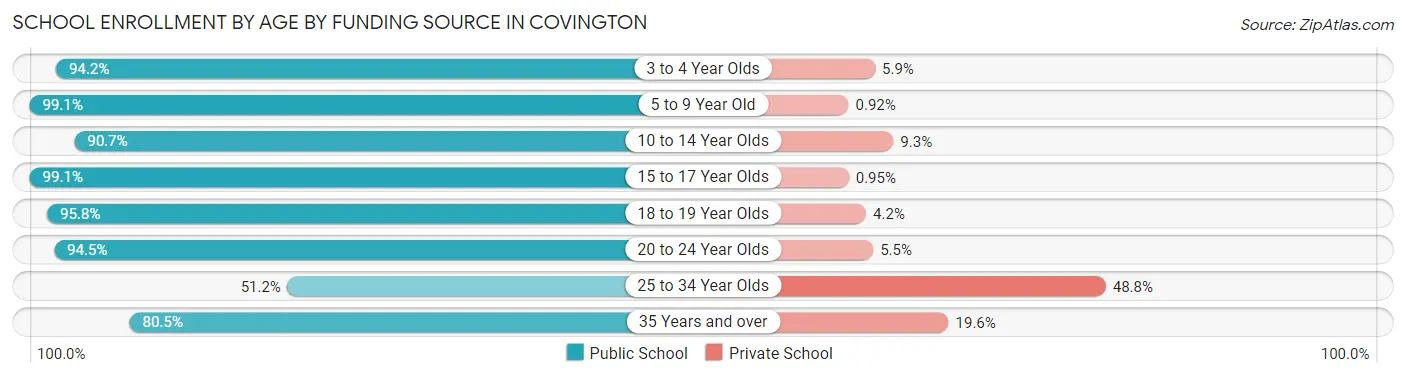
| Age Bracket | Public School | Private School |
| 3 to 4 Year Olds | 193 (94.2%) | 12 (5.9%) |
| 5 to 9 Year Old | 758 (99.1%) | 7 (0.9%) |
| 10 to 14 Year Olds | 1,107 (90.7%) | 113 (9.3%) |
| 15 to 17 Year Olds | 623 (99.1%) | 6 (0.9%) |
| 18 to 19 Year Olds | 183 (95.8%) | 8 (4.2%) |
| 20 to 24 Year Olds | 206 (94.5%) | 12 (5.5%) |
| 25 to 34 Year Olds | 65 (51.2%) | 62 (48.8%) |
| 35 Years and over | 177 (80.4%) | 43 (19.6%) |
| Total | 3,310 (92.6%) | 265 (7.4%) |
Educational Attainment by Field of Study in Covington
Education (781 | 30.4%), business (446 | 17.4%), communications (320 | 12.5%), psychology (265 | 10.3%), and science & technology (257 | 10.0%) are the most common fields of study among 2,568 individuals in Covington who have obtained a bachelor's degree or higher.
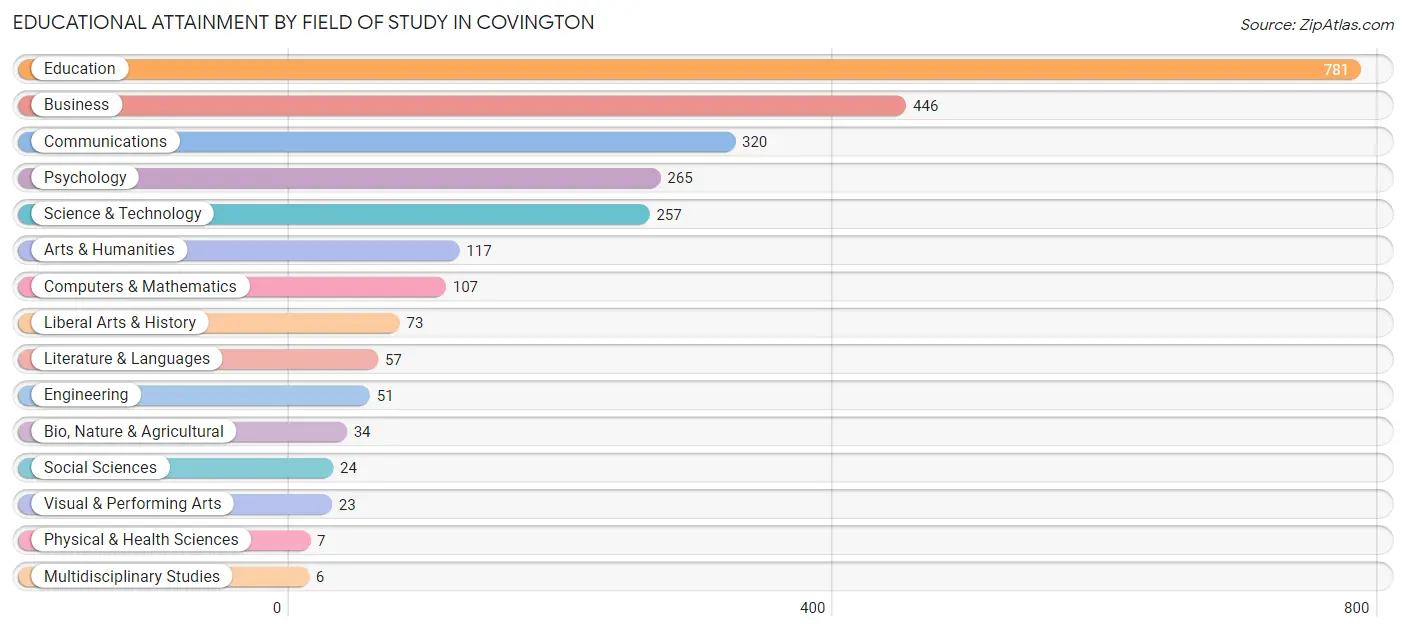
| Field of Study | # Graduates | % Graduates |
| Computers & Mathematics | 107 | 4.2% |
| Bio, Nature & Agricultural | 34 | 1.3% |
| Physical & Health Sciences | 7 | 0.3% |
| Psychology | 265 | 10.3% |
| Social Sciences | 24 | 0.9% |
| Engineering | 51 | 2.0% |
| Multidisciplinary Studies | 6 | 0.2% |
| Science & Technology | 257 | 10.0% |
| Business | 446 | 17.4% |
| Education | 781 | 30.4% |
| Literature & Languages | 57 | 2.2% |
| Liberal Arts & History | 73 | 2.8% |
| Visual & Performing Arts | 23 | 0.9% |
| Communications | 320 | 12.5% |
| Arts & Humanities | 117 | 4.6% |
| Total | 2,568 | 100.0% |
Transportation & Commute in Covington
Vehicle Availability by Sex in Covington
The most prevalent vehicle ownership categories in Covington are males with 2 vehicles (1,367, accounting for 45.4%) and females with 2 vehicles (1,424, making up 38.0%).
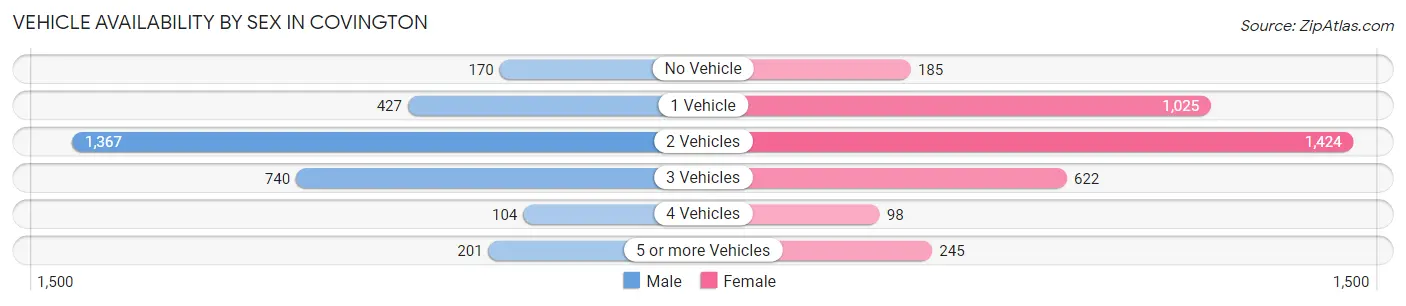
| Vehicles Available | Male | Female |
| No Vehicle | 170 (5.7%) | 185 (5.1%) |
| 1 Vehicle | 427 (14.2%) | 1,025 (28.5%) |
| 2 Vehicles | 1,367 (45.4%) | 1,424 (39.6%) |
| 3 Vehicles | 740 (24.6%) | 622 (17.3%) |
| 4 Vehicles | 104 (3.5%) | 98 (2.7%) |
| 5 or more Vehicles | 201 (6.7%) | 245 (6.8%) |
| Total | 3,009 (100.0%) | 3,599 (100.0%) |
Commute Time in Covington
The most frequently occuring commute durations in Covington are 60 to 89 minutes (1,185 commuters, 21.0%), 15 to 19 minutes (881 commuters, 15.6%), and 45 to 59 minutes (692 commuters, 12.2%).
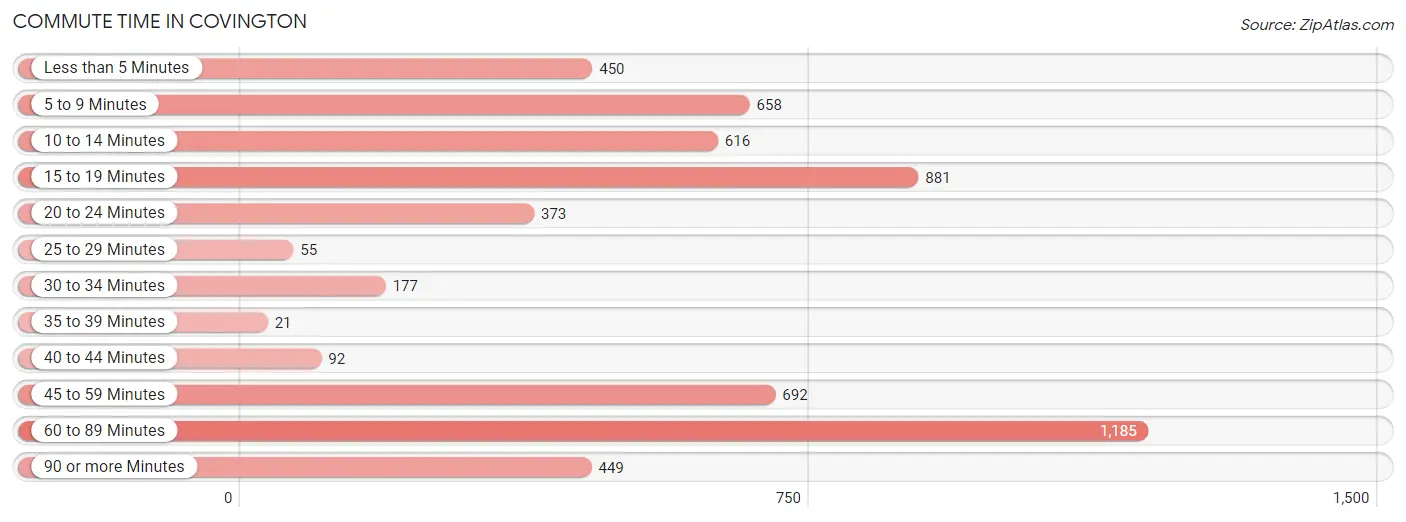
| Commute Time | # Commuters | % Commuters |
| Less than 5 Minutes | 450 | 8.0% |
| 5 to 9 Minutes | 658 | 11.7% |
| 10 to 14 Minutes | 616 | 10.9% |
| 15 to 19 Minutes | 881 | 15.6% |
| 20 to 24 Minutes | 373 | 6.6% |
| 25 to 29 Minutes | 55 | 1.0% |
| 30 to 34 Minutes | 177 | 3.1% |
| 35 to 39 Minutes | 21 | 0.4% |
| 40 to 44 Minutes | 92 | 1.6% |
| 45 to 59 Minutes | 692 | 12.2% |
| 60 to 89 Minutes | 1,185 | 21.0% |
| 90 or more Minutes | 449 | 8.0% |
Commute Time by Sex in Covington
The most common commute times in Covington are 60 to 89 minutes (561 commuters, 21.1%) for males and 60 to 89 minutes (624 commuters, 20.9%) for females.
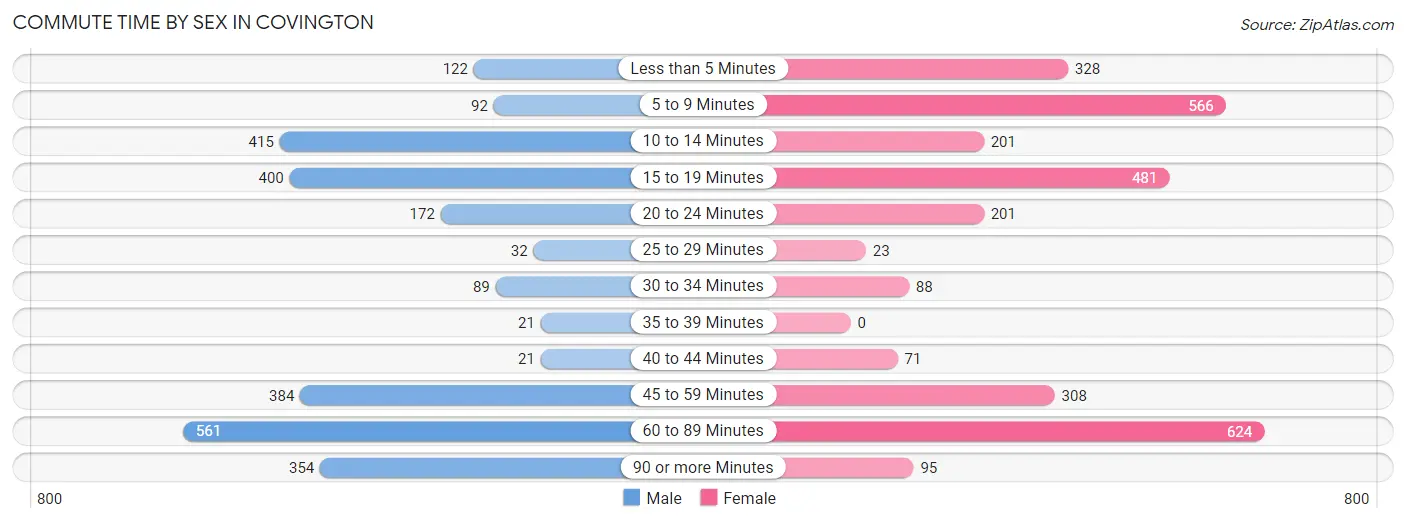
| Commute Time | Male | Female |
| Less than 5 Minutes | 122 (4.6%) | 328 (11.0%) |
| 5 to 9 Minutes | 92 (3.5%) | 566 (19.0%) |
| 10 to 14 Minutes | 415 (15.6%) | 201 (6.7%) |
| 15 to 19 Minutes | 400 (15.0%) | 481 (16.1%) |
| 20 to 24 Minutes | 172 (6.5%) | 201 (6.7%) |
| 25 to 29 Minutes | 32 (1.2%) | 23 (0.8%) |
| 30 to 34 Minutes | 89 (3.3%) | 88 (2.9%) |
| 35 to 39 Minutes | 21 (0.8%) | 0 (0.0%) |
| 40 to 44 Minutes | 21 (0.8%) | 71 (2.4%) |
| 45 to 59 Minutes | 384 (14.4%) | 308 (10.3%) |
| 60 to 89 Minutes | 561 (21.1%) | 624 (20.9%) |
| 90 or more Minutes | 354 (13.3%) | 95 (3.2%) |
Time of Departure to Work by Sex in Covington
The most frequent times of departure to work in Covington are 8:00 AM to 8:29 AM (419, 15.7%) for males and 4:00 PM to 11:59 PM (553, 18.5%) for females.
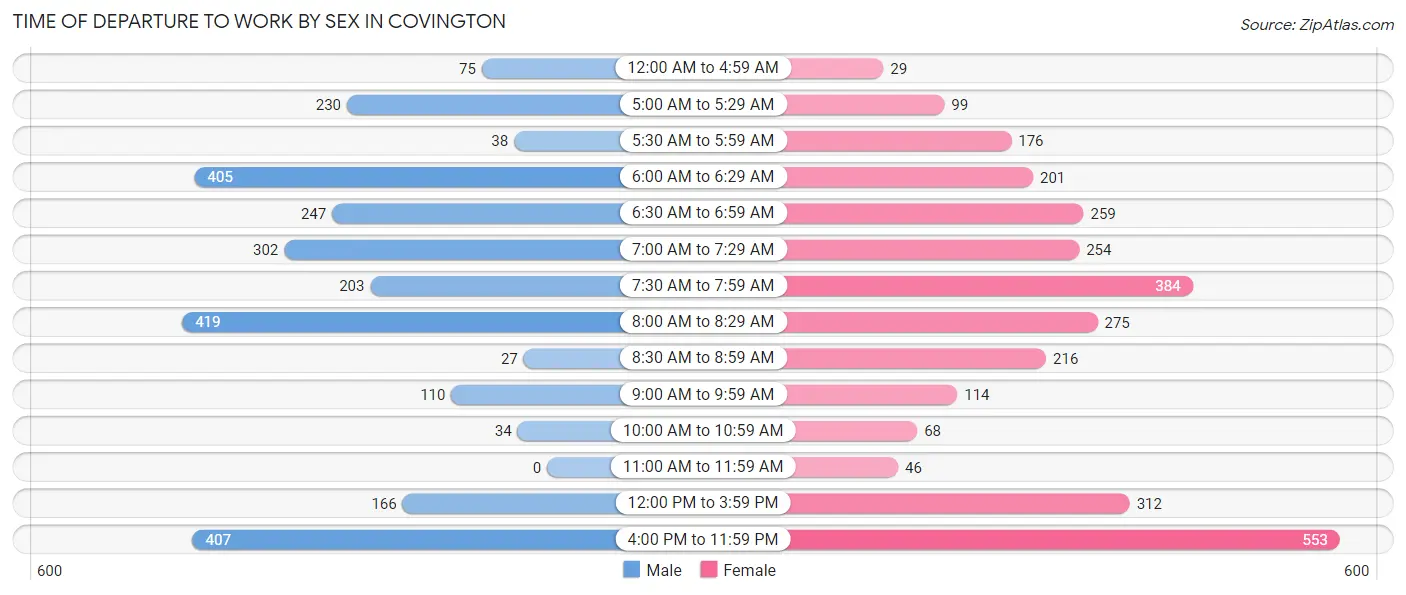
| Time of Departure | Male | Female |
| 12:00 AM to 4:59 AM | 75 (2.8%) | 29 (1.0%) |
| 5:00 AM to 5:29 AM | 230 (8.6%) | 99 (3.3%) |
| 5:30 AM to 5:59 AM | 38 (1.4%) | 176 (5.9%) |
| 6:00 AM to 6:29 AM | 405 (15.2%) | 201 (6.7%) |
| 6:30 AM to 6:59 AM | 247 (9.3%) | 259 (8.7%) |
| 7:00 AM to 7:29 AM | 302 (11.3%) | 254 (8.5%) |
| 7:30 AM to 7:59 AM | 203 (7.6%) | 384 (12.9%) |
| 8:00 AM to 8:29 AM | 419 (15.7%) | 275 (9.2%) |
| 8:30 AM to 8:59 AM | 27 (1.0%) | 216 (7.2%) |
| 9:00 AM to 9:59 AM | 110 (4.1%) | 114 (3.8%) |
| 10:00 AM to 10:59 AM | 34 (1.3%) | 68 (2.3%) |
| 11:00 AM to 11:59 AM | 0 (0.0%) | 46 (1.5%) |
| 12:00 PM to 3:59 PM | 166 (6.2%) | 312 (10.4%) |
| 4:00 PM to 11:59 PM | 407 (15.3%) | 553 (18.5%) |
| Total | 2,663 (100.0%) | 2,986 (100.0%) |
Housing Occupancy in Covington
Occupancy by Ownership in Covington
Of the total 5,481 dwellings in Covington, owner-occupied units account for 2,496 (45.5%), while renter-occupied units make up 2,985 (54.5%).
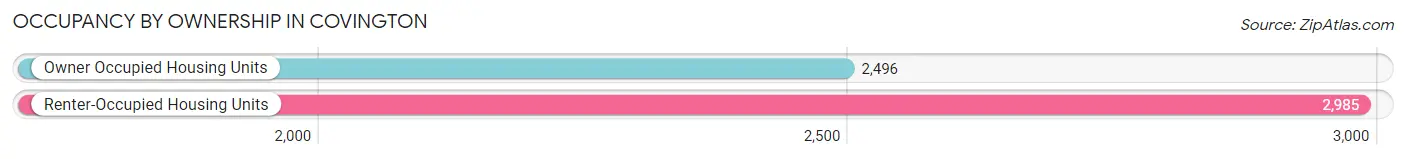
| Occupancy | # Housing Units | % Housing Units |
| Owner Occupied Housing Units | 2,496 | 45.5% |
| Renter-Occupied Housing Units | 2,985 | 54.5% |
| Total Occupied Housing Units | 5,481 | 100.0% |
Occupancy by Household Size in Covington
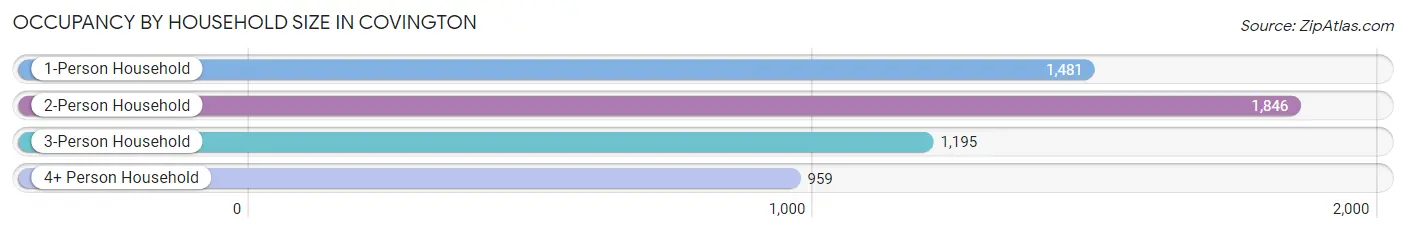
| Household Size | # Housing Units | % Housing Units |
| 1-Person Household | 1,481 | 27.0% |
| 2-Person Household | 1,846 | 33.7% |
| 3-Person Household | 1,195 | 21.8% |
| 4+ Person Household | 959 | 17.5% |
| Total Housing Units | 5,481 | 100.0% |
Occupancy by Ownership by Household Size in Covington
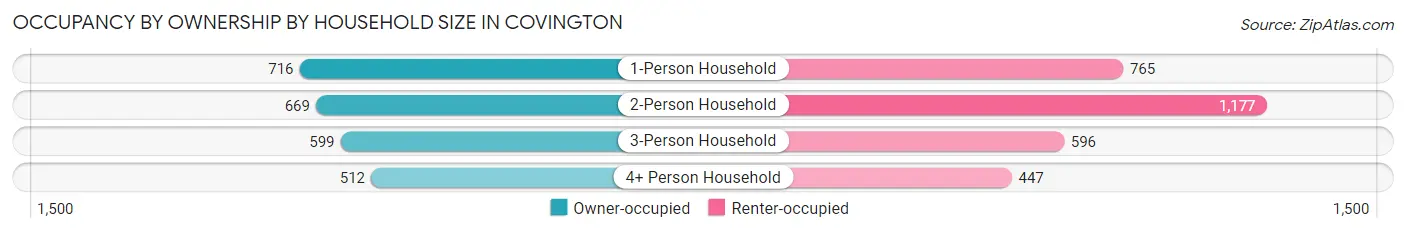
| Household Size | Owner-occupied | Renter-occupied |
| 1-Person Household | 716 (48.3%) | 765 (51.6%) |
| 2-Person Household | 669 (36.2%) | 1,177 (63.8%) |
| 3-Person Household | 599 (50.1%) | 596 (49.9%) |
| 4+ Person Household | 512 (53.4%) | 447 (46.6%) |
| Total Housing Units | 2,496 (45.5%) | 2,985 (54.5%) |
Occupancy by Educational Attainment in Covington
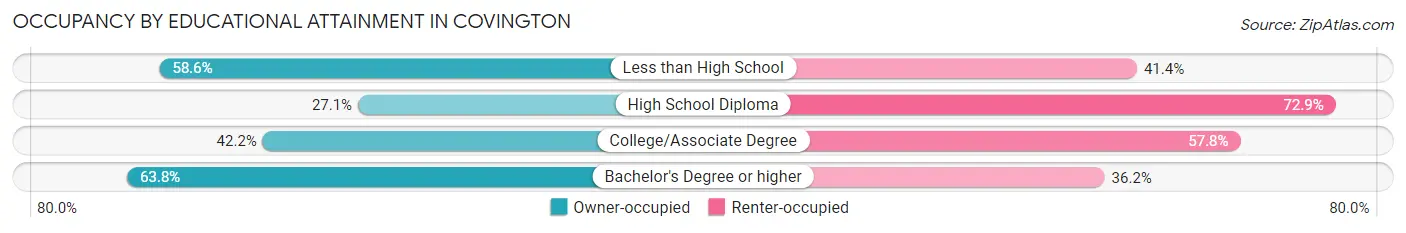
| Household Size | Owner-occupied | Renter-occupied |
| Less than High School | 401 (58.6%) | 283 (41.4%) |
| High School Diploma | 382 (27.1%) | 1,026 (72.9%) |
| College/Associate Degree | 879 (42.2%) | 1,202 (57.8%) |
| Bachelor's Degree or higher | 834 (63.8%) | 474 (36.2%) |
Occupancy by Age of Householder in Covington
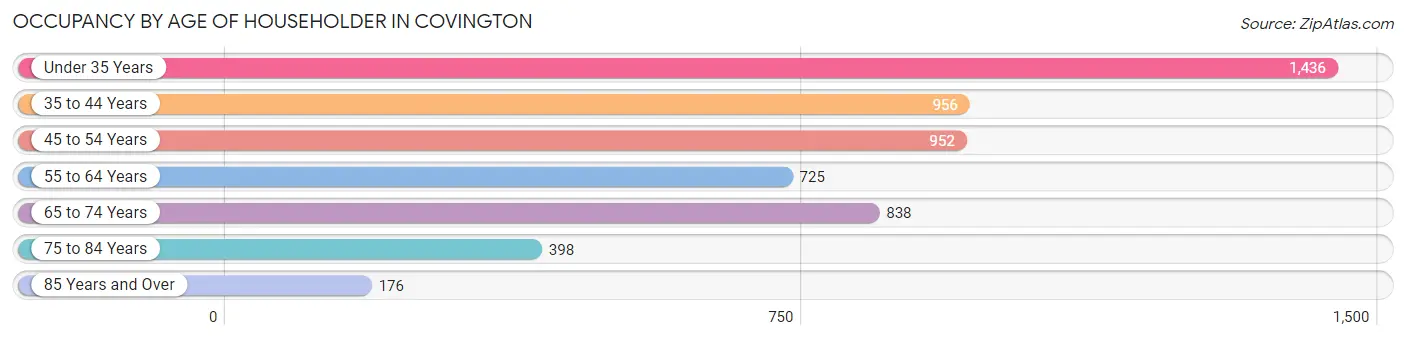
| Age Bracket | # Households | % Households |
| Under 35 Years | 1,436 | 26.2% |
| 35 to 44 Years | 956 | 17.4% |
| 45 to 54 Years | 952 | 17.4% |
| 55 to 64 Years | 725 | 13.2% |
| 65 to 74 Years | 838 | 15.3% |
| 75 to 84 Years | 398 | 7.3% |
| 85 Years and Over | 176 | 3.2% |
| Total | 5,481 | 100.0% |
Housing Finances in Covington
Median Income by Occupancy in Covington
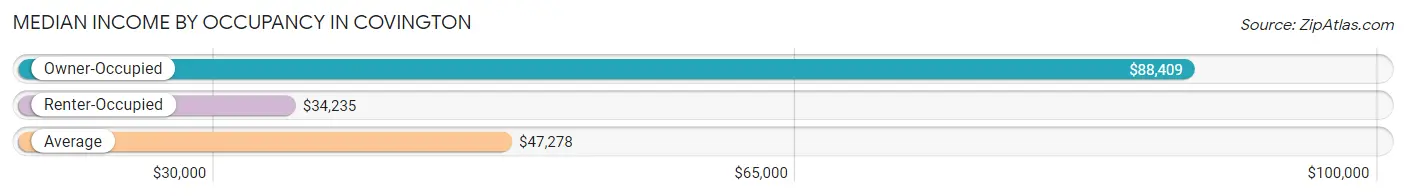
| Occupancy Type | # Households | Median Income |
| Owner-Occupied | 2,496 (45.5%) | $88,409 |
| Renter-Occupied | 2,985 (54.5%) | $34,235 |
| Average | 5,481 (100.0%) | $47,278 |
Occupancy by Householder Income Bracket in Covington
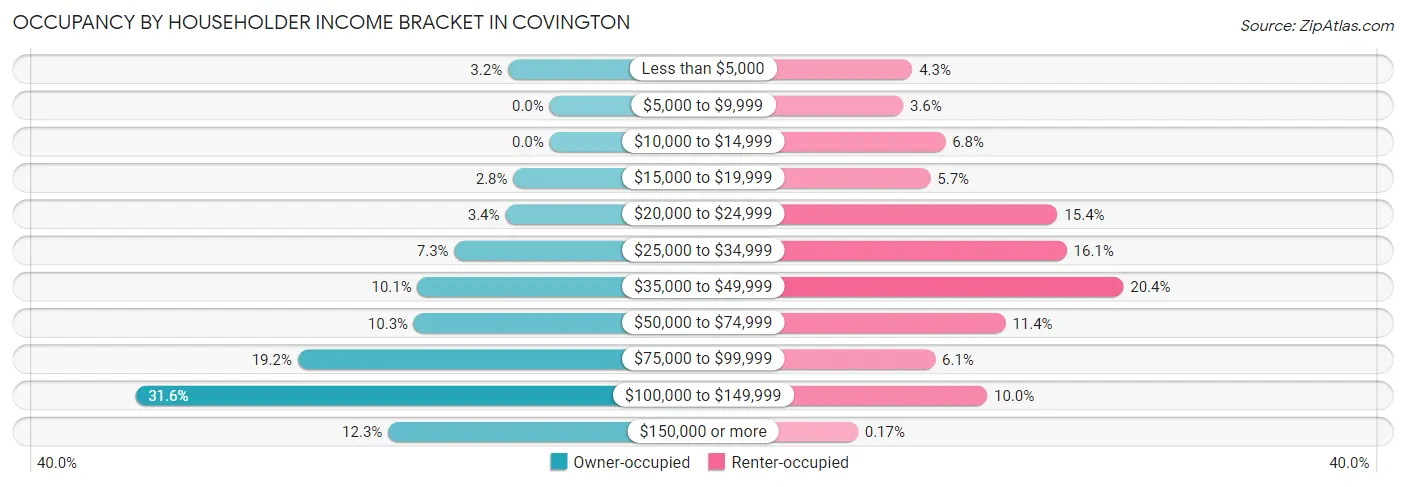
| Income Bracket | Owner-occupied | Renter-occupied |
| Less than $5,000 | 79 (3.2%) | 129 (4.3%) |
| $5,000 to $9,999 | 0 (0.0%) | 108 (3.6%) |
| $10,000 to $14,999 | 0 (0.0%) | 204 (6.8%) |
| $15,000 to $19,999 | 69 (2.8%) | 170 (5.7%) |
| $20,000 to $24,999 | 84 (3.4%) | 459 (15.4%) |
| $25,000 to $34,999 | 181 (7.2%) | 480 (16.1%) |
| $35,000 to $49,999 | 251 (10.1%) | 609 (20.4%) |
| $50,000 to $74,999 | 258 (10.3%) | 341 (11.4%) |
| $75,000 to $99,999 | 479 (19.2%) | 181 (6.1%) |
| $100,000 to $149,999 | 788 (31.6%) | 299 (10.0%) |
| $150,000 or more | 307 (12.3%) | 5 (0.2%) |
| Total | 2,496 (100.0%) | 2,985 (100.0%) |
Monthly Housing Cost Tiers in Covington
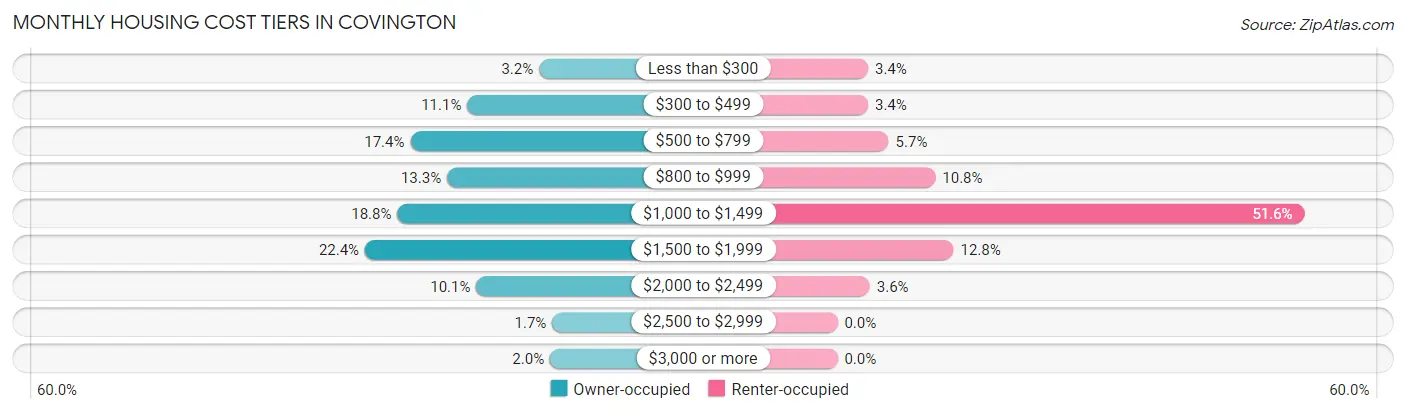
| Monthly Cost | Owner-occupied | Renter-occupied |
| Less than $300 | 79 (3.2%) | 101 (3.4%) |
| $300 to $499 | 277 (11.1%) | 101 (3.4%) |
| $500 to $799 | 434 (17.4%) | 169 (5.7%) |
| $800 to $999 | 333 (13.3%) | 323 (10.8%) |
| $1,000 to $1,499 | 470 (18.8%) | 1,540 (51.6%) |
| $1,500 to $1,999 | 559 (22.4%) | 383 (12.8%) |
| $2,000 to $2,499 | 252 (10.1%) | 107 (3.6%) |
| $2,500 to $2,999 | 43 (1.7%) | 0 (0.0%) |
| $3,000 or more | 49 (2.0%) | 0 (0.0%) |
| Total | 2,496 (100.0%) | 2,985 (100.0%) |
Physical Housing Characteristics in Covington
Housing Structures in Covington
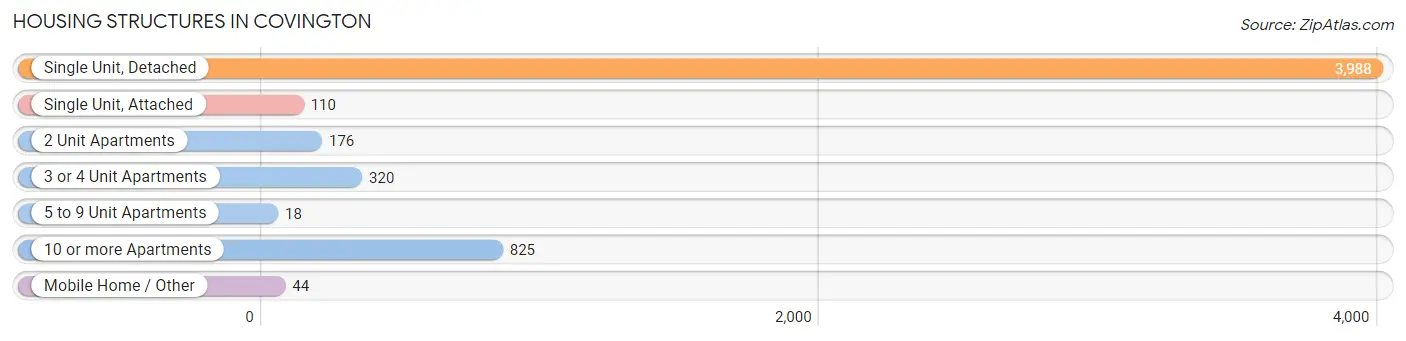
| Structure Type | # Housing Units | % Housing Units |
| Single Unit, Detached | 3,988 | 72.8% |
| Single Unit, Attached | 110 | 2.0% |
| 2 Unit Apartments | 176 | 3.2% |
| 3 or 4 Unit Apartments | 320 | 5.8% |
| 5 to 9 Unit Apartments | 18 | 0.3% |
| 10 or more Apartments | 825 | 15.0% |
| Mobile Home / Other | 44 | 0.8% |
| Total | 5,481 | 100.0% |
Housing Structures by Occupancy in Covington
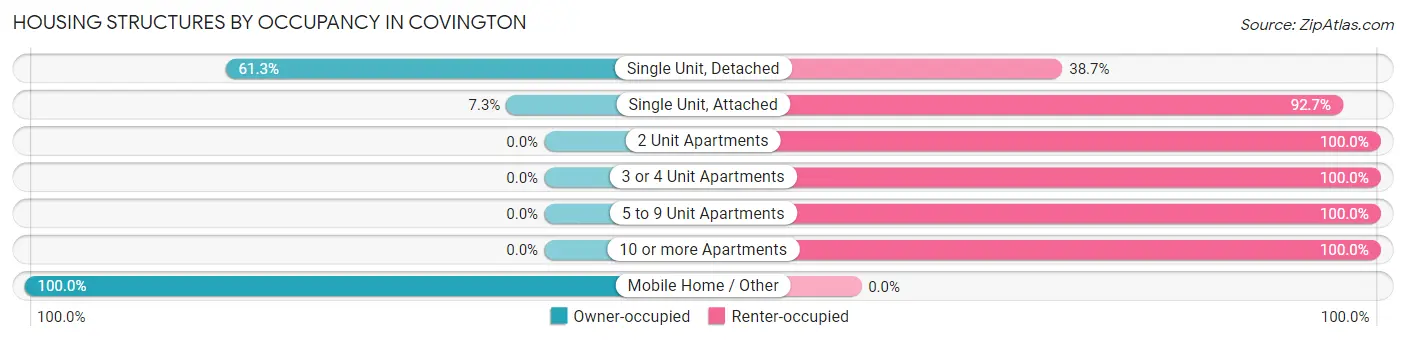
| Structure Type | Owner-occupied | Renter-occupied |
| Single Unit, Detached | 2,444 (61.3%) | 1,544 (38.7%) |
| Single Unit, Attached | 8 (7.3%) | 102 (92.7%) |
| 2 Unit Apartments | 0 (0.0%) | 176 (100.0%) |
| 3 or 4 Unit Apartments | 0 (0.0%) | 320 (100.0%) |
| 5 to 9 Unit Apartments | 0 (0.0%) | 18 (100.0%) |
| 10 or more Apartments | 0 (0.0%) | 825 (100.0%) |
| Mobile Home / Other | 44 (100.0%) | 0 (0.0%) |
| Total | 2,496 (45.5%) | 2,985 (54.5%) |
Housing Structures by Number of Rooms in Covington
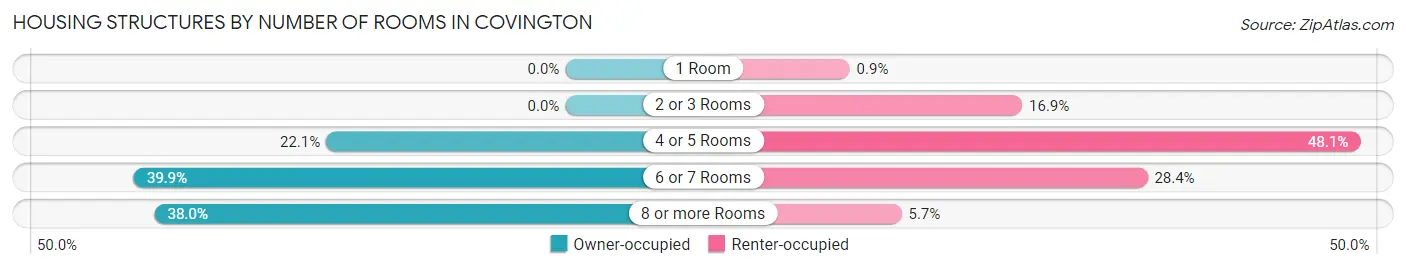
| Number of Rooms | Owner-occupied | Renter-occupied |
| 1 Room | 0 (0.0%) | 27 (0.9%) |
| 2 or 3 Rooms | 0 (0.0%) | 503 (16.9%) |
| 4 or 5 Rooms | 552 (22.1%) | 1,436 (48.1%) |
| 6 or 7 Rooms | 996 (39.9%) | 849 (28.4%) |
| 8 or more Rooms | 948 (38.0%) | 170 (5.7%) |
| Total | 2,496 (100.0%) | 2,985 (100.0%) |
Housing Structure by Heating Type in Covington
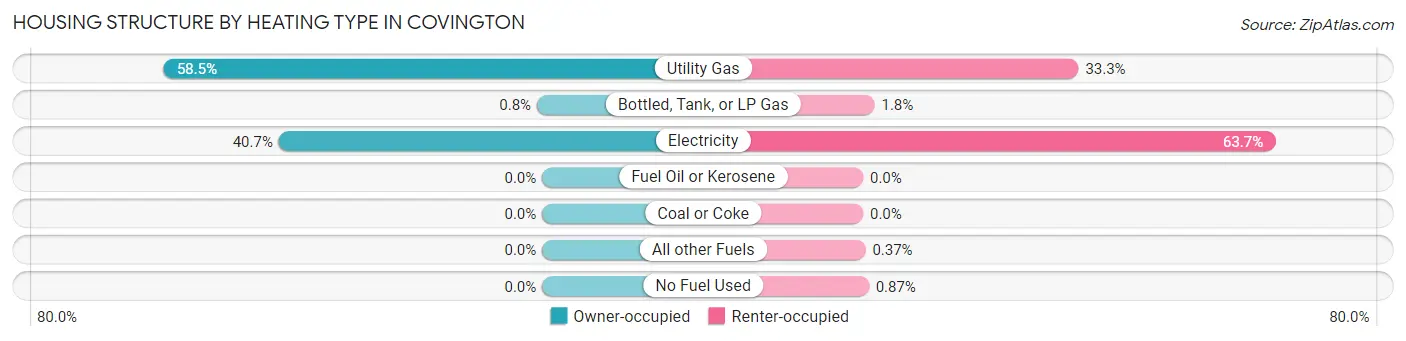
| Heating Type | Owner-occupied | Renter-occupied |
| Utility Gas | 1,460 (58.5%) | 994 (33.3%) |
| Bottled, Tank, or LP Gas | 20 (0.8%) | 53 (1.8%) |
| Electricity | 1,016 (40.7%) | 1,901 (63.7%) |
| Fuel Oil or Kerosene | 0 (0.0%) | 0 (0.0%) |
| Coal or Coke | 0 (0.0%) | 0 (0.0%) |
| All other Fuels | 0 (0.0%) | 11 (0.4%) |
| No Fuel Used | 0 (0.0%) | 26 (0.9%) |
| Total | 2,496 (100.0%) | 2,985 (100.0%) |
Household Vehicle Usage in Covington
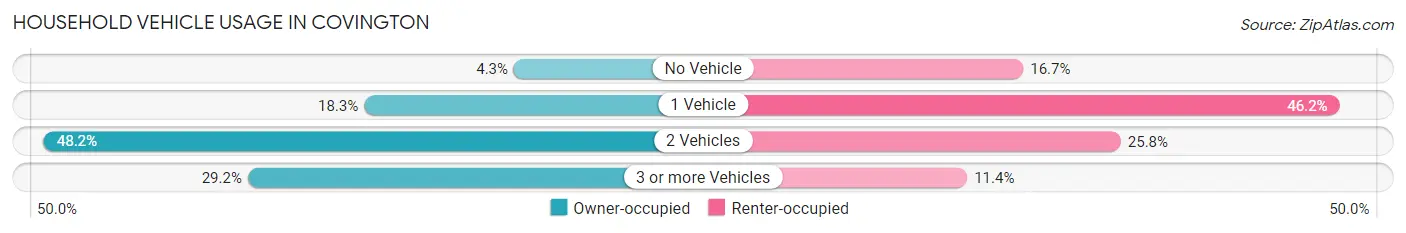
| Vehicles per Household | Owner-occupied | Renter-occupied |
| No Vehicle | 108 (4.3%) | 497 (16.7%) |
| 1 Vehicle | 457 (18.3%) | 1,378 (46.2%) |
| 2 Vehicles | 1,203 (48.2%) | 769 (25.8%) |
| 3 or more Vehicles | 728 (29.2%) | 341 (11.4%) |
| Total | 2,496 (100.0%) | 2,985 (100.0%) |
Real Estate & Mortgages in Covington
Real Estate and Mortgage Overview in Covington
| Characteristic | Without Mortgage | With Mortgage |
| Housing Units | 822 | 1,674 |
| Median Property Value | $165,700 | $245,300 |
| Median Household Income | $83,026 | $171 |
| Monthly Housing Costs | $542 | $49 |
| Real Estate Taxes | $716 | $42 |
Property Value by Mortgage Status in Covington
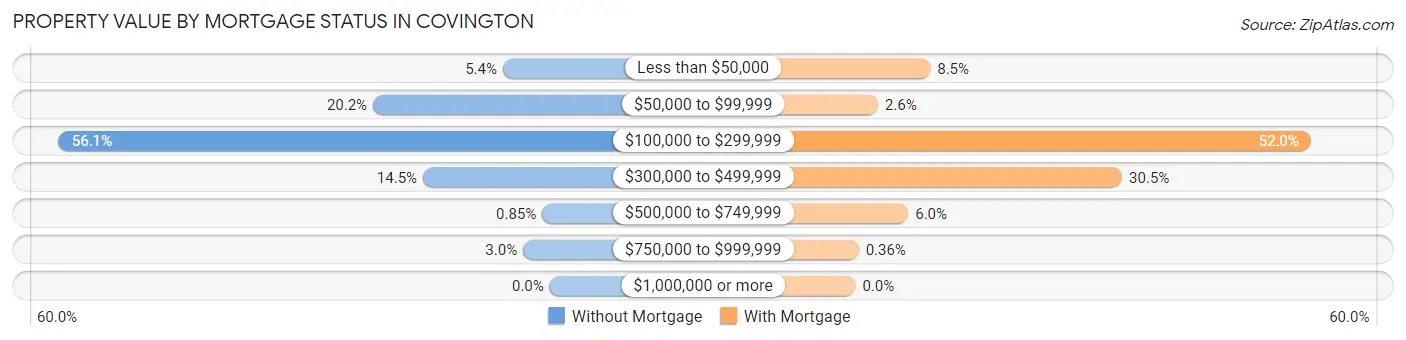
| Property Value | Without Mortgage | With Mortgage |
| Less than $50,000 | 44 (5.3%) | 143 (8.5%) |
| $50,000 to $99,999 | 166 (20.2%) | 43 (2.6%) |
| $100,000 to $299,999 | 461 (56.1%) | 871 (52.0%) |
| $300,000 to $499,999 | 119 (14.5%) | 510 (30.5%) |
| $500,000 to $749,999 | 7 (0.9%) | 101 (6.0%) |
| $750,000 to $999,999 | 25 (3.0%) | 6 (0.4%) |
| $1,000,000 or more | 0 (0.0%) | 0 (0.0%) |
| Total | 822 (100.0%) | 1,674 (100.0%) |
Household Income by Mortgage Status in Covington
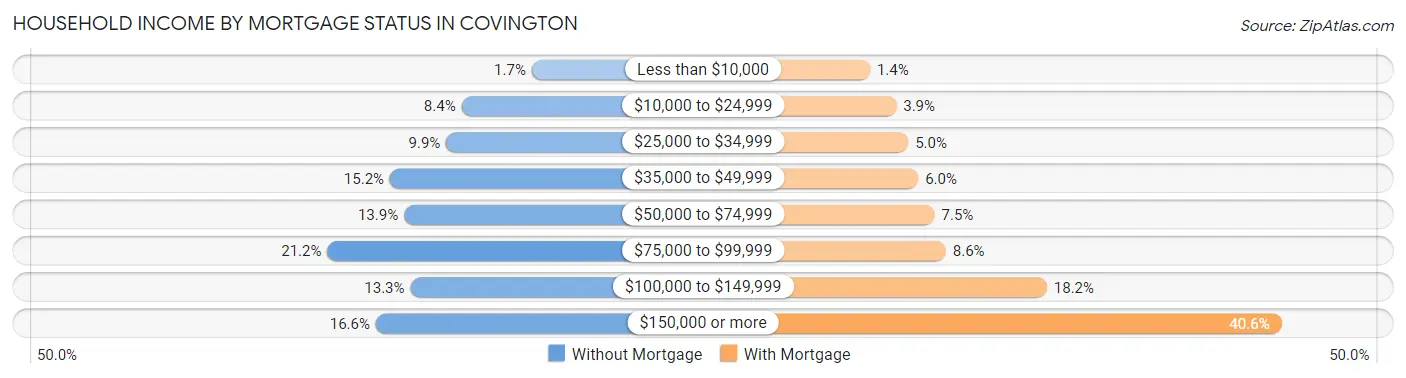
| Household Income | Without Mortgage | With Mortgage |
| Less than $10,000 | 14 (1.7%) | 23 (1.4%) |
| $10,000 to $24,999 | 69 (8.4%) | 65 (3.9%) |
| $25,000 to $34,999 | 81 (9.9%) | 84 (5.0%) |
| $35,000 to $49,999 | 125 (15.2%) | 100 (6.0%) |
| $50,000 to $74,999 | 114 (13.9%) | 126 (7.5%) |
| $75,000 to $99,999 | 174 (21.2%) | 144 (8.6%) |
| $100,000 to $149,999 | 109 (13.3%) | 305 (18.2%) |
| $150,000 or more | 136 (16.6%) | 679 (40.6%) |
| Total | 822 (100.0%) | 1,674 (100.0%) |
Property Value to Household Income Ratio in Covington
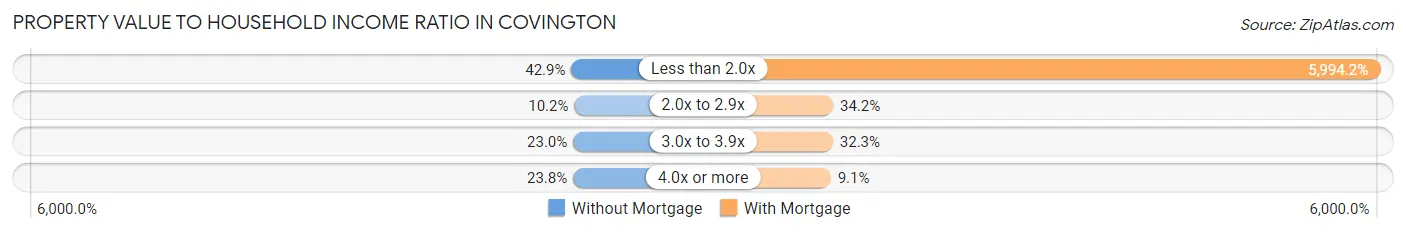
| Value-to-Income Ratio | Without Mortgage | With Mortgage |
| Less than 2.0x | 353 (42.9%) | 100,342 (5,994.1%) |
| 2.0x to 2.9x | 84 (10.2%) | 572 (34.2%) |
| 3.0x to 3.9x | 189 (23.0%) | 541 (32.3%) |
| 4.0x or more | 196 (23.8%) | 153 (9.1%) |
| Total | 822 (100.0%) | 1,674 (100.0%) |
Real Estate Taxes by Mortgage Status in Covington
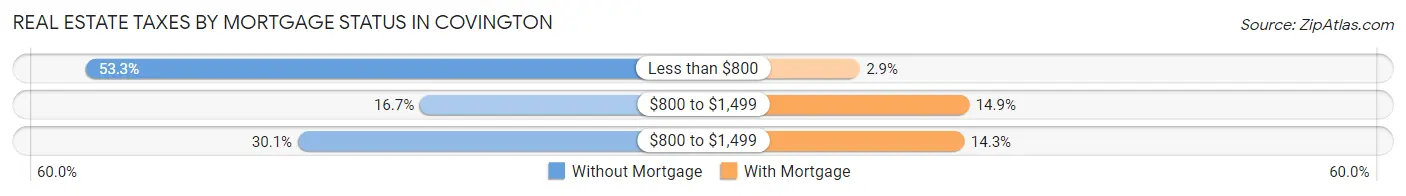
| Property Taxes | Without Mortgage | With Mortgage |
| Less than $800 | 438 (53.3%) | 48 (2.9%) |
| $800 to $1,499 | 137 (16.7%) | 249 (14.9%) |
| $800 to $1,499 | 247 (30.0%) | 240 (14.3%) |
| Total | 822 (100.0%) | 1,674 (100.0%) |
Health & Disability in Covington
Health Insurance Coverage by Age in Covington
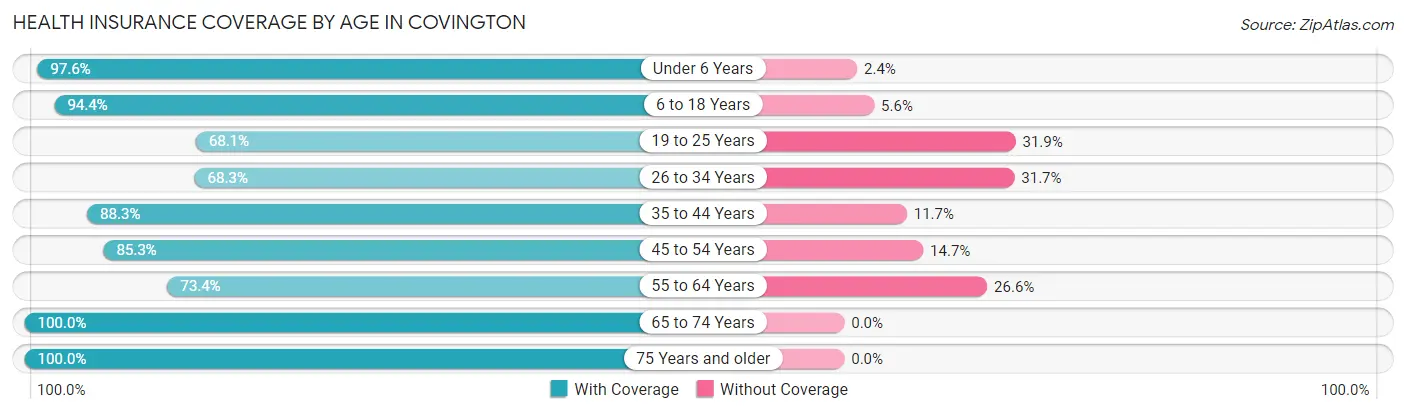
| Age Bracket | With Coverage | Without Coverage |
| Under 6 Years | 939 (97.6%) | 23 (2.4%) |
| 6 to 18 Years | 2,558 (94.4%) | 151 (5.6%) |
| 19 to 25 Years | 735 (68.1%) | 345 (31.9%) |
| 26 to 34 Years | 1,432 (68.3%) | 665 (31.7%) |
| 35 to 44 Years | 1,402 (88.3%) | 185 (11.7%) |
| 45 to 54 Years | 1,629 (85.3%) | 281 (14.7%) |
| 55 to 64 Years | 892 (73.4%) | 324 (26.6%) |
| 65 to 74 Years | 1,091 (100.0%) | 0 (0.0%) |
| 75 Years and older | 818 (100.0%) | 0 (0.0%) |
| Total | 11,496 (85.4%) | 1,974 (14.6%) |
Health Insurance Coverage by Citizenship Status in Covington
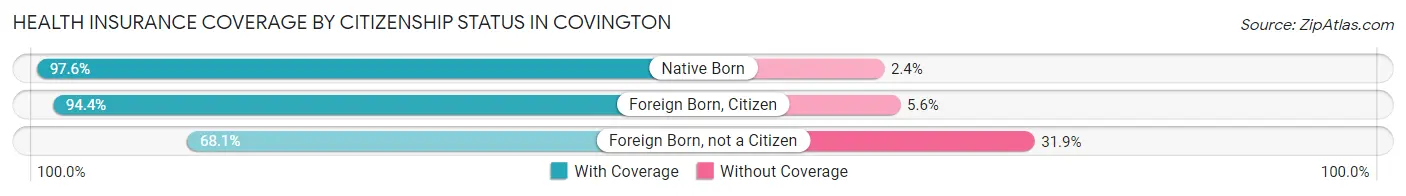
| Citizenship Status | With Coverage | Without Coverage |
| Native Born | 939 (97.6%) | 23 (2.4%) |
| Foreign Born, Citizen | 2,558 (94.4%) | 151 (5.6%) |
| Foreign Born, not a Citizen | 735 (68.1%) | 345 (31.9%) |
Health Insurance Coverage by Household Income in Covington
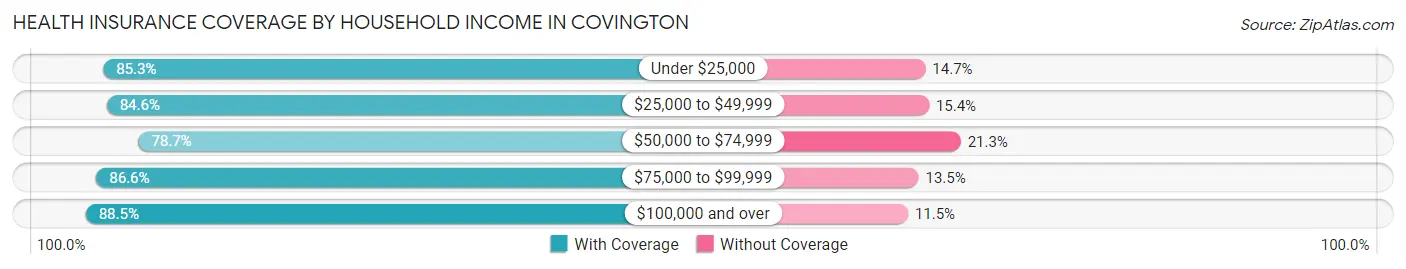
| Household Income | With Coverage | Without Coverage |
| Under $25,000 | 2,270 (85.3%) | 392 (14.7%) |
| $25,000 to $49,999 | 2,781 (84.6%) | 506 (15.4%) |
| $50,000 to $74,999 | 1,327 (78.7%) | 360 (21.3%) |
| $75,000 to $99,999 | 1,396 (86.6%) | 217 (13.5%) |
| $100,000 and over | 3,701 (88.5%) | 479 (11.5%) |
Public vs Private Health Insurance Coverage by Age in Covington
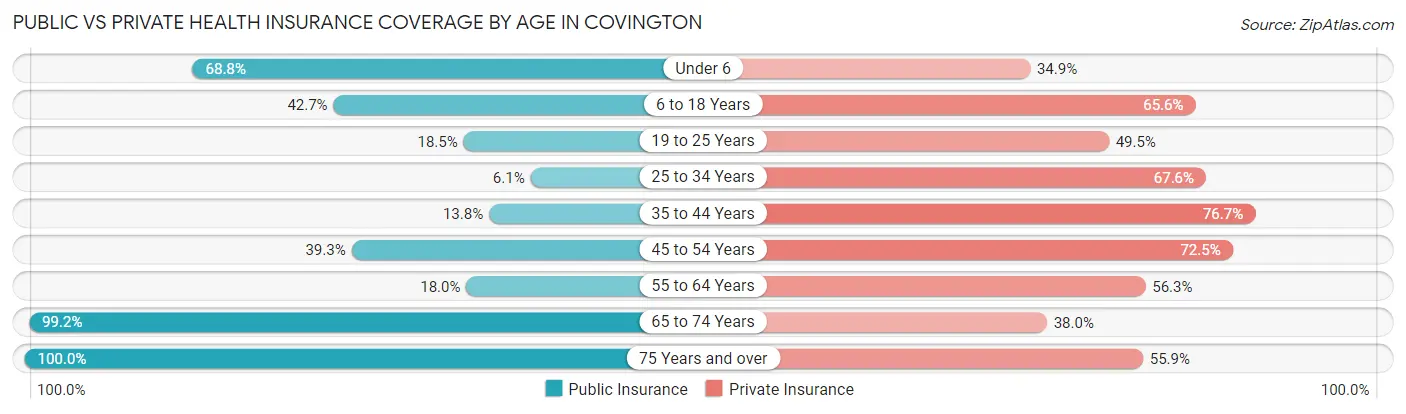
| Age Bracket | Public Insurance | Private Insurance |
| Under 6 | 662 (68.8%) | 336 (34.9%) |
| 6 to 18 Years | 1,156 (42.7%) | 1,777 (65.6%) |
| 19 to 25 Years | 200 (18.5%) | 535 (49.5%) |
| 25 to 34 Years | 128 (6.1%) | 1,417 (67.6%) |
| 35 to 44 Years | 219 (13.8%) | 1,217 (76.7%) |
| 45 to 54 Years | 751 (39.3%) | 1,385 (72.5%) |
| 55 to 64 Years | 219 (18.0%) | 685 (56.3%) |
| 65 to 74 Years | 1,082 (99.2%) | 415 (38.0%) |
| 75 Years and over | 818 (100.0%) | 457 (55.9%) |
| Total | 5,235 (38.9%) | 8,224 (61.1%) |
Disability Status by Sex by Age in Covington
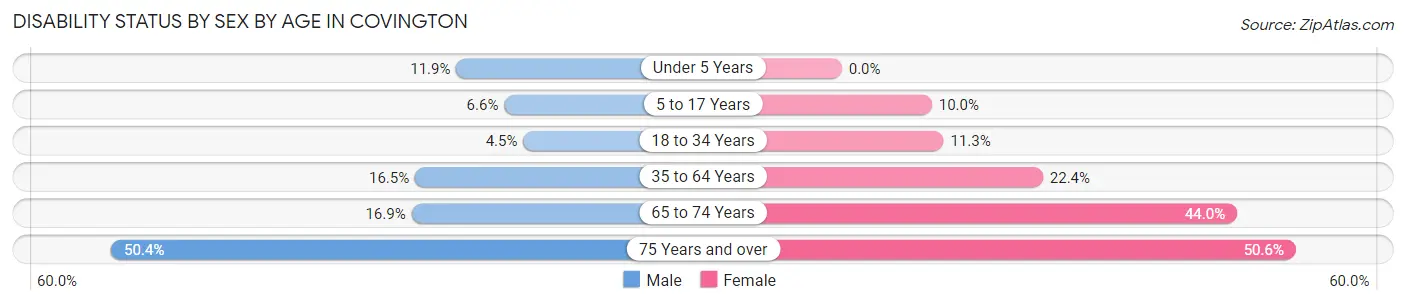
| Age Bracket | Male | Female |
| Under 5 Years | 44 (11.9%) | 0 (0.0%) |
| 5 to 17 Years | 105 (6.6%) | 103 (10.0%) |
| 18 to 34 Years | 70 (4.5%) | 207 (11.3%) |
| 35 to 64 Years | 341 (16.5%) | 593 (22.4%) |
| 65 to 74 Years | 80 (16.9%) | 272 (44.0%) |
| 75 Years and over | 137 (50.4%) | 276 (50.5%) |
Disability Class by Sex by Age in Covington
Disability Class: Hearing Difficulty
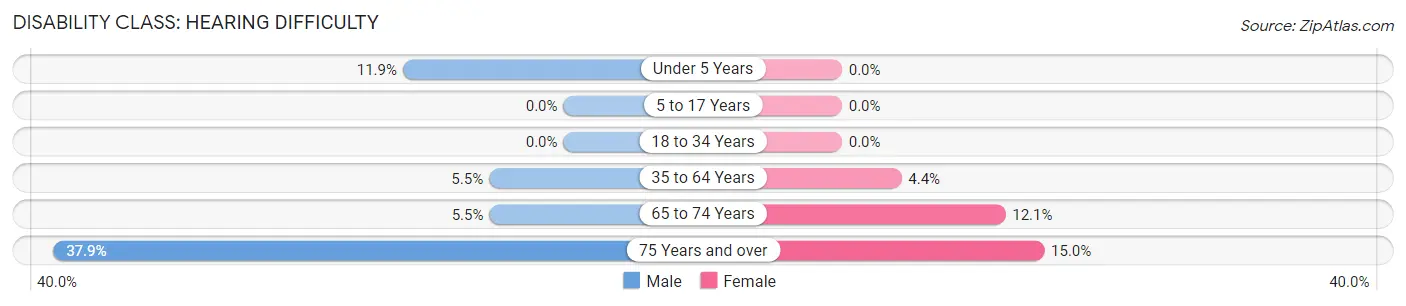
| Age Bracket | Male | Female |
| Under 5 Years | 44 (11.9%) | 0 (0.0%) |
| 5 to 17 Years | 0 (0.0%) | 0 (0.0%) |
| 18 to 34 Years | 0 (0.0%) | 0 (0.0%) |
| 35 to 64 Years | 114 (5.5%) | 117 (4.4%) |
| 65 to 74 Years | 26 (5.5%) | 75 (12.1%) |
| 75 Years and over | 103 (37.9%) | 82 (15.0%) |
Disability Class: Vision Difficulty
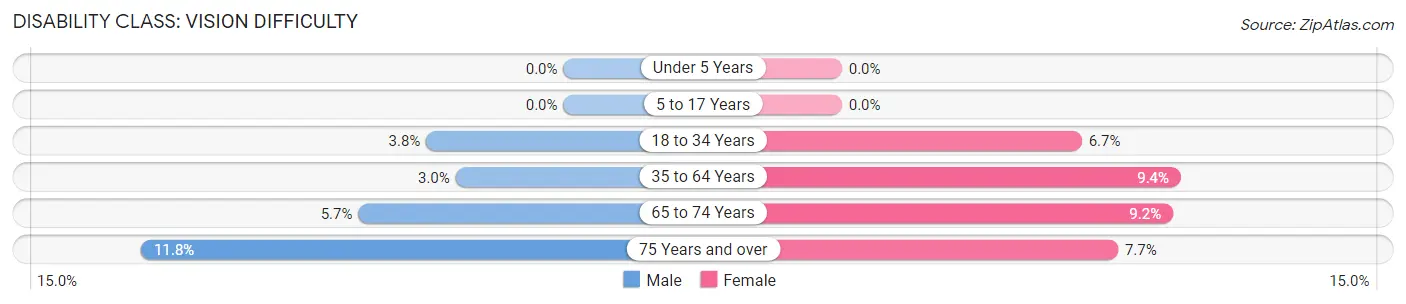
| Age Bracket | Male | Female |
| Under 5 Years | 0 (0.0%) | 0 (0.0%) |
| 5 to 17 Years | 0 (0.0%) | 0 (0.0%) |
| 18 to 34 Years | 60 (3.8%) | 122 (6.7%) |
| 35 to 64 Years | 62 (3.0%) | 250 (9.4%) |
| 65 to 74 Years | 27 (5.7%) | 57 (9.2%) |
| 75 Years and over | 32 (11.8%) | 42 (7.7%) |
Disability Class: Cognitive Difficulty
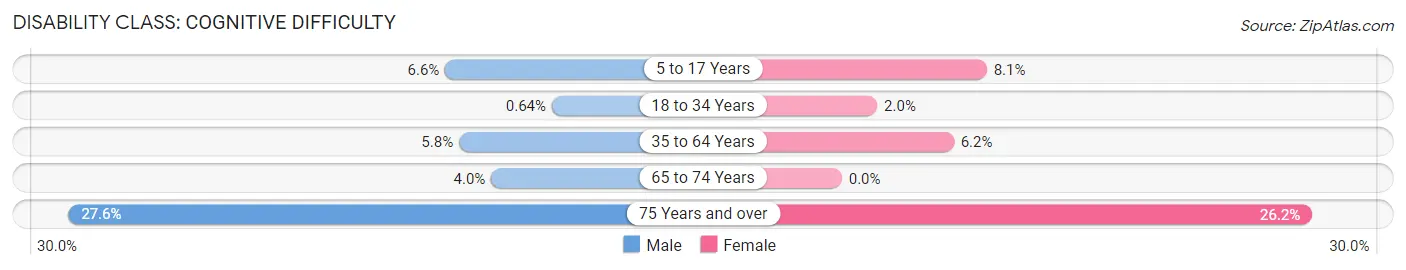
| Age Bracket | Male | Female |
| 5 to 17 Years | 105 (6.6%) | 83 (8.1%) |
| 18 to 34 Years | 10 (0.6%) | 36 (2.0%) |
| 35 to 64 Years | 120 (5.8%) | 165 (6.2%) |
| 65 to 74 Years | 19 (4.0%) | 0 (0.0%) |
| 75 Years and over | 75 (27.6%) | 143 (26.2%) |
Disability Class: Ambulatory Difficulty
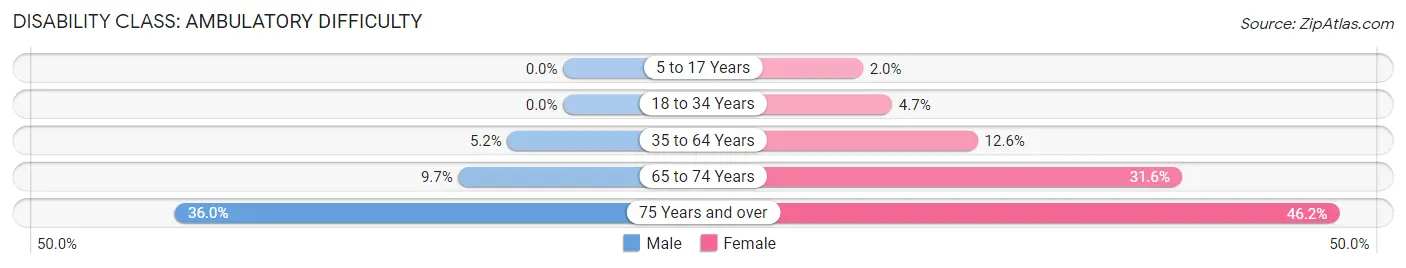
| Age Bracket | Male | Female |
| 5 to 17 Years | 0 (0.0%) | 20 (1.9%) |
| 18 to 34 Years | 0 (0.0%) | 85 (4.6%) |
| 35 to 64 Years | 107 (5.2%) | 334 (12.6%) |
| 65 to 74 Years | 46 (9.7%) | 195 (31.6%) |
| 75 Years and over | 98 (36.0%) | 252 (46.2%) |
Disability Class: Self-Care Difficulty
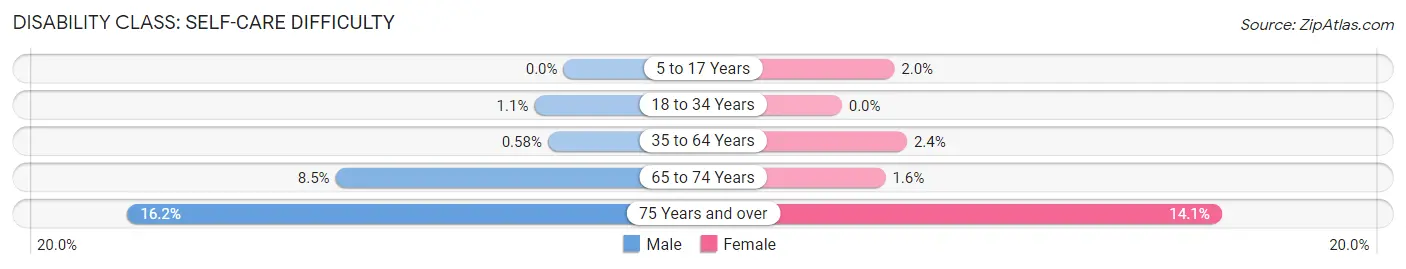
| Age Bracket | Male | Female |
| 5 to 17 Years | 0 (0.0%) | 20 (1.9%) |
| 18 to 34 Years | 17 (1.1%) | 0 (0.0%) |
| 35 to 64 Years | 12 (0.6%) | 64 (2.4%) |
| 65 to 74 Years | 40 (8.5%) | 10 (1.6%) |
| 75 Years and over | 44 (16.2%) | 77 (14.1%) |
Technology Access in Covington
Computing Device Access in Covington
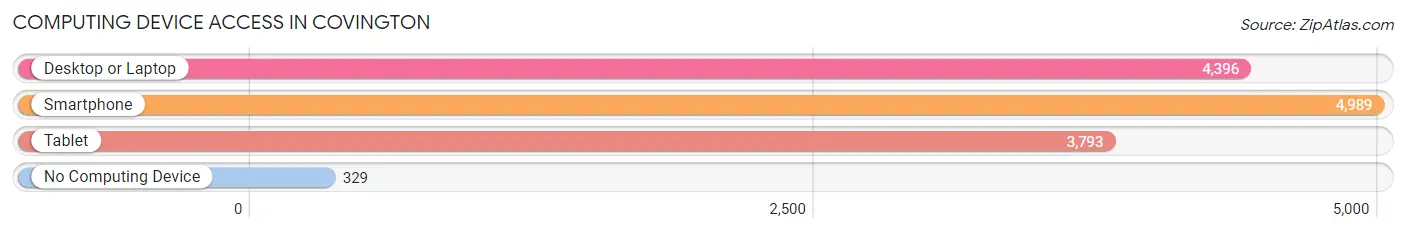
| Device Type | # Households | % Households |
| Desktop or Laptop | 4,396 | 80.2% |
| Smartphone | 4,989 | 91.0% |
| Tablet | 3,793 | 69.2% |
| No Computing Device | 329 | 6.0% |
| Total | 5,481 | 100.0% |
Internet Access in Covington
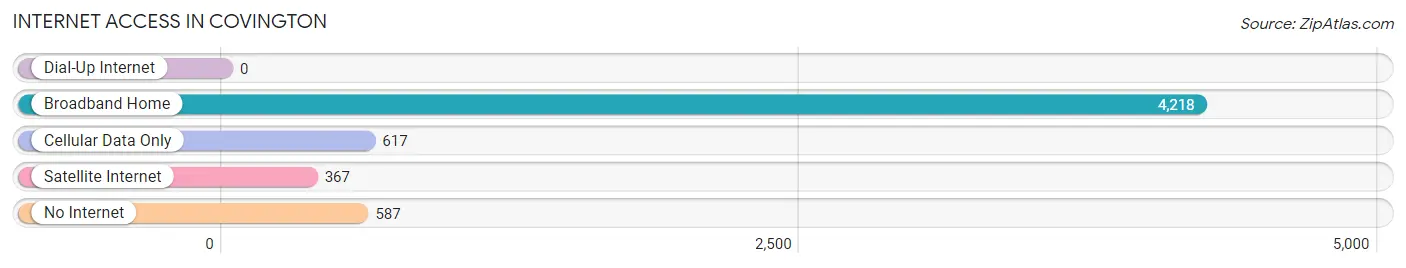
| Internet Type | # Households | % Households |
| Dial-Up Internet | 0 | 0.0% |
| Broadband Home | 4,218 | 77.0% |
| Cellular Data Only | 617 | 11.3% |
| Satellite Internet | 367 | 6.7% |
| No Internet | 587 | 10.7% |
| Total | 5,481 | 100.0% |
Covington Summary
Covington, Georgia is a city located in Newton County, Georgia, United States. It is the county seat of Newton County and is located 35 miles east of Atlanta. The city has a population of 15,856 as of the 2010 census.
History
Covington was founded in 1822 as the county seat of Newton County. It was named after General Leonard Covington, a hero of the War of 1812. The city was incorporated in 1823 and has since grown to become the largest city in Newton County.
Covington has a rich history and has been home to many notable people. The city was the birthplace of the famous author Alice Walker, who wrote the Pulitzer Prize-winning novel The Color Purple. The city was also the home of the first African-American mayor of a major city in the United States, Otis Johnson.
Geography
Covington is located in the Piedmont region of Georgia, at the foothills of the Blue Ridge Mountains. The city is situated on the Yellow River, which flows through the city and is a major source of recreation for the area. The city is located 35 miles east of Atlanta and is part of the Atlanta metropolitan area.
The city has a total area of 11.2 square miles, of which 11.1 square miles is land and 0.1 square miles is water. The city is located at an elevation of 845 feet above sea level.
Economy
Covington has a diverse economy that is driven by manufacturing, retail, and healthcare. The city is home to several major employers, including the Newton Medical Center, the Covington-Newton County Chamber of Commerce, and the Newton County Board of Education.
The city is also home to several major manufacturing companies, including Georgia-Pacific, which produces paper products, and the Covington Mill, which produces textiles. The city is also home to several retail stores, including Walmart, Target, and Home Depot.
Demographics
As of the 2010 census, Covington had a population of 15,856. The racial makeup of the city was 57.2% White, 34.3% African American, 0.3% Native American, 1.2% Asian, 0.1% Pacific Islander, 4.7% from other races, and 2.4% from two or more races. Hispanic or Latino of any race were 8.3% of the population.
The median income for a household in the city was $37,845, and the median income for a family was $45,945. The per capita income for the city was $20,845. About 17.2% of families and 20.7% of the population were below the poverty line, including 28.2% of those under age 18 and 11.2% of those age 65 or over.
Covington is a diverse city with a rich history and a vibrant economy. The city is home to many notable people and is a great place to live and work. With its close proximity to Atlanta, Covington is a great place to call home.
Common Questions
What is Per Capita Income in Covington?
Per Capita income in Covington is $27,797.
What is the Median Family Income in Covington?
Median Family Income in Covington is $64,353.
What is the Median Household income in Covington?
Median Household Income in Covington is $47,278.
What is Income or Wage Gap in Covington?
Income or Wage Gap in Covington is 4.9%.
Women in Covington earn 95.1 cents for every dollar earned by a man.
What is Family Income Deficit in Covington?
Family Income Deficit in Covington is $13,215.
Families that are below poverty line in Covington earn $13,215 less on average than the poverty threshold level.
What is Inequality or Gini Index in Covington?
Inequality or Gini Index in Covington is 0.44.
What is the Total Population of Covington?
Total Population of Covington is 14,190.
What is the Total Male Population of Covington?
Total Male Population of Covington is 6,832.
What is the Total Female Population of Covington?
Total Female Population of Covington is 7,358.
What is the Ratio of Males per 100 Females in Covington?
There are 92.85 Males per 100 Females in Covington.
What is the Ratio of Females per 100 Males in Covington?
There are 107.70 Females per 100 Males in Covington.
What is the Median Population Age in Covington?
Median Population Age in Covington is 34.8 Years.
What is the Average Family Size in Covington
Average Family Size in Covington is 3.0 People.
What is the Average Household Size in Covington
Average Household Size in Covington is 2.5 People.
How Large is the Labor Force in Covington?
There are 7,232 People in the Labor Forcein in Covington.
What is the Percentage of People in the Labor Force in Covington?
64.5% of People are in the Labor Force in Covington.
What is the Unemployment Rate in Covington?
Unemployment Rate in Covington is 6.1%.