Senoia, GA Map & Demographics
Senoia Map
Senoia Overview
$46,503
PER CAPITA INCOME
$122,945
AVG FAMILY INCOME
$114,423
AVG HOUSEHOLD INCOME
24.8%
WAGE / INCOME GAP [ % ]
75.2¢/ $1
WAGE / INCOME GAP [ $ ]
0.33
INEQUALITY / GINI INDEX
5,115
TOTAL POPULATION
2,641
MALE POPULATION
2,474
FEMALE POPULATION
106.75
MALES / 100 FEMALES
93.68
FEMALES / 100 MALES
35.8
MEDIAN AGE
3.2
AVG FAMILY SIZE
2.8
AVG HOUSEHOLD SIZE
2,800
LABOR FORCE [ PEOPLE ]
71.2%
PERCENT IN LABOR FORCE
3.6%
UNEMPLOYMENT RATE
Senoia Zip Codes
Income in Senoia
Income Overview in Senoia
Per Capita Income in Senoia is $46,503, while median incomes of families and households are $122,945 and $114,423 respectively.
| Characteristic | Number | Measure |
| Per Capita Income | 5,115 | $46,503 |
| Median Family Income | 1,479 | $122,945 |
| Mean Family Income | 1,479 | $131,631 |
| Median Household Income | 1,796 | $114,423 |
| Mean Household Income | 1,796 | $123,611 |
| Income Deficit | 1,479 | $0 |
| Wage / Income Gap (%) | 5,115 | 24.81% |
| Wage / Income Gap ($) | 5,115 | 75.19¢ per $1 |
| Gini / Inequality Index | 5,115 | 0.33 |
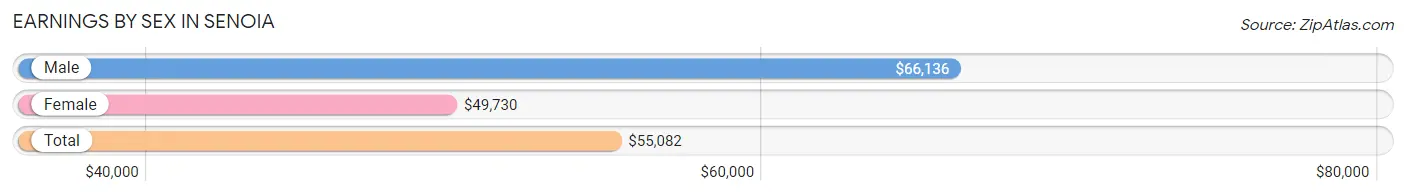
Earnings by Sex in Senoia
Average Earnings in Senoia are $55,082, $66,136 for men and $49,730 for women, a difference of 24.8%.
| Sex | Number | Average Earnings |
| Male | 1,756 (62.3%) | $66,136 |
| Female | 1,062 (37.7%) | $49,730 |
| Total | 2,818 (100.0%) | $55,082 |
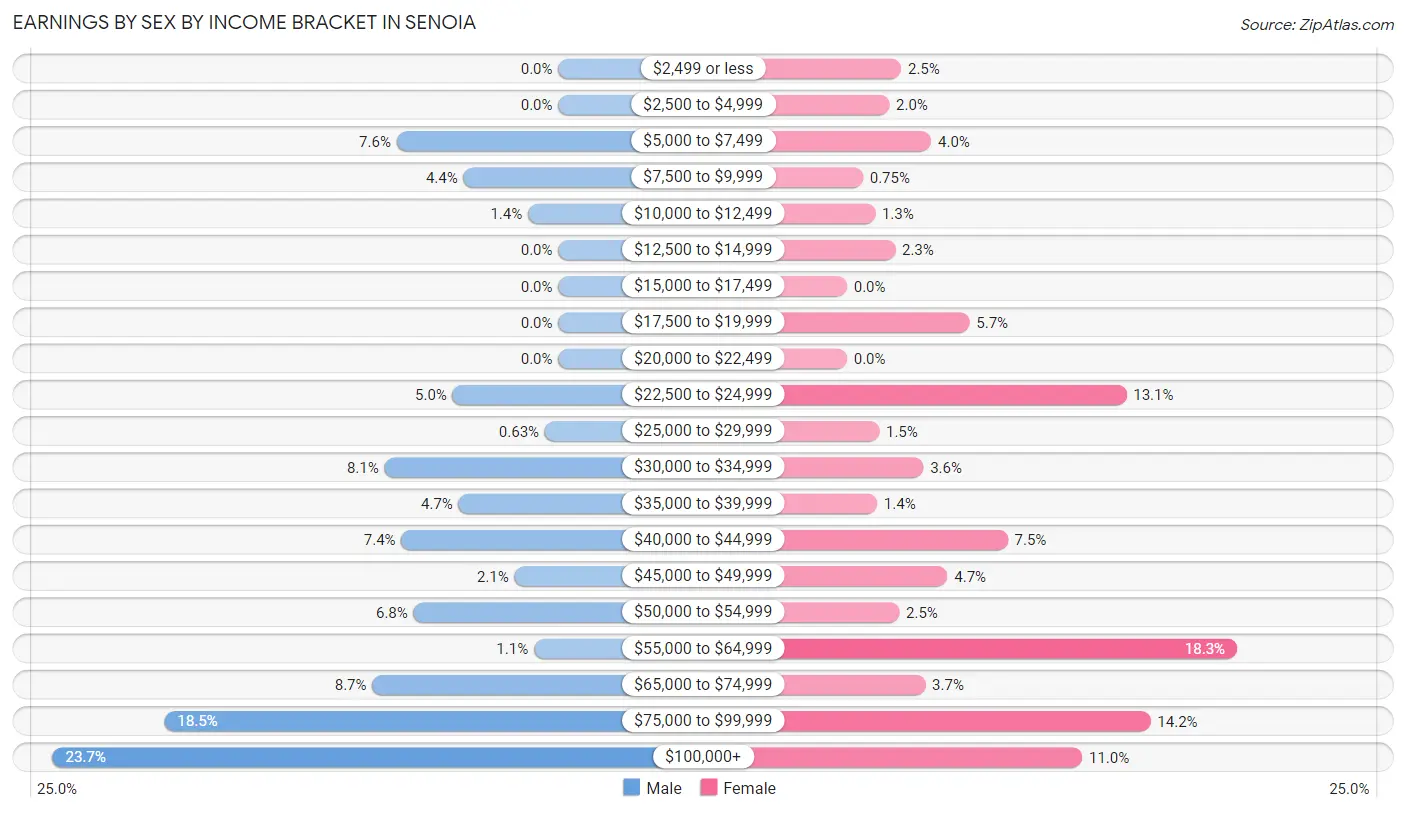
Earnings by Sex by Income Bracket in Senoia
The most common earnings brackets in Senoia are $100,000+ for men (416 | 23.7%) and $55,000 to $64,999 for women (194 | 18.3%).
| Income | Male | Female |
| $2,499 or less | 0 (0.0%) | 27 (2.5%) |
| $2,500 to $4,999 | 0 (0.0%) | 21 (2.0%) |
| $5,000 to $7,499 | 133 (7.6%) | 42 (4.0%) |
| $7,500 to $9,999 | 78 (4.4%) | 8 (0.7%) |
| $10,000 to $12,499 | 25 (1.4%) | 14 (1.3%) |
| $12,500 to $14,999 | 0 (0.0%) | 24 (2.3%) |
| $15,000 to $17,499 | 0 (0.0%) | 0 (0.0%) |
| $17,500 to $19,999 | 0 (0.0%) | 61 (5.7%) |
| $20,000 to $22,499 | 0 (0.0%) | 0 (0.0%) |
| $22,500 to $24,999 | 87 (5.0%) | 139 (13.1%) |
| $25,000 to $29,999 | 11 (0.6%) | 16 (1.5%) |
| $30,000 to $34,999 | 143 (8.1%) | 38 (3.6%) |
| $35,000 to $39,999 | 82 (4.7%) | 15 (1.4%) |
| $40,000 to $44,999 | 129 (7.3%) | 80 (7.5%) |
| $45,000 to $49,999 | 36 (2.1%) | 50 (4.7%) |
| $50,000 to $54,999 | 119 (6.8%) | 26 (2.5%) |
| $55,000 to $64,999 | 20 (1.1%) | 194 (18.3%) |
| $65,000 to $74,999 | 153 (8.7%) | 39 (3.7%) |
| $75,000 to $99,999 | 324 (18.4%) | 151 (14.2%) |
| $100,000+ | 416 (23.7%) | 117 (11.0%) |
| Total | 1,756 (100.0%) | 1,062 (100.0%) |
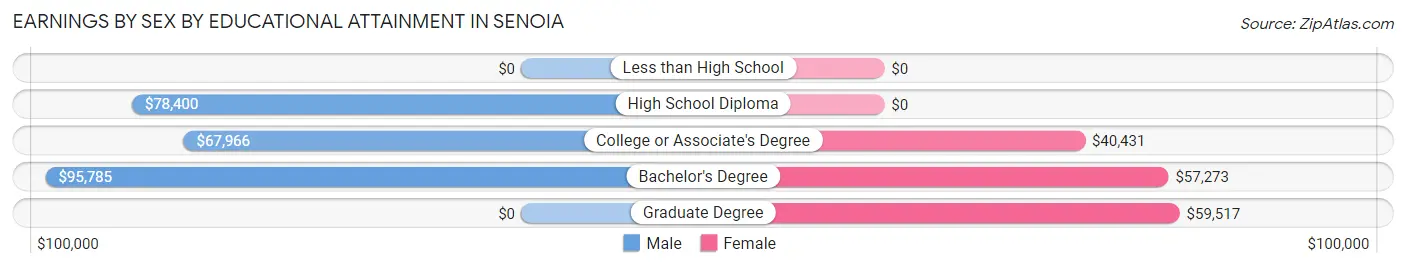
Earnings by Sex by Educational Attainment in Senoia
Average earnings in Senoia are $70,257 for men and $55,329 for women, a difference of 21.2%. Men with an educational attainment of bachelor's degree enjoy the highest average annual earnings of $95,785, while those with college or associate's degree education earn the least with $67,966. Women with an educational attainment of graduate degree earn the most with the average annual earnings of $59,517, while those with college or associate's degree education have the smallest earnings of $40,431.
| Educational Attainment | Male Income | Female Income |
| Less than High School | - | - |
| High School Diploma | $78,400 | $0 |
| College or Associate's Degree | $67,966 | $40,431 |
| Bachelor's Degree | $95,785 | $57,273 |
| Graduate Degree | - | - |
| Total | $70,257 | $55,329 |
Family Income in Senoia
Family Income Brackets in Senoia
According to the Senoia family income data, there are 632 families falling into the $100,000 to $149,999 income range, which is the most common income bracket and makes up 42.7% of all families.
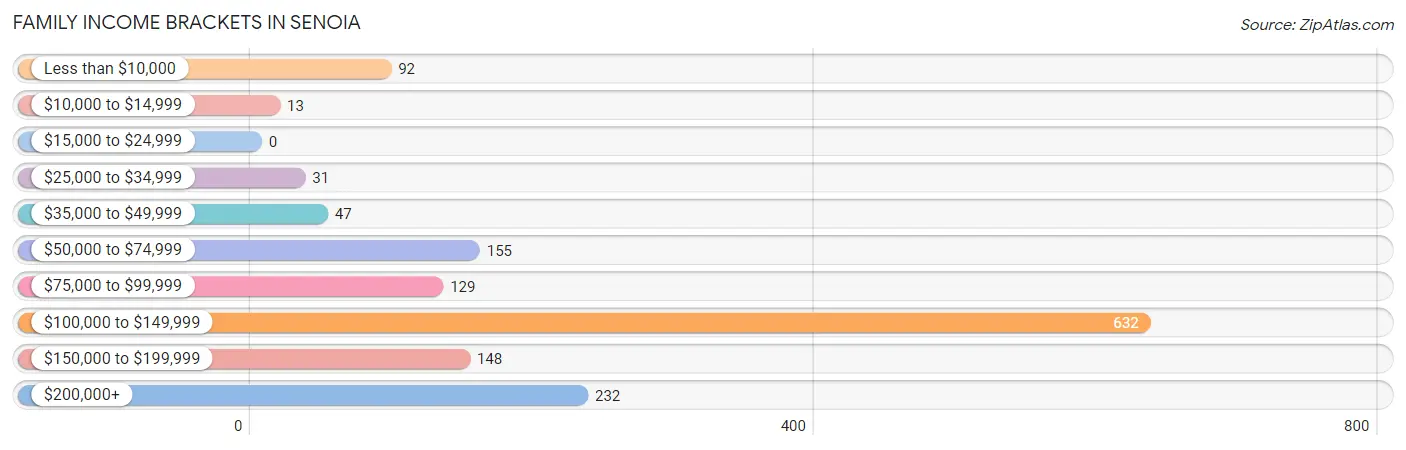
| Income Bracket | # Families | % Families |
| Less than $10,000 | 92 | 6.2% |
| $10,000 to $14,999 | 13 | 0.9% |
| $15,000 to $24,999 | 0 | 0.0% |
| $25,000 to $34,999 | 31 | 2.1% |
| $35,000 to $49,999 | 47 | 3.2% |
| $50,000 to $74,999 | 155 | 10.5% |
| $75,000 to $99,999 | 129 | 8.7% |
| $100,000 to $149,999 | 632 | 42.7% |
| $150,000 to $199,999 | 148 | 10.0% |
| $200,000+ | 232 | 15.7% |
Family Income by Famaliy Size in Senoia
5-person families (100 | 6.8%) account for the highest median family income in Senoia with $180,625 per family, while 2-person families (835 | 56.5%) have the highest median income of $61,930 per family member.
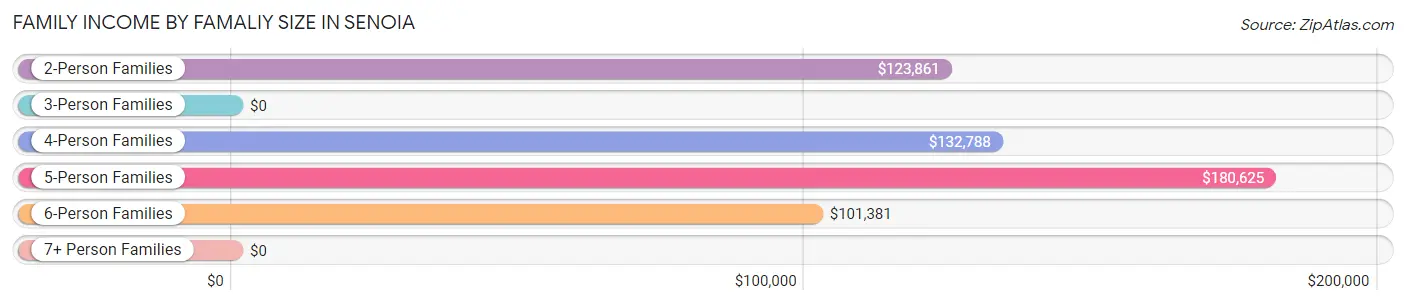
| Income Bracket | # Families | Median Income |
| 2-Person Families | 835 (56.5%) | $123,861 |
| 3-Person Families | 179 (12.1%) | $0 |
| 4-Person Families | 201 (13.6%) | $132,788 |
| 5-Person Families | 100 (6.8%) | $180,625 |
| 6-Person Families | 164 (11.1%) | $101,381 |
| 7+ Person Families | 0 (0.0%) | $0 |
| Total | 1,479 (100.0%) | $122,945 |
Family Income by Number of Earners in Senoia
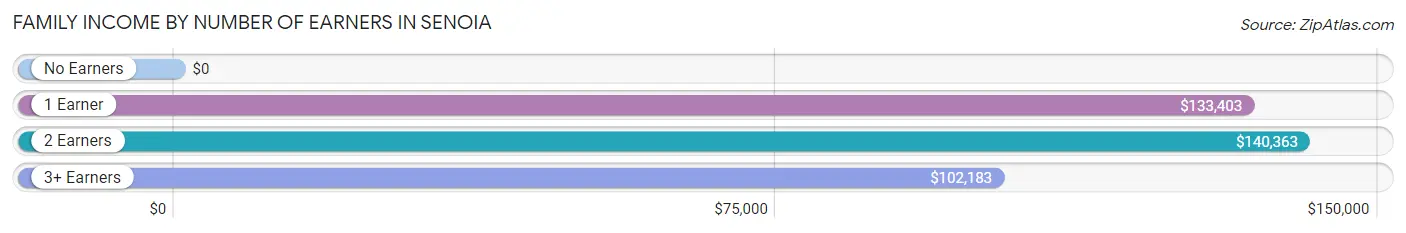
| Number of Earners | # Families | Median Income |
| No Earners | 235 (15.9%) | $0 |
| 1 Earner | 468 (31.6%) | $133,403 |
| 2 Earners | 541 (36.6%) | $140,363 |
| 3+ Earners | 235 (15.9%) | $102,183 |
| Total | 1,479 (100.0%) | $122,945 |
Household Income in Senoia
Household Income Brackets in Senoia
With 762 households falling in the category, the $100,000 to $149,999 income range is the most frequent in Senoia, accounting for 42.4% of all households. In contrast, only 13 households (0.7%) fall into the $10,000 to $14,999 income bracket, making it the least populous group.
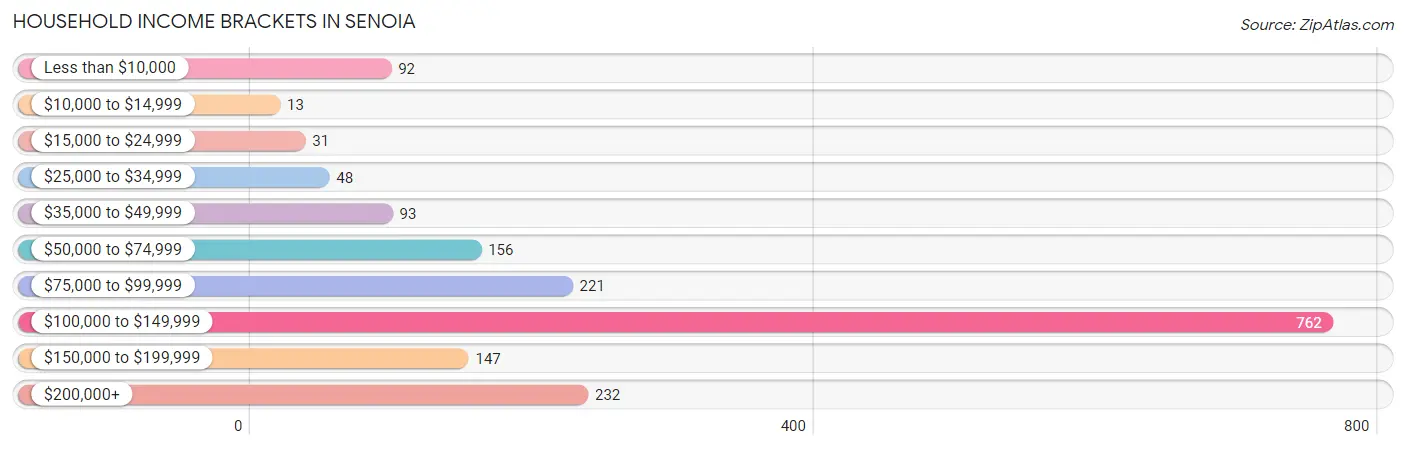
| Income Bracket | # Households | % Households |
| Less than $10,000 | 92 | 5.1% |
| $10,000 to $14,999 | 13 | 0.7% |
| $15,000 to $24,999 | 31 | 1.7% |
| $25,000 to $34,999 | 48 | 2.7% |
| $35,000 to $49,999 | 93 | 5.2% |
| $50,000 to $74,999 | 156 | 8.7% |
| $75,000 to $99,999 | 221 | 12.3% |
| $100,000 to $149,999 | 762 | 42.4% |
| $150,000 to $199,999 | 147 | 8.2% |
| $200,000+ | 232 | 12.9% |
Household Income by Householder Age in Senoia
The median household income in Senoia is $114,423, with the highest median household income of $138,311 found in the 45 to 64 years age bracket for the primary householder. A total of 755 households (42.0%) fall into this category.
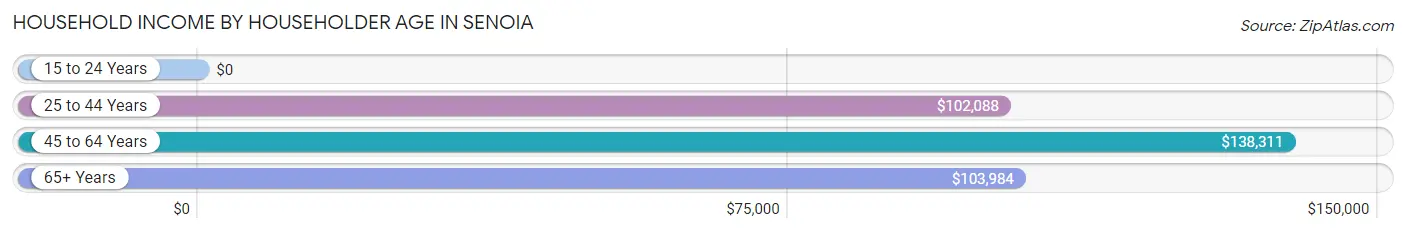
| Income Bracket | # Households | Median Income |
| 15 to 24 Years | 0 (0.0%) | $0 |
| 25 to 44 Years | 716 (39.9%) | $102,088 |
| 45 to 64 Years | 755 (42.0%) | $138,311 |
| 65+ Years | 325 (18.1%) | $103,984 |
| Total | 1,796 (100.0%) | $114,423 |
Poverty in Senoia
Income Below Poverty by Sex and Age in Senoia
With 2.6% poverty level for males and 7.0% for females among the residents of Senoia, 65 to 74 year old males and 16 and 17 year old females are the most vulnerable to poverty, with 14 males (10.0%) and 41 females (100.0%) in their respective age groups living below the poverty level.
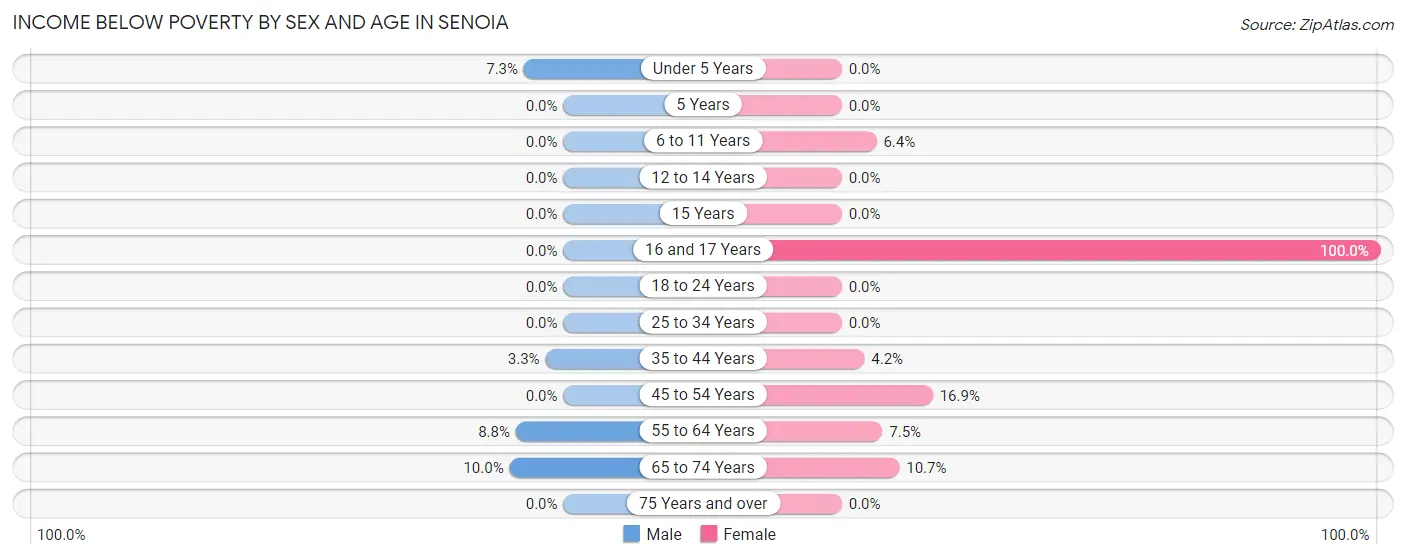
| Age Bracket | Male | Female |
| Under 5 Years | 14 (7.3%) | 0 (0.0%) |
| 5 Years | 0 (0.0%) | 0 (0.0%) |
| 6 to 11 Years | 0 (0.0%) | 15 (6.4%) |
| 12 to 14 Years | 0 (0.0%) | 0 (0.0%) |
| 15 Years | 0 (0.0%) | 0 (0.0%) |
| 16 and 17 Years | 0 (0.0%) | 41 (100.0%) |
| 18 to 24 Years | 0 (0.0%) | 0 (0.0%) |
| 25 to 34 Years | 0 (0.0%) | 0 (0.0%) |
| 35 to 44 Years | 13 (3.3%) | 13 (4.2%) |
| 45 to 54 Years | 0 (0.0%) | 52 (16.9%) |
| 55 to 64 Years | 28 (8.8%) | 27 (7.5%) |
| 65 to 74 Years | 14 (10.0%) | 25 (10.7%) |
| 75 Years and over | 0 (0.0%) | 0 (0.0%) |
| Total | 69 (2.6%) | 173 (7.0%) |
Income Above Poverty by Sex and Age in Senoia
According to the poverty statistics in Senoia, males aged 5 years and females aged under 5 years are the age groups that are most secure financially, with 100.0% of males and 100.0% of females in these age groups living above the poverty line.
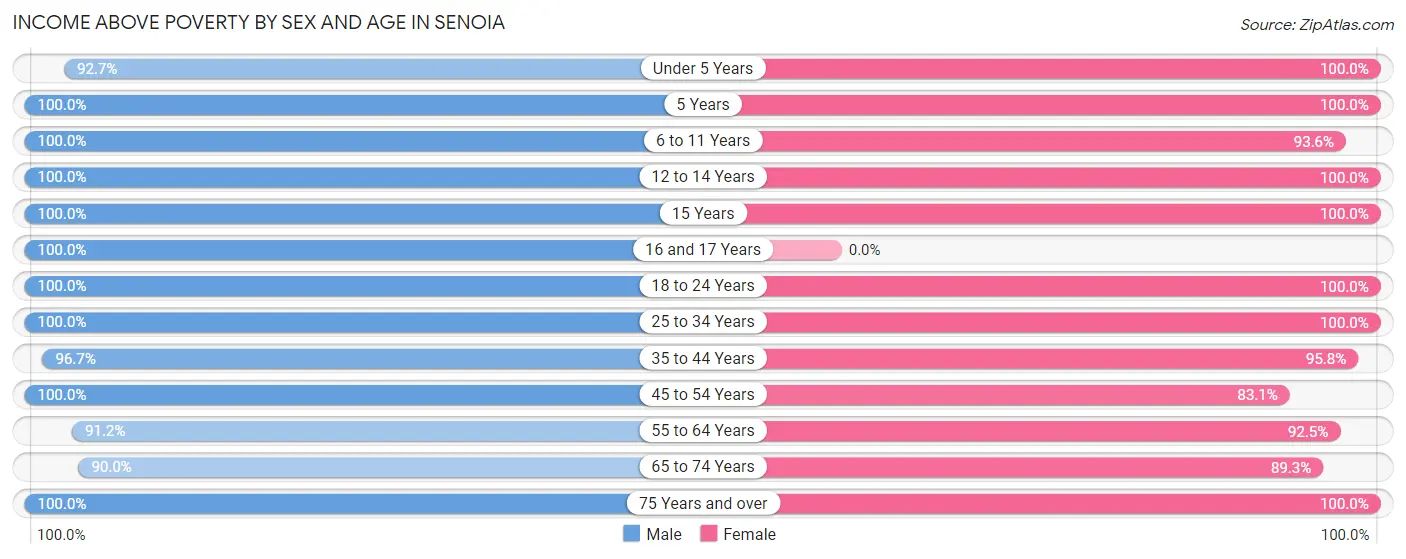
| Age Bracket | Male | Female |
| Under 5 Years | 177 (92.7%) | 81 (100.0%) |
| 5 Years | 43 (100.0%) | 93 (100.0%) |
| 6 to 11 Years | 357 (100.0%) | 218 (93.6%) |
| 12 to 14 Years | 23 (100.0%) | 72 (100.0%) |
| 15 Years | 20 (100.0%) | 69 (100.0%) |
| 16 and 17 Years | 61 (100.0%) | 0 (0.0%) |
| 18 to 24 Years | 159 (100.0%) | 95 (100.0%) |
| 25 to 34 Years | 476 (100.0%) | 443 (100.0%) |
| 35 to 44 Years | 377 (96.7%) | 298 (95.8%) |
| 45 to 54 Years | 379 (100.0%) | 256 (83.1%) |
| 55 to 64 Years | 289 (91.2%) | 332 (92.5%) |
| 65 to 74 Years | 126 (90.0%) | 209 (89.3%) |
| 75 Years and over | 85 (100.0%) | 135 (100.0%) |
| Total | 2,572 (97.4%) | 2,301 (93.0%) |
Income Below Poverty Among Married-Couple Families in Senoia
The poverty statistics for married-couple families in Senoia show that 4.4% or 53 of the total 1,206 families live below the poverty line. Families with no children have the highest poverty rate of 5.8%, comprising of 40 families. On the other hand, families with 3 or 4 children have the lowest poverty rate of 0.0%, which includes 0 families.
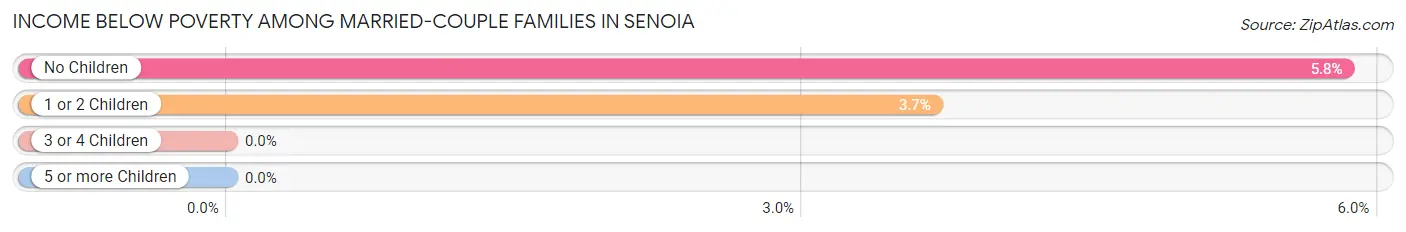
| Children | Above Poverty | Below Poverty |
| No Children | 646 (94.2%) | 40 (5.8%) |
| 1 or 2 Children | 340 (96.3%) | 13 (3.7%) |
| 3 or 4 Children | 167 (100.0%) | 0 (0.0%) |
| 5 or more Children | 0 (0.0%) | 0 (0.0%) |
| Total | 1,153 (95.6%) | 53 (4.4%) |
Income Below Poverty Among Single-Parent Households in Senoia
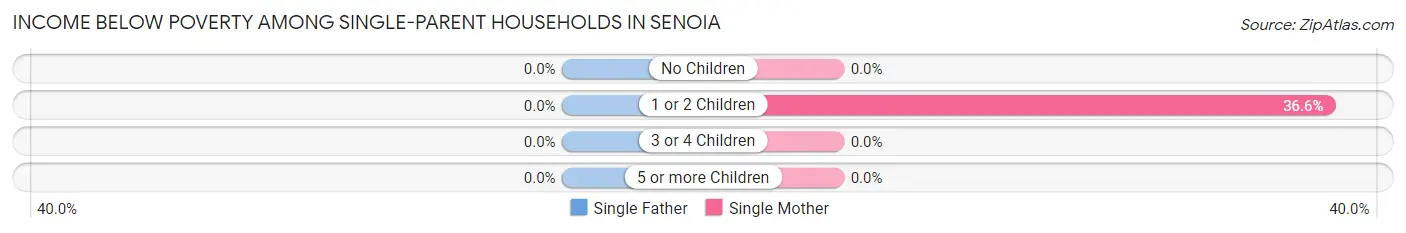
| Children | Single Father | Single Mother |
| No Children | 0 (0.0%) | 0 (0.0%) |
| 1 or 2 Children | 0 (0.0%) | 52 (36.6%) |
| 3 or 4 Children | 0 (0.0%) | 0 (0.0%) |
| 5 or more Children | 0 (0.0%) | 0 (0.0%) |
| Total | 0 (0.0%) | 52 (21.9%) |
Income Below Poverty Among Married-Couple vs Single-Parent Households in Senoia
The poverty data for Senoia shows that 53 of the married-couple family households (4.4%) and 52 of the single-parent households (19.1%) are living below the poverty level. Within the married-couple family households, those with no children have the highest poverty rate, with 40 households (5.8%) falling below the poverty line. Among the single-parent households, those with 1 or 2 children have the highest poverty rate, with 52 household (36.6%) living below poverty.
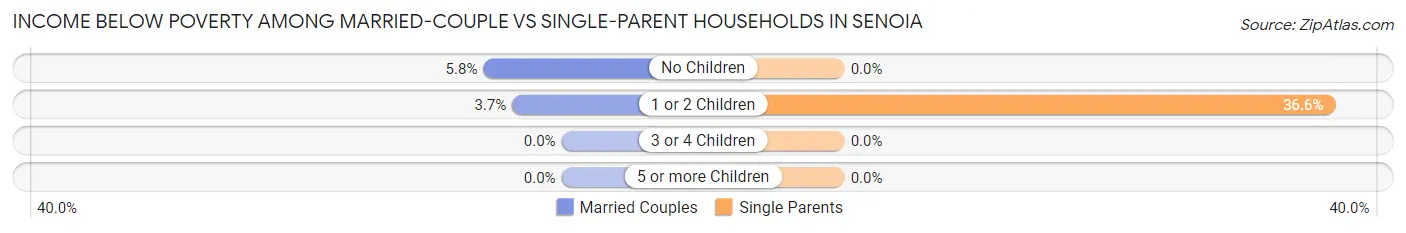
| Children | Married-Couple Families | Single-Parent Households |
| No Children | 40 (5.8%) | 0 (0.0%) |
| 1 or 2 Children | 13 (3.7%) | 52 (36.6%) |
| 3 or 4 Children | 0 (0.0%) | 0 (0.0%) |
| 5 or more Children | 0 (0.0%) | 0 (0.0%) |
| Total | 53 (4.4%) | 52 (19.1%) |
Race in Senoia
The most populous races in Senoia are White / Caucasian (3,785 | 74.0%), Black / African American (933 | 18.2%), and Two or more Races (336 | 6.6%).
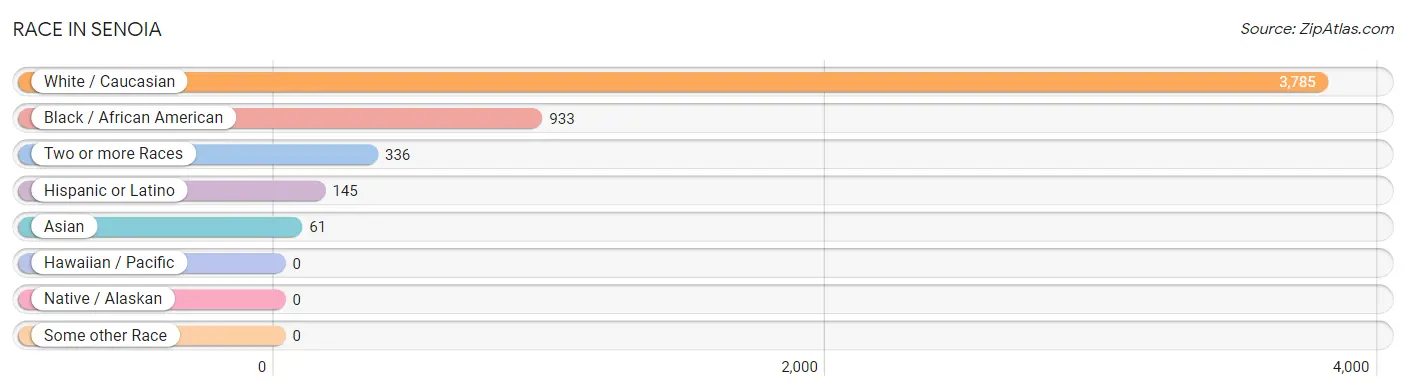
| Race | # Population | % Population |
| Asian | 61 | 1.2% |
| Black / African American | 933 | 18.2% |
| Hawaiian / Pacific | 0 | 0.0% |
| Hispanic or Latino | 145 | 2.8% |
| Native / Alaskan | 0 | 0.0% |
| White / Caucasian | 3,785 | 74.0% |
| Two or more Races | 336 | 6.6% |
| Some other Race | 0 | 0.0% |
| Total | 5,115 | 100.0% |
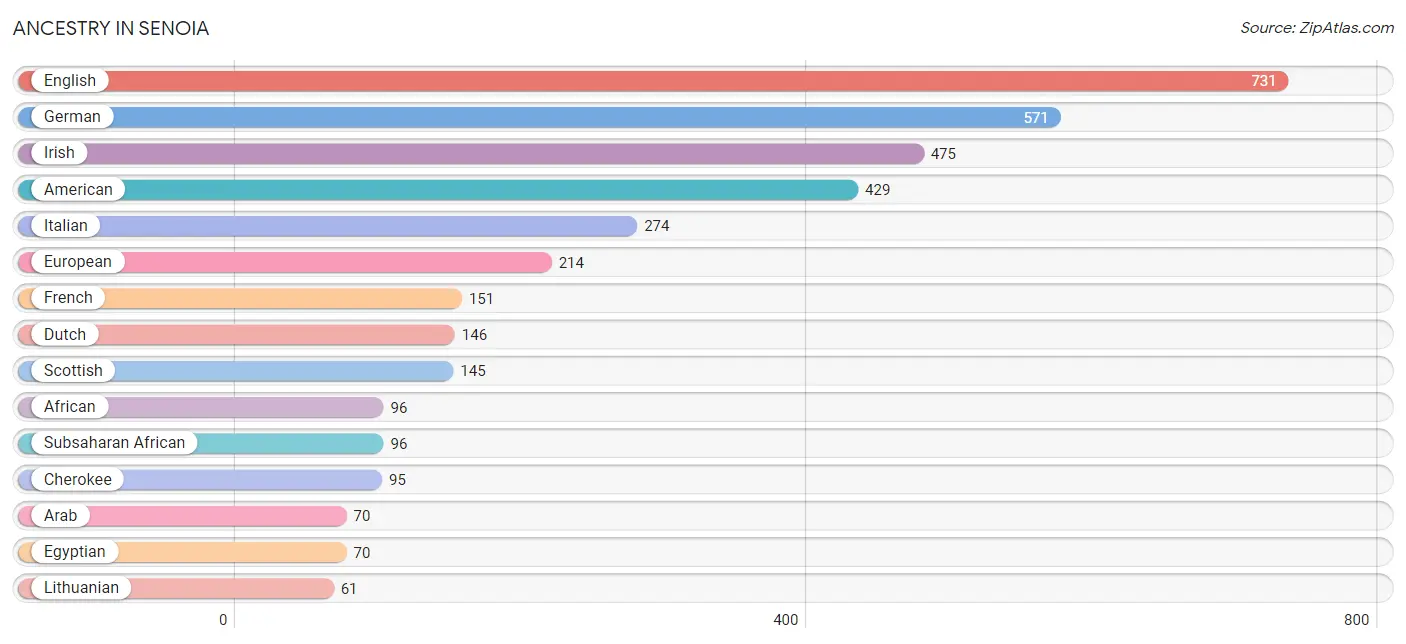
Ancestry in Senoia
The most populous ancestries reported in Senoia are English (731 | 14.3%), German (571 | 11.2%), Irish (475 | 9.3%), American (429 | 8.4%), and Italian (274 | 5.4%), together accounting for 48.5% of all Senoia residents.
| Ancestry | # Population | % Population |
| African | 96 | 1.9% |
| American | 429 | 8.4% |
| Arab | 70 | 1.4% |
| Argentinean | 22 | 0.4% |
| Belgian | 16 | 0.3% |
| Burmese | 46 | 0.9% |
| Canadian | 15 | 0.3% |
| Central American | 17 | 0.3% |
| Cherokee | 95 | 1.9% |
| Colombian | 24 | 0.5% |
| Costa Rican | 17 | 0.3% |
| Dutch | 146 | 2.9% |
| Eastern European | 31 | 0.6% |
| Egyptian | 70 | 1.4% |
| English | 731 | 14.3% |
| European | 214 | 4.2% |
| French | 151 | 2.9% |
| German | 571 | 11.2% |
| Hungarian | 8 | 0.2% |
| Indian (Asian) | 36 | 0.7% |
| Irish | 475 | 9.3% |
| Italian | 274 | 5.4% |
| Jamaican | 30 | 0.6% |
| Korean | 29 | 0.6% |
| Lithuanian | 61 | 1.2% |
| Lumbee | 10 | 0.2% |
| Polish | 44 | 0.9% |
| Scandinavian | 31 | 0.6% |
| Scotch-Irish | 12 | 0.2% |
| Scottish | 145 | 2.8% |
| South American | 46 | 0.9% |
| Spaniard | 25 | 0.5% |
| Spanish | 57 | 1.1% |
| Subsaharan African | 96 | 1.9% |
| Thai | 25 | 0.5% |
| Welsh | 17 | 0.3% | View All 36 Rows |
Immigrants in Senoia
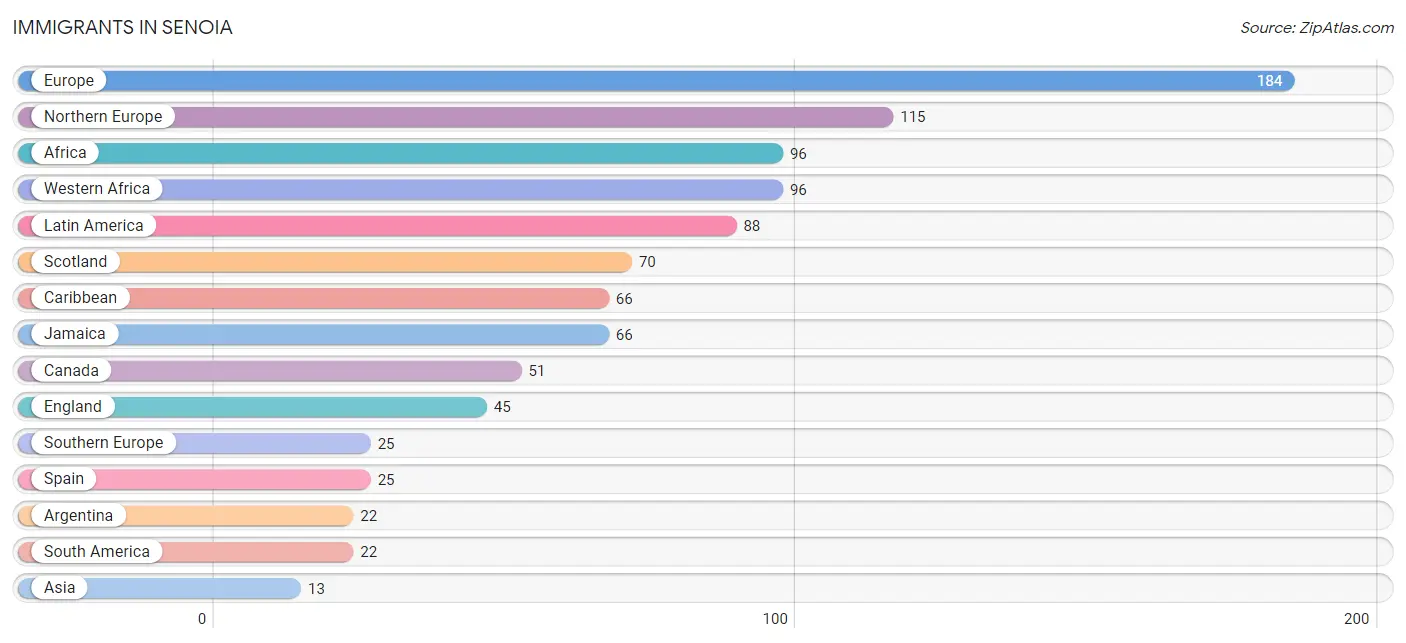
The most numerous immigrant groups reported in Senoia came from Europe (184 | 3.6%), Northern Europe (115 | 2.2%), Africa (96 | 1.9%), Western Africa (96 | 1.9%), and Latin America (88 | 1.7%), together accounting for 11.3% of all Senoia residents.
| Immigration Origin | # Population | % Population |
| Africa | 96 | 1.9% |
| Argentina | 22 | 0.4% |
| Asia | 13 | 0.3% |
| Canada | 51 | 1.0% |
| Caribbean | 66 | 1.3% |
| England | 45 | 0.9% |
| Europe | 184 | 3.6% |
| Jamaica | 66 | 1.3% |
| Latin America | 88 | 1.7% |
| Northern Europe | 115 | 2.2% |
| Philippines | 13 | 0.3% |
| Scotland | 70 | 1.4% |
| South America | 22 | 0.4% |
| South Eastern Asia | 13 | 0.3% |
| Southern Europe | 25 | 0.5% |
| Spain | 25 | 0.5% |
| Western Africa | 96 | 1.9% | View All 17 Rows |
Sex and Age in Senoia
Sex and Age in Senoia
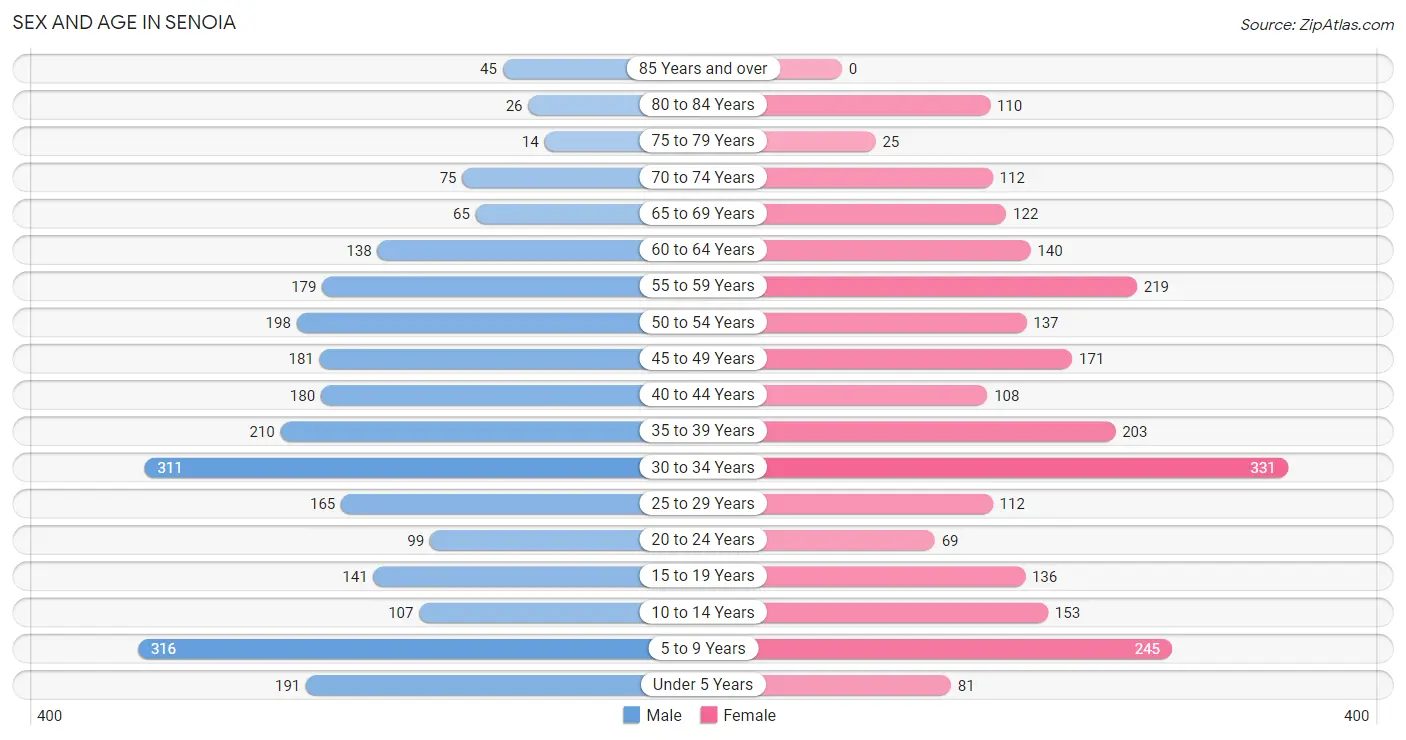
The most populous age groups in Senoia are 5 to 9 Years (316 | 12.0%) for men and 30 to 34 Years (331 | 13.4%) for women.
| Age Bracket | Male | Female |
| Under 5 Years | 191 (7.2%) | 81 (3.3%) |
| 5 to 9 Years | 316 (12.0%) | 245 (9.9%) |
| 10 to 14 Years | 107 (4.1%) | 153 (6.2%) |
| 15 to 19 Years | 141 (5.3%) | 136 (5.5%) |
| 20 to 24 Years | 99 (3.7%) | 69 (2.8%) |
| 25 to 29 Years | 165 (6.2%) | 112 (4.5%) |
| 30 to 34 Years | 311 (11.8%) | 331 (13.4%) |
| 35 to 39 Years | 210 (8.0%) | 203 (8.2%) |
| 40 to 44 Years | 180 (6.8%) | 108 (4.4%) |
| 45 to 49 Years | 181 (6.9%) | 171 (6.9%) |
| 50 to 54 Years | 198 (7.5%) | 137 (5.5%) |
| 55 to 59 Years | 179 (6.8%) | 219 (8.8%) |
| 60 to 64 Years | 138 (5.2%) | 140 (5.7%) |
| 65 to 69 Years | 65 (2.5%) | 122 (4.9%) |
| 70 to 74 Years | 75 (2.8%) | 112 (4.5%) |
| 75 to 79 Years | 14 (0.5%) | 25 (1.0%) |
| 80 to 84 Years | 26 (1.0%) | 110 (4.4%) |
| 85 Years and over | 45 (1.7%) | 0 (0.0%) |
| Total | 2,641 (100.0%) | 2,474 (100.0%) |
Families and Households in Senoia
Median Family Size in Senoia
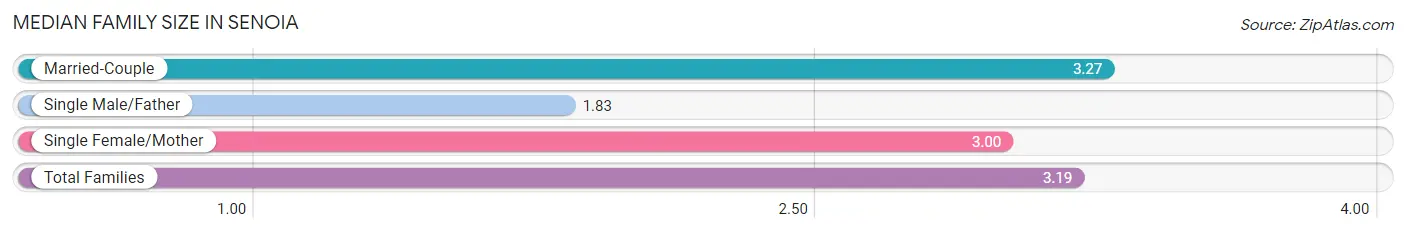
The median family size in Senoia is 3.19 persons per family, with married-couple families (1,206 | 81.5%) accounting for the largest median family size of 3.27 persons per family. On the other hand, single male/father families (36 | 2.4%) represent the smallest median family size with 1.83 persons per family.
| Family Type | # Families | Family Size |
| Married-Couple | 1,206 (81.5%) | 3.27 |
| Single Male/Father | 36 (2.4%) | 1.83 |
| Single Female/Mother | 237 (16.0%) | 3.00 |
| Total Families | 1,479 (100.0%) | 3.19 |
Median Household Size in Senoia
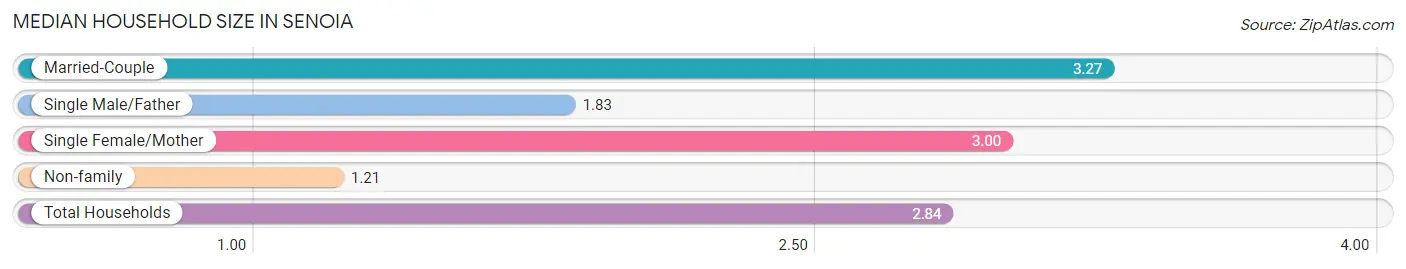
The median household size in Senoia is 2.84 persons per household, with married-couple households (1,206 | 67.1%) accounting for the largest median household size of 3.27 persons per household. non-family households (317 | 17.6%) represent the smallest median household size with 1.21 persons per household.
| Household Type | # Households | Household Size |
| Married-Couple | 1,206 (67.1%) | 3.27 |
| Single Male/Father | 36 (2.0%) | 1.83 |
| Single Female/Mother | 237 (13.2%) | 3.00 |
| Non-family | 317 (17.6%) | 1.21 |
| Total Households | 1,796 (100.0%) | 2.84 |
Household Size by Marriage Status in Senoia
Out of a total of 1,796 households in Senoia, 1,479 (82.4%) are family households, while 317 (17.6%) are nonfamily households. The most numerous type of family households are 2-person households, comprising 835, and the most common type of nonfamily households are 1-person households, comprising 257.
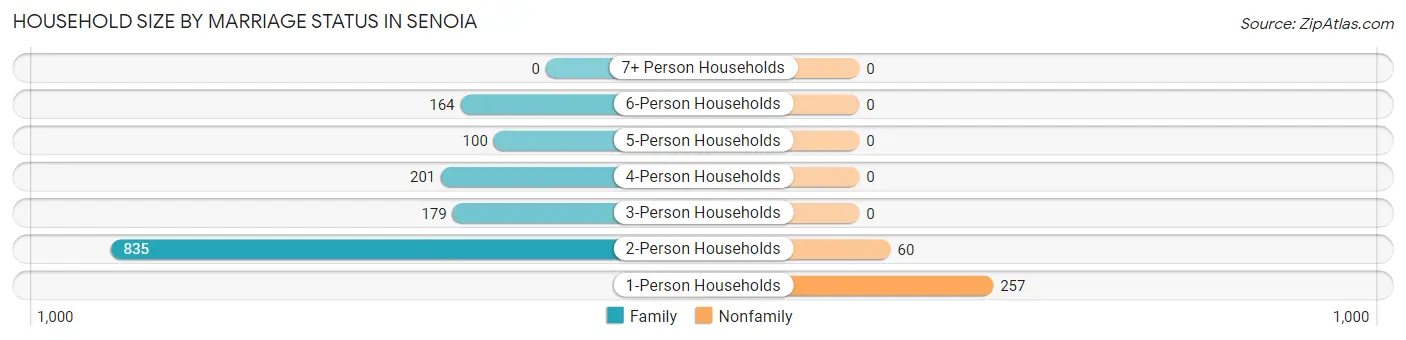
| Household Size | Family Households | Nonfamily Households |
| 1-Person Households | - | 257 (14.3%) |
| 2-Person Households | 835 (46.5%) | 60 (3.3%) |
| 3-Person Households | 179 (10.0%) | 0 (0.0%) |
| 4-Person Households | 201 (11.2%) | 0 (0.0%) |
| 5-Person Households | 100 (5.6%) | 0 (0.0%) |
| 6-Person Households | 164 (9.1%) | 0 (0.0%) |
| 7+ Person Households | 0 (0.0%) | 0 (0.0%) |
| Total | 1,479 (82.4%) | 317 (17.6%) |
Female Fertility in Senoia
Fertility by Age in Senoia
Average fertility rate in Senoia is 46.0 births per 1,000 women. Women in the age bracket of 20 to 34 years have the highest fertility rate with 102.0 births per 1,000 women. Women in the age bracket of 20 to 34 years acount for 100.0% of all women with births.
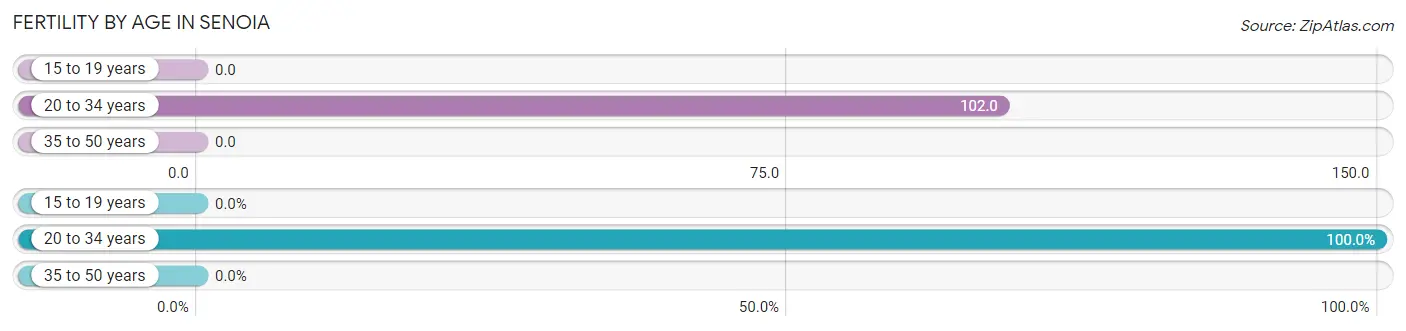
| Age Bracket | Women with Births | Births / 1,000 Women |
| 15 to 19 years | 0 (0.0%) | 0.0 |
| 20 to 34 years | 52 (100.0%) | 102.0 |
| 35 to 50 years | 0 (0.0%) | 0.0 |
| Total | 52 (100.0%) | 46.0 |
Fertility by Age by Marriage Status in Senoia
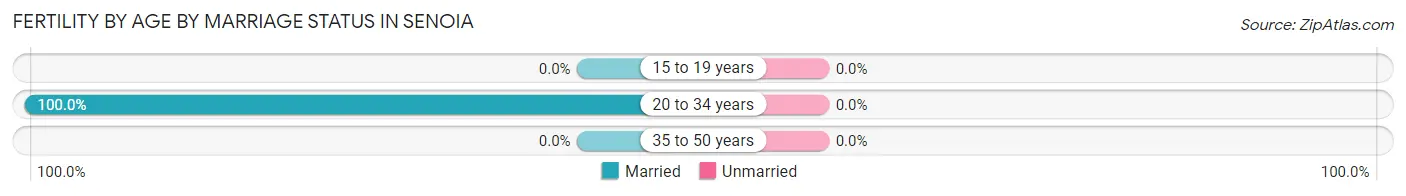
| Age Bracket | Married | Unmarried |
| 15 to 19 years | 0 (0.0%) | 0 (0.0%) |
| 20 to 34 years | 52 (100.0%) | 0 (0.0%) |
| 35 to 50 years | 0 (0.0%) | 0 (0.0%) |
| Total | 52 (100.0%) | 0 (0.0%) |
Fertility by Education in Senoia
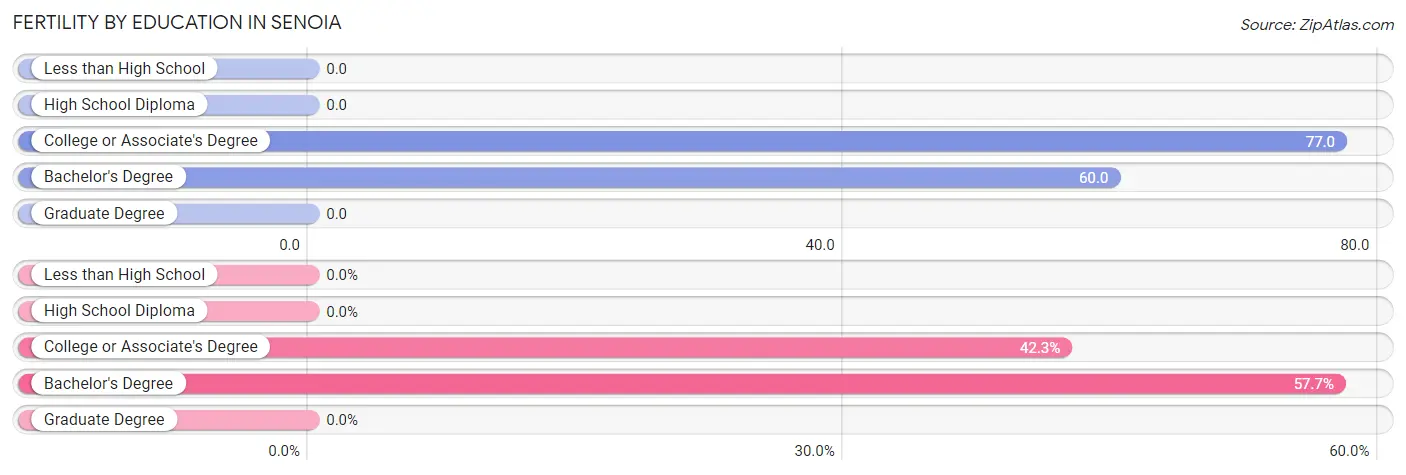
| Educational Attainment | Women with Births | Births / 1,000 Women |
| Less than High School | 0 (0.0%) | 0.0 |
| High School Diploma | 0 (0.0%) | 0.0 |
| College or Associate's Degree | 22 (42.3%) | 77.0 |
| Bachelor's Degree | 30 (57.7%) | 60.0 |
| Graduate Degree | 0 (0.0%) | 0.0 |
| Total | 52 (100.0%) | 46.0 |
Fertility by Education by Marriage Status in Senoia
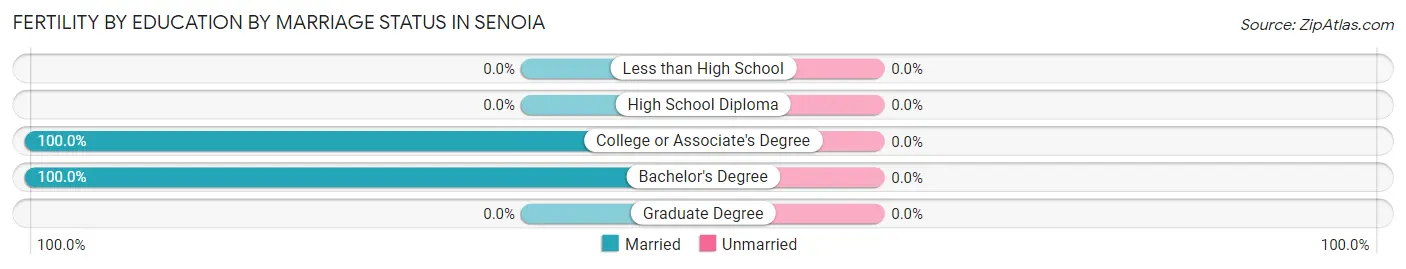
| Educational Attainment | Married | Unmarried |
| Less than High School | 0 (0.0%) | 0 (0.0%) |
| High School Diploma | 0 (0.0%) | 0 (0.0%) |
| College or Associate's Degree | 22 (100.0%) | 0 (0.0%) |
| Bachelor's Degree | 30 (100.0%) | 0 (0.0%) |
| Graduate Degree | 0 (0.0%) | 0 (0.0%) |
| Total | 52 (100.0%) | 0 (0.0%) |
Employment Characteristics in Senoia
Employment by Class of Employer in Senoia
Among the 2,644 employed individuals in Senoia, private company employees (1,766 | 66.8%), not-for-profit organizations (236 | 8.9%), and self-employed (incorporated) (227 | 8.6%) make up the most common classes of employment.
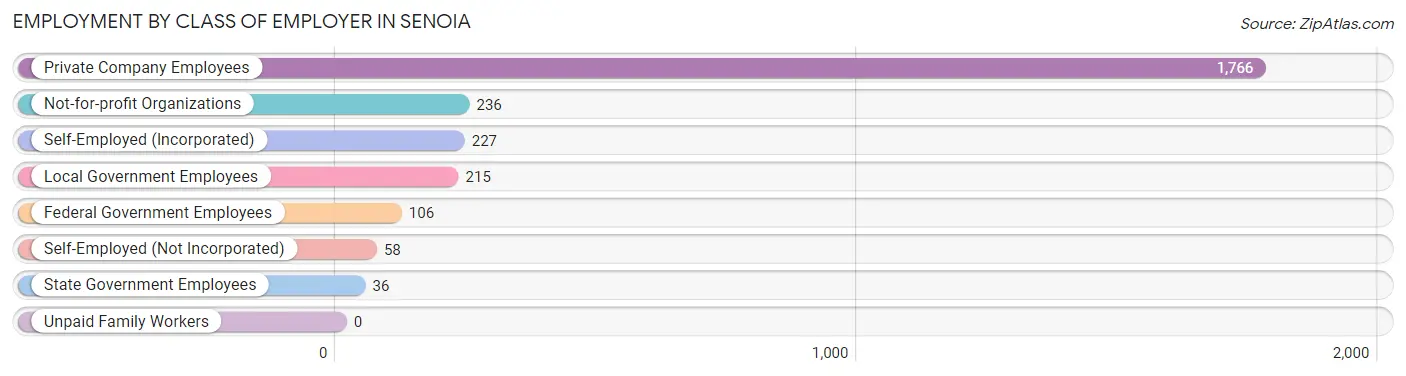
| Employer Class | # Employees | % Employees |
| Private Company Employees | 1,766 | 66.8% |
| Self-Employed (Incorporated) | 227 | 8.6% |
| Self-Employed (Not Incorporated) | 58 | 2.2% |
| Not-for-profit Organizations | 236 | 8.9% |
| Local Government Employees | 215 | 8.1% |
| State Government Employees | 36 | 1.4% |
| Federal Government Employees | 106 | 4.0% |
| Unpaid Family Workers | 0 | 0.0% |
| Total | 2,644 | 100.0% |
Employment Status by Age in Senoia
According to the labor force statistics for Senoia, out of the total population over 16 years of age (3,933), 71.2% or 2,800 individuals are in the labor force, with 3.6% or 101 of them unemployed. The age group with the highest labor force participation rate is 20 to 24 years, with 100.0% or 168 individuals in the labor force. Within the labor force, the 20 to 24 years age range has the highest percentage of unemployed individuals, with 16.1% or 27 of them being unemployed.
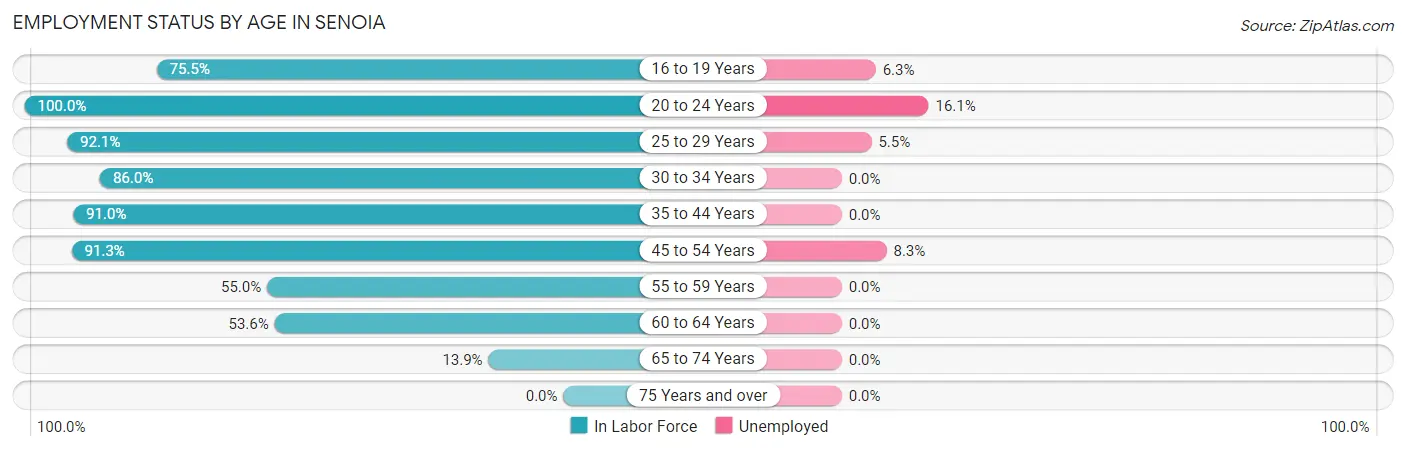
| Age Bracket | In Labor Force | Unemployed |
| 16 to 19 Years | 142 (75.5%) | 9 (6.3%) |
| 20 to 24 Years | 168 (100.0%) | 27 (16.1%) |
| 25 to 29 Years | 255 (92.1%) | 14 (5.5%) |
| 30 to 34 Years | 552 (86.0%) | 0 (0.0%) |
| 35 to 44 Years | 638 (91.0%) | 0 (0.0%) |
| 45 to 54 Years | 627 (91.3%) | 52 (8.3%) |
| 55 to 59 Years | 219 (55.0%) | 0 (0.0%) |
| 60 to 64 Years | 149 (53.6%) | 0 (0.0%) |
| 65 to 74 Years | 52 (13.9%) | 0 (0.0%) |
| 75 Years and over | 0 (0.0%) | 0 (0.0%) |
| Total | 2,800 (71.2%) | 101 (3.6%) |
Employment Status by Educational Attainment in Senoia
According to labor force statistics for Senoia, 81.8% of individuals (2,440) out of the total population between 25 and 64 years of age (2,983) are in the labor force, with 2.7% or 66 of them being unemployed. The group with the highest labor force participation rate are those with the educational attainment of less than high school, with 93.8% or 121 individuals in the labor force. Within the labor force, individuals with high school diploma education have the highest percentage of unemployment, with 15.2% or 52 of them being unemployed.
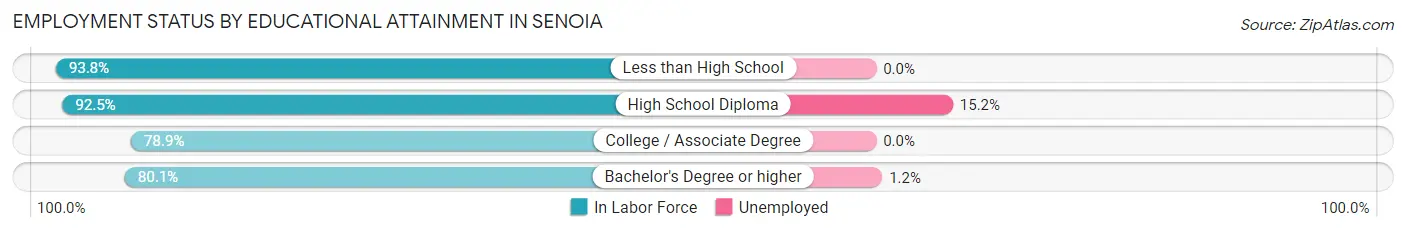
| Educational Attainment | In Labor Force | Unemployed |
| Less than High School | 121 (93.8%) | 0 (0.0%) |
| High School Diploma | 343 (92.5%) | 56 (15.2%) |
| College / Associate Degree | 818 (78.9%) | 0 (0.0%) |
| Bachelor's Degree or higher | 1,158 (80.1%) | 17 (1.2%) |
| Total | 2,440 (81.8%) | 81 (2.7%) |
Employment Occupations by Sex in Senoia
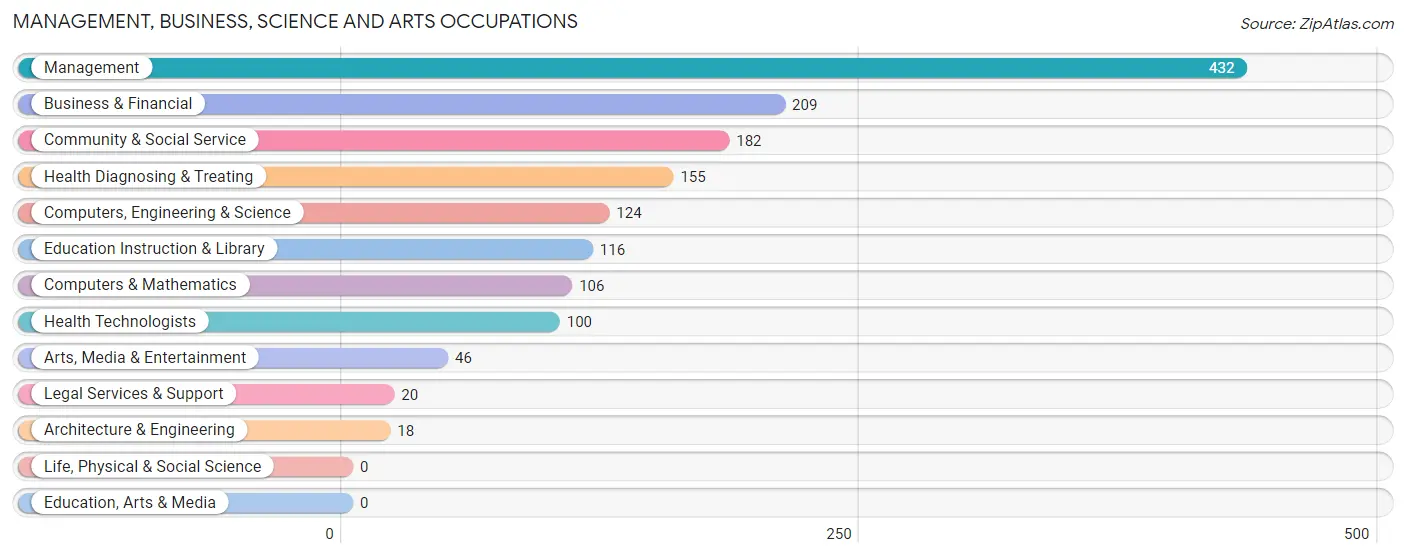
Management, Business, Science and Arts Occupations
The most common Management, Business, Science and Arts occupations in Senoia are Management (432 | 16.0%), Business & Financial (209 | 7.7%), Community & Social Service (182 | 6.7%), Health Diagnosing & Treating (155 | 5.7%), and Computers, Engineering & Science (124 | 4.6%).
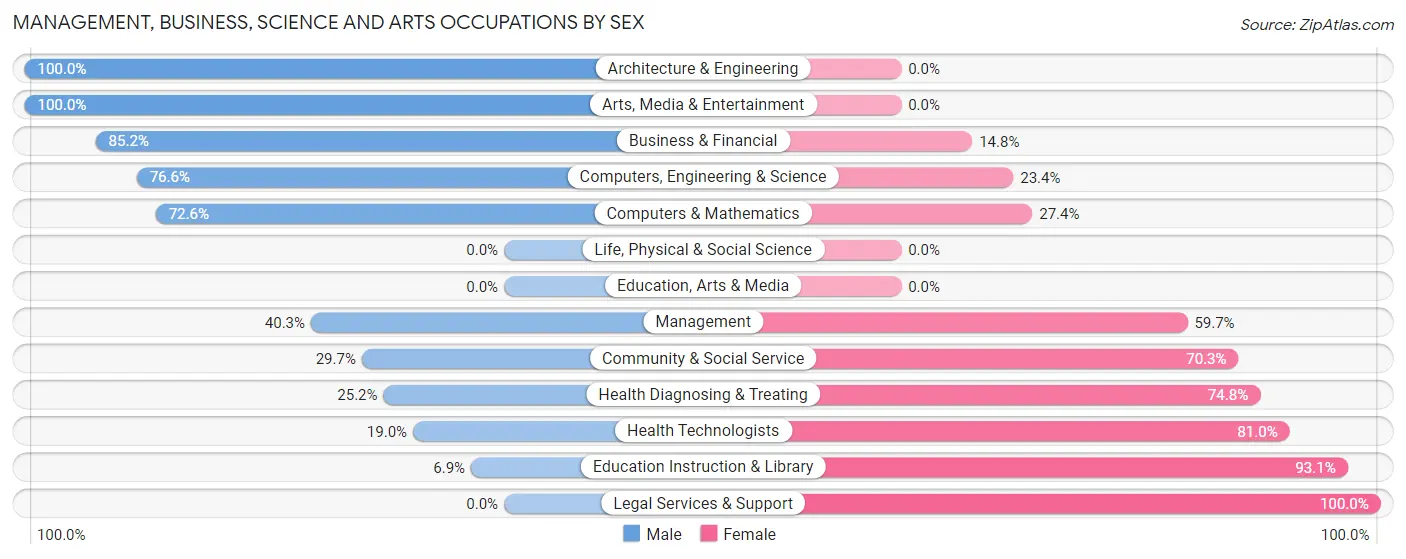
Management, Business, Science and Arts Occupations by Sex
Within the Management, Business, Science and Arts occupations in Senoia, the most male-oriented occupations are Architecture & Engineering (100.0%), Arts, Media & Entertainment (100.0%), and Business & Financial (85.2%), while the most female-oriented occupations are Legal Services & Support (100.0%), Education Instruction & Library (93.1%), and Health Technologists (81.0%).
| Occupation | Male | Female |
| Management | 174 (40.3%) | 258 (59.7%) |
| Business & Financial | 178 (85.2%) | 31 (14.8%) |
| Computers, Engineering & Science | 95 (76.6%) | 29 (23.4%) |
| Computers & Mathematics | 77 (72.6%) | 29 (27.4%) |
| Architecture & Engineering | 18 (100.0%) | 0 (0.0%) |
| Life, Physical & Social Science | 0 (0.0%) | 0 (0.0%) |
| Community & Social Service | 54 (29.7%) | 128 (70.3%) |
| Education, Arts & Media | 0 (0.0%) | 0 (0.0%) |
| Legal Services & Support | 0 (0.0%) | 20 (100.0%) |
| Education Instruction & Library | 8 (6.9%) | 108 (93.1%) |
| Arts, Media & Entertainment | 46 (100.0%) | 0 (0.0%) |
| Health Diagnosing & Treating | 39 (25.2%) | 116 (74.8%) |
| Health Technologists | 19 (19.0%) | 81 (81.0%) |
| Total (Category) | 540 (49.0%) | 562 (51.0%) |
| Total (Overall) | 1,720 (63.7%) | 980 (36.3%) |
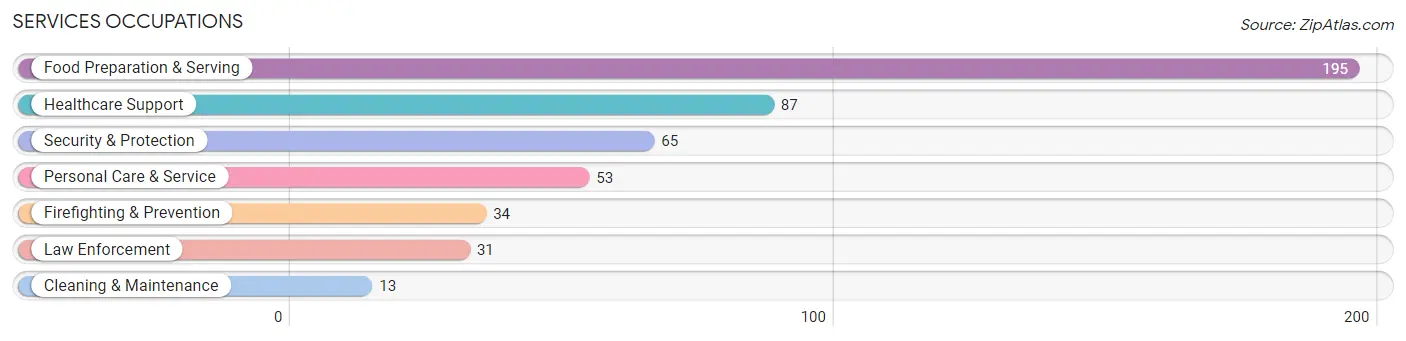
Services Occupations
The most common Services occupations in Senoia are Food Preparation & Serving (195 | 7.2%), Healthcare Support (87 | 3.2%), Security & Protection (65 | 2.4%), Personal Care & Service (53 | 2.0%), and Firefighting & Prevention (34 | 1.3%).
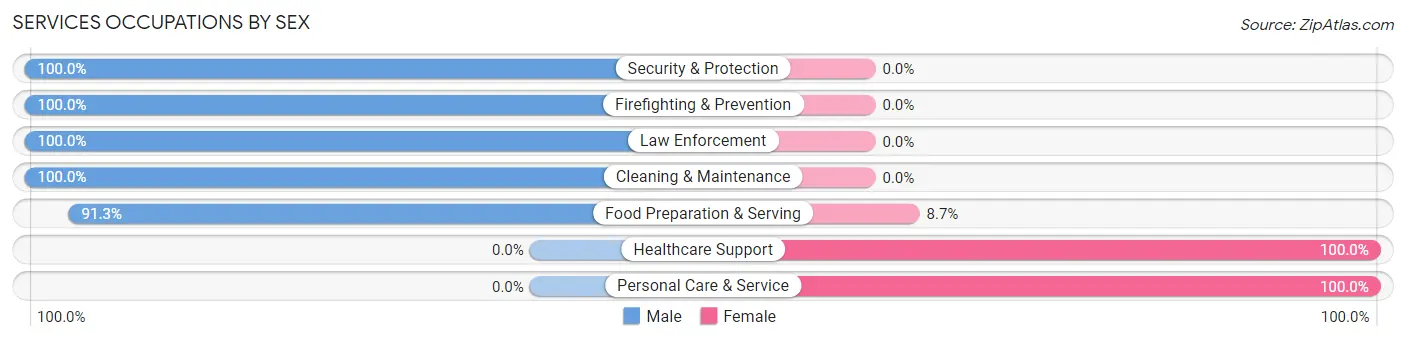
Services Occupations by Sex
Within the Services occupations in Senoia, the most male-oriented occupations are Security & Protection (100.0%), Firefighting & Prevention (100.0%), and Law Enforcement (100.0%), while the most female-oriented occupations are Healthcare Support (100.0%), Personal Care & Service (100.0%), and Food Preparation & Serving (8.7%).
| Occupation | Male | Female |
| Healthcare Support | 0 (0.0%) | 87 (100.0%) |
| Security & Protection | 65 (100.0%) | 0 (0.0%) |
| Firefighting & Prevention | 34 (100.0%) | 0 (0.0%) |
| Law Enforcement | 31 (100.0%) | 0 (0.0%) |
| Food Preparation & Serving | 178 (91.3%) | 17 (8.7%) |
| Cleaning & Maintenance | 13 (100.0%) | 0 (0.0%) |
| Personal Care & Service | 0 (0.0%) | 53 (100.0%) |
| Total (Category) | 256 (62.0%) | 157 (38.0%) |
| Total (Overall) | 1,720 (63.7%) | 980 (36.3%) |
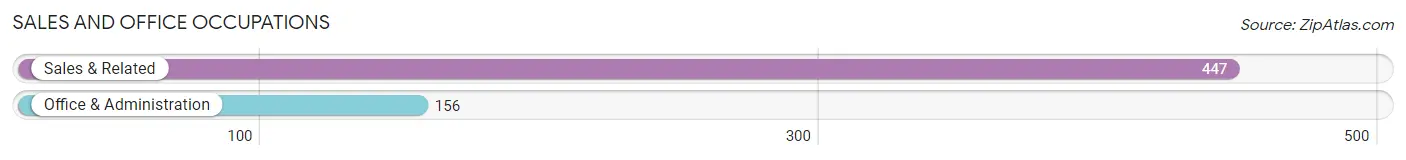
Sales and Office Occupations
The most common Sales and Office occupations in Senoia are Sales & Related (447 | 16.6%), and Office & Administration (156 | 5.8%).
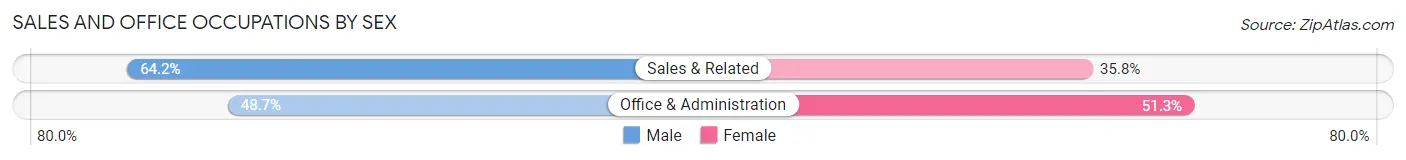
Sales and Office Occupations by Sex
| Occupation | Male | Female |
| Sales & Related | 287 (64.2%) | 160 (35.8%) |
| Office & Administration | 76 (48.7%) | 80 (51.3%) |
| Total (Category) | 363 (60.2%) | 240 (39.8%) |
| Total (Overall) | 1,720 (63.7%) | 980 (36.3%) |
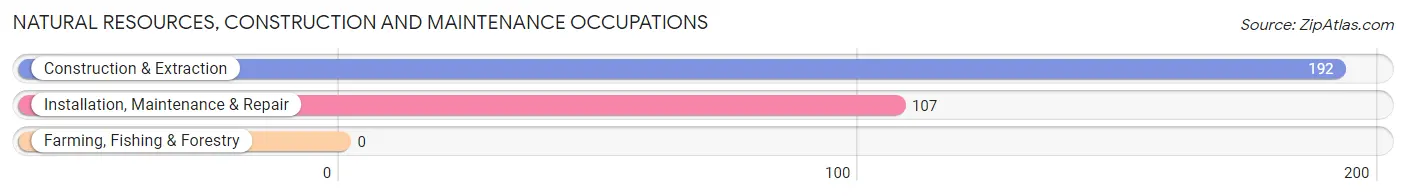
Natural Resources, Construction and Maintenance Occupations
The most common Natural Resources, Construction and Maintenance occupations in Senoia are Construction & Extraction (192 | 7.1%), and Installation, Maintenance & Repair (107 | 4.0%).
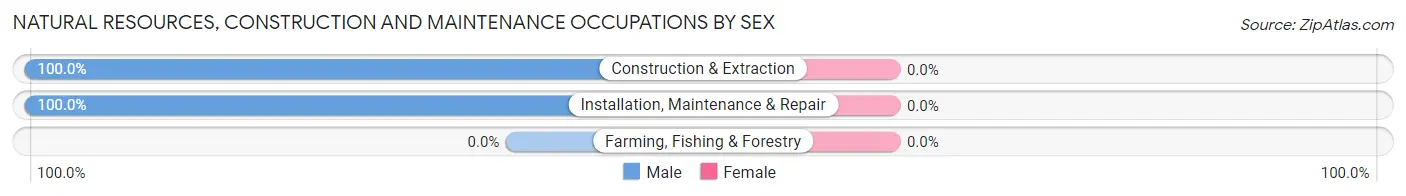
Natural Resources, Construction and Maintenance Occupations by Sex
| Occupation | Male | Female |
| Farming, Fishing & Forestry | 0 (0.0%) | 0 (0.0%) |
| Construction & Extraction | 192 (100.0%) | 0 (0.0%) |
| Installation, Maintenance & Repair | 107 (100.0%) | 0 (0.0%) |
| Total (Category) | 299 (100.0%) | 0 (0.0%) |
| Total (Overall) | 1,720 (63.7%) | 980 (36.3%) |
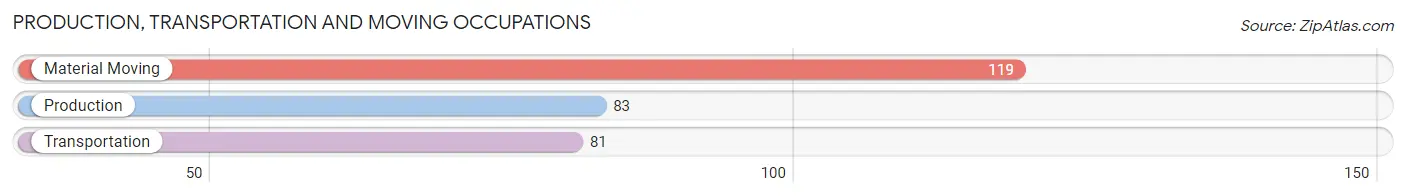
Production, Transportation and Moving Occupations
The most common Production, Transportation and Moving occupations in Senoia are Material Moving (119 | 4.4%), Production (83 | 3.1%), and Transportation (81 | 3.0%).
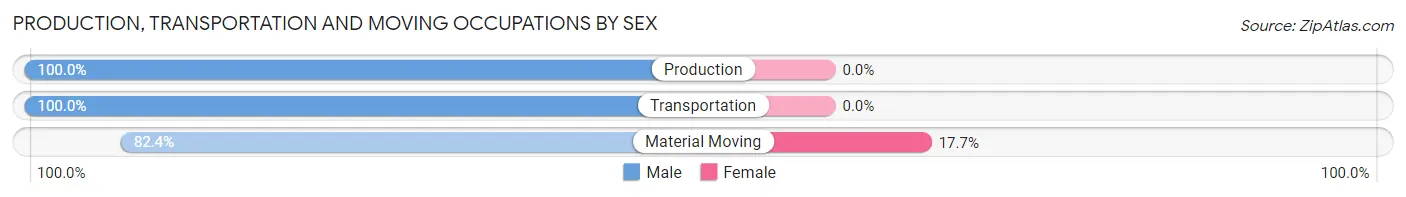
Production, Transportation and Moving Occupations by Sex
| Occupation | Male | Female |
| Production | 83 (100.0%) | 0 (0.0%) |
| Transportation | 81 (100.0%) | 0 (0.0%) |
| Material Moving | 98 (82.4%) | 21 (17.6%) |
| Total (Category) | 262 (92.6%) | 21 (7.4%) |
| Total (Overall) | 1,720 (63.7%) | 980 (36.3%) |
Employment Industries by Sex in Senoia
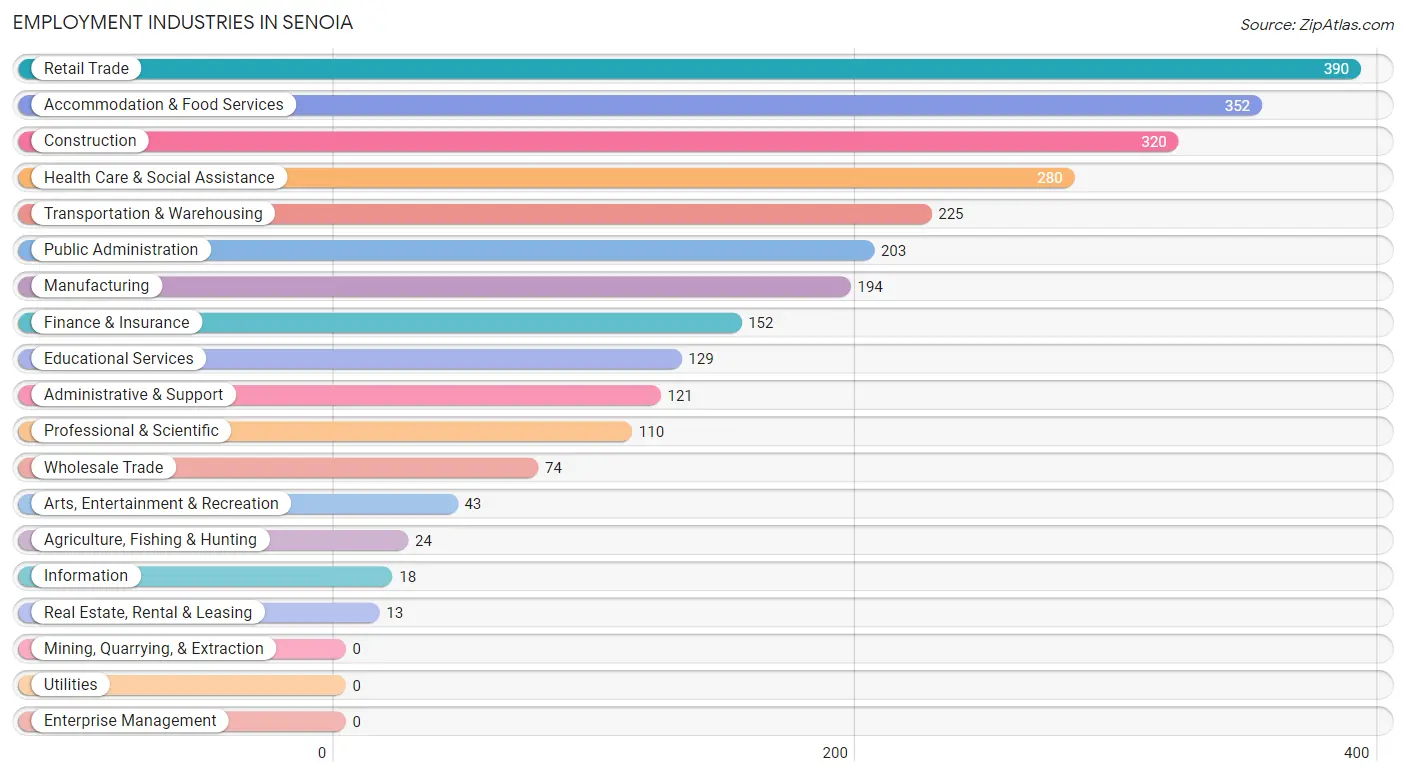
Employment Industries in Senoia
The major employment industries in Senoia include Retail Trade (390 | 14.4%), Accommodation & Food Services (352 | 13.0%), Construction (320 | 11.8%), Health Care & Social Assistance (280 | 10.4%), and Transportation & Warehousing (225 | 8.3%).
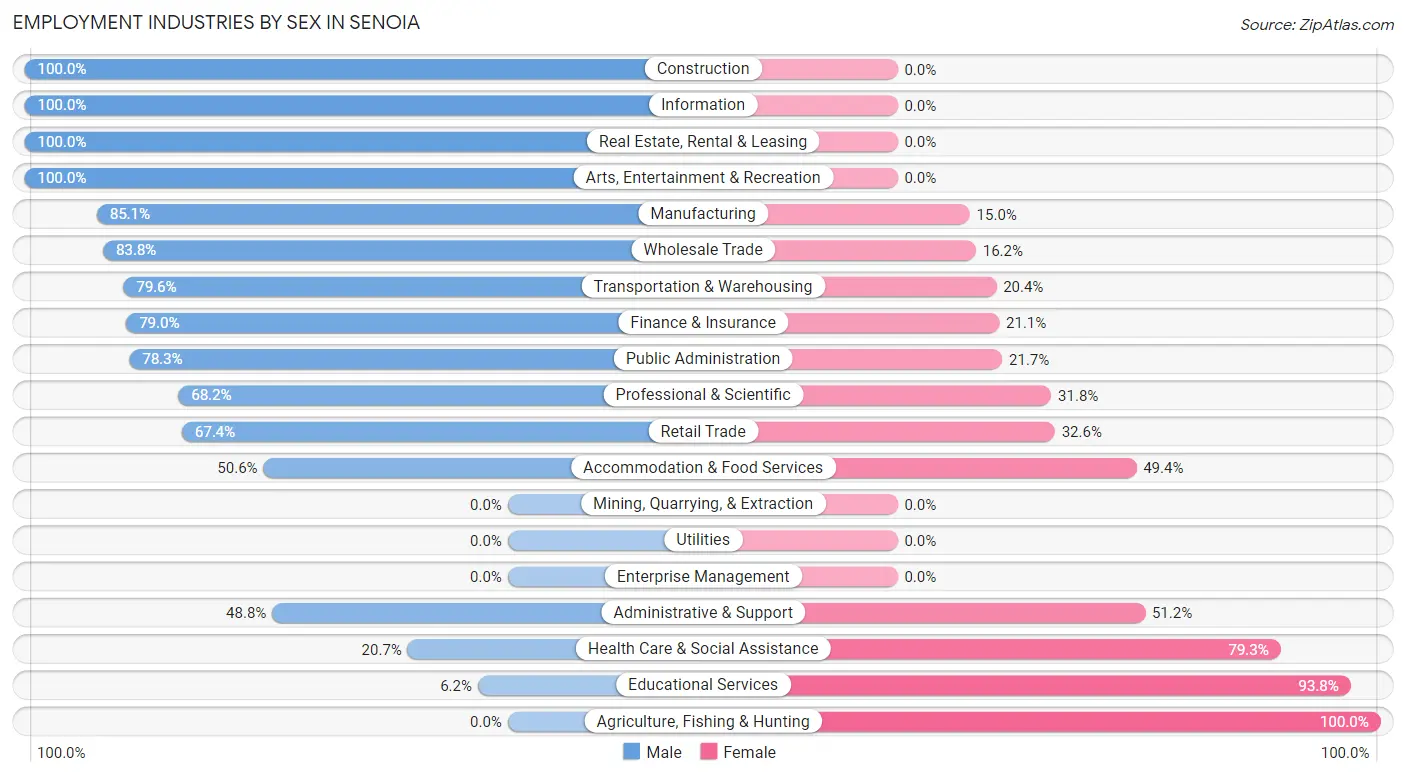
Employment Industries by Sex in Senoia
The Senoia industries that see more men than women are Construction (100.0%), Information (100.0%), and Real Estate, Rental & Leasing (100.0%), whereas the industries that tend to have a higher number of women are Agriculture, Fishing & Hunting (100.0%), Educational Services (93.8%), and Health Care & Social Assistance (79.3%).
| Industry | Male | Female |
| Agriculture, Fishing & Hunting | 0 (0.0%) | 24 (100.0%) |
| Mining, Quarrying, & Extraction | 0 (0.0%) | 0 (0.0%) |
| Construction | 320 (100.0%) | 0 (0.0%) |
| Manufacturing | 165 (85.1%) | 29 (14.9%) |
| Wholesale Trade | 62 (83.8%) | 12 (16.2%) |
| Retail Trade | 263 (67.4%) | 127 (32.6%) |
| Transportation & Warehousing | 179 (79.6%) | 46 (20.4%) |
| Utilities | 0 (0.0%) | 0 (0.0%) |
| Information | 18 (100.0%) | 0 (0.0%) |
| Finance & Insurance | 120 (78.9%) | 32 (21.0%) |
| Real Estate, Rental & Leasing | 13 (100.0%) | 0 (0.0%) |
| Professional & Scientific | 75 (68.2%) | 35 (31.8%) |
| Enterprise Management | 0 (0.0%) | 0 (0.0%) |
| Administrative & Support | 59 (48.8%) | 62 (51.2%) |
| Educational Services | 8 (6.2%) | 121 (93.8%) |
| Health Care & Social Assistance | 58 (20.7%) | 222 (79.3%) |
| Arts, Entertainment & Recreation | 43 (100.0%) | 0 (0.0%) |
| Accommodation & Food Services | 178 (50.6%) | 174 (49.4%) |
| Public Administration | 159 (78.3%) | 44 (21.7%) |
| Total | 1,720 (63.7%) | 980 (36.3%) |
Education in Senoia
School Enrollment in Senoia
The most common levels of schooling among the 1,415 students in Senoia are elementary school (401 | 28.3%), middle school (302 | 21.3%), and graduate / professional (189 | 13.4%).
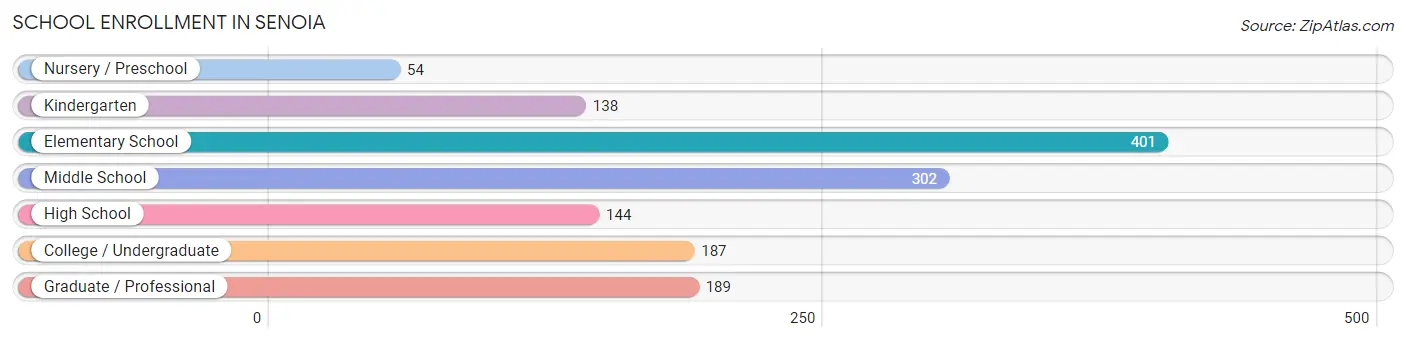
| School Level | # Students | % Students |
| Nursery / Preschool | 54 | 3.8% |
| Kindergarten | 138 | 9.8% |
| Elementary School | 401 | 28.3% |
| Middle School | 302 | 21.3% |
| High School | 144 | 10.2% |
| College / Undergraduate | 187 | 13.2% |
| Graduate / Professional | 189 | 13.4% |
| Total | 1,415 | 100.0% |
School Enrollment by Age by Funding Source in Senoia
Out of a total of 1,415 students who are enrolled in schools in Senoia, 270 (19.1%) attend a private institution, while the remaining 1,145 (80.9%) are enrolled in public schools. The age group of 3 to 4 year olds has the highest likelihood of being enrolled in private schools, with 42 (100.0% in the age bracket) enrolled. Conversely, the age group of 15 to 17 year olds has the lowest likelihood of being enrolled in a private school, with 186 (100.0% in the age bracket) attending a public institution.
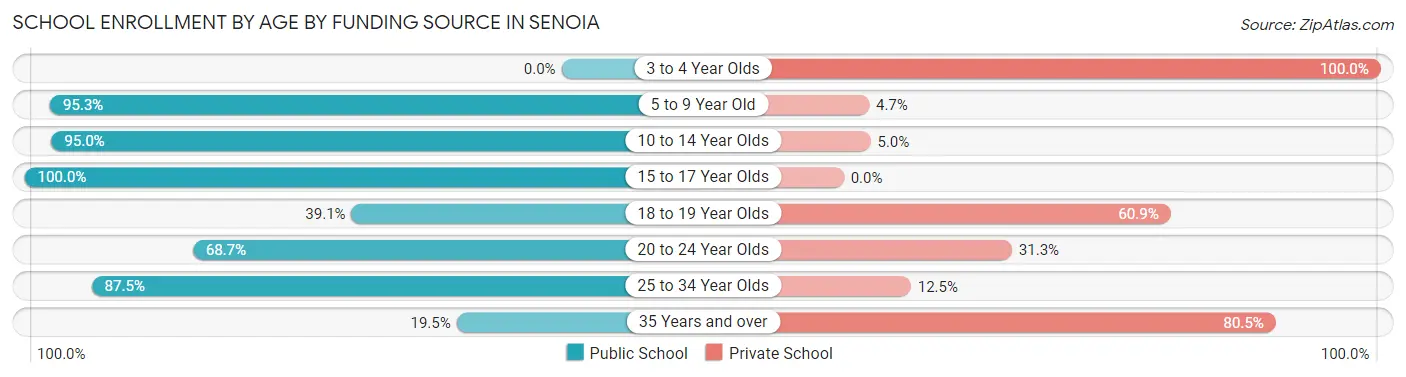
| Age Bracket | Public School | Private School |
| 3 to 4 Year Olds | 0 (0.0%) | 42 (100.0%) |
| 5 to 9 Year Old | 525 (95.3%) | 26 (4.7%) |
| 10 to 14 Year Olds | 247 (95.0%) | 13 (5.0%) |
| 15 to 17 Year Olds | 186 (100.0%) | 0 (0.0%) |
| 18 to 19 Year Olds | 9 (39.1%) | 14 (60.9%) |
| 20 to 24 Year Olds | 46 (68.7%) | 21 (31.3%) |
| 25 to 34 Year Olds | 98 (87.5%) | 14 (12.5%) |
| 35 Years and over | 34 (19.5%) | 140 (80.5%) |
| Total | 1,145 (80.9%) | 270 (19.1%) |
Educational Attainment by Field of Study in Senoia
Education (362 | 19.5%), business (303 | 16.3%), computers & mathematics (211 | 11.4%), science & technology (188 | 10.1%), and social sciences (186 | 10.0%) are the most common fields of study among 1,857 individuals in Senoia who have obtained a bachelor's degree or higher.
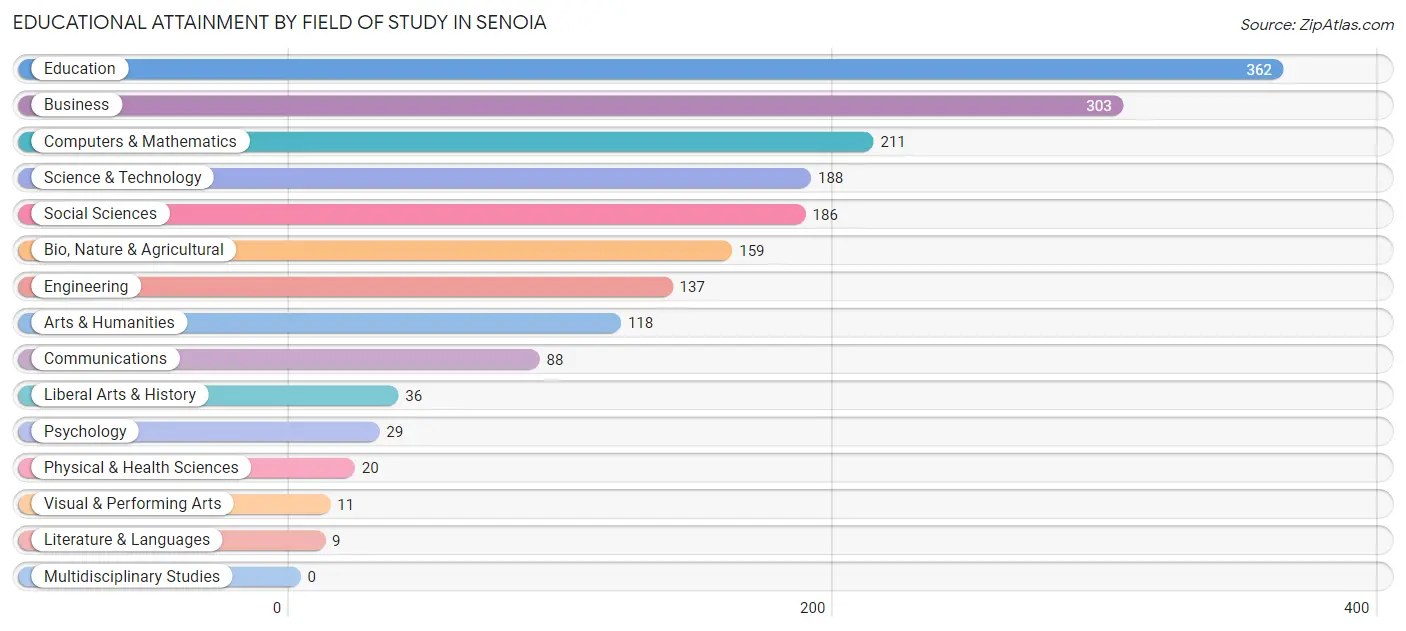
| Field of Study | # Graduates | % Graduates |
| Computers & Mathematics | 211 | 11.4% |
| Bio, Nature & Agricultural | 159 | 8.6% |
| Physical & Health Sciences | 20 | 1.1% |
| Psychology | 29 | 1.6% |
| Social Sciences | 186 | 10.0% |
| Engineering | 137 | 7.4% |
| Multidisciplinary Studies | 0 | 0.0% |
| Science & Technology | 188 | 10.1% |
| Business | 303 | 16.3% |
| Education | 362 | 19.5% |
| Literature & Languages | 9 | 0.5% |
| Liberal Arts & History | 36 | 1.9% |
| Visual & Performing Arts | 11 | 0.6% |
| Communications | 88 | 4.7% |
| Arts & Humanities | 118 | 6.4% |
| Total | 1,857 | 100.0% |
Transportation & Commute in Senoia
Vehicle Availability by Sex in Senoia
The most prevalent vehicle ownership categories in Senoia are males with 2 vehicles (707, accounting for 42.5%) and females with 2 vehicles (420, making up 72.1%).
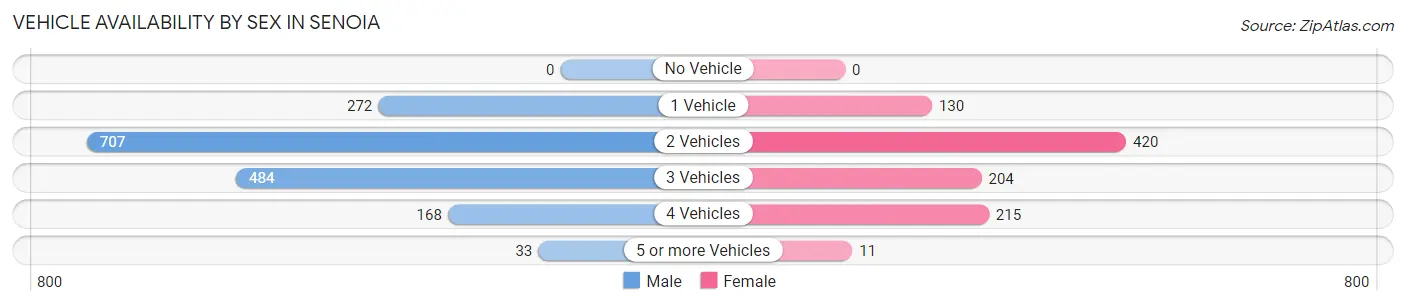
| Vehicles Available | Male | Female |
| No Vehicle | 0 (0.0%) | 0 (0.0%) |
| 1 Vehicle | 272 (16.4%) | 130 (13.3%) |
| 2 Vehicles | 707 (42.5%) | 420 (42.9%) |
| 3 Vehicles | 484 (29.1%) | 204 (20.8%) |
| 4 Vehicles | 168 (10.1%) | 215 (21.9%) |
| 5 or more Vehicles | 33 (2.0%) | 11 (1.1%) |
| Total | 1,664 (100.0%) | 980 (100.0%) |
Commute Time in Senoia
The most frequently occuring commute durations in Senoia are 5 to 9 minutes (386 commuters, 16.4%), 60 to 89 minutes (335 commuters, 14.2%), and 20 to 24 minutes (323 commuters, 13.7%).
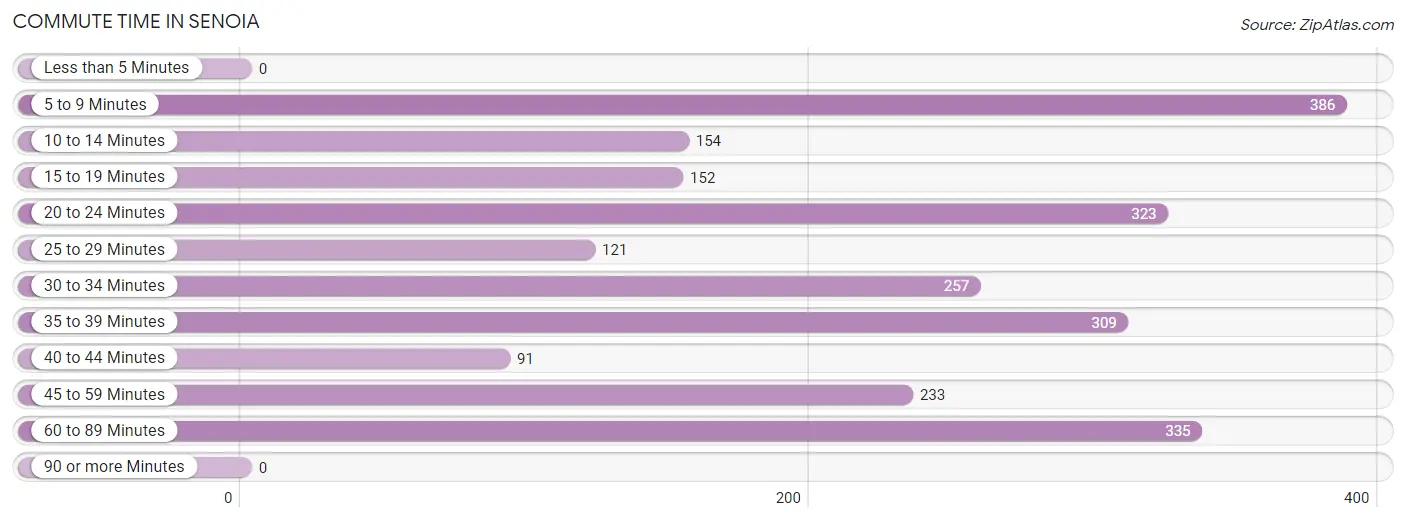
| Commute Time | # Commuters | % Commuters |
| Less than 5 Minutes | 0 | 0.0% |
| 5 to 9 Minutes | 386 | 16.4% |
| 10 to 14 Minutes | 154 | 6.5% |
| 15 to 19 Minutes | 152 | 6.4% |
| 20 to 24 Minutes | 323 | 13.7% |
| 25 to 29 Minutes | 121 | 5.1% |
| 30 to 34 Minutes | 257 | 10.9% |
| 35 to 39 Minutes | 309 | 13.1% |
| 40 to 44 Minutes | 91 | 3.8% |
| 45 to 59 Minutes | 233 | 9.9% |
| 60 to 89 Minutes | 335 | 14.2% |
| 90 or more Minutes | 0 | 0.0% |
Commute Time by Sex in Senoia
The most common commute times in Senoia are 5 to 9 minutes (281 commuters, 18.3%) for males and 20 to 24 minutes (198 commuters, 23.9%) for females.
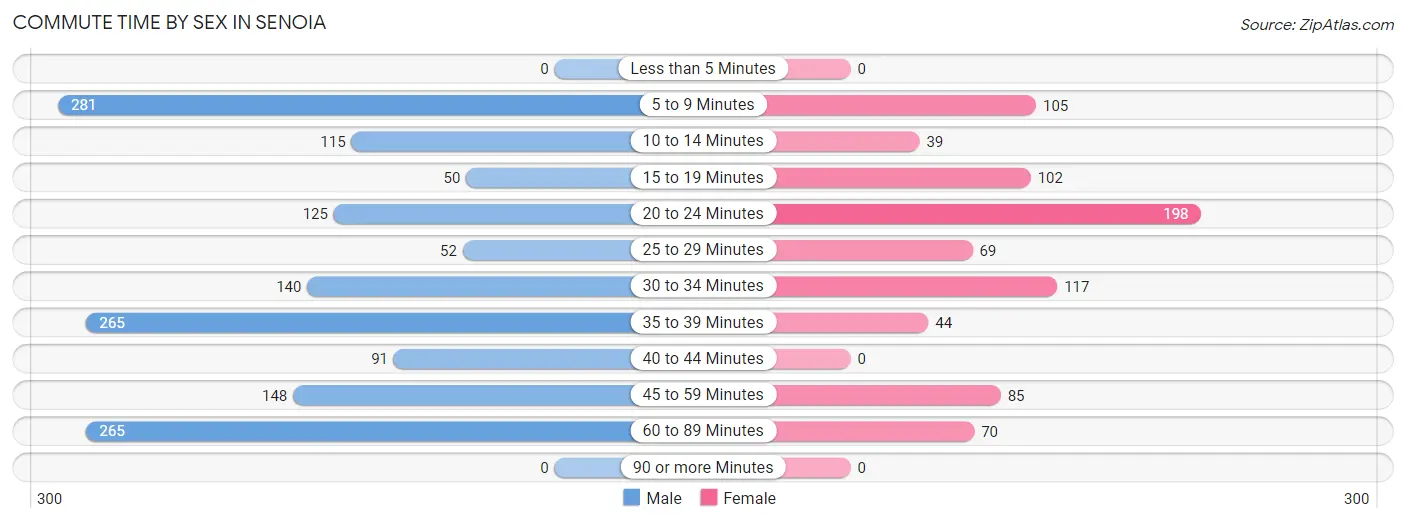
| Commute Time | Male | Female |
| Less than 5 Minutes | 0 (0.0%) | 0 (0.0%) |
| 5 to 9 Minutes | 281 (18.3%) | 105 (12.7%) |
| 10 to 14 Minutes | 115 (7.5%) | 39 (4.7%) |
| 15 to 19 Minutes | 50 (3.3%) | 102 (12.3%) |
| 20 to 24 Minutes | 125 (8.2%) | 198 (23.9%) |
| 25 to 29 Minutes | 52 (3.4%) | 69 (8.3%) |
| 30 to 34 Minutes | 140 (9.1%) | 117 (14.1%) |
| 35 to 39 Minutes | 265 (17.3%) | 44 (5.3%) |
| 40 to 44 Minutes | 91 (5.9%) | 0 (0.0%) |
| 45 to 59 Minutes | 148 (9.7%) | 85 (10.2%) |
| 60 to 89 Minutes | 265 (17.3%) | 70 (8.4%) |
| 90 or more Minutes | 0 (0.0%) | 0 (0.0%) |
Time of Departure to Work by Sex in Senoia
The most frequent times of departure to work in Senoia are 6:30 AM to 6:59 AM (304, 19.8%) for males and 7:00 AM to 7:29 AM (184, 22.2%) for females.
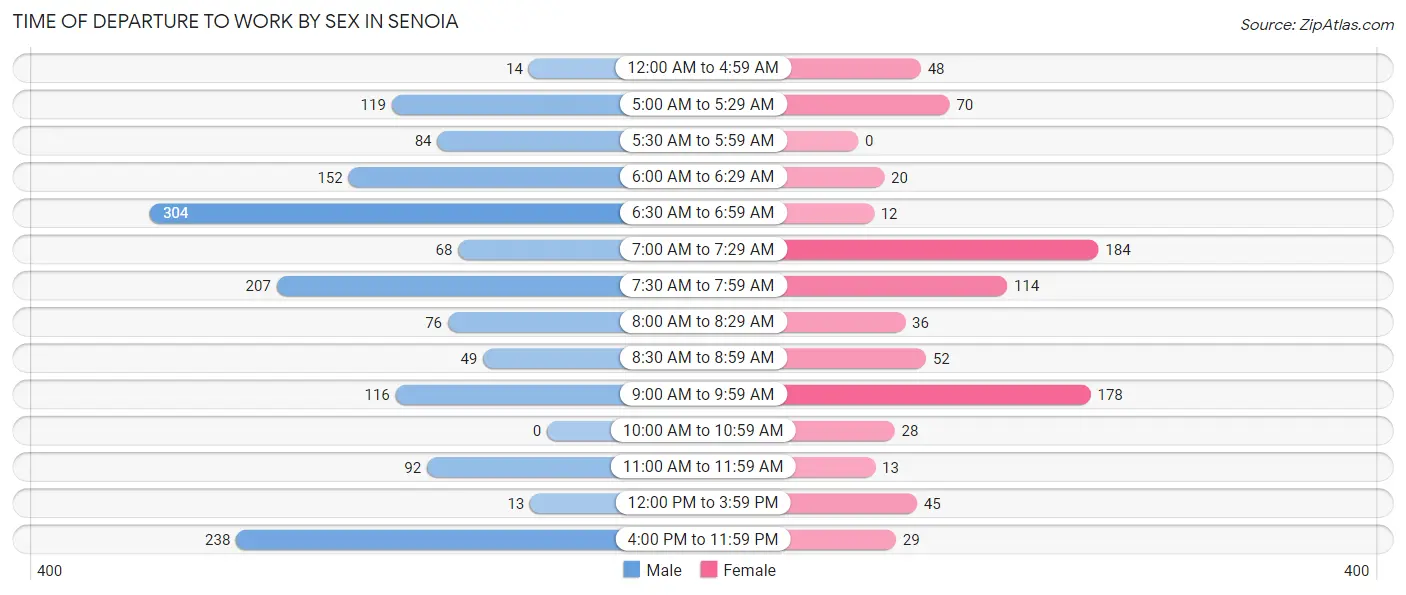
| Time of Departure | Male | Female |
| 12:00 AM to 4:59 AM | 14 (0.9%) | 48 (5.8%) |
| 5:00 AM to 5:29 AM | 119 (7.8%) | 70 (8.4%) |
| 5:30 AM to 5:59 AM | 84 (5.5%) | 0 (0.0%) |
| 6:00 AM to 6:29 AM | 152 (9.9%) | 20 (2.4%) |
| 6:30 AM to 6:59 AM | 304 (19.8%) | 12 (1.5%) |
| 7:00 AM to 7:29 AM | 68 (4.4%) | 184 (22.2%) |
| 7:30 AM to 7:59 AM | 207 (13.5%) | 114 (13.8%) |
| 8:00 AM to 8:29 AM | 76 (5.0%) | 36 (4.3%) |
| 8:30 AM to 8:59 AM | 49 (3.2%) | 52 (6.3%) |
| 9:00 AM to 9:59 AM | 116 (7.6%) | 178 (21.5%) |
| 10:00 AM to 10:59 AM | 0 (0.0%) | 28 (3.4%) |
| 11:00 AM to 11:59 AM | 92 (6.0%) | 13 (1.6%) |
| 12:00 PM to 3:59 PM | 13 (0.9%) | 45 (5.4%) |
| 4:00 PM to 11:59 PM | 238 (15.5%) | 29 (3.5%) |
| Total | 1,532 (100.0%) | 829 (100.0%) |
Housing Occupancy in Senoia
Occupancy by Ownership in Senoia
Of the total 1,796 dwellings in Senoia, owner-occupied units account for 1,654 (92.1%), while renter-occupied units make up 142 (7.9%).
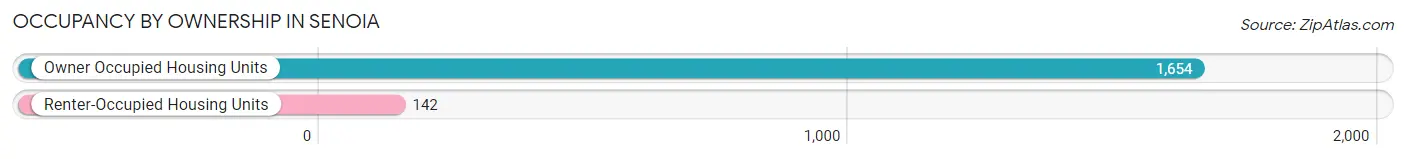
| Occupancy | # Housing Units | % Housing Units |
| Owner Occupied Housing Units | 1,654 | 92.1% |
| Renter-Occupied Housing Units | 142 | 7.9% |
| Total Occupied Housing Units | 1,796 | 100.0% |
Occupancy by Household Size in Senoia
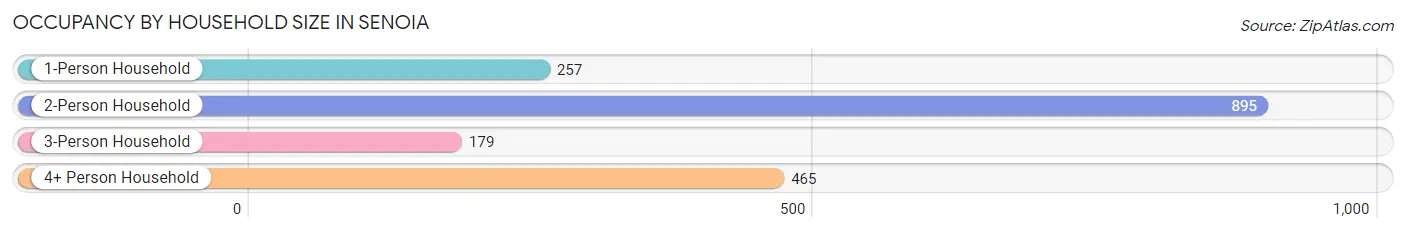
| Household Size | # Housing Units | % Housing Units |
| 1-Person Household | 257 | 14.3% |
| 2-Person Household | 895 | 49.8% |
| 3-Person Household | 179 | 10.0% |
| 4+ Person Household | 465 | 25.9% |
| Total Housing Units | 1,796 | 100.0% |
Occupancy by Ownership by Household Size in Senoia
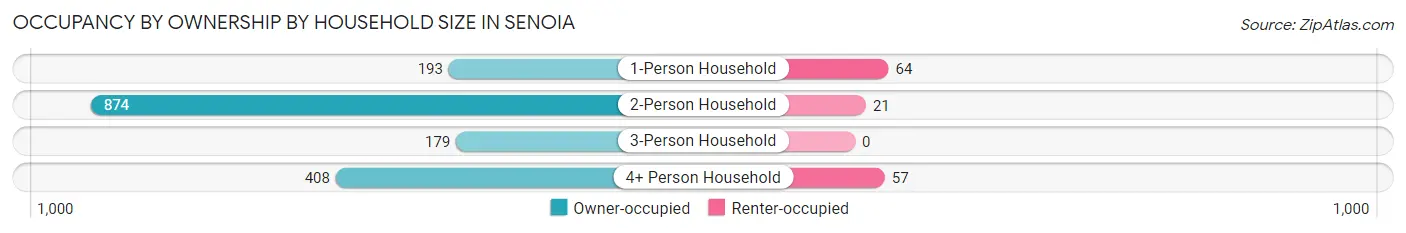
| Household Size | Owner-occupied | Renter-occupied |
| 1-Person Household | 193 (75.1%) | 64 (24.9%) |
| 2-Person Household | 874 (97.7%) | 21 (2.4%) |
| 3-Person Household | 179 (100.0%) | 0 (0.0%) |
| 4+ Person Household | 408 (87.7%) | 57 (12.3%) |
| Total Housing Units | 1,654 (92.1%) | 142 (7.9%) |
Occupancy by Educational Attainment in Senoia
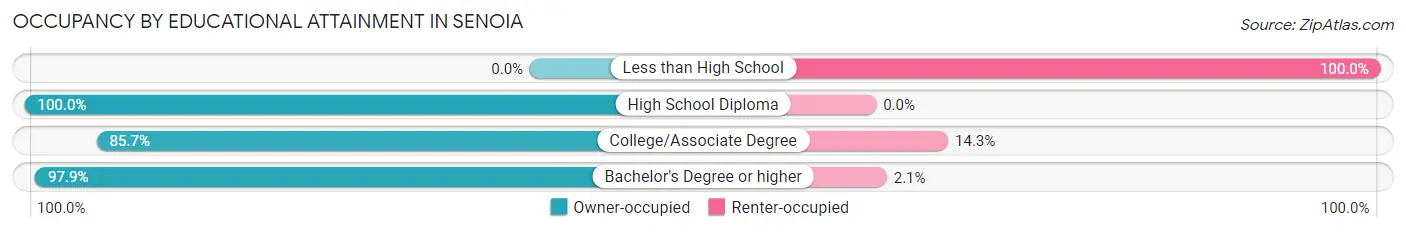
| Household Size | Owner-occupied | Renter-occupied |
| Less than High School | 0 (0.0%) | 45 (100.0%) |
| High School Diploma | 217 (100.0%) | 0 (0.0%) |
| College/Associate Degree | 457 (85.7%) | 76 (14.3%) |
| Bachelor's Degree or higher | 980 (97.9%) | 21 (2.1%) |
Occupancy by Age of Householder in Senoia
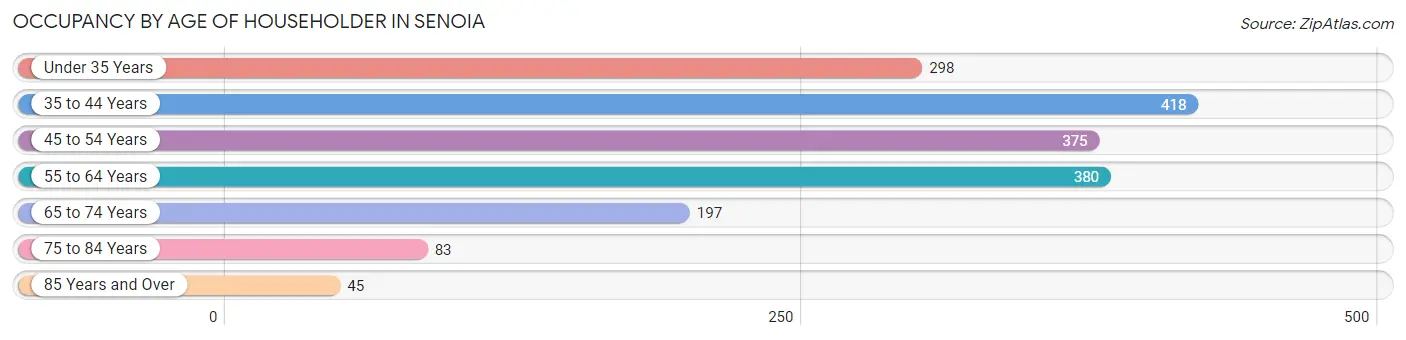
| Age Bracket | # Households | % Households |
| Under 35 Years | 298 | 16.6% |
| 35 to 44 Years | 418 | 23.3% |
| 45 to 54 Years | 375 | 20.9% |
| 55 to 64 Years | 380 | 21.2% |
| 65 to 74 Years | 197 | 11.0% |
| 75 to 84 Years | 83 | 4.6% |
| 85 Years and Over | 45 | 2.5% |
| Total | 1,796 | 100.0% |
Housing Finances in Senoia
Median Income by Occupancy in Senoia
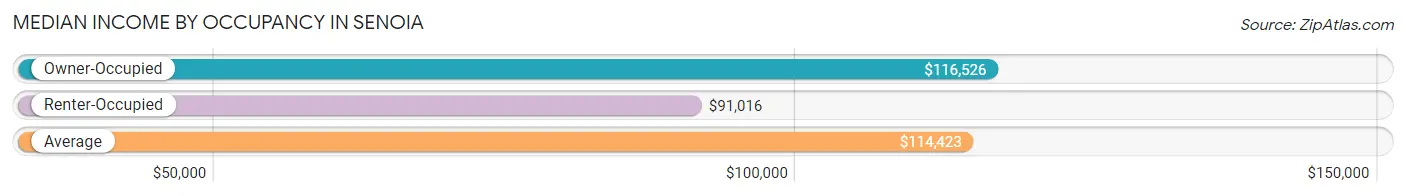
| Occupancy Type | # Households | Median Income |
| Owner-Occupied | 1,654 (92.1%) | $116,526 |
| Renter-Occupied | 142 (7.9%) | $91,016 |
| Average | 1,796 (100.0%) | $114,423 |
Occupancy by Householder Income Bracket in Senoia
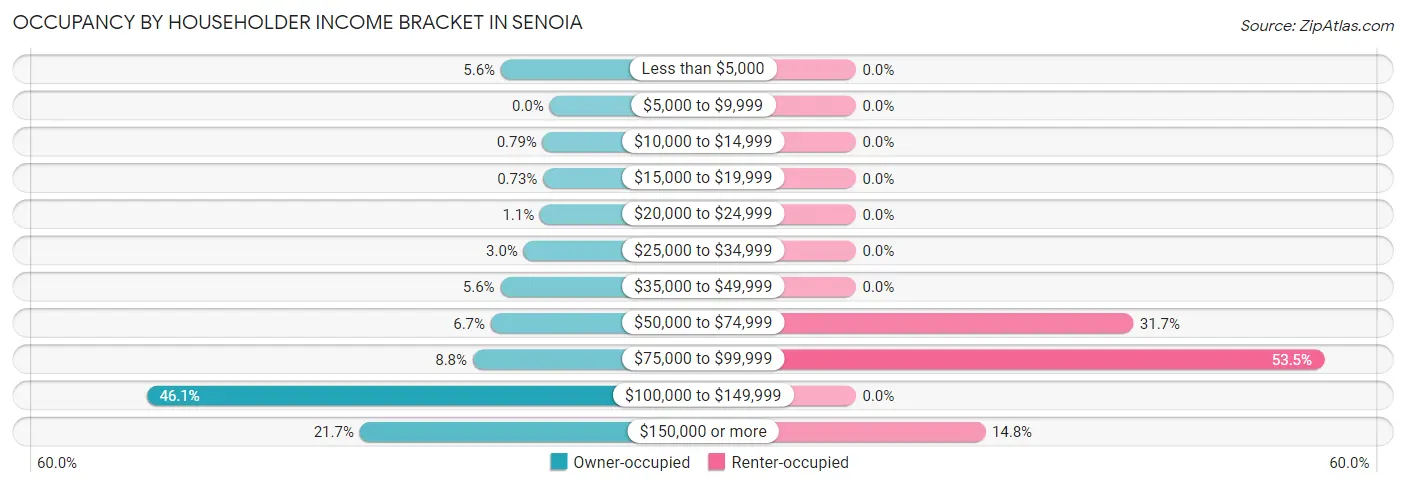
| Income Bracket | Owner-occupied | Renter-occupied |
| Less than $5,000 | 92 (5.6%) | 0 (0.0%) |
| $5,000 to $9,999 | 0 (0.0%) | 0 (0.0%) |
| $10,000 to $14,999 | 13 (0.8%) | 0 (0.0%) |
| $15,000 to $19,999 | 12 (0.7%) | 0 (0.0%) |
| $20,000 to $24,999 | 18 (1.1%) | 0 (0.0%) |
| $25,000 to $34,999 | 49 (3.0%) | 0 (0.0%) |
| $35,000 to $49,999 | 93 (5.6%) | 0 (0.0%) |
| $50,000 to $74,999 | 111 (6.7%) | 45 (31.7%) |
| $75,000 to $99,999 | 145 (8.8%) | 76 (53.5%) |
| $100,000 to $149,999 | 762 (46.1%) | 0 (0.0%) |
| $150,000 or more | 359 (21.7%) | 21 (14.8%) |
| Total | 1,654 (100.0%) | 142 (100.0%) |
Monthly Housing Cost Tiers in Senoia
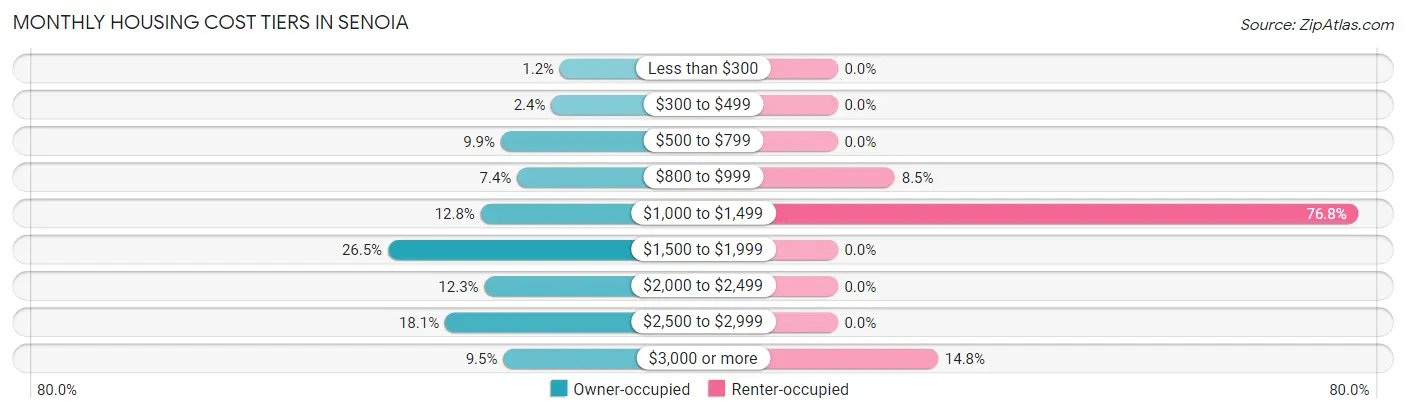
| Monthly Cost | Owner-occupied | Renter-occupied |
| Less than $300 | 19 (1.1%) | 0 (0.0%) |
| $300 to $499 | 40 (2.4%) | 0 (0.0%) |
| $500 to $799 | 163 (9.9%) | 0 (0.0%) |
| $800 to $999 | 123 (7.4%) | 12 (8.5%) |
| $1,000 to $1,499 | 212 (12.8%) | 109 (76.8%) |
| $1,500 to $1,999 | 438 (26.5%) | 0 (0.0%) |
| $2,000 to $2,499 | 203 (12.3%) | 0 (0.0%) |
| $2,500 to $2,999 | 299 (18.1%) | 0 (0.0%) |
| $3,000 or more | 157 (9.5%) | 21 (14.8%) |
| Total | 1,654 (100.0%) | 142 (100.0%) |
Physical Housing Characteristics in Senoia
Housing Structures in Senoia
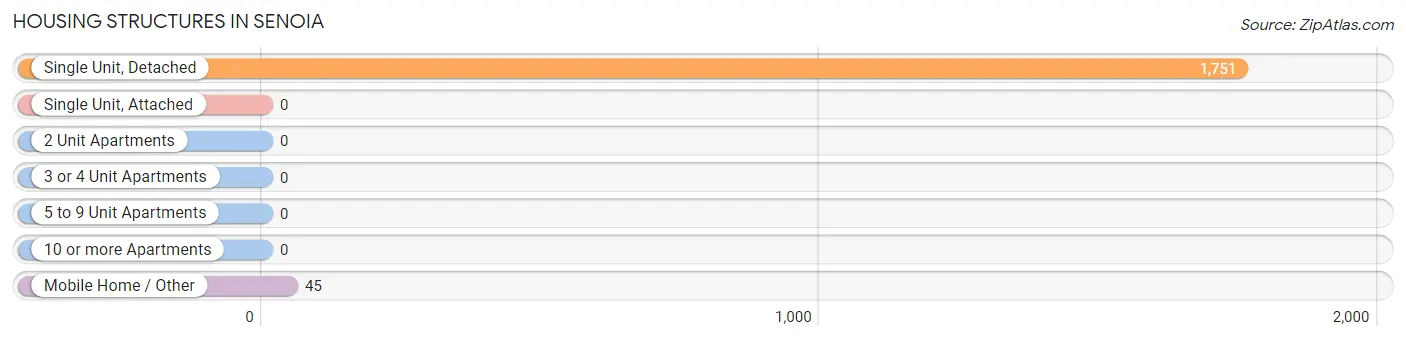
| Structure Type | # Housing Units | % Housing Units |
| Single Unit, Detached | 1,751 | 97.5% |
| Single Unit, Attached | 0 | 0.0% |
| 2 Unit Apartments | 0 | 0.0% |
| 3 or 4 Unit Apartments | 0 | 0.0% |
| 5 to 9 Unit Apartments | 0 | 0.0% |
| 10 or more Apartments | 0 | 0.0% |
| Mobile Home / Other | 45 | 2.5% |
| Total | 1,796 | 100.0% |
Housing Structures by Occupancy in Senoia
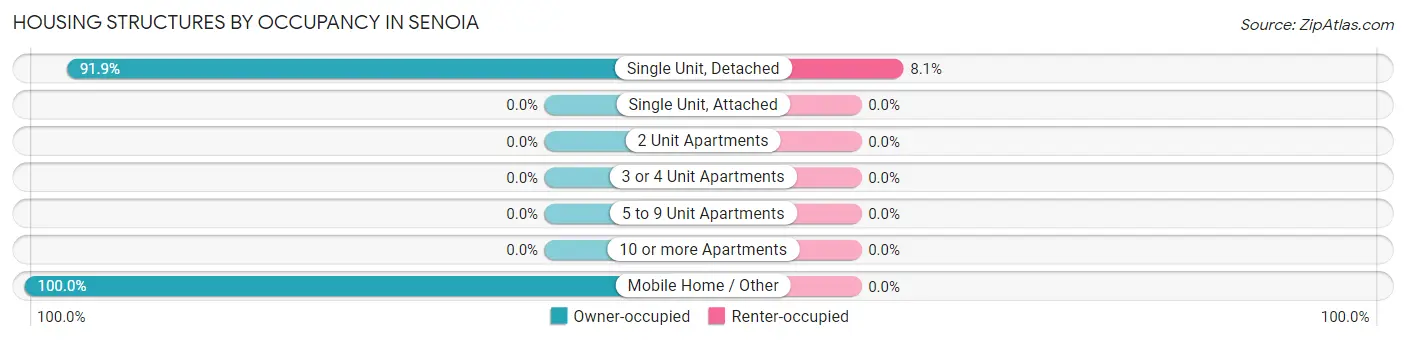
| Structure Type | Owner-occupied | Renter-occupied |
| Single Unit, Detached | 1,609 (91.9%) | 142 (8.1%) |
| Single Unit, Attached | 0 (0.0%) | 0 (0.0%) |
| 2 Unit Apartments | 0 (0.0%) | 0 (0.0%) |
| 3 or 4 Unit Apartments | 0 (0.0%) | 0 (0.0%) |
| 5 to 9 Unit Apartments | 0 (0.0%) | 0 (0.0%) |
| 10 or more Apartments | 0 (0.0%) | 0 (0.0%) |
| Mobile Home / Other | 45 (100.0%) | 0 (0.0%) |
| Total | 1,654 (92.1%) | 142 (7.9%) |
Housing Structures by Number of Rooms in Senoia
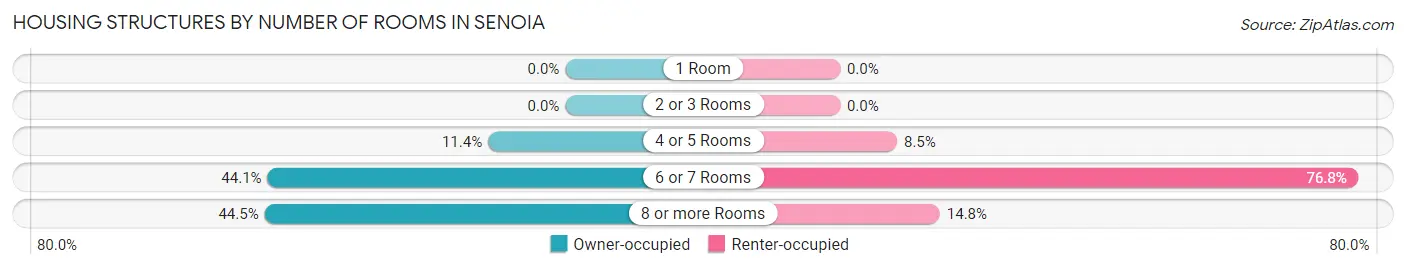
| Number of Rooms | Owner-occupied | Renter-occupied |
| 1 Room | 0 (0.0%) | 0 (0.0%) |
| 2 or 3 Rooms | 0 (0.0%) | 0 (0.0%) |
| 4 or 5 Rooms | 189 (11.4%) | 12 (8.5%) |
| 6 or 7 Rooms | 729 (44.1%) | 109 (76.8%) |
| 8 or more Rooms | 736 (44.5%) | 21 (14.8%) |
| Total | 1,654 (100.0%) | 142 (100.0%) |
Housing Structure by Heating Type in Senoia
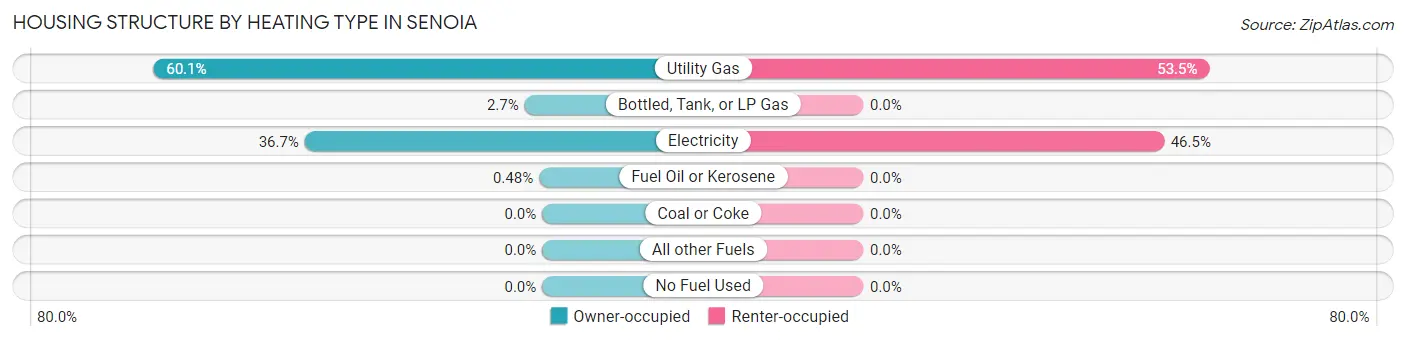
| Heating Type | Owner-occupied | Renter-occupied |
| Utility Gas | 994 (60.1%) | 76 (53.5%) |
| Bottled, Tank, or LP Gas | 45 (2.7%) | 0 (0.0%) |
| Electricity | 607 (36.7%) | 66 (46.5%) |
| Fuel Oil or Kerosene | 8 (0.5%) | 0 (0.0%) |
| Coal or Coke | 0 (0.0%) | 0 (0.0%) |
| All other Fuels | 0 (0.0%) | 0 (0.0%) |
| No Fuel Used | 0 (0.0%) | 0 (0.0%) |
| Total | 1,654 (100.0%) | 142 (100.0%) |
Household Vehicle Usage in Senoia
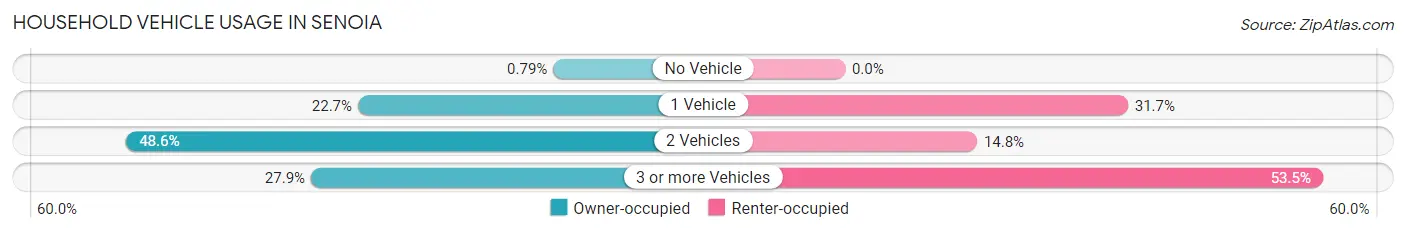
| Vehicles per Household | Owner-occupied | Renter-occupied |
| No Vehicle | 13 (0.8%) | 0 (0.0%) |
| 1 Vehicle | 375 (22.7%) | 45 (31.7%) |
| 2 Vehicles | 804 (48.6%) | 21 (14.8%) |
| 3 or more Vehicles | 462 (27.9%) | 76 (53.5%) |
| Total | 1,654 (100.0%) | 142 (100.0%) |
Real Estate & Mortgages in Senoia
Real Estate and Mortgage Overview in Senoia
| Characteristic | Without Mortgage | With Mortgage |
| Housing Units | 260 | 1,394 |
| Median Property Value | $324,500 | $364,700 |
| Median Household Income | $101,842 | $305 |
| Monthly Housing Costs | $667 | $157 |
| Real Estate Taxes | $3,269 | $0 |
Property Value by Mortgage Status in Senoia
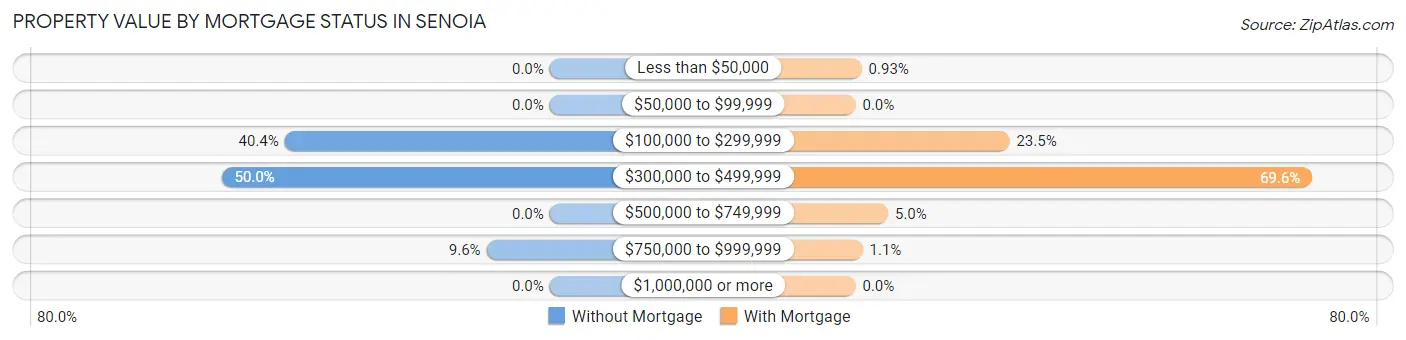
| Property Value | Without Mortgage | With Mortgage |
| Less than $50,000 | 0 (0.0%) | 13 (0.9%) |
| $50,000 to $99,999 | 0 (0.0%) | 0 (0.0%) |
| $100,000 to $299,999 | 105 (40.4%) | 327 (23.5%) |
| $300,000 to $499,999 | 130 (50.0%) | 970 (69.6%) |
| $500,000 to $749,999 | 0 (0.0%) | 69 (5.0%) |
| $750,000 to $999,999 | 25 (9.6%) | 15 (1.1%) |
| $1,000,000 or more | 0 (0.0%) | 0 (0.0%) |
| Total | 260 (100.0%) | 1,394 (100.0%) |
Household Income by Mortgage Status in Senoia
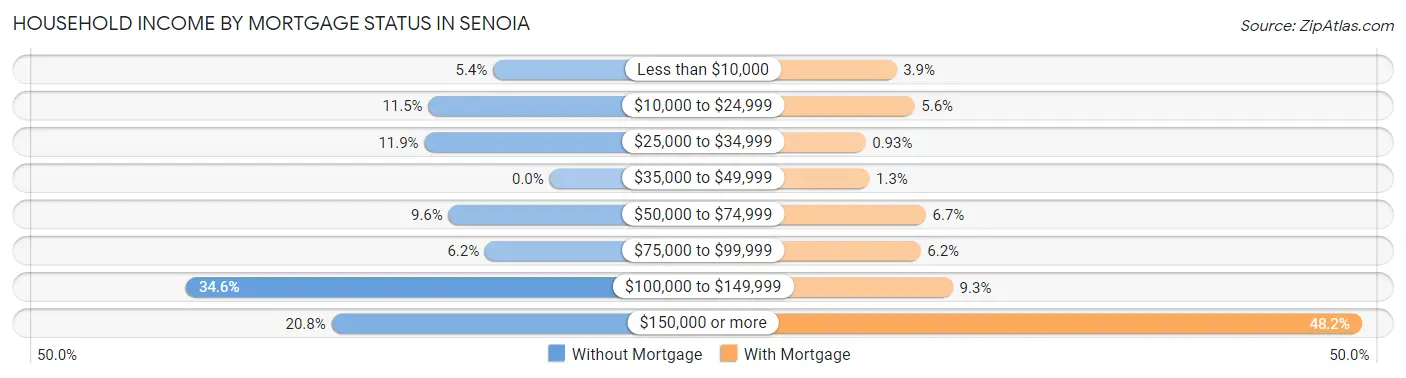
| Household Income | Without Mortgage | With Mortgage |
| Less than $10,000 | 14 (5.4%) | 54 (3.9%) |
| $10,000 to $24,999 | 30 (11.5%) | 78 (5.6%) |
| $25,000 to $34,999 | 31 (11.9%) | 13 (0.9%) |
| $35,000 to $49,999 | 0 (0.0%) | 18 (1.3%) |
| $50,000 to $74,999 | 25 (9.6%) | 93 (6.7%) |
| $75,000 to $99,999 | 16 (6.1%) | 86 (6.2%) |
| $100,000 to $149,999 | 90 (34.6%) | 129 (9.2%) |
| $150,000 or more | 54 (20.8%) | 672 (48.2%) |
| Total | 260 (100.0%) | 1,394 (100.0%) |
Property Value to Household Income Ratio in Senoia
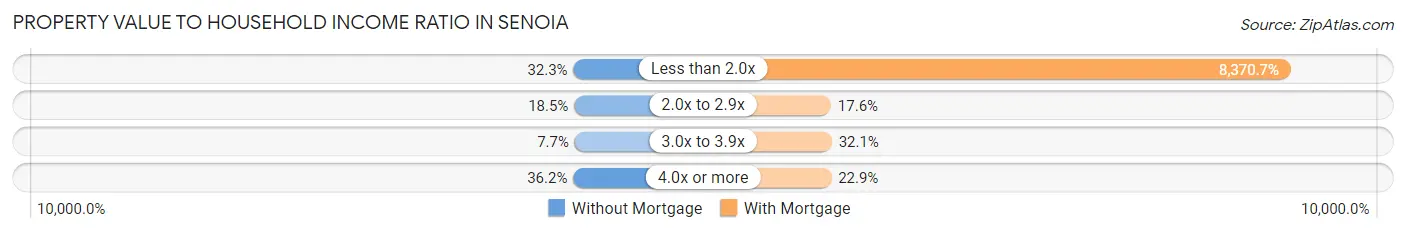
| Value-to-Income Ratio | Without Mortgage | With Mortgage |
| Less than 2.0x | 84 (32.3%) | 116,688 (8,370.7%) |
| 2.0x to 2.9x | 48 (18.5%) | 245 (17.6%) |
| 3.0x to 3.9x | 20 (7.7%) | 447 (32.1%) |
| 4.0x or more | 94 (36.1%) | 319 (22.9%) |
| Total | 260 (100.0%) | 1,394 (100.0%) |
Real Estate Taxes by Mortgage Status in Senoia
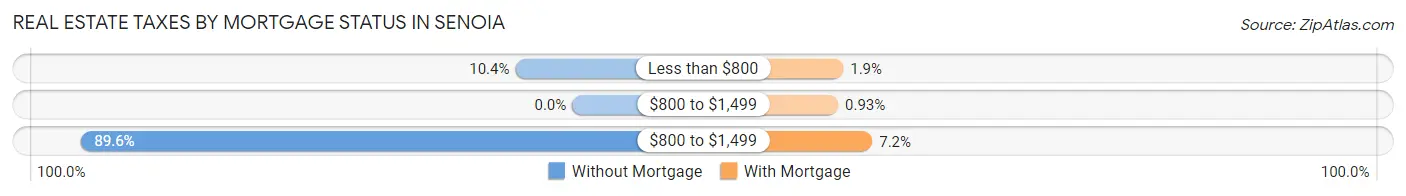
| Property Taxes | Without Mortgage | With Mortgage |
| Less than $800 | 27 (10.4%) | 26 (1.9%) |
| $800 to $1,499 | 0 (0.0%) | 13 (0.9%) |
| $800 to $1,499 | 233 (89.6%) | 100 (7.2%) |
| Total | 260 (100.0%) | 1,394 (100.0%) |
Health & Disability in Senoia
Health Insurance Coverage by Age in Senoia
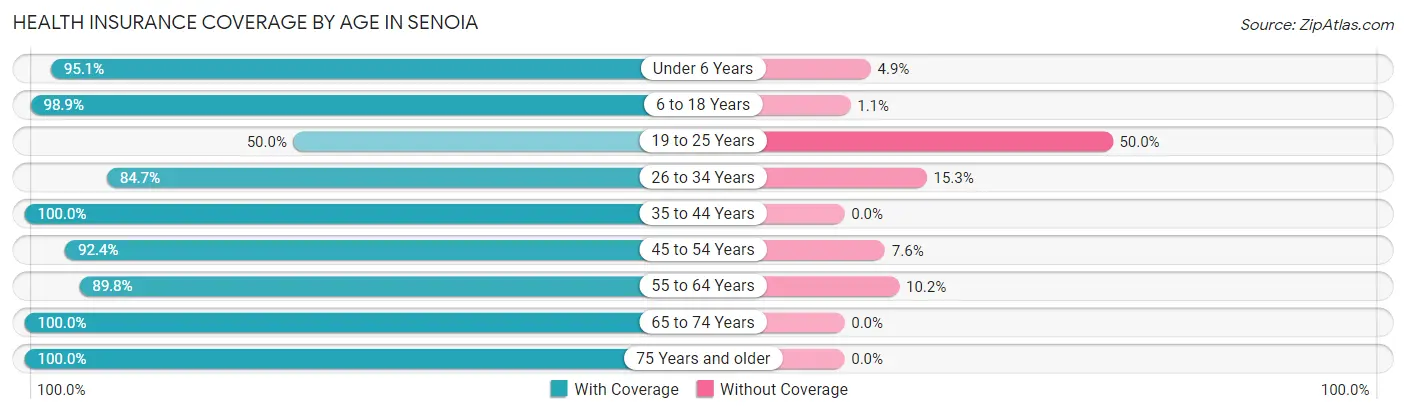
| Age Bracket | With Coverage | Without Coverage |
| Under 6 Years | 388 (95.1%) | 20 (4.9%) |
| 6 to 18 Years | 880 (98.9%) | 10 (1.1%) |
| 19 to 25 Years | 120 (50.0%) | 120 (50.0%) |
| 26 to 34 Years | 778 (84.7%) | 141 (15.3%) |
| 35 to 44 Years | 701 (100.0%) | 0 (0.0%) |
| 45 to 54 Years | 635 (92.4%) | 52 (7.6%) |
| 55 to 64 Years | 607 (89.8%) | 69 (10.2%) |
| 65 to 74 Years | 374 (100.0%) | 0 (0.0%) |
| 75 Years and older | 220 (100.0%) | 0 (0.0%) |
| Total | 4,703 (91.9%) | 412 (8.1%) |
Health Insurance Coverage by Citizenship Status in Senoia
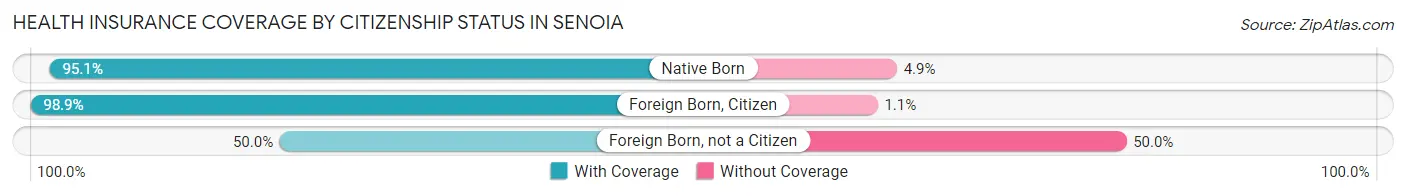
| Citizenship Status | With Coverage | Without Coverage |
| Native Born | 388 (95.1%) | 20 (4.9%) |
| Foreign Born, Citizen | 880 (98.9%) | 10 (1.1%) |
| Foreign Born, not a Citizen | 120 (50.0%) | 120 (50.0%) |
Health Insurance Coverage by Household Income in Senoia
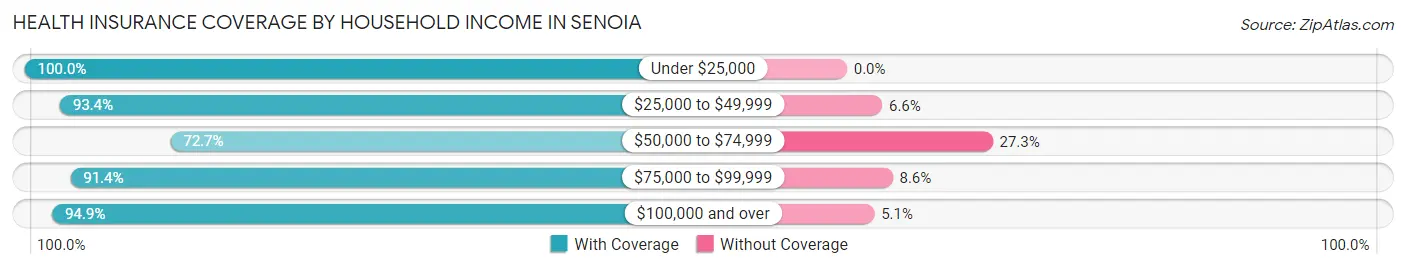
| Household Income | With Coverage | Without Coverage |
| Under $25,000 | 274 (100.0%) | 0 (0.0%) |
| $25,000 to $49,999 | 297 (93.4%) | 21 (6.6%) |
| $50,000 to $74,999 | 458 (72.7%) | 172 (27.3%) |
| $75,000 to $99,999 | 512 (91.4%) | 48 (8.6%) |
| $100,000 and over | 3,154 (94.9%) | 171 (5.1%) |
Public vs Private Health Insurance Coverage by Age in Senoia
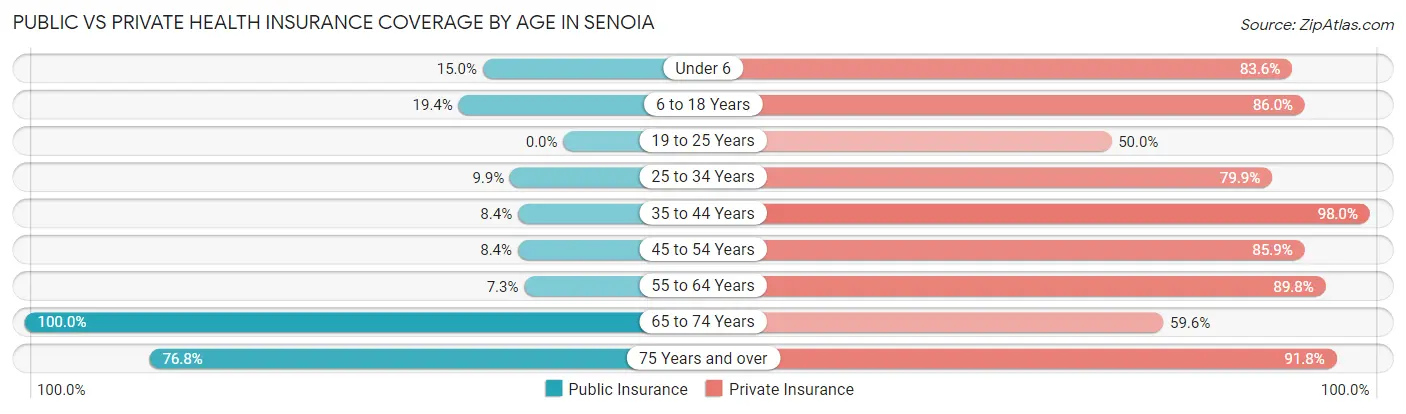
| Age Bracket | Public Insurance | Private Insurance |
| Under 6 | 61 (14.9%) | 341 (83.6%) |
| 6 to 18 Years | 173 (19.4%) | 765 (86.0%) |
| 19 to 25 Years | 0 (0.0%) | 120 (50.0%) |
| 25 to 34 Years | 91 (9.9%) | 734 (79.9%) |
| 35 to 44 Years | 59 (8.4%) | 687 (98.0%) |
| 45 to 54 Years | 58 (8.4%) | 590 (85.9%) |
| 55 to 64 Years | 49 (7.2%) | 607 (89.8%) |
| 65 to 74 Years | 374 (100.0%) | 223 (59.6%) |
| 75 Years and over | 169 (76.8%) | 202 (91.8%) |
| Total | 1,034 (20.2%) | 4,269 (83.5%) |
Disability Status by Sex by Age in Senoia
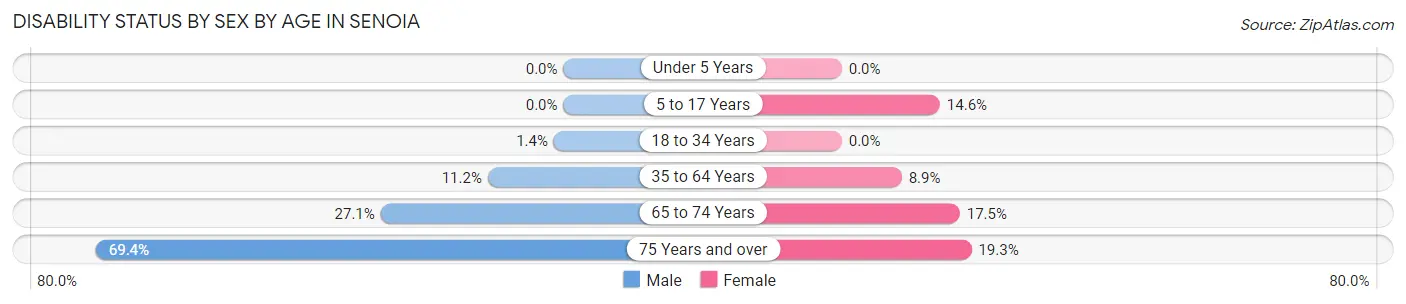
| Age Bracket | Male | Female |
| Under 5 Years | 0 (0.0%) | 0 (0.0%) |
| 5 to 17 Years | 0 (0.0%) | 74 (14.6%) |
| 18 to 34 Years | 9 (1.4%) | 0 (0.0%) |
| 35 to 64 Years | 122 (11.2%) | 87 (8.9%) |
| 65 to 74 Years | 38 (27.1%) | 41 (17.5%) |
| 75 Years and over | 59 (69.4%) | 26 (19.3%) |
Disability Class by Sex by Age in Senoia
Disability Class: Hearing Difficulty
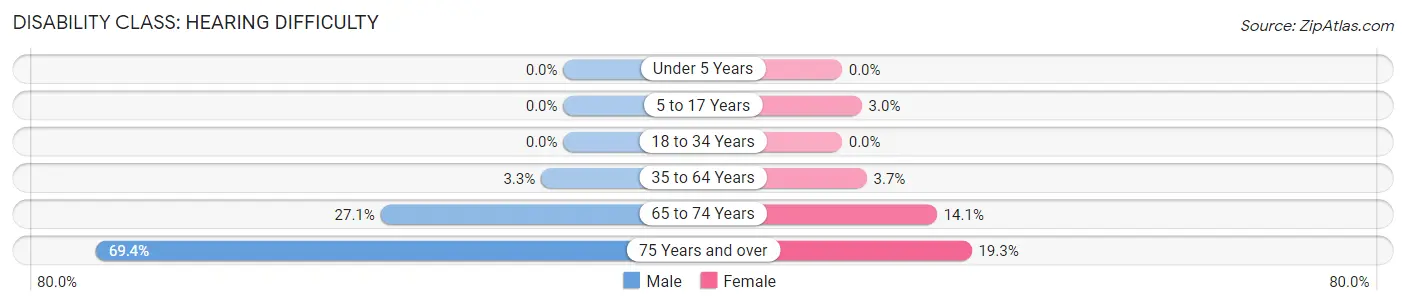
| Age Bracket | Male | Female |
| Under 5 Years | 0 (0.0%) | 0 (0.0%) |
| 5 to 17 Years | 0 (0.0%) | 15 (2.9%) |
| 18 to 34 Years | 0 (0.0%) | 0 (0.0%) |
| 35 to 64 Years | 36 (3.3%) | 36 (3.7%) |
| 65 to 74 Years | 38 (27.1%) | 33 (14.1%) |
| 75 Years and over | 59 (69.4%) | 26 (19.3%) |
Disability Class: Vision Difficulty
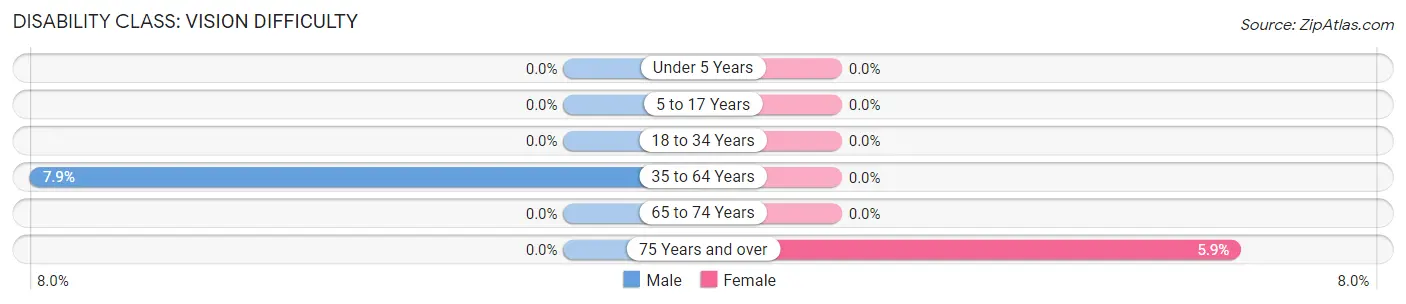
| Age Bracket | Male | Female |
| Under 5 Years | 0 (0.0%) | 0 (0.0%) |
| 5 to 17 Years | 0 (0.0%) | 0 (0.0%) |
| 18 to 34 Years | 0 (0.0%) | 0 (0.0%) |
| 35 to 64 Years | 86 (7.9%) | 0 (0.0%) |
| 65 to 74 Years | 0 (0.0%) | 0 (0.0%) |
| 75 Years and over | 0 (0.0%) | 8 (5.9%) |
Disability Class: Cognitive Difficulty
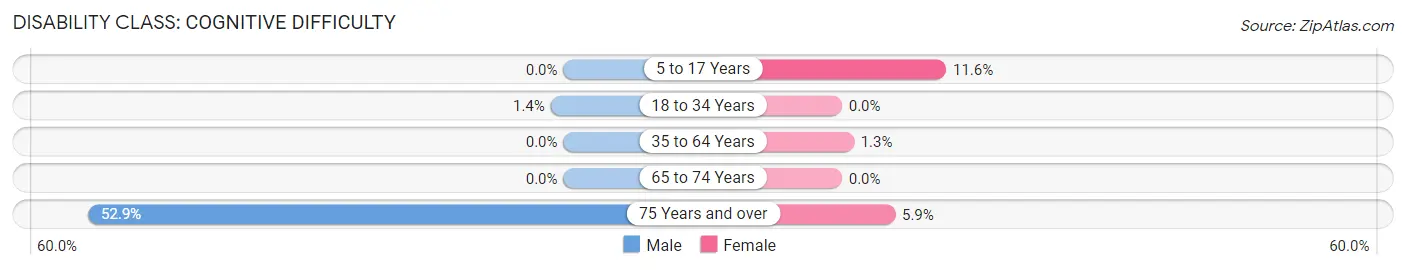
| Age Bracket | Male | Female |
| 5 to 17 Years | 0 (0.0%) | 59 (11.6%) |
| 18 to 34 Years | 9 (1.4%) | 0 (0.0%) |
| 35 to 64 Years | 0 (0.0%) | 13 (1.3%) |
| 65 to 74 Years | 0 (0.0%) | 0 (0.0%) |
| 75 Years and over | 45 (52.9%) | 8 (5.9%) |
Disability Class: Ambulatory Difficulty
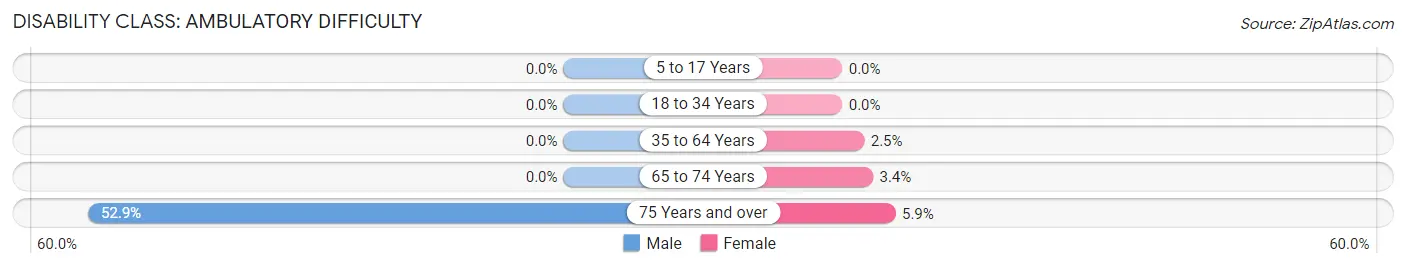
| Age Bracket | Male | Female |
| 5 to 17 Years | 0 (0.0%) | 0 (0.0%) |
| 18 to 34 Years | 0 (0.0%) | 0 (0.0%) |
| 35 to 64 Years | 0 (0.0%) | 24 (2.5%) |
| 65 to 74 Years | 0 (0.0%) | 8 (3.4%) |
| 75 Years and over | 45 (52.9%) | 8 (5.9%) |
Disability Class: Self-Care Difficulty
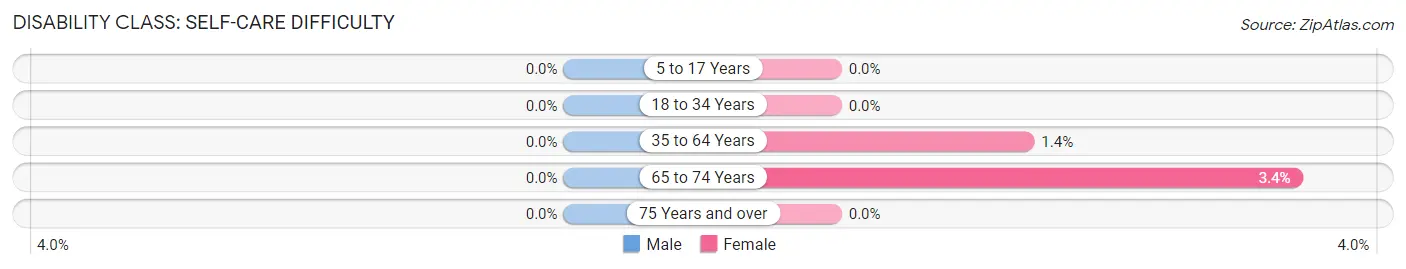
| Age Bracket | Male | Female |
| 5 to 17 Years | 0 (0.0%) | 0 (0.0%) |
| 18 to 34 Years | 0 (0.0%) | 0 (0.0%) |
| 35 to 64 Years | 0 (0.0%) | 14 (1.4%) |
| 65 to 74 Years | 0 (0.0%) | 8 (3.4%) |
| 75 Years and over | 0 (0.0%) | 0 (0.0%) |
Technology Access in Senoia
Computing Device Access in Senoia
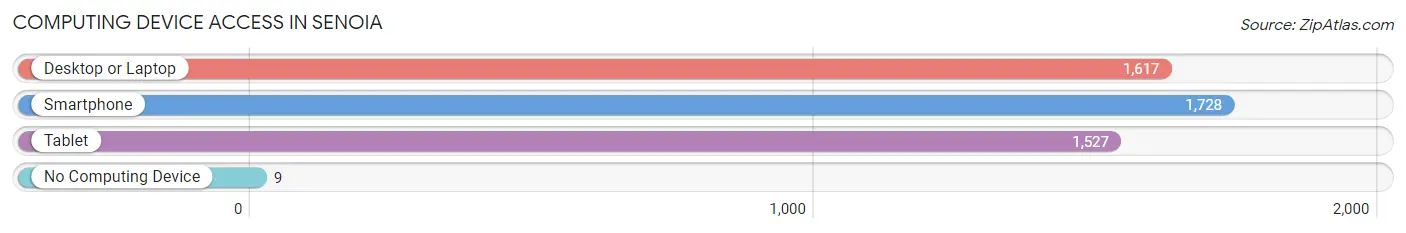
| Device Type | # Households | % Households |
| Desktop or Laptop | 1,617 | 90.0% |
| Smartphone | 1,728 | 96.2% |
| Tablet | 1,527 | 85.0% |
| No Computing Device | 9 | 0.5% |
| Total | 1,796 | 100.0% |
Internet Access in Senoia
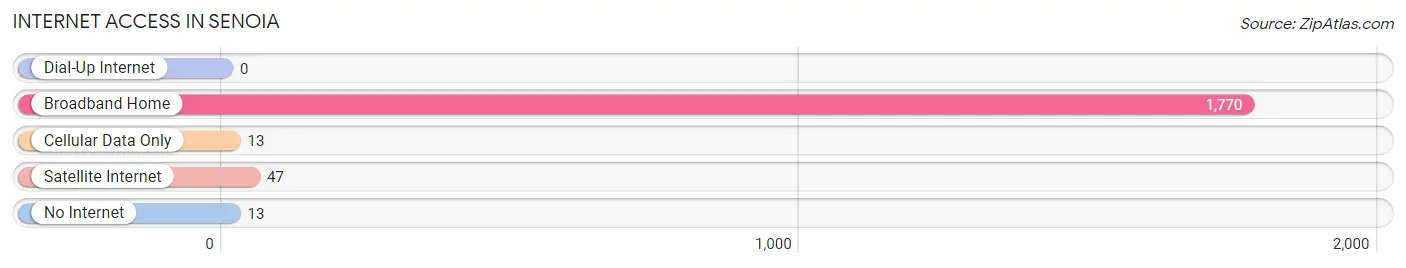
| Internet Type | # Households | % Households |
| Dial-Up Internet | 0 | 0.0% |
| Broadband Home | 1,770 | 98.6% |
| Cellular Data Only | 13 | 0.7% |
| Satellite Internet | 47 | 2.6% |
| No Internet | 13 | 0.7% |
| Total | 1,796 | 100.0% |
Senoia Summary
Senoia, Georgia is a small town located in Coweta County, Georgia, about 35 miles southwest of Atlanta. It is a part of the Atlanta metropolitan area and is home to a population of about 4,000 people.
History
Senoia was founded in 1828 by William and Mary Harris. The town was originally called “Scratch Ankle” due to the briars and brambles that grew in the area. In 1866, the town was renamed Senoia, after the Cherokee word for “place of the pinetrees”.
Senoia was a small farming community until the late 19th century, when the railroad came to town. The railroad brought new industry and jobs to the area, and the town began to grow. In the early 20th century, Senoia was a thriving center of commerce, with a variety of businesses, including a cotton gin, a grist mill, a sawmill, and a brick factory.
Senoia was also home to a number of prominent citizens, including the first African-American mayor of a Georgia town, William H. Harris. Harris was elected mayor in 1892 and served until 1896.
Geography
Senoia is located in the foothills of the Appalachian Mountains, about 35 miles southwest of Atlanta. The town is situated on the banks of the Chattahoochee River, and is surrounded by rolling hills and forests. The town is located in a humid subtropical climate zone, with hot, humid summers and mild winters.
Economy
Senoia’s economy is largely based on agriculture and tourism. The town is home to a number of farms, which produce a variety of crops, including corn, soybeans, cotton, and peanuts. The town is also home to a number of tourist attractions, including the Senoia Raceway, a NASCAR-sanctioned racetrack, and the Senoia Historic District, which features a variety of historic buildings and homes.
Demographics
As of the 2010 census, Senoia had a population of 4,073 people. The racial makeup of the town was 79.3% White, 15.7% African American, 0.3% Native American, 0.7% Asian, 0.1% Pacific Islander, and 3.9% from other races. The median household income was $45,938, and the median family income was $51,938.
Senoia is a small town with a rich history and a vibrant economy. It is a great place to live, work, and visit, and is a great example of a small town in the South.
Common Questions
What is Per Capita Income in Senoia?
Per Capita income in Senoia is $46,503.
What is the Median Family Income in Senoia?
Median Family Income in Senoia is $122,945.
What is the Median Household income in Senoia?
Median Household Income in Senoia is $114,423.
What is Income or Wage Gap in Senoia?
Income or Wage Gap in Senoia is 24.8%.
Women in Senoia earn 75.2 cents for every dollar earned by a man.
What is Inequality or Gini Index in Senoia?
Inequality or Gini Index in Senoia is 0.33.
What is the Total Population of Senoia?
Total Population of Senoia is 5,115.
What is the Total Male Population of Senoia?
Total Male Population of Senoia is 2,641.
What is the Total Female Population of Senoia?
Total Female Population of Senoia is 2,474.
What is the Ratio of Males per 100 Females in Senoia?
There are 106.75 Males per 100 Females in Senoia.
What is the Ratio of Females per 100 Males in Senoia?
There are 93.68 Females per 100 Males in Senoia.
What is the Median Population Age in Senoia?
Median Population Age in Senoia is 35.8 Years.
What is the Average Family Size in Senoia
Average Family Size in Senoia is 3.2 People.
What is the Average Household Size in Senoia
Average Household Size in Senoia is 2.8 People.
How Large is the Labor Force in Senoia?
There are 2,800 People in the Labor Forcein in Senoia.
What is the Percentage of People in the Labor Force in Senoia?
71.2% of People are in the Labor Force in Senoia.
What is the Unemployment Rate in Senoia?
Unemployment Rate in Senoia is 3.6%.