Zip Codes with the Highest Percentage of Population Employed in Computer & Mathematics in Snellville, GA
RELATED REPORTS & OPTIONS
Computer & Mathematics
Snellville
Compare Zip Codes
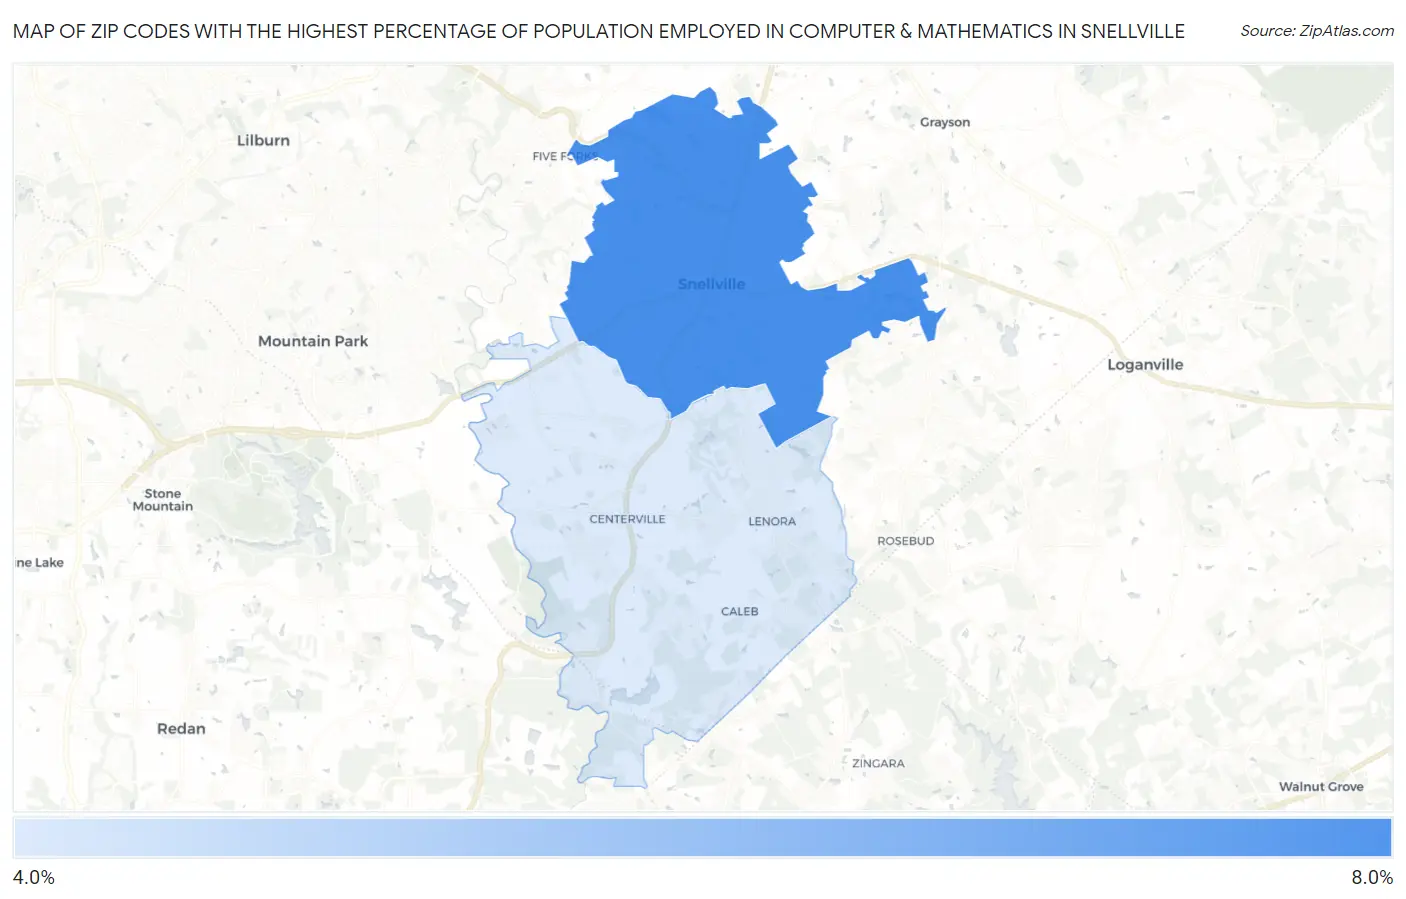
Map of Zip Codes with the Highest Percentage of Population Employed in Computer & Mathematics in Snellville
4.0%
6.5%
Zip Codes with the Highest Percentage of Population Employed in Computer & Mathematics in Snellville, GA
| Zip Code | % Employed | vs State | vs National | |
| 1. | 30078 | 6.5% | 3.7%(+2.80)#40 | 3.5%(+2.94)#1,963 |
| 2. | 30039 | 4.0% | 3.7%(+0.374)#109 | 3.5%(+0.506)#4,968 |
1
Common Questions
What are the Top Zip Codes with the Highest Percentage of Population Employed in Computer & Mathematics in Snellville, GA?
Top Zip Codes with the Highest Percentage of Population Employed in Computer & Mathematics in Snellville, GA are:
What zip code has the Highest Percentage of Population Employed in Computer & Mathematics in Snellville, GA?
30078 has the Highest Percentage of Population Employed in Computer & Mathematics in Snellville, GA with 6.5%.
What is the Percentage of Population Employed in Computer & Mathematics in Snellville, GA?
Percentage of Population Employed in Computer & Mathematics in Snellville is 7.9%.
What is the Percentage of Population Employed in Computer & Mathematics in Georgia?
Percentage of Population Employed in Computer & Mathematics in Georgia is 3.7%.
What is the Percentage of Population Employed in Computer & Mathematics in the United States?
Percentage of Population Employed in Computer & Mathematics in the United States is 3.5%.