Ardentown, DE Map & Demographics
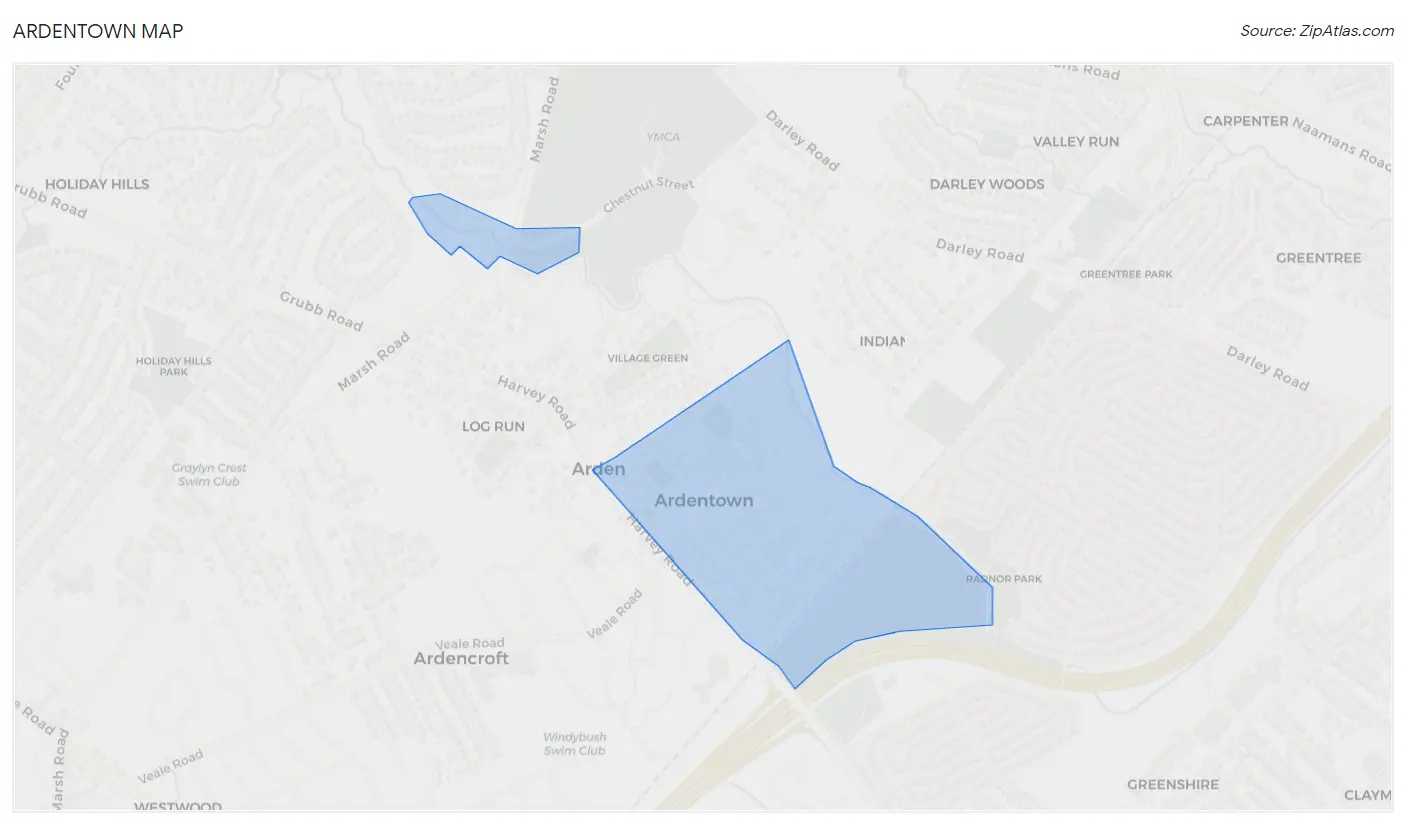
Ardentown Map
Ardentown Overview
$53,403
PER CAPITA INCOME
$102,917
AVG FAMILY INCOME
$81,250
AVG HOUSEHOLD INCOME
0.36
INEQUALITY / GINI INDEX
223
TOTAL POPULATION
106
MALE POPULATION
117
FEMALE POPULATION
90.60
MALES / 100 FEMALES
110.38
FEMALES / 100 MALES
57.8
MEDIAN AGE
2.5
AVG FAMILY SIZE
1.9
AVG HOUSEHOLD SIZE
105
LABOR FORCE [ PEOPLE ]
52.8%
PERCENT IN LABOR FORCE
4.8%
UNEMPLOYMENT RATE
Income in Ardentown
Income Overview in Ardentown
Per Capita Income in Ardentown is $53,403, while median incomes of families and households are $102,917 and $81,250 respectively.
| Characteristic | Number | Measure |
| Per Capita Income | 223 | $53,403 |
| Median Family Income | 68 | $102,917 |
| Mean Family Income | 68 | $111,582 |
| Median Household Income | 113 | $81,250 |
| Mean Household Income | 113 | $101,818 |
| Income Deficit | 68 | $0 |
| Wage / Income Gap (%) | 223 | 0.00% |
| Wage / Income Gap ($) | 223 | 100.00¢ per $1 |
| Gini / Inequality Index | 223 | 0.36 |
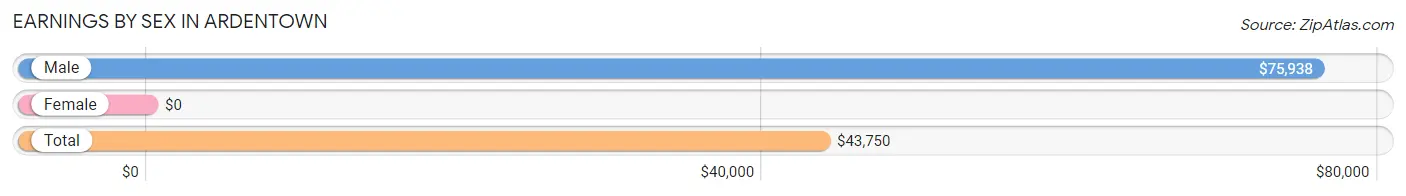
Earnings by Sex in Ardentown
| Sex | Number | Average Earnings |
| Male | 63 (52.5%) | $75,938 |
| Female | 57 (47.5%) | $0 |
| Total | 120 (100.0%) | $43,750 |
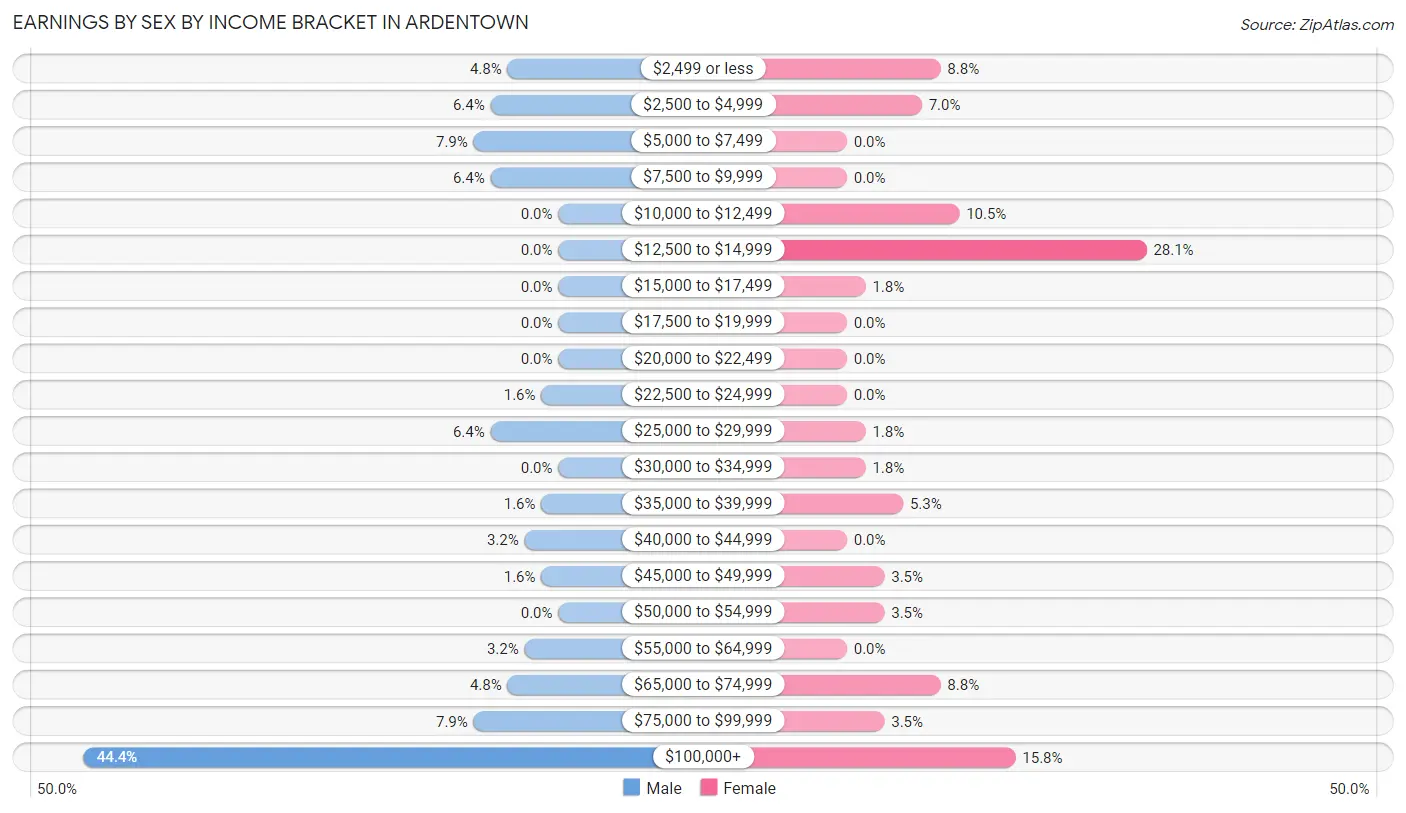
Earnings by Sex by Income Bracket in Ardentown
The most common earnings brackets in Ardentown are $100,000+ for men (28 | 44.4%) and $12,500 to $14,999 for women (16 | 28.1%).
| Income | Male | Female |
| $2,499 or less | 3 (4.8%) | 5 (8.8%) |
| $2,500 to $4,999 | 4 (6.4%) | 4 (7.0%) |
| $5,000 to $7,499 | 5 (7.9%) | 0 (0.0%) |
| $7,500 to $9,999 | 4 (6.4%) | 0 (0.0%) |
| $10,000 to $12,499 | 0 (0.0%) | 6 (10.5%) |
| $12,500 to $14,999 | 0 (0.0%) | 16 (28.1%) |
| $15,000 to $17,499 | 0 (0.0%) | 1 (1.8%) |
| $17,500 to $19,999 | 0 (0.0%) | 0 (0.0%) |
| $20,000 to $22,499 | 0 (0.0%) | 0 (0.0%) |
| $22,500 to $24,999 | 1 (1.6%) | 0 (0.0%) |
| $25,000 to $29,999 | 4 (6.4%) | 1 (1.8%) |
| $30,000 to $34,999 | 0 (0.0%) | 1 (1.8%) |
| $35,000 to $39,999 | 1 (1.6%) | 3 (5.3%) |
| $40,000 to $44,999 | 2 (3.2%) | 0 (0.0%) |
| $45,000 to $49,999 | 1 (1.6%) | 2 (3.5%) |
| $50,000 to $54,999 | 0 (0.0%) | 2 (3.5%) |
| $55,000 to $64,999 | 2 (3.2%) | 0 (0.0%) |
| $65,000 to $74,999 | 3 (4.8%) | 5 (8.8%) |
| $75,000 to $99,999 | 5 (7.9%) | 2 (3.5%) |
| $100,000+ | 28 (44.4%) | 9 (15.8%) |
| Total | 63 (100.0%) | 57 (100.0%) |
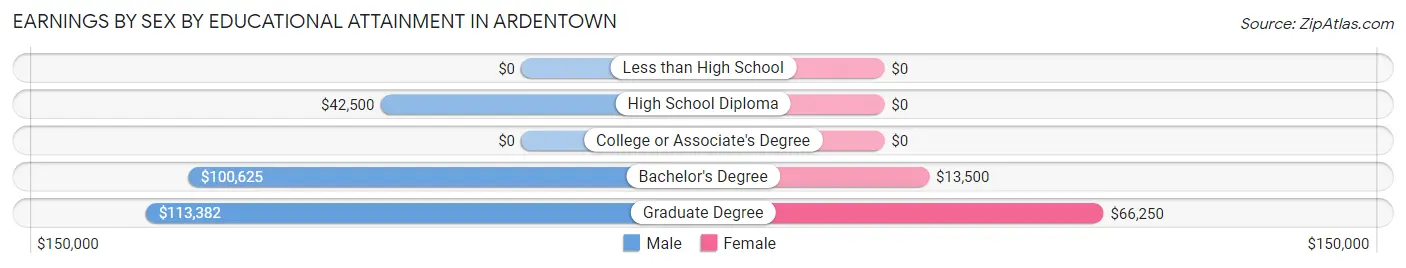
Earnings by Sex by Educational Attainment in Ardentown
| Educational Attainment | Male Income | Female Income |
| Less than High School | - | - |
| High School Diploma | $42,500 | $0 |
| College or Associate's Degree | - | - |
| Bachelor's Degree | $100,625 | $13,500 |
| Graduate Degree | $113,382 | $66,250 |
| Total | $100,625 | $0 |
Family Income in Ardentown
Family Income Brackets in Ardentown
According to the Ardentown family income data, there are 25 families falling into the $100,000 to $149,999 income range, which is the most common income bracket and makes up 36.8% of all families.
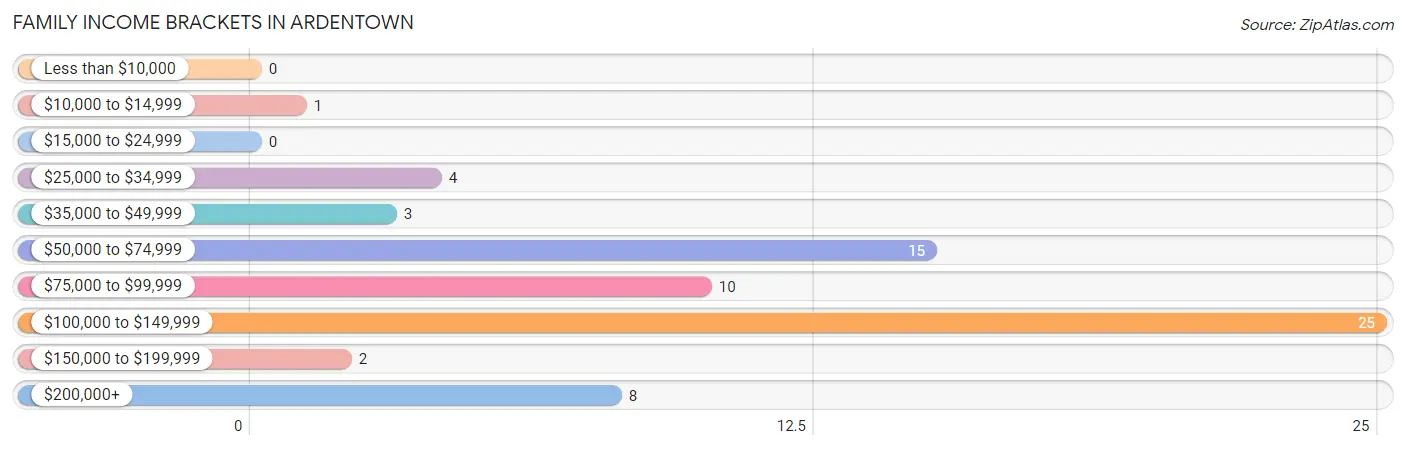
| Income Bracket | # Families | % Families |
| Less than $10,000 | 0 | 0.0% |
| $10,000 to $14,999 | 1 | 1.5% |
| $15,000 to $24,999 | 0 | 0.0% |
| $25,000 to $34,999 | 4 | 5.9% |
| $35,000 to $49,999 | 3 | 4.4% |
| $50,000 to $74,999 | 15 | 22.1% |
| $75,000 to $99,999 | 10 | 14.7% |
| $100,000 to $149,999 | 25 | 36.8% |
| $150,000 to $199,999 | 2 | 2.9% |
| $200,000+ | 8 | 11.8% |
Family Income by Famaliy Size in Ardentown
3-person families (7 | 10.3%) account for the highest median family income in Ardentown with $103,125 per family, while 2-person families (52 | 76.5%) have the highest median income of $47,500 per family member.
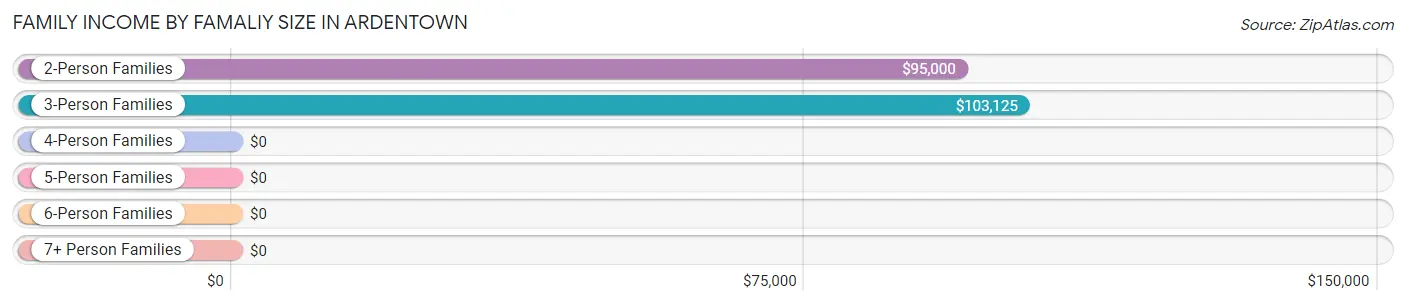
| Income Bracket | # Families | Median Income |
| 2-Person Families | 52 (76.5%) | $95,000 |
| 3-Person Families | 7 (10.3%) | $103,125 |
| 4-Person Families | 5 (7.3%) | $0 |
| 5-Person Families | 4 (5.9%) | $0 |
| 6-Person Families | 0 (0.0%) | $0 |
| 7+ Person Families | 0 (0.0%) | $0 |
| Total | 68 (100.0%) | $102,917 |
Family Income by Number of Earners in Ardentown
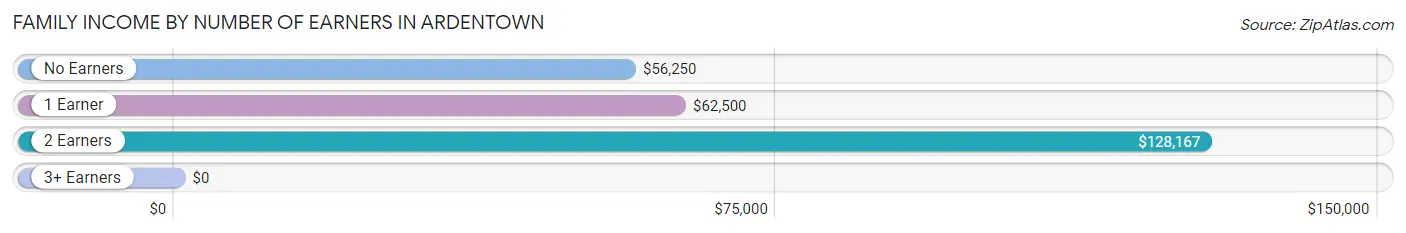
| Number of Earners | # Families | Median Income |
| No Earners | 12 (17.6%) | $56,250 |
| 1 Earner | 20 (29.4%) | $62,500 |
| 2 Earners | 32 (47.1%) | $128,167 |
| 3+ Earners | 4 (5.9%) | $0 |
| Total | 68 (100.0%) | $102,917 |
Household Income in Ardentown
Household Income Brackets in Ardentown
With 31 households falling in the category, the $100,000 to $149,999 income range is the most frequent in Ardentown, accounting for 27.4% of all households.
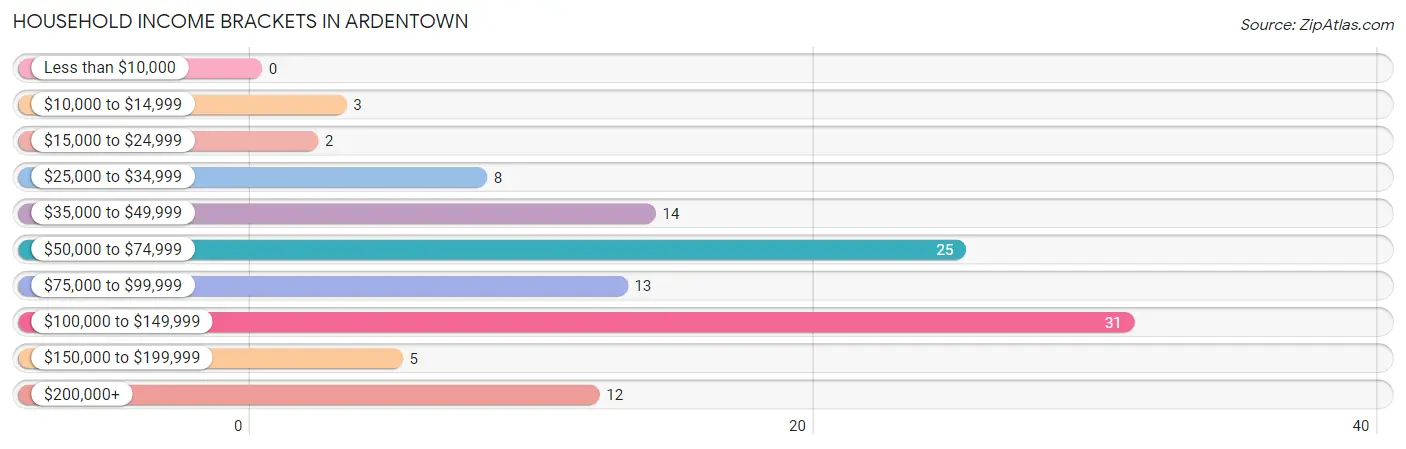
| Income Bracket | # Households | % Households |
| Less than $10,000 | 0 | 0.0% |
| $10,000 to $14,999 | 3 | 2.7% |
| $15,000 to $24,999 | 2 | 1.8% |
| $25,000 to $34,999 | 8 | 7.1% |
| $35,000 to $49,999 | 14 | 12.4% |
| $50,000 to $74,999 | 25 | 22.1% |
| $75,000 to $99,999 | 13 | 11.5% |
| $100,000 to $149,999 | 31 | 27.4% |
| $150,000 to $199,999 | 5 | 4.4% |
| $200,000+ | 12 | 10.6% |
Household Income by Householder Age in Ardentown
The median household income in Ardentown is $81,250, with the highest median household income of $128,333 found in the 45 to 64 years age bracket for the primary householder. A total of 38 households (33.6%) fall into this category. Meanwhile, the 15 to 24 years age bracket for the primary householder has the lowest median household income of $0, with 1 households (0.9%) in this group.
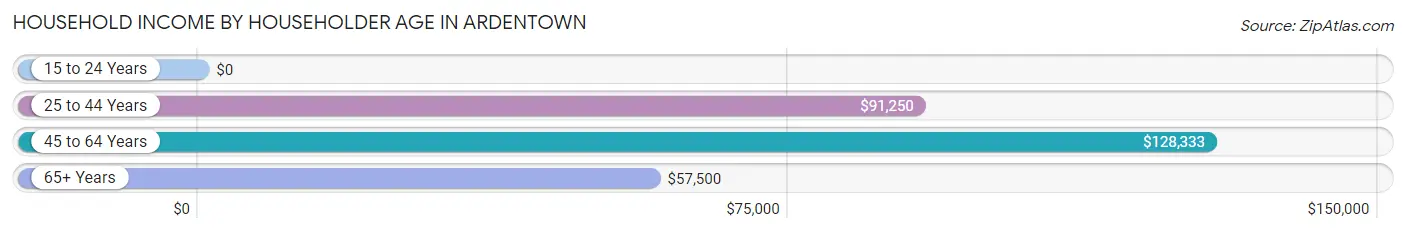
| Income Bracket | # Households | Median Income |
| 15 to 24 Years | 1 (0.9%) | $0 |
| 25 to 44 Years | 20 (17.7%) | $91,250 |
| 45 to 64 Years | 38 (33.6%) | $128,333 |
| 65+ Years | 54 (47.8%) | $57,500 |
| Total | 113 (100.0%) | $81,250 |
Poverty in Ardentown
Income Below Poverty by Sex and Age in Ardentown
With 5.7% poverty level for males and 2.6% for females among the residents of Ardentown, 12 to 14 year old males and 35 to 44 year old females are the most vulnerable to poverty, with 4 males (33.3%) and 1 females (16.7%) in their respective age groups living below the poverty level.
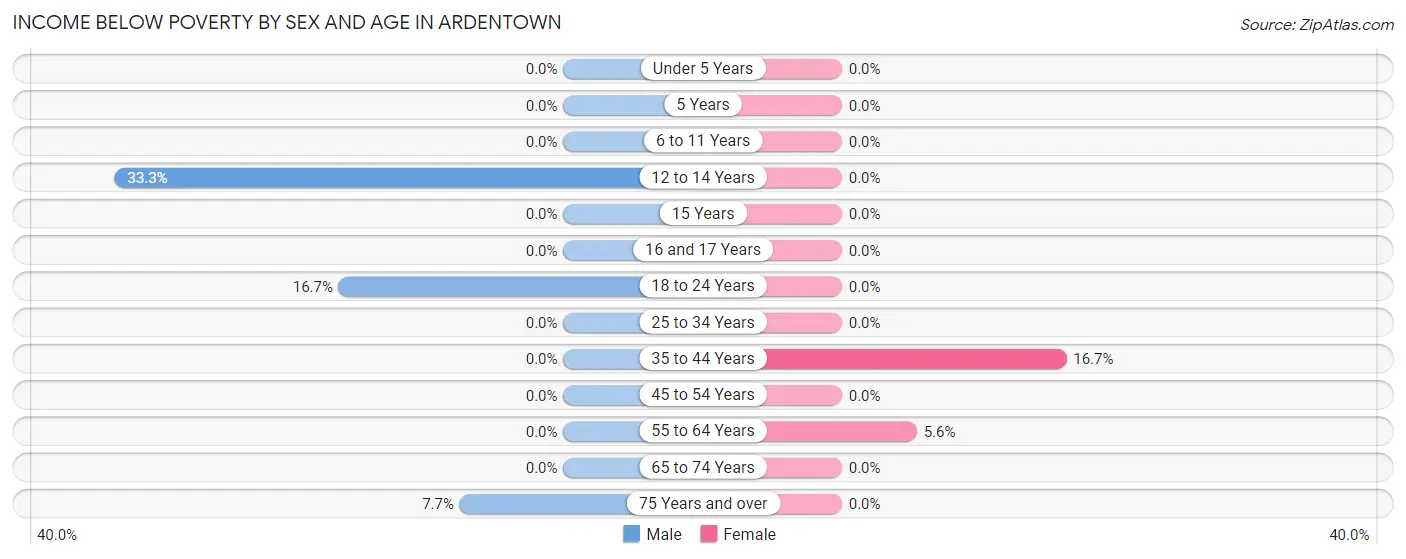
| Age Bracket | Male | Female |
| Under 5 Years | 0 (0.0%) | 0 (0.0%) |
| 5 Years | 0 (0.0%) | 0 (0.0%) |
| 6 to 11 Years | 0 (0.0%) | 0 (0.0%) |
| 12 to 14 Years | 4 (33.3%) | 0 (0.0%) |
| 15 Years | 0 (0.0%) | 0 (0.0%) |
| 16 and 17 Years | 0 (0.0%) | 0 (0.0%) |
| 18 to 24 Years | 1 (16.7%) | 0 (0.0%) |
| 25 to 34 Years | 0 (0.0%) | 0 (0.0%) |
| 35 to 44 Years | 0 (0.0%) | 1 (16.7%) |
| 45 to 54 Years | 0 (0.0%) | 0 (0.0%) |
| 55 to 64 Years | 0 (0.0%) | 2 (5.6%) |
| 65 to 74 Years | 0 (0.0%) | 0 (0.0%) |
| 75 Years and over | 1 (7.7%) | 0 (0.0%) |
| Total | 6 (5.7%) | 3 (2.6%) |
Income Above Poverty by Sex and Age in Ardentown
According to the poverty statistics in Ardentown, males aged 6 to 11 years and females aged 6 to 11 years are the age groups that are most secure financially, with 100.0% of males and 100.0% of females in these age groups living above the poverty line.
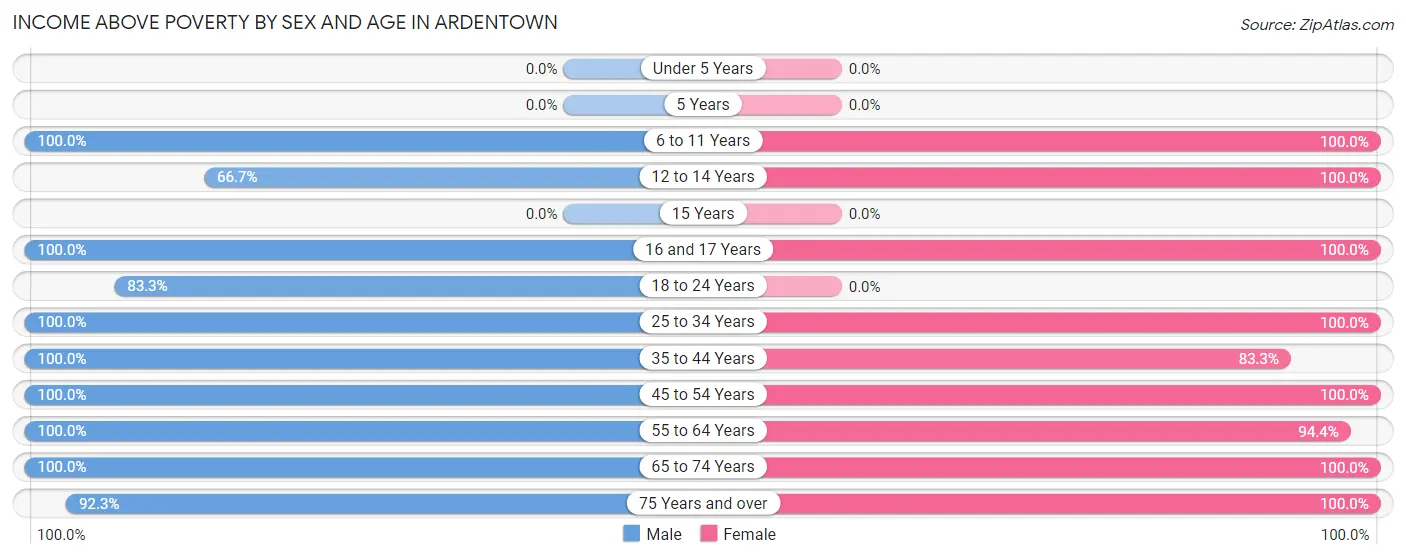
| Age Bracket | Male | Female |
| Under 5 Years | 0 (0.0%) | 0 (0.0%) |
| 5 Years | 0 (0.0%) | 0 (0.0%) |
| 6 to 11 Years | 5 (100.0%) | 5 (100.0%) |
| 12 to 14 Years | 8 (66.7%) | 2 (100.0%) |
| 15 Years | 0 (0.0%) | 0 (0.0%) |
| 16 and 17 Years | 2 (100.0%) | 2 (100.0%) |
| 18 to 24 Years | 5 (83.3%) | 0 (0.0%) |
| 25 to 34 Years | 6 (100.0%) | 10 (100.0%) |
| 35 to 44 Years | 11 (100.0%) | 5 (83.3%) |
| 45 to 54 Years | 5 (100.0%) | 7 (100.0%) |
| 55 to 64 Years | 30 (100.0%) | 34 (94.4%) |
| 65 to 74 Years | 15 (100.0%) | 24 (100.0%) |
| 75 Years and over | 12 (92.3%) | 23 (100.0%) |
| Total | 99 (94.3%) | 112 (97.4%) |
Income Below Poverty Among Married-Couple Families in Ardentown
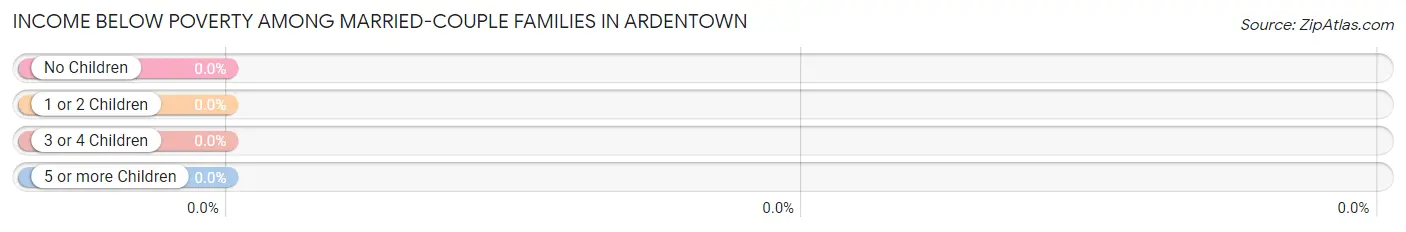
| Children | Above Poverty | Below Poverty |
| No Children | 47 (100.0%) | 0 (0.0%) |
| 1 or 2 Children | 6 (100.0%) | 0 (0.0%) |
| 3 or 4 Children | 4 (100.0%) | 0 (0.0%) |
| 5 or more Children | 0 (0.0%) | 0 (0.0%) |
| Total | 57 (100.0%) | 0 (0.0%) |
Income Below Poverty Among Single-Parent Households in Ardentown
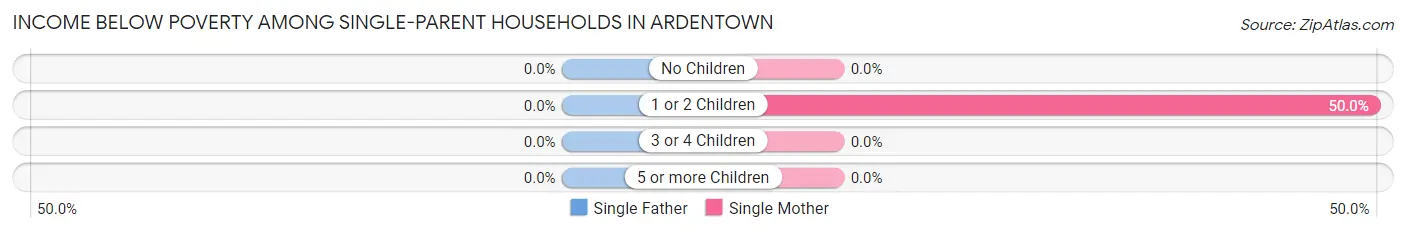
| Children | Single Father | Single Mother |
| No Children | 0 (0.0%) | 0 (0.0%) |
| 1 or 2 Children | 0 (0.0%) | 1 (50.0%) |
| 3 or 4 Children | 0 (0.0%) | 0 (0.0%) |
| 5 or more Children | 0 (0.0%) | 0 (0.0%) |
| Total | 0 (0.0%) | 1 (14.3%) |
Income Below Poverty Among Married-Couple vs Single-Parent Households in Ardentown
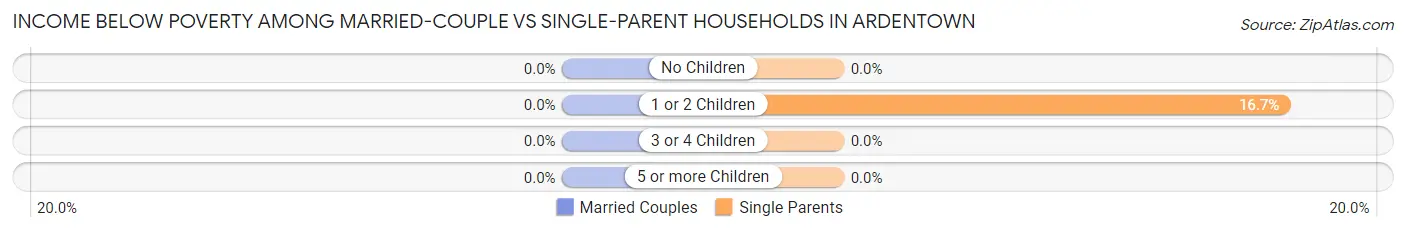
| Children | Married-Couple Families | Single-Parent Households |
| No Children | 0 (0.0%) | 0 (0.0%) |
| 1 or 2 Children | 0 (0.0%) | 1 (16.7%) |
| 3 or 4 Children | 0 (0.0%) | 0 (0.0%) |
| 5 or more Children | 0 (0.0%) | 0 (0.0%) |
| Total | 0 (0.0%) | 1 (9.1%) |
Race in Ardentown
The most populous races in Ardentown are White / Caucasian (192 | 86.1%), Two or more Races (26 | 11.7%), and Hispanic or Latino (12 | 5.4%).
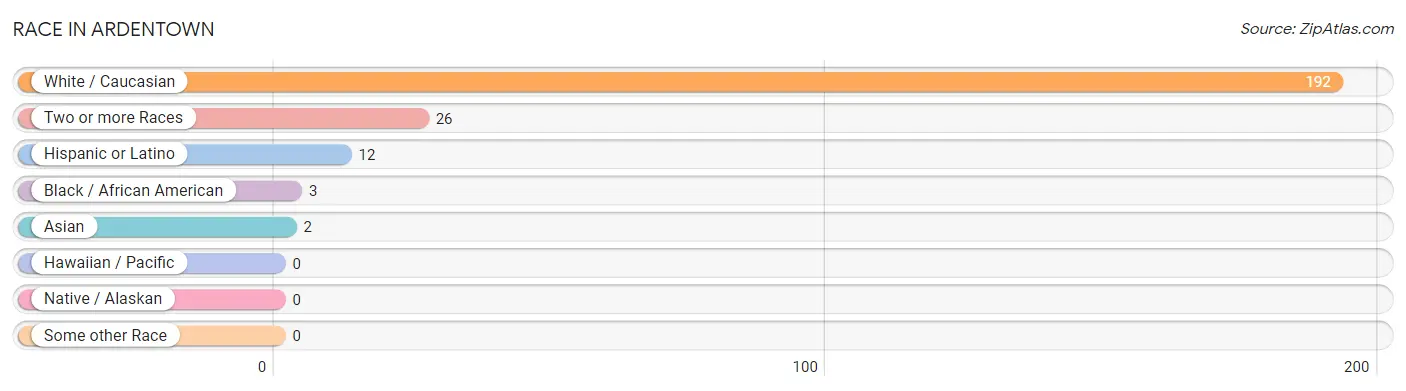
| Race | # Population | % Population |
| Asian | 2 | 0.9% |
| Black / African American | 3 | 1.3% |
| Hawaiian / Pacific | 0 | 0.0% |
| Hispanic or Latino | 12 | 5.4% |
| Native / Alaskan | 0 | 0.0% |
| White / Caucasian | 192 | 86.1% |
| Two or more Races | 26 | 11.7% |
| Some other Race | 0 | 0.0% |
| Total | 223 | 100.0% |
Ancestry in Ardentown
The most populous ancestries reported in Ardentown are Irish (92 | 41.3%), English (78 | 35.0%), Italian (32 | 14.3%), German (28 | 12.6%), and Cherokee (15 | 6.7%), together accounting for 109.9% of all Ardentown residents.
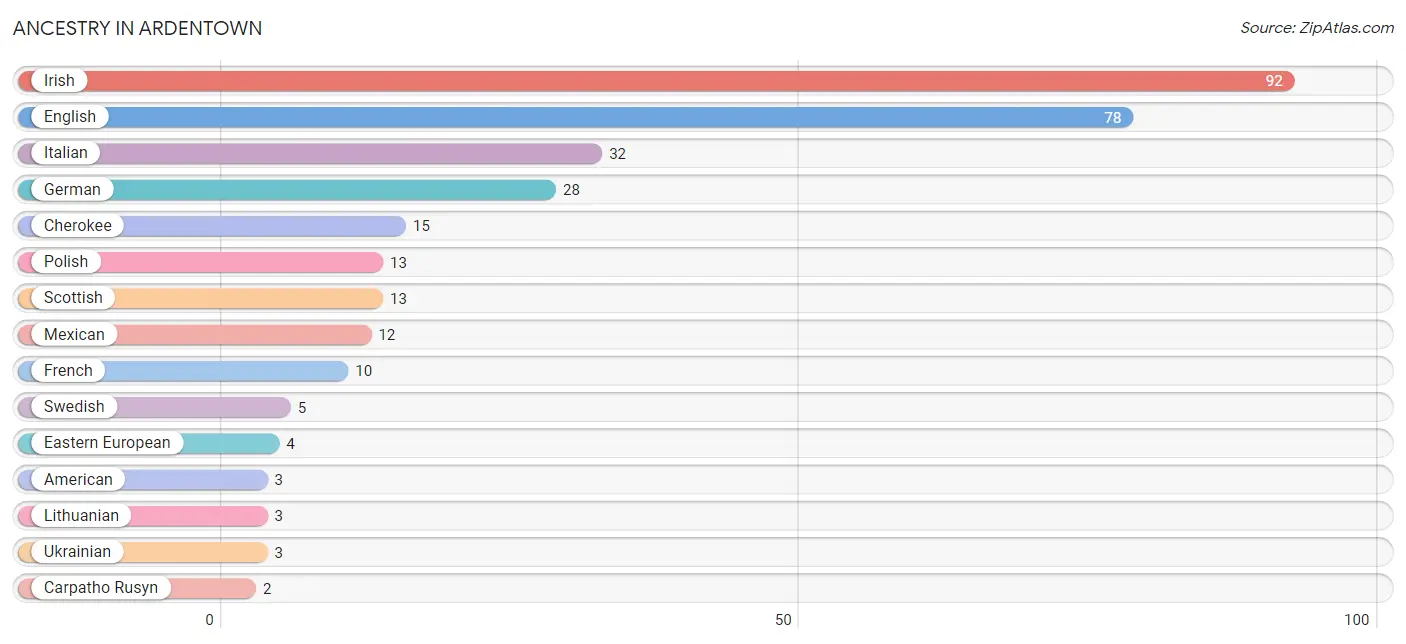
| Ancestry | # Population | % Population |
| American | 3 | 1.3% |
| Austrian | 1 | 0.4% |
| Carpatho Rusyn | 2 | 0.9% |
| Cherokee | 15 | 6.7% |
| Dutch | 2 | 0.9% |
| Eastern European | 4 | 1.8% |
| English | 78 | 35.0% |
| European | 1 | 0.4% |
| French | 10 | 4.5% |
| French Canadian | 1 | 0.4% |
| German | 28 | 12.6% |
| Greek | 1 | 0.4% |
| Irish | 92 | 41.3% |
| Italian | 32 | 14.3% |
| Lithuanian | 3 | 1.3% |
| Mexican | 12 | 5.4% |
| Polish | 13 | 5.8% |
| Russian | 1 | 0.4% |
| Scotch-Irish | 2 | 0.9% |
| Scottish | 13 | 5.8% |
| Swedish | 5 | 2.2% |
| Swiss | 2 | 0.9% |
| Thai | 2 | 0.9% |
| Ukrainian | 3 | 1.3% | View All 24 Rows |
Immigrants in Ardentown
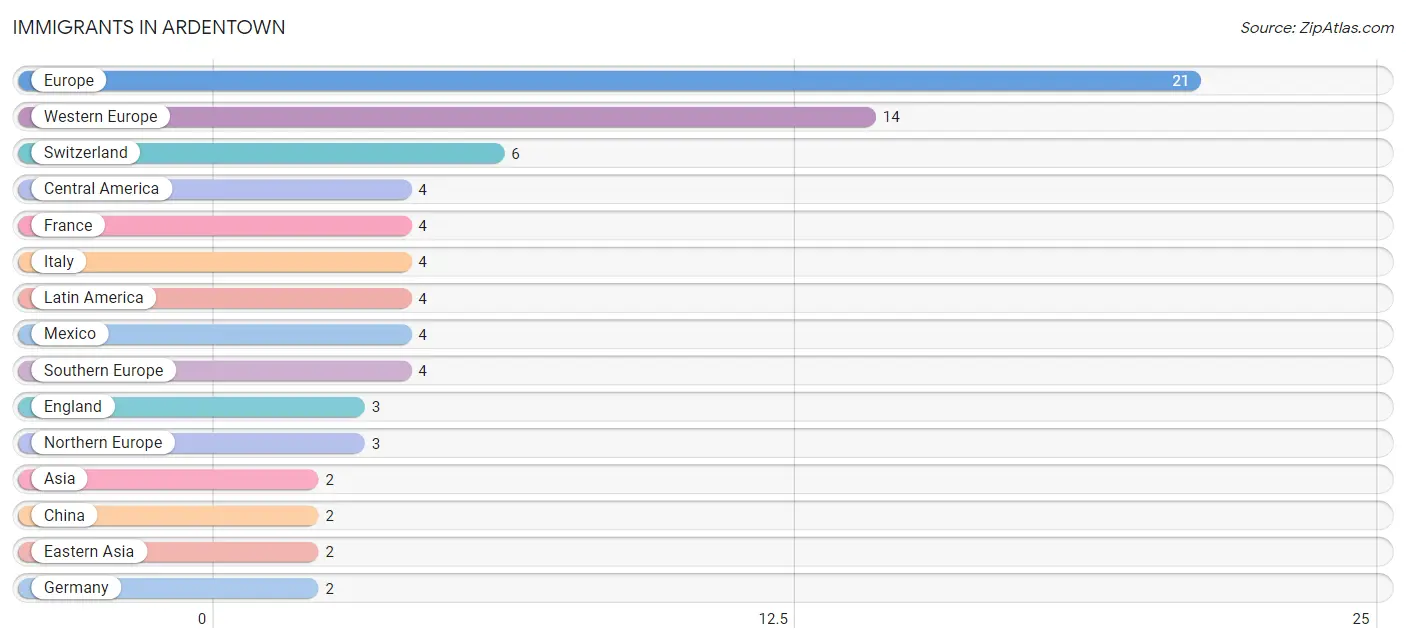
The most numerous immigrant groups reported in Ardentown came from Europe (21 | 9.4%), Western Europe (14 | 6.3%), Switzerland (6 | 2.7%), Central America (4 | 1.8%), and France (4 | 1.8%), together accounting for 22.0% of all Ardentown residents.
| Immigration Origin | # Population | % Population |
| Asia | 2 | 0.9% |
| Central America | 4 | 1.8% |
| China | 2 | 0.9% |
| Eastern Asia | 2 | 0.9% |
| England | 3 | 1.3% |
| Europe | 21 | 9.4% |
| France | 4 | 1.8% |
| Germany | 2 | 0.9% |
| Italy | 4 | 1.8% |
| Latin America | 4 | 1.8% |
| Mexico | 4 | 1.8% |
| Netherlands | 2 | 0.9% |
| Northern Europe | 3 | 1.3% |
| Southern Europe | 4 | 1.8% |
| Switzerland | 6 | 2.7% |
| Western Europe | 14 | 6.3% | View All 16 Rows |
Sex and Age in Ardentown
Sex and Age in Ardentown
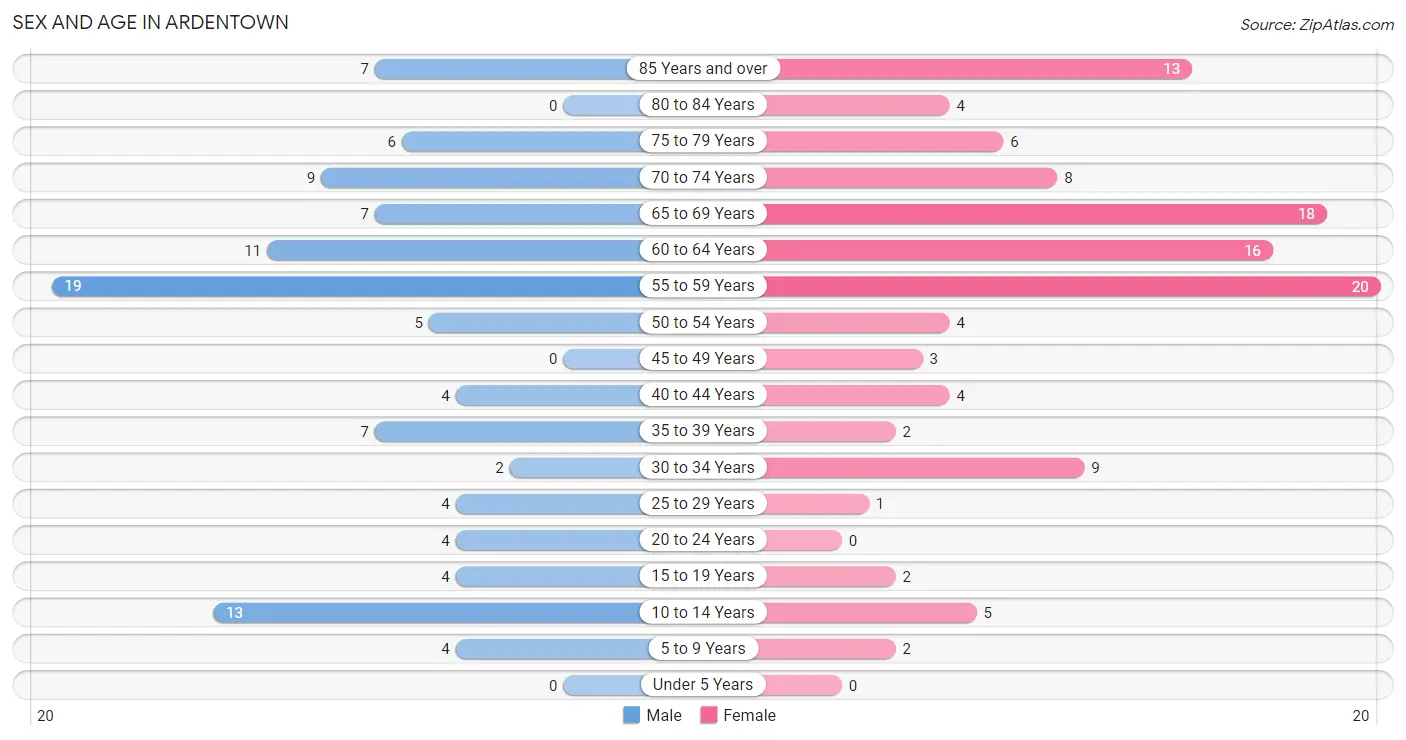
The most populous age groups in Ardentown are 55 to 59 Years (19 | 17.9%) for men and 55 to 59 Years (20 | 17.1%) for women.
| Age Bracket | Male | Female |
| Under 5 Years | 0 (0.0%) | 0 (0.0%) |
| 5 to 9 Years | 4 (3.8%) | 2 (1.7%) |
| 10 to 14 Years | 13 (12.3%) | 5 (4.3%) |
| 15 to 19 Years | 4 (3.8%) | 2 (1.7%) |
| 20 to 24 Years | 4 (3.8%) | 0 (0.0%) |
| 25 to 29 Years | 4 (3.8%) | 1 (0.9%) |
| 30 to 34 Years | 2 (1.9%) | 9 (7.7%) |
| 35 to 39 Years | 7 (6.6%) | 2 (1.7%) |
| 40 to 44 Years | 4 (3.8%) | 4 (3.4%) |
| 45 to 49 Years | 0 (0.0%) | 3 (2.6%) |
| 50 to 54 Years | 5 (4.7%) | 4 (3.4%) |
| 55 to 59 Years | 19 (17.9%) | 20 (17.1%) |
| 60 to 64 Years | 11 (10.4%) | 16 (13.7%) |
| 65 to 69 Years | 7 (6.6%) | 18 (15.4%) |
| 70 to 74 Years | 9 (8.5%) | 8 (6.8%) |
| 75 to 79 Years | 6 (5.7%) | 6 (5.1%) |
| 80 to 84 Years | 0 (0.0%) | 4 (3.4%) |
| 85 Years and over | 7 (6.6%) | 13 (11.1%) |
| Total | 106 (100.0%) | 117 (100.0%) |
Families and Households in Ardentown
Median Family Size in Ardentown
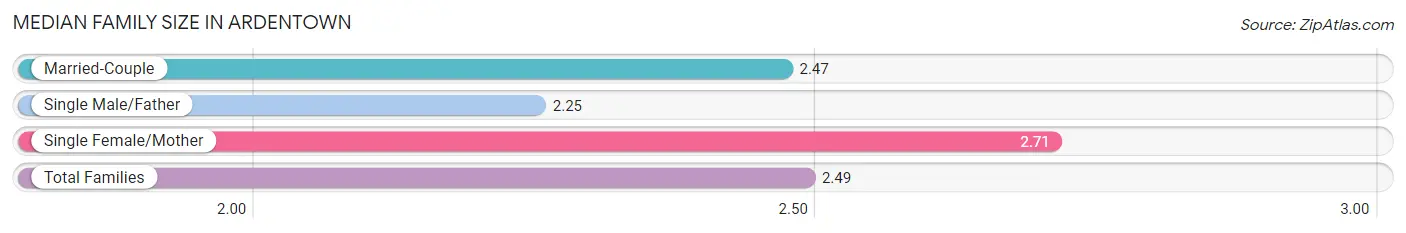
The median family size in Ardentown is 2.49 persons per family, with single female/mother families (7 | 10.3%) accounting for the largest median family size of 2.71 persons per family. On the other hand, single male/father families (4 | 5.9%) represent the smallest median family size with 2.25 persons per family.
| Family Type | # Families | Family Size |
| Married-Couple | 57 (83.8%) | 2.47 |
| Single Male/Father | 4 (5.9%) | 2.25 |
| Single Female/Mother | 7 (10.3%) | 2.71 |
| Total Families | 68 (100.0%) | 2.49 |
Median Household Size in Ardentown
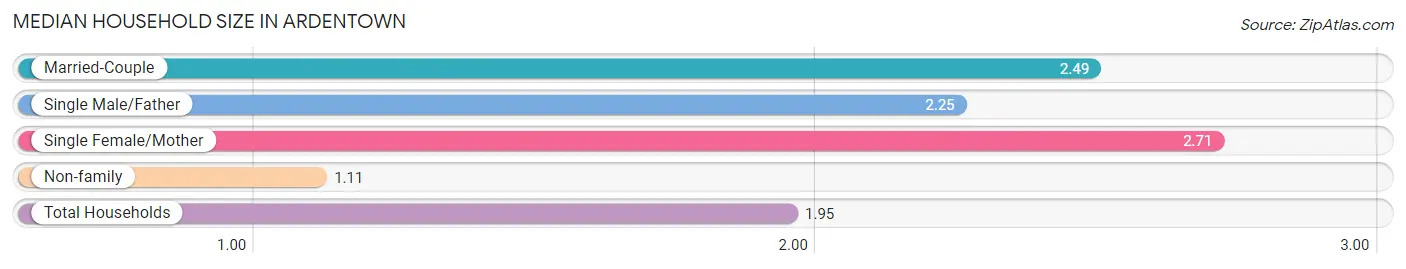
The median household size in Ardentown is 1.95 persons per household, with single female/mother households (7 | 6.2%) accounting for the largest median household size of 2.71 persons per household. non-family households (45 | 39.8%) represent the smallest median household size with 1.11 persons per household.
| Household Type | # Households | Household Size |
| Married-Couple | 57 (50.4%) | 2.49 |
| Single Male/Father | 4 (3.5%) | 2.25 |
| Single Female/Mother | 7 (6.2%) | 2.71 |
| Non-family | 45 (39.8%) | 1.11 |
| Total Households | 113 (100.0%) | 1.95 |
Household Size by Marriage Status in Ardentown
Out of a total of 113 households in Ardentown, 68 (60.2%) are family households, while 45 (39.8%) are nonfamily households. The most numerous type of family households are 2-person households, comprising 51, and the most common type of nonfamily households are 1-person households, comprising 40.
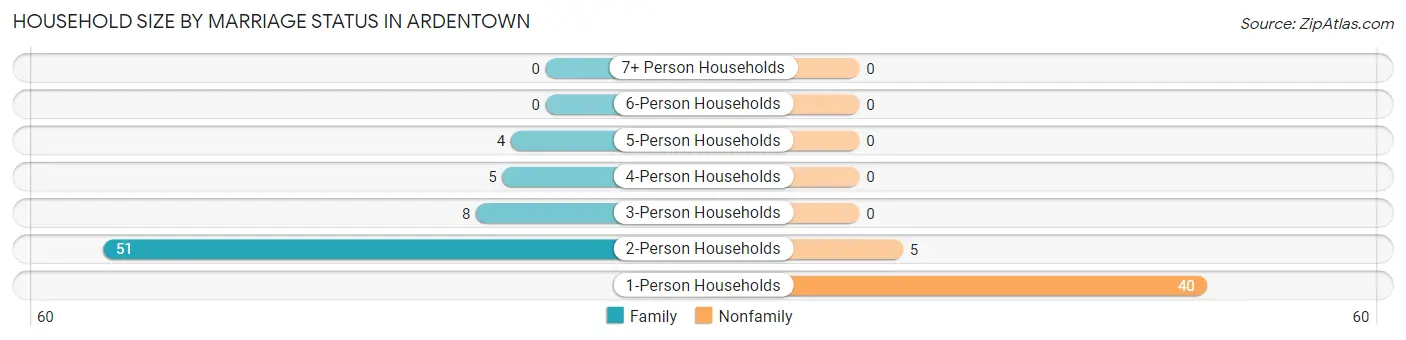
| Household Size | Family Households | Nonfamily Households |
| 1-Person Households | - | 40 (35.4%) |
| 2-Person Households | 51 (45.1%) | 5 (4.4%) |
| 3-Person Households | 8 (7.1%) | 0 (0.0%) |
| 4-Person Households | 5 (4.4%) | 0 (0.0%) |
| 5-Person Households | 4 (3.5%) | 0 (0.0%) |
| 6-Person Households | 0 (0.0%) | 0 (0.0%) |
| 7+ Person Households | 0 (0.0%) | 0 (0.0%) |
| Total | 68 (60.2%) | 45 (39.8%) |
Female Fertility in Ardentown
Fertility by Age in Ardentown
| Age Bracket | Women with Births | Births / 1,000 Women |
| 15 to 19 years | 0 (0.0%) | 0.0 |
| 20 to 34 years | 0 (0.0%) | 0.0 |
| 35 to 50 years | 0 (0.0%) | 0.0 |
| Total | 0 (0.0%) | 0.0 |
Fertility by Age by Marriage Status in Ardentown
| Age Bracket | Married | Unmarried |
| 15 to 19 years | 0 (0.0%) | 0 (0.0%) |
| 20 to 34 years | 0 (0.0%) | 0 (0.0%) |
| 35 to 50 years | 0 (0.0%) | 0 (0.0%) |
| Total | 0 (0.0%) | 0 (0.0%) |
Fertility by Education in Ardentown
| Educational Attainment | Women with Births | Births / 1,000 Women |
| Less than High School | 0 (0.0%) | 0.0 |
| High School Diploma | 0 (0.0%) | 0.0 |
| College or Associate's Degree | 0 (0.0%) | 0.0 |
| Bachelor's Degree | 0 (0.0%) | 0.0 |
| Graduate Degree | 0 (0.0%) | 0.0 |
| Total | 0 (0.0%) | 0.0 |
Fertility by Education by Marriage Status in Ardentown
| Educational Attainment | Married | Unmarried |
| Less than High School | 0 (0.0%) | 0 (0.0%) |
| High School Diploma | 0 (0.0%) | 0 (0.0%) |
| College or Associate's Degree | 0 (0.0%) | 0 (0.0%) |
| Bachelor's Degree | 0 (0.0%) | 0 (0.0%) |
| Graduate Degree | 0 (0.0%) | 0 (0.0%) |
| Total | 0 (0.0%) | 0 (0.0%) |
Employment Characteristics in Ardentown
Employment by Class of Employer in Ardentown
Among the 100 employed individuals in Ardentown, self-employed (not incorporated) (35 | 35.0%), private company employees (34 | 34.0%), and not-for-profit organizations (13 | 13.0%) make up the most common classes of employment.
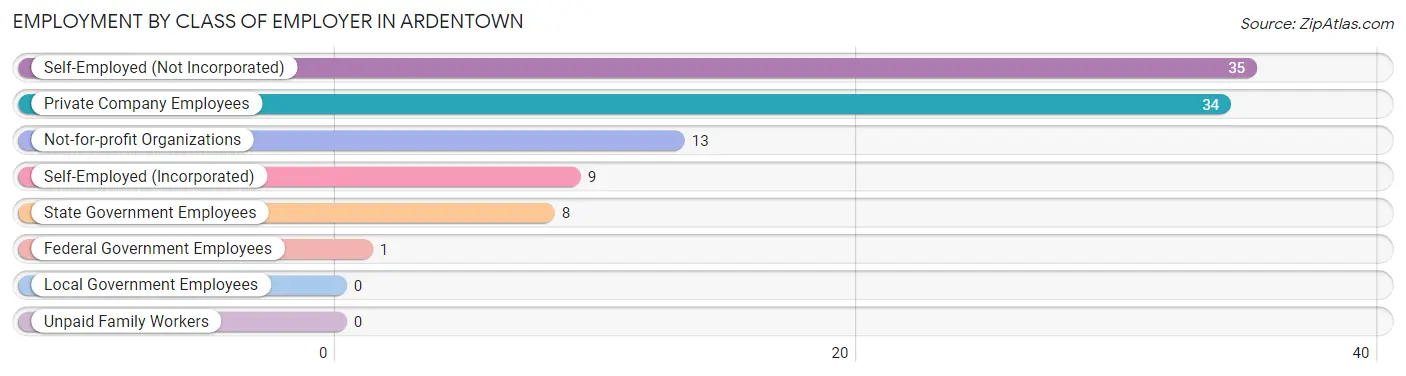
| Employer Class | # Employees | % Employees |
| Private Company Employees | 34 | 34.0% |
| Self-Employed (Incorporated) | 9 | 9.0% |
| Self-Employed (Not Incorporated) | 35 | 35.0% |
| Not-for-profit Organizations | 13 | 13.0% |
| Local Government Employees | 0 | 0.0% |
| State Government Employees | 8 | 8.0% |
| Federal Government Employees | 1 | 1.0% |
| Unpaid Family Workers | 0 | 0.0% |
| Total | 100 | 100.0% |
Employment Status by Age in Ardentown
According to the labor force statistics for Ardentown, out of the total population over 16 years of age (199), 52.8% or 105 individuals are in the labor force, with 4.8% or 5 of them unemployed. The age group with the highest labor force participation rate is 25 to 29 years, with 100.0% or 5 individuals in the labor force. Within the labor force, the 35 to 44 years age range has the highest percentage of unemployed individuals, with 33.3% or 5 of them being unemployed.
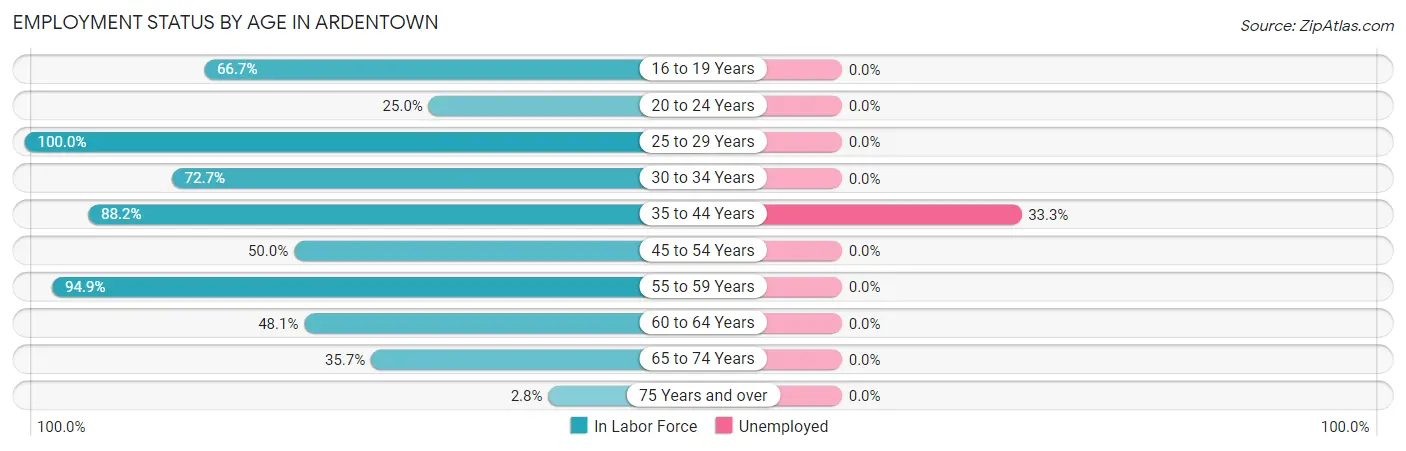
| Age Bracket | In Labor Force | Unemployed |
| 16 to 19 Years | 4 (66.7%) | 0 (0.0%) |
| 20 to 24 Years | 1 (25.0%) | 0 (0.0%) |
| 25 to 29 Years | 5 (100.0%) | 0 (0.0%) |
| 30 to 34 Years | 8 (72.7%) | 0 (0.0%) |
| 35 to 44 Years | 15 (88.2%) | 5 (33.3%) |
| 45 to 54 Years | 6 (50.0%) | 0 (0.0%) |
| 55 to 59 Years | 37 (94.9%) | 0 (0.0%) |
| 60 to 64 Years | 13 (48.1%) | 0 (0.0%) |
| 65 to 74 Years | 15 (35.7%) | 0 (0.0%) |
| 75 Years and over | 1 (2.8%) | 0 (0.0%) |
| Total | 105 (52.8%) | 5 (4.8%) |
Employment Status by Educational Attainment in Ardentown
According to labor force statistics for Ardentown, 75.7% of individuals (84) out of the total population between 25 and 64 years of age (111) are in the labor force, with 6.0% or 5 of them being unemployed. The group with the highest labor force participation rate are those with the educational attainment of less than high school, with 100.0% or 6 individuals in the labor force. Within the labor force, individuals with less than high school education have the highest percentage of unemployment, with 66.7% or 4 of them being unemployed.
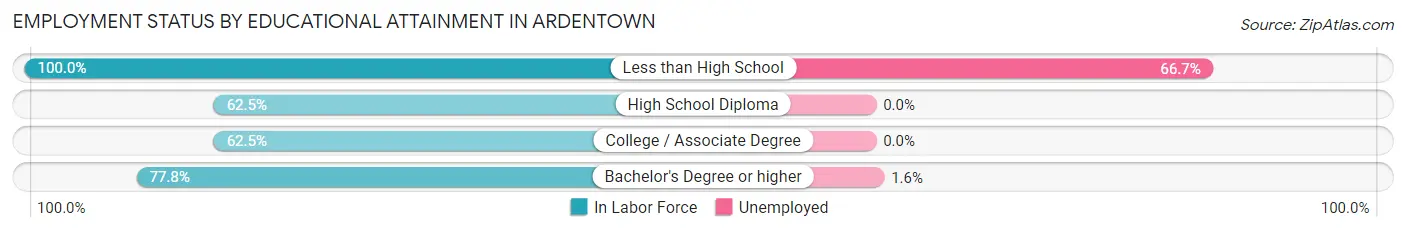
| Educational Attainment | In Labor Force | Unemployed |
| Less than High School | 6 (100.0%) | 4 (66.7%) |
| High School Diploma | 5 (62.5%) | 0 (0.0%) |
| College / Associate Degree | 10 (62.5%) | 0 (0.0%) |
| Bachelor's Degree or higher | 63 (77.8%) | 1 (1.6%) |
| Total | 84 (75.7%) | 7 (6.0%) |
Employment Occupations by Sex in Ardentown
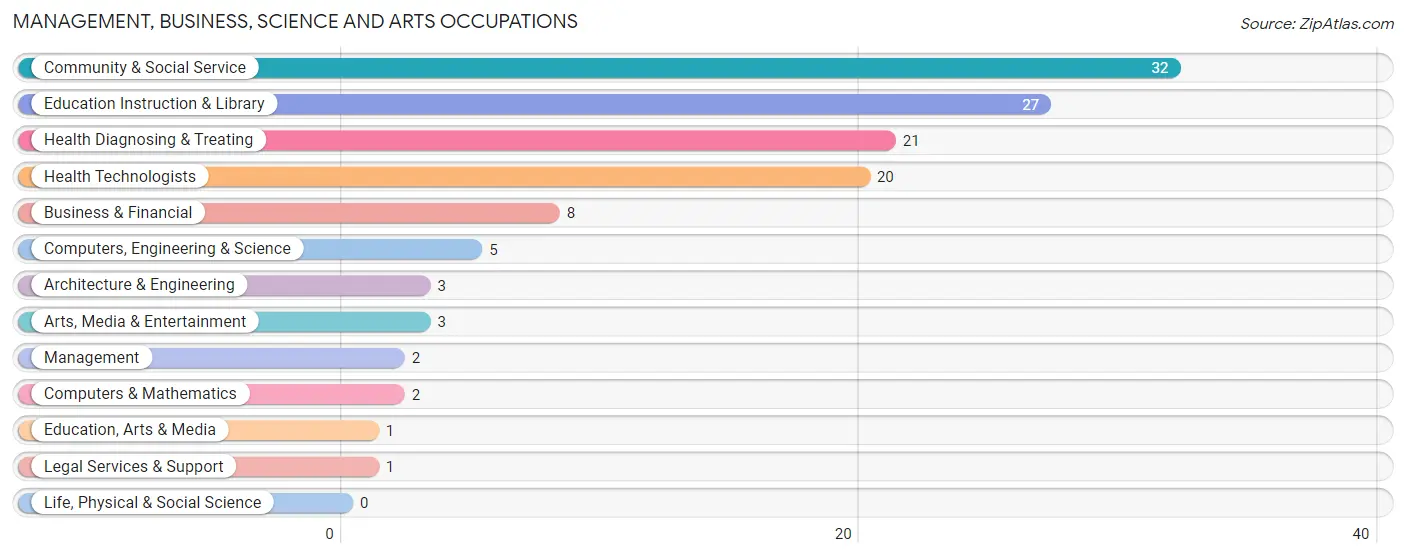
Management, Business, Science and Arts Occupations
The most common Management, Business, Science and Arts occupations in Ardentown are Community & Social Service (32 | 32.0%), Education Instruction & Library (27 | 27.0%), Health Diagnosing & Treating (21 | 21.0%), Health Technologists (20 | 20.0%), and Business & Financial (8 | 8.0%).
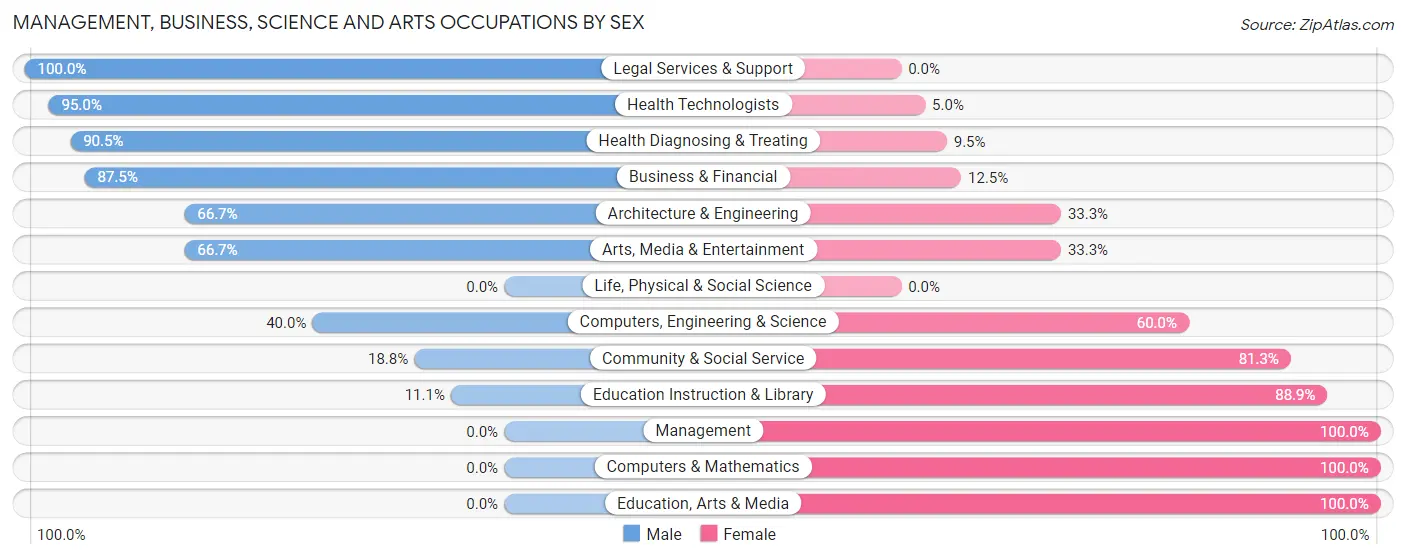
Management, Business, Science and Arts Occupations by Sex
Within the Management, Business, Science and Arts occupations in Ardentown, the most male-oriented occupations are Legal Services & Support (100.0%), Health Technologists (95.0%), and Health Diagnosing & Treating (90.5%), while the most female-oriented occupations are Management (100.0%), Computers & Mathematics (100.0%), and Education, Arts & Media (100.0%).
| Occupation | Male | Female |
| Management | 0 (0.0%) | 2 (100.0%) |
| Business & Financial | 7 (87.5%) | 1 (12.5%) |
| Computers, Engineering & Science | 2 (40.0%) | 3 (60.0%) |
| Computers & Mathematics | 0 (0.0%) | 2 (100.0%) |
| Architecture & Engineering | 2 (66.7%) | 1 (33.3%) |
| Life, Physical & Social Science | 0 (0.0%) | 0 (0.0%) |
| Community & Social Service | 6 (18.8%) | 26 (81.2%) |
| Education, Arts & Media | 0 (0.0%) | 1 (100.0%) |
| Legal Services & Support | 1 (100.0%) | 0 (0.0%) |
| Education Instruction & Library | 3 (11.1%) | 24 (88.9%) |
| Arts, Media & Entertainment | 2 (66.7%) | 1 (33.3%) |
| Health Diagnosing & Treating | 19 (90.5%) | 2 (9.5%) |
| Health Technologists | 19 (95.0%) | 1 (5.0%) |
| Total (Category) | 34 (50.0%) | 34 (50.0%) |
| Total (Overall) | 52 (52.0%) | 48 (48.0%) |
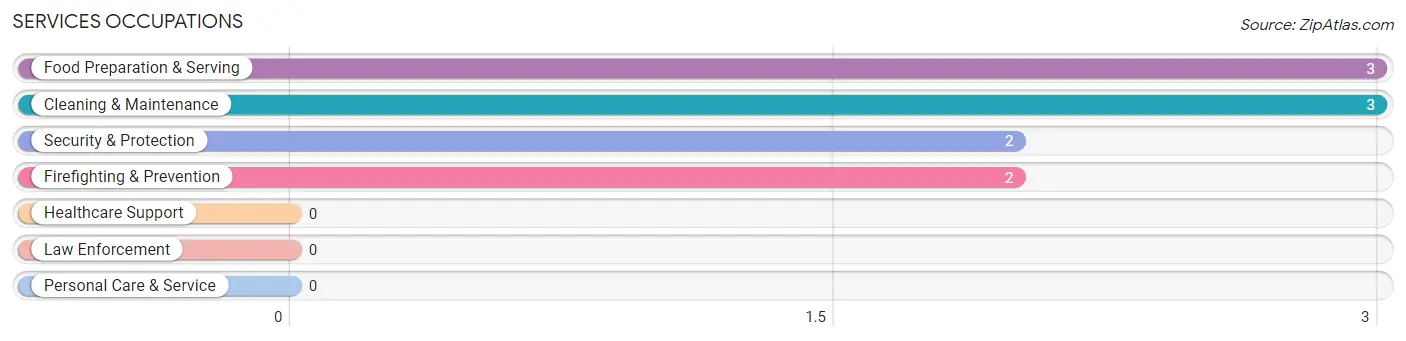
Services Occupations
The most common Services occupations in Ardentown are Food Preparation & Serving (3 | 3.0%), Cleaning & Maintenance (3 | 3.0%), Security & Protection (2 | 2.0%), and Firefighting & Prevention (2 | 2.0%).
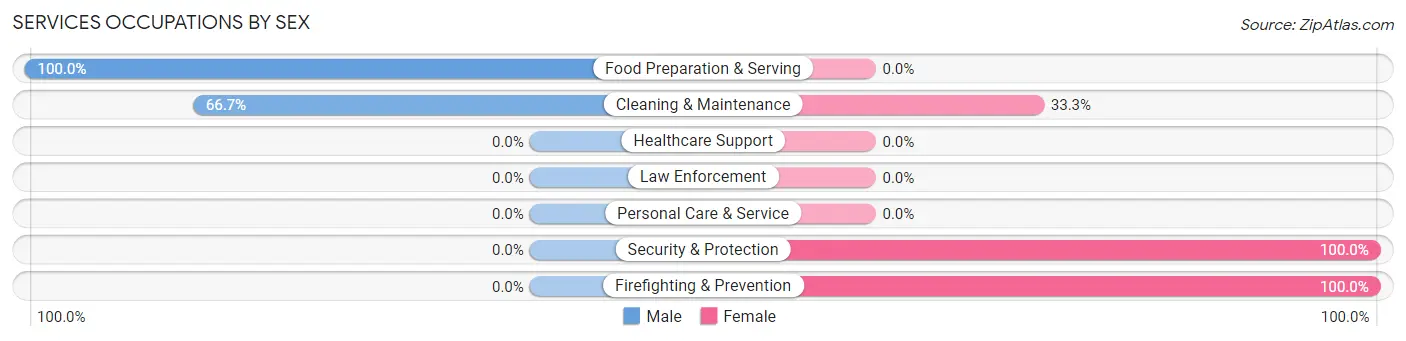
Services Occupations by Sex
Within the Services occupations in Ardentown, the most male-oriented occupations are Food Preparation & Serving (100.0%), and Cleaning & Maintenance (66.7%), while the most female-oriented occupations are Security & Protection (100.0%), Firefighting & Prevention (100.0%), and Cleaning & Maintenance (33.3%).
| Occupation | Male | Female |
| Healthcare Support | 0 (0.0%) | 0 (0.0%) |
| Security & Protection | 0 (0.0%) | 2 (100.0%) |
| Firefighting & Prevention | 0 (0.0%) | 2 (100.0%) |
| Law Enforcement | 0 (0.0%) | 0 (0.0%) |
| Food Preparation & Serving | 3 (100.0%) | 0 (0.0%) |
| Cleaning & Maintenance | 2 (66.7%) | 1 (33.3%) |
| Personal Care & Service | 0 (0.0%) | 0 (0.0%) |
| Total (Category) | 5 (62.5%) | 3 (37.5%) |
| Total (Overall) | 52 (52.0%) | 48 (48.0%) |
Sales and Office Occupations
The most common Sales and Office occupations in Ardentown are , and Office & Administration (11 | 11.0%).
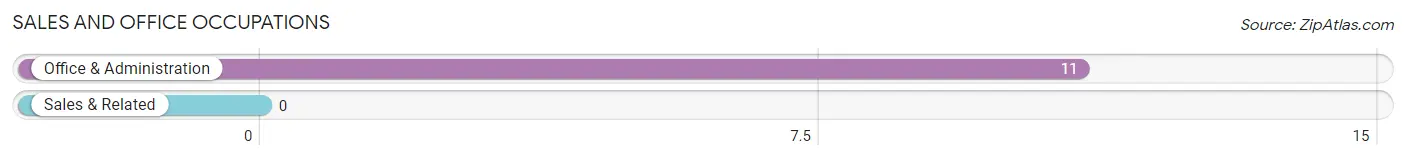
Sales and Office Occupations by Sex
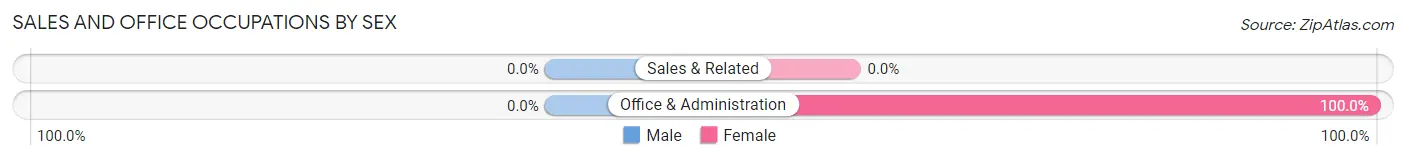
| Occupation | Male | Female |
| Sales & Related | 0 (0.0%) | 0 (0.0%) |
| Office & Administration | 0 (0.0%) | 11 (100.0%) |
| Total (Category) | 0 (0.0%) | 11 (100.0%) |
| Total (Overall) | 52 (52.0%) | 48 (48.0%) |
Natural Resources, Construction and Maintenance Occupations
The most common Natural Resources, Construction and Maintenance occupations in Ardentown are Installation, Maintenance & Repair (2 | 2.0%), and Construction & Extraction (1 | 1.0%).
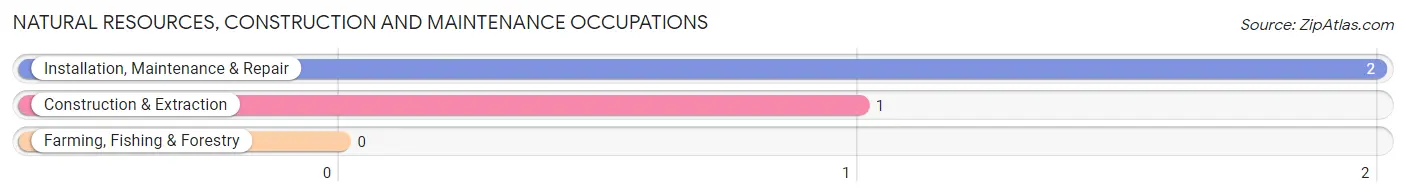
Natural Resources, Construction and Maintenance Occupations by Sex
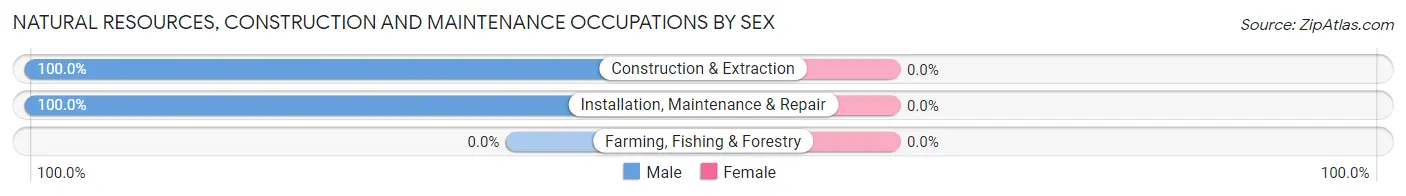
| Occupation | Male | Female |
| Farming, Fishing & Forestry | 0 (0.0%) | 0 (0.0%) |
| Construction & Extraction | 1 (100.0%) | 0 (0.0%) |
| Installation, Maintenance & Repair | 2 (100.0%) | 0 (0.0%) |
| Total (Category) | 3 (100.0%) | 0 (0.0%) |
| Total (Overall) | 52 (52.0%) | 48 (48.0%) |
Production, Transportation and Moving Occupations
The most common Production, Transportation and Moving occupations in Ardentown are Material Moving (5 | 5.0%), Production (4 | 4.0%), and Transportation (1 | 1.0%).
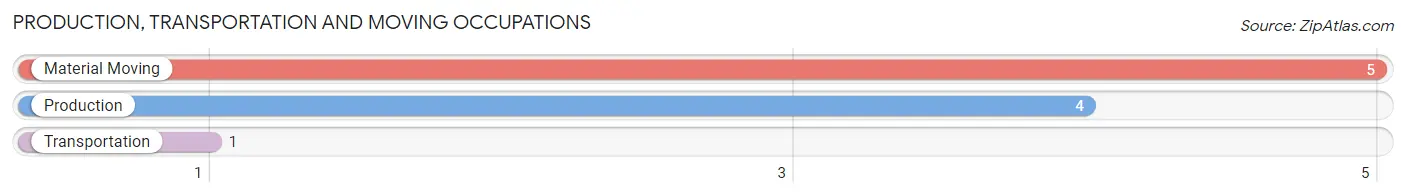
Production, Transportation and Moving Occupations by Sex
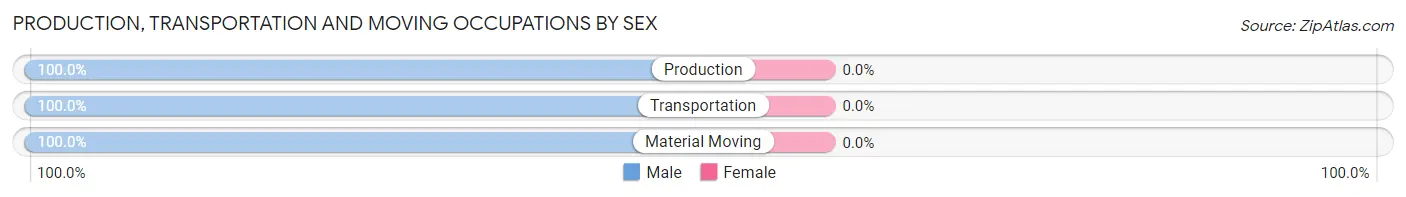
| Occupation | Male | Female |
| Production | 4 (100.0%) | 0 (0.0%) |
| Transportation | 1 (100.0%) | 0 (0.0%) |
| Material Moving | 5 (100.0%) | 0 (0.0%) |
| Total (Category) | 10 (100.0%) | 0 (0.0%) |
| Total (Overall) | 52 (52.0%) | 48 (48.0%) |
Employment Industries by Sex in Ardentown
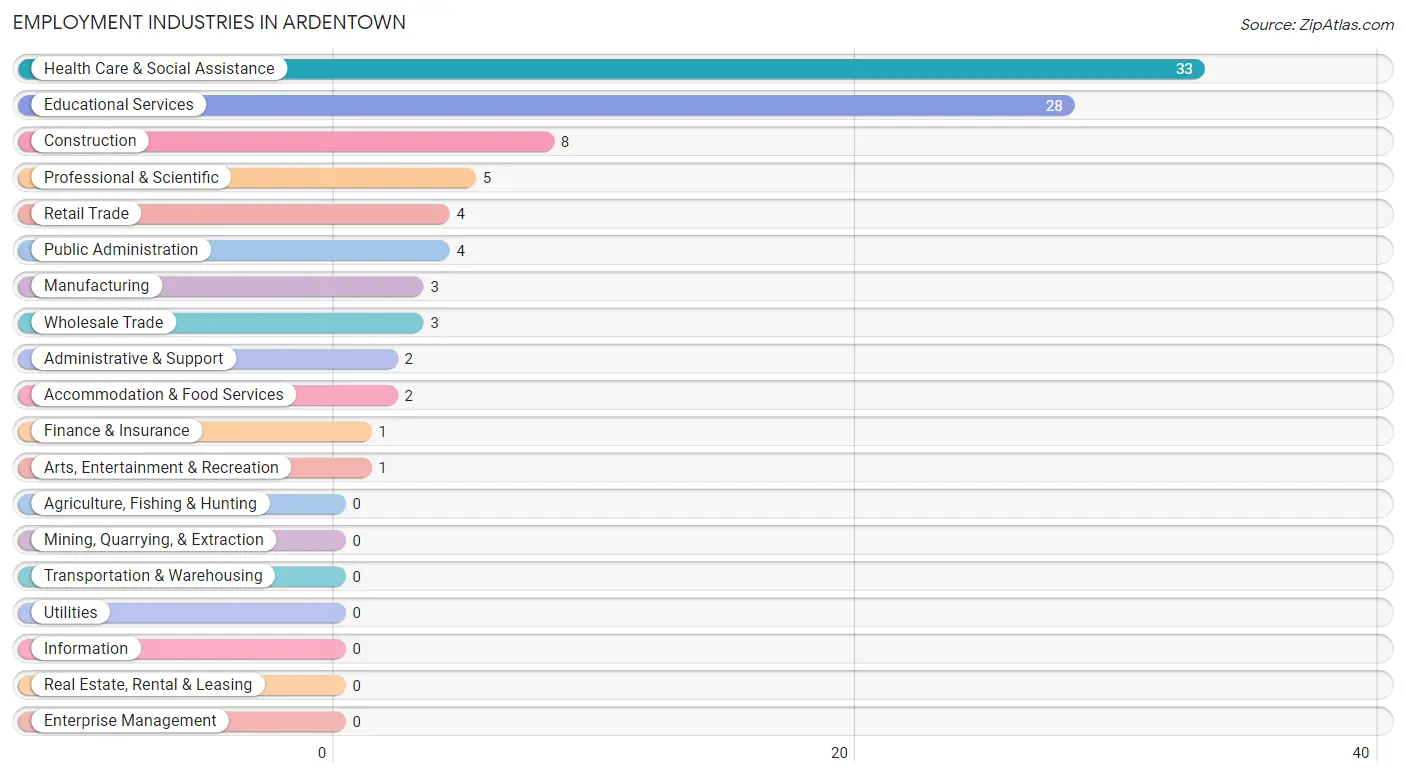
Employment Industries in Ardentown
The major employment industries in Ardentown include Health Care & Social Assistance (33 | 33.0%), Educational Services (28 | 28.0%), Construction (8 | 8.0%), Professional & Scientific (5 | 5.0%), and Retail Trade (4 | 4.0%).
Employment Industries by Sex in Ardentown
The Ardentown industries that see more men than women are Wholesale Trade (100.0%), Accommodation & Food Services (100.0%), and Professional & Scientific (80.0%), whereas the industries that tend to have a higher number of women are Finance & Insurance (100.0%), Arts, Entertainment & Recreation (100.0%), and Educational Services (82.1%).
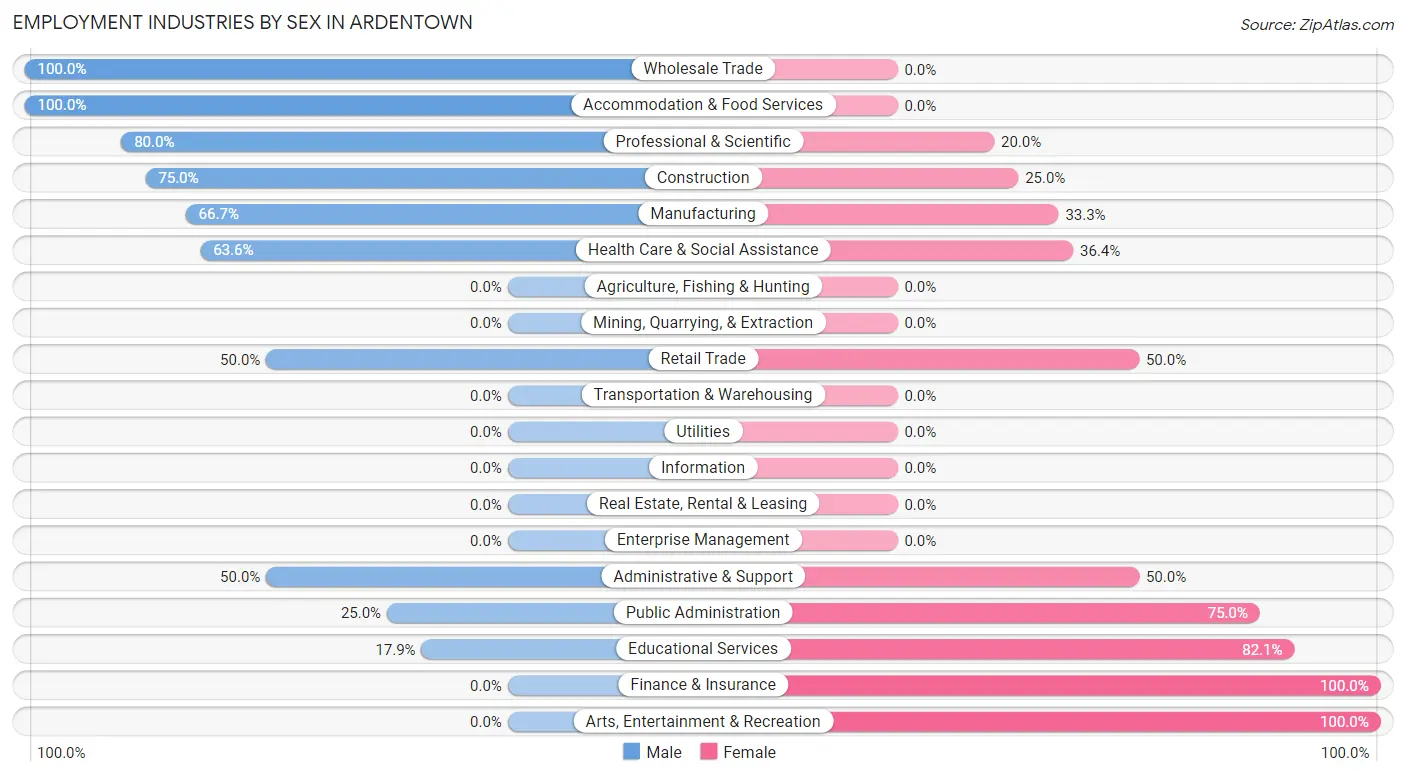
| Industry | Male | Female |
| Agriculture, Fishing & Hunting | 0 (0.0%) | 0 (0.0%) |
| Mining, Quarrying, & Extraction | 0 (0.0%) | 0 (0.0%) |
| Construction | 6 (75.0%) | 2 (25.0%) |
| Manufacturing | 2 (66.7%) | 1 (33.3%) |
| Wholesale Trade | 3 (100.0%) | 0 (0.0%) |
| Retail Trade | 2 (50.0%) | 2 (50.0%) |
| Transportation & Warehousing | 0 (0.0%) | 0 (0.0%) |
| Utilities | 0 (0.0%) | 0 (0.0%) |
| Information | 0 (0.0%) | 0 (0.0%) |
| Finance & Insurance | 0 (0.0%) | 1 (100.0%) |
| Real Estate, Rental & Leasing | 0 (0.0%) | 0 (0.0%) |
| Professional & Scientific | 4 (80.0%) | 1 (20.0%) |
| Enterprise Management | 0 (0.0%) | 0 (0.0%) |
| Administrative & Support | 1 (50.0%) | 1 (50.0%) |
| Educational Services | 5 (17.9%) | 23 (82.1%) |
| Health Care & Social Assistance | 21 (63.6%) | 12 (36.4%) |
| Arts, Entertainment & Recreation | 0 (0.0%) | 1 (100.0%) |
| Accommodation & Food Services | 2 (100.0%) | 0 (0.0%) |
| Public Administration | 1 (25.0%) | 3 (75.0%) |
| Total | 52 (52.0%) | 48 (48.0%) |
Education in Ardentown
School Enrollment in Ardentown
The most common levels of schooling among the 33 students in Ardentown are middle school (16 | 48.5%), college / undergraduate (7 | 21.2%), and elementary school (6 | 18.2%).
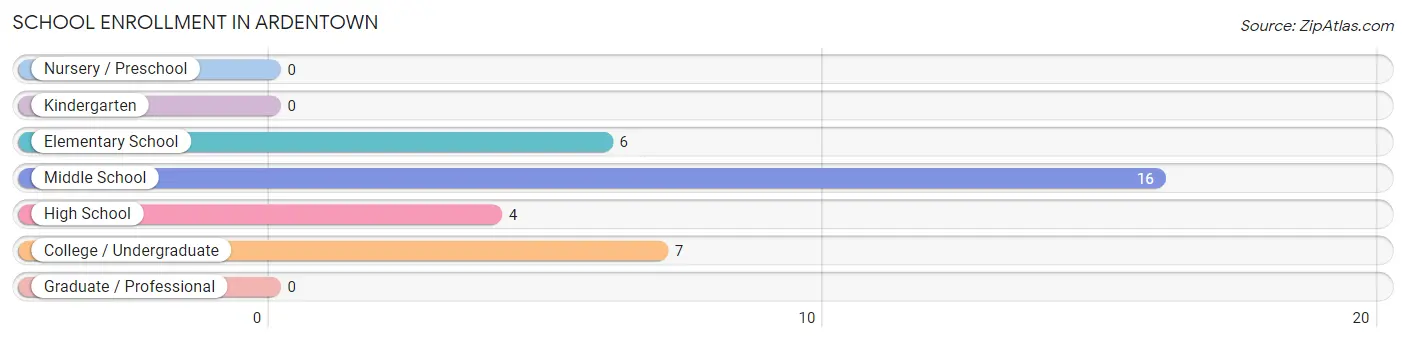
| School Level | # Students | % Students |
| Nursery / Preschool | 0 | 0.0% |
| Kindergarten | 0 | 0.0% |
| Elementary School | 6 | 18.2% |
| Middle School | 16 | 48.5% |
| High School | 4 | 12.1% |
| College / Undergraduate | 7 | 21.2% |
| Graduate / Professional | 0 | 0.0% |
| Total | 33 | 100.0% |
School Enrollment by Age by Funding Source in Ardentown
Out of a total of 33 students who are enrolled in schools in Ardentown, 11 (33.3%) attend a private institution, while the remaining 22 (66.7%) are enrolled in public schools. The age group of 35 years and over has the highest likelihood of being enrolled in private schools, with 1 (100.0% in the age bracket) enrolled. Conversely, the age group of 5 to 9 year old has the lowest likelihood of being enrolled in a private school, with 6 (100.0% in the age bracket) attending a public institution.
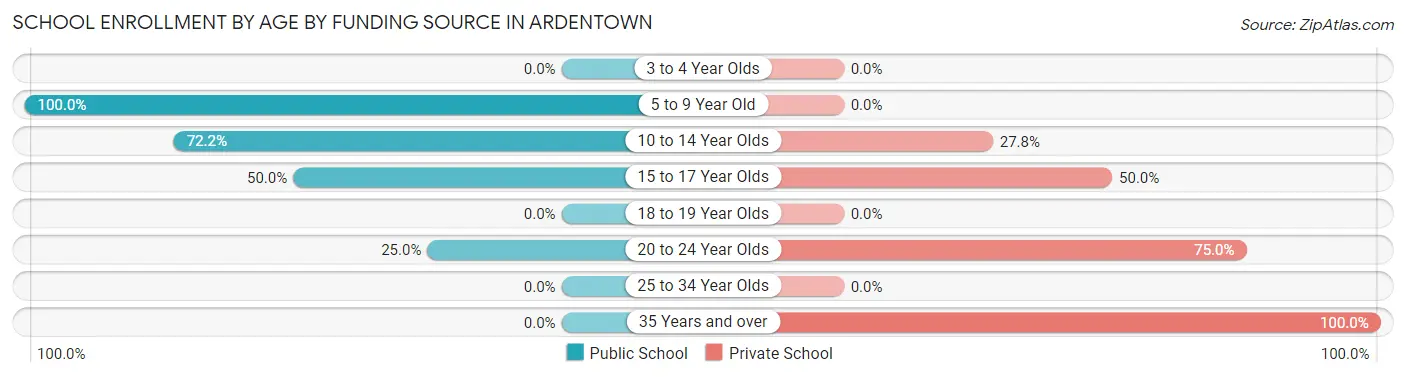
| Age Bracket | Public School | Private School |
| 3 to 4 Year Olds | 0 (0.0%) | 0 (0.0%) |
| 5 to 9 Year Old | 6 (100.0%) | 0 (0.0%) |
| 10 to 14 Year Olds | 13 (72.2%) | 5 (27.8%) |
| 15 to 17 Year Olds | 2 (50.0%) | 2 (50.0%) |
| 18 to 19 Year Olds | 0 (0.0%) | 0 (0.0%) |
| 20 to 24 Year Olds | 1 (25.0%) | 3 (75.0%) |
| 25 to 34 Year Olds | 0 (0.0%) | 0 (0.0%) |
| 35 Years and over | 0 (0.0%) | 1 (100.0%) |
| Total | 22 (66.7%) | 11 (33.3%) |
Educational Attainment by Field of Study in Ardentown
Social sciences (30 | 19.9%), psychology (25 | 16.6%), visual & performing arts (15 | 9.9%), liberal arts & history (14 | 9.3%), and education (12 | 8.0%) are the most common fields of study among 151 individuals in Ardentown who have obtained a bachelor's degree or higher.
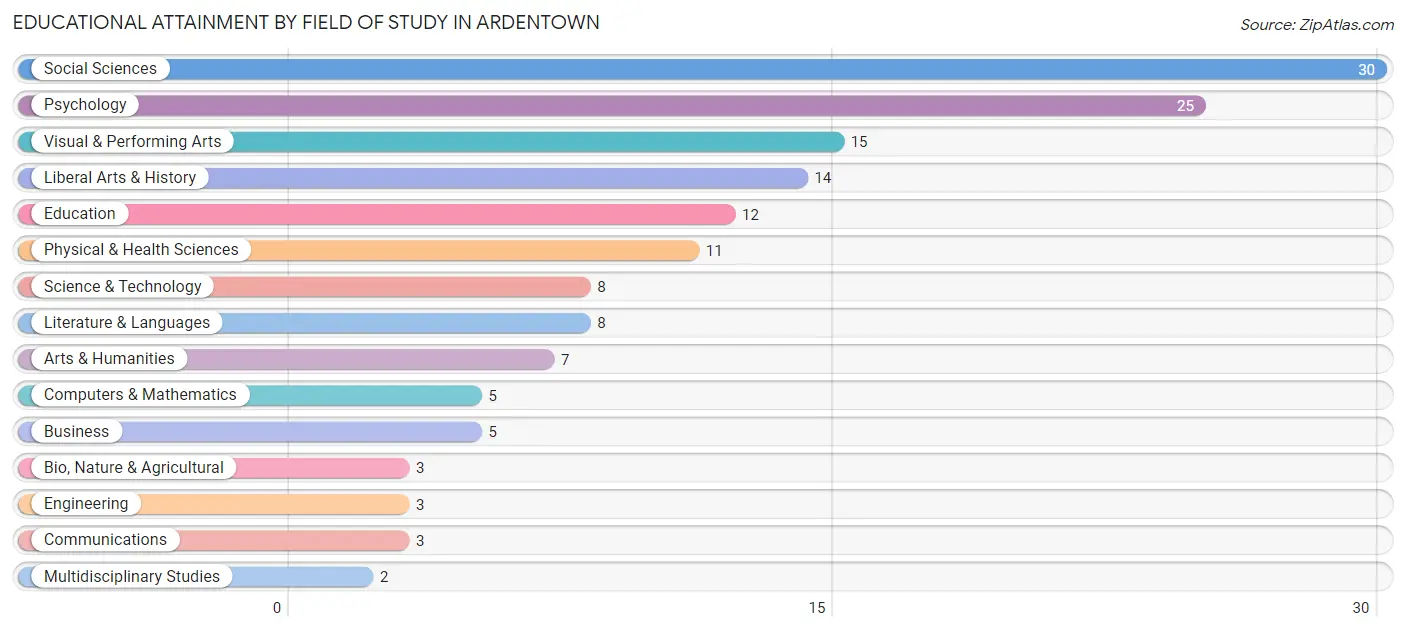
| Field of Study | # Graduates | % Graduates |
| Computers & Mathematics | 5 | 3.3% |
| Bio, Nature & Agricultural | 3 | 2.0% |
| Physical & Health Sciences | 11 | 7.3% |
| Psychology | 25 | 16.6% |
| Social Sciences | 30 | 19.9% |
| Engineering | 3 | 2.0% |
| Multidisciplinary Studies | 2 | 1.3% |
| Science & Technology | 8 | 5.3% |
| Business | 5 | 3.3% |
| Education | 12 | 8.0% |
| Literature & Languages | 8 | 5.3% |
| Liberal Arts & History | 14 | 9.3% |
| Visual & Performing Arts | 15 | 9.9% |
| Communications | 3 | 2.0% |
| Arts & Humanities | 7 | 4.6% |
| Total | 151 | 100.0% |
Transportation & Commute in Ardentown
Vehicle Availability by Sex in Ardentown
The most prevalent vehicle ownership categories in Ardentown are males with 2 vehicles (34, accounting for 65.4%) and females with 2 vehicles (34, making up 70.8%).
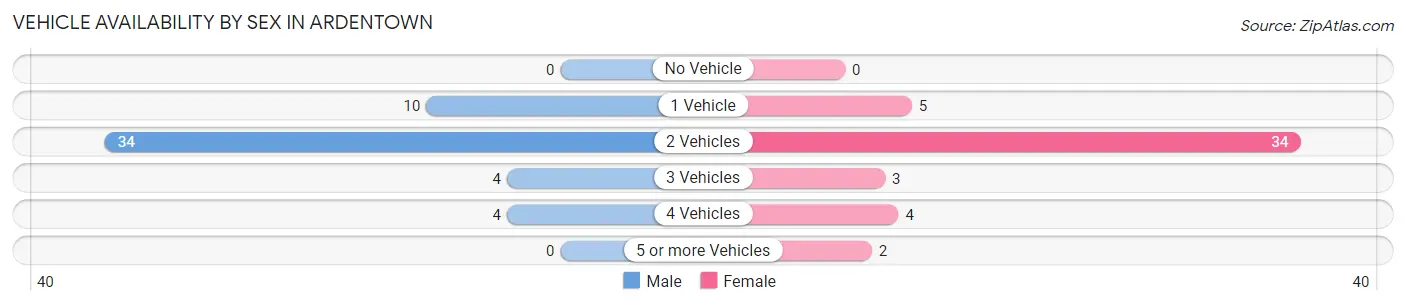
| Vehicles Available | Male | Female |
| No Vehicle | 0 (0.0%) | 0 (0.0%) |
| 1 Vehicle | 10 (19.2%) | 5 (10.4%) |
| 2 Vehicles | 34 (65.4%) | 34 (70.8%) |
| 3 Vehicles | 4 (7.7%) | 3 (6.2%) |
| 4 Vehicles | 4 (7.7%) | 4 (8.3%) |
| 5 or more Vehicles | 0 (0.0%) | 2 (4.2%) |
| Total | 52 (100.0%) | 48 (100.0%) |
Commute Time in Ardentown
The most frequently occuring commute durations in Ardentown are 15 to 19 minutes (14 commuters, 24.1%), 30 to 34 minutes (8 commuters, 13.8%), and 10 to 14 minutes (7 commuters, 12.1%).
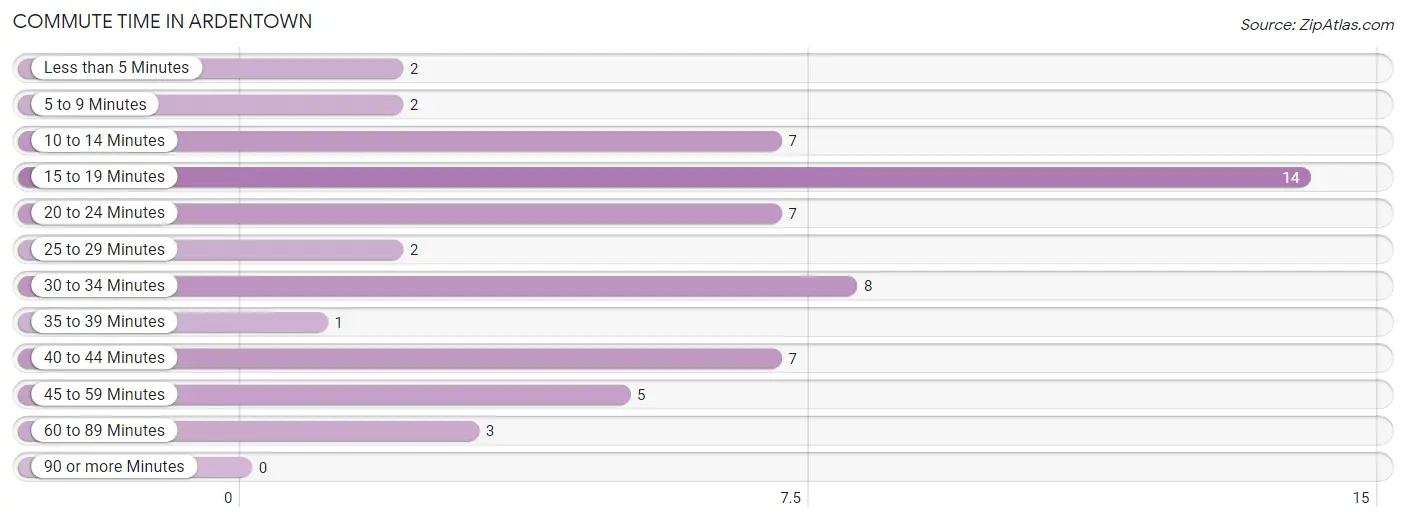
| Commute Time | # Commuters | % Commuters |
| Less than 5 Minutes | 2 | 3.5% |
| 5 to 9 Minutes | 2 | 3.5% |
| 10 to 14 Minutes | 7 | 12.1% |
| 15 to 19 Minutes | 14 | 24.1% |
| 20 to 24 Minutes | 7 | 12.1% |
| 25 to 29 Minutes | 2 | 3.5% |
| 30 to 34 Minutes | 8 | 13.8% |
| 35 to 39 Minutes | 1 | 1.7% |
| 40 to 44 Minutes | 7 | 12.1% |
| 45 to 59 Minutes | 5 | 8.6% |
| 60 to 89 Minutes | 3 | 5.2% |
| 90 or more Minutes | 0 | 0.0% |
Commute Time by Sex in Ardentown
The most common commute times in Ardentown are 40 to 44 minutes (6 commuters, 20.7%) for males and 15 to 19 minutes (9 commuters, 31.0%) for females.
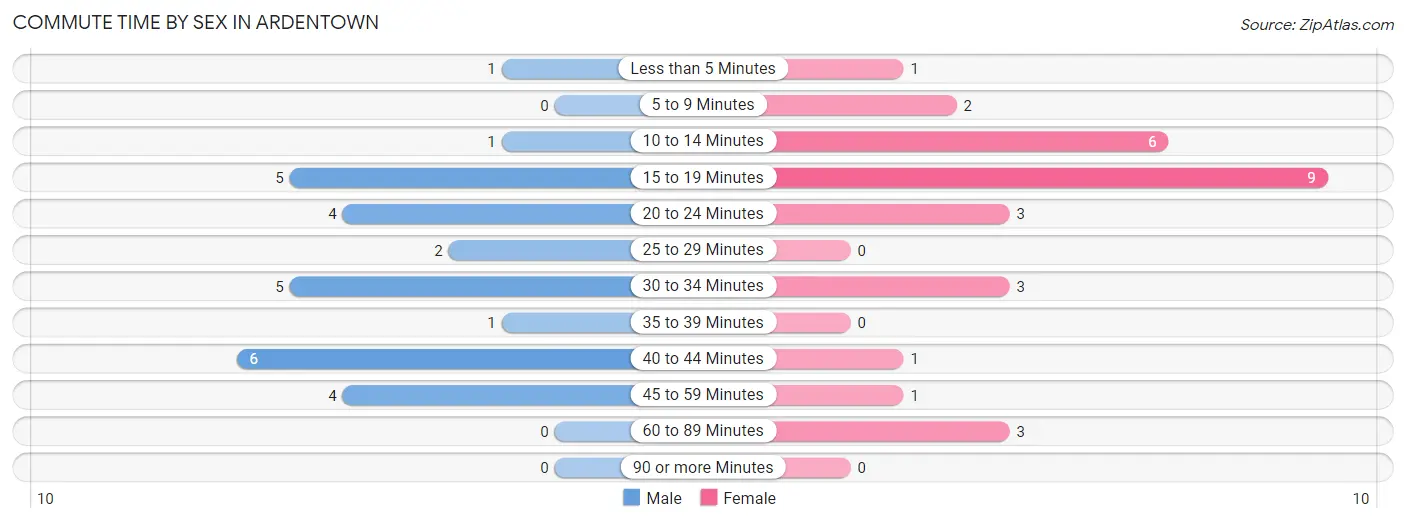
| Commute Time | Male | Female |
| Less than 5 Minutes | 1 (3.5%) | 1 (3.5%) |
| 5 to 9 Minutes | 0 (0.0%) | 2 (6.9%) |
| 10 to 14 Minutes | 1 (3.5%) | 6 (20.7%) |
| 15 to 19 Minutes | 5 (17.2%) | 9 (31.0%) |
| 20 to 24 Minutes | 4 (13.8%) | 3 (10.3%) |
| 25 to 29 Minutes | 2 (6.9%) | 0 (0.0%) |
| 30 to 34 Minutes | 5 (17.2%) | 3 (10.3%) |
| 35 to 39 Minutes | 1 (3.5%) | 0 (0.0%) |
| 40 to 44 Minutes | 6 (20.7%) | 1 (3.5%) |
| 45 to 59 Minutes | 4 (13.8%) | 1 (3.5%) |
| 60 to 89 Minutes | 0 (0.0%) | 3 (10.3%) |
| 90 or more Minutes | 0 (0.0%) | 0 (0.0%) |
Time of Departure to Work by Sex in Ardentown
The most frequent times of departure to work in Ardentown are 7:00 AM to 7:29 AM (7, 24.1%) for males and 7:30 AM to 7:59 AM (7, 24.1%) for females.
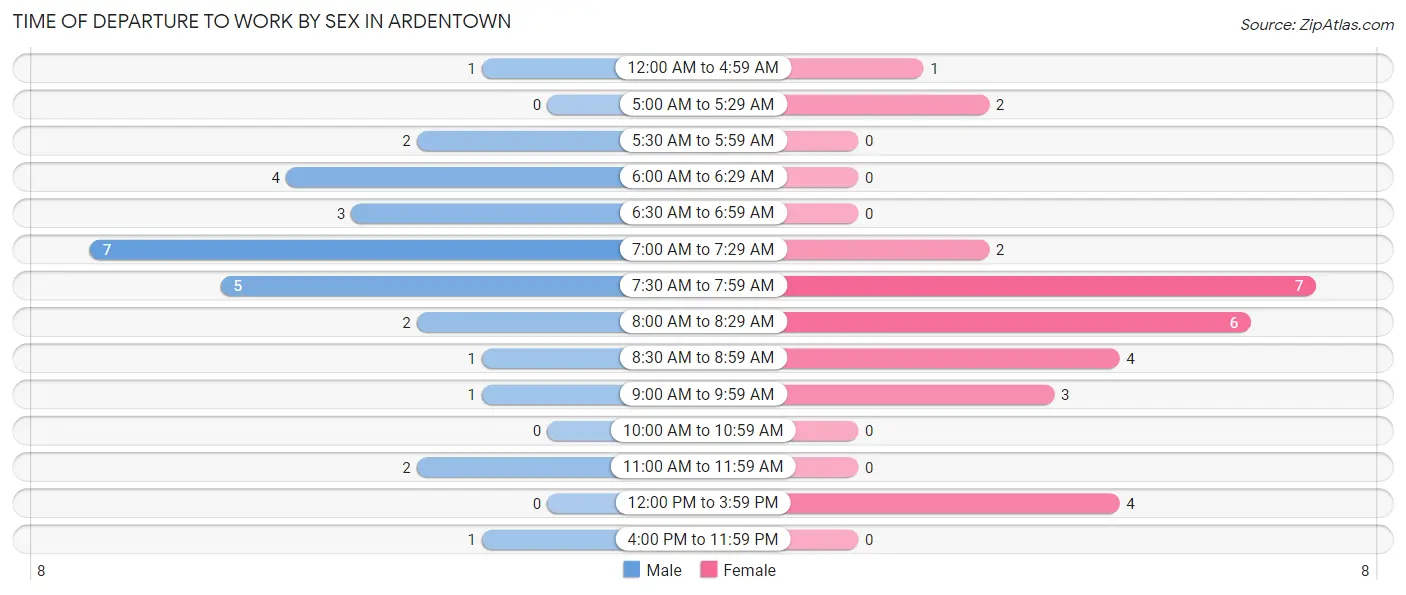
| Time of Departure | Male | Female |
| 12:00 AM to 4:59 AM | 1 (3.5%) | 1 (3.5%) |
| 5:00 AM to 5:29 AM | 0 (0.0%) | 2 (6.9%) |
| 5:30 AM to 5:59 AM | 2 (6.9%) | 0 (0.0%) |
| 6:00 AM to 6:29 AM | 4 (13.8%) | 0 (0.0%) |
| 6:30 AM to 6:59 AM | 3 (10.3%) | 0 (0.0%) |
| 7:00 AM to 7:29 AM | 7 (24.1%) | 2 (6.9%) |
| 7:30 AM to 7:59 AM | 5 (17.2%) | 7 (24.1%) |
| 8:00 AM to 8:29 AM | 2 (6.9%) | 6 (20.7%) |
| 8:30 AM to 8:59 AM | 1 (3.5%) | 4 (13.8%) |
| 9:00 AM to 9:59 AM | 1 (3.5%) | 3 (10.3%) |
| 10:00 AM to 10:59 AM | 0 (0.0%) | 0 (0.0%) |
| 11:00 AM to 11:59 AM | 2 (6.9%) | 0 (0.0%) |
| 12:00 PM to 3:59 PM | 0 (0.0%) | 4 (13.8%) |
| 4:00 PM to 11:59 PM | 1 (3.5%) | 0 (0.0%) |
| Total | 29 (100.0%) | 29 (100.0%) |
Housing Occupancy in Ardentown
Occupancy by Ownership in Ardentown
Of the total 113 dwellings in Ardentown, owner-occupied units account for 90 (79.6%), while renter-occupied units make up 23 (20.3%).
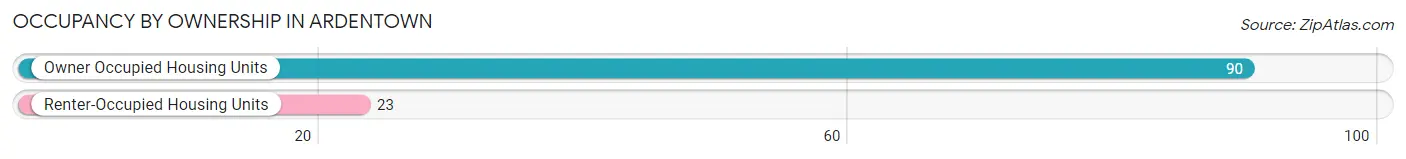
| Occupancy | # Housing Units | % Housing Units |
| Owner Occupied Housing Units | 90 | 79.6% |
| Renter-Occupied Housing Units | 23 | 20.3% |
| Total Occupied Housing Units | 113 | 100.0% |
Occupancy by Household Size in Ardentown
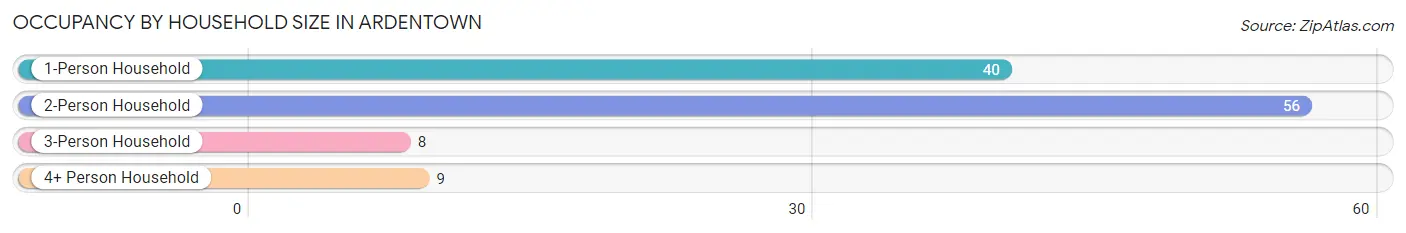
| Household Size | # Housing Units | % Housing Units |
| 1-Person Household | 40 | 35.4% |
| 2-Person Household | 56 | 49.6% |
| 3-Person Household | 8 | 7.1% |
| 4+ Person Household | 9 | 8.0% |
| Total Housing Units | 113 | 100.0% |
Occupancy by Ownership by Household Size in Ardentown
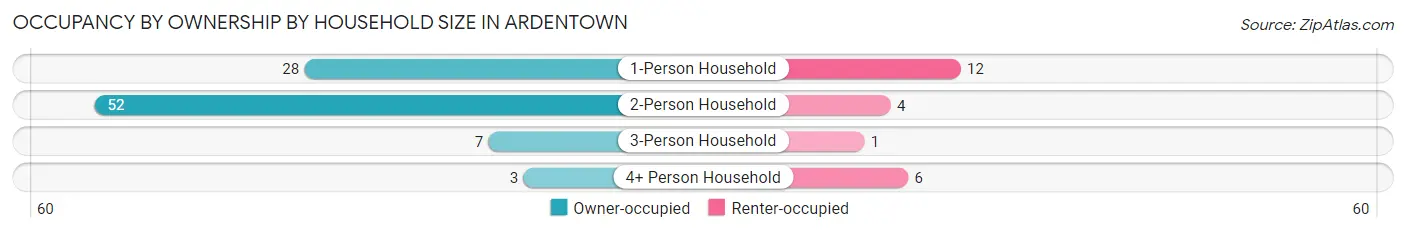
| Household Size | Owner-occupied | Renter-occupied |
| 1-Person Household | 28 (70.0%) | 12 (30.0%) |
| 2-Person Household | 52 (92.9%) | 4 (7.1%) |
| 3-Person Household | 7 (87.5%) | 1 (12.5%) |
| 4+ Person Household | 3 (33.3%) | 6 (66.7%) |
| Total Housing Units | 90 (79.6%) | 23 (20.3%) |
Occupancy by Educational Attainment in Ardentown
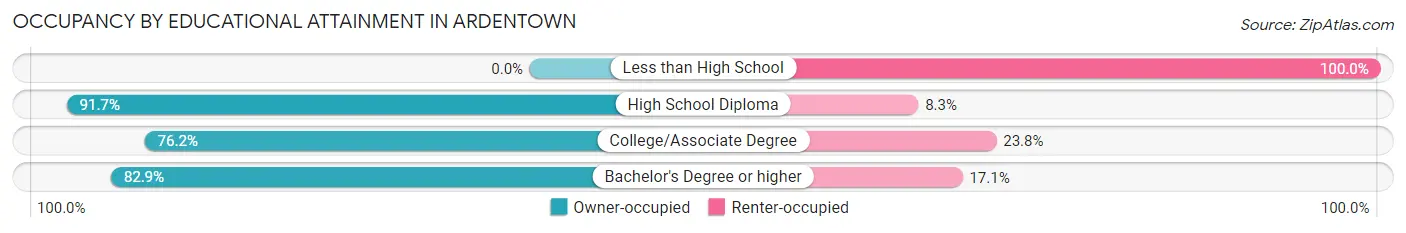
| Household Size | Owner-occupied | Renter-occupied |
| Less than High School | 0 (0.0%) | 4 (100.0%) |
| High School Diploma | 11 (91.7%) | 1 (8.3%) |
| College/Associate Degree | 16 (76.2%) | 5 (23.8%) |
| Bachelor's Degree or higher | 63 (82.9%) | 13 (17.1%) |
Occupancy by Age of Householder in Ardentown
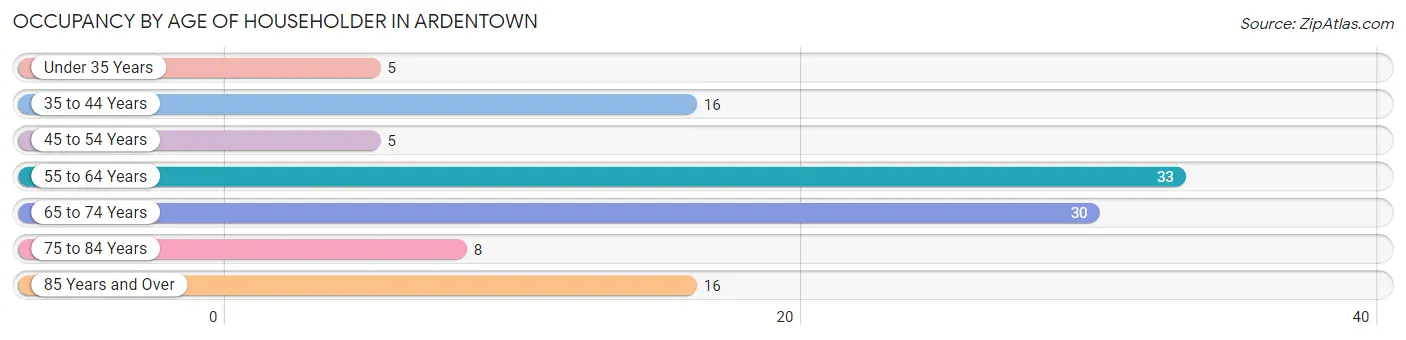
| Age Bracket | # Households | % Households |
| Under 35 Years | 5 | 4.4% |
| 35 to 44 Years | 16 | 14.2% |
| 45 to 54 Years | 5 | 4.4% |
| 55 to 64 Years | 33 | 29.2% |
| 65 to 74 Years | 30 | 26.6% |
| 75 to 84 Years | 8 | 7.1% |
| 85 Years and Over | 16 | 14.2% |
| Total | 113 | 100.0% |
Housing Finances in Ardentown
Median Income by Occupancy in Ardentown
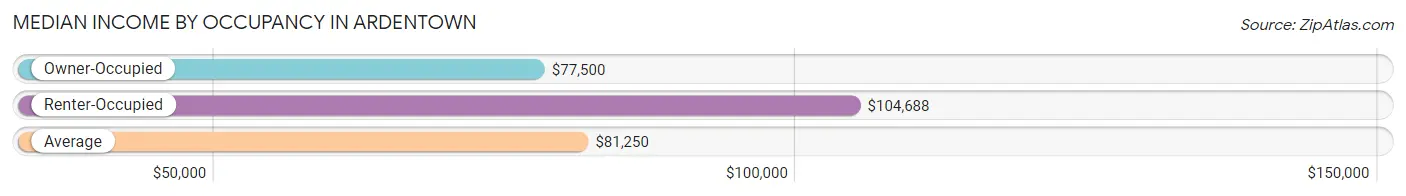
| Occupancy Type | # Households | Median Income |
| Owner-Occupied | 90 (79.6%) | $77,500 |
| Renter-Occupied | 23 (20.3%) | $104,688 |
| Average | 113 (100.0%) | $81,250 |
Occupancy by Householder Income Bracket in Ardentown
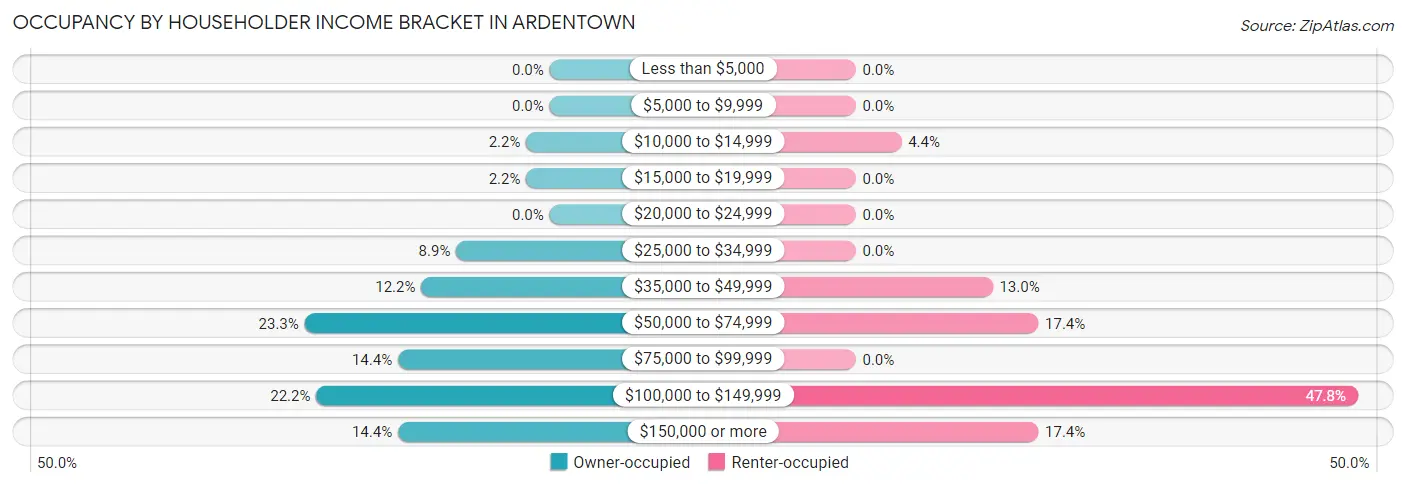
| Income Bracket | Owner-occupied | Renter-occupied |
| Less than $5,000 | 0 (0.0%) | 0 (0.0%) |
| $5,000 to $9,999 | 0 (0.0%) | 0 (0.0%) |
| $10,000 to $14,999 | 2 (2.2%) | 1 (4.3%) |
| $15,000 to $19,999 | 2 (2.2%) | 0 (0.0%) |
| $20,000 to $24,999 | 0 (0.0%) | 0 (0.0%) |
| $25,000 to $34,999 | 8 (8.9%) | 0 (0.0%) |
| $35,000 to $49,999 | 11 (12.2%) | 3 (13.0%) |
| $50,000 to $74,999 | 21 (23.3%) | 4 (17.4%) |
| $75,000 to $99,999 | 13 (14.4%) | 0 (0.0%) |
| $100,000 to $149,999 | 20 (22.2%) | 11 (47.8%) |
| $150,000 or more | 13 (14.4%) | 4 (17.4%) |
| Total | 90 (100.0%) | 23 (100.0%) |
Monthly Housing Cost Tiers in Ardentown
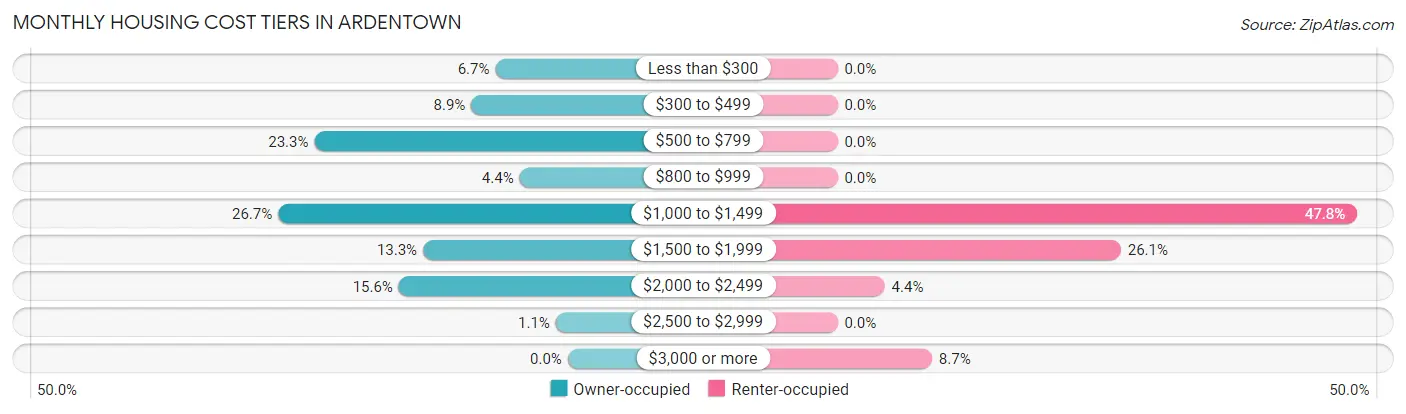
| Monthly Cost | Owner-occupied | Renter-occupied |
| Less than $300 | 6 (6.7%) | 0 (0.0%) |
| $300 to $499 | 8 (8.9%) | 0 (0.0%) |
| $500 to $799 | 21 (23.3%) | 0 (0.0%) |
| $800 to $999 | 4 (4.4%) | 0 (0.0%) |
| $1,000 to $1,499 | 24 (26.7%) | 11 (47.8%) |
| $1,500 to $1,999 | 12 (13.3%) | 6 (26.1%) |
| $2,000 to $2,499 | 14 (15.6%) | 1 (4.3%) |
| $2,500 to $2,999 | 1 (1.1%) | 0 (0.0%) |
| $3,000 or more | 0 (0.0%) | 2 (8.7%) |
| Total | 90 (100.0%) | 23 (100.0%) |
Physical Housing Characteristics in Ardentown
Housing Structures in Ardentown
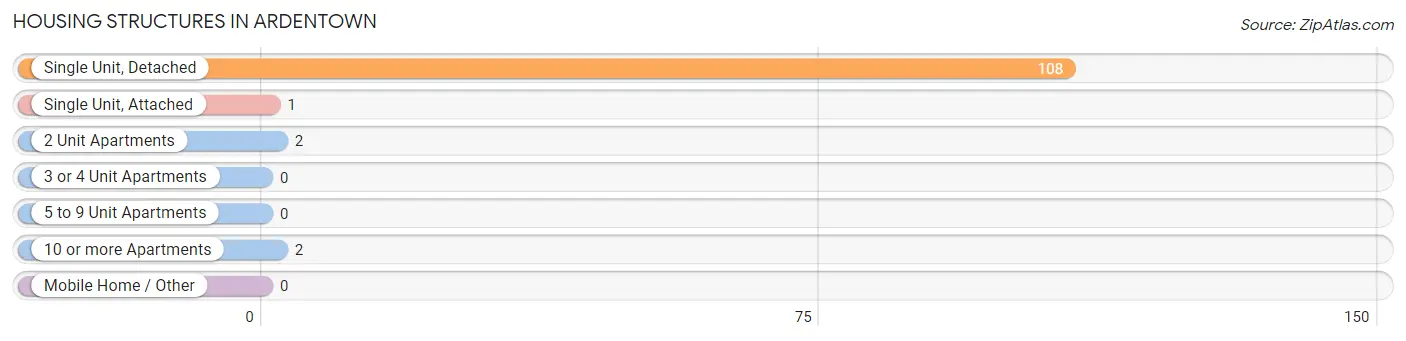
| Structure Type | # Housing Units | % Housing Units |
| Single Unit, Detached | 108 | 95.6% |
| Single Unit, Attached | 1 | 0.9% |
| 2 Unit Apartments | 2 | 1.8% |
| 3 or 4 Unit Apartments | 0 | 0.0% |
| 5 to 9 Unit Apartments | 0 | 0.0% |
| 10 or more Apartments | 2 | 1.8% |
| Mobile Home / Other | 0 | 0.0% |
| Total | 113 | 100.0% |
Housing Structures by Occupancy in Ardentown
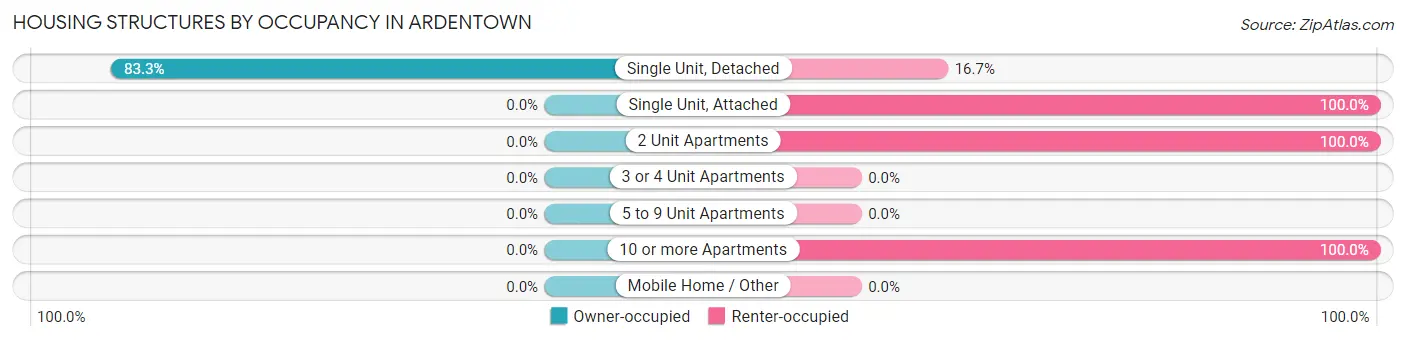
| Structure Type | Owner-occupied | Renter-occupied |
| Single Unit, Detached | 90 (83.3%) | 18 (16.7%) |
| Single Unit, Attached | 0 (0.0%) | 1 (100.0%) |
| 2 Unit Apartments | 0 (0.0%) | 2 (100.0%) |
| 3 or 4 Unit Apartments | 0 (0.0%) | 0 (0.0%) |
| 5 to 9 Unit Apartments | 0 (0.0%) | 0 (0.0%) |
| 10 or more Apartments | 0 (0.0%) | 2 (100.0%) |
| Mobile Home / Other | 0 (0.0%) | 0 (0.0%) |
| Total | 90 (79.6%) | 23 (20.3%) |
Housing Structures by Number of Rooms in Ardentown
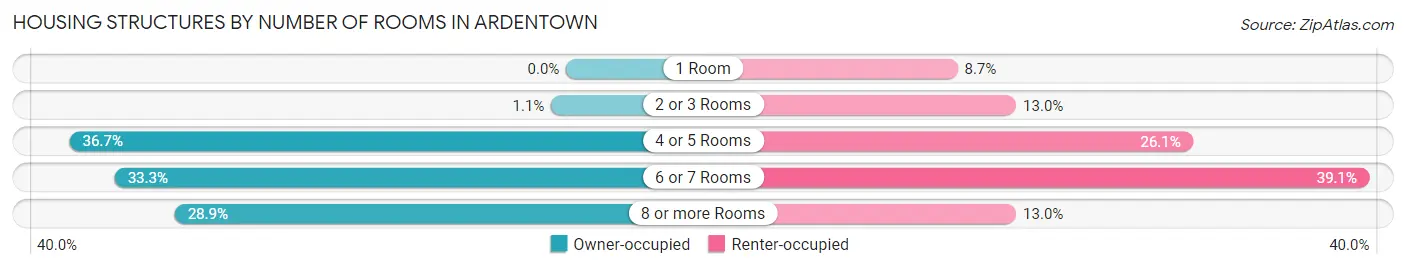
| Number of Rooms | Owner-occupied | Renter-occupied |
| 1 Room | 0 (0.0%) | 2 (8.7%) |
| 2 or 3 Rooms | 1 (1.1%) | 3 (13.0%) |
| 4 or 5 Rooms | 33 (36.7%) | 6 (26.1%) |
| 6 or 7 Rooms | 30 (33.3%) | 9 (39.1%) |
| 8 or more Rooms | 26 (28.9%) | 3 (13.0%) |
| Total | 90 (100.0%) | 23 (100.0%) |
Housing Structure by Heating Type in Ardentown
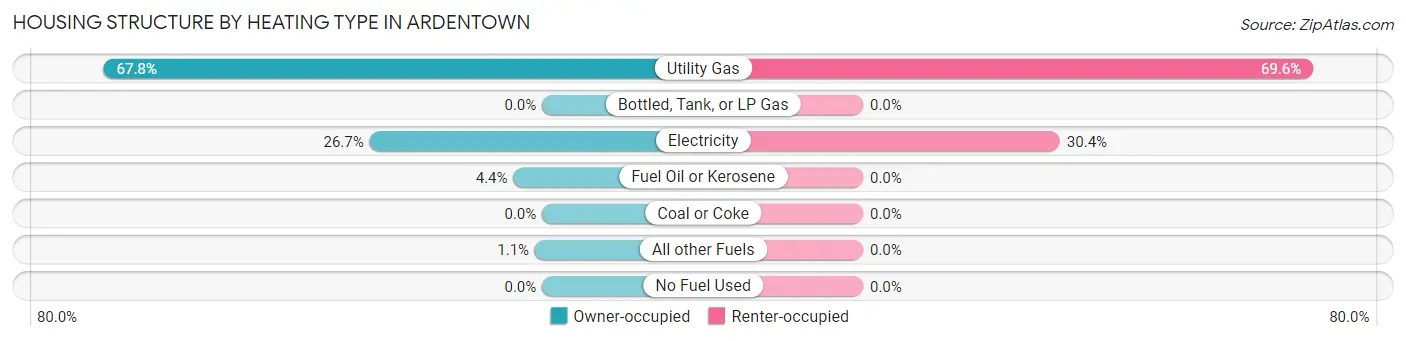
| Heating Type | Owner-occupied | Renter-occupied |
| Utility Gas | 61 (67.8%) | 16 (69.6%) |
| Bottled, Tank, or LP Gas | 0 (0.0%) | 0 (0.0%) |
| Electricity | 24 (26.7%) | 7 (30.4%) |
| Fuel Oil or Kerosene | 4 (4.4%) | 0 (0.0%) |
| Coal or Coke | 0 (0.0%) | 0 (0.0%) |
| All other Fuels | 1 (1.1%) | 0 (0.0%) |
| No Fuel Used | 0 (0.0%) | 0 (0.0%) |
| Total | 90 (100.0%) | 23 (100.0%) |
Household Vehicle Usage in Ardentown
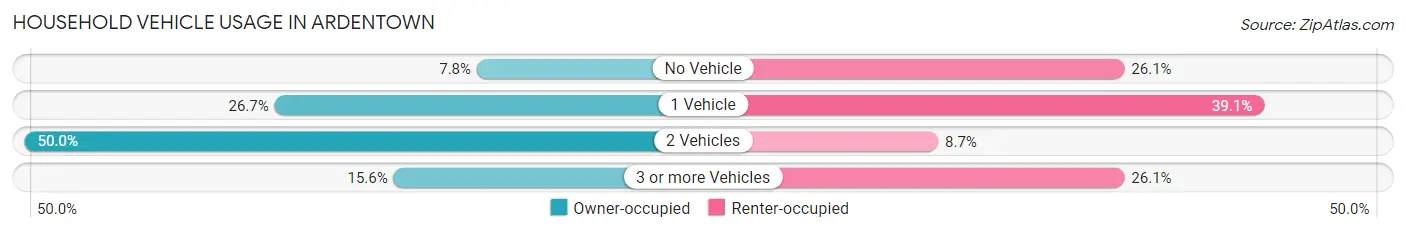
| Vehicles per Household | Owner-occupied | Renter-occupied |
| No Vehicle | 7 (7.8%) | 6 (26.1%) |
| 1 Vehicle | 24 (26.7%) | 9 (39.1%) |
| 2 Vehicles | 45 (50.0%) | 2 (8.7%) |
| 3 or more Vehicles | 14 (15.6%) | 6 (26.1%) |
| Total | 90 (100.0%) | 23 (100.0%) |
Real Estate & Mortgages in Ardentown
Real Estate and Mortgage Overview in Ardentown
| Characteristic | Without Mortgage | With Mortgage |
| Housing Units | 40 | 50 |
| Median Property Value | $357,100 | $330,800 |
| Median Household Income | $56,875 | $7 |
| Monthly Housing Costs | $625 | $0 |
| Real Estate Taxes | $3,000 | $2 |
Property Value by Mortgage Status in Ardentown
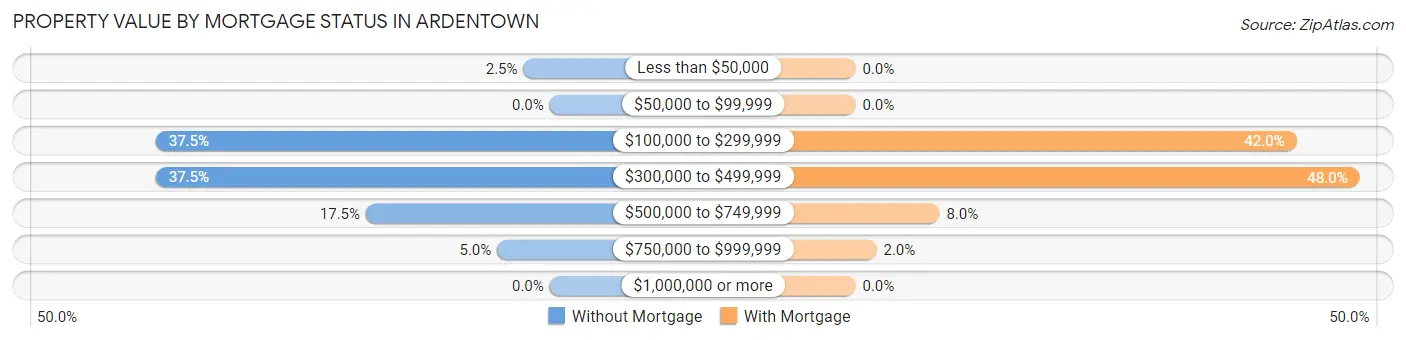
| Property Value | Without Mortgage | With Mortgage |
| Less than $50,000 | 1 (2.5%) | 0 (0.0%) |
| $50,000 to $99,999 | 0 (0.0%) | 0 (0.0%) |
| $100,000 to $299,999 | 15 (37.5%) | 21 (42.0%) |
| $300,000 to $499,999 | 15 (37.5%) | 24 (48.0%) |
| $500,000 to $749,999 | 7 (17.5%) | 4 (8.0%) |
| $750,000 to $999,999 | 2 (5.0%) | 1 (2.0%) |
| $1,000,000 or more | 0 (0.0%) | 0 (0.0%) |
| Total | 40 (100.0%) | 50 (100.0%) |
Household Income by Mortgage Status in Ardentown
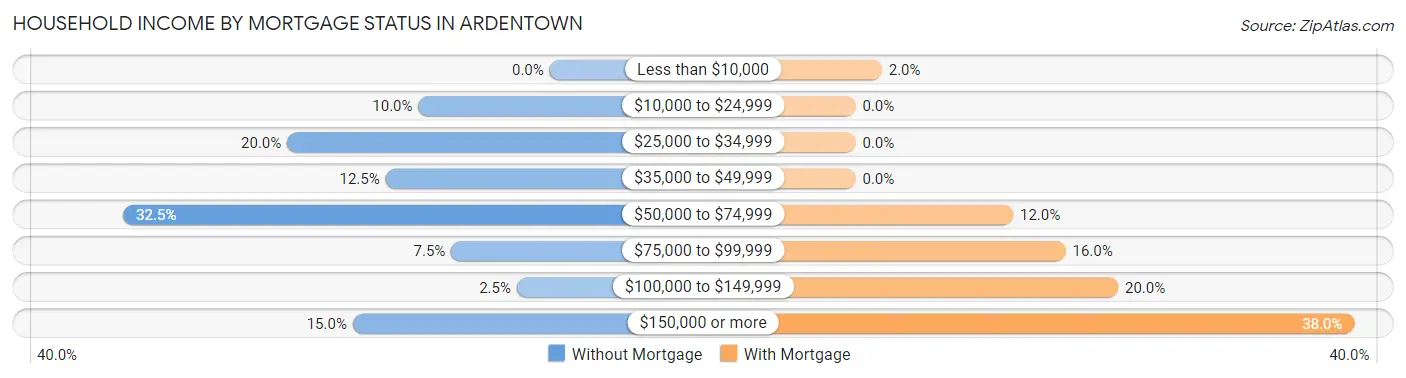
| Household Income | Without Mortgage | With Mortgage |
| Less than $10,000 | 0 (0.0%) | 1 (2.0%) |
| $10,000 to $24,999 | 4 (10.0%) | 0 (0.0%) |
| $25,000 to $34,999 | 8 (20.0%) | 0 (0.0%) |
| $35,000 to $49,999 | 5 (12.5%) | 0 (0.0%) |
| $50,000 to $74,999 | 13 (32.5%) | 6 (12.0%) |
| $75,000 to $99,999 | 3 (7.5%) | 8 (16.0%) |
| $100,000 to $149,999 | 1 (2.5%) | 10 (20.0%) |
| $150,000 or more | 6 (15.0%) | 19 (38.0%) |
| Total | 40 (100.0%) | 50 (100.0%) |
Property Value to Household Income Ratio in Ardentown
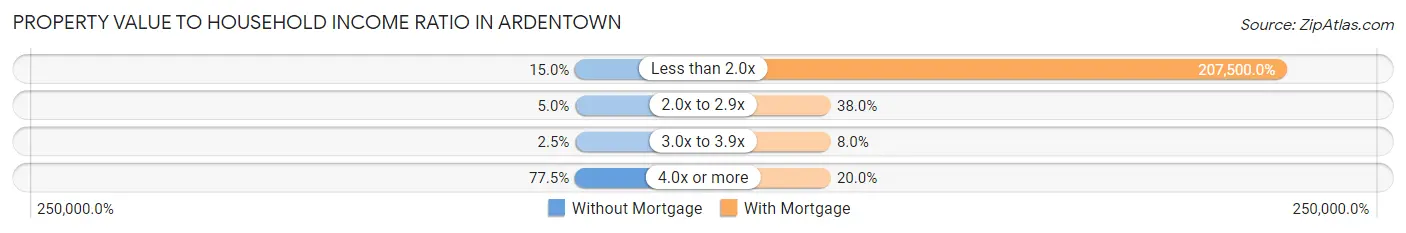
| Value-to-Income Ratio | Without Mortgage | With Mortgage |
| Less than 2.0x | 6 (15.0%) | 103,750 (207,500.0%) |
| 2.0x to 2.9x | 2 (5.0%) | 19 (38.0%) |
| 3.0x to 3.9x | 1 (2.5%) | 4 (8.0%) |
| 4.0x or more | 31 (77.5%) | 10 (20.0%) |
| Total | 40 (100.0%) | 50 (100.0%) |
Real Estate Taxes by Mortgage Status in Ardentown
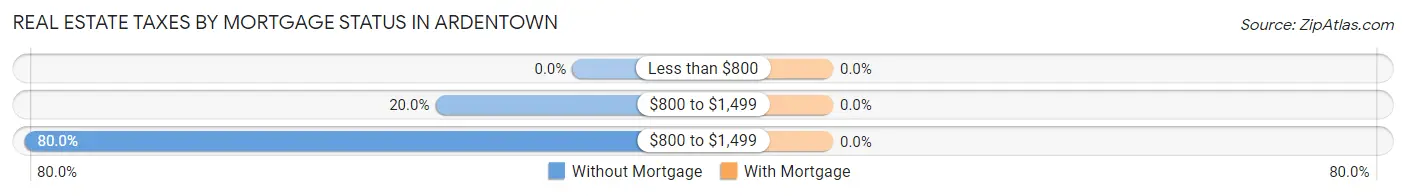
| Property Taxes | Without Mortgage | With Mortgage |
| Less than $800 | 0 (0.0%) | 0 (0.0%) |
| $800 to $1,499 | 8 (20.0%) | 0 (0.0%) |
| $800 to $1,499 | 32 (80.0%) | 0 (0.0%) |
| Total | 40 (100.0%) | 50 (100.0%) |
Health & Disability in Ardentown
Health Insurance Coverage by Age in Ardentown
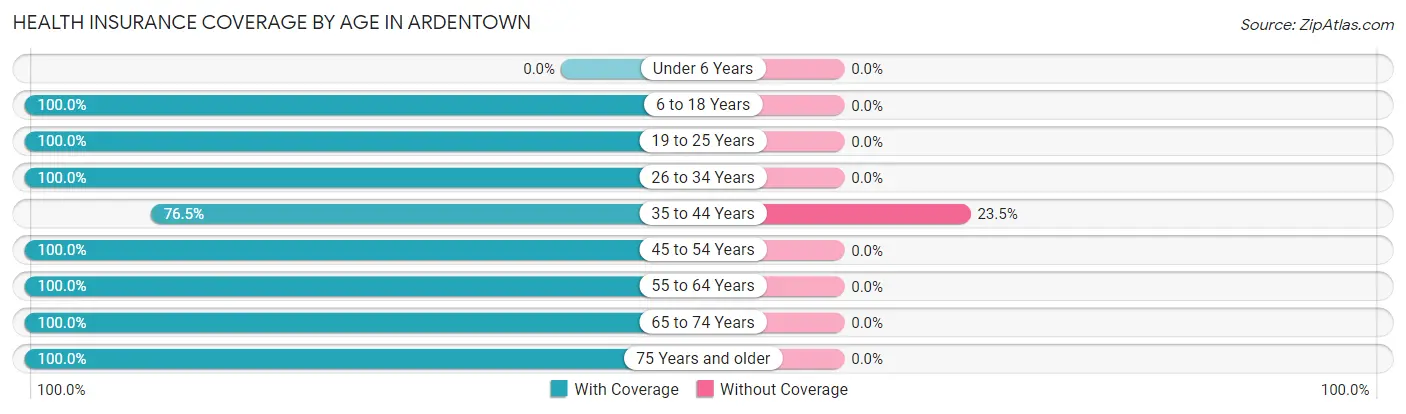
| Age Bracket | With Coverage | Without Coverage |
| Under 6 Years | 0 (0.0%) | 0 (0.0%) |
| 6 to 18 Years | 30 (100.0%) | 0 (0.0%) |
| 19 to 25 Years | 5 (100.0%) | 0 (0.0%) |
| 26 to 34 Years | 15 (100.0%) | 0 (0.0%) |
| 35 to 44 Years | 13 (76.5%) | 4 (23.5%) |
| 45 to 54 Years | 12 (100.0%) | 0 (0.0%) |
| 55 to 64 Years | 66 (100.0%) | 0 (0.0%) |
| 65 to 74 Years | 39 (100.0%) | 0 (0.0%) |
| 75 Years and older | 36 (100.0%) | 0 (0.0%) |
| Total | 216 (98.2%) | 4 (1.8%) |
Health Insurance Coverage by Citizenship Status in Ardentown

| Citizenship Status | With Coverage | Without Coverage |
| Native Born | 0 (0.0%) | 0 (0.0%) |
| Foreign Born, Citizen | 30 (100.0%) | 0 (0.0%) |
| Foreign Born, not a Citizen | 5 (100.0%) | 0 (0.0%) |
Health Insurance Coverage by Household Income in Ardentown
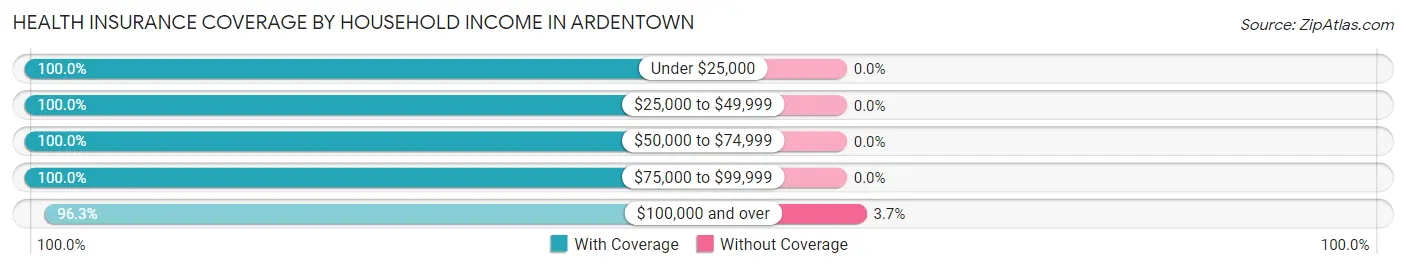
| Household Income | With Coverage | Without Coverage |
| Under $25,000 | 9 (100.0%) | 0 (0.0%) |
| $25,000 to $49,999 | 32 (100.0%) | 0 (0.0%) |
| $50,000 to $74,999 | 46 (100.0%) | 0 (0.0%) |
| $75,000 to $99,999 | 25 (100.0%) | 0 (0.0%) |
| $100,000 and over | 104 (96.3%) | 4 (3.7%) |
Public vs Private Health Insurance Coverage by Age in Ardentown
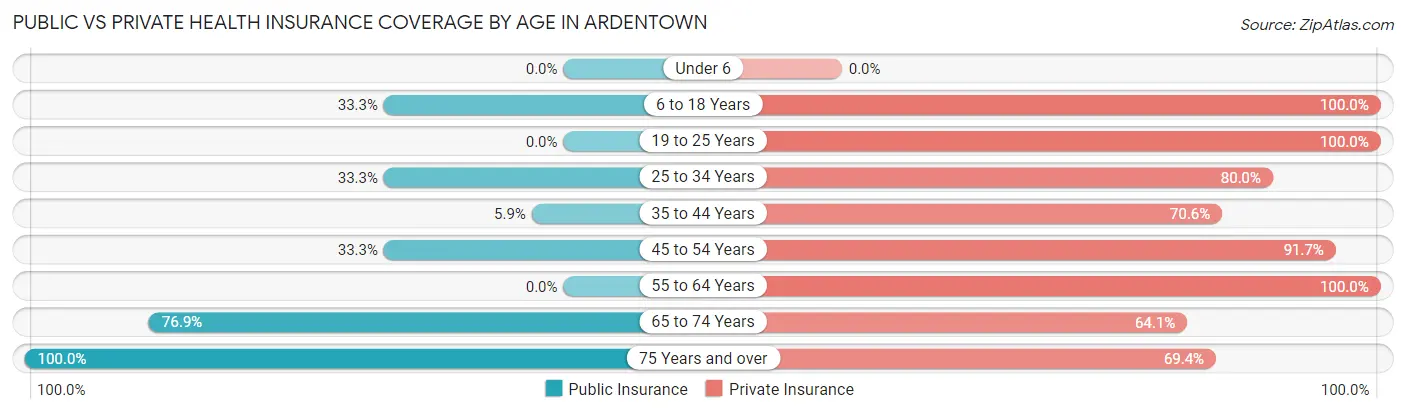
| Age Bracket | Public Insurance | Private Insurance |
| Under 6 | 0 (0.0%) | 0 (0.0%) |
| 6 to 18 Years | 10 (33.3%) | 30 (100.0%) |
| 19 to 25 Years | 0 (0.0%) | 5 (100.0%) |
| 25 to 34 Years | 5 (33.3%) | 12 (80.0%) |
| 35 to 44 Years | 1 (5.9%) | 12 (70.6%) |
| 45 to 54 Years | 4 (33.3%) | 11 (91.7%) |
| 55 to 64 Years | 0 (0.0%) | 66 (100.0%) |
| 65 to 74 Years | 30 (76.9%) | 25 (64.1%) |
| 75 Years and over | 36 (100.0%) | 25 (69.4%) |
| Total | 86 (39.1%) | 186 (84.6%) |
Disability Status by Sex by Age in Ardentown
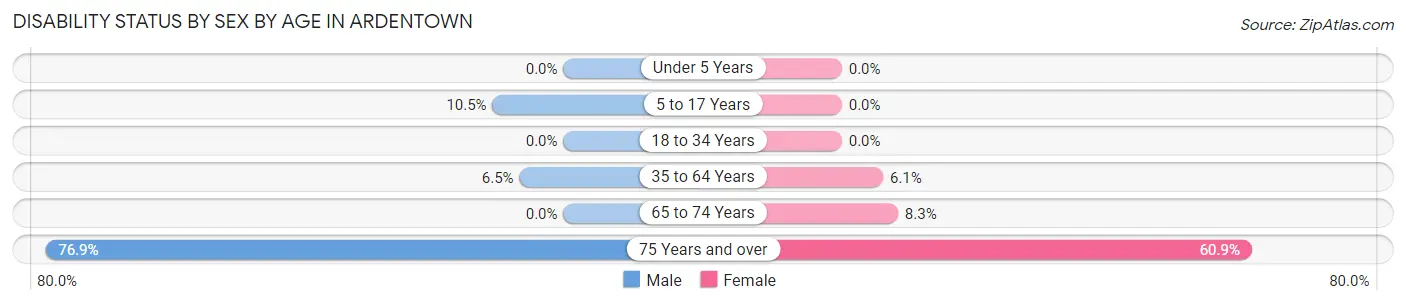
| Age Bracket | Male | Female |
| Under 5 Years | 0 (0.0%) | 0 (0.0%) |
| 5 to 17 Years | 2 (10.5%) | 0 (0.0%) |
| 18 to 34 Years | 0 (0.0%) | 0 (0.0%) |
| 35 to 64 Years | 3 (6.5%) | 3 (6.1%) |
| 65 to 74 Years | 0 (0.0%) | 2 (8.3%) |
| 75 Years and over | 10 (76.9%) | 14 (60.9%) |
Disability Class by Sex by Age in Ardentown
Disability Class: Hearing Difficulty
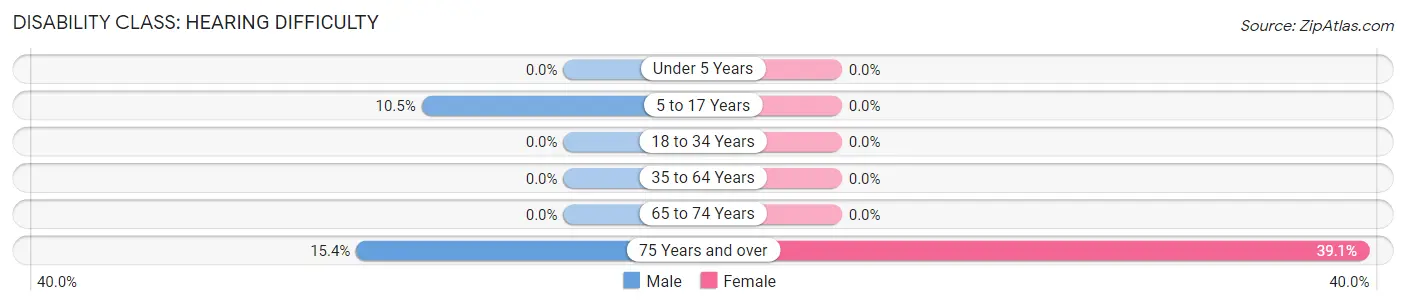
| Age Bracket | Male | Female |
| Under 5 Years | 0 (0.0%) | 0 (0.0%) |
| 5 to 17 Years | 2 (10.5%) | 0 (0.0%) |
| 18 to 34 Years | 0 (0.0%) | 0 (0.0%) |
| 35 to 64 Years | 0 (0.0%) | 0 (0.0%) |
| 65 to 74 Years | 0 (0.0%) | 0 (0.0%) |
| 75 Years and over | 2 (15.4%) | 9 (39.1%) |
Disability Class: Vision Difficulty
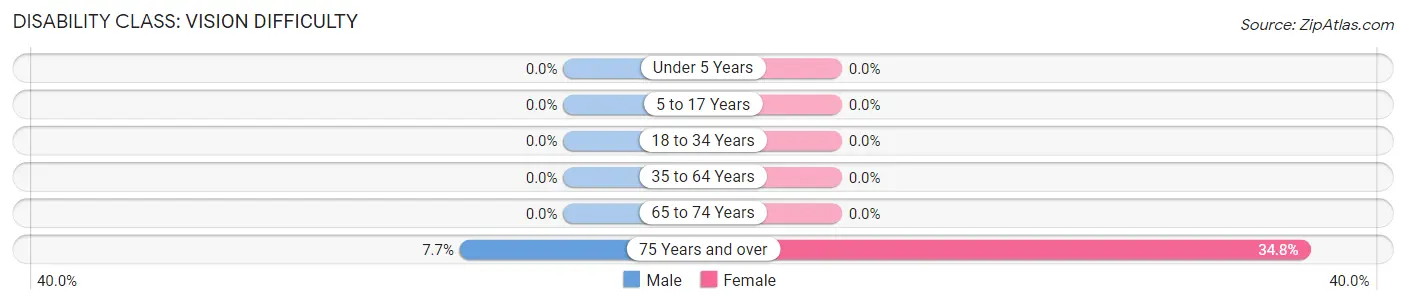
| Age Bracket | Male | Female |
| Under 5 Years | 0 (0.0%) | 0 (0.0%) |
| 5 to 17 Years | 0 (0.0%) | 0 (0.0%) |
| 18 to 34 Years | 0 (0.0%) | 0 (0.0%) |
| 35 to 64 Years | 0 (0.0%) | 0 (0.0%) |
| 65 to 74 Years | 0 (0.0%) | 0 (0.0%) |
| 75 Years and over | 1 (7.7%) | 8 (34.8%) |
Disability Class: Cognitive Difficulty
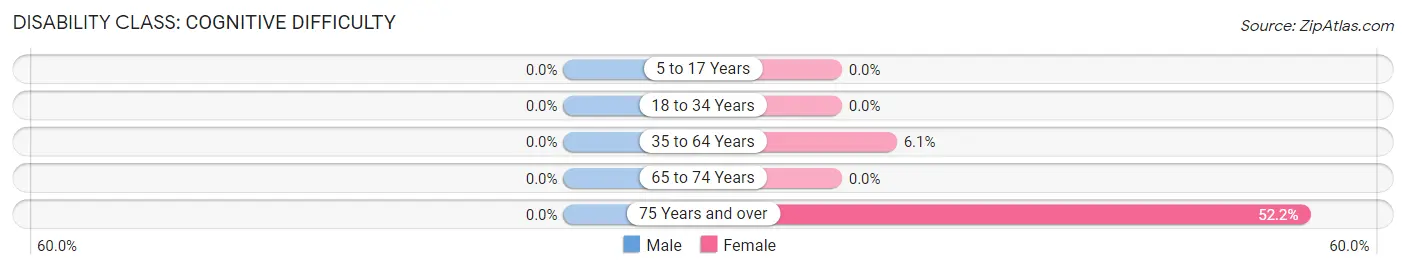
| Age Bracket | Male | Female |
| 5 to 17 Years | 0 (0.0%) | 0 (0.0%) |
| 18 to 34 Years | 0 (0.0%) | 0 (0.0%) |
| 35 to 64 Years | 0 (0.0%) | 3 (6.1%) |
| 65 to 74 Years | 0 (0.0%) | 0 (0.0%) |
| 75 Years and over | 0 (0.0%) | 12 (52.2%) |
Disability Class: Ambulatory Difficulty
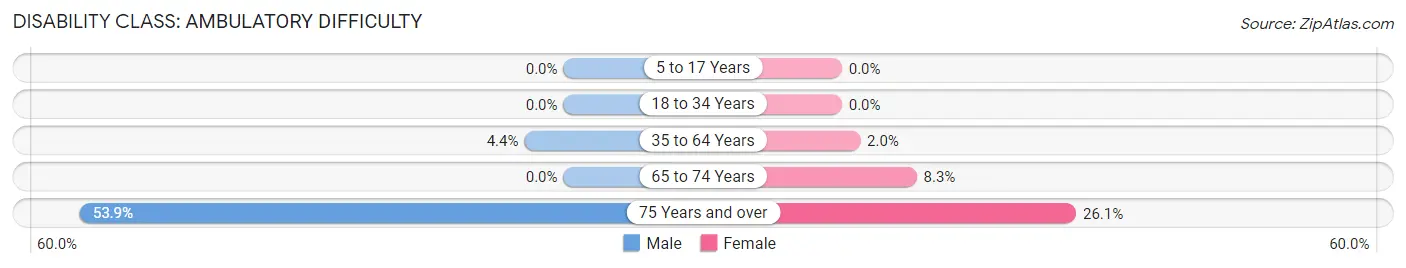
| Age Bracket | Male | Female |
| 5 to 17 Years | 0 (0.0%) | 0 (0.0%) |
| 18 to 34 Years | 0 (0.0%) | 0 (0.0%) |
| 35 to 64 Years | 2 (4.3%) | 1 (2.0%) |
| 65 to 74 Years | 0 (0.0%) | 2 (8.3%) |
| 75 Years and over | 7 (53.8%) | 6 (26.1%) |
Disability Class: Self-Care Difficulty
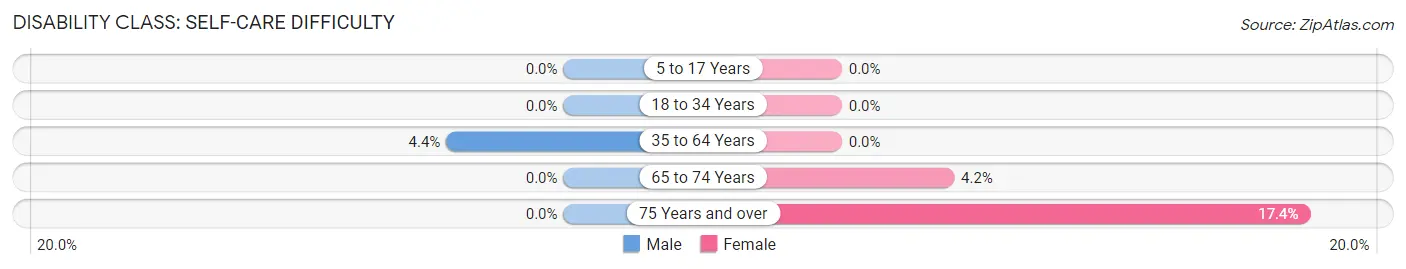
| Age Bracket | Male | Female |
| 5 to 17 Years | 0 (0.0%) | 0 (0.0%) |
| 18 to 34 Years | 0 (0.0%) | 0 (0.0%) |
| 35 to 64 Years | 2 (4.3%) | 0 (0.0%) |
| 65 to 74 Years | 0 (0.0%) | 1 (4.2%) |
| 75 Years and over | 0 (0.0%) | 4 (17.4%) |
Technology Access in Ardentown
Computing Device Access in Ardentown
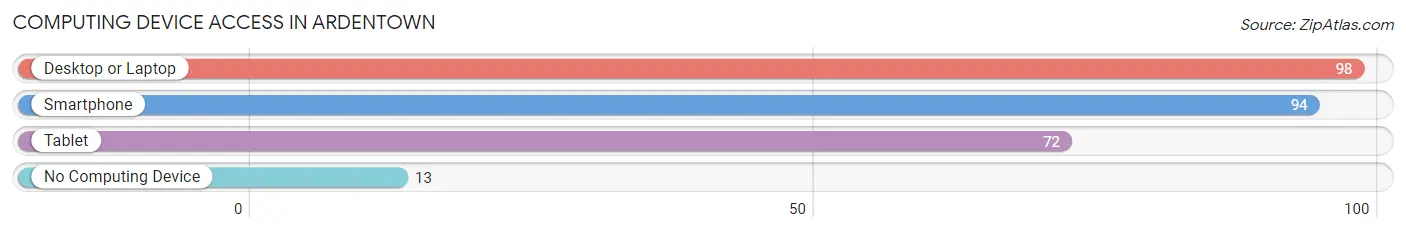
| Device Type | # Households | % Households |
| Desktop or Laptop | 98 | 86.7% |
| Smartphone | 94 | 83.2% |
| Tablet | 72 | 63.7% |
| No Computing Device | 13 | 11.5% |
| Total | 113 | 100.0% |
Internet Access in Ardentown
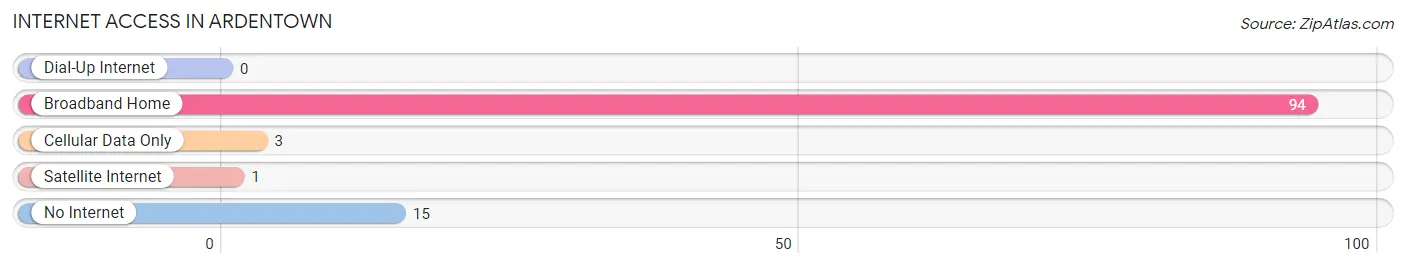
| Internet Type | # Households | % Households |
| Dial-Up Internet | 0 | 0.0% |
| Broadband Home | 94 | 83.2% |
| Cellular Data Only | 3 | 2.6% |
| Satellite Internet | 1 | 0.9% |
| No Internet | 15 | 13.3% |
| Total | 113 | 100.0% |
Ardentown Summary
Ardentown is a small unincorporated community located in New Castle County, Delaware. It is situated in the northern part of the state, just south of the Maryland border. The community is bordered by the towns of Newark, Delaware to the north, and Middletown, Delaware to the south. The population of Ardentown was estimated to be 1,845 in the year 2000.
History
Ardentown was first settled in the late 1700s by a group of Quakers from Pennsylvania. The community was originally known as “Arden”, after the nearby Ardenwood Forest. The name was changed to Ardentown in 1883 when the post office was established.
The community was largely agricultural until the early 1900s, when the DuPont Company began to purchase land in the area for the construction of a gunpowder mill. The mill was completed in 1915 and operated until the late 1950s. The mill was eventually replaced by a chemical plant, which is still in operation today.
Geography
Ardentown is located in northern New Castle County, Delaware, just south of the Maryland border. The community is situated on the banks of the Red Clay Creek, which flows through the area. The terrain is mostly flat, with some rolling hills in the surrounding area. The climate is temperate, with hot summers and cold winters.
Economy
The economy of Ardentown is largely based on the chemical plant that is located in the community. The plant is owned and operated by the DuPont Company and produces a variety of chemicals and materials for industrial and commercial use. The plant employs a large number of local residents and is a major contributor to the local economy.
In addition to the chemical plant, Ardentown is home to a number of small businesses, including restaurants, retail stores, and service providers. The community also has a number of small farms that produce a variety of crops, including corn, soybeans, and wheat.
Demographics
As of the year 2000, the population of Ardentown was estimated to be 1,845. The racial makeup of the community was 94.3% White, 2.7% African American, 0.7% Asian, and 2.3% other. The median household income was $45,000, and the median home value was $150,000.
The majority of the population is employed in the chemical plant, with a smaller number employed in the local businesses and farms. The community is served by the Red Clay Consolidated School District, which provides public education to the area.
Ardentown is a small, close-knit community with a rich history and a bright future. The community is home to a diverse population and a thriving economy, making it an ideal place to live and work.
Common Questions
What is Per Capita Income in Ardentown?
Per Capita income in Ardentown is $53,403.
What is the Median Family Income in Ardentown?
Median Family Income in Ardentown is $102,917.
What is the Median Household income in Ardentown?
Median Household Income in Ardentown is $81,250.
What is Inequality or Gini Index in Ardentown?
Inequality or Gini Index in Ardentown is 0.36.
What is the Total Population of Ardentown?
Total Population of Ardentown is 223.
What is the Total Male Population of Ardentown?
Total Male Population of Ardentown is 106.
What is the Total Female Population of Ardentown?
Total Female Population of Ardentown is 117.
What is the Ratio of Males per 100 Females in Ardentown?
There are 90.60 Males per 100 Females in Ardentown.
What is the Ratio of Females per 100 Males in Ardentown?
There are 110.38 Females per 100 Males in Ardentown.
What is the Median Population Age in Ardentown?
Median Population Age in Ardentown is 57.8 Years.
What is the Average Family Size in Ardentown
Average Family Size in Ardentown is 2.5 People.
What is the Average Household Size in Ardentown
Average Household Size in Ardentown is 1.9 People.
How Large is the Labor Force in Ardentown?
There are 105 People in the Labor Forcein in Ardentown.
What is the Percentage of People in the Labor Force in Ardentown?
52.8% of People are in the Labor Force in Ardentown.
What is the Unemployment Rate in Ardentown?
Unemployment Rate in Ardentown is 4.8%.