Dewey Beach, DE Map & Demographics
Dewey Beach Map
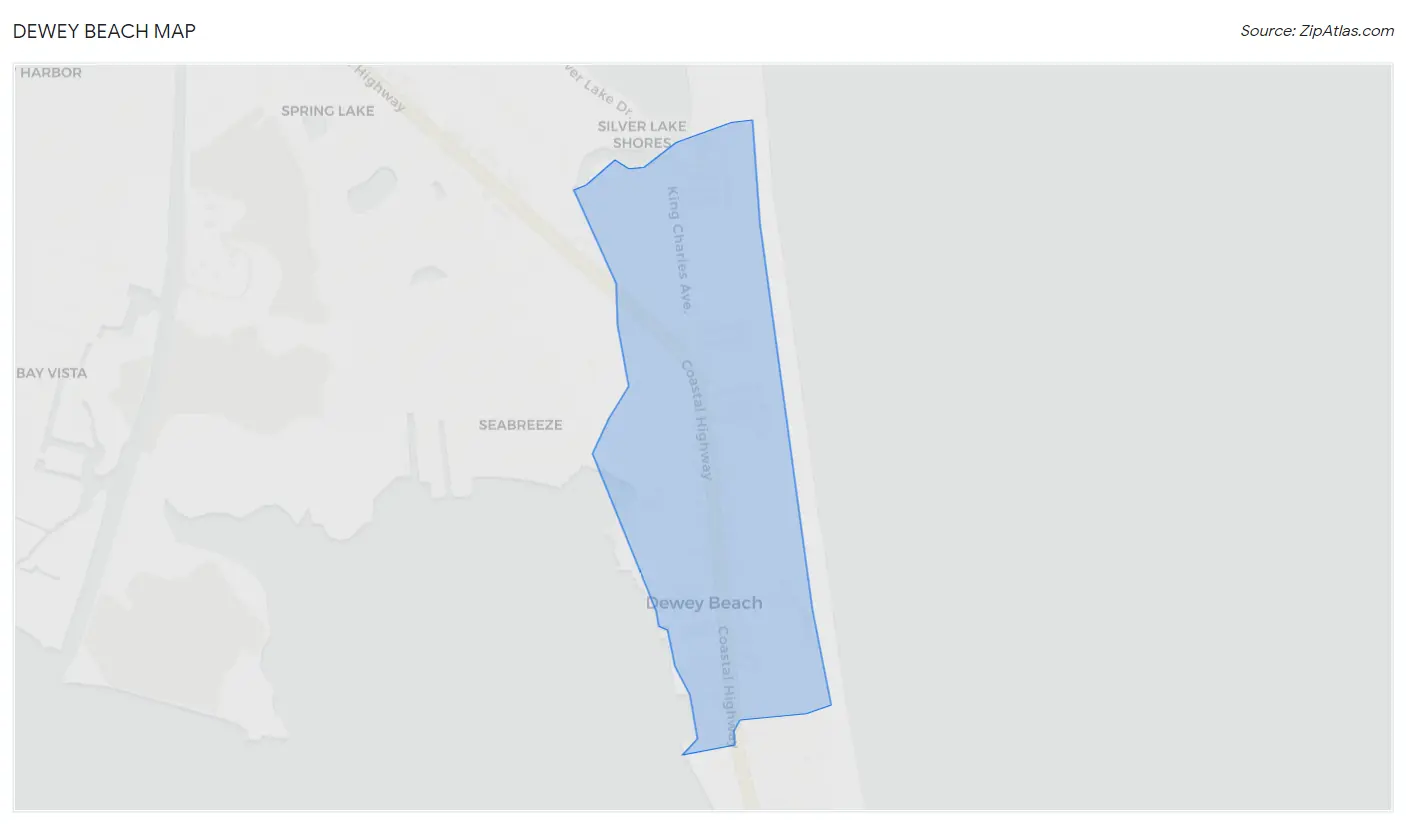
Dewey Beach Overview
$87,153
PER CAPITA INCOME
$135,625
AVG FAMILY INCOME
$98,500
AVG HOUSEHOLD INCOME
49.3%
WAGE / INCOME GAP [ % ]
50.7¢/ $1
WAGE / INCOME GAP [ $ ]
$12,553
FAMILY INCOME DEFICIT
0.56
INEQUALITY / GINI INDEX
359
TOTAL POPULATION
169
MALE POPULATION
190
FEMALE POPULATION
88.95
MALES / 100 FEMALES
112.43
FEMALES / 100 MALES
59.9
MEDIAN AGE
2.3
AVG FAMILY SIZE
1.9
AVG HOUSEHOLD SIZE
176
LABOR FORCE [ PEOPLE ]
50.4%
PERCENT IN LABOR FORCE
1.7%
UNEMPLOYMENT RATE
Dewey Beach Area Codes
Income in Dewey Beach
Income Overview in Dewey Beach
Per Capita Income in Dewey Beach is $87,153, while median incomes of families and households are $135,625 and $98,500 respectively.
| Characteristic | Number | Measure |
| Per Capita Income | 359 | $87,153 |
| Median Family Income | 121 | $135,625 |
| Mean Family Income | 121 | $196,707 |
| Median Household Income | 194 | $98,500 |
| Mean Household Income | 194 | $160,066 |
| Income Deficit | 121 | $12,553 |
| Wage / Income Gap (%) | 359 | 49.30% |
| Wage / Income Gap ($) | 359 | 50.70¢ per $1 |
| Gini / Inequality Index | 359 | 0.56 |
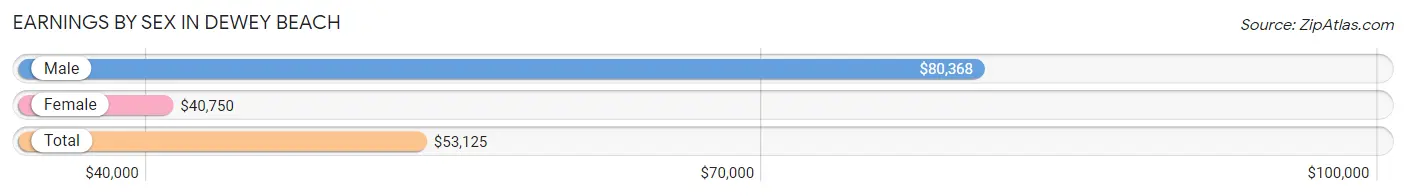
Earnings by Sex in Dewey Beach
Average Earnings in Dewey Beach are $53,125, $80,368 for men and $40,750 for women, a difference of 49.3%.
| Sex | Number | Average Earnings |
| Male | 95 (52.8%) | $80,368 |
| Female | 85 (47.2%) | $40,750 |
| Total | 180 (100.0%) | $53,125 |
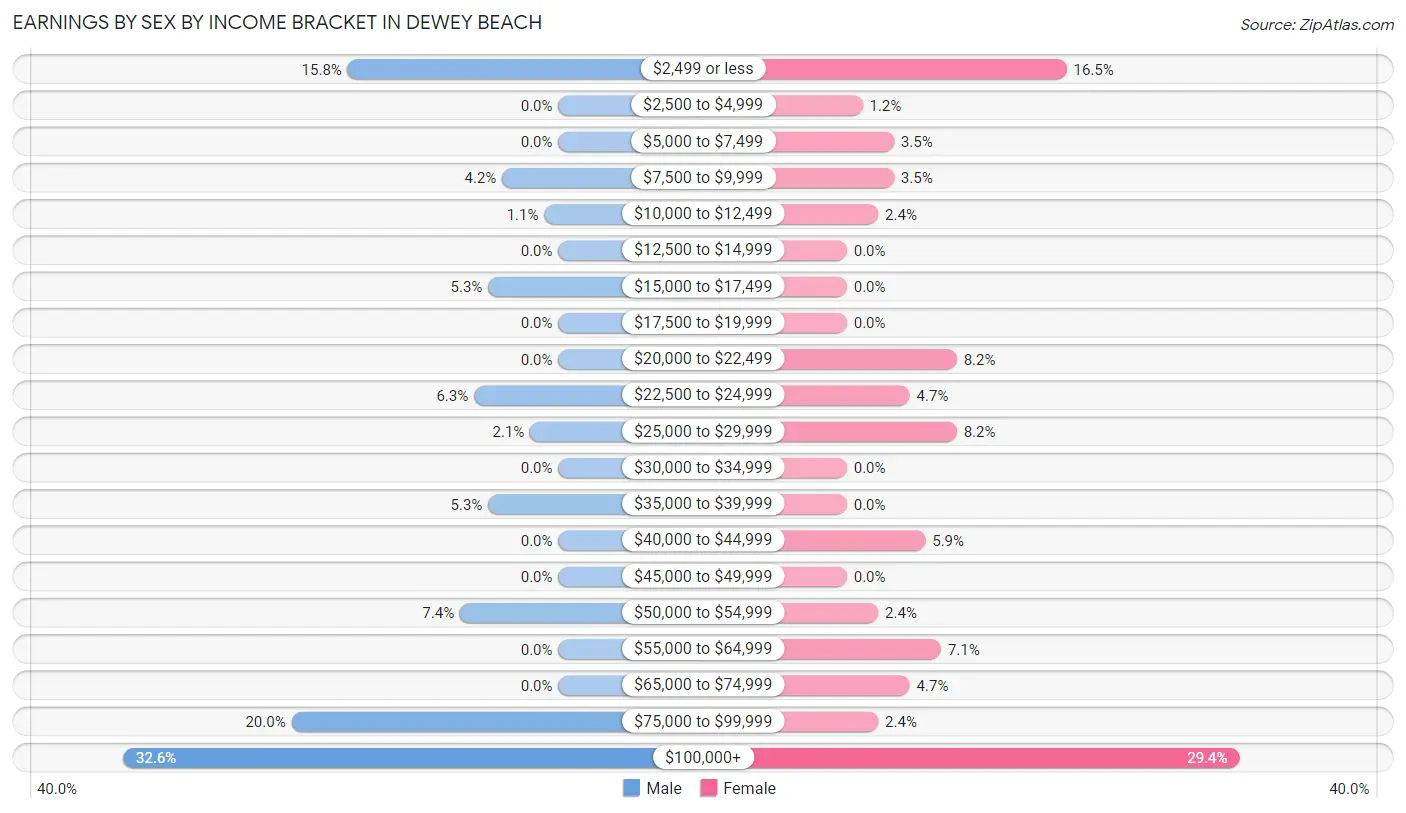
Earnings by Sex by Income Bracket in Dewey Beach
The most common earnings brackets in Dewey Beach are $100,000+ for men (31 | 32.6%) and $100,000+ for women (25 | 29.4%).
| Income | Male | Female |
| $2,499 or less | 15 (15.8%) | 14 (16.5%) |
| $2,500 to $4,999 | 0 (0.0%) | 1 (1.2%) |
| $5,000 to $7,499 | 0 (0.0%) | 3 (3.5%) |
| $7,500 to $9,999 | 4 (4.2%) | 3 (3.5%) |
| $10,000 to $12,499 | 1 (1.1%) | 2 (2.4%) |
| $12,500 to $14,999 | 0 (0.0%) | 0 (0.0%) |
| $15,000 to $17,499 | 5 (5.3%) | 0 (0.0%) |
| $17,500 to $19,999 | 0 (0.0%) | 0 (0.0%) |
| $20,000 to $22,499 | 0 (0.0%) | 7 (8.2%) |
| $22,500 to $24,999 | 6 (6.3%) | 4 (4.7%) |
| $25,000 to $29,999 | 2 (2.1%) | 7 (8.2%) |
| $30,000 to $34,999 | 0 (0.0%) | 0 (0.0%) |
| $35,000 to $39,999 | 5 (5.3%) | 0 (0.0%) |
| $40,000 to $44,999 | 0 (0.0%) | 5 (5.9%) |
| $45,000 to $49,999 | 0 (0.0%) | 0 (0.0%) |
| $50,000 to $54,999 | 7 (7.4%) | 2 (2.4%) |
| $55,000 to $64,999 | 0 (0.0%) | 6 (7.1%) |
| $65,000 to $74,999 | 0 (0.0%) | 4 (4.7%) |
| $75,000 to $99,999 | 19 (20.0%) | 2 (2.4%) |
| $100,000+ | 31 (32.6%) | 25 (29.4%) |
| Total | 95 (100.0%) | 85 (100.0%) |
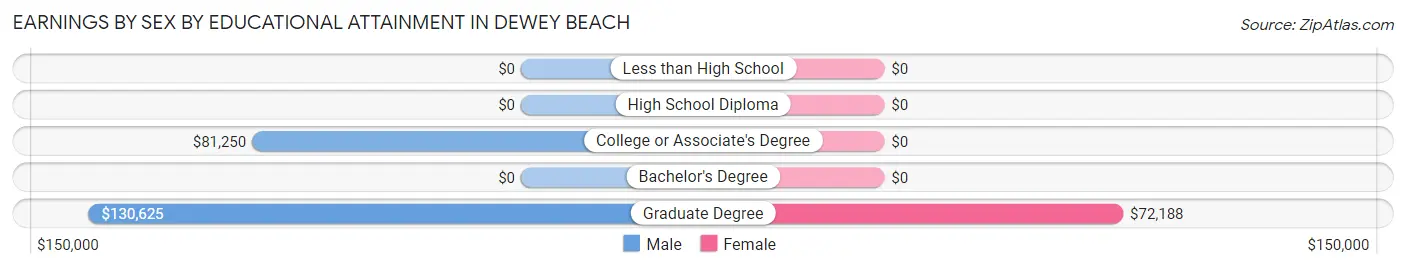
Earnings by Sex by Educational Attainment in Dewey Beach
Average earnings in Dewey Beach are $81,691 for men and $42,000 for women, a difference of 48.6%. Men with an educational attainment of graduate degree enjoy the highest average annual earnings of $130,625, while those with college or associate's degree education earn the least with $81,250. Women with an educational attainment of graduate degree earn the most with the average annual earnings of $72,188, while those with graduate degree education have the smallest earnings of $72,188.
| Educational Attainment | Male Income | Female Income |
| Less than High School | - | - |
| High School Diploma | - | - |
| College or Associate's Degree | $81,250 | $0 |
| Bachelor's Degree | - | - |
| Graduate Degree | $130,625 | $72,188 |
| Total | $81,691 | $42,000 |
Family Income in Dewey Beach
Family Income Brackets in Dewey Beach
According to the Dewey Beach family income data, there are 38 families falling into the $200,000+ income range, which is the most common income bracket and makes up 31.4% of all families.
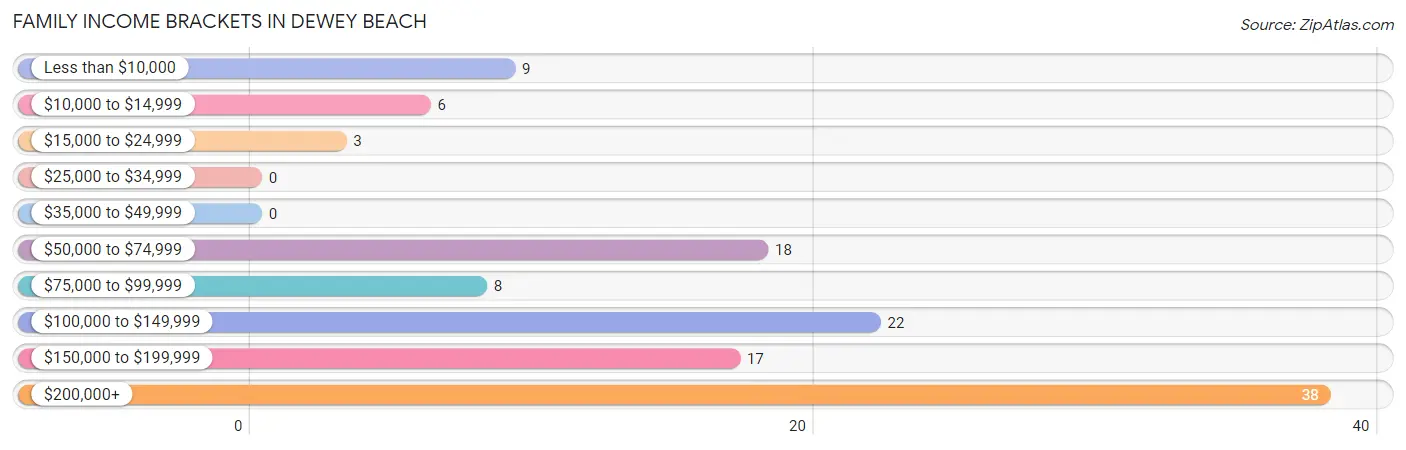
| Income Bracket | # Families | % Families |
| Less than $10,000 | 9 | 7.4% |
| $10,000 to $14,999 | 6 | 5.0% |
| $15,000 to $24,999 | 3 | 2.5% |
| $25,000 to $34,999 | 0 | 0.0% |
| $35,000 to $49,999 | 0 | 0.0% |
| $50,000 to $74,999 | 18 | 14.9% |
| $75,000 to $99,999 | 8 | 6.6% |
| $100,000 to $149,999 | 22 | 18.2% |
| $150,000 to $199,999 | 17 | 14.0% |
| $200,000+ | 38 | 31.4% |
Family Income by Famaliy Size in Dewey Beach
2-person families (106 | 87.6%) account for the highest median family income in Dewey Beach with $154,167 per family, while 2-person families (106 | 87.6%) have the highest median income of $77,084 per family member.
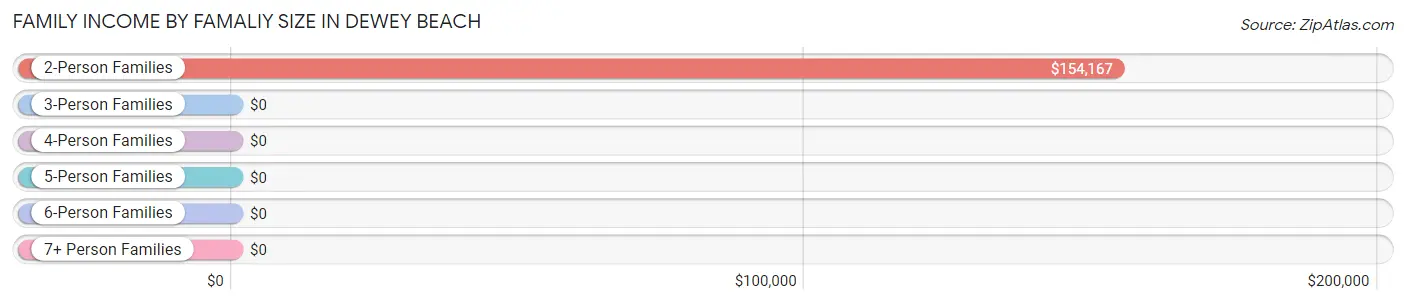
| Income Bracket | # Families | Median Income |
| 2-Person Families | 106 (87.6%) | $154,167 |
| 3-Person Families | 11 (9.1%) | $0 |
| 4-Person Families | 0 (0.0%) | $0 |
| 5-Person Families | 4 (3.3%) | $0 |
| 6-Person Families | 0 (0.0%) | $0 |
| 7+ Person Families | 0 (0.0%) | $0 |
| Total | 121 (100.0%) | $135,625 |
Family Income by Number of Earners in Dewey Beach
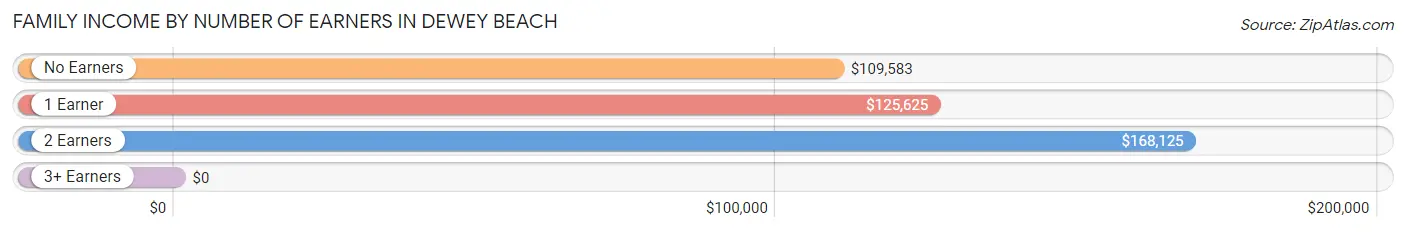
| Number of Earners | # Families | Median Income |
| No Earners | 45 (37.2%) | $109,583 |
| 1 Earner | 25 (20.7%) | $125,625 |
| 2 Earners | 47 (38.8%) | $168,125 |
| 3+ Earners | 4 (3.3%) | $0 |
| Total | 121 (100.0%) | $135,625 |
Household Income in Dewey Beach
Household Income Brackets in Dewey Beach
With 44 households falling in the category, the $200,000+ income range is the most frequent in Dewey Beach, accounting for 22.7% of all households. In contrast, only 5 households (2.6%) fall into the $15,000 to $24,999 income bracket, making it the least populous group.
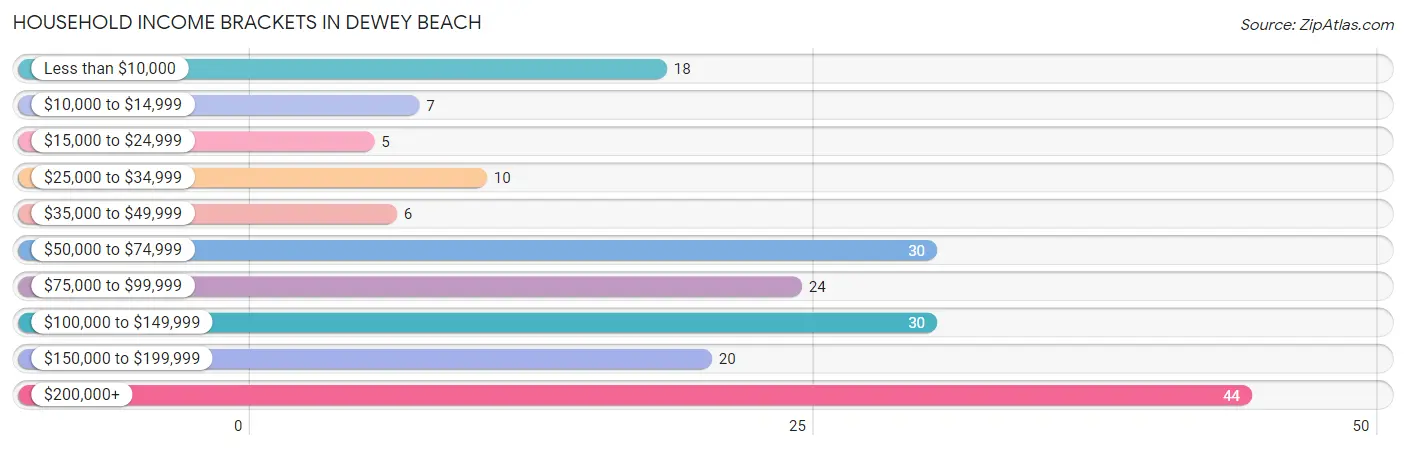
| Income Bracket | # Households | % Households |
| Less than $10,000 | 18 | 9.3% |
| $10,000 to $14,999 | 7 | 3.6% |
| $15,000 to $24,999 | 5 | 2.6% |
| $25,000 to $34,999 | 10 | 5.2% |
| $35,000 to $49,999 | 6 | 3.1% |
| $50,000 to $74,999 | 30 | 15.5% |
| $75,000 to $99,999 | 24 | 12.4% |
| $100,000 to $149,999 | 30 | 15.5% |
| $150,000 to $199,999 | 20 | 10.3% |
| $200,000+ | 44 | 22.7% |
Household Income by Householder Age in Dewey Beach
The median household income in Dewey Beach is $98,500, with the highest median household income of $109,583 found in the 65+ years age bracket for the primary householder. A total of 81 households (41.7%) fall into this category.
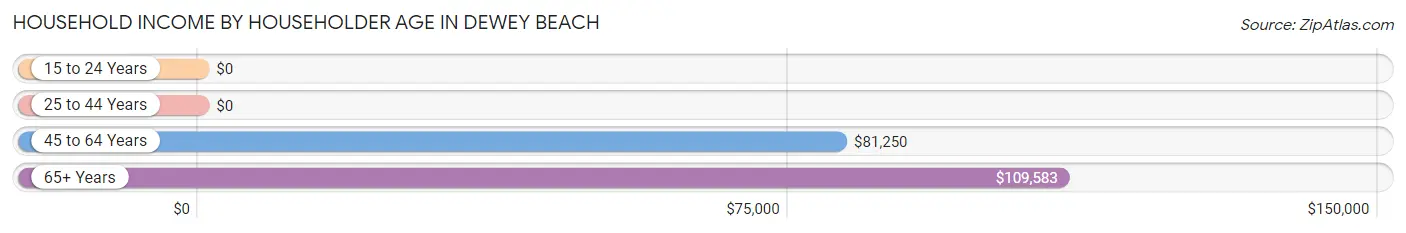
| Income Bracket | # Households | Median Income |
| 15 to 24 Years | 0 (0.0%) | $0 |
| 25 to 44 Years | 18 (9.3%) | $0 |
| 45 to 64 Years | 95 (49.0%) | $81,250 |
| 65+ Years | 81 (41.7%) | $109,583 |
| Total | 194 (100.0%) | $98,500 |
Poverty in Dewey Beach
Income Below Poverty by Sex and Age in Dewey Beach
With 11.2% poverty level for males and 14.7% for females among the residents of Dewey Beach, 55 to 64 year old males and 15 year old females are the most vulnerable to poverty, with 19 males (43.2%) and 6 females (100.0%) in their respective age groups living below the poverty level.
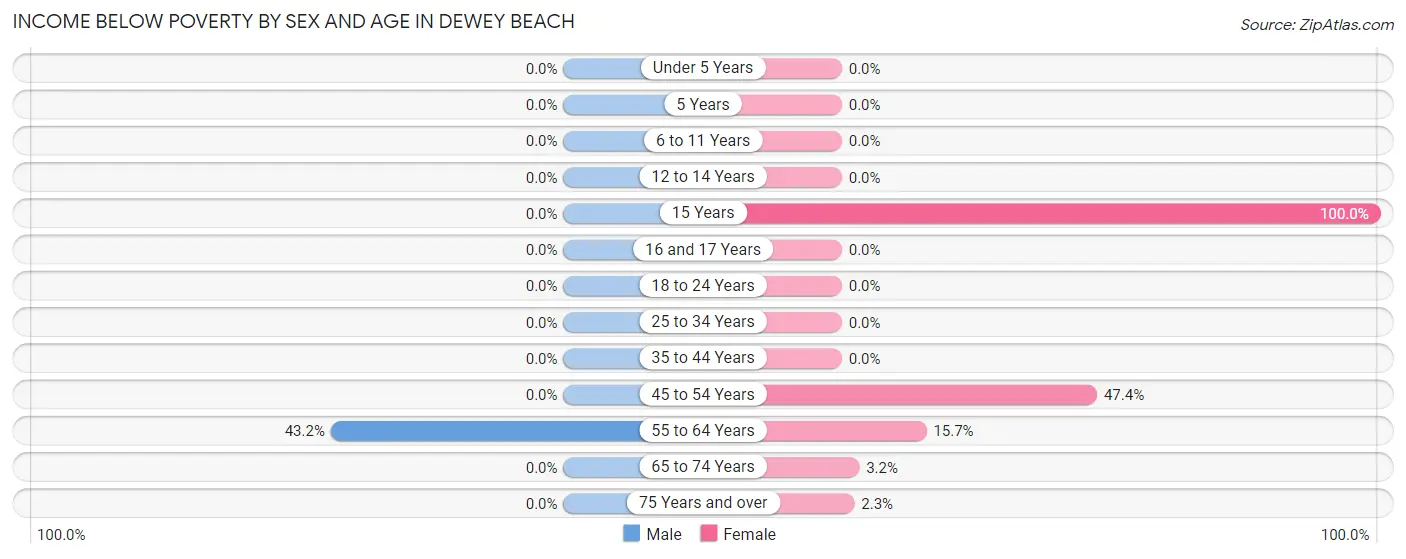
| Age Bracket | Male | Female |
| Under 5 Years | 0 (0.0%) | 0 (0.0%) |
| 5 Years | 0 (0.0%) | 0 (0.0%) |
| 6 to 11 Years | 0 (0.0%) | 0 (0.0%) |
| 12 to 14 Years | 0 (0.0%) | 0 (0.0%) |
| 15 Years | 0 (0.0%) | 6 (100.0%) |
| 16 and 17 Years | 0 (0.0%) | 0 (0.0%) |
| 18 to 24 Years | 0 (0.0%) | 0 (0.0%) |
| 25 to 34 Years | 0 (0.0%) | 0 (0.0%) |
| 35 to 44 Years | 0 (0.0%) | 0 (0.0%) |
| 45 to 54 Years | 0 (0.0%) | 9 (47.4%) |
| 55 to 64 Years | 19 (43.2%) | 11 (15.7%) |
| 65 to 74 Years | 0 (0.0%) | 1 (3.2%) |
| 75 Years and over | 0 (0.0%) | 1 (2.3%) |
| Total | 19 (11.2%) | 28 (14.7%) |
Income Above Poverty by Sex and Age in Dewey Beach
According to the poverty statistics in Dewey Beach, males aged 12 to 14 years and females aged 18 to 24 years are the age groups that are most secure financially, with 100.0% of males and 100.0% of females in these age groups living above the poverty line.
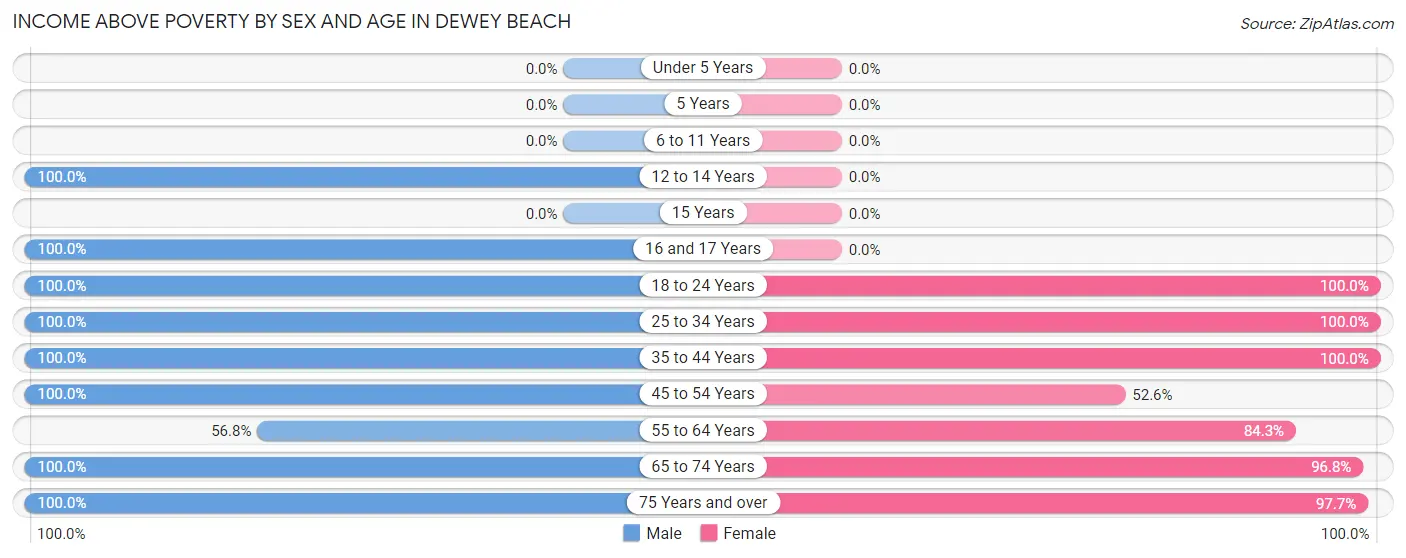
| Age Bracket | Male | Female |
| Under 5 Years | 0 (0.0%) | 0 (0.0%) |
| 5 Years | 0 (0.0%) | 0 (0.0%) |
| 6 to 11 Years | 0 (0.0%) | 0 (0.0%) |
| 12 to 14 Years | 4 (100.0%) | 0 (0.0%) |
| 15 Years | 0 (0.0%) | 0 (0.0%) |
| 16 and 17 Years | 10 (100.0%) | 0 (0.0%) |
| 18 to 24 Years | 8 (100.0%) | 5 (100.0%) |
| 25 to 34 Years | 24 (100.0%) | 6 (100.0%) |
| 35 to 44 Years | 4 (100.0%) | 10 (100.0%) |
| 45 to 54 Years | 17 (100.0%) | 10 (52.6%) |
| 55 to 64 Years | 25 (56.8%) | 59 (84.3%) |
| 65 to 74 Years | 35 (100.0%) | 30 (96.8%) |
| 75 Years and over | 23 (100.0%) | 42 (97.7%) |
| Total | 150 (88.8%) | 162 (85.3%) |
Income Below Poverty Among Married-Couple Families in Dewey Beach
The poverty statistics for married-couple families in Dewey Beach show that 14.1% or 15 of the total 106 families live below the poverty line. Families with 1 or 2 children have the highest poverty rate of 100.0%, comprising of 7 families. On the other hand, families with no children have the lowest poverty rate of 8.1%, which includes 8 families.
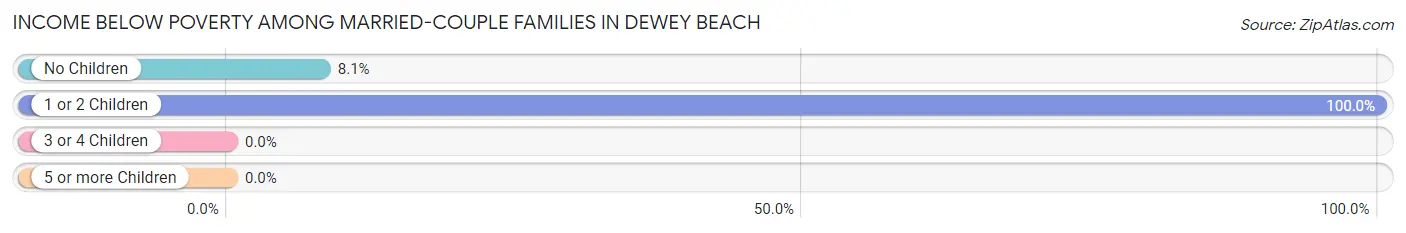
| Children | Above Poverty | Below Poverty |
| No Children | 91 (91.9%) | 8 (8.1%) |
| 1 or 2 Children | 0 (0.0%) | 7 (100.0%) |
| 3 or 4 Children | 0 (0.0%) | 0 (0.0%) |
| 5 or more Children | 0 (0.0%) | 0 (0.0%) |
| Total | 91 (85.9%) | 15 (14.1%) |
Income Below Poverty Among Single-Parent Households in Dewey Beach
| Children | Single Father | Single Mother |
| No Children | 0 (0.0%) | 0 (0.0%) |
| 1 or 2 Children | 0 (0.0%) | 0 (0.0%) |
| 3 or 4 Children | 0 (0.0%) | 0 (0.0%) |
| 5 or more Children | 0 (0.0%) | 0 (0.0%) |
| Total | 0 (0.0%) | 0 (0.0%) |
Income Below Poverty Among Married-Couple vs Single-Parent Households in Dewey Beach
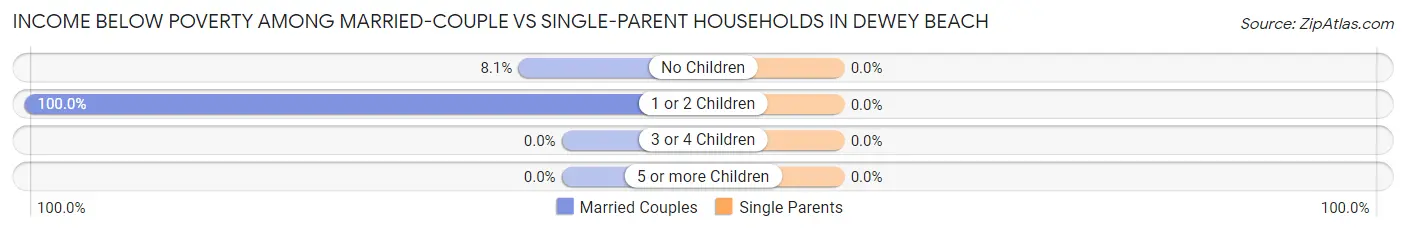
| Children | Married-Couple Families | Single-Parent Households |
| No Children | 8 (8.1%) | 0 (0.0%) |
| 1 or 2 Children | 7 (100.0%) | 0 (0.0%) |
| 3 or 4 Children | 0 (0.0%) | 0 (0.0%) |
| 5 or more Children | 0 (0.0%) | 0 (0.0%) |
| Total | 15 (14.1%) | 0 (0.0%) |
Race in Dewey Beach
The most populous races in Dewey Beach are White / Caucasian (335 | 93.3%), Two or more Races (20 | 5.6%), and Hispanic or Latino (6 | 1.7%).
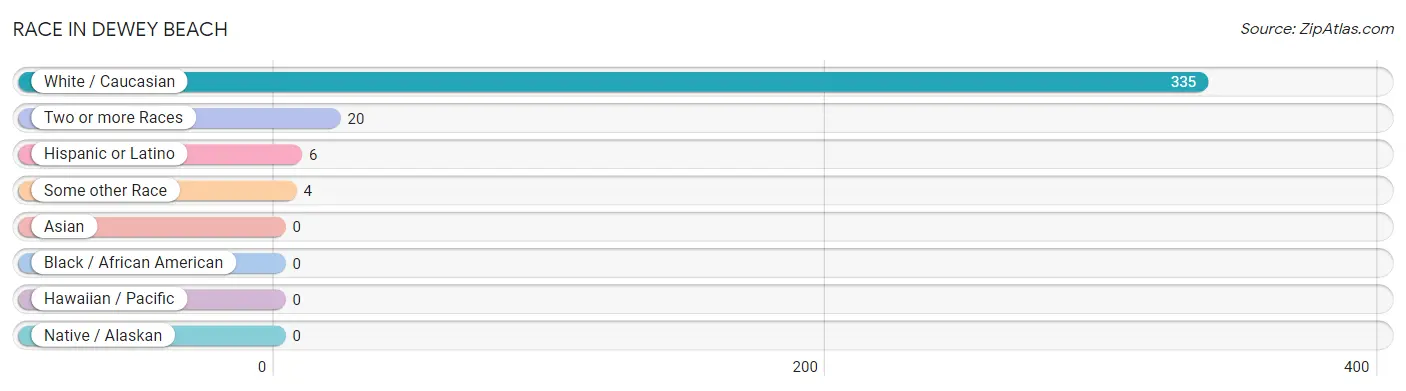
| Race | # Population | % Population |
| Asian | 0 | 0.0% |
| Black / African American | 0 | 0.0% |
| Hawaiian / Pacific | 0 | 0.0% |
| Hispanic or Latino | 6 | 1.7% |
| Native / Alaskan | 0 | 0.0% |
| White / Caucasian | 335 | 93.3% |
| Two or more Races | 20 | 5.6% |
| Some other Race | 4 | 1.1% |
| Total | 359 | 100.0% |
Ancestry in Dewey Beach
The most populous ancestries reported in Dewey Beach are Irish (102 | 28.4%), German (67 | 18.7%), Italian (46 | 12.8%), American (43 | 12.0%), and English (38 | 10.6%), together accounting for 82.4% of all Dewey Beach residents.
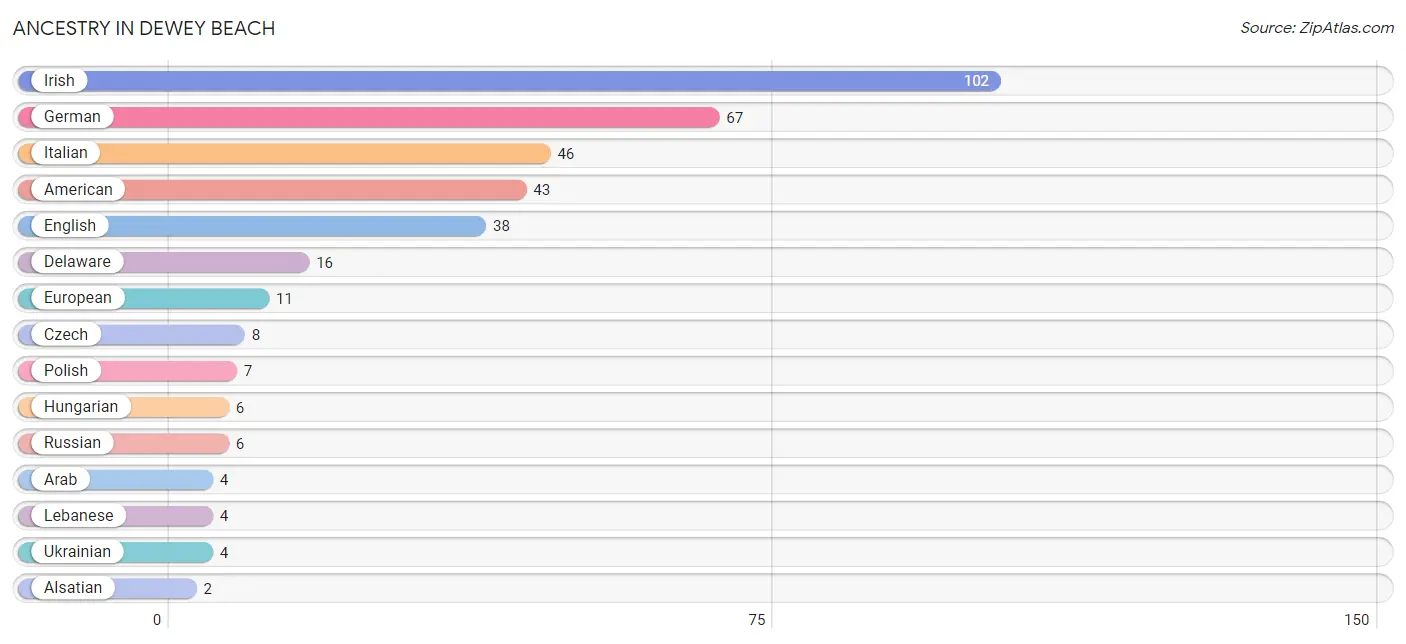
| Ancestry | # Population | % Population |
| Alsatian | 2 | 0.6% |
| American | 43 | 12.0% |
| Arab | 4 | 1.1% |
| Czech | 8 | 2.2% |
| Danish | 1 | 0.3% |
| Delaware | 16 | 4.5% |
| Eastern European | 2 | 0.6% |
| English | 38 | 10.6% |
| European | 11 | 3.1% |
| French | 2 | 0.6% |
| German | 67 | 18.7% |
| Greek | 2 | 0.6% |
| Hungarian | 6 | 1.7% |
| Irish | 102 | 28.4% |
| Italian | 46 | 12.8% |
| Lebanese | 4 | 1.1% |
| Mexican | 2 | 0.6% |
| Northern European | 1 | 0.3% |
| Polish | 7 | 1.9% |
| Puerto Rican | 2 | 0.6% |
| Russian | 6 | 1.7% |
| Scandinavian | 2 | 0.6% |
| Scottish | 2 | 0.6% |
| Spanish | 2 | 0.6% |
| Swedish | 2 | 0.6% |
| Swiss | 2 | 0.6% |
| Ukrainian | 4 | 1.1% | View All 27 Rows |
Immigrants in Dewey Beach
The most numerous immigrant groups reported in Dewey Beach came from Europe (3 | 0.8%), Germany (3 | 0.8%), Western Europe (3 | 0.8%), Africa (2 | 0.6%), and Asia (2 | 0.6%), together accounting for 3.6% of all Dewey Beach residents.
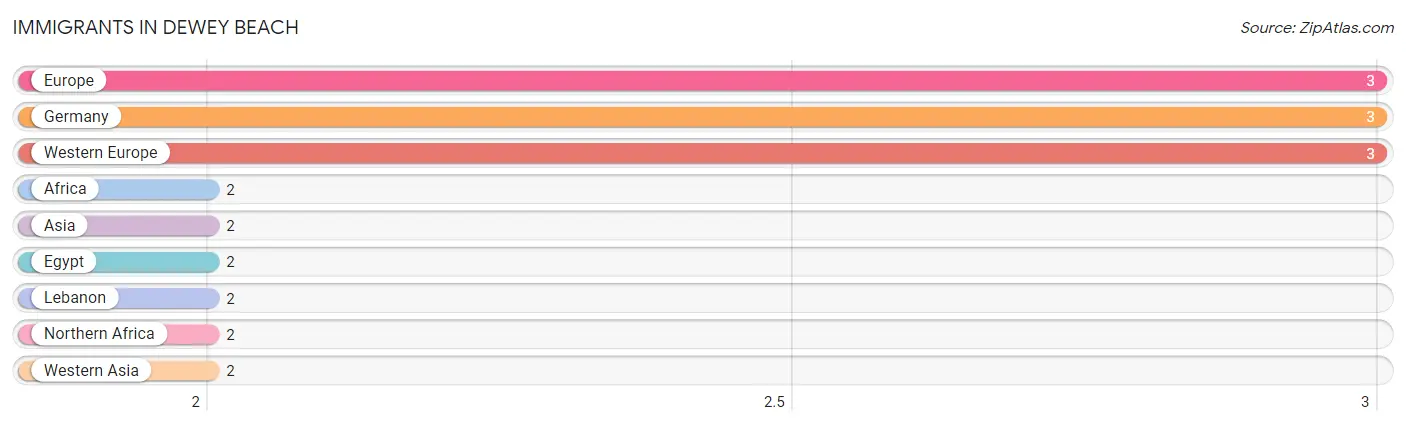
| Immigration Origin | # Population | % Population |
| Africa | 2 | 0.6% |
| Asia | 2 | 0.6% |
| Egypt | 2 | 0.6% |
| Europe | 3 | 0.8% |
| Germany | 3 | 0.8% |
| Lebanon | 2 | 0.6% |
| Northern Africa | 2 | 0.6% |
| Western Asia | 2 | 0.6% |
| Western Europe | 3 | 0.8% | View All 9 Rows |
Sex and Age in Dewey Beach
Sex and Age in Dewey Beach
The most populous age groups in Dewey Beach are 55 to 59 Years (25 | 14.8%) for men and 55 to 59 Years (43 | 22.6%) for women.
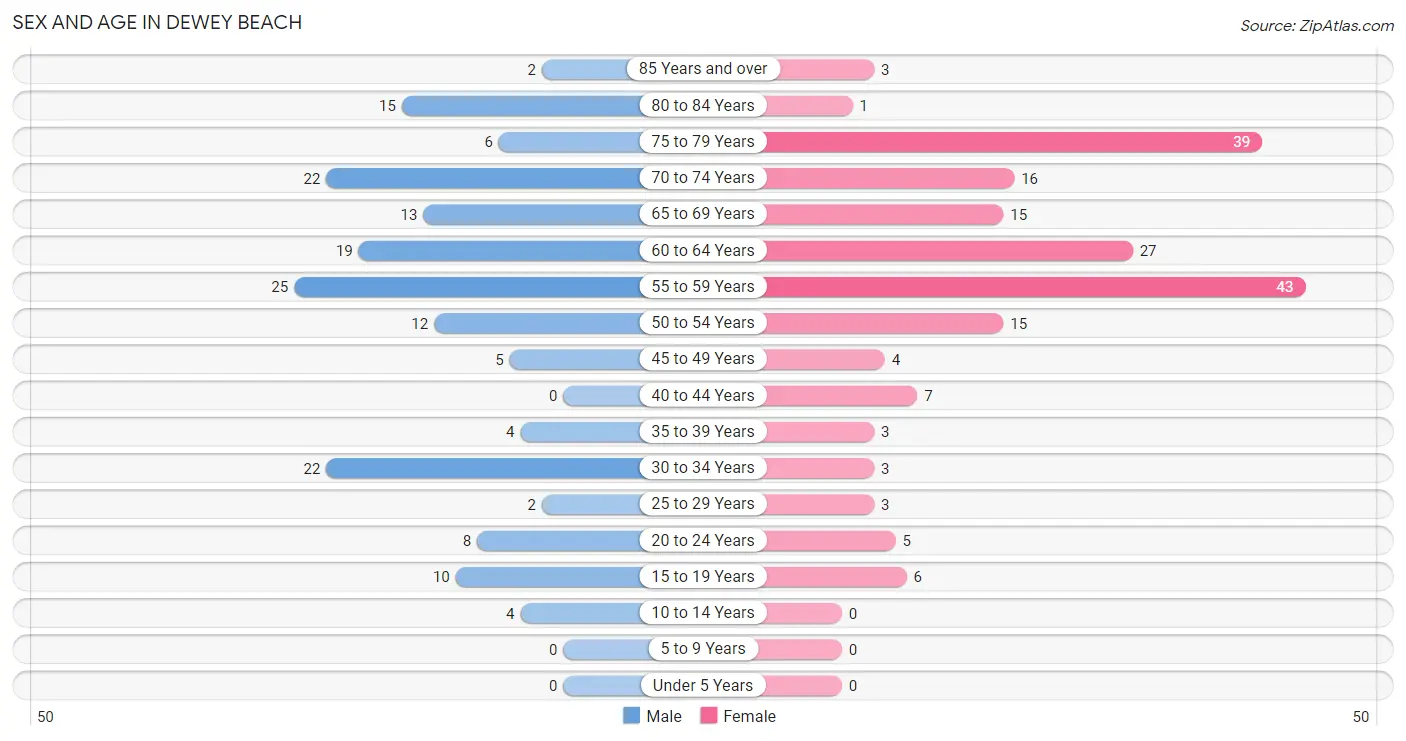
| Age Bracket | Male | Female |
| Under 5 Years | 0 (0.0%) | 0 (0.0%) |
| 5 to 9 Years | 0 (0.0%) | 0 (0.0%) |
| 10 to 14 Years | 4 (2.4%) | 0 (0.0%) |
| 15 to 19 Years | 10 (5.9%) | 6 (3.2%) |
| 20 to 24 Years | 8 (4.7%) | 5 (2.6%) |
| 25 to 29 Years | 2 (1.2%) | 3 (1.6%) |
| 30 to 34 Years | 22 (13.0%) | 3 (1.6%) |
| 35 to 39 Years | 4 (2.4%) | 3 (1.6%) |
| 40 to 44 Years | 0 (0.0%) | 7 (3.7%) |
| 45 to 49 Years | 5 (3.0%) | 4 (2.1%) |
| 50 to 54 Years | 12 (7.1%) | 15 (7.9%) |
| 55 to 59 Years | 25 (14.8%) | 43 (22.6%) |
| 60 to 64 Years | 19 (11.2%) | 27 (14.2%) |
| 65 to 69 Years | 13 (7.7%) | 15 (7.9%) |
| 70 to 74 Years | 22 (13.0%) | 16 (8.4%) |
| 75 to 79 Years | 6 (3.5%) | 39 (20.5%) |
| 80 to 84 Years | 15 (8.9%) | 1 (0.5%) |
| 85 Years and over | 2 (1.2%) | 3 (1.6%) |
| Total | 169 (100.0%) | 190 (100.0%) |
Families and Households in Dewey Beach
Median Family Size in Dewey Beach
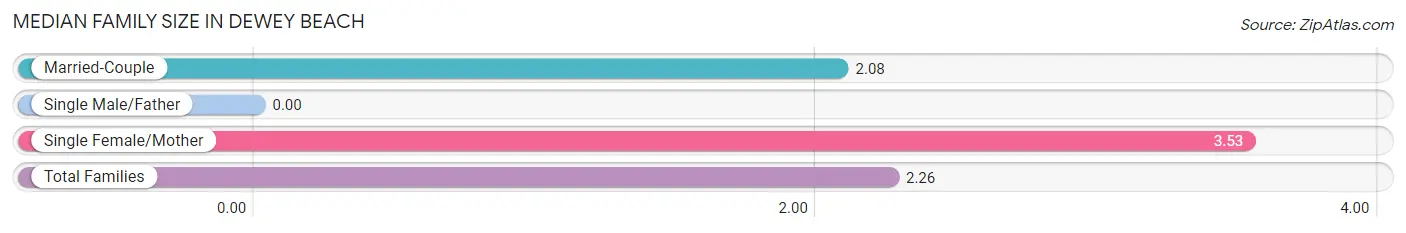
| Family Type | # Families | Family Size |
| Married-Couple | 106 (87.6%) | 2.08 |
| Single Male/Father | 0 (0.0%) | - |
| Single Female/Mother | 15 (12.4%) | 3.53 |
| Total Families | 121 (100.0%) | 2.26 |
Median Household Size in Dewey Beach
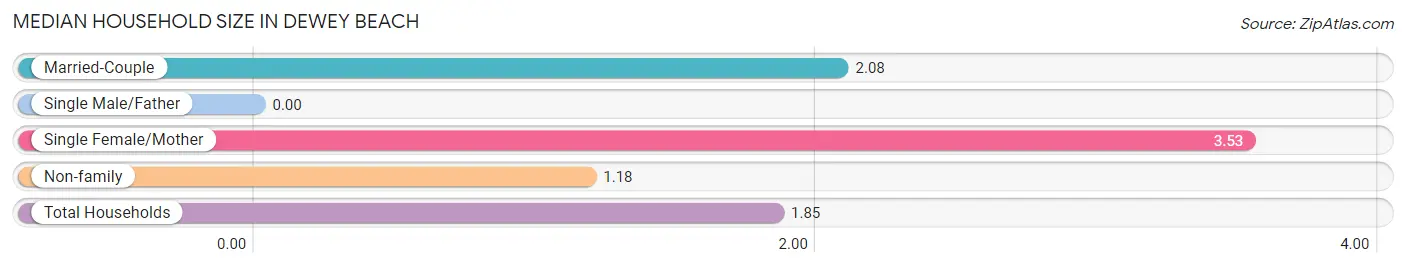
| Household Type | # Households | Household Size |
| Married-Couple | 106 (54.6%) | 2.08 |
| Single Male/Father | 0 (0.0%) | - |
| Single Female/Mother | 15 (7.7%) | 3.53 |
| Non-family | 73 (37.6%) | 1.18 |
| Total Households | 194 (100.0%) | 1.85 |
Household Size by Marriage Status in Dewey Beach
Out of a total of 194 households in Dewey Beach, 121 (62.4%) are family households, while 73 (37.6%) are nonfamily households. The most numerous type of family households are 2-person households, comprising 106, and the most common type of nonfamily households are 1-person households, comprising 61.
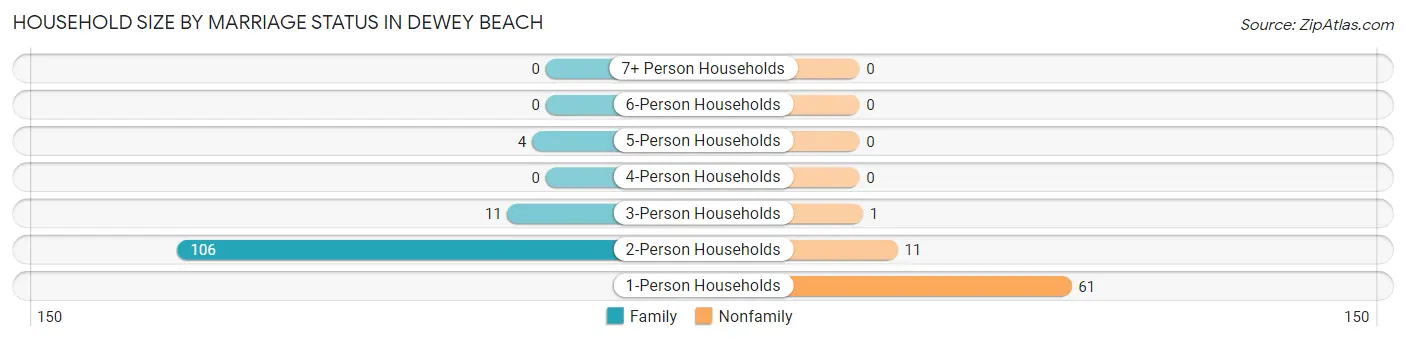
| Household Size | Family Households | Nonfamily Households |
| 1-Person Households | - | 61 (31.4%) |
| 2-Person Households | 106 (54.6%) | 11 (5.7%) |
| 3-Person Households | 11 (5.7%) | 1 (0.5%) |
| 4-Person Households | 0 (0.0%) | 0 (0.0%) |
| 5-Person Households | 4 (2.1%) | 0 (0.0%) |
| 6-Person Households | 0 (0.0%) | 0 (0.0%) |
| 7+ Person Households | 0 (0.0%) | 0 (0.0%) |
| Total | 121 (62.4%) | 73 (37.6%) |
Female Fertility in Dewey Beach
Fertility by Age in Dewey Beach
| Age Bracket | Women with Births | Births / 1,000 Women |
| 15 to 19 years | 0 (0.0%) | 0.0 |
| 20 to 34 years | 0 (0.0%) | 0.0 |
| 35 to 50 years | 0 (0.0%) | 0.0 |
| Total | 0 (0.0%) | 0.0 |
Fertility by Age by Marriage Status in Dewey Beach
| Age Bracket | Married | Unmarried |
| 15 to 19 years | 0 (0.0%) | 0 (0.0%) |
| 20 to 34 years | 0 (0.0%) | 0 (0.0%) |
| 35 to 50 years | 0 (0.0%) | 0 (0.0%) |
| Total | 0 (0.0%) | 0 (0.0%) |
Fertility by Education in Dewey Beach
| Educational Attainment | Women with Births | Births / 1,000 Women |
| Less than High School | 0 (0.0%) | 0.0 |
| High School Diploma | 0 (0.0%) | 0.0 |
| College or Associate's Degree | 0 (0.0%) | 0.0 |
| Bachelor's Degree | 0 (0.0%) | 0.0 |
| Graduate Degree | 0 (0.0%) | 0.0 |
| Total | 0 (0.0%) | 0.0 |
Fertility by Education by Marriage Status in Dewey Beach
| Educational Attainment | Married | Unmarried |
| Less than High School | 0 (0.0%) | 0 (0.0%) |
| High School Diploma | 0 (0.0%) | 0 (0.0%) |
| College or Associate's Degree | 0 (0.0%) | 0 (0.0%) |
| Bachelor's Degree | 0 (0.0%) | 0 (0.0%) |
| Graduate Degree | 0 (0.0%) | 0 (0.0%) |
| Total | 0 (0.0%) | 0 (0.0%) |
Employment Characteristics in Dewey Beach
Employment by Class of Employer in Dewey Beach
Among the 173 employed individuals in Dewey Beach, private company employees (121 | 69.9%), self-employed (incorporated) (12 | 6.9%), and not-for-profit organizations (12 | 6.9%) make up the most common classes of employment.
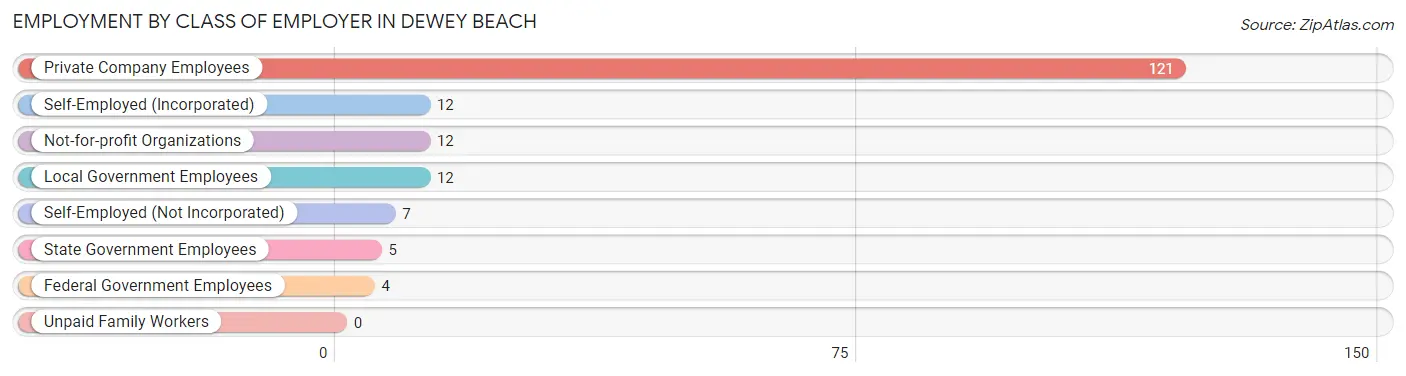
| Employer Class | # Employees | % Employees |
| Private Company Employees | 121 | 69.9% |
| Self-Employed (Incorporated) | 12 | 6.9% |
| Self-Employed (Not Incorporated) | 7 | 4.1% |
| Not-for-profit Organizations | 12 | 6.9% |
| Local Government Employees | 12 | 6.9% |
| State Government Employees | 5 | 2.9% |
| Federal Government Employees | 4 | 2.3% |
| Unpaid Family Workers | 0 | 0.0% |
| Total | 173 | 100.0% |
Employment Status by Age in Dewey Beach
According to the labor force statistics for Dewey Beach, out of the total population over 16 years of age (349), 50.4% or 176 individuals are in the labor force, with 1.7% or 3 of them unemployed. The age group with the highest labor force participation rate is 16 to 19 years, with 100.0% or 10 individuals in the labor force. Within the labor force, the 60 to 64 years age range has the highest percentage of unemployed individuals, with 15.0% or 3 of them being unemployed.
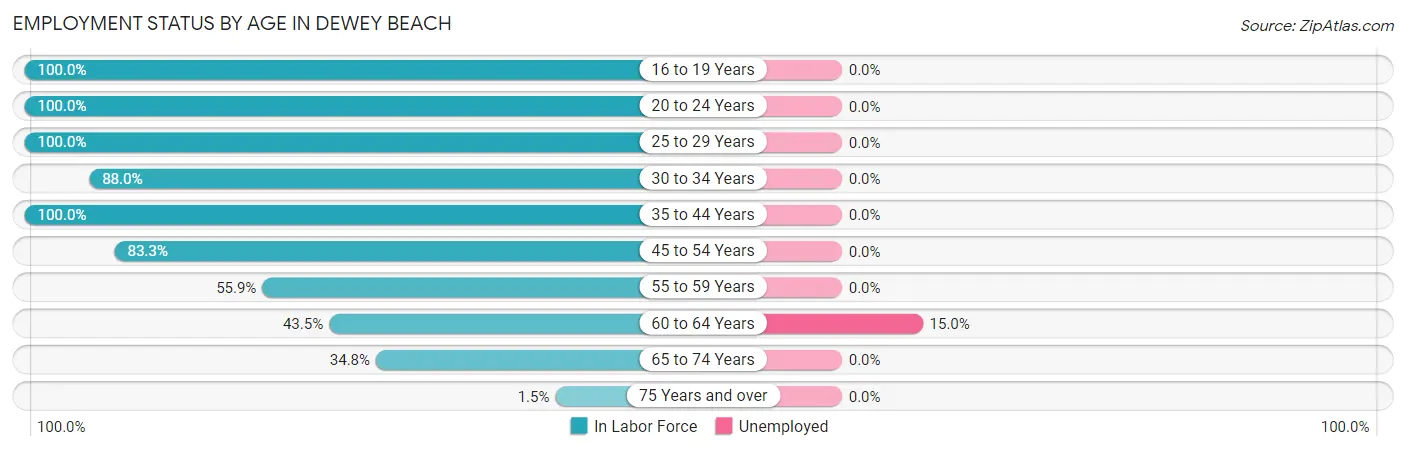
| Age Bracket | In Labor Force | Unemployed |
| 16 to 19 Years | 10 (100.0%) | 0 (0.0%) |
| 20 to 24 Years | 13 (100.0%) | 0 (0.0%) |
| 25 to 29 Years | 5 (100.0%) | 0 (0.0%) |
| 30 to 34 Years | 22 (88.0%) | 0 (0.0%) |
| 35 to 44 Years | 14 (100.0%) | 0 (0.0%) |
| 45 to 54 Years | 30 (83.3%) | 0 (0.0%) |
| 55 to 59 Years | 38 (55.9%) | 0 (0.0%) |
| 60 to 64 Years | 20 (43.5%) | 3 (15.0%) |
| 65 to 74 Years | 23 (34.8%) | 0 (0.0%) |
| 75 Years and over | 1 (1.5%) | 0 (0.0%) |
| Total | 176 (50.4%) | 3 (1.7%) |
Employment Status by Educational Attainment in Dewey Beach
According to labor force statistics for Dewey Beach, 66.5% of individuals (129) out of the total population between 25 and 64 years of age (194) are in the labor force, with 2.3% or 3 of them being unemployed. The group with the highest labor force participation rate are those with the educational attainment of college / associate degree, with 80.0% or 32 individuals in the labor force. Within the labor force, individuals with college / associate degree education have the highest percentage of unemployment, with 9.4% or 3 of them being unemployed.
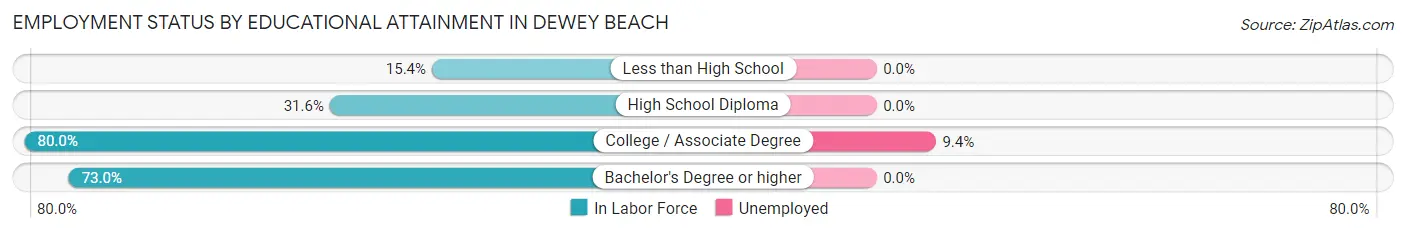
| Educational Attainment | In Labor Force | Unemployed |
| Less than High School | 2 (15.4%) | 0 (0.0%) |
| High School Diploma | 6 (31.6%) | 0 (0.0%) |
| College / Associate Degree | 32 (80.0%) | 4 (9.4%) |
| Bachelor's Degree or higher | 89 (73.0%) | 0 (0.0%) |
| Total | 129 (66.5%) | 4 (2.3%) |
Employment Occupations by Sex in Dewey Beach
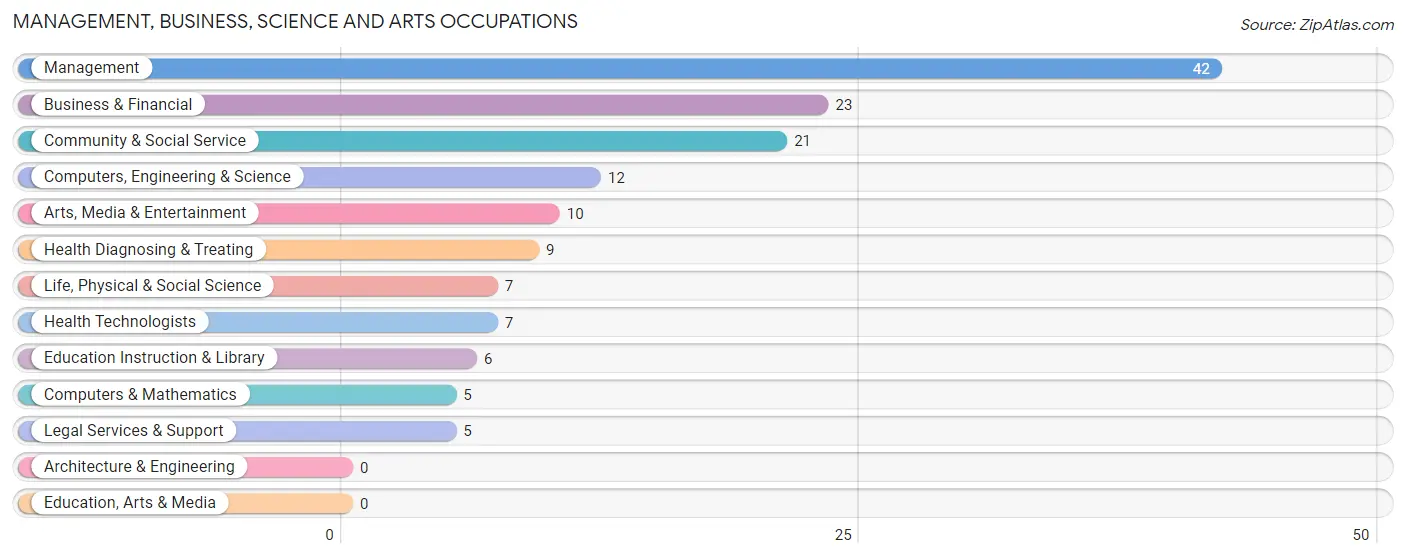
Management, Business, Science and Arts Occupations
The most common Management, Business, Science and Arts occupations in Dewey Beach are Management (42 | 24.3%), Business & Financial (23 | 13.3%), Community & Social Service (21 | 12.1%), Computers, Engineering & Science (12 | 6.9%), and Arts, Media & Entertainment (10 | 5.8%).
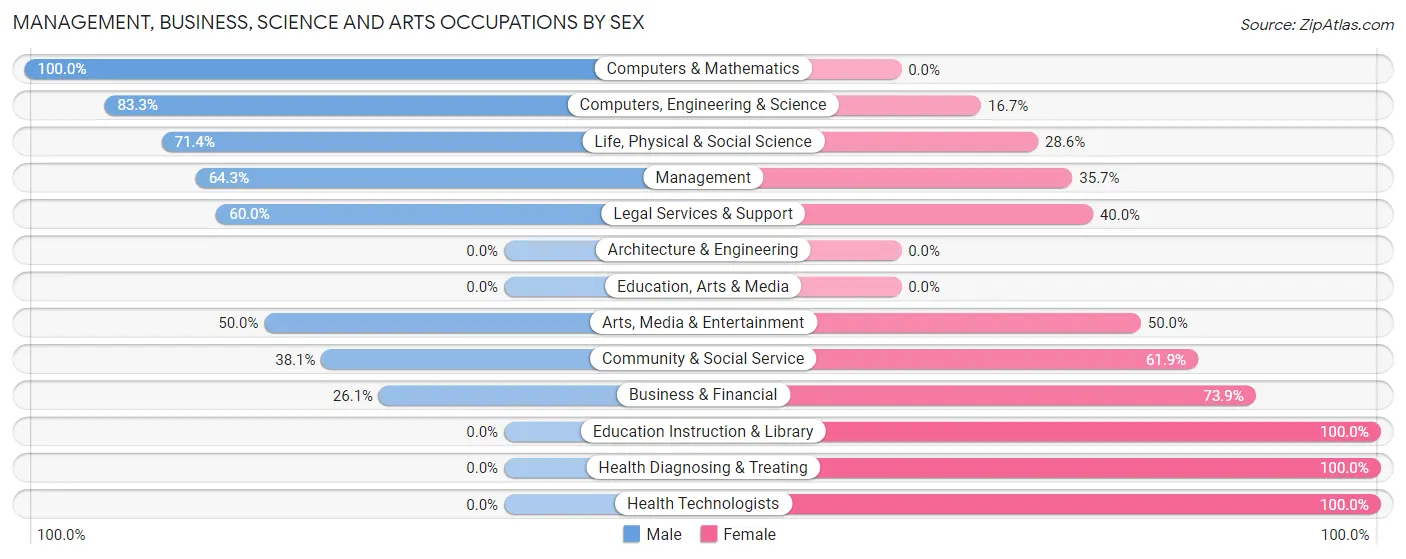
Management, Business, Science and Arts Occupations by Sex
Within the Management, Business, Science and Arts occupations in Dewey Beach, the most male-oriented occupations are Computers & Mathematics (100.0%), Computers, Engineering & Science (83.3%), and Life, Physical & Social Science (71.4%), while the most female-oriented occupations are Education Instruction & Library (100.0%), Health Diagnosing & Treating (100.0%), and Health Technologists (100.0%).
| Occupation | Male | Female |
| Management | 27 (64.3%) | 15 (35.7%) |
| Business & Financial | 6 (26.1%) | 17 (73.9%) |
| Computers, Engineering & Science | 10 (83.3%) | 2 (16.7%) |
| Computers & Mathematics | 5 (100.0%) | 0 (0.0%) |
| Architecture & Engineering | 0 (0.0%) | 0 (0.0%) |
| Life, Physical & Social Science | 5 (71.4%) | 2 (28.6%) |
| Community & Social Service | 8 (38.1%) | 13 (61.9%) |
| Education, Arts & Media | 0 (0.0%) | 0 (0.0%) |
| Legal Services & Support | 3 (60.0%) | 2 (40.0%) |
| Education Instruction & Library | 0 (0.0%) | 6 (100.0%) |
| Arts, Media & Entertainment | 5 (50.0%) | 5 (50.0%) |
| Health Diagnosing & Treating | 0 (0.0%) | 9 (100.0%) |
| Health Technologists | 0 (0.0%) | 7 (100.0%) |
| Total (Category) | 51 (47.7%) | 56 (52.3%) |
| Total (Overall) | 91 (52.6%) | 82 (47.4%) |
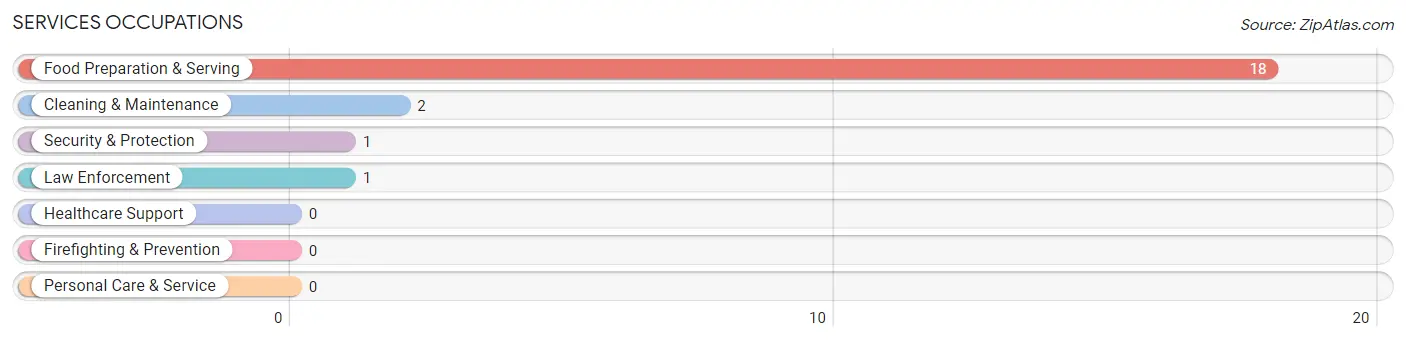
Services Occupations
The most common Services occupations in Dewey Beach are Food Preparation & Serving (18 | 10.4%), Cleaning & Maintenance (2 | 1.2%), Security & Protection (1 | 0.6%), and Law Enforcement (1 | 0.6%).
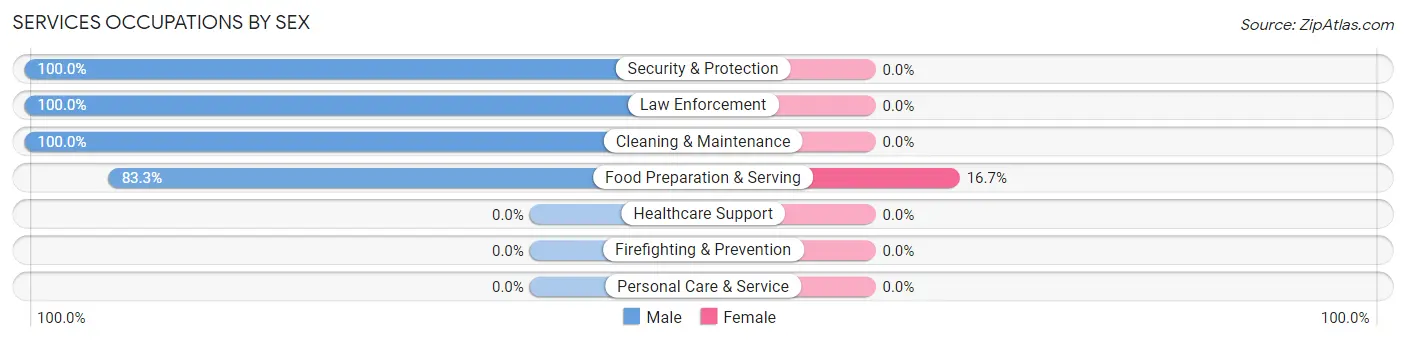
Services Occupations by Sex
| Occupation | Male | Female |
| Healthcare Support | 0 (0.0%) | 0 (0.0%) |
| Security & Protection | 1 (100.0%) | 0 (0.0%) |
| Firefighting & Prevention | 0 (0.0%) | 0 (0.0%) |
| Law Enforcement | 1 (100.0%) | 0 (0.0%) |
| Food Preparation & Serving | 15 (83.3%) | 3 (16.7%) |
| Cleaning & Maintenance | 2 (100.0%) | 0 (0.0%) |
| Personal Care & Service | 0 (0.0%) | 0 (0.0%) |
| Total (Category) | 18 (85.7%) | 3 (14.3%) |
| Total (Overall) | 91 (52.6%) | 82 (47.4%) |
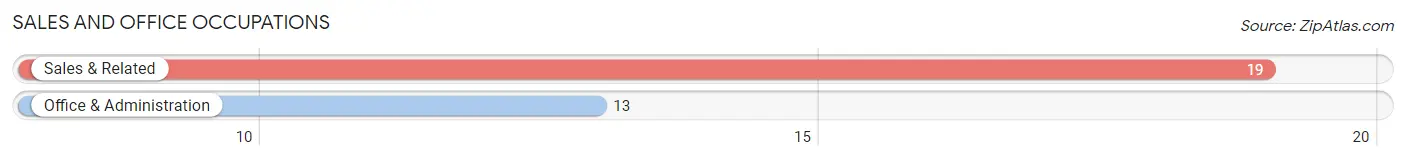
Sales and Office Occupations
The most common Sales and Office occupations in Dewey Beach are Sales & Related (19 | 11.0%), and Office & Administration (13 | 7.5%).
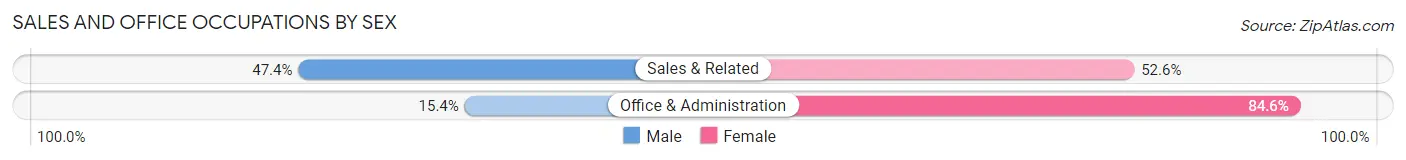
Sales and Office Occupations by Sex
| Occupation | Male | Female |
| Sales & Related | 9 (47.4%) | 10 (52.6%) |
| Office & Administration | 2 (15.4%) | 11 (84.6%) |
| Total (Category) | 11 (34.4%) | 21 (65.6%) |
| Total (Overall) | 91 (52.6%) | 82 (47.4%) |
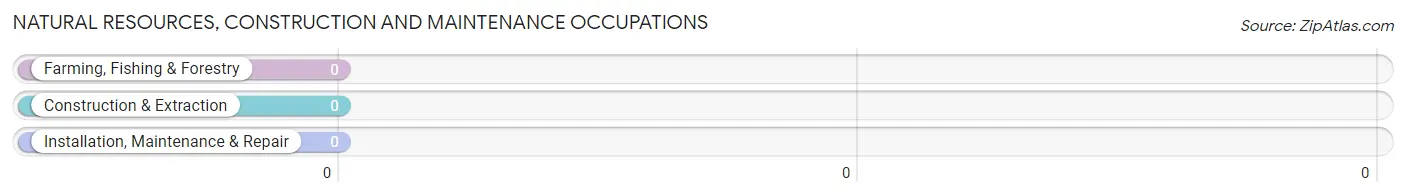
Natural Resources, Construction and Maintenance Occupations
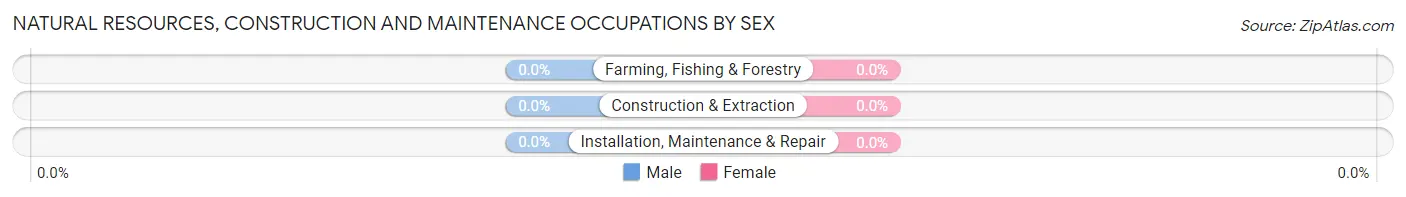
Natural Resources, Construction and Maintenance Occupations by Sex
| Occupation | Male | Female |
| Farming, Fishing & Forestry | 0 (0.0%) | 0 (0.0%) |
| Construction & Extraction | 0 (0.0%) | 0 (0.0%) |
| Installation, Maintenance & Repair | 0 (0.0%) | 0 (0.0%) |
| Total (Category) | 0 (0.0%) | 0 (0.0%) |
| Total (Overall) | 91 (52.6%) | 82 (47.4%) |
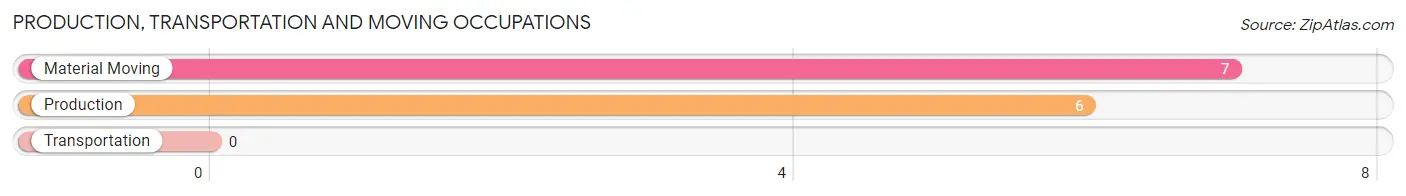
Production, Transportation and Moving Occupations
The most common Production, Transportation and Moving occupations in Dewey Beach are Material Moving (7 | 4.1%), and Production (6 | 3.5%).
Production, Transportation and Moving Occupations by Sex
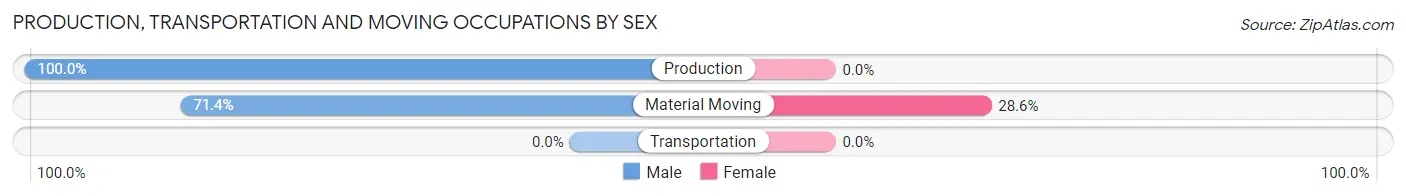
| Occupation | Male | Female |
| Production | 6 (100.0%) | 0 (0.0%) |
| Transportation | 0 (0.0%) | 0 (0.0%) |
| Material Moving | 5 (71.4%) | 2 (28.6%) |
| Total (Category) | 11 (84.6%) | 2 (15.4%) |
| Total (Overall) | 91 (52.6%) | 82 (47.4%) |
Employment Industries by Sex in Dewey Beach
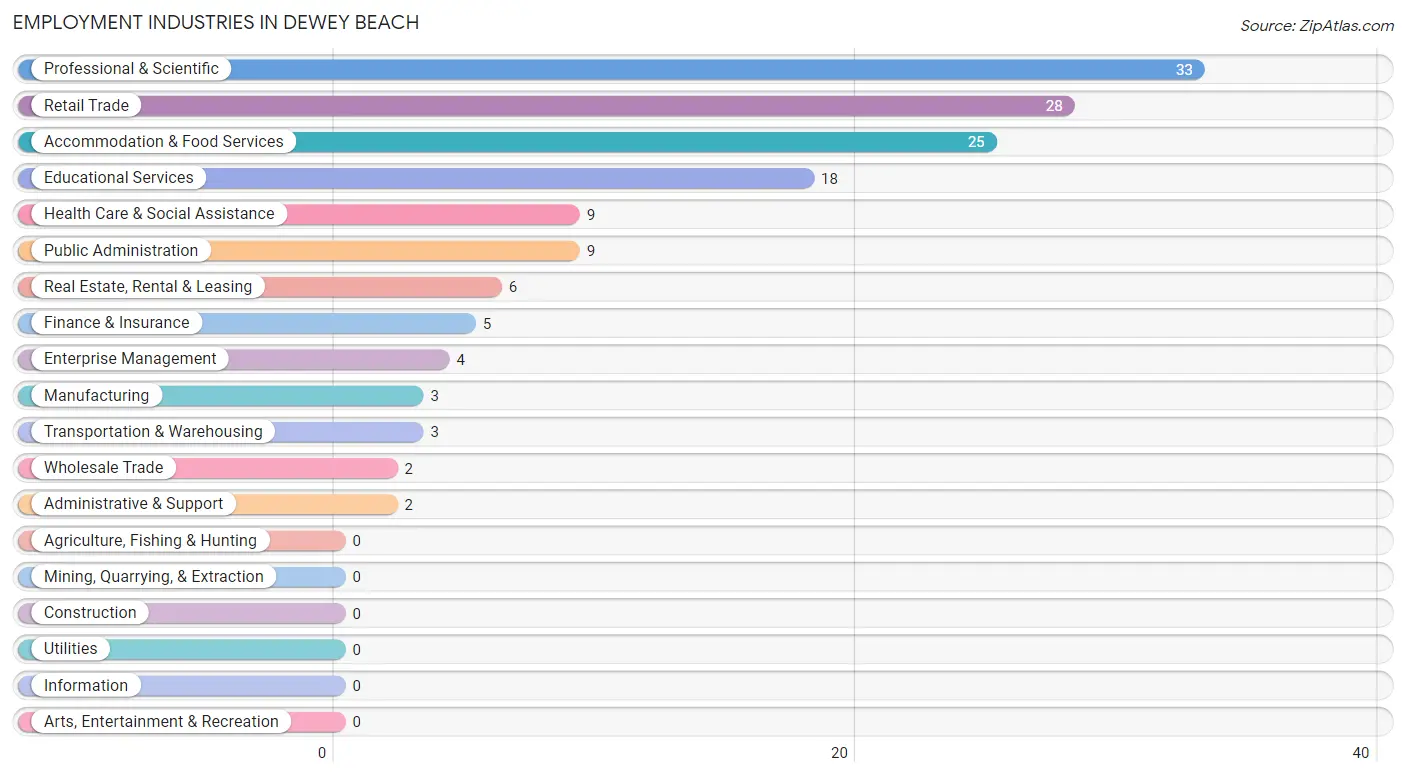
Employment Industries in Dewey Beach
The major employment industries in Dewey Beach include Professional & Scientific (33 | 19.1%), Retail Trade (28 | 16.2%), Accommodation & Food Services (25 | 14.4%), Educational Services (18 | 10.4%), and Health Care & Social Assistance (9 | 5.2%).
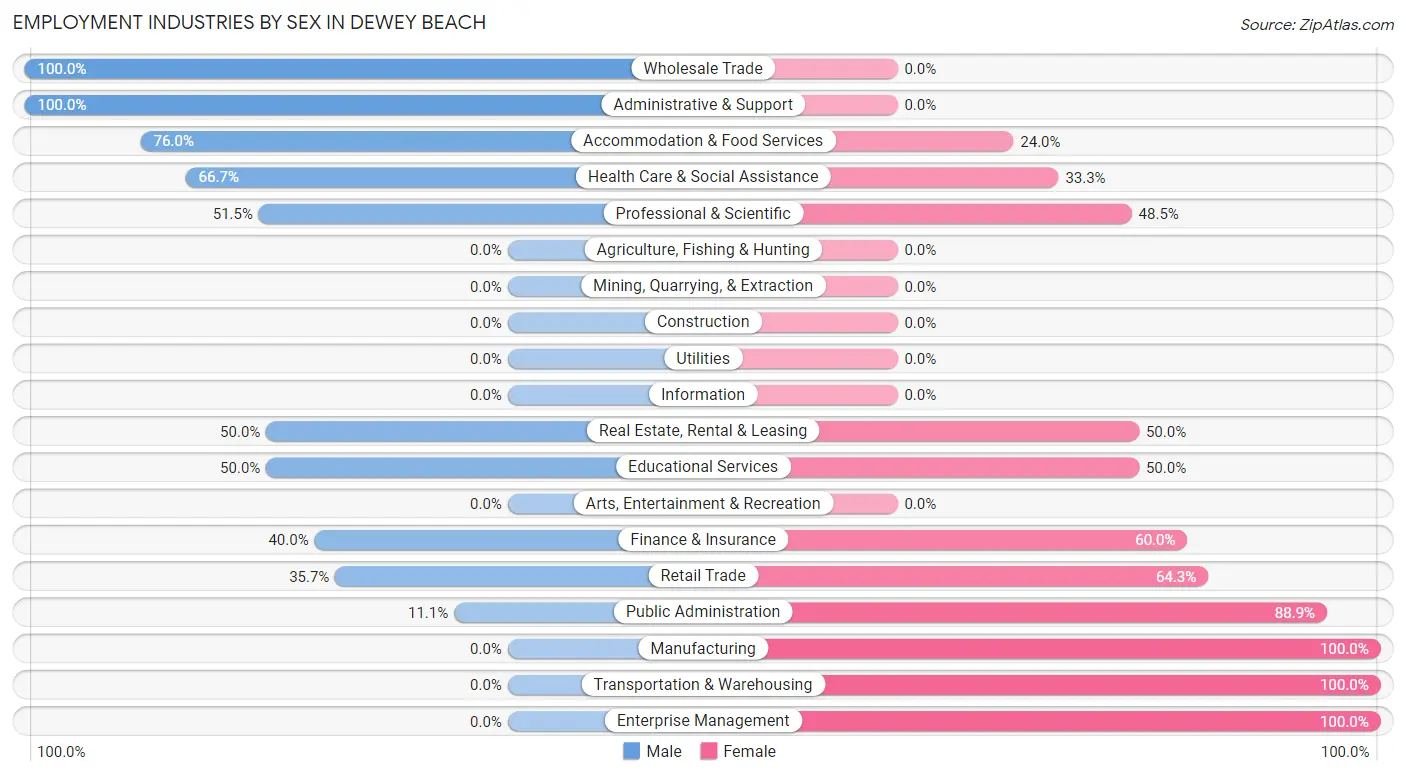
Employment Industries by Sex in Dewey Beach
The Dewey Beach industries that see more men than women are Wholesale Trade (100.0%), Administrative & Support (100.0%), and Accommodation & Food Services (76.0%), whereas the industries that tend to have a higher number of women are Manufacturing (100.0%), Transportation & Warehousing (100.0%), and Enterprise Management (100.0%).
| Industry | Male | Female |
| Agriculture, Fishing & Hunting | 0 (0.0%) | 0 (0.0%) |
| Mining, Quarrying, & Extraction | 0 (0.0%) | 0 (0.0%) |
| Construction | 0 (0.0%) | 0 (0.0%) |
| Manufacturing | 0 (0.0%) | 3 (100.0%) |
| Wholesale Trade | 2 (100.0%) | 0 (0.0%) |
| Retail Trade | 10 (35.7%) | 18 (64.3%) |
| Transportation & Warehousing | 0 (0.0%) | 3 (100.0%) |
| Utilities | 0 (0.0%) | 0 (0.0%) |
| Information | 0 (0.0%) | 0 (0.0%) |
| Finance & Insurance | 2 (40.0%) | 3 (60.0%) |
| Real Estate, Rental & Leasing | 3 (50.0%) | 3 (50.0%) |
| Professional & Scientific | 17 (51.5%) | 16 (48.5%) |
| Enterprise Management | 0 (0.0%) | 4 (100.0%) |
| Administrative & Support | 2 (100.0%) | 0 (0.0%) |
| Educational Services | 9 (50.0%) | 9 (50.0%) |
| Health Care & Social Assistance | 6 (66.7%) | 3 (33.3%) |
| Arts, Entertainment & Recreation | 0 (0.0%) | 0 (0.0%) |
| Accommodation & Food Services | 19 (76.0%) | 6 (24.0%) |
| Public Administration | 1 (11.1%) | 8 (88.9%) |
| Total | 91 (52.6%) | 82 (47.4%) |
Education in Dewey Beach
School Enrollment in Dewey Beach
The most common levels of schooling among the 48 students in Dewey Beach are college / undergraduate (24 | 50.0%), high school (16 | 33.3%), and middle school (4 | 8.3%).
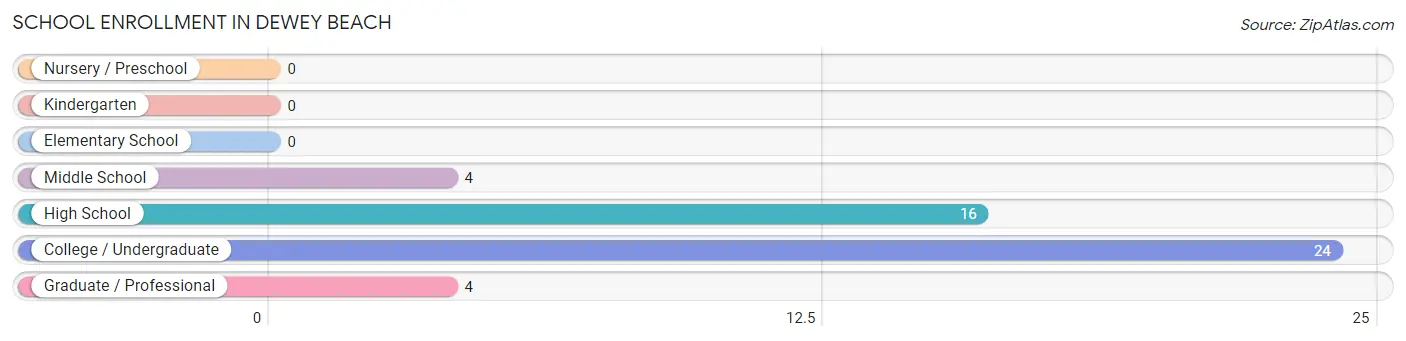
| School Level | # Students | % Students |
| Nursery / Preschool | 0 | 0.0% |
| Kindergarten | 0 | 0.0% |
| Elementary School | 0 | 0.0% |
| Middle School | 4 | 8.3% |
| High School | 16 | 33.3% |
| College / Undergraduate | 24 | 50.0% |
| Graduate / Professional | 4 | 8.3% |
| Total | 48 | 100.0% |
School Enrollment by Age by Funding Source in Dewey Beach
Out of a total of 48 students who are enrolled in schools in Dewey Beach, 3 (6.3%) attend a private institution, while the remaining 45 (93.7%) are enrolled in public schools. The age group of 20 to 24 year olds has the highest likelihood of being enrolled in private schools, with 3 (37.5% in the age bracket) enrolled. Conversely, the age group of 10 to 14 year olds has the lowest likelihood of being enrolled in a private school, with 4 (100.0% in the age bracket) attending a public institution.
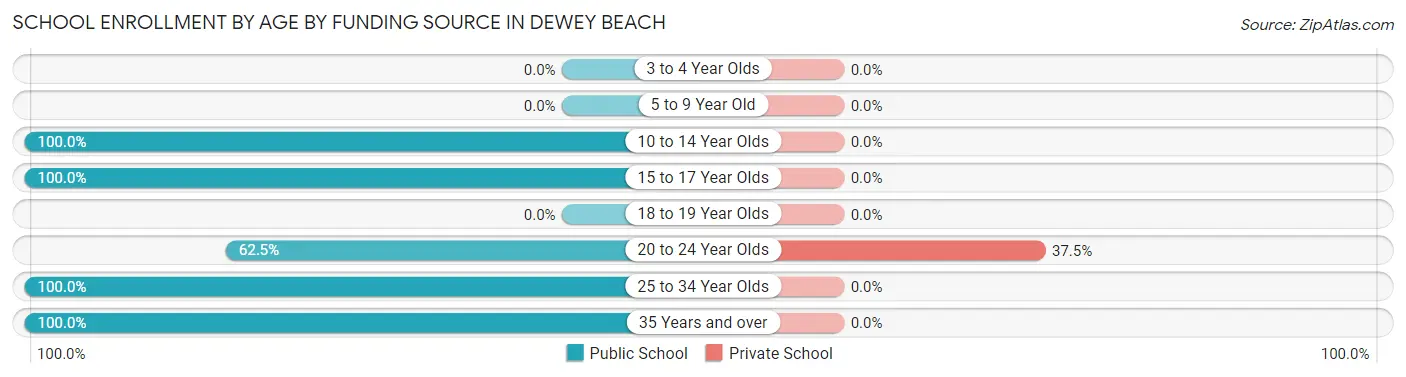
| Age Bracket | Public School | Private School |
| 3 to 4 Year Olds | 0 (0.0%) | 0 (0.0%) |
| 5 to 9 Year Old | 0 (0.0%) | 0 (0.0%) |
| 10 to 14 Year Olds | 4 (100.0%) | 0 (0.0%) |
| 15 to 17 Year Olds | 16 (100.0%) | 0 (0.0%) |
| 18 to 19 Year Olds | 0 (0.0%) | 0 (0.0%) |
| 20 to 24 Year Olds | 5 (62.5%) | 3 (37.5%) |
| 25 to 34 Year Olds | 16 (100.0%) | 0 (0.0%) |
| 35 Years and over | 4 (100.0%) | 0 (0.0%) |
| Total | 45 (93.8%) | 3 (6.3%) |
Educational Attainment by Field of Study in Dewey Beach
Business (57 | 24.4%), social sciences (45 | 19.2%), bio, nature & agricultural (21 | 9.0%), education (18 | 7.7%), and computers & mathematics (17 | 7.3%) are the most common fields of study among 234 individuals in Dewey Beach who have obtained a bachelor's degree or higher.
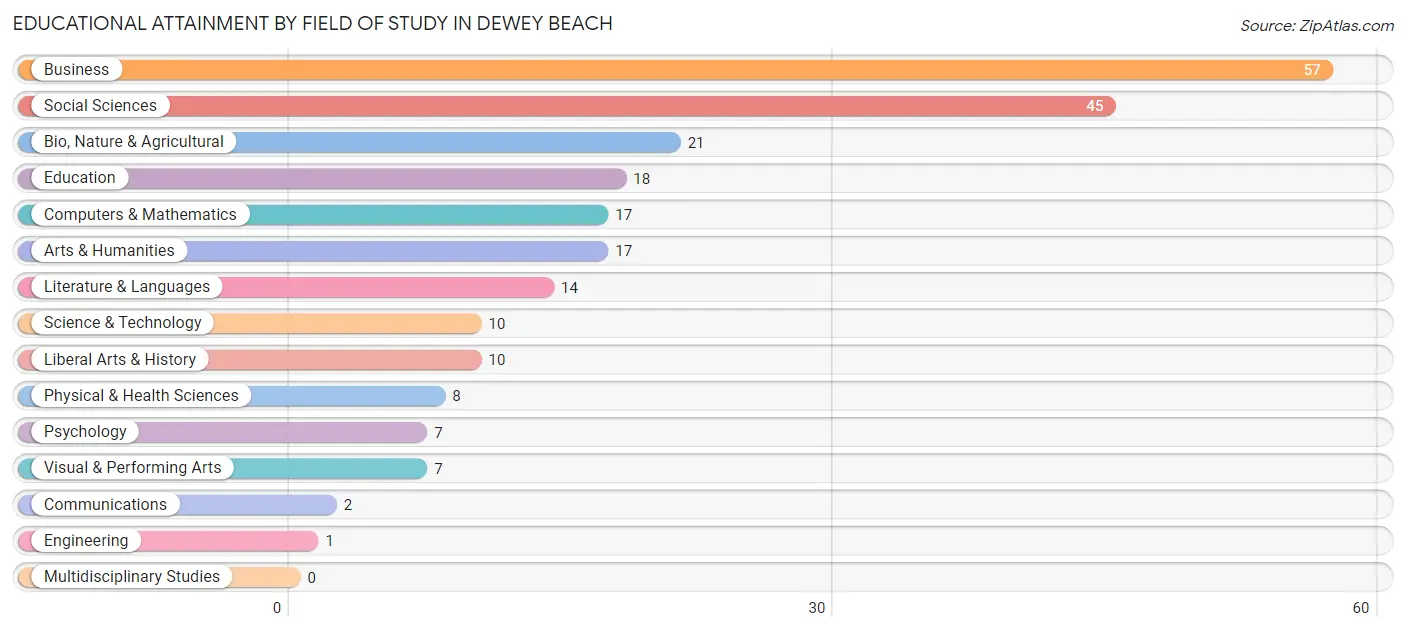
| Field of Study | # Graduates | % Graduates |
| Computers & Mathematics | 17 | 7.3% |
| Bio, Nature & Agricultural | 21 | 9.0% |
| Physical & Health Sciences | 8 | 3.4% |
| Psychology | 7 | 3.0% |
| Social Sciences | 45 | 19.2% |
| Engineering | 1 | 0.4% |
| Multidisciplinary Studies | 0 | 0.0% |
| Science & Technology | 10 | 4.3% |
| Business | 57 | 24.4% |
| Education | 18 | 7.7% |
| Literature & Languages | 14 | 6.0% |
| Liberal Arts & History | 10 | 4.3% |
| Visual & Performing Arts | 7 | 3.0% |
| Communications | 2 | 0.9% |
| Arts & Humanities | 17 | 7.3% |
| Total | 234 | 100.0% |
Transportation & Commute in Dewey Beach
Vehicle Availability by Sex in Dewey Beach
The most prevalent vehicle ownership categories in Dewey Beach are males with 2 vehicles (41, accounting for 45.1%) and females with 2 vehicles (52, making up 50.0%).
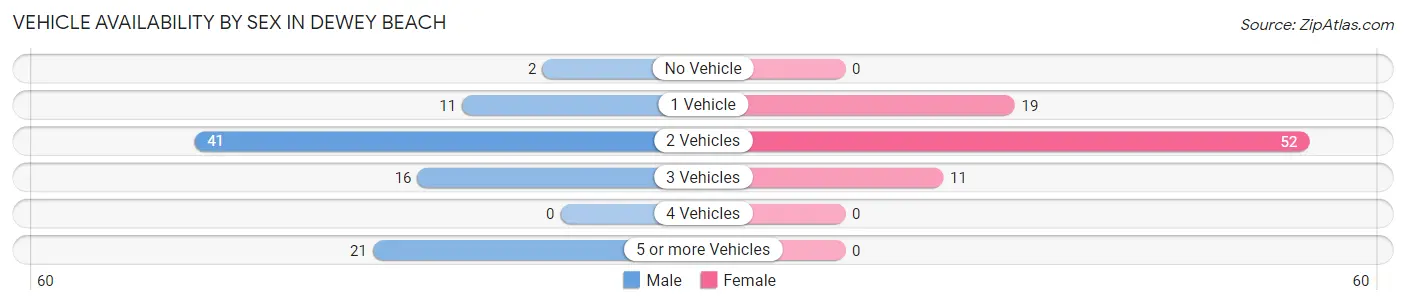
| Vehicles Available | Male | Female |
| No Vehicle | 2 (2.2%) | 0 (0.0%) |
| 1 Vehicle | 11 (12.1%) | 19 (23.2%) |
| 2 Vehicles | 41 (45.1%) | 52 (63.4%) |
| 3 Vehicles | 16 (17.6%) | 11 (13.4%) |
| 4 Vehicles | 0 (0.0%) | 0 (0.0%) |
| 5 or more Vehicles | 21 (23.1%) | 0 (0.0%) |
| Total | 91 (100.0%) | 82 (100.0%) |
Commute Time in Dewey Beach
The most frequently occuring commute durations in Dewey Beach are 5 to 9 minutes (28 commuters, 24.8%), 60 to 89 minutes (14 commuters, 12.4%), and 20 to 24 minutes (13 commuters, 11.5%).
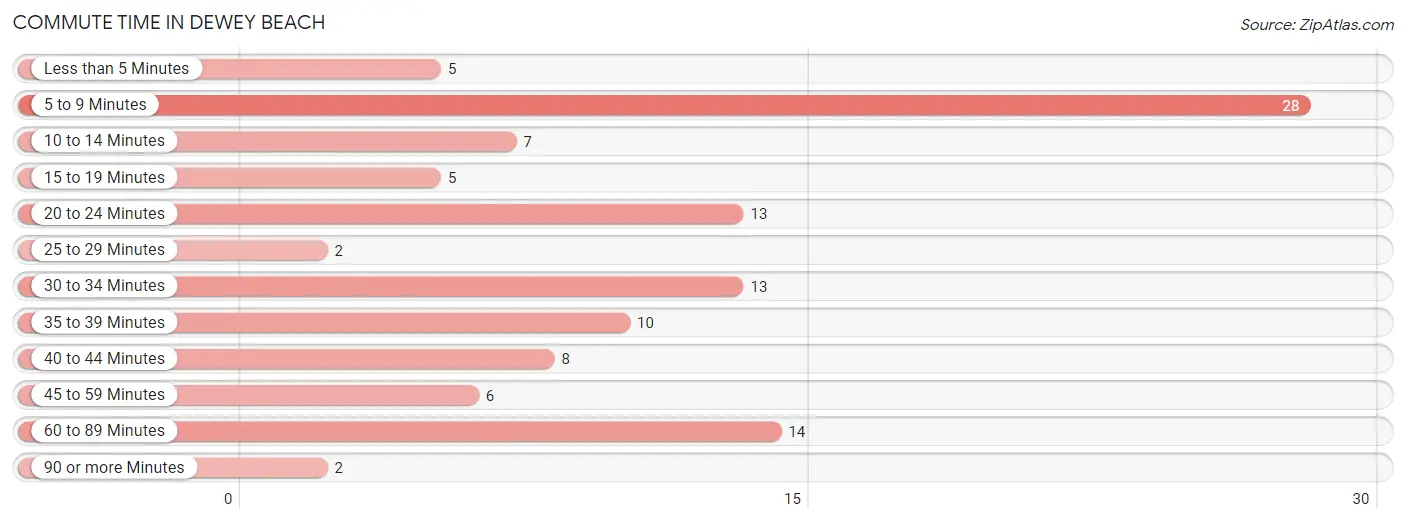
| Commute Time | # Commuters | % Commuters |
| Less than 5 Minutes | 5 | 4.4% |
| 5 to 9 Minutes | 28 | 24.8% |
| 10 to 14 Minutes | 7 | 6.2% |
| 15 to 19 Minutes | 5 | 4.4% |
| 20 to 24 Minutes | 13 | 11.5% |
| 25 to 29 Minutes | 2 | 1.8% |
| 30 to 34 Minutes | 13 | 11.5% |
| 35 to 39 Minutes | 10 | 8.8% |
| 40 to 44 Minutes | 8 | 7.1% |
| 45 to 59 Minutes | 6 | 5.3% |
| 60 to 89 Minutes | 14 | 12.4% |
| 90 or more Minutes | 2 | 1.8% |
Commute Time by Sex in Dewey Beach
The most common commute times in Dewey Beach are 5 to 9 minutes (14 commuters, 25.0%) for males and 5 to 9 minutes (14 commuters, 24.6%) for females.
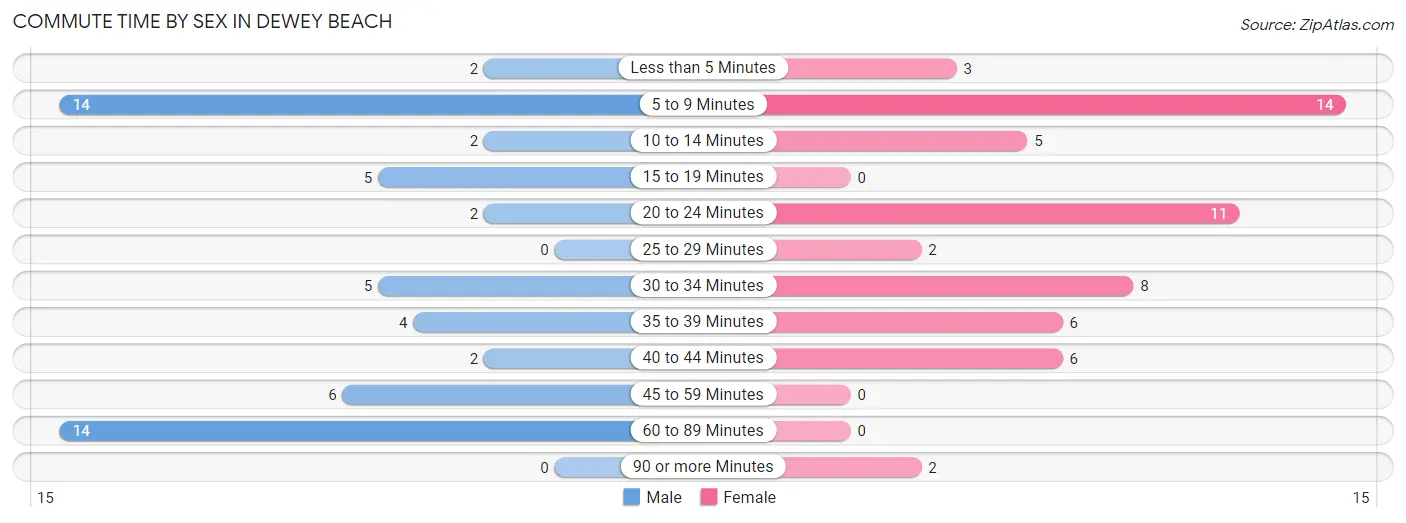
| Commute Time | Male | Female |
| Less than 5 Minutes | 2 (3.6%) | 3 (5.3%) |
| 5 to 9 Minutes | 14 (25.0%) | 14 (24.6%) |
| 10 to 14 Minutes | 2 (3.6%) | 5 (8.8%) |
| 15 to 19 Minutes | 5 (8.9%) | 0 (0.0%) |
| 20 to 24 Minutes | 2 (3.6%) | 11 (19.3%) |
| 25 to 29 Minutes | 0 (0.0%) | 2 (3.5%) |
| 30 to 34 Minutes | 5 (8.9%) | 8 (14.0%) |
| 35 to 39 Minutes | 4 (7.1%) | 6 (10.5%) |
| 40 to 44 Minutes | 2 (3.6%) | 6 (10.5%) |
| 45 to 59 Minutes | 6 (10.7%) | 0 (0.0%) |
| 60 to 89 Minutes | 14 (25.0%) | 0 (0.0%) |
| 90 or more Minutes | 0 (0.0%) | 2 (3.5%) |
Time of Departure to Work by Sex in Dewey Beach
The most frequent times of departure to work in Dewey Beach are 8:00 AM to 8:29 AM (14, 25.0%) for males and 7:30 AM to 7:59 AM (10, 17.5%) for females.
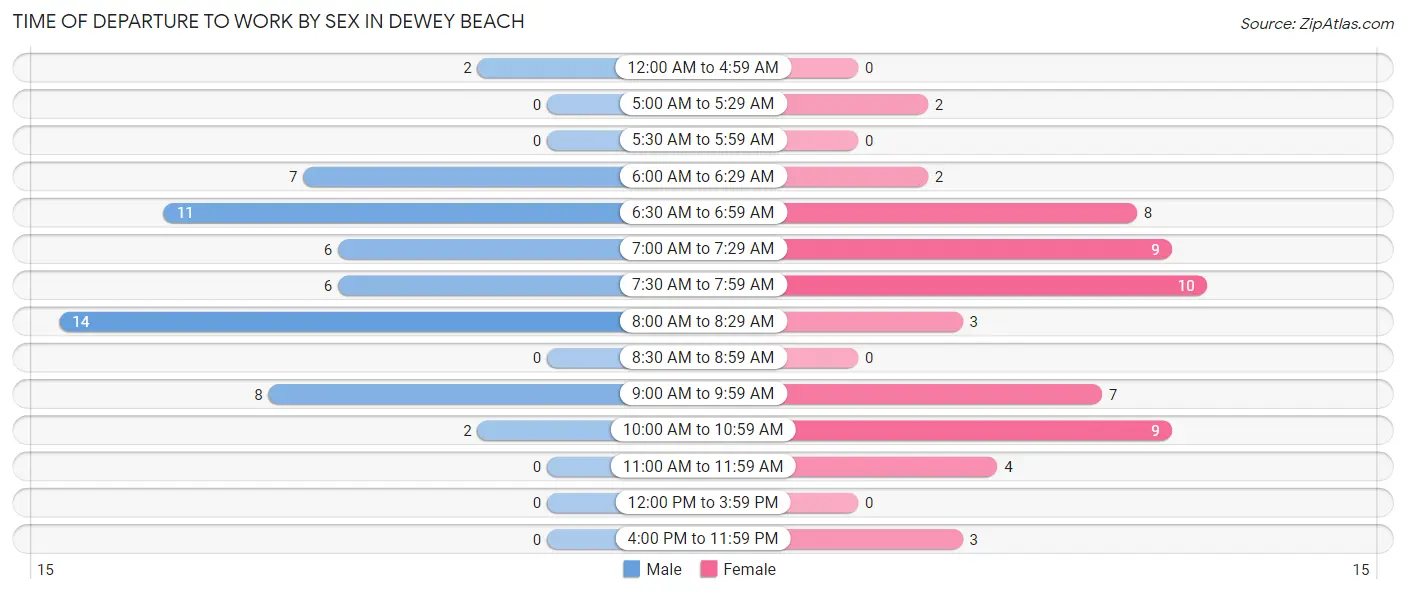
| Time of Departure | Male | Female |
| 12:00 AM to 4:59 AM | 2 (3.6%) | 0 (0.0%) |
| 5:00 AM to 5:29 AM | 0 (0.0%) | 2 (3.5%) |
| 5:30 AM to 5:59 AM | 0 (0.0%) | 0 (0.0%) |
| 6:00 AM to 6:29 AM | 7 (12.5%) | 2 (3.5%) |
| 6:30 AM to 6:59 AM | 11 (19.6%) | 8 (14.0%) |
| 7:00 AM to 7:29 AM | 6 (10.7%) | 9 (15.8%) |
| 7:30 AM to 7:59 AM | 6 (10.7%) | 10 (17.5%) |
| 8:00 AM to 8:29 AM | 14 (25.0%) | 3 (5.3%) |
| 8:30 AM to 8:59 AM | 0 (0.0%) | 0 (0.0%) |
| 9:00 AM to 9:59 AM | 8 (14.3%) | 7 (12.3%) |
| 10:00 AM to 10:59 AM | 2 (3.6%) | 9 (15.8%) |
| 11:00 AM to 11:59 AM | 0 (0.0%) | 4 (7.0%) |
| 12:00 PM to 3:59 PM | 0 (0.0%) | 0 (0.0%) |
| 4:00 PM to 11:59 PM | 0 (0.0%) | 3 (5.3%) |
| Total | 56 (100.0%) | 57 (100.0%) |
Housing Occupancy in Dewey Beach
Occupancy by Ownership in Dewey Beach
Of the total 194 dwellings in Dewey Beach, owner-occupied units account for 167 (86.1%), while renter-occupied units make up 27 (13.9%).
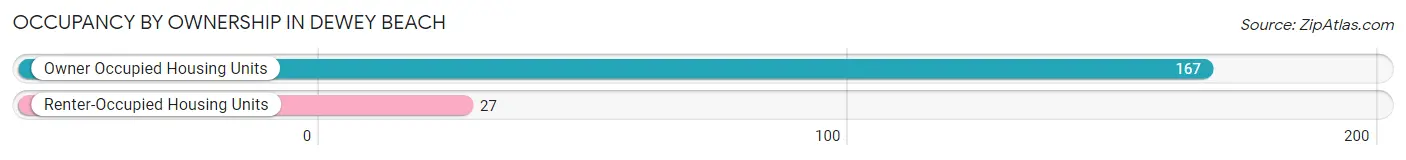
| Occupancy | # Housing Units | % Housing Units |
| Owner Occupied Housing Units | 167 | 86.1% |
| Renter-Occupied Housing Units | 27 | 13.9% |
| Total Occupied Housing Units | 194 | 100.0% |
Occupancy by Household Size in Dewey Beach
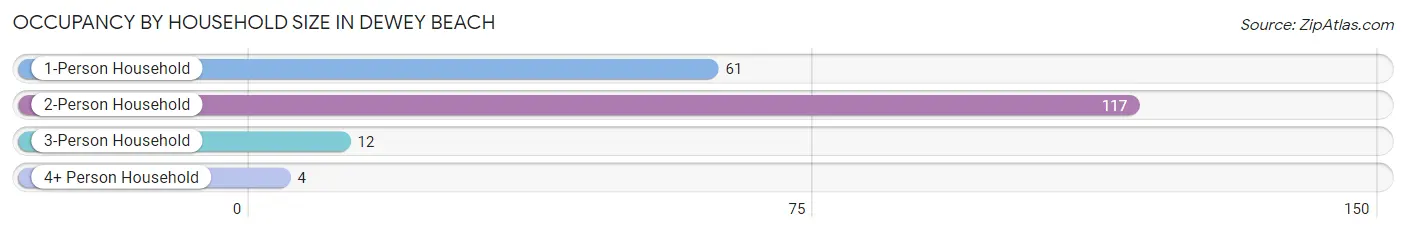
| Household Size | # Housing Units | % Housing Units |
| 1-Person Household | 61 | 31.4% |
| 2-Person Household | 117 | 60.3% |
| 3-Person Household | 12 | 6.2% |
| 4+ Person Household | 4 | 2.1% |
| Total Housing Units | 194 | 100.0% |
Occupancy by Ownership by Household Size in Dewey Beach
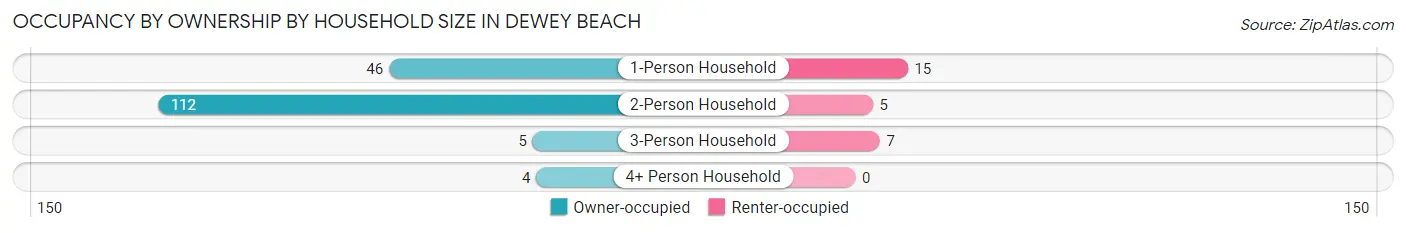
| Household Size | Owner-occupied | Renter-occupied |
| 1-Person Household | 46 (75.4%) | 15 (24.6%) |
| 2-Person Household | 112 (95.7%) | 5 (4.3%) |
| 3-Person Household | 5 (41.7%) | 7 (58.3%) |
| 4+ Person Household | 4 (100.0%) | 0 (0.0%) |
| Total Housing Units | 167 (86.1%) | 27 (13.9%) |
Occupancy by Educational Attainment in Dewey Beach
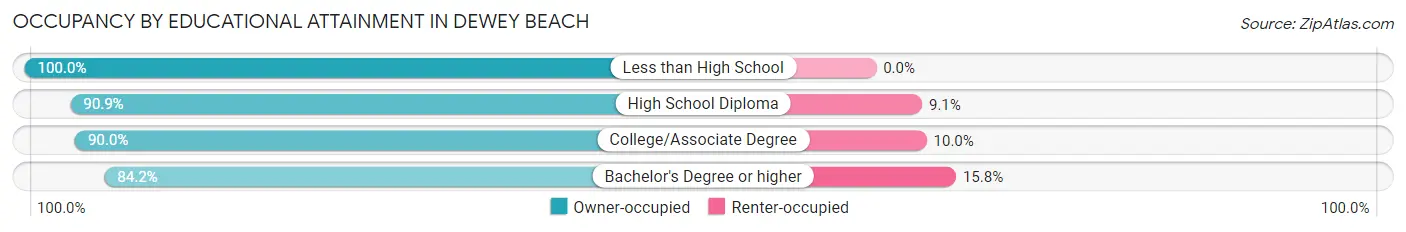
| Household Size | Owner-occupied | Renter-occupied |
| Less than High School | 3 (100.0%) | 0 (0.0%) |
| High School Diploma | 20 (90.9%) | 2 (9.1%) |
| College/Associate Degree | 27 (90.0%) | 3 (10.0%) |
| Bachelor's Degree or higher | 117 (84.2%) | 22 (15.8%) |
Occupancy by Age of Householder in Dewey Beach
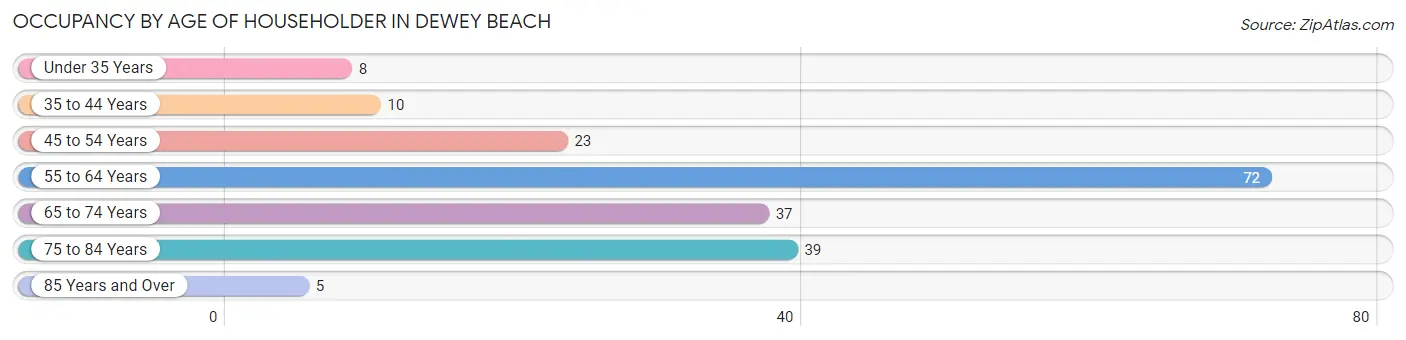
| Age Bracket | # Households | % Households |
| Under 35 Years | 8 | 4.1% |
| 35 to 44 Years | 10 | 5.1% |
| 45 to 54 Years | 23 | 11.9% |
| 55 to 64 Years | 72 | 37.1% |
| 65 to 74 Years | 37 | 19.1% |
| 75 to 84 Years | 39 | 20.1% |
| 85 Years and Over | 5 | 2.6% |
| Total | 194 | 100.0% |
Housing Finances in Dewey Beach
Median Income by Occupancy in Dewey Beach
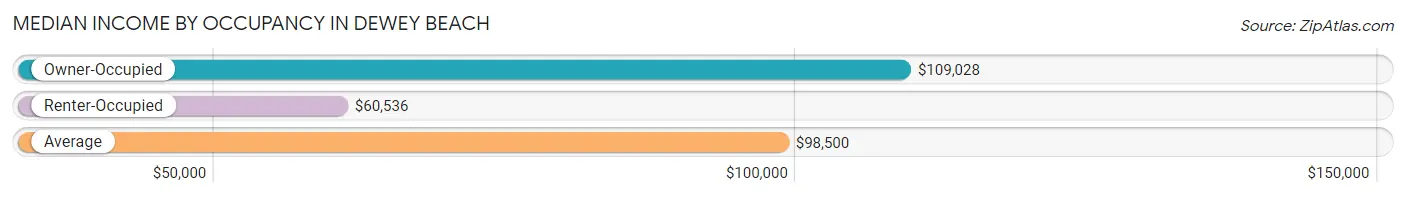
| Occupancy Type | # Households | Median Income |
| Owner-Occupied | 167 (86.1%) | $109,028 |
| Renter-Occupied | 27 (13.9%) | $60,536 |
| Average | 194 (100.0%) | $98,500 |
Occupancy by Householder Income Bracket in Dewey Beach
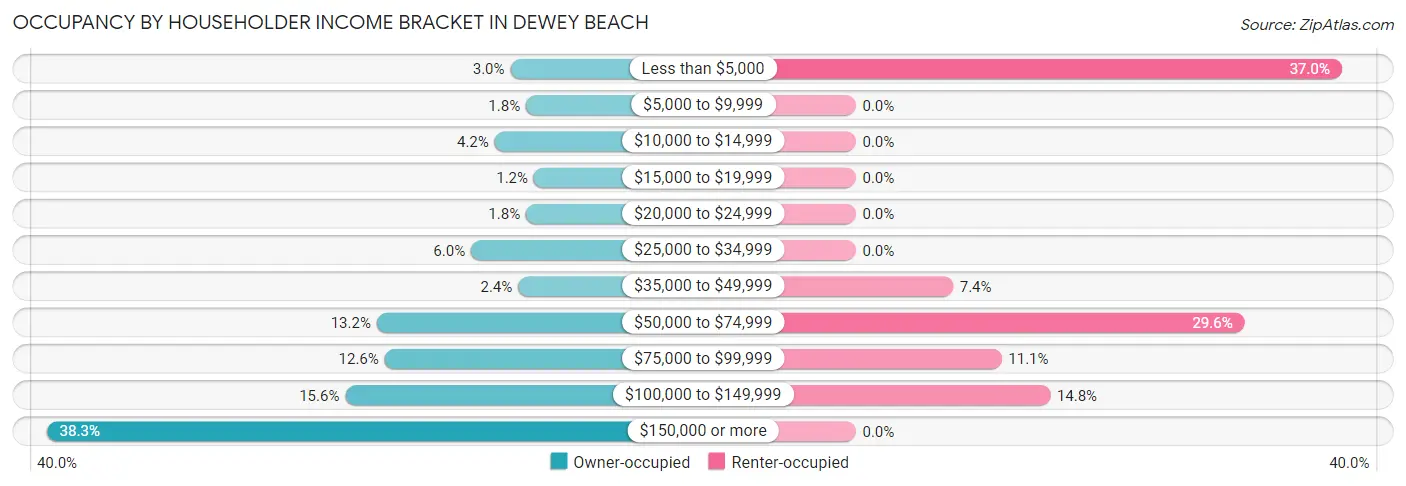
| Income Bracket | Owner-occupied | Renter-occupied |
| Less than $5,000 | 5 (3.0%) | 10 (37.0%) |
| $5,000 to $9,999 | 3 (1.8%) | 0 (0.0%) |
| $10,000 to $14,999 | 7 (4.2%) | 0 (0.0%) |
| $15,000 to $19,999 | 2 (1.2%) | 0 (0.0%) |
| $20,000 to $24,999 | 3 (1.8%) | 0 (0.0%) |
| $25,000 to $34,999 | 10 (6.0%) | 0 (0.0%) |
| $35,000 to $49,999 | 4 (2.4%) | 2 (7.4%) |
| $50,000 to $74,999 | 22 (13.2%) | 8 (29.6%) |
| $75,000 to $99,999 | 21 (12.6%) | 3 (11.1%) |
| $100,000 to $149,999 | 26 (15.6%) | 4 (14.8%) |
| $150,000 or more | 64 (38.3%) | 0 (0.0%) |
| Total | 167 (100.0%) | 27 (100.0%) |
Monthly Housing Cost Tiers in Dewey Beach
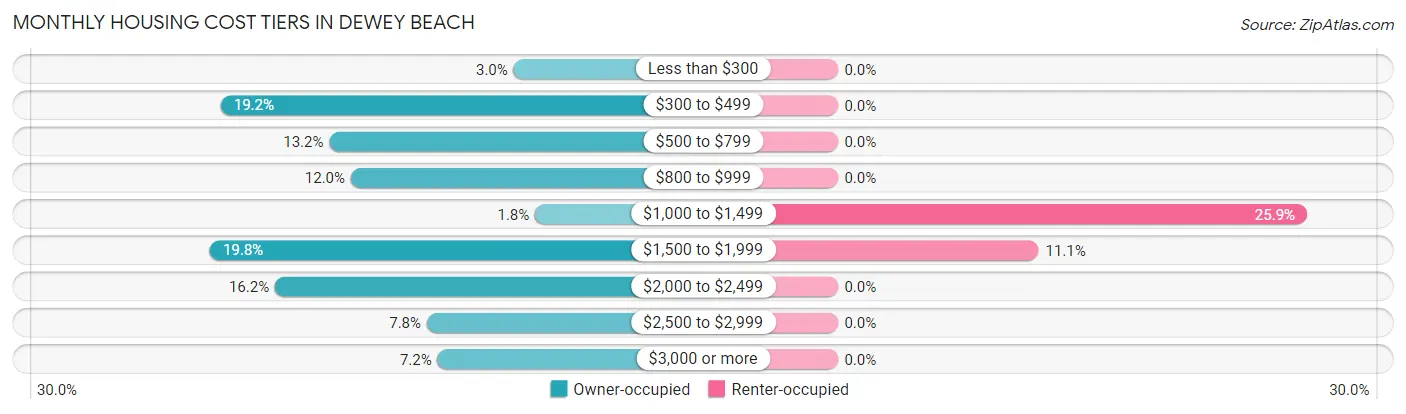
| Monthly Cost | Owner-occupied | Renter-occupied |
| Less than $300 | 5 (3.0%) | 0 (0.0%) |
| $300 to $499 | 32 (19.2%) | 0 (0.0%) |
| $500 to $799 | 22 (13.2%) | 0 (0.0%) |
| $800 to $999 | 20 (12.0%) | 0 (0.0%) |
| $1,000 to $1,499 | 3 (1.8%) | 7 (25.9%) |
| $1,500 to $1,999 | 33 (19.8%) | 3 (11.1%) |
| $2,000 to $2,499 | 27 (16.2%) | 0 (0.0%) |
| $2,500 to $2,999 | 13 (7.8%) | 0 (0.0%) |
| $3,000 or more | 12 (7.2%) | 0 (0.0%) |
| Total | 167 (100.0%) | 27 (100.0%) |
Physical Housing Characteristics in Dewey Beach
Housing Structures in Dewey Beach
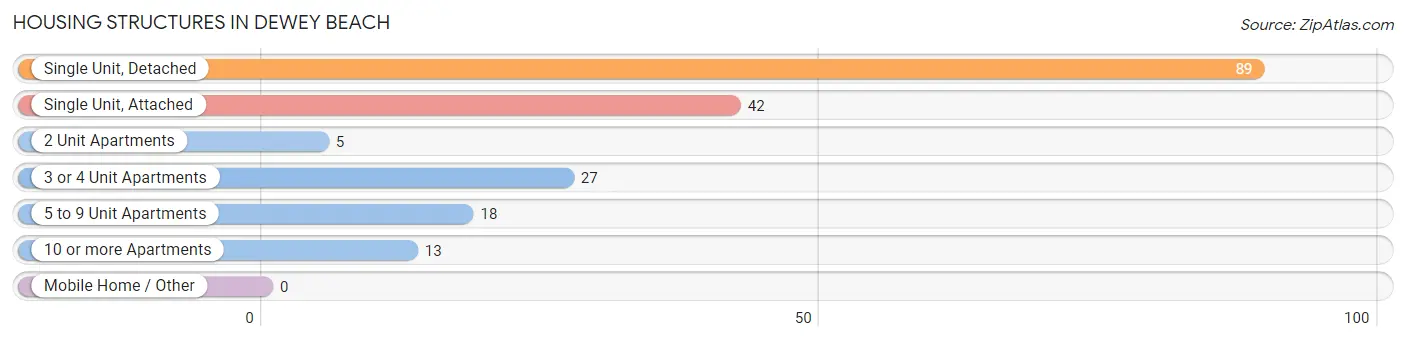
| Structure Type | # Housing Units | % Housing Units |
| Single Unit, Detached | 89 | 45.9% |
| Single Unit, Attached | 42 | 21.6% |
| 2 Unit Apartments | 5 | 2.6% |
| 3 or 4 Unit Apartments | 27 | 13.9% |
| 5 to 9 Unit Apartments | 18 | 9.3% |
| 10 or more Apartments | 13 | 6.7% |
| Mobile Home / Other | 0 | 0.0% |
| Total | 194 | 100.0% |
Housing Structures by Occupancy in Dewey Beach
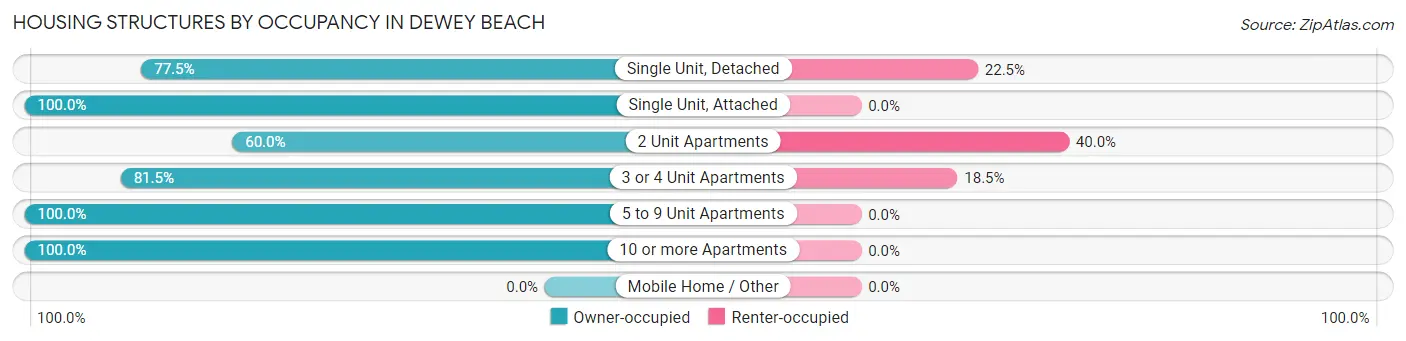
| Structure Type | Owner-occupied | Renter-occupied |
| Single Unit, Detached | 69 (77.5%) | 20 (22.5%) |
| Single Unit, Attached | 42 (100.0%) | 0 (0.0%) |
| 2 Unit Apartments | 3 (60.0%) | 2 (40.0%) |
| 3 or 4 Unit Apartments | 22 (81.5%) | 5 (18.5%) |
| 5 to 9 Unit Apartments | 18 (100.0%) | 0 (0.0%) |
| 10 or more Apartments | 13 (100.0%) | 0 (0.0%) |
| Mobile Home / Other | 0 (0.0%) | 0 (0.0%) |
| Total | 167 (86.1%) | 27 (13.9%) |
Housing Structures by Number of Rooms in Dewey Beach
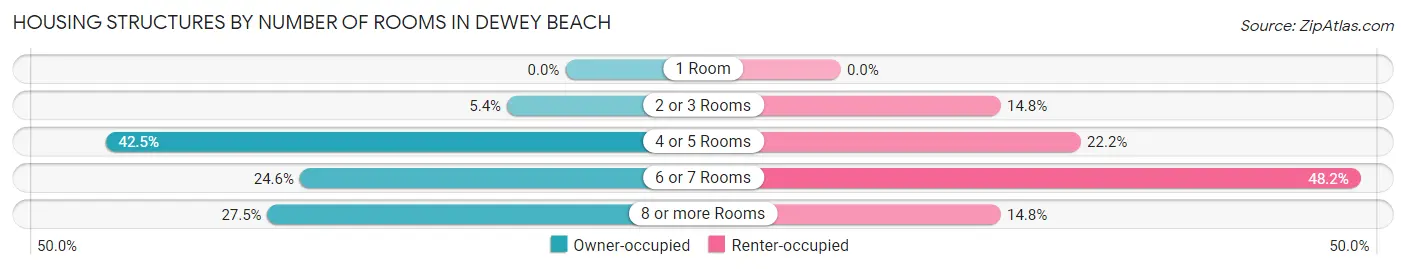
| Number of Rooms | Owner-occupied | Renter-occupied |
| 1 Room | 0 (0.0%) | 0 (0.0%) |
| 2 or 3 Rooms | 9 (5.4%) | 4 (14.8%) |
| 4 or 5 Rooms | 71 (42.5%) | 6 (22.2%) |
| 6 or 7 Rooms | 41 (24.5%) | 13 (48.1%) |
| 8 or more Rooms | 46 (27.5%) | 4 (14.8%) |
| Total | 167 (100.0%) | 27 (100.0%) |
Housing Structure by Heating Type in Dewey Beach
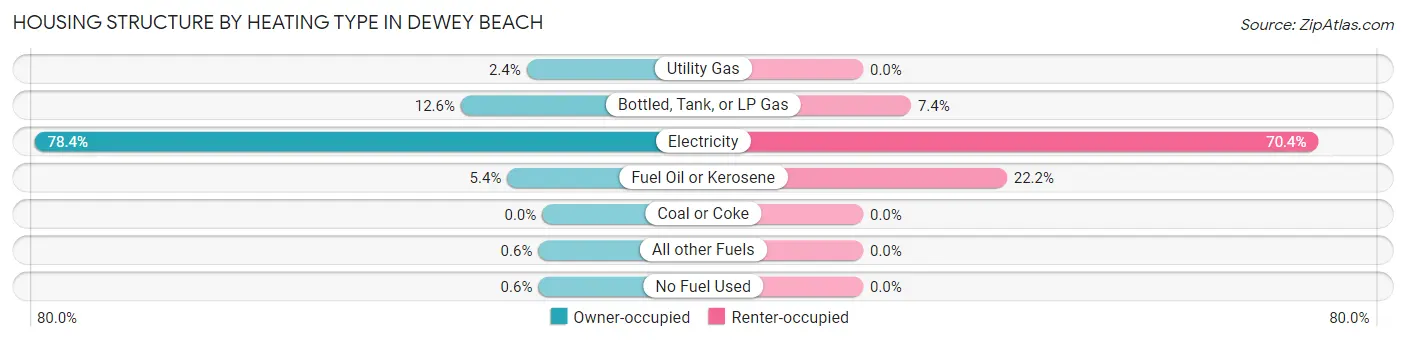
| Heating Type | Owner-occupied | Renter-occupied |
| Utility Gas | 4 (2.4%) | 0 (0.0%) |
| Bottled, Tank, or LP Gas | 21 (12.6%) | 2 (7.4%) |
| Electricity | 131 (78.4%) | 19 (70.4%) |
| Fuel Oil or Kerosene | 9 (5.4%) | 6 (22.2%) |
| Coal or Coke | 0 (0.0%) | 0 (0.0%) |
| All other Fuels | 1 (0.6%) | 0 (0.0%) |
| No Fuel Used | 1 (0.6%) | 0 (0.0%) |
| Total | 167 (100.0%) | 27 (100.0%) |
Household Vehicle Usage in Dewey Beach
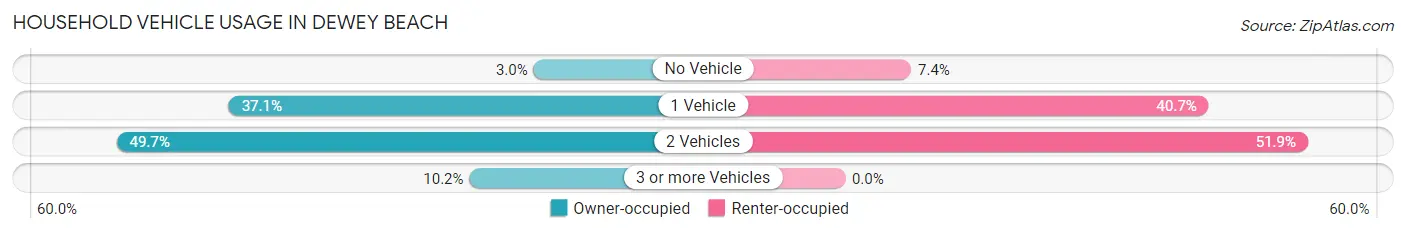
| Vehicles per Household | Owner-occupied | Renter-occupied |
| No Vehicle | 5 (3.0%) | 2 (7.4%) |
| 1 Vehicle | 62 (37.1%) | 11 (40.7%) |
| 2 Vehicles | 83 (49.7%) | 14 (51.8%) |
| 3 or more Vehicles | 17 (10.2%) | 0 (0.0%) |
| Total | 167 (100.0%) | 27 (100.0%) |
Real Estate & Mortgages in Dewey Beach
Real Estate and Mortgage Overview in Dewey Beach
| Characteristic | Without Mortgage | With Mortgage |
| Housing Units | 93 | 74 |
| Median Property Value | $847,200 | $763,200 |
| Median Household Income | $103,750 | $35 |
| Monthly Housing Costs | $595 | $12 |
| Real Estate Taxes | $1,902 | $0 |
Property Value by Mortgage Status in Dewey Beach
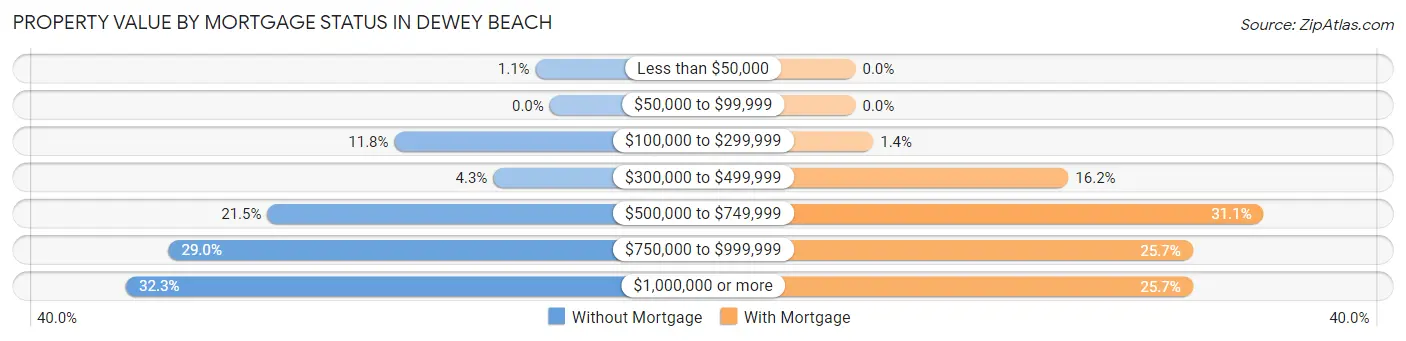
| Property Value | Without Mortgage | With Mortgage |
| Less than $50,000 | 1 (1.1%) | 0 (0.0%) |
| $50,000 to $99,999 | 0 (0.0%) | 0 (0.0%) |
| $100,000 to $299,999 | 11 (11.8%) | 1 (1.3%) |
| $300,000 to $499,999 | 4 (4.3%) | 12 (16.2%) |
| $500,000 to $749,999 | 20 (21.5%) | 23 (31.1%) |
| $750,000 to $999,999 | 27 (29.0%) | 19 (25.7%) |
| $1,000,000 or more | 30 (32.3%) | 19 (25.7%) |
| Total | 93 (100.0%) | 74 (100.0%) |
Household Income by Mortgage Status in Dewey Beach
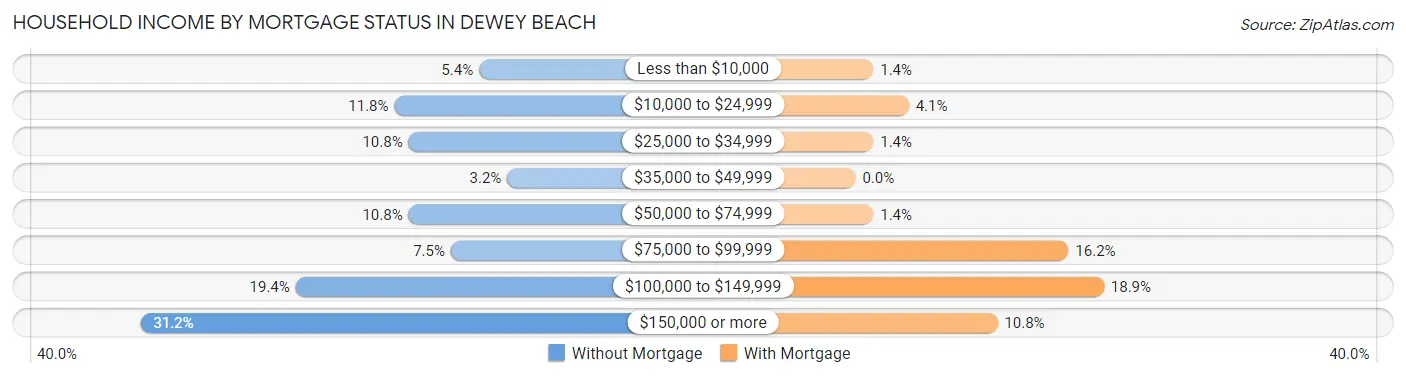
| Household Income | Without Mortgage | With Mortgage |
| Less than $10,000 | 5 (5.4%) | 1 (1.3%) |
| $10,000 to $24,999 | 11 (11.8%) | 3 (4.1%) |
| $25,000 to $34,999 | 10 (10.7%) | 1 (1.3%) |
| $35,000 to $49,999 | 3 (3.2%) | 0 (0.0%) |
| $50,000 to $74,999 | 10 (10.7%) | 1 (1.3%) |
| $75,000 to $99,999 | 7 (7.5%) | 12 (16.2%) |
| $100,000 to $149,999 | 18 (19.4%) | 14 (18.9%) |
| $150,000 or more | 29 (31.2%) | 8 (10.8%) |
| Total | 93 (100.0%) | 74 (100.0%) |
Property Value to Household Income Ratio in Dewey Beach
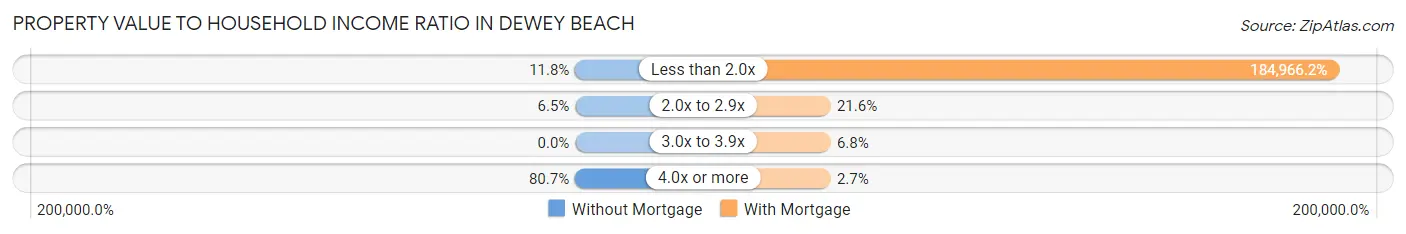
| Value-to-Income Ratio | Without Mortgage | With Mortgage |
| Less than 2.0x | 11 (11.8%) | 136,875 (184,966.2%) |
| 2.0x to 2.9x | 6 (6.5%) | 16 (21.6%) |
| 3.0x to 3.9x | 0 (0.0%) | 5 (6.8%) |
| 4.0x or more | 75 (80.6%) | 2 (2.7%) |
| Total | 93 (100.0%) | 74 (100.0%) |
Real Estate Taxes by Mortgage Status in Dewey Beach
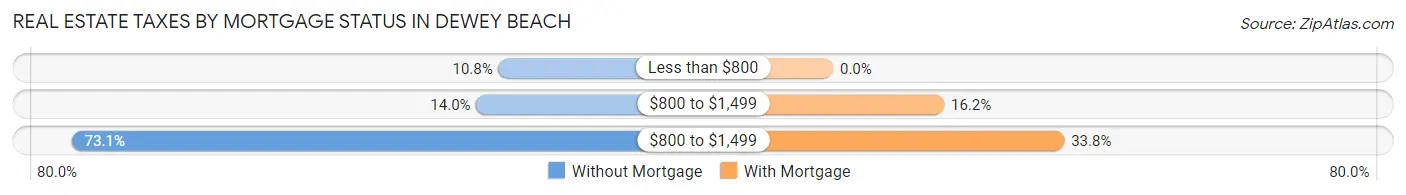
| Property Taxes | Without Mortgage | With Mortgage |
| Less than $800 | 10 (10.7%) | 0 (0.0%) |
| $800 to $1,499 | 13 (14.0%) | 12 (16.2%) |
| $800 to $1,499 | 68 (73.1%) | 25 (33.8%) |
| Total | 93 (100.0%) | 74 (100.0%) |
Health & Disability in Dewey Beach
Health Insurance Coverage by Age in Dewey Beach
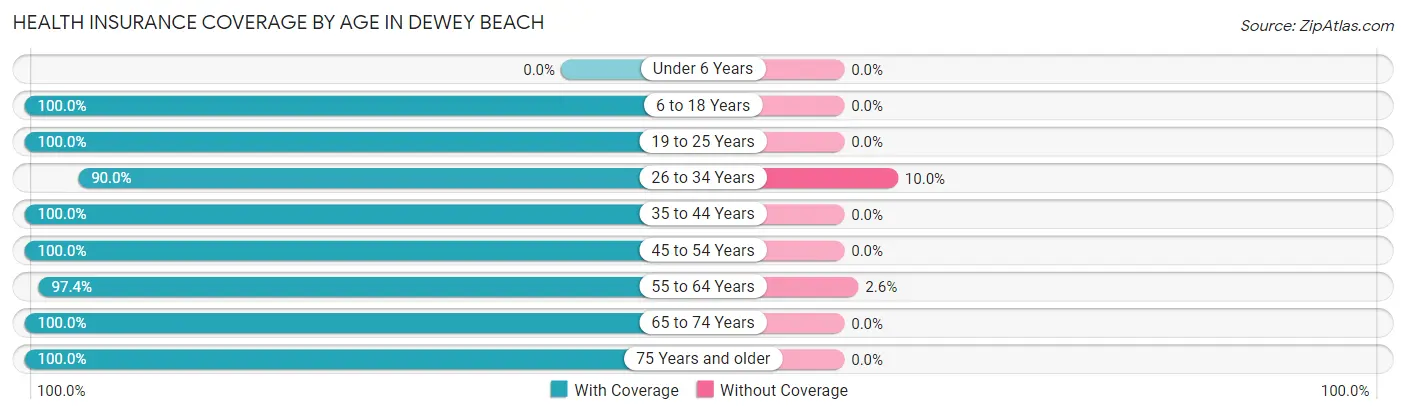
| Age Bracket | With Coverage | Without Coverage |
| Under 6 Years | 0 (0.0%) | 0 (0.0%) |
| 6 to 18 Years | 20 (100.0%) | 0 (0.0%) |
| 19 to 25 Years | 13 (100.0%) | 0 (0.0%) |
| 26 to 34 Years | 27 (90.0%) | 3 (10.0%) |
| 35 to 44 Years | 14 (100.0%) | 0 (0.0%) |
| 45 to 54 Years | 36 (100.0%) | 0 (0.0%) |
| 55 to 64 Years | 111 (97.4%) | 3 (2.6%) |
| 65 to 74 Years | 66 (100.0%) | 0 (0.0%) |
| 75 Years and older | 66 (100.0%) | 0 (0.0%) |
| Total | 353 (98.3%) | 6 (1.7%) |
Health Insurance Coverage by Citizenship Status in Dewey Beach
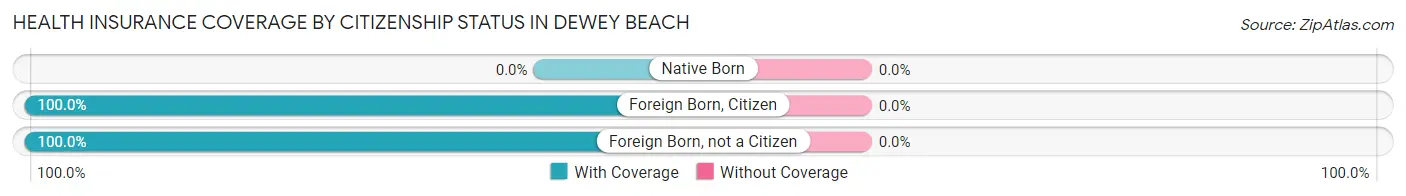
| Citizenship Status | With Coverage | Without Coverage |
| Native Born | 0 (0.0%) | 0 (0.0%) |
| Foreign Born, Citizen | 20 (100.0%) | 0 (0.0%) |
| Foreign Born, not a Citizen | 13 (100.0%) | 0 (0.0%) |
Health Insurance Coverage by Household Income in Dewey Beach
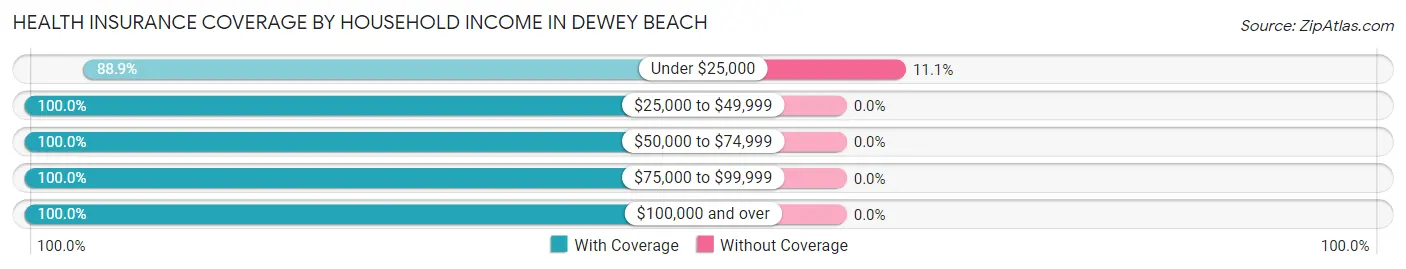
| Household Income | With Coverage | Without Coverage |
| Under $25,000 | 48 (88.9%) | 6 (11.1%) |
| $25,000 to $49,999 | 16 (100.0%) | 0 (0.0%) |
| $50,000 to $74,999 | 68 (100.0%) | 0 (0.0%) |
| $75,000 to $99,999 | 41 (100.0%) | 0 (0.0%) |
| $100,000 and over | 180 (100.0%) | 0 (0.0%) |
Public vs Private Health Insurance Coverage by Age in Dewey Beach
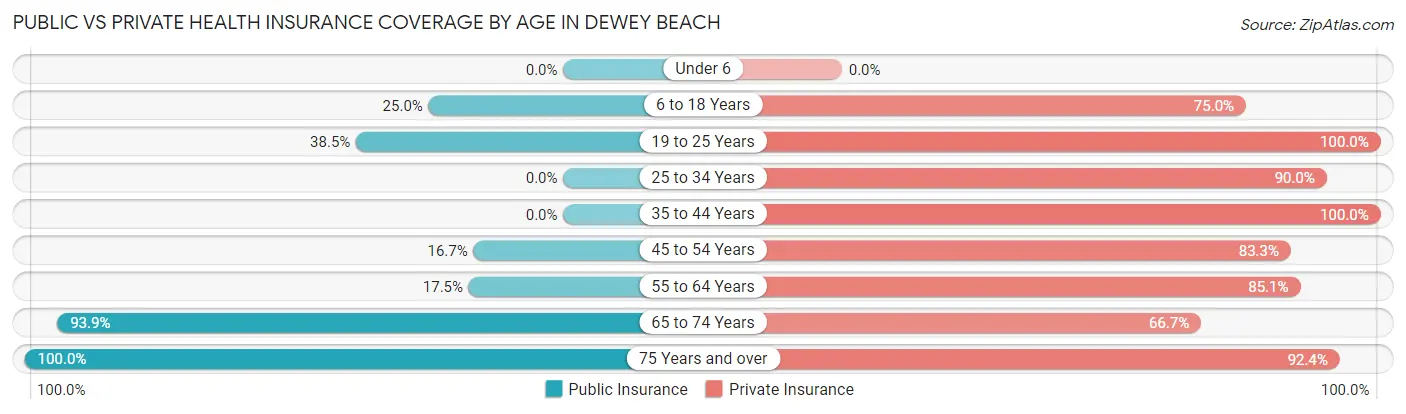
| Age Bracket | Public Insurance | Private Insurance |
| Under 6 | 0 (0.0%) | 0 (0.0%) |
| 6 to 18 Years | 5 (25.0%) | 15 (75.0%) |
| 19 to 25 Years | 5 (38.5%) | 13 (100.0%) |
| 25 to 34 Years | 0 (0.0%) | 27 (90.0%) |
| 35 to 44 Years | 0 (0.0%) | 14 (100.0%) |
| 45 to 54 Years | 6 (16.7%) | 30 (83.3%) |
| 55 to 64 Years | 20 (17.5%) | 97 (85.1%) |
| 65 to 74 Years | 62 (93.9%) | 44 (66.7%) |
| 75 Years and over | 66 (100.0%) | 61 (92.4%) |
| Total | 164 (45.7%) | 301 (83.8%) |
Disability Status by Sex by Age in Dewey Beach
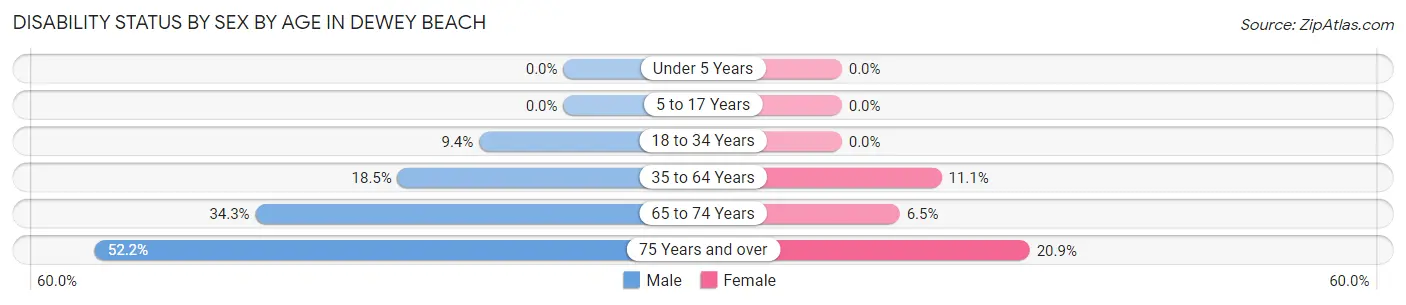
| Age Bracket | Male | Female |
| Under 5 Years | 0 (0.0%) | 0 (0.0%) |
| 5 to 17 Years | 0 (0.0%) | 0 (0.0%) |
| 18 to 34 Years | 3 (9.4%) | 0 (0.0%) |
| 35 to 64 Years | 12 (18.5%) | 11 (11.1%) |
| 65 to 74 Years | 12 (34.3%) | 2 (6.5%) |
| 75 Years and over | 12 (52.2%) | 9 (20.9%) |
Disability Class by Sex by Age in Dewey Beach
Disability Class: Hearing Difficulty
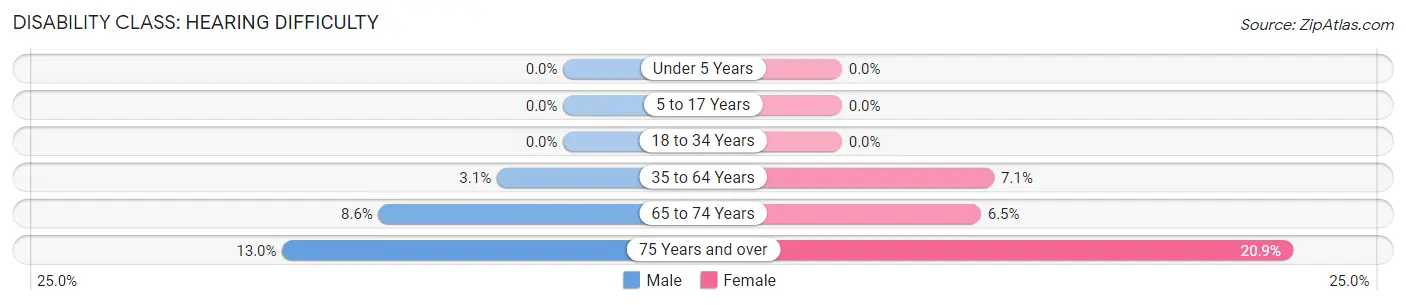
| Age Bracket | Male | Female |
| Under 5 Years | 0 (0.0%) | 0 (0.0%) |
| 5 to 17 Years | 0 (0.0%) | 0 (0.0%) |
| 18 to 34 Years | 0 (0.0%) | 0 (0.0%) |
| 35 to 64 Years | 2 (3.1%) | 7 (7.1%) |
| 65 to 74 Years | 3 (8.6%) | 2 (6.5%) |
| 75 Years and over | 3 (13.0%) | 9 (20.9%) |
Disability Class: Vision Difficulty
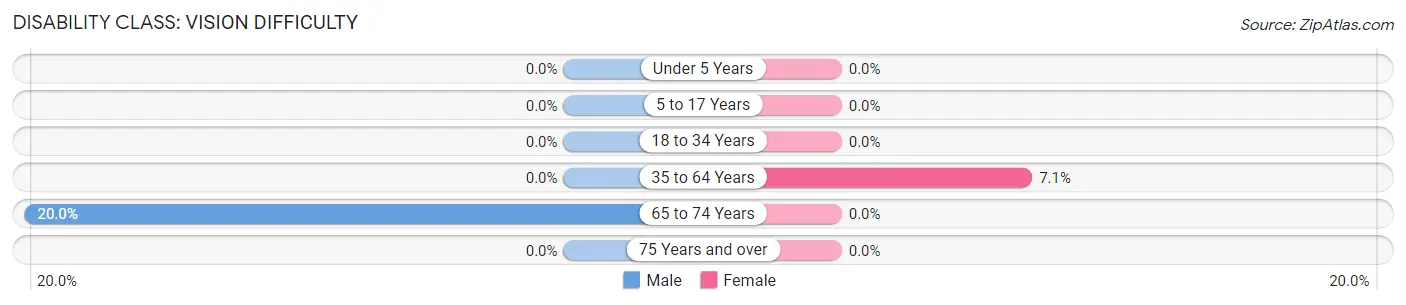
| Age Bracket | Male | Female |
| Under 5 Years | 0 (0.0%) | 0 (0.0%) |
| 5 to 17 Years | 0 (0.0%) | 0 (0.0%) |
| 18 to 34 Years | 0 (0.0%) | 0 (0.0%) |
| 35 to 64 Years | 0 (0.0%) | 7 (7.1%) |
| 65 to 74 Years | 7 (20.0%) | 0 (0.0%) |
| 75 Years and over | 0 (0.0%) | 0 (0.0%) |
Disability Class: Cognitive Difficulty
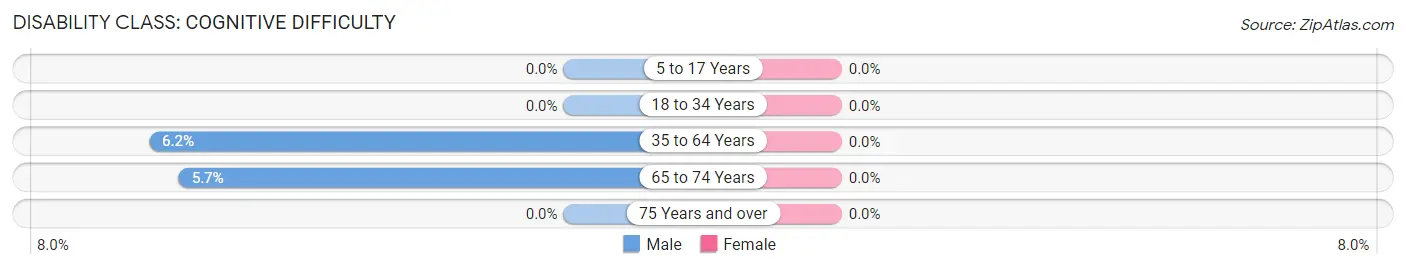
| Age Bracket | Male | Female |
| 5 to 17 Years | 0 (0.0%) | 0 (0.0%) |
| 18 to 34 Years | 0 (0.0%) | 0 (0.0%) |
| 35 to 64 Years | 4 (6.1%) | 0 (0.0%) |
| 65 to 74 Years | 2 (5.7%) | 0 (0.0%) |
| 75 Years and over | 0 (0.0%) | 0 (0.0%) |
Disability Class: Ambulatory Difficulty
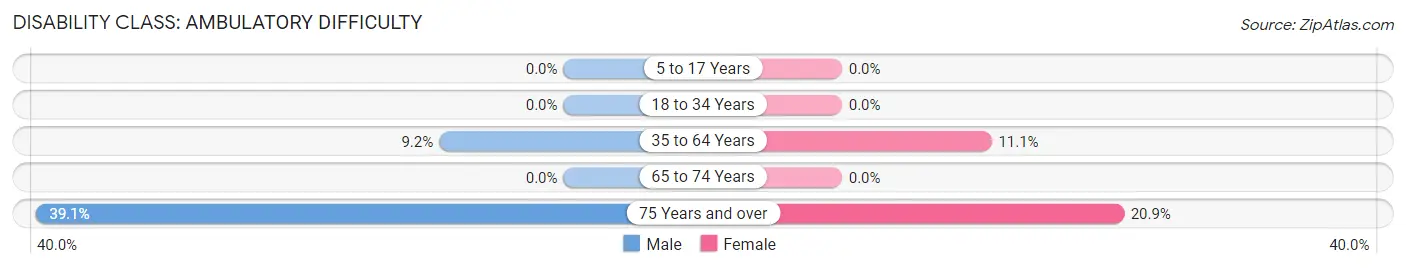
| Age Bracket | Male | Female |
| 5 to 17 Years | 0 (0.0%) | 0 (0.0%) |
| 18 to 34 Years | 0 (0.0%) | 0 (0.0%) |
| 35 to 64 Years | 6 (9.2%) | 11 (11.1%) |
| 65 to 74 Years | 0 (0.0%) | 0 (0.0%) |
| 75 Years and over | 9 (39.1%) | 9 (20.9%) |
Disability Class: Self-Care Difficulty
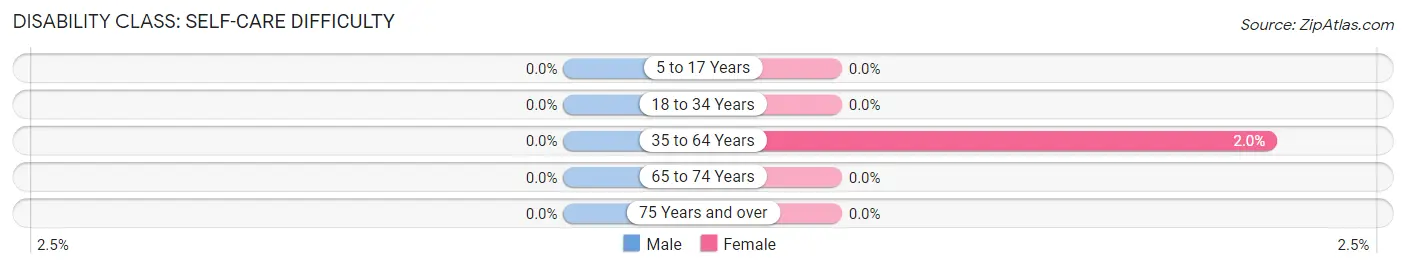
| Age Bracket | Male | Female |
| 5 to 17 Years | 0 (0.0%) | 0 (0.0%) |
| 18 to 34 Years | 0 (0.0%) | 0 (0.0%) |
| 35 to 64 Years | 0 (0.0%) | 2 (2.0%) |
| 65 to 74 Years | 0 (0.0%) | 0 (0.0%) |
| 75 Years and over | 0 (0.0%) | 0 (0.0%) |
Technology Access in Dewey Beach
Computing Device Access in Dewey Beach
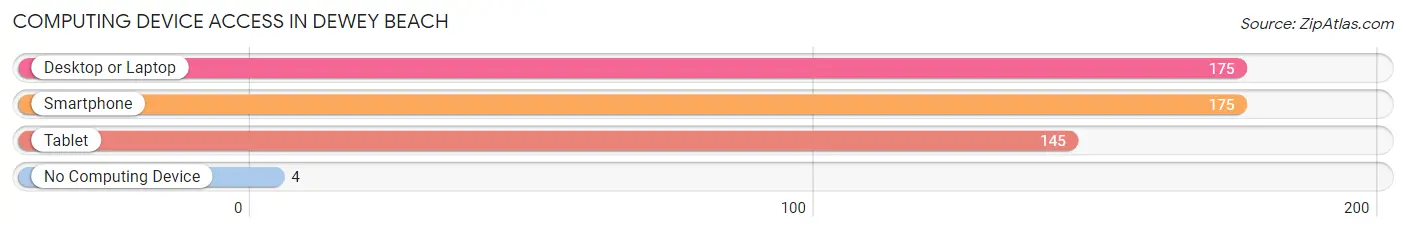
| Device Type | # Households | % Households |
| Desktop or Laptop | 175 | 90.2% |
| Smartphone | 175 | 90.2% |
| Tablet | 145 | 74.7% |
| No Computing Device | 4 | 2.1% |
| Total | 194 | 100.0% |
Internet Access in Dewey Beach
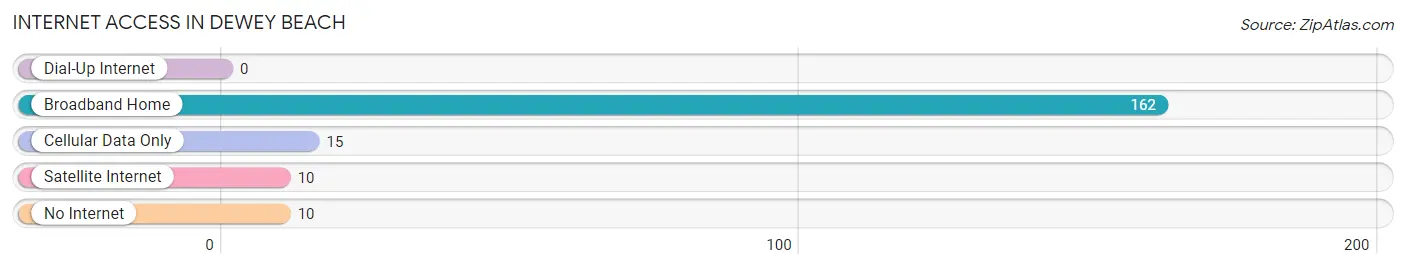
| Internet Type | # Households | % Households |
| Dial-Up Internet | 0 | 0.0% |
| Broadband Home | 162 | 83.5% |
| Cellular Data Only | 15 | 7.7% |
| Satellite Internet | 10 | 5.1% |
| No Internet | 10 | 5.1% |
| Total | 194 | 100.0% |
Dewey Beach Summary
Dewey Beach is a small town located in Sussex County, Delaware, United States. It is situated on the Atlantic Ocean, just south of Rehoboth Beach and north of Bethany Beach. The town is known for its vibrant nightlife and beach activities, and is a popular destination for tourists and locals alike.
History
Dewey Beach was originally part of the Rehoboth Beach area, but was separated in the early 1900s when the Rehoboth Beach Boardwalk was built. The town was named after Admiral George Dewey, who was a hero of the Spanish-American War. The town was officially incorporated in 1981.
In the early 1900s, Dewey Beach was a popular destination for fishing and crabbing. The town was also known for its beach activities, such as swimming, sunbathing, and beach volleyball. In the 1950s, the town began to attract more tourists, and the first hotel was built in 1959.
In the 1970s, Dewey Beach began to attract more visitors, and the town began to develop. The town was known for its vibrant nightlife, and many bars and restaurants opened up. The town also began to attract more tourists, and the population began to grow.
Geography
Dewey Beach is located in Sussex County, Delaware, United States. It is situated on the Atlantic Ocean, just south of Rehoboth Beach and north of Bethany Beach. The town is bordered by the Rehoboth Bay to the west and the Indian River Bay to the east. The town covers an area of 1.2 square miles, and has a population of approximately 300 people.
The town is known for its white sand beaches, which are popular for swimming, sunbathing, and beach volleyball. The town also has a number of parks, including the Silver Lake Park, which is a popular spot for fishing and crabbing.
Economy
Dewey Beach is a popular tourist destination, and the town’s economy is largely based on tourism. The town is home to a number of hotels, restaurants, bars, and shops, which cater to tourists and locals alike. The town also has a number of marinas, which are popular for fishing and boating.
The town is also home to a number of businesses, such as real estate agencies, insurance companies, and law firms. The town is also home to a number of government offices, such as the Dewey Beach Town Hall and the Dewey Beach Police Department.
Demographics
As of the 2010 census, the population of Dewey Beach was 300 people. The racial makeup of the town was 94.7% White, 1.3% African American, 0.7% Native American, 0.7% Asian, 0.3% from other races, and 2.7% from two or more races. The median household income was $50,000, and the median family income was $60,000.
Conclusion
Dewey Beach is a small town located in Sussex County, Delaware, United States. It is situated on the Atlantic Ocean, just south of Rehoboth Beach and north of Bethany Beach. The town is known for its vibrant nightlife and beach activities, and is a popular destination for tourists and locals alike. The town’s economy is largely based on tourism, and the town is home to a number of hotels, restaurants, bars, and shops. The population of Dewey Beach is 300 people, and the racial makeup of the town is 94.7% White, 1.3% African American, 0.7% Native American, 0.7% Asian, 0.3% from other races, and 2.7% from two or more races.
Common Questions
What is Per Capita Income in Dewey Beach?
Per Capita income in Dewey Beach is $87,153.
What is the Median Family Income in Dewey Beach?
Median Family Income in Dewey Beach is $135,625.
What is the Median Household income in Dewey Beach?
Median Household Income in Dewey Beach is $98,500.
What is Income or Wage Gap in Dewey Beach?
Income or Wage Gap in Dewey Beach is 49.3%.
Women in Dewey Beach earn 50.7 cents for every dollar earned by a man.
What is Family Income Deficit in Dewey Beach?
Family Income Deficit in Dewey Beach is $12,553.
Families that are below poverty line in Dewey Beach earn $12,553 less on average than the poverty threshold level.
What is Inequality or Gini Index in Dewey Beach?
Inequality or Gini Index in Dewey Beach is 0.56.
What is the Total Population of Dewey Beach?
Total Population of Dewey Beach is 359.
What is the Total Male Population of Dewey Beach?
Total Male Population of Dewey Beach is 169.
What is the Total Female Population of Dewey Beach?
Total Female Population of Dewey Beach is 190.
What is the Ratio of Males per 100 Females in Dewey Beach?
There are 88.95 Males per 100 Females in Dewey Beach.
What is the Ratio of Females per 100 Males in Dewey Beach?
There are 112.43 Females per 100 Males in Dewey Beach.
What is the Median Population Age in Dewey Beach?
Median Population Age in Dewey Beach is 59.9 Years.
What is the Average Family Size in Dewey Beach
Average Family Size in Dewey Beach is 2.3 People.
What is the Average Household Size in Dewey Beach
Average Household Size in Dewey Beach is 1.9 People.
How Large is the Labor Force in Dewey Beach?
There are 176 People in the Labor Forcein in Dewey Beach.
What is the Percentage of People in the Labor Force in Dewey Beach?
50.4% of People are in the Labor Force in Dewey Beach.
What is the Unemployment Rate in Dewey Beach?
Unemployment Rate in Dewey Beach is 1.7%.