South Bethany, DE Map & Demographics
South Bethany Map
South Bethany Overview
$104,454
PER CAPITA INCOME
$107,500
AVG FAMILY INCOME
$106,840
AVG HOUSEHOLD INCOME
45.6%
WAGE / INCOME GAP [ % ]
54.4¢/ $1
WAGE / INCOME GAP [ $ ]
0.45
INEQUALITY / GINI INDEX
490
TOTAL POPULATION
281
MALE POPULATION
209
FEMALE POPULATION
134.45
MALES / 100 FEMALES
74.38
FEMALES / 100 MALES
69.6
MEDIAN AGE
1.8
AVG FAMILY SIZE
1.6
AVG HOUSEHOLD SIZE
150
LABOR FORCE [ PEOPLE ]
30.7%
PERCENT IN LABOR FORCE
4.0%
UNEMPLOYMENT RATE
South Bethany Area Codes
Income in South Bethany
Income Overview in South Bethany
Per Capita Income in South Bethany is $104,454, while median incomes of families and households are $107,500 and $106,840 respectively.
| Characteristic | Number | Measure |
| Per Capita Income | 490 | $104,454 |
| Median Family Income | 220 | $107,500 |
| Mean Family Income | 220 | $192,752 |
| Median Household Income | 302 | $106,840 |
| Mean Household Income | 302 | $168,100 |
| Income Deficit | 220 | $0 |
| Wage / Income Gap (%) | 490 | 45.58% |
| Wage / Income Gap ($) | 490 | 54.42¢ per $1 |
| Gini / Inequality Index | 490 | 0.45 |
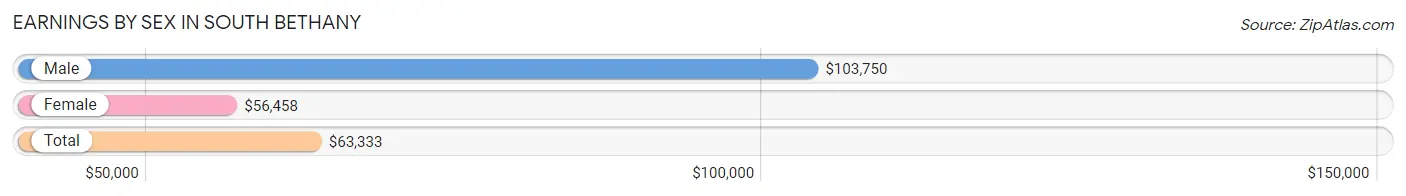
Earnings by Sex in South Bethany
Average Earnings in South Bethany are $63,333, $103,750 for men and $56,458 for women, a difference of 45.6%.
| Sex | Number | Average Earnings |
| Male | 97 (54.5%) | $103,750 |
| Female | 81 (45.5%) | $56,458 |
| Total | 178 (100.0%) | $63,333 |
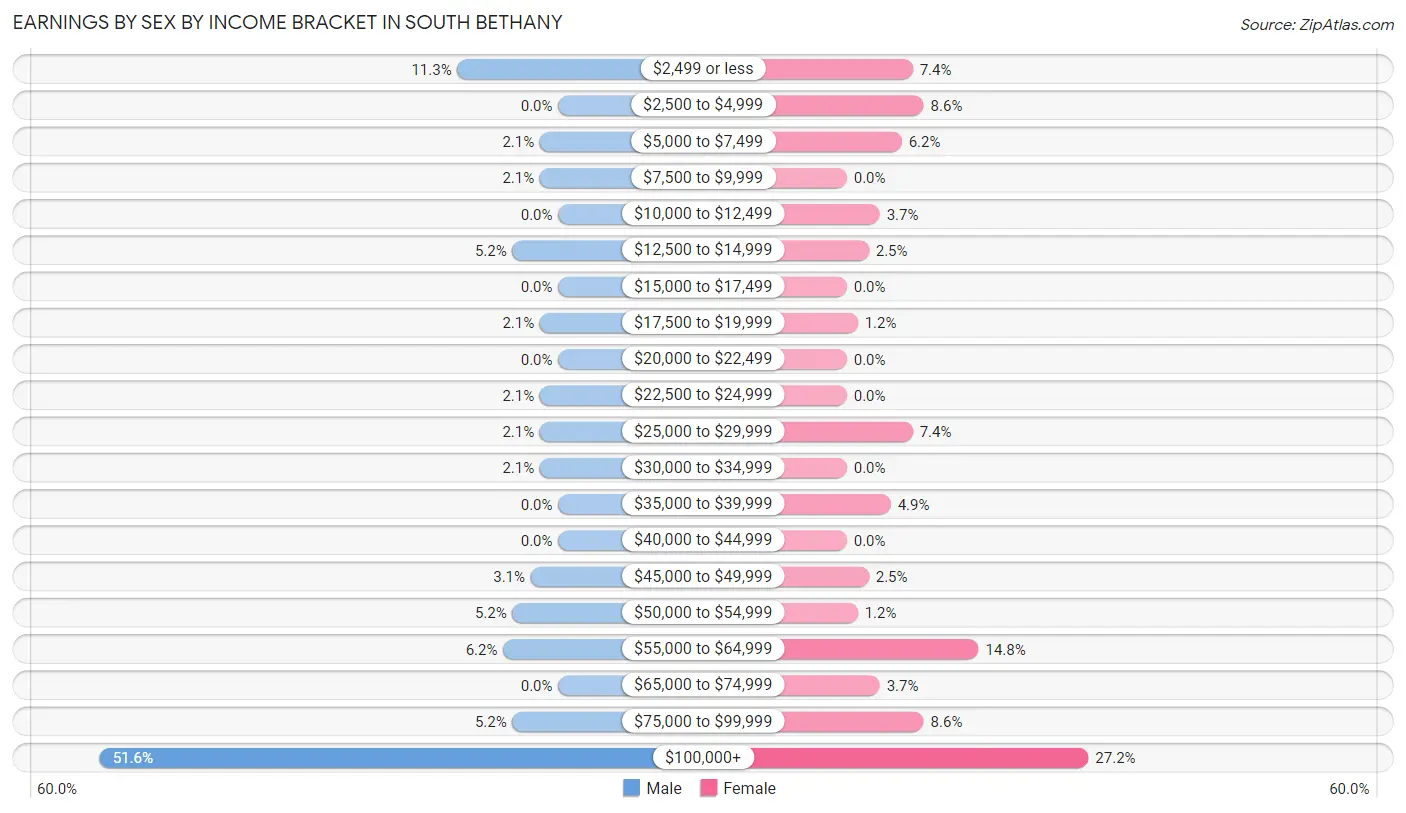
Earnings by Sex by Income Bracket in South Bethany
The most common earnings brackets in South Bethany are $100,000+ for men (50 | 51.5%) and $100,000+ for women (22 | 27.2%).
| Income | Male | Female |
| $2,499 or less | 11 (11.3%) | 6 (7.4%) |
| $2,500 to $4,999 | 0 (0.0%) | 7 (8.6%) |
| $5,000 to $7,499 | 2 (2.1%) | 5 (6.2%) |
| $7,500 to $9,999 | 2 (2.1%) | 0 (0.0%) |
| $10,000 to $12,499 | 0 (0.0%) | 3 (3.7%) |
| $12,500 to $14,999 | 5 (5.1%) | 2 (2.5%) |
| $15,000 to $17,499 | 0 (0.0%) | 0 (0.0%) |
| $17,500 to $19,999 | 2 (2.1%) | 1 (1.2%) |
| $20,000 to $22,499 | 0 (0.0%) | 0 (0.0%) |
| $22,500 to $24,999 | 2 (2.1%) | 0 (0.0%) |
| $25,000 to $29,999 | 2 (2.1%) | 6 (7.4%) |
| $30,000 to $34,999 | 2 (2.1%) | 0 (0.0%) |
| $35,000 to $39,999 | 0 (0.0%) | 4 (4.9%) |
| $40,000 to $44,999 | 0 (0.0%) | 0 (0.0%) |
| $45,000 to $49,999 | 3 (3.1%) | 2 (2.5%) |
| $50,000 to $54,999 | 5 (5.1%) | 1 (1.2%) |
| $55,000 to $64,999 | 6 (6.2%) | 12 (14.8%) |
| $65,000 to $74,999 | 0 (0.0%) | 3 (3.7%) |
| $75,000 to $99,999 | 5 (5.1%) | 7 (8.6%) |
| $100,000+ | 50 (51.5%) | 22 (27.2%) |
| Total | 97 (100.0%) | 81 (100.0%) |
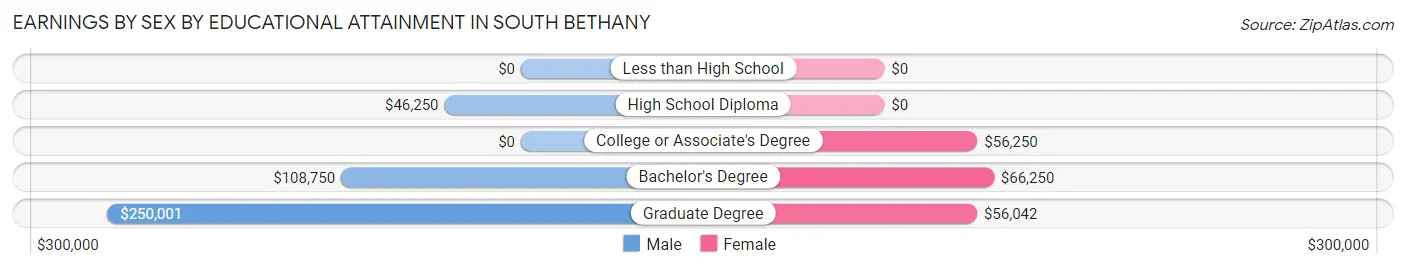
Earnings by Sex by Educational Attainment in South Bethany
Average earnings in South Bethany are $106,250 for men and $55,417 for women, a difference of 47.8%. Men with an educational attainment of graduate degree enjoy the highest average annual earnings of $250,001, while those with high school diploma education earn the least with $46,250. Women with an educational attainment of bachelor's degree earn the most with the average annual earnings of $66,250, while those with graduate degree education have the smallest earnings of $56,042.
| Educational Attainment | Male Income | Female Income |
| Less than High School | - | - |
| High School Diploma | $46,250 | $0 |
| College or Associate's Degree | - | - |
| Bachelor's Degree | $108,750 | $66,250 |
| Graduate Degree | $250,001 | $56,042 |
| Total | $106,250 | $55,417 |
Family Income in South Bethany
Family Income Brackets in South Bethany
According to the South Bethany family income data, there are 104 families falling into the $100,000 to $149,999 income range, which is the most common income bracket and makes up 47.3% of all families. Conversely, the less than $10,000 income bracket is the least frequent group with only 2 families (0.9%) belonging to this category.
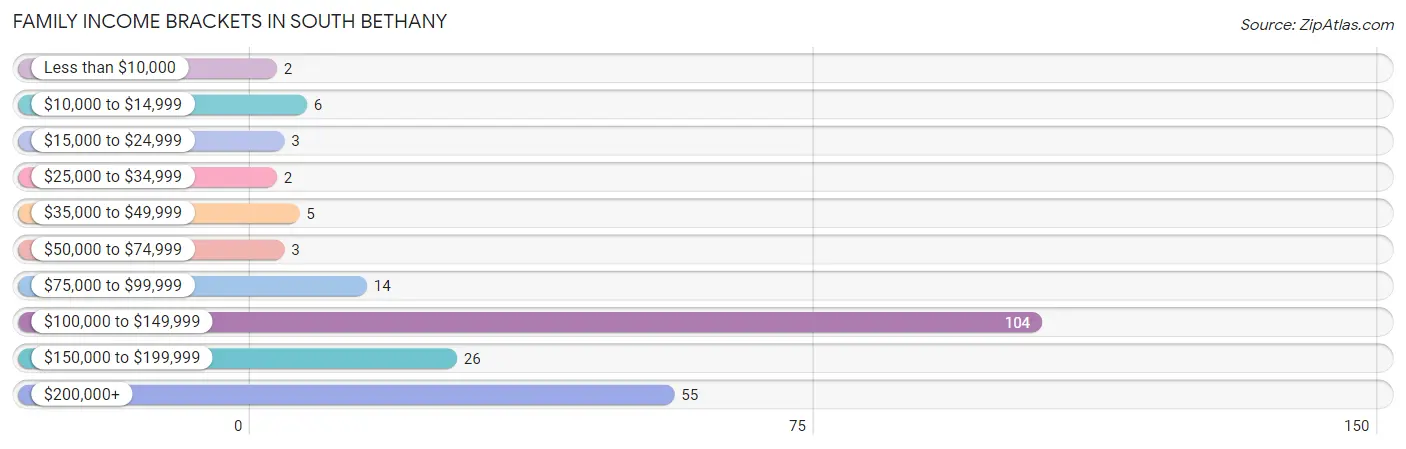
| Income Bracket | # Families | % Families |
| Less than $10,000 | 2 | 0.9% |
| $10,000 to $14,999 | 6 | 2.7% |
| $15,000 to $24,999 | 3 | 1.4% |
| $25,000 to $34,999 | 2 | 0.9% |
| $35,000 to $49,999 | 5 | 2.3% |
| $50,000 to $74,999 | 3 | 1.4% |
| $75,000 to $99,999 | 14 | 6.4% |
| $100,000 to $149,999 | 104 | 47.3% |
| $150,000 to $199,999 | 26 | 11.8% |
| $200,000+ | 55 | 25.0% |
Family Income by Famaliy Size in South Bethany
3-person families (14 | 6.4%) account for the highest median family income in South Bethany with $139,167 per family, while 2-person families (206 | 93.6%) have the highest median income of $53,663 per family member.
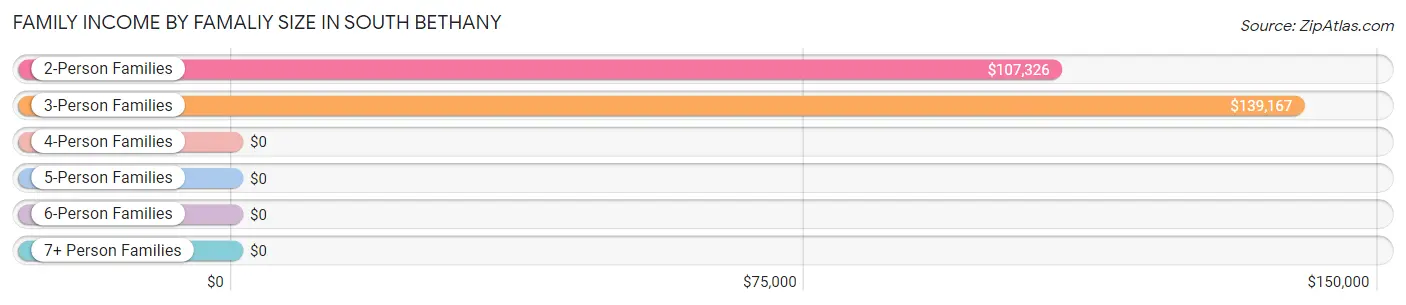
| Income Bracket | # Families | Median Income |
| 2-Person Families | 206 (93.6%) | $107,326 |
| 3-Person Families | 14 (6.4%) | $139,167 |
| 4-Person Families | 0 (0.0%) | $0 |
| 5-Person Families | 0 (0.0%) | $0 |
| 6-Person Families | 0 (0.0%) | $0 |
| 7+ Person Families | 0 (0.0%) | $0 |
| Total | 220 (100.0%) | $107,500 |
Family Income by Number of Earners in South Bethany
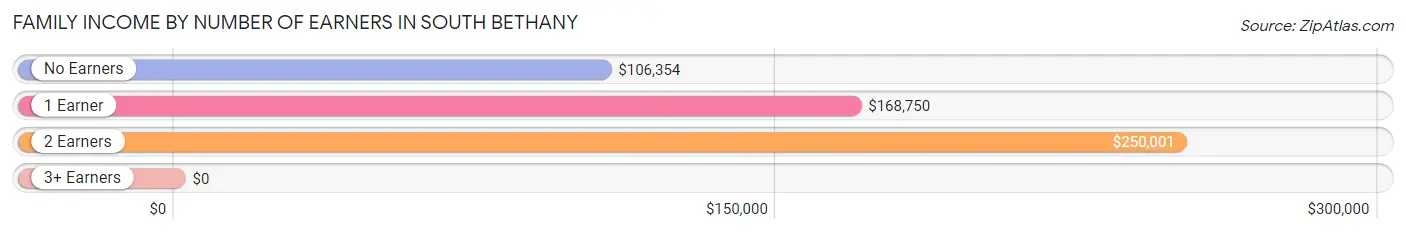
| Number of Earners | # Families | Median Income |
| No Earners | 132 (60.0%) | $106,354 |
| 1 Earner | 42 (19.1%) | $168,750 |
| 2 Earners | 42 (19.1%) | $250,001 |
| 3+ Earners | 4 (1.8%) | $0 |
| Total | 220 (100.0%) | $107,500 |
Household Income in South Bethany
Household Income Brackets in South Bethany
With 120 households falling in the category, the $100,000 to $149,999 income range is the most frequent in South Bethany, accounting for 39.7% of all households. In contrast, only 5 households (1.7%) fall into the less than $10,000 income bracket, making it the least populous group.
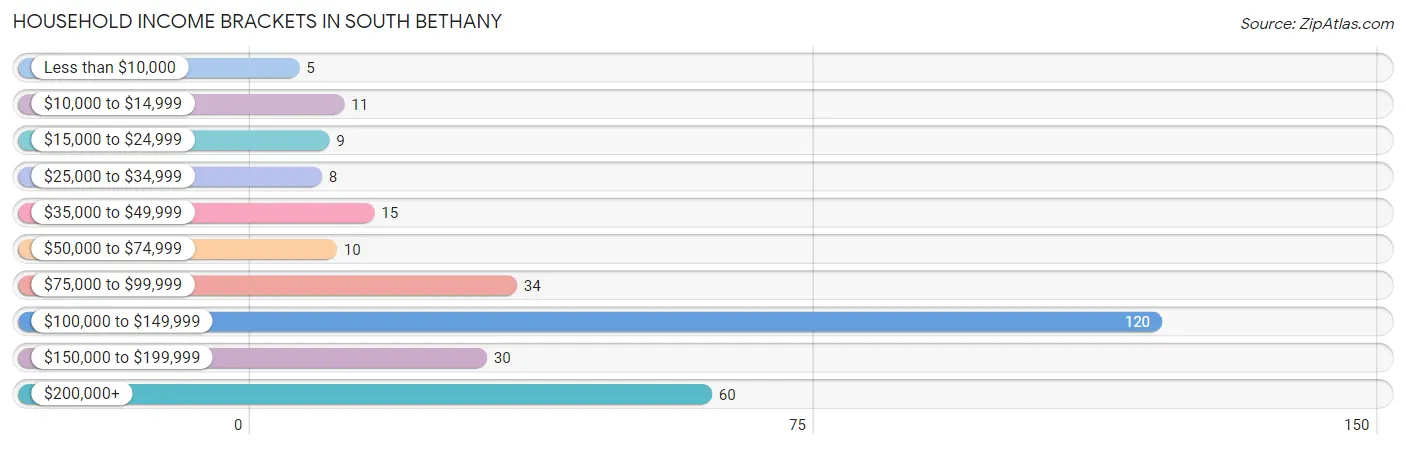
| Income Bracket | # Households | % Households |
| Less than $10,000 | 5 | 1.7% |
| $10,000 to $14,999 | 11 | 3.6% |
| $15,000 to $24,999 | 9 | 3.0% |
| $25,000 to $34,999 | 8 | 2.6% |
| $35,000 to $49,999 | 15 | 5.0% |
| $50,000 to $74,999 | 10 | 3.3% |
| $75,000 to $99,999 | 34 | 11.3% |
| $100,000 to $149,999 | 120 | 39.7% |
| $150,000 to $199,999 | 30 | 9.9% |
| $200,000+ | 60 | 19.9% |
Household Income by Householder Age in South Bethany
The median household income in South Bethany is $106,840, with the highest median household income of $171,250 found in the 45 to 64 years age bracket for the primary householder. A total of 74 households (24.5%) fall into this category. Meanwhile, the 15 to 24 years age bracket for the primary householder has the lowest median household income of $0, with 2 households (0.7%) in this group.
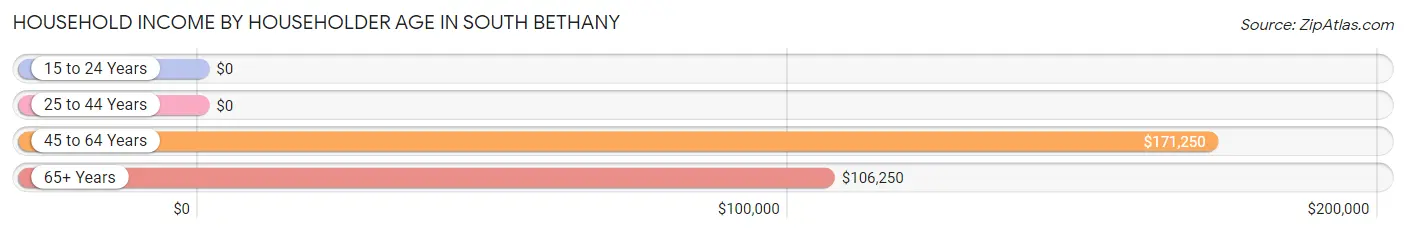
| Income Bracket | # Households | Median Income |
| 15 to 24 Years | 2 (0.7%) | $0 |
| 25 to 44 Years | 4 (1.3%) | $0 |
| 45 to 64 Years | 74 (24.5%) | $171,250 |
| 65+ Years | 222 (73.5%) | $106,250 |
| Total | 302 (100.0%) | $106,840 |
Poverty in South Bethany
Income Below Poverty by Sex and Age in South Bethany
With 4.6% poverty level for males and 6.2% for females among the residents of South Bethany, 55 to 64 year old males and 75 year old and over females are the most vulnerable to poverty, with 12 males (17.1%) and 8 females (14.0%) in their respective age groups living below the poverty level.
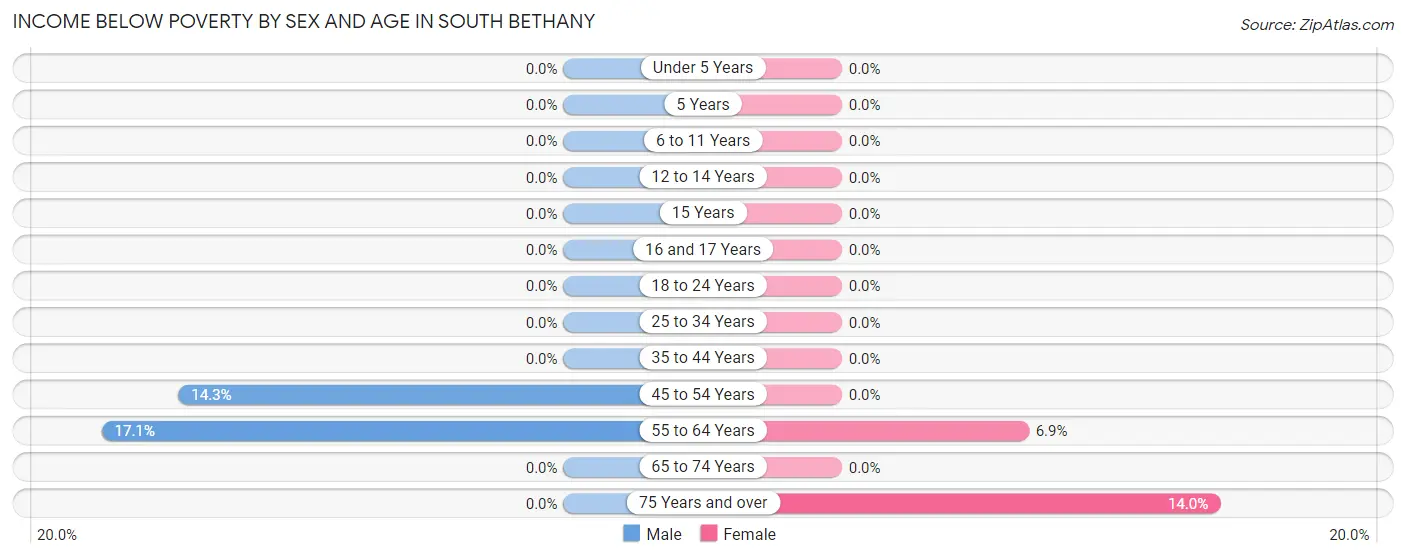
| Age Bracket | Male | Female |
| Under 5 Years | 0 (0.0%) | 0 (0.0%) |
| 5 Years | 0 (0.0%) | 0 (0.0%) |
| 6 to 11 Years | 0 (0.0%) | 0 (0.0%) |
| 12 to 14 Years | 0 (0.0%) | 0 (0.0%) |
| 15 Years | 0 (0.0%) | 0 (0.0%) |
| 16 and 17 Years | 0 (0.0%) | 0 (0.0%) |
| 18 to 24 Years | 0 (0.0%) | 0 (0.0%) |
| 25 to 34 Years | 0 (0.0%) | 0 (0.0%) |
| 35 to 44 Years | 0 (0.0%) | 0 (0.0%) |
| 45 to 54 Years | 1 (14.3%) | 0 (0.0%) |
| 55 to 64 Years | 12 (17.1%) | 5 (6.9%) |
| 65 to 74 Years | 0 (0.0%) | 0 (0.0%) |
| 75 Years and over | 0 (0.0%) | 8 (14.0%) |
| Total | 13 (4.6%) | 13 (6.2%) |
Income Above Poverty by Sex and Age in South Bethany
According to the poverty statistics in South Bethany, males aged 16 and 17 years and females aged 12 to 14 years are the age groups that are most secure financially, with 100.0% of males and 100.0% of females in these age groups living above the poverty line.
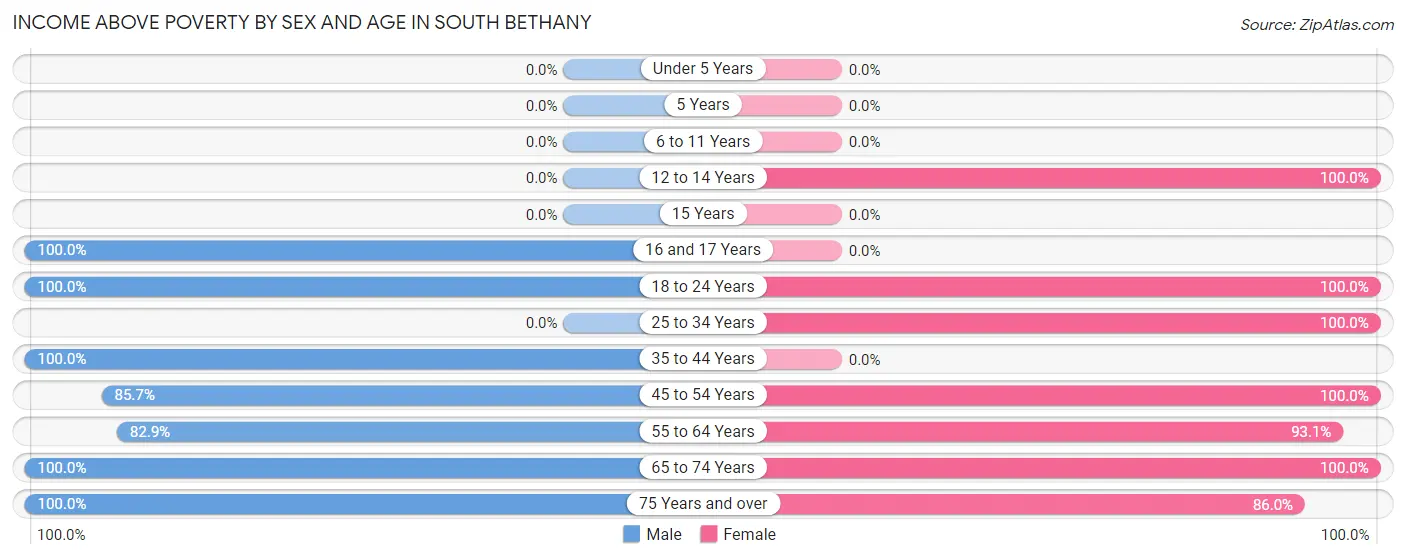
| Age Bracket | Male | Female |
| Under 5 Years | 0 (0.0%) | 0 (0.0%) |
| 5 Years | 0 (0.0%) | 0 (0.0%) |
| 6 to 11 Years | 0 (0.0%) | 0 (0.0%) |
| 12 to 14 Years | 0 (0.0%) | 2 (100.0%) |
| 15 Years | 0 (0.0%) | 0 (0.0%) |
| 16 and 17 Years | 2 (100.0%) | 0 (0.0%) |
| 18 to 24 Years | 1 (100.0%) | 5 (100.0%) |
| 25 to 34 Years | 0 (0.0%) | 7 (100.0%) |
| 35 to 44 Years | 7 (100.0%) | 0 (0.0%) |
| 45 to 54 Years | 6 (85.7%) | 10 (100.0%) |
| 55 to 64 Years | 58 (82.9%) | 67 (93.1%) |
| 65 to 74 Years | 136 (100.0%) | 56 (100.0%) |
| 75 Years and over | 58 (100.0%) | 49 (86.0%) |
| Total | 268 (95.4%) | 196 (93.8%) |
Income Below Poverty Among Married-Couple Families in South Bethany
The poverty statistics for married-couple families in South Bethany show that 2.4% or 5 of the total 212 families live below the poverty line. Families with no children have the highest poverty rate of 2.4%, comprising of 5 families. On the other hand, families with 1 or 2 children have the lowest poverty rate of 0.0%, which includes 0 families.
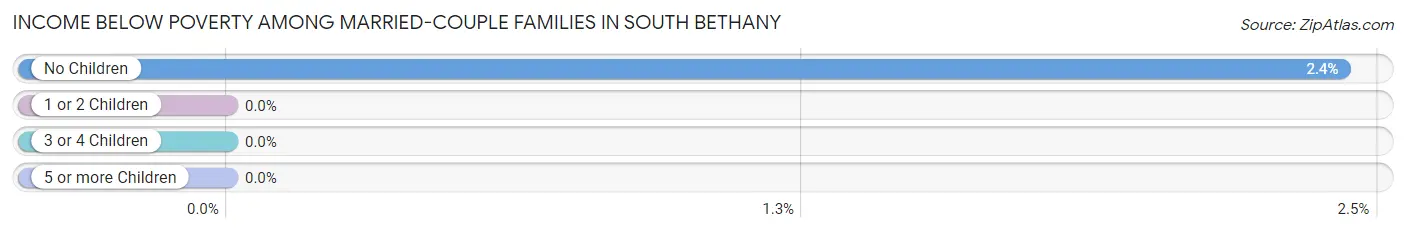
| Children | Above Poverty | Below Poverty |
| No Children | 202 (97.6%) | 5 (2.4%) |
| 1 or 2 Children | 5 (100.0%) | 0 (0.0%) |
| 3 or 4 Children | 0 (0.0%) | 0 (0.0%) |
| 5 or more Children | 0 (0.0%) | 0 (0.0%) |
| Total | 207 (97.6%) | 5 (2.4%) |
Income Below Poverty Among Single-Parent Households in South Bethany
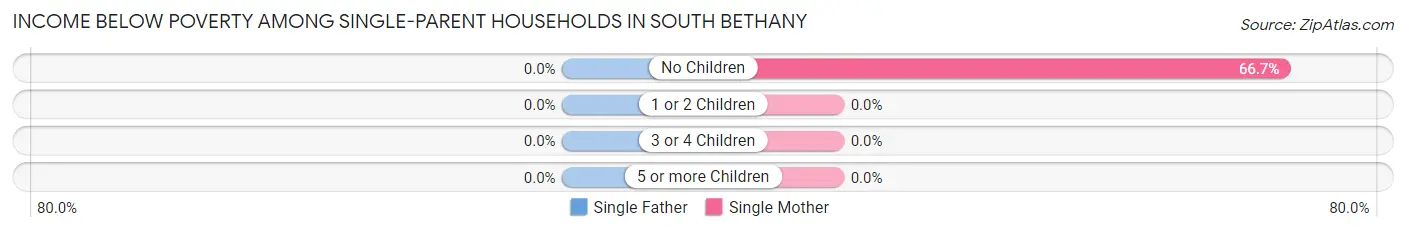
| Children | Single Father | Single Mother |
| No Children | 0 (0.0%) | 4 (66.7%) |
| 1 or 2 Children | 0 (0.0%) | 0 (0.0%) |
| 3 or 4 Children | 0 (0.0%) | 0 (0.0%) |
| 5 or more Children | 0 (0.0%) | 0 (0.0%) |
| Total | 0 (0.0%) | 4 (66.7%) |
Income Below Poverty Among Married-Couple vs Single-Parent Households in South Bethany
The poverty data for South Bethany shows that 5 of the married-couple family households (2.4%) and 4 of the single-parent households (50.0%) are living below the poverty level. Within the married-couple family households, those with no children have the highest poverty rate, with 5 households (2.4%) falling below the poverty line. Among the single-parent households, those with no children have the highest poverty rate, with 4 household (50.0%) living below poverty.
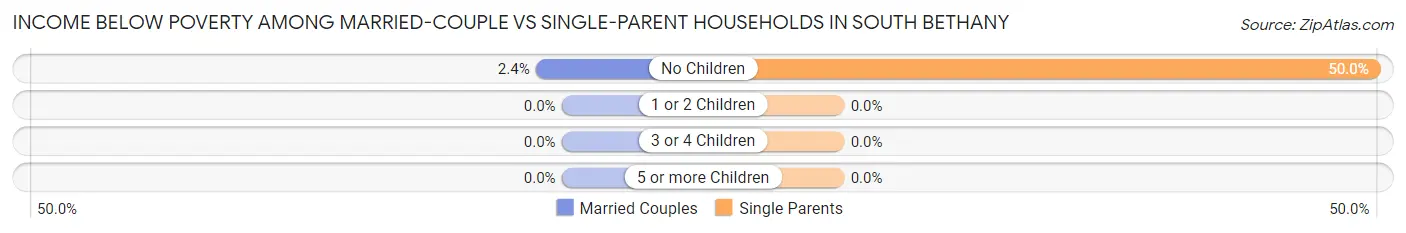
| Children | Married-Couple Families | Single-Parent Households |
| No Children | 5 (2.4%) | 4 (50.0%) |
| 1 or 2 Children | 0 (0.0%) | 0 (0.0%) |
| 3 or 4 Children | 0 (0.0%) | 0 (0.0%) |
| 5 or more Children | 0 (0.0%) | 0 (0.0%) |
| Total | 5 (2.4%) | 4 (50.0%) |
Race in South Bethany
The most populous races in South Bethany are White / Caucasian (409 | 83.5%), Two or more Races (72 | 14.7%), and Native / Alaskan (6 | 1.2%).
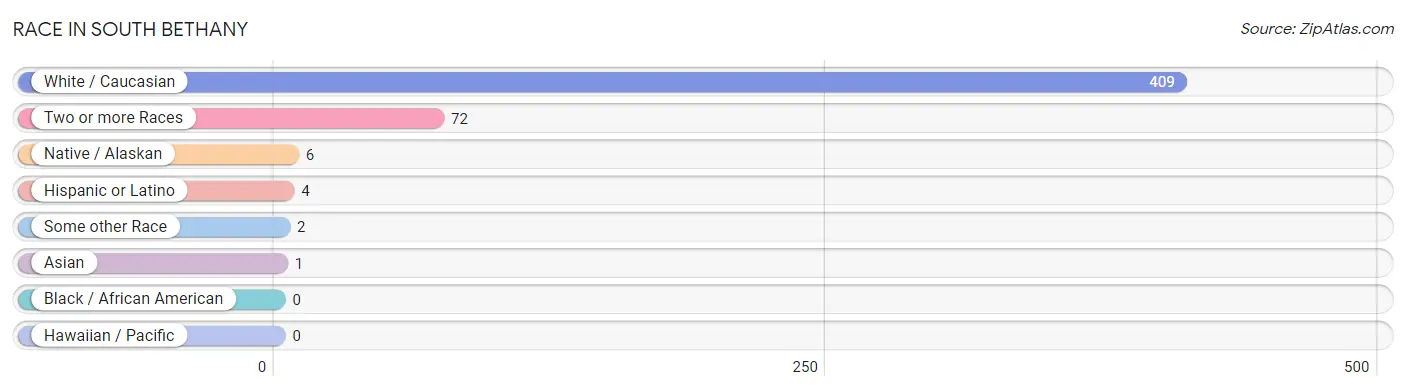
| Race | # Population | % Population |
| Asian | 1 | 0.2% |
| Black / African American | 0 | 0.0% |
| Hawaiian / Pacific | 0 | 0.0% |
| Hispanic or Latino | 4 | 0.8% |
| Native / Alaskan | 6 | 1.2% |
| White / Caucasian | 409 | 83.5% |
| Two or more Races | 72 | 14.7% |
| Some other Race | 2 | 0.4% |
| Total | 490 | 100.0% |
Ancestry in South Bethany
The most populous ancestries reported in South Bethany are German (136 | 27.8%), Irish (103 | 21.0%), English (89 | 18.2%), British (79 | 16.1%), and Italian (70 | 14.3%), together accounting for 97.4% of all South Bethany residents.
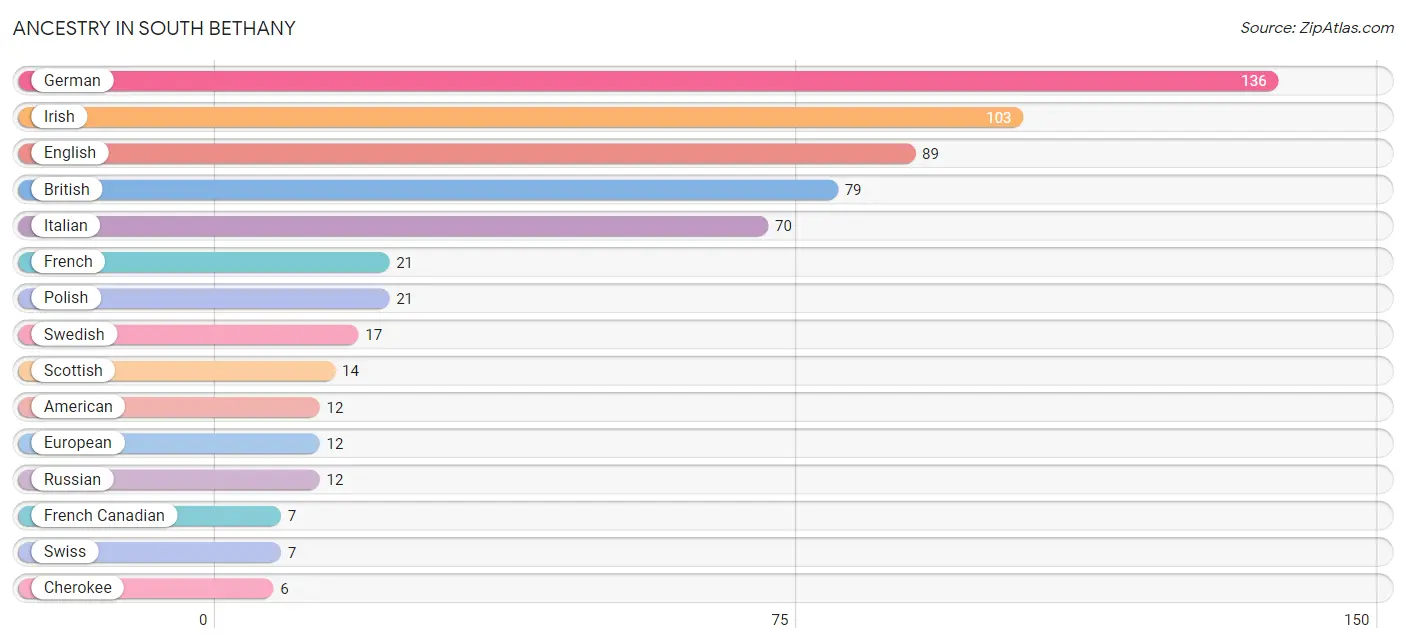
| Ancestry | # Population | % Population |
| American | 12 | 2.5% |
| Arab | 3 | 0.6% |
| Armenian | 2 | 0.4% |
| Austrian | 1 | 0.2% |
| Belgian | 3 | 0.6% |
| British | 79 | 16.1% |
| Central American | 3 | 0.6% |
| Cherokee | 6 | 1.2% |
| Croatian | 2 | 0.4% |
| Czech | 1 | 0.2% |
| Czechoslovakian | 2 | 0.4% |
| Danish | 1 | 0.2% |
| Dutch | 5 | 1.0% |
| Eastern European | 4 | 0.8% |
| Egyptian | 2 | 0.4% |
| English | 89 | 18.2% |
| European | 12 | 2.5% |
| French | 21 | 4.3% |
| French Canadian | 7 | 1.4% |
| German | 136 | 27.8% |
| Guatemalan | 1 | 0.2% |
| Honduran | 2 | 0.4% |
| Hungarian | 4 | 0.8% |
| Indian (Asian) | 1 | 0.2% |
| Irish | 103 | 21.0% |
| Italian | 70 | 14.3% |
| Lebanese | 1 | 0.2% |
| Lithuanian | 2 | 0.4% |
| Polish | 21 | 4.3% |
| Puerto Rican | 1 | 0.2% |
| Russian | 12 | 2.5% |
| Scotch-Irish | 3 | 0.6% |
| Scottish | 14 | 2.9% |
| Slovak | 4 | 0.8% |
| Swedish | 17 | 3.5% |
| Swiss | 7 | 1.4% |
| Ukrainian | 1 | 0.2% |
| Welsh | 6 | 1.2% | View All 38 Rows |
Immigrants in South Bethany
The most numerous immigrant groups reported in South Bethany came from Central America (5 | 1.0%), Latin America (5 | 1.0%), Europe (3 | 0.6%), Eastern Europe (2 | 0.4%), and Honduras (2 | 0.4%), together accounting for 3.5% of all South Bethany residents.
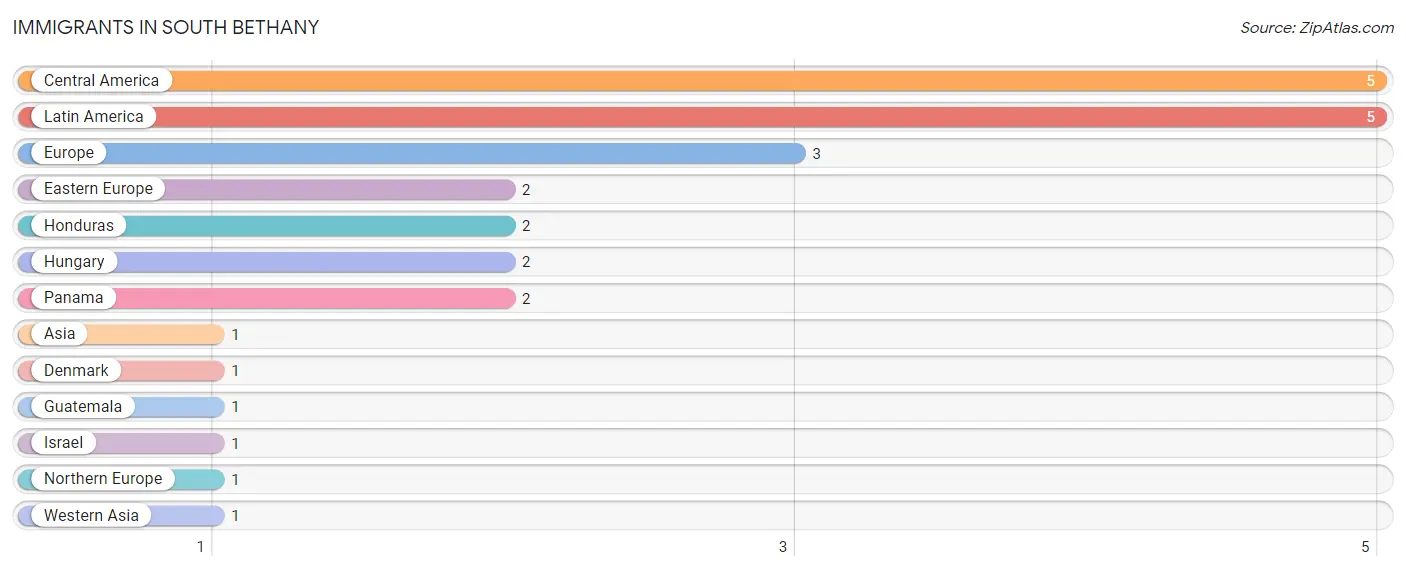
| Immigration Origin | # Population | % Population |
| Asia | 1 | 0.2% |
| Central America | 5 | 1.0% |
| Denmark | 1 | 0.2% |
| Eastern Europe | 2 | 0.4% |
| Europe | 3 | 0.6% |
| Guatemala | 1 | 0.2% |
| Honduras | 2 | 0.4% |
| Hungary | 2 | 0.4% |
| Israel | 1 | 0.2% |
| Latin America | 5 | 1.0% |
| Northern Europe | 1 | 0.2% |
| Panama | 2 | 0.4% |
| Western Asia | 1 | 0.2% | View All 13 Rows |
Sex and Age in South Bethany
Sex and Age in South Bethany
The most populous age groups in South Bethany are 70 to 74 Years (98 | 34.9%) for men and 60 to 64 Years (45 | 21.5%) for women.
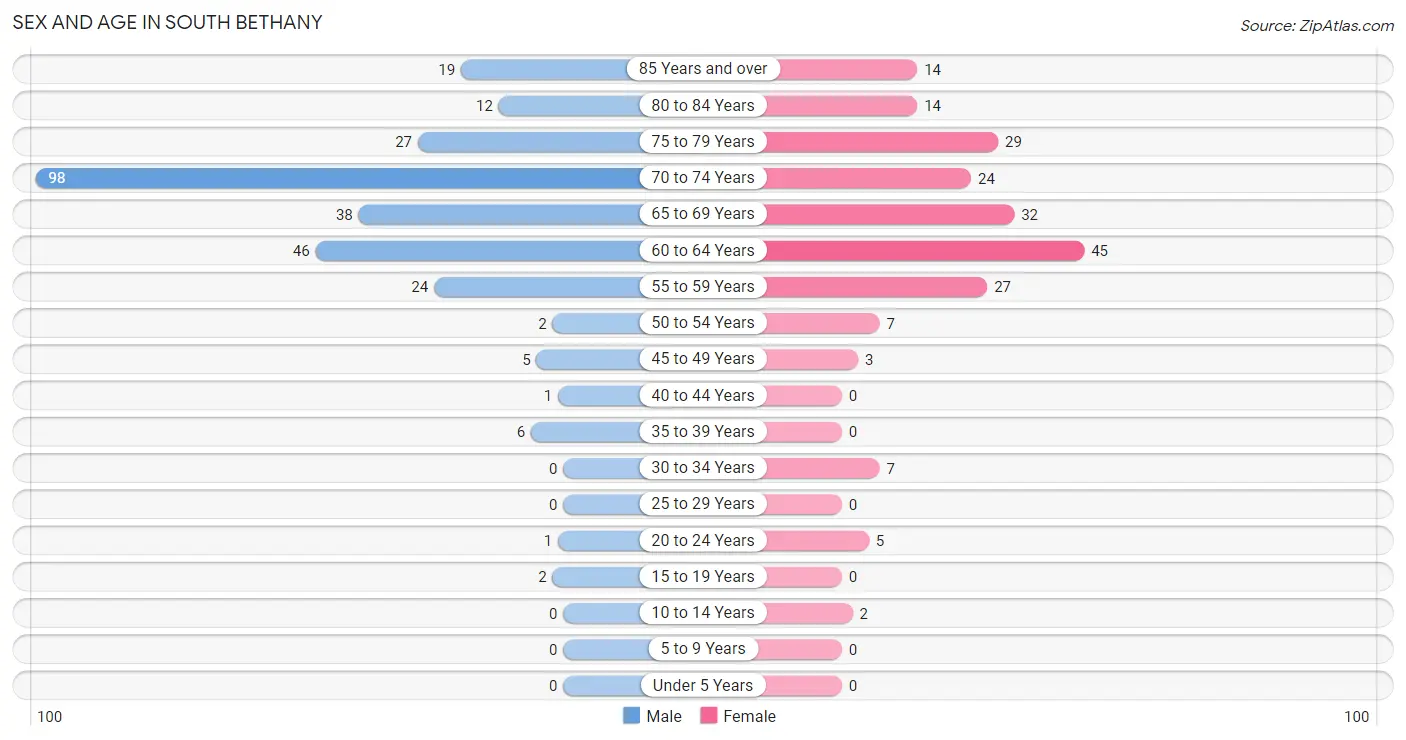
| Age Bracket | Male | Female |
| Under 5 Years | 0 (0.0%) | 0 (0.0%) |
| 5 to 9 Years | 0 (0.0%) | 0 (0.0%) |
| 10 to 14 Years | 0 (0.0%) | 2 (1.0%) |
| 15 to 19 Years | 2 (0.7%) | 0 (0.0%) |
| 20 to 24 Years | 1 (0.4%) | 5 (2.4%) |
| 25 to 29 Years | 0 (0.0%) | 0 (0.0%) |
| 30 to 34 Years | 0 (0.0%) | 7 (3.4%) |
| 35 to 39 Years | 6 (2.1%) | 0 (0.0%) |
| 40 to 44 Years | 1 (0.4%) | 0 (0.0%) |
| 45 to 49 Years | 5 (1.8%) | 3 (1.4%) |
| 50 to 54 Years | 2 (0.7%) | 7 (3.4%) |
| 55 to 59 Years | 24 (8.5%) | 27 (12.9%) |
| 60 to 64 Years | 46 (16.4%) | 45 (21.5%) |
| 65 to 69 Years | 38 (13.5%) | 32 (15.3%) |
| 70 to 74 Years | 98 (34.9%) | 24 (11.5%) |
| 75 to 79 Years | 27 (9.6%) | 29 (13.9%) |
| 80 to 84 Years | 12 (4.3%) | 14 (6.7%) |
| 85 Years and over | 19 (6.8%) | 14 (6.7%) |
| Total | 281 (100.0%) | 209 (100.0%) |
Families and Households in South Bethany
Median Family Size in South Bethany
The median family size in South Bethany is 1.83 persons per family, with single female/mother families (6 | 2.7%) accounting for the largest median family size of 2.67 persons per family. On the other hand, married-couple families (212 | 96.4%) represent the smallest median family size with 1.80 persons per family.
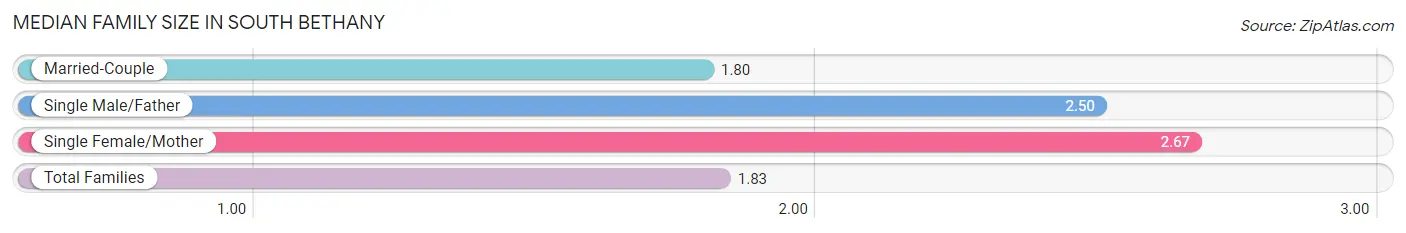
| Family Type | # Families | Family Size |
| Married-Couple | 212 (96.4%) | 1.80 |
| Single Male/Father | 2 (0.9%) | 2.50 |
| Single Female/Mother | 6 (2.7%) | 2.67 |
| Total Families | 220 (100.0%) | 1.83 |
Median Household Size in South Bethany
The median household size in South Bethany is 1.62 persons per household, with single female/mother households (6 | 2.0%) accounting for the largest median household size of 2.67 persons per household. non-family households (82 | 27.2%) represent the smallest median household size with 1.06 persons per household.
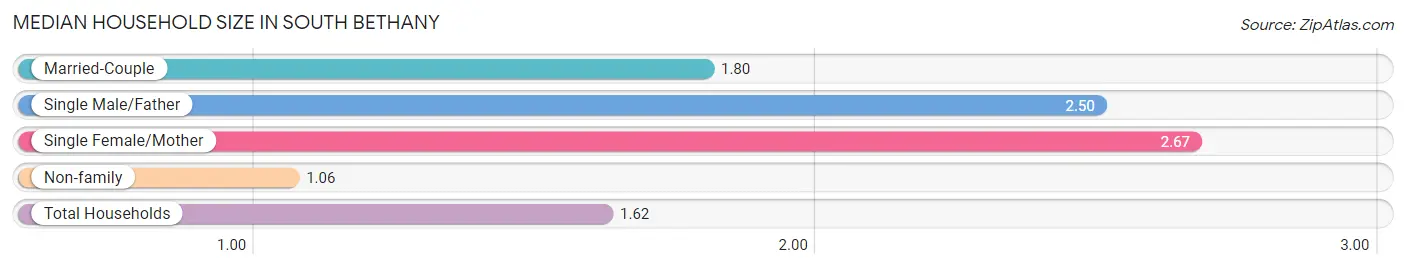
| Household Type | # Households | Household Size |
| Married-Couple | 212 (70.2%) | 1.80 |
| Single Male/Father | 2 (0.7%) | 2.50 |
| Single Female/Mother | 6 (2.0%) | 2.67 |
| Non-family | 82 (27.2%) | 1.06 |
| Total Households | 302 (100.0%) | 1.62 |
Household Size by Marriage Status in South Bethany
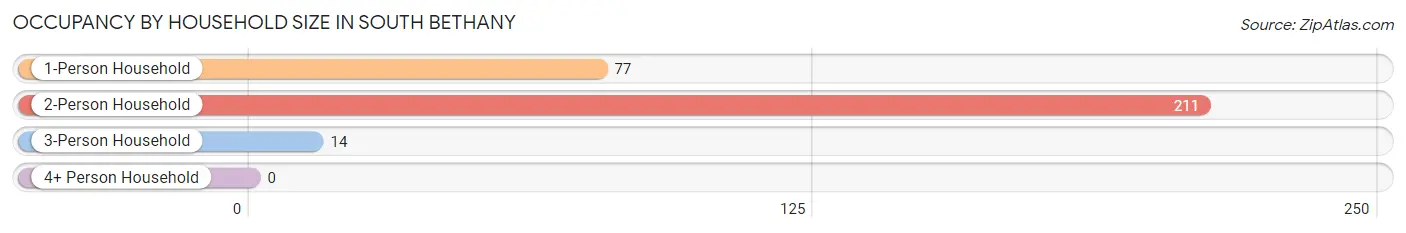
Out of a total of 302 households in South Bethany, 220 (72.9%) are family households, while 82 (27.2%) are nonfamily households. The most numerous type of family households are 2-person households, comprising 206, and the most common type of nonfamily households are 1-person households, comprising 77.
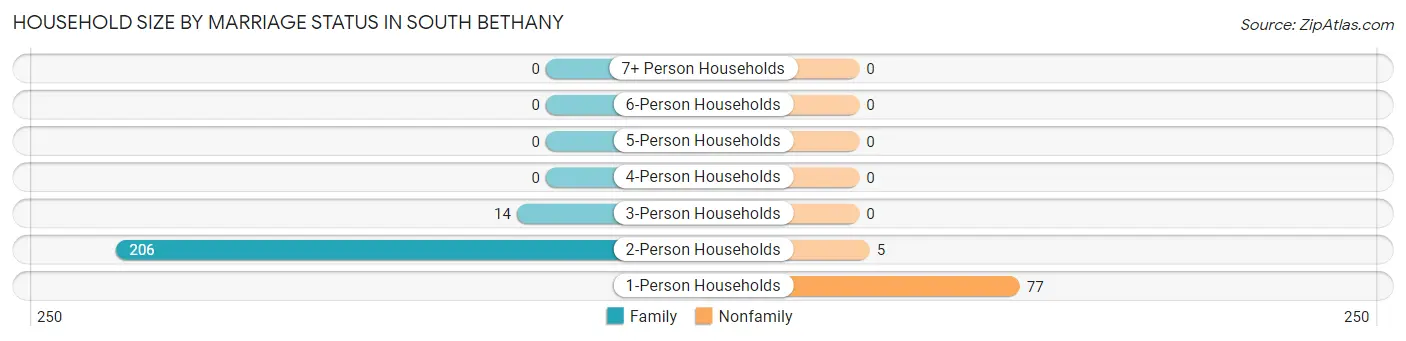
| Household Size | Family Households | Nonfamily Households |
| 1-Person Households | - | 77 (25.5%) |
| 2-Person Households | 206 (68.2%) | 5 (1.7%) |
| 3-Person Households | 14 (4.6%) | 0 (0.0%) |
| 4-Person Households | 0 (0.0%) | 0 (0.0%) |
| 5-Person Households | 0 (0.0%) | 0 (0.0%) |
| 6-Person Households | 0 (0.0%) | 0 (0.0%) |
| 7+ Person Households | 0 (0.0%) | 0 (0.0%) |
| Total | 220 (72.9%) | 82 (27.2%) |
Female Fertility in South Bethany
Fertility by Age in South Bethany
| Age Bracket | Women with Births | Births / 1,000 Women |
| 15 to 19 years | 0 (0.0%) | 0.0 |
| 20 to 34 years | 0 (0.0%) | 0.0 |
| 35 to 50 years | 0 (0.0%) | 0.0 |
| Total | 0 (0.0%) | 0.0 |
Fertility by Age by Marriage Status in South Bethany
| Age Bracket | Married | Unmarried |
| 15 to 19 years | 0 (0.0%) | 0 (0.0%) |
| 20 to 34 years | 0 (0.0%) | 0 (0.0%) |
| 35 to 50 years | 0 (0.0%) | 0 (0.0%) |
| Total | 0 (0.0%) | 0 (0.0%) |
Fertility by Education in South Bethany
| Educational Attainment | Women with Births | Births / 1,000 Women |
| Less than High School | 0 (0.0%) | 0.0 |
| High School Diploma | 0 (0.0%) | 0.0 |
| College or Associate's Degree | 0 (0.0%) | 0.0 |
| Bachelor's Degree | 0 (0.0%) | 0.0 |
| Graduate Degree | 0 (0.0%) | 0.0 |
| Total | 0 (0.0%) | 0.0 |
Fertility by Education by Marriage Status in South Bethany
| Educational Attainment | Married | Unmarried |
| Less than High School | 0 (0.0%) | 0 (0.0%) |
| High School Diploma | 0 (0.0%) | 0 (0.0%) |
| College or Associate's Degree | 0 (0.0%) | 0 (0.0%) |
| Bachelor's Degree | 0 (0.0%) | 0 (0.0%) |
| Graduate Degree | 0 (0.0%) | 0 (0.0%) |
| Total | 0 (0.0%) | 0 (0.0%) |
Employment Characteristics in South Bethany
Employment by Class of Employer in South Bethany
Among the 138 employed individuals in South Bethany, private company employees (98 | 71.0%), self-employed (incorporated) (19 | 13.8%), and local government employees (7 | 5.1%) make up the most common classes of employment.
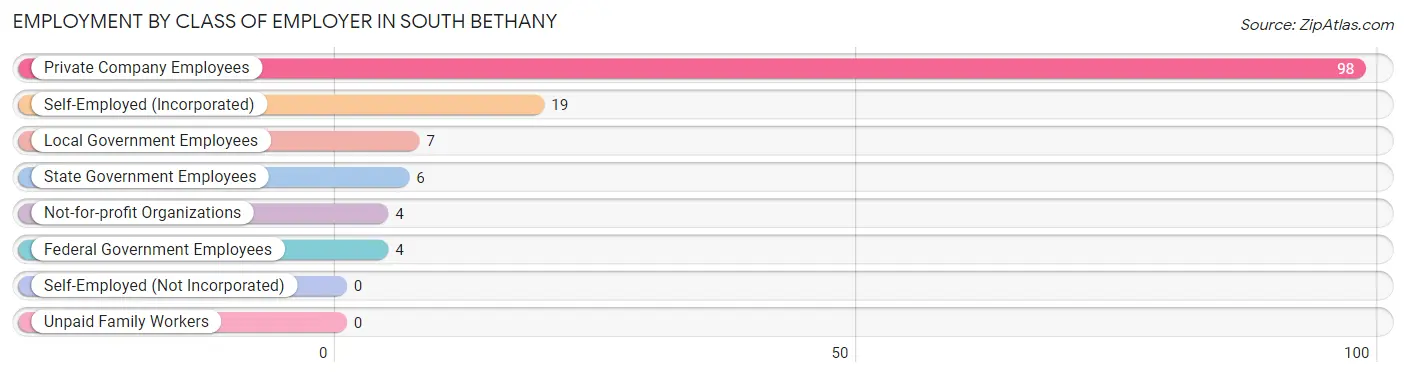
| Employer Class | # Employees | % Employees |
| Private Company Employees | 98 | 71.0% |
| Self-Employed (Incorporated) | 19 | 13.8% |
| Self-Employed (Not Incorporated) | 0 | 0.0% |
| Not-for-profit Organizations | 4 | 2.9% |
| Local Government Employees | 7 | 5.1% |
| State Government Employees | 6 | 4.3% |
| Federal Government Employees | 4 | 2.9% |
| Unpaid Family Workers | 0 | 0.0% |
| Total | 138 | 100.0% |
Employment Status by Age in South Bethany
According to the labor force statistics for South Bethany, out of the total population over 16 years of age (488), 30.7% or 150 individuals are in the labor force, with 4.0% or 6 of them unemployed. The age group with the highest labor force participation rate is 20 to 24 years, with 100.0% or 6 individuals in the labor force. Within the labor force, the 75 years and over age range has the highest percentage of unemployed individuals, with 20.0% or 2 of them being unemployed.
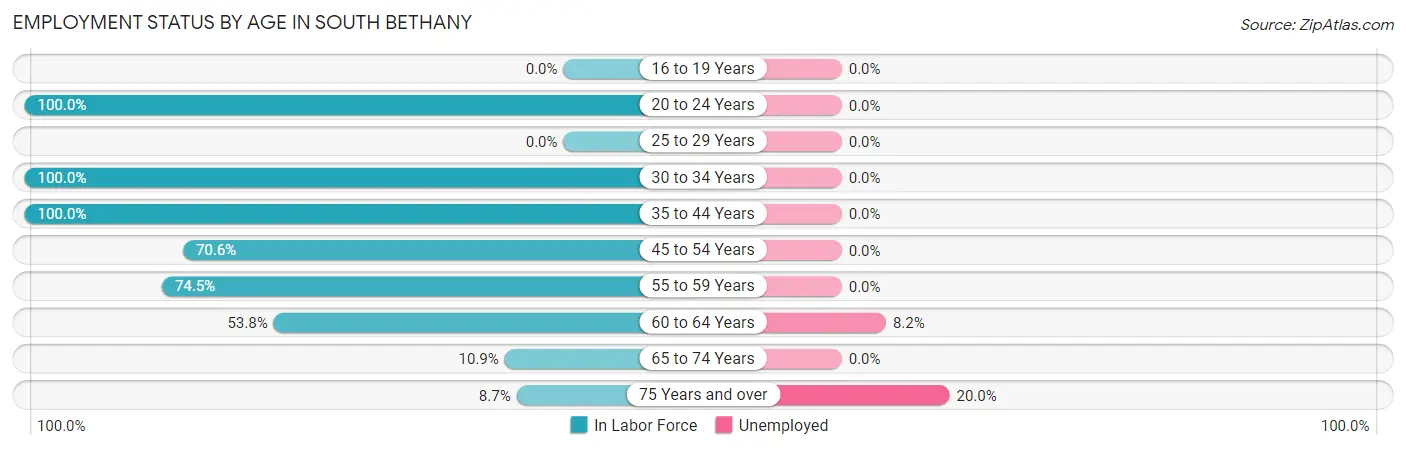
| Age Bracket | In Labor Force | Unemployed |
| 16 to 19 Years | 0 (0.0%) | 0 (0.0%) |
| 20 to 24 Years | 6 (100.0%) | 0 (0.0%) |
| 25 to 29 Years | 0 (0.0%) | 0 (0.0%) |
| 30 to 34 Years | 7 (100.0%) | 0 (0.0%) |
| 35 to 44 Years | 7 (100.0%) | 0 (0.0%) |
| 45 to 54 Years | 12 (70.6%) | 0 (0.0%) |
| 55 to 59 Years | 38 (74.5%) | 0 (0.0%) |
| 60 to 64 Years | 49 (53.8%) | 4 (8.2%) |
| 65 to 74 Years | 21 (10.9%) | 0 (0.0%) |
| 75 Years and over | 10 (8.7%) | 2 (20.0%) |
| Total | 150 (30.7%) | 6 (4.0%) |
Employment Status by Educational Attainment in South Bethany
According to labor force statistics for South Bethany, 65.3% of individuals (113) out of the total population between 25 and 64 years of age (173) are in the labor force, with 3.5% or 4 of them being unemployed. The group with the highest labor force participation rate are those with the educational attainment of high school diploma, with 85.7% or 12 individuals in the labor force. Within the labor force, individuals with high school diploma education have the highest percentage of unemployment, with 16.7% or 2 of them being unemployed.
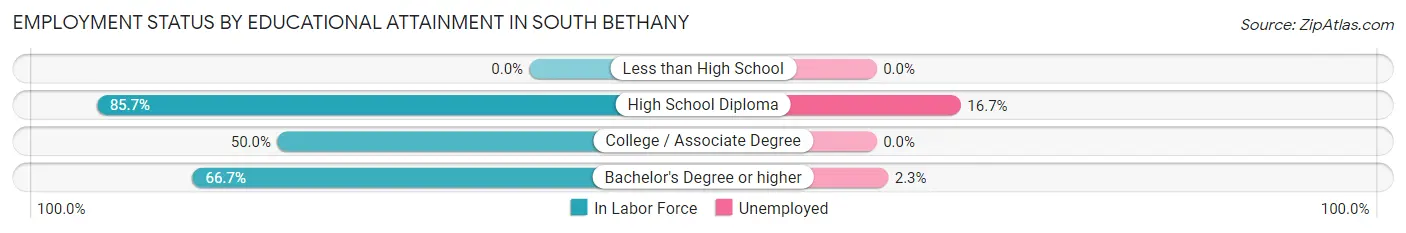
| Educational Attainment | In Labor Force | Unemployed |
| Less than High School | 0 (0.0%) | 0 (0.0%) |
| High School Diploma | 12 (85.7%) | 2 (16.7%) |
| College / Associate Degree | 15 (50.0%) | 0 (0.0%) |
| Bachelor's Degree or higher | 86 (66.7%) | 3 (2.3%) |
| Total | 113 (65.3%) | 6 (3.5%) |
Employment Occupations by Sex in South Bethany
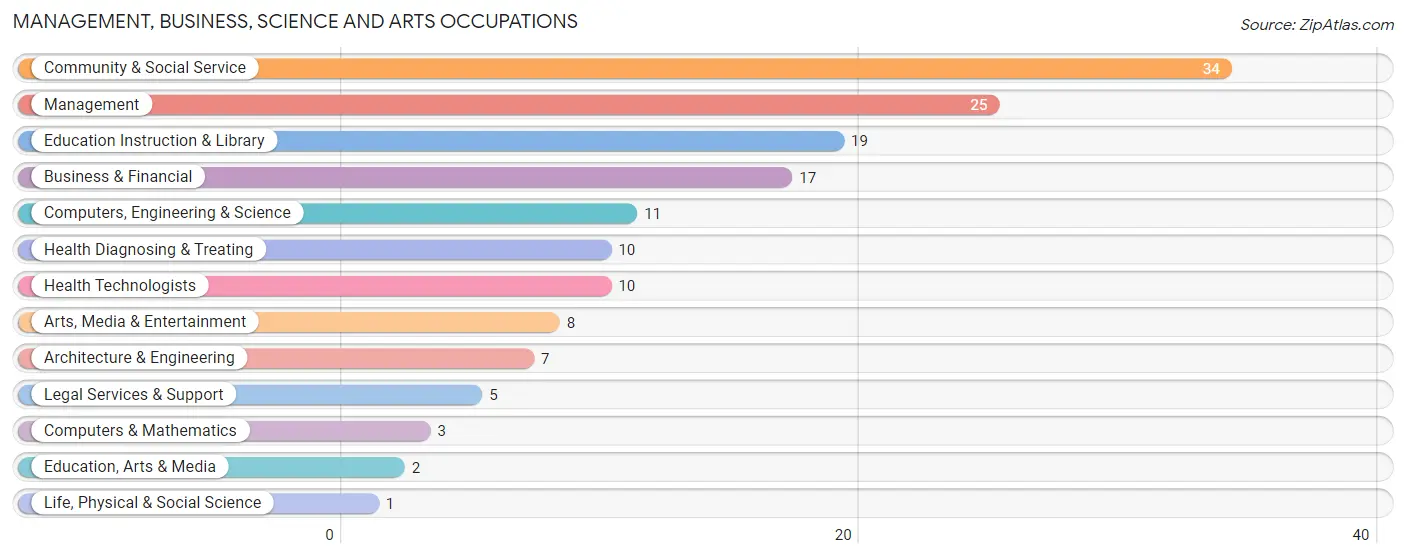
Management, Business, Science and Arts Occupations
The most common Management, Business, Science and Arts occupations in South Bethany are Community & Social Service (34 | 23.6%), Management (25 | 17.4%), Education Instruction & Library (19 | 13.2%), Business & Financial (17 | 11.8%), and Computers, Engineering & Science (11 | 7.6%).
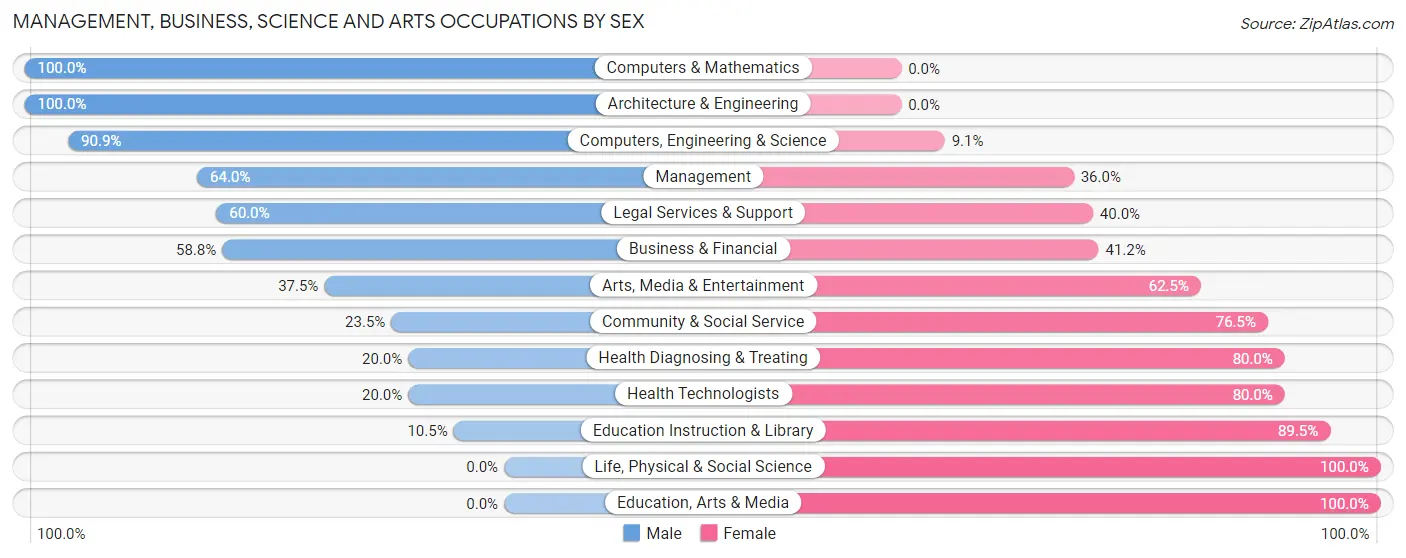
Management, Business, Science and Arts Occupations by Sex
Within the Management, Business, Science and Arts occupations in South Bethany, the most male-oriented occupations are Computers & Mathematics (100.0%), Architecture & Engineering (100.0%), and Computers, Engineering & Science (90.9%), while the most female-oriented occupations are Life, Physical & Social Science (100.0%), Education, Arts & Media (100.0%), and Education Instruction & Library (89.5%).
| Occupation | Male | Female |
| Management | 16 (64.0%) | 9 (36.0%) |
| Business & Financial | 10 (58.8%) | 7 (41.2%) |
| Computers, Engineering & Science | 10 (90.9%) | 1 (9.1%) |
| Computers & Mathematics | 3 (100.0%) | 0 (0.0%) |
| Architecture & Engineering | 7 (100.0%) | 0 (0.0%) |
| Life, Physical & Social Science | 0 (0.0%) | 1 (100.0%) |
| Community & Social Service | 8 (23.5%) | 26 (76.5%) |
| Education, Arts & Media | 0 (0.0%) | 2 (100.0%) |
| Legal Services & Support | 3 (60.0%) | 2 (40.0%) |
| Education Instruction & Library | 2 (10.5%) | 17 (89.5%) |
| Arts, Media & Entertainment | 3 (37.5%) | 5 (62.5%) |
| Health Diagnosing & Treating | 2 (20.0%) | 8 (80.0%) |
| Health Technologists | 2 (20.0%) | 8 (80.0%) |
| Total (Category) | 46 (47.4%) | 51 (52.6%) |
| Total (Overall) | 74 (51.4%) | 70 (48.6%) |
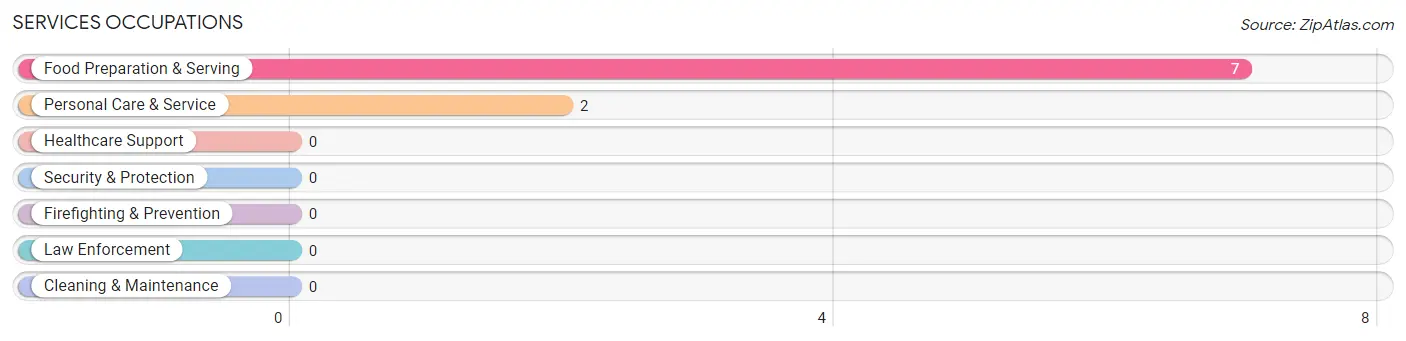
Services Occupations
The most common Services occupations in South Bethany are Food Preparation & Serving (7 | 4.9%), and Personal Care & Service (2 | 1.4%).
Services Occupations by Sex
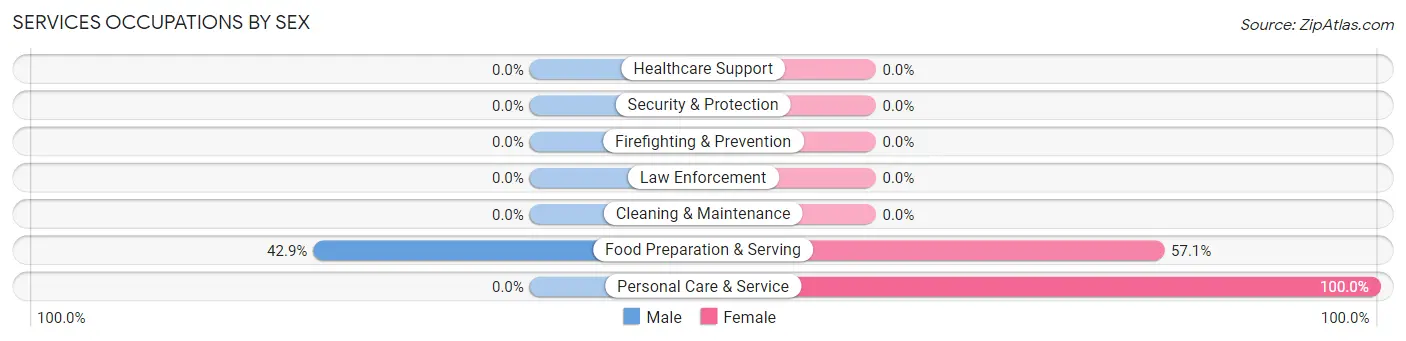
| Occupation | Male | Female |
| Healthcare Support | 0 (0.0%) | 0 (0.0%) |
| Security & Protection | 0 (0.0%) | 0 (0.0%) |
| Firefighting & Prevention | 0 (0.0%) | 0 (0.0%) |
| Law Enforcement | 0 (0.0%) | 0 (0.0%) |
| Food Preparation & Serving | 3 (42.9%) | 4 (57.1%) |
| Cleaning & Maintenance | 0 (0.0%) | 0 (0.0%) |
| Personal Care & Service | 0 (0.0%) | 2 (100.0%) |
| Total (Category) | 3 (33.3%) | 6 (66.7%) |
| Total (Overall) | 74 (51.4%) | 70 (48.6%) |
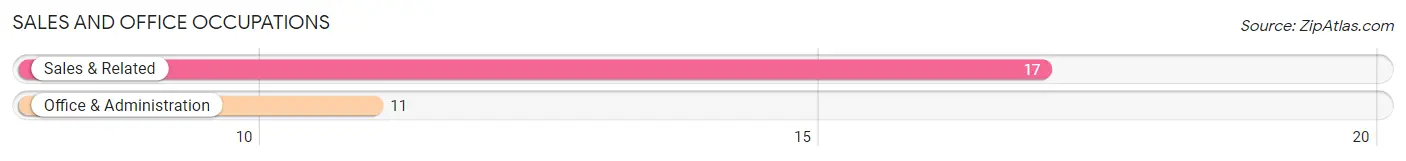
Sales and Office Occupations
The most common Sales and Office occupations in South Bethany are Sales & Related (17 | 11.8%), and Office & Administration (11 | 7.6%).
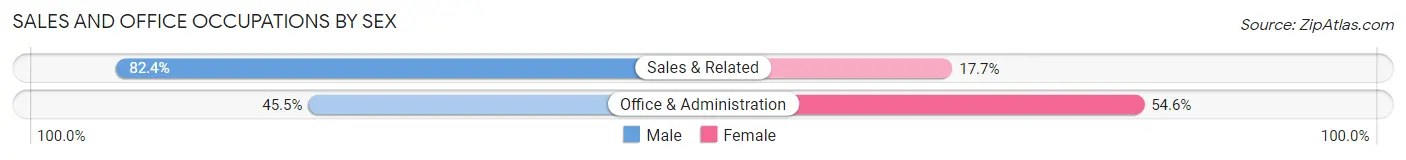
Sales and Office Occupations by Sex
| Occupation | Male | Female |
| Sales & Related | 14 (82.4%) | 3 (17.6%) |
| Office & Administration | 5 (45.5%) | 6 (54.5%) |
| Total (Category) | 19 (67.9%) | 9 (32.1%) |
| Total (Overall) | 74 (51.4%) | 70 (48.6%) |
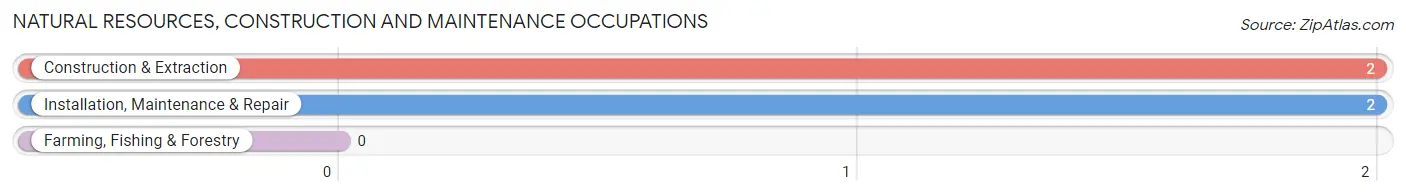
Natural Resources, Construction and Maintenance Occupations
The most common Natural Resources, Construction and Maintenance occupations in South Bethany are Construction & Extraction (2 | 1.4%), and Installation, Maintenance & Repair (2 | 1.4%).
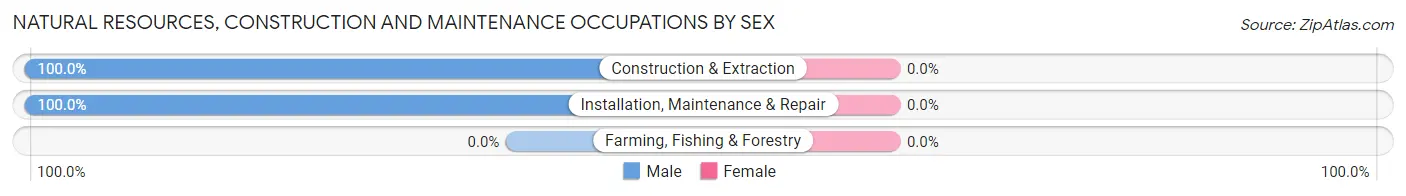
Natural Resources, Construction and Maintenance Occupations by Sex
| Occupation | Male | Female |
| Farming, Fishing & Forestry | 0 (0.0%) | 0 (0.0%) |
| Construction & Extraction | 2 (100.0%) | 0 (0.0%) |
| Installation, Maintenance & Repair | 2 (100.0%) | 0 (0.0%) |
| Total (Category) | 4 (100.0%) | 0 (0.0%) |
| Total (Overall) | 74 (51.4%) | 70 (48.6%) |
Production, Transportation and Moving Occupations
The most common Production, Transportation and Moving occupations in South Bethany are Production (4 | 2.8%), Transportation (1 | 0.7%), and Material Moving (1 | 0.7%).
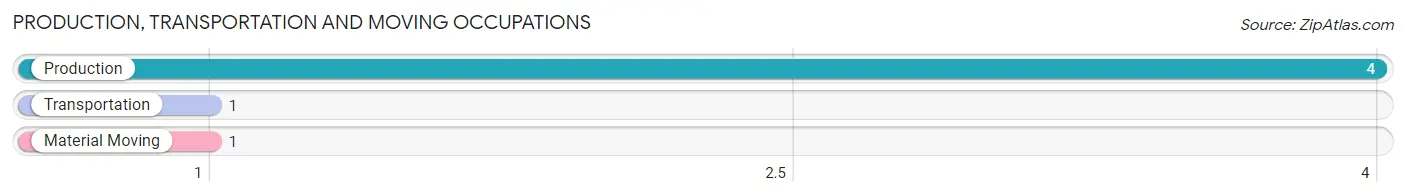
Production, Transportation and Moving Occupations by Sex
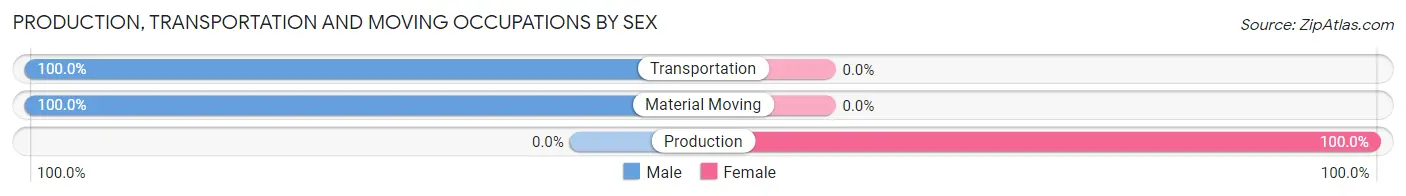
| Occupation | Male | Female |
| Production | 0 (0.0%) | 4 (100.0%) |
| Transportation | 1 (100.0%) | 0 (0.0%) |
| Material Moving | 1 (100.0%) | 0 (0.0%) |
| Total (Category) | 2 (33.3%) | 4 (66.7%) |
| Total (Overall) | 74 (51.4%) | 70 (48.6%) |
Employment Industries by Sex in South Bethany
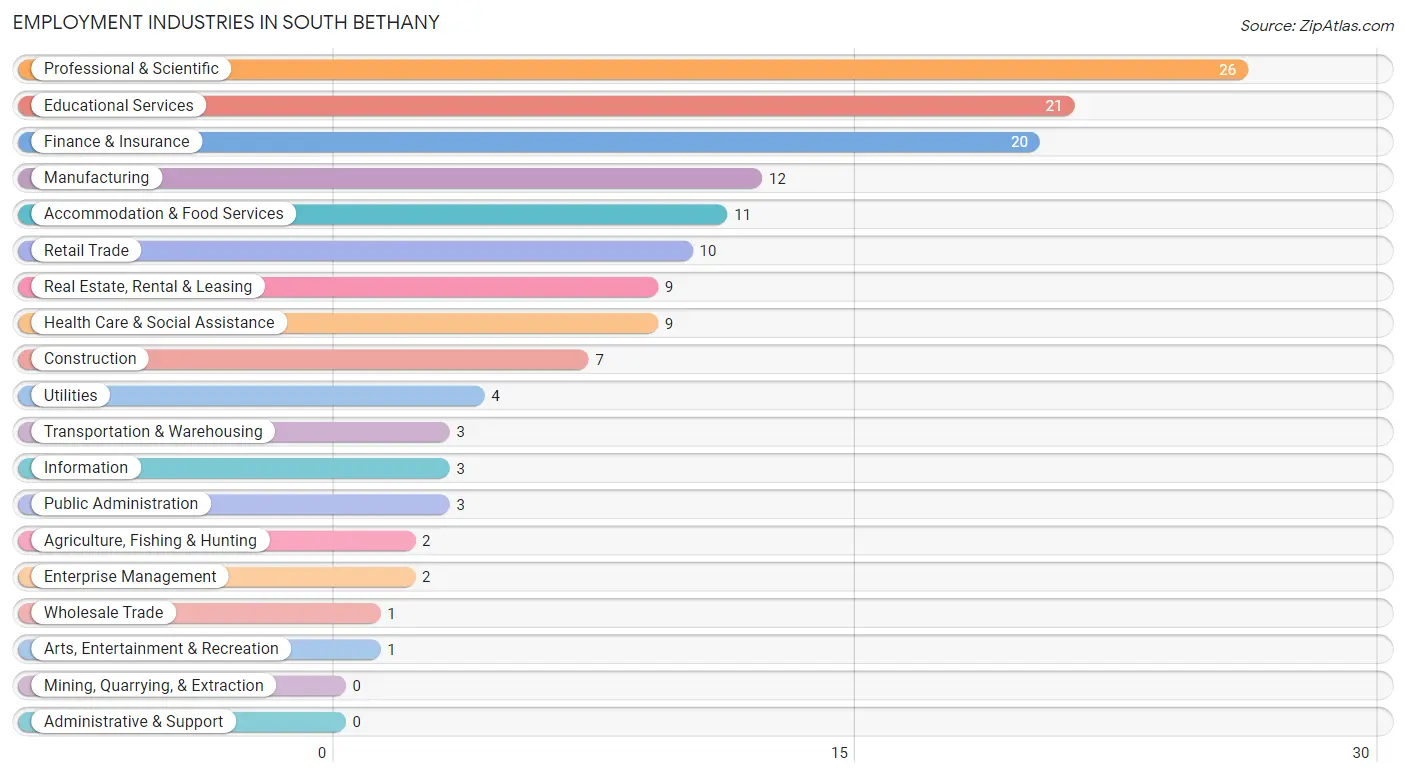
Employment Industries in South Bethany
The major employment industries in South Bethany include Professional & Scientific (26 | 18.1%), Educational Services (21 | 14.6%), Finance & Insurance (20 | 13.9%), Manufacturing (12 | 8.3%), and Accommodation & Food Services (11 | 7.6%).
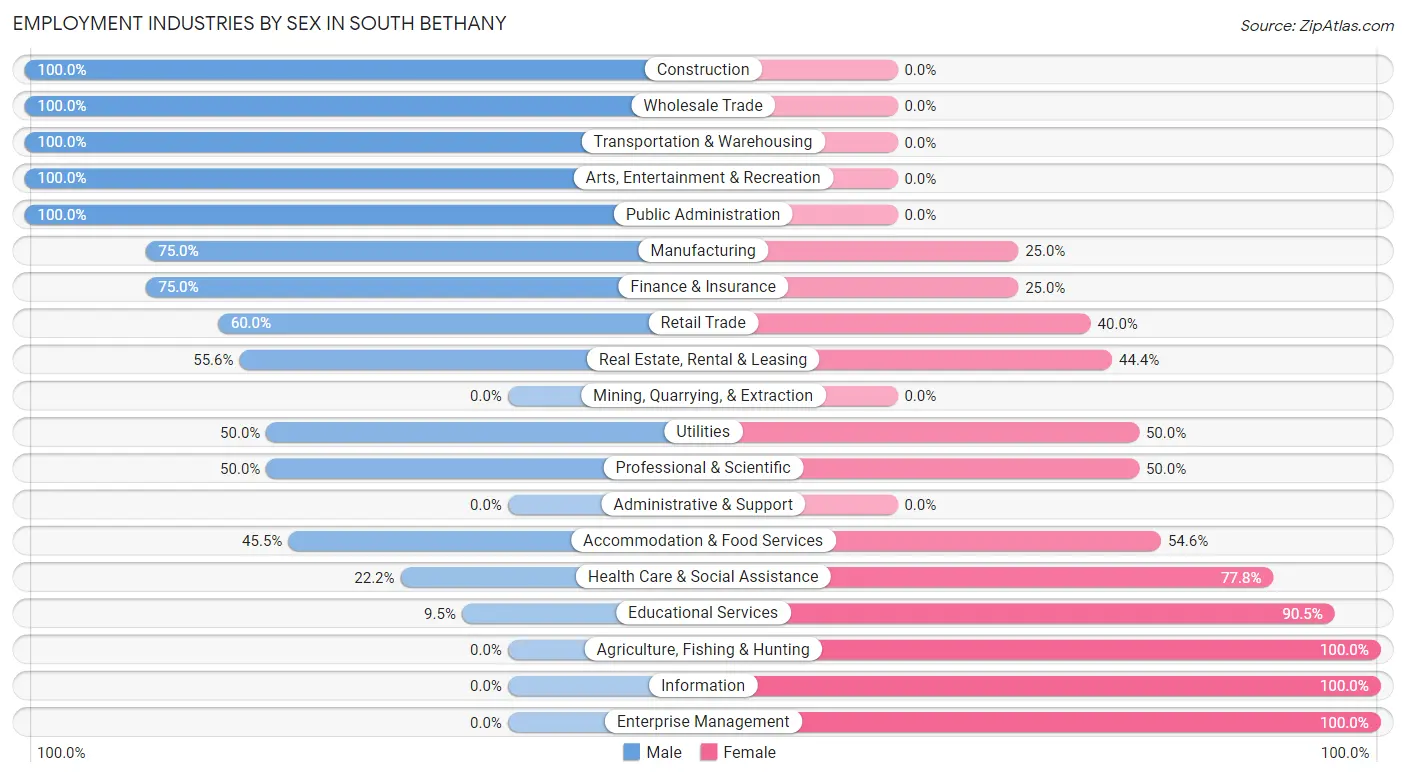
Employment Industries by Sex in South Bethany
The South Bethany industries that see more men than women are Construction (100.0%), Wholesale Trade (100.0%), and Transportation & Warehousing (100.0%), whereas the industries that tend to have a higher number of women are Agriculture, Fishing & Hunting (100.0%), Information (100.0%), and Enterprise Management (100.0%).
| Industry | Male | Female |
| Agriculture, Fishing & Hunting | 0 (0.0%) | 2 (100.0%) |
| Mining, Quarrying, & Extraction | 0 (0.0%) | 0 (0.0%) |
| Construction | 7 (100.0%) | 0 (0.0%) |
| Manufacturing | 9 (75.0%) | 3 (25.0%) |
| Wholesale Trade | 1 (100.0%) | 0 (0.0%) |
| Retail Trade | 6 (60.0%) | 4 (40.0%) |
| Transportation & Warehousing | 3 (100.0%) | 0 (0.0%) |
| Utilities | 2 (50.0%) | 2 (50.0%) |
| Information | 0 (0.0%) | 3 (100.0%) |
| Finance & Insurance | 15 (75.0%) | 5 (25.0%) |
| Real Estate, Rental & Leasing | 5 (55.6%) | 4 (44.4%) |
| Professional & Scientific | 13 (50.0%) | 13 (50.0%) |
| Enterprise Management | 0 (0.0%) | 2 (100.0%) |
| Administrative & Support | 0 (0.0%) | 0 (0.0%) |
| Educational Services | 2 (9.5%) | 19 (90.5%) |
| Health Care & Social Assistance | 2 (22.2%) | 7 (77.8%) |
| Arts, Entertainment & Recreation | 1 (100.0%) | 0 (0.0%) |
| Accommodation & Food Services | 5 (45.5%) | 6 (54.5%) |
| Public Administration | 3 (100.0%) | 0 (0.0%) |
| Total | 74 (51.4%) | 70 (48.6%) |
Education in South Bethany
School Enrollment in South Bethany
The most common levels of schooling among the 10 students in South Bethany are college / undergraduate (6 | 60.0%), middle school (2 | 20.0%), and high school (2 | 20.0%).
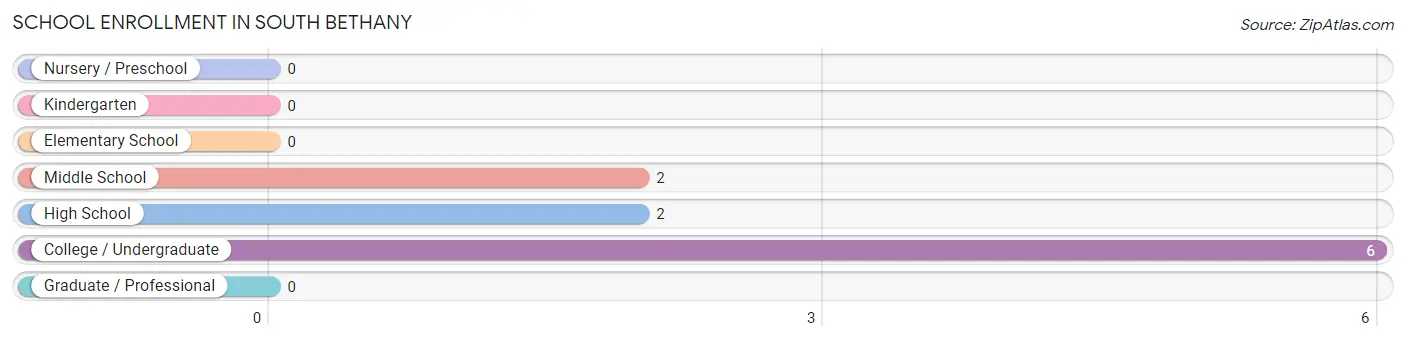
| School Level | # Students | % Students |
| Nursery / Preschool | 0 | 0.0% |
| Kindergarten | 0 | 0.0% |
| Elementary School | 0 | 0.0% |
| Middle School | 2 | 20.0% |
| High School | 2 | 20.0% |
| College / Undergraduate | 6 | 60.0% |
| Graduate / Professional | 0 | 0.0% |
| Total | 10 | 100.0% |
School Enrollment by Age by Funding Source in South Bethany
Out of a total of 10 students who are enrolled in schools in South Bethany, 1 (10.0%) attend a private institution, while the remaining 9 (90.0%) are enrolled in public schools. The age group of 35 years and over has the highest likelihood of being enrolled in private schools, with 1 (33.3% in the age bracket) enrolled. Conversely, the age group of 10 to 14 year olds has the lowest likelihood of being enrolled in a private school, with 2 (100.0% in the age bracket) attending a public institution.
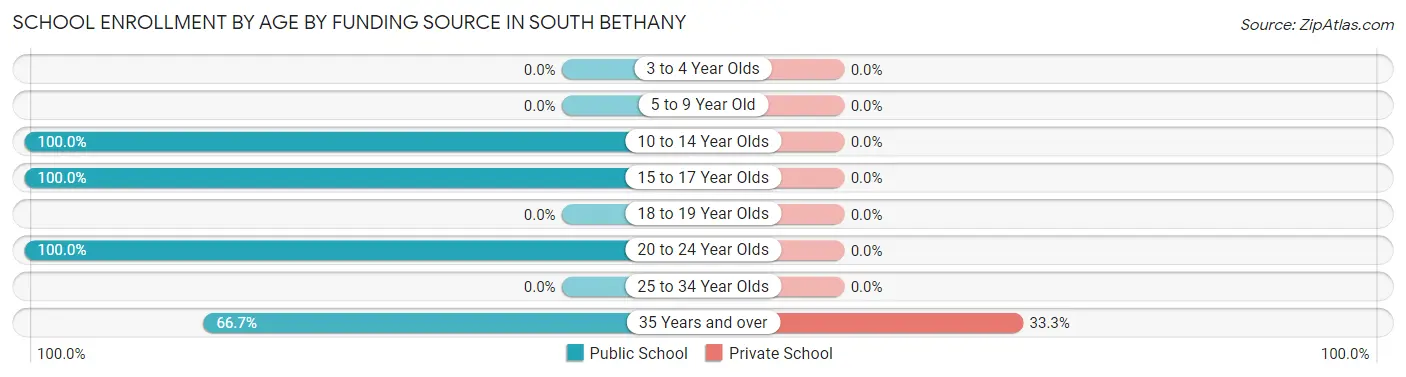
| Age Bracket | Public School | Private School |
| 3 to 4 Year Olds | 0 (0.0%) | 0 (0.0%) |
| 5 to 9 Year Old | 0 (0.0%) | 0 (0.0%) |
| 10 to 14 Year Olds | 2 (100.0%) | 0 (0.0%) |
| 15 to 17 Year Olds | 2 (100.0%) | 0 (0.0%) |
| 18 to 19 Year Olds | 0 (0.0%) | 0 (0.0%) |
| 20 to 24 Year Olds | 3 (100.0%) | 0 (0.0%) |
| 25 to 34 Year Olds | 0 (0.0%) | 0 (0.0%) |
| 35 Years and over | 2 (66.7%) | 1 (33.3%) |
| Total | 9 (90.0%) | 1 (10.0%) |
Educational Attainment by Field of Study in South Bethany
Business (139 | 36.0%), education (42 | 10.9%), science & technology (31 | 8.0%), engineering (30 | 7.8%), and social sciences (28 | 7.2%) are the most common fields of study among 386 individuals in South Bethany who have obtained a bachelor's degree or higher.
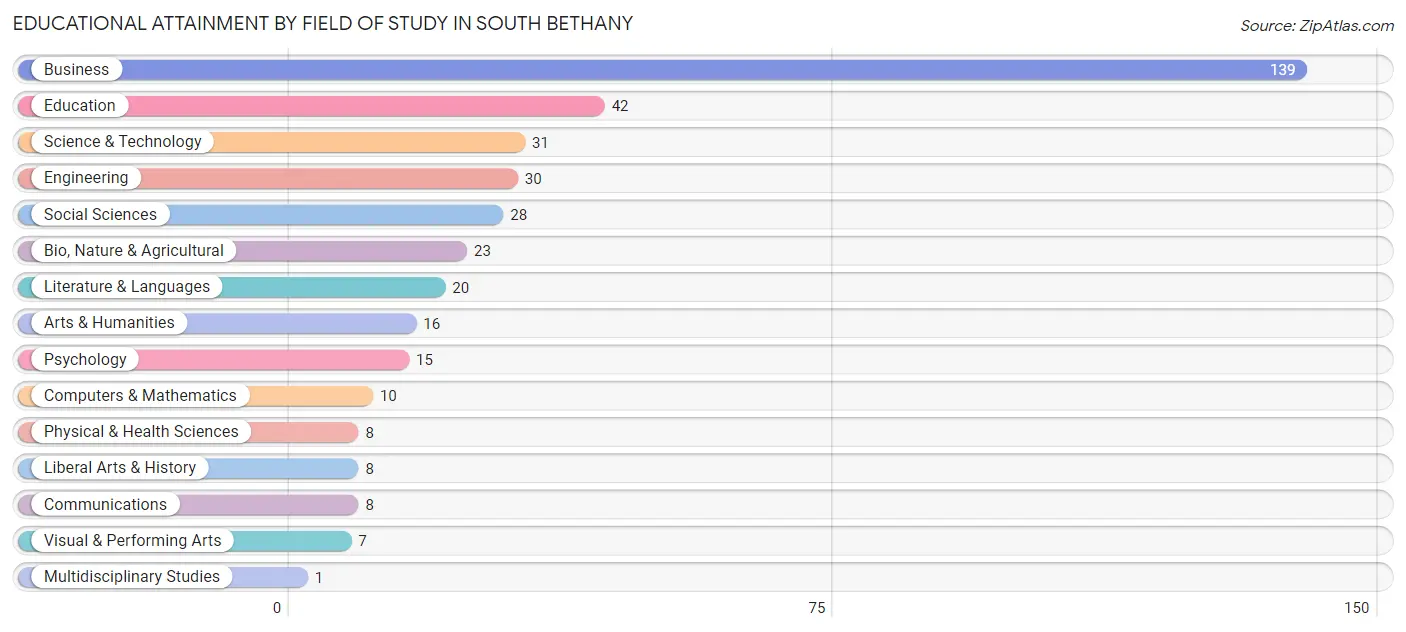
| Field of Study | # Graduates | % Graduates |
| Computers & Mathematics | 10 | 2.6% |
| Bio, Nature & Agricultural | 23 | 6.0% |
| Physical & Health Sciences | 8 | 2.1% |
| Psychology | 15 | 3.9% |
| Social Sciences | 28 | 7.2% |
| Engineering | 30 | 7.8% |
| Multidisciplinary Studies | 1 | 0.3% |
| Science & Technology | 31 | 8.0% |
| Business | 139 | 36.0% |
| Education | 42 | 10.9% |
| Literature & Languages | 20 | 5.2% |
| Liberal Arts & History | 8 | 2.1% |
| Visual & Performing Arts | 7 | 1.8% |
| Communications | 8 | 2.1% |
| Arts & Humanities | 16 | 4.2% |
| Total | 386 | 100.0% |
Transportation & Commute in South Bethany
Vehicle Availability by Sex in South Bethany
The most prevalent vehicle ownership categories in South Bethany are males with 2 vehicles (42, accounting for 59.2%) and females with 2 vehicles (54, making up 62.7%).
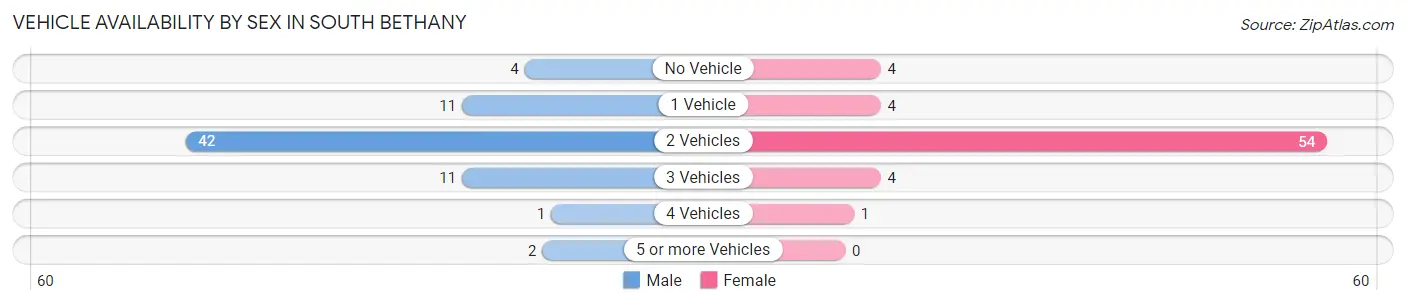
| Vehicles Available | Male | Female |
| No Vehicle | 4 (5.6%) | 4 (6.0%) |
| 1 Vehicle | 11 (15.5%) | 4 (6.0%) |
| 2 Vehicles | 42 (59.2%) | 54 (80.6%) |
| 3 Vehicles | 11 (15.5%) | 4 (6.0%) |
| 4 Vehicles | 1 (1.4%) | 1 (1.5%) |
| 5 or more Vehicles | 2 (2.8%) | 0 (0.0%) |
| Total | 71 (100.0%) | 67 (100.0%) |
Commute Time in South Bethany
The most frequently occuring commute durations in South Bethany are 30 to 34 minutes (22 commuters, 25.3%), 45 to 59 minutes (15 commuters, 17.2%), and 20 to 24 minutes (13 commuters, 14.9%).
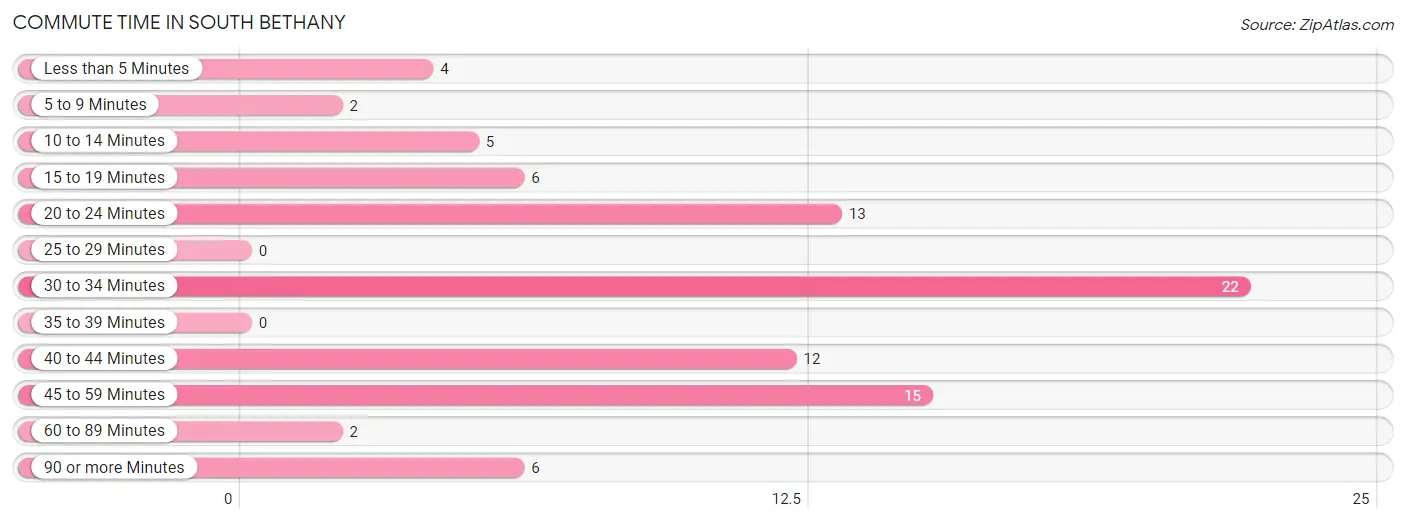
| Commute Time | # Commuters | % Commuters |
| Less than 5 Minutes | 4 | 4.6% |
| 5 to 9 Minutes | 2 | 2.3% |
| 10 to 14 Minutes | 5 | 5.8% |
| 15 to 19 Minutes | 6 | 6.9% |
| 20 to 24 Minutes | 13 | 14.9% |
| 25 to 29 Minutes | 0 | 0.0% |
| 30 to 34 Minutes | 22 | 25.3% |
| 35 to 39 Minutes | 0 | 0.0% |
| 40 to 44 Minutes | 12 | 13.8% |
| 45 to 59 Minutes | 15 | 17.2% |
| 60 to 89 Minutes | 2 | 2.3% |
| 90 or more Minutes | 6 | 6.9% |
Commute Time by Sex in South Bethany
The most common commute times in South Bethany are 40 to 44 minutes (8 commuters, 20.5%) for males and 30 to 34 minutes (16 commuters, 33.3%) for females.
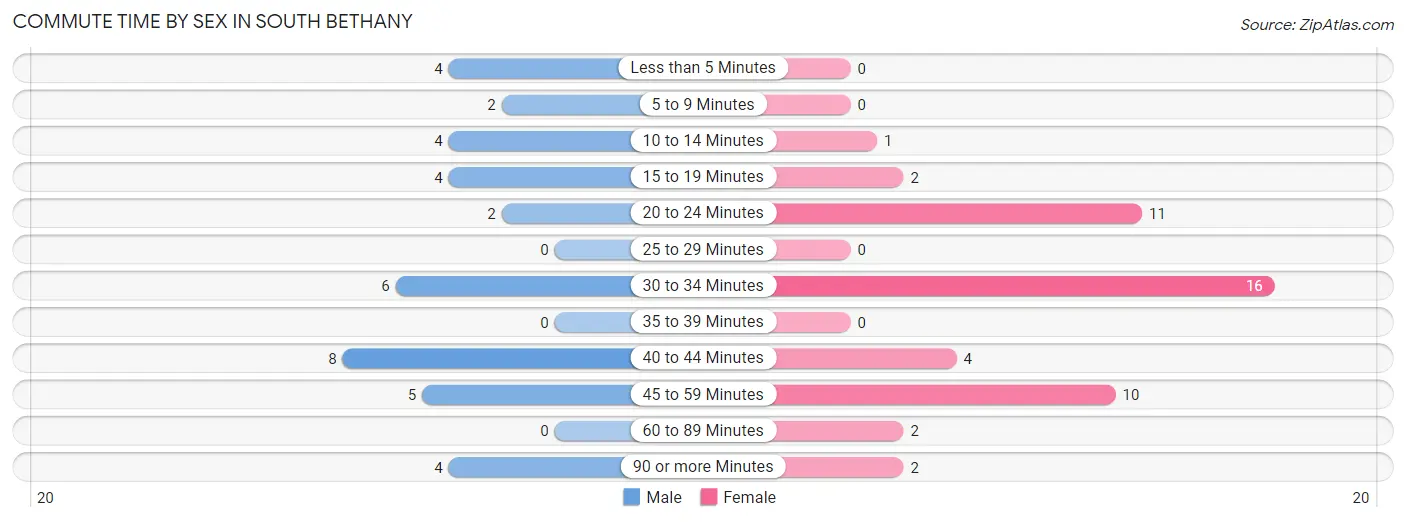
| Commute Time | Male | Female |
| Less than 5 Minutes | 4 (10.3%) | 0 (0.0%) |
| 5 to 9 Minutes | 2 (5.1%) | 0 (0.0%) |
| 10 to 14 Minutes | 4 (10.3%) | 1 (2.1%) |
| 15 to 19 Minutes | 4 (10.3%) | 2 (4.2%) |
| 20 to 24 Minutes | 2 (5.1%) | 11 (22.9%) |
| 25 to 29 Minutes | 0 (0.0%) | 0 (0.0%) |
| 30 to 34 Minutes | 6 (15.4%) | 16 (33.3%) |
| 35 to 39 Minutes | 0 (0.0%) | 0 (0.0%) |
| 40 to 44 Minutes | 8 (20.5%) | 4 (8.3%) |
| 45 to 59 Minutes | 5 (12.8%) | 10 (20.8%) |
| 60 to 89 Minutes | 0 (0.0%) | 2 (4.2%) |
| 90 or more Minutes | 4 (10.3%) | 2 (4.2%) |
Time of Departure to Work by Sex in South Bethany
The most frequent times of departure to work in South Bethany are 9:00 AM to 9:59 AM (10, 25.6%) for males and 6:00 AM to 6:29 AM (10, 20.8%) for females.
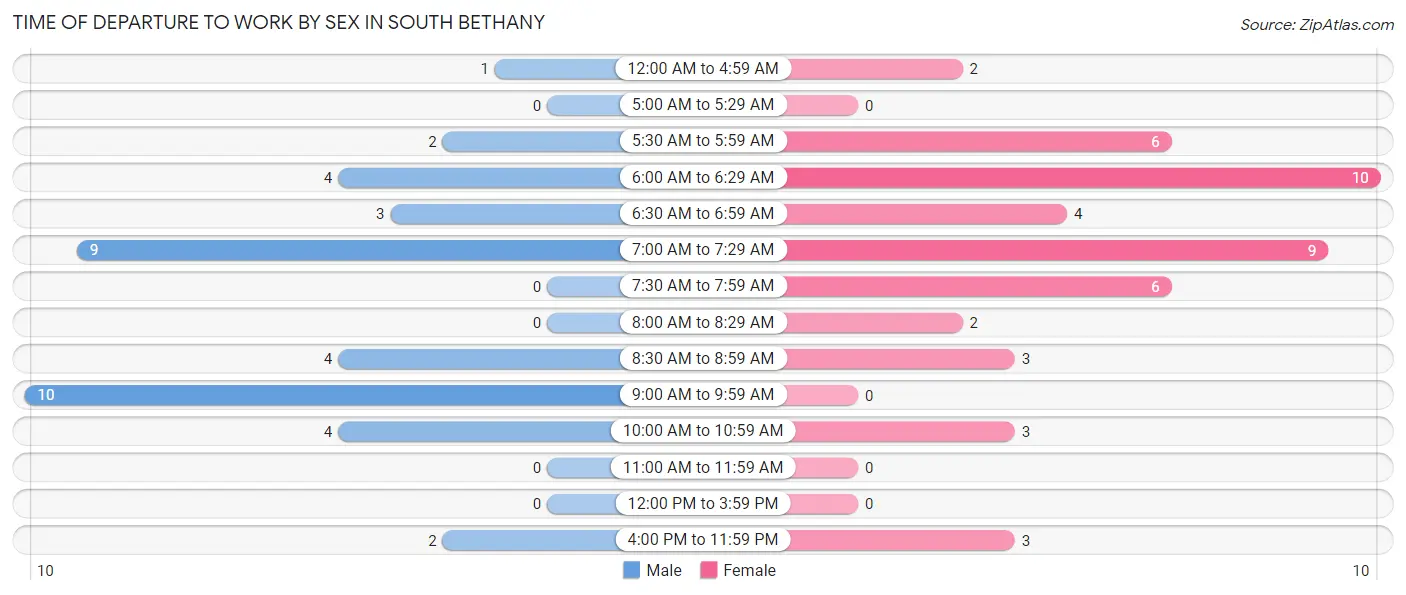
| Time of Departure | Male | Female |
| 12:00 AM to 4:59 AM | 1 (2.6%) | 2 (4.2%) |
| 5:00 AM to 5:29 AM | 0 (0.0%) | 0 (0.0%) |
| 5:30 AM to 5:59 AM | 2 (5.1%) | 6 (12.5%) |
| 6:00 AM to 6:29 AM | 4 (10.3%) | 10 (20.8%) |
| 6:30 AM to 6:59 AM | 3 (7.7%) | 4 (8.3%) |
| 7:00 AM to 7:29 AM | 9 (23.1%) | 9 (18.8%) |
| 7:30 AM to 7:59 AM | 0 (0.0%) | 6 (12.5%) |
| 8:00 AM to 8:29 AM | 0 (0.0%) | 2 (4.2%) |
| 8:30 AM to 8:59 AM | 4 (10.3%) | 3 (6.2%) |
| 9:00 AM to 9:59 AM | 10 (25.6%) | 0 (0.0%) |
| 10:00 AM to 10:59 AM | 4 (10.3%) | 3 (6.2%) |
| 11:00 AM to 11:59 AM | 0 (0.0%) | 0 (0.0%) |
| 12:00 PM to 3:59 PM | 0 (0.0%) | 0 (0.0%) |
| 4:00 PM to 11:59 PM | 2 (5.1%) | 3 (6.2%) |
| Total | 39 (100.0%) | 48 (100.0%) |
Housing Occupancy in South Bethany
Occupancy by Ownership in South Bethany
Of the total 302 dwellings in South Bethany, owner-occupied units account for 300 (99.3%), while renter-occupied units make up 2 (0.7%).
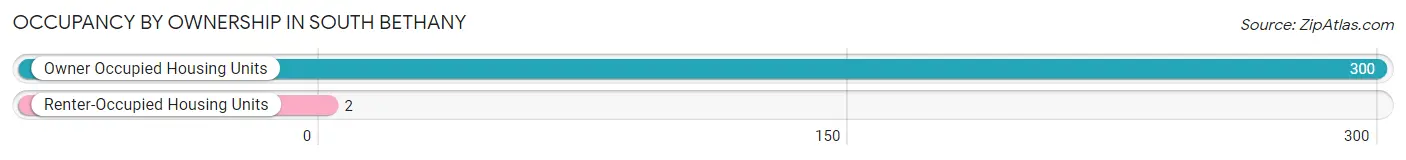
| Occupancy | # Housing Units | % Housing Units |
| Owner Occupied Housing Units | 300 | 99.3% |
| Renter-Occupied Housing Units | 2 | 0.7% |
| Total Occupied Housing Units | 302 | 100.0% |
Occupancy by Household Size in South Bethany
| Household Size | # Housing Units | % Housing Units |
| 1-Person Household | 77 | 25.5% |
| 2-Person Household | 211 | 69.9% |
| 3-Person Household | 14 | 4.6% |
| 4+ Person Household | 0 | 0.0% |
| Total Housing Units | 302 | 100.0% |
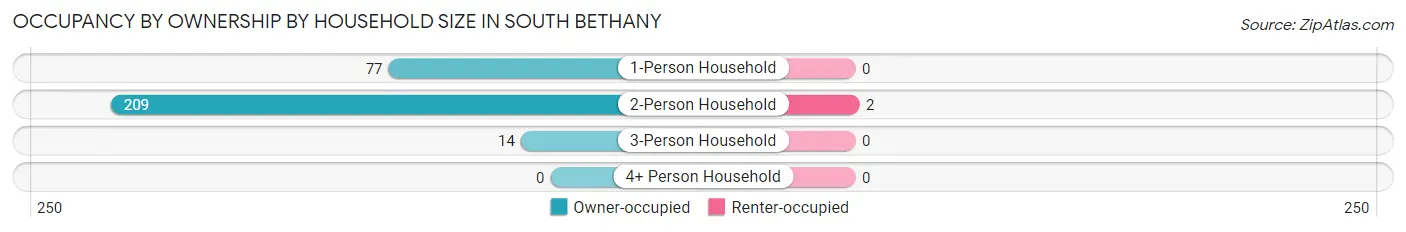
Occupancy by Ownership by Household Size in South Bethany
| Household Size | Owner-occupied | Renter-occupied |
| 1-Person Household | 77 (100.0%) | 0 (0.0%) |
| 2-Person Household | 209 (99.1%) | 2 (0.9%) |
| 3-Person Household | 14 (100.0%) | 0 (0.0%) |
| 4+ Person Household | 0 (0.0%) | 0 (0.0%) |
| Total Housing Units | 300 (99.3%) | 2 (0.7%) |
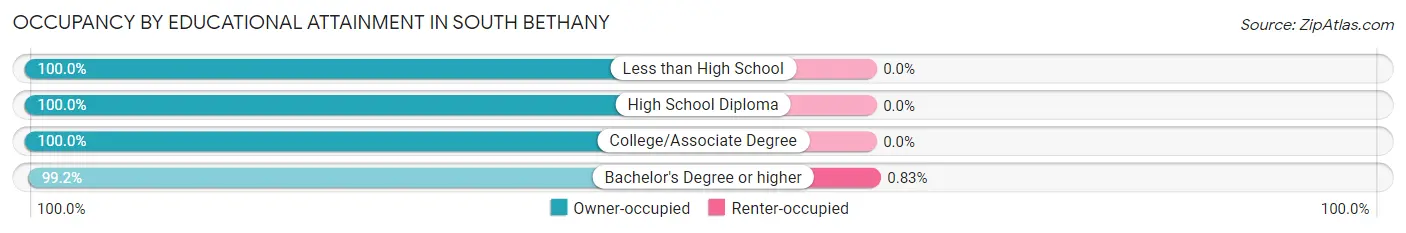
Occupancy by Educational Attainment in South Bethany
| Household Size | Owner-occupied | Renter-occupied |
| Less than High School | 2 (100.0%) | 0 (0.0%) |
| High School Diploma | 12 (100.0%) | 0 (0.0%) |
| College/Associate Degree | 47 (100.0%) | 0 (0.0%) |
| Bachelor's Degree or higher | 239 (99.2%) | 2 (0.8%) |
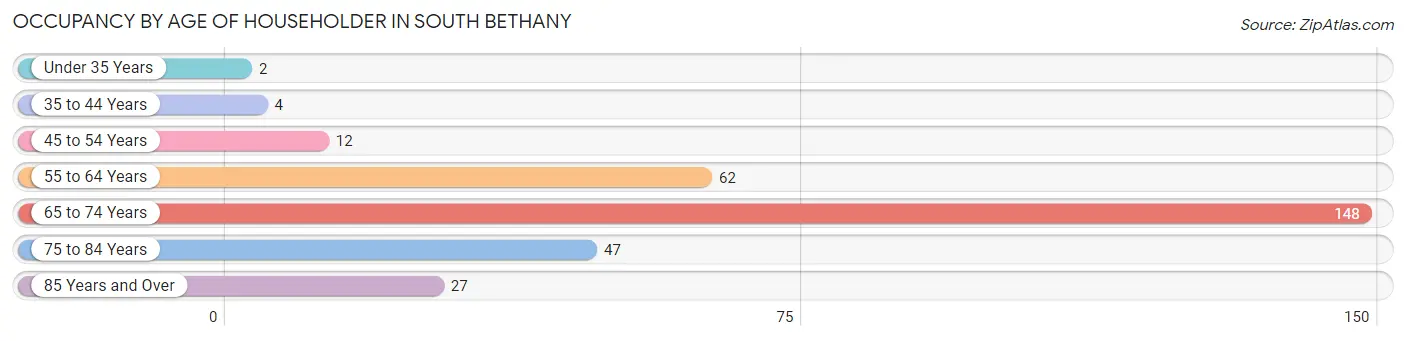
Occupancy by Age of Householder in South Bethany
| Age Bracket | # Households | % Households |
| Under 35 Years | 2 | 0.7% |
| 35 to 44 Years | 4 | 1.3% |
| 45 to 54 Years | 12 | 4.0% |
| 55 to 64 Years | 62 | 20.5% |
| 65 to 74 Years | 148 | 49.0% |
| 75 to 84 Years | 47 | 15.6% |
| 85 Years and Over | 27 | 8.9% |
| Total | 302 | 100.0% |
Housing Finances in South Bethany
Median Income by Occupancy in South Bethany
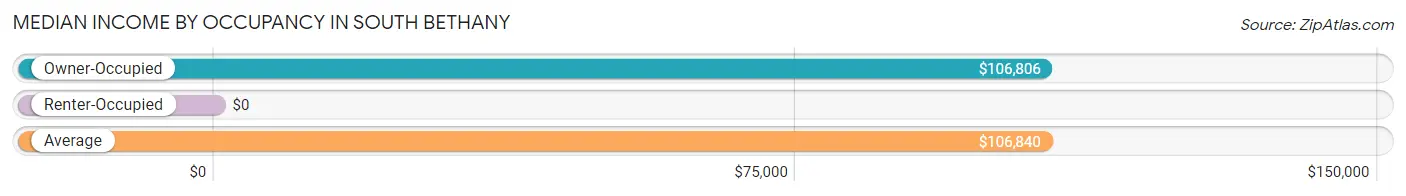
| Occupancy Type | # Households | Median Income |
| Owner-Occupied | 300 (99.3%) | $106,806 |
| Renter-Occupied | 2 (0.7%) | $0 |
| Average | 302 (100.0%) | $106,840 |
Occupancy by Householder Income Bracket in South Bethany
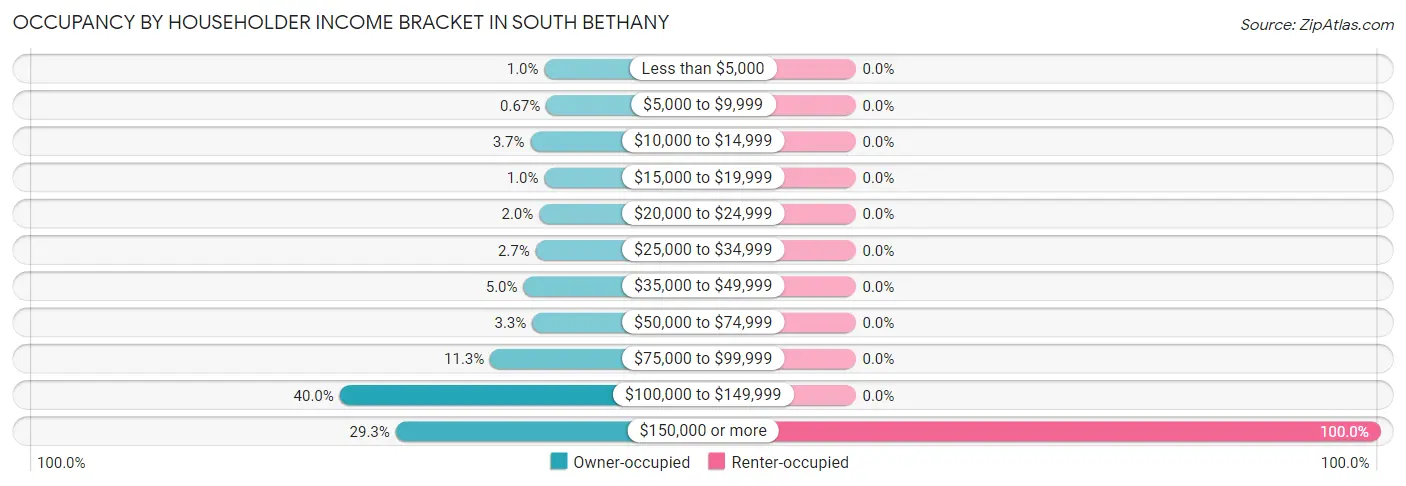
| Income Bracket | Owner-occupied | Renter-occupied |
| Less than $5,000 | 3 (1.0%) | 0 (0.0%) |
| $5,000 to $9,999 | 2 (0.7%) | 0 (0.0%) |
| $10,000 to $14,999 | 11 (3.7%) | 0 (0.0%) |
| $15,000 to $19,999 | 3 (1.0%) | 0 (0.0%) |
| $20,000 to $24,999 | 6 (2.0%) | 0 (0.0%) |
| $25,000 to $34,999 | 8 (2.7%) | 0 (0.0%) |
| $35,000 to $49,999 | 15 (5.0%) | 0 (0.0%) |
| $50,000 to $74,999 | 10 (3.3%) | 0 (0.0%) |
| $75,000 to $99,999 | 34 (11.3%) | 0 (0.0%) |
| $100,000 to $149,999 | 120 (40.0%) | 0 (0.0%) |
| $150,000 or more | 88 (29.3%) | 2 (100.0%) |
| Total | 300 (100.0%) | 2 (100.0%) |
Monthly Housing Cost Tiers in South Bethany
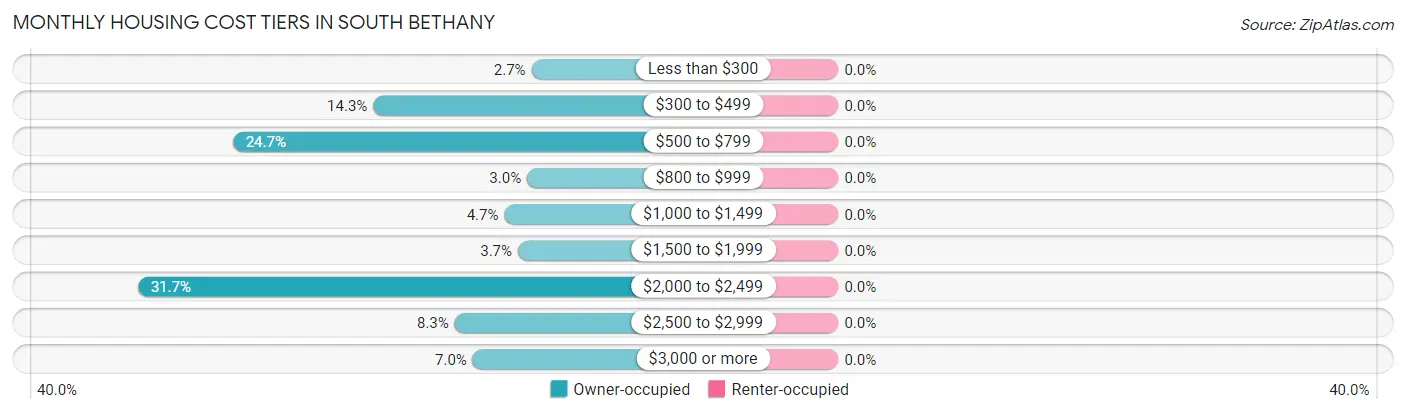
| Monthly Cost | Owner-occupied | Renter-occupied |
| Less than $300 | 8 (2.7%) | 0 (0.0%) |
| $300 to $499 | 43 (14.3%) | 0 (0.0%) |
| $500 to $799 | 74 (24.7%) | 0 (0.0%) |
| $800 to $999 | 9 (3.0%) | 0 (0.0%) |
| $1,000 to $1,499 | 14 (4.7%) | 0 (0.0%) |
| $1,500 to $1,999 | 11 (3.7%) | 0 (0.0%) |
| $2,000 to $2,499 | 95 (31.7%) | 0 (0.0%) |
| $2,500 to $2,999 | 25 (8.3%) | 0 (0.0%) |
| $3,000 or more | 21 (7.0%) | 0 (0.0%) |
| Total | 300 (100.0%) | 2 (100.0%) |
Physical Housing Characteristics in South Bethany
Housing Structures in South Bethany
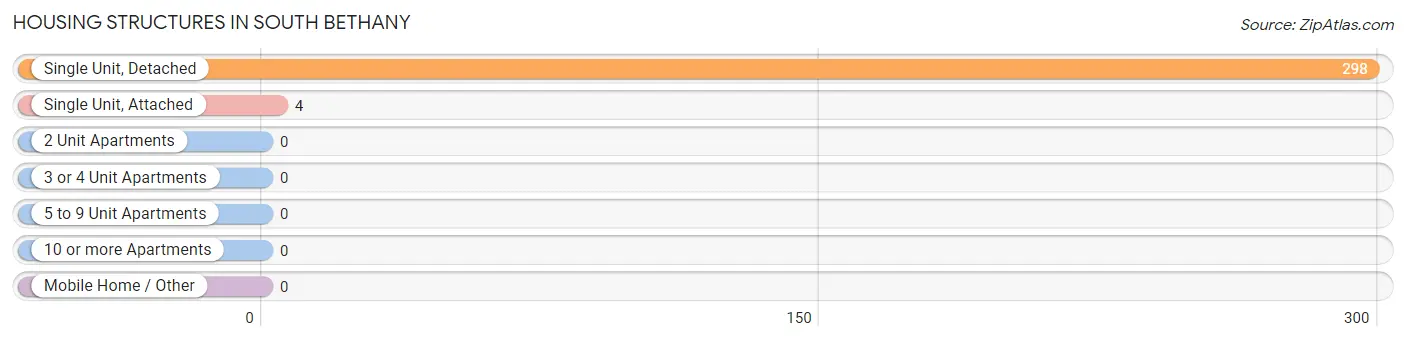
| Structure Type | # Housing Units | % Housing Units |
| Single Unit, Detached | 298 | 98.7% |
| Single Unit, Attached | 4 | 1.3% |
| 2 Unit Apartments | 0 | 0.0% |
| 3 or 4 Unit Apartments | 0 | 0.0% |
| 5 to 9 Unit Apartments | 0 | 0.0% |
| 10 or more Apartments | 0 | 0.0% |
| Mobile Home / Other | 0 | 0.0% |
| Total | 302 | 100.0% |
Housing Structures by Occupancy in South Bethany
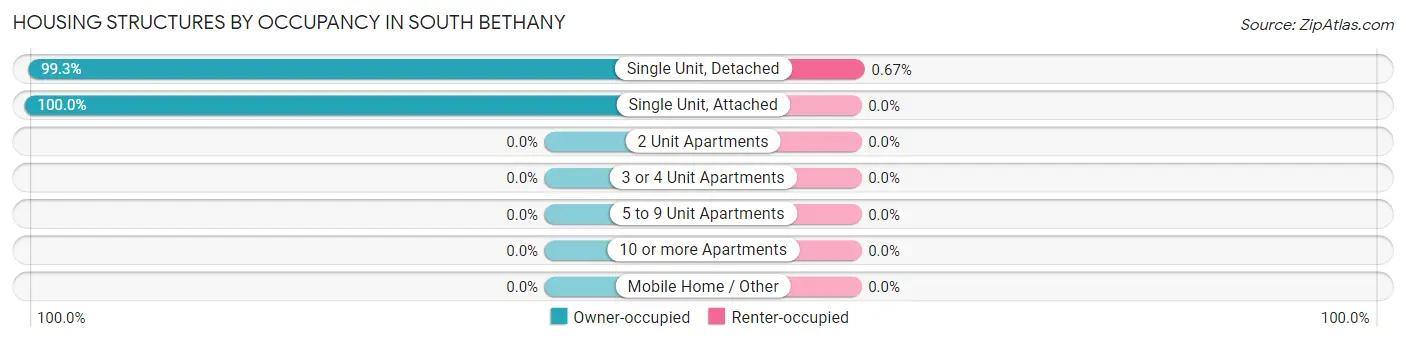
| Structure Type | Owner-occupied | Renter-occupied |
| Single Unit, Detached | 296 (99.3%) | 2 (0.7%) |
| Single Unit, Attached | 4 (100.0%) | 0 (0.0%) |
| 2 Unit Apartments | 0 (0.0%) | 0 (0.0%) |
| 3 or 4 Unit Apartments | 0 (0.0%) | 0 (0.0%) |
| 5 to 9 Unit Apartments | 0 (0.0%) | 0 (0.0%) |
| 10 or more Apartments | 0 (0.0%) | 0 (0.0%) |
| Mobile Home / Other | 0 (0.0%) | 0 (0.0%) |
| Total | 300 (99.3%) | 2 (0.7%) |
Housing Structures by Number of Rooms in South Bethany
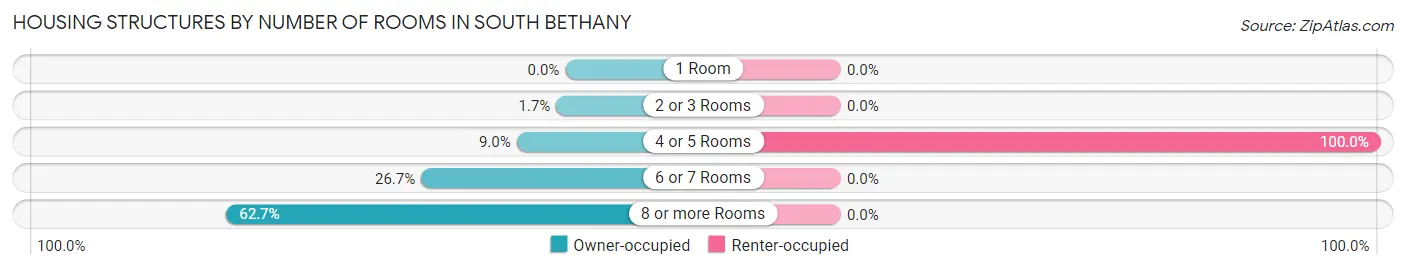
| Number of Rooms | Owner-occupied | Renter-occupied |
| 1 Room | 0 (0.0%) | 0 (0.0%) |
| 2 or 3 Rooms | 5 (1.7%) | 0 (0.0%) |
| 4 or 5 Rooms | 27 (9.0%) | 2 (100.0%) |
| 6 or 7 Rooms | 80 (26.7%) | 0 (0.0%) |
| 8 or more Rooms | 188 (62.7%) | 0 (0.0%) |
| Total | 300 (100.0%) | 2 (100.0%) |
Housing Structure by Heating Type in South Bethany
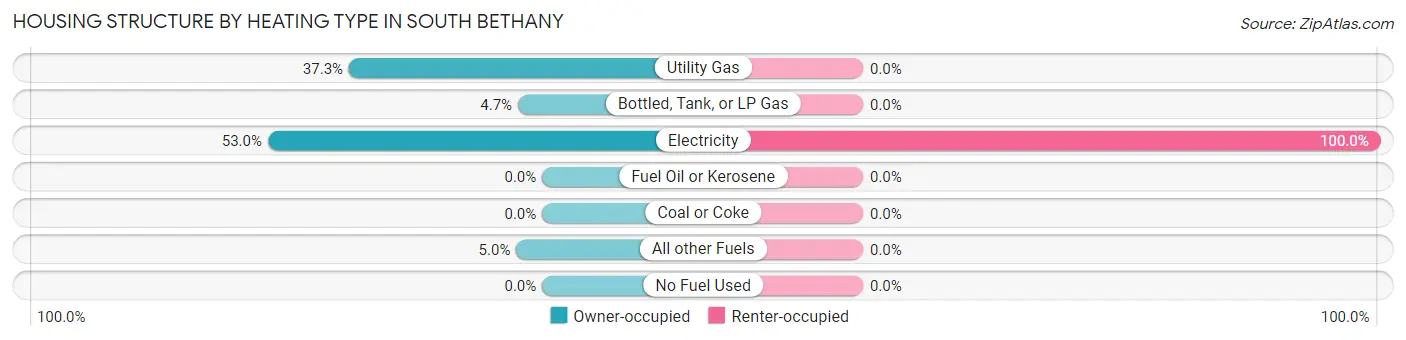
| Heating Type | Owner-occupied | Renter-occupied |
| Utility Gas | 112 (37.3%) | 0 (0.0%) |
| Bottled, Tank, or LP Gas | 14 (4.7%) | 0 (0.0%) |
| Electricity | 159 (53.0%) | 2 (100.0%) |
| Fuel Oil or Kerosene | 0 (0.0%) | 0 (0.0%) |
| Coal or Coke | 0 (0.0%) | 0 (0.0%) |
| All other Fuels | 15 (5.0%) | 0 (0.0%) |
| No Fuel Used | 0 (0.0%) | 0 (0.0%) |
| Total | 300 (100.0%) | 2 (100.0%) |
Household Vehicle Usage in South Bethany
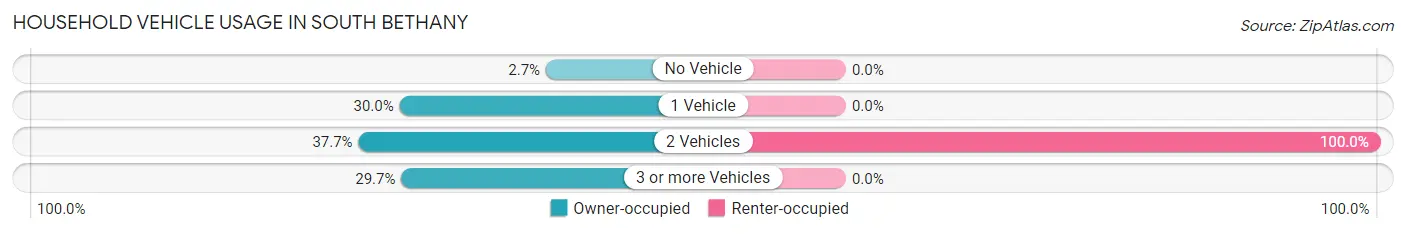
| Vehicles per Household | Owner-occupied | Renter-occupied |
| No Vehicle | 8 (2.7%) | 0 (0.0%) |
| 1 Vehicle | 90 (30.0%) | 0 (0.0%) |
| 2 Vehicles | 113 (37.7%) | 2 (100.0%) |
| 3 or more Vehicles | 89 (29.7%) | 0 (0.0%) |
| Total | 300 (100.0%) | 2 (100.0%) |
Real Estate & Mortgages in South Bethany
Real Estate and Mortgage Overview in South Bethany
| Characteristic | Without Mortgage | With Mortgage |
| Housing Units | 132 | 168 |
| Median Property Value | $864,600 | $571,400 |
| Median Household Income | $102,500 | $50 |
| Monthly Housing Costs | $563 | $21 |
| Real Estate Taxes | $1,838 | $0 |
Property Value by Mortgage Status in South Bethany
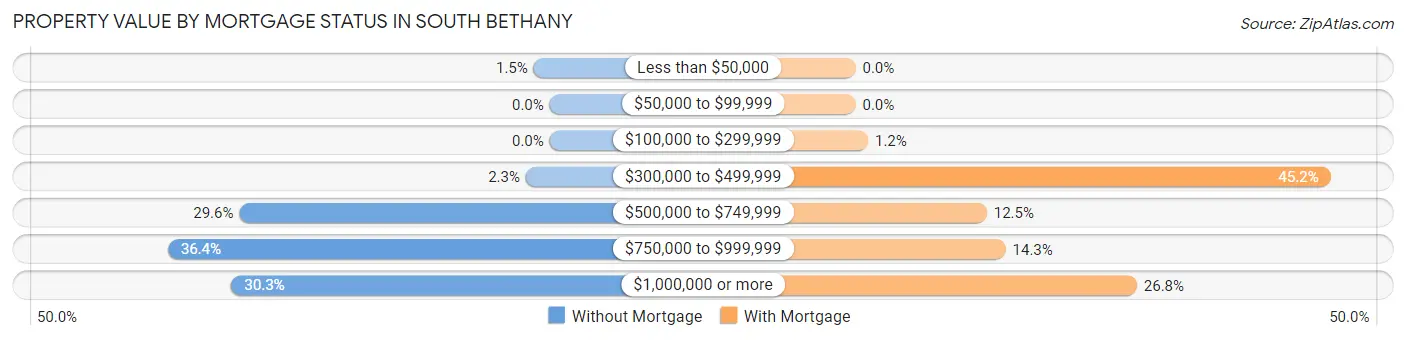
| Property Value | Without Mortgage | With Mortgage |
| Less than $50,000 | 2 (1.5%) | 0 (0.0%) |
| $50,000 to $99,999 | 0 (0.0%) | 0 (0.0%) |
| $100,000 to $299,999 | 0 (0.0%) | 2 (1.2%) |
| $300,000 to $499,999 | 3 (2.3%) | 76 (45.2%) |
| $500,000 to $749,999 | 39 (29.5%) | 21 (12.5%) |
| $750,000 to $999,999 | 48 (36.4%) | 24 (14.3%) |
| $1,000,000 or more | 40 (30.3%) | 45 (26.8%) |
| Total | 132 (100.0%) | 168 (100.0%) |
Household Income by Mortgage Status in South Bethany
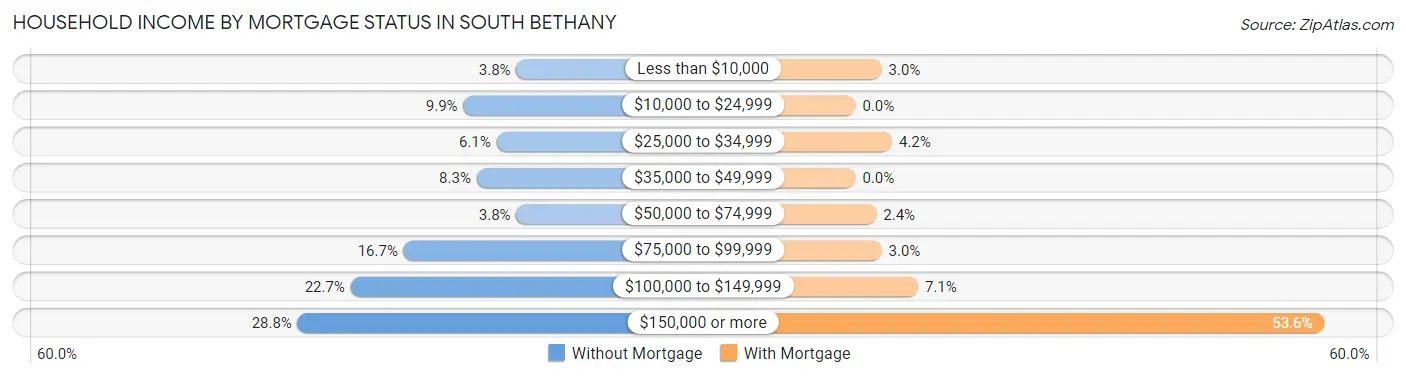
| Household Income | Without Mortgage | With Mortgage |
| Less than $10,000 | 5 (3.8%) | 5 (3.0%) |
| $10,000 to $24,999 | 13 (9.9%) | 0 (0.0%) |
| $25,000 to $34,999 | 8 (6.1%) | 7 (4.2%) |
| $35,000 to $49,999 | 11 (8.3%) | 0 (0.0%) |
| $50,000 to $74,999 | 5 (3.8%) | 4 (2.4%) |
| $75,000 to $99,999 | 22 (16.7%) | 5 (3.0%) |
| $100,000 to $149,999 | 30 (22.7%) | 12 (7.1%) |
| $150,000 or more | 38 (28.8%) | 90 (53.6%) |
| Total | 132 (100.0%) | 168 (100.0%) |
Property Value to Household Income Ratio in South Bethany
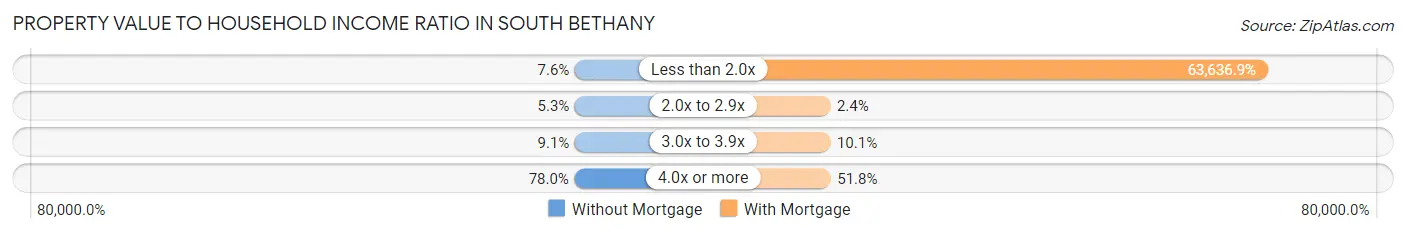
| Value-to-Income Ratio | Without Mortgage | With Mortgage |
| Less than 2.0x | 10 (7.6%) | 106,910 (63,636.9%) |
| 2.0x to 2.9x | 7 (5.3%) | 4 (2.4%) |
| 3.0x to 3.9x | 12 (9.1%) | 17 (10.1%) |
| 4.0x or more | 103 (78.0%) | 87 (51.8%) |
| Total | 132 (100.0%) | 168 (100.0%) |
Real Estate Taxes by Mortgage Status in South Bethany
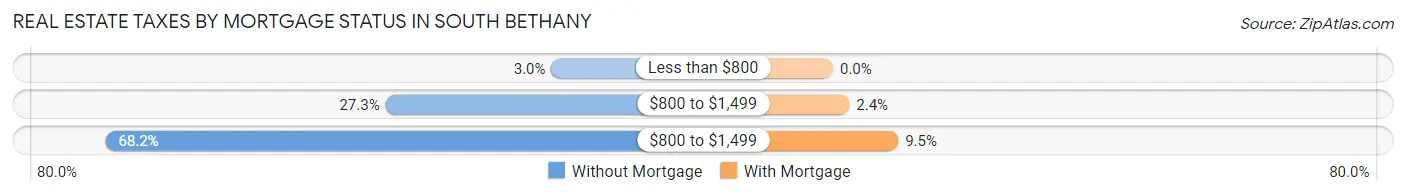
| Property Taxes | Without Mortgage | With Mortgage |
| Less than $800 | 4 (3.0%) | 0 (0.0%) |
| $800 to $1,499 | 36 (27.3%) | 4 (2.4%) |
| $800 to $1,499 | 90 (68.2%) | 16 (9.5%) |
| Total | 132 (100.0%) | 168 (100.0%) |
Health & Disability in South Bethany
Health Insurance Coverage by Age in South Bethany
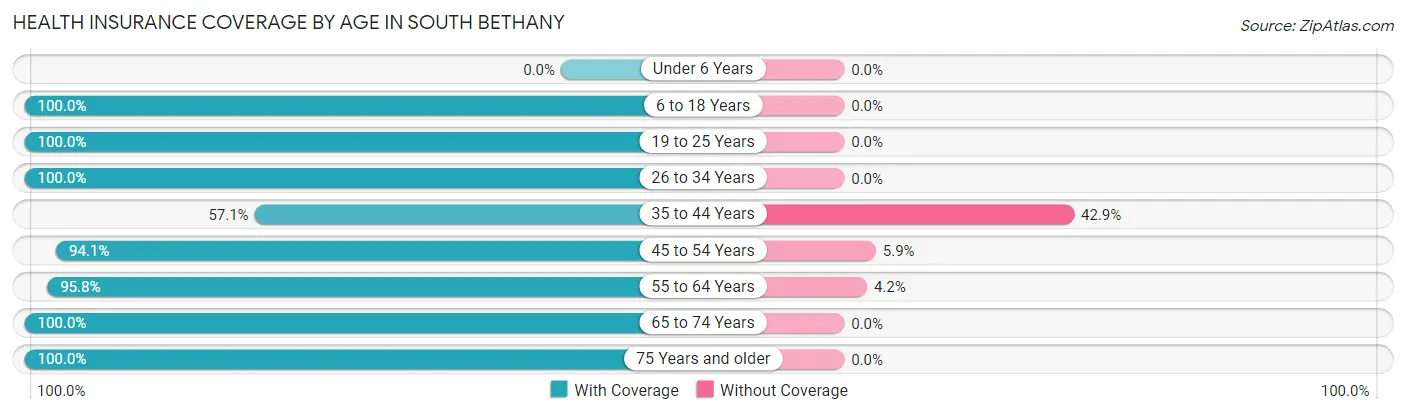
| Age Bracket | With Coverage | Without Coverage |
| Under 6 Years | 0 (0.0%) | 0 (0.0%) |
| 6 to 18 Years | 4 (100.0%) | 0 (0.0%) |
| 19 to 25 Years | 6 (100.0%) | 0 (0.0%) |
| 26 to 34 Years | 7 (100.0%) | 0 (0.0%) |
| 35 to 44 Years | 4 (57.1%) | 3 (42.9%) |
| 45 to 54 Years | 16 (94.1%) | 1 (5.9%) |
| 55 to 64 Years | 136 (95.8%) | 6 (4.2%) |
| 65 to 74 Years | 192 (100.0%) | 0 (0.0%) |
| 75 Years and older | 115 (100.0%) | 0 (0.0%) |
| Total | 480 (98.0%) | 10 (2.0%) |
Health Insurance Coverage by Citizenship Status in South Bethany
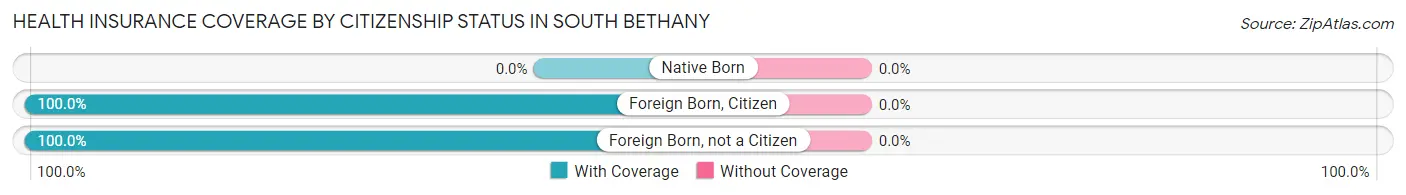
| Citizenship Status | With Coverage | Without Coverage |
| Native Born | 0 (0.0%) | 0 (0.0%) |
| Foreign Born, Citizen | 4 (100.0%) | 0 (0.0%) |
| Foreign Born, not a Citizen | 6 (100.0%) | 0 (0.0%) |
Health Insurance Coverage by Household Income in South Bethany
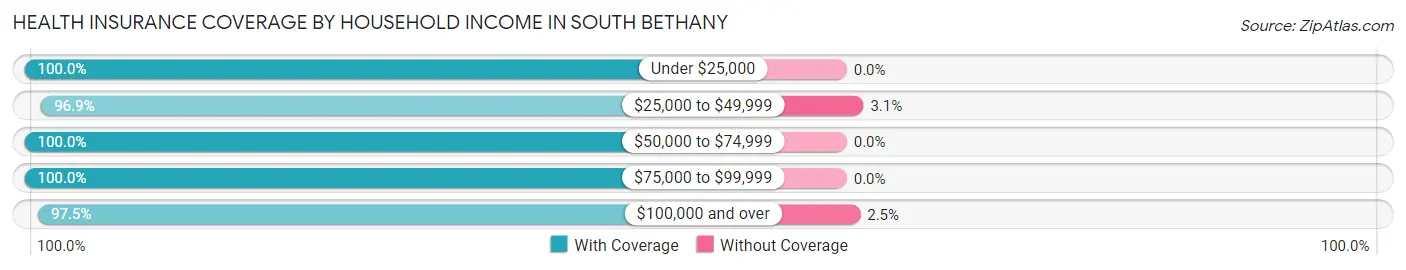
| Household Income | With Coverage | Without Coverage |
| Under $25,000 | 36 (100.0%) | 0 (0.0%) |
| $25,000 to $49,999 | 31 (96.9%) | 1 (3.1%) |
| $50,000 to $74,999 | 14 (100.0%) | 0 (0.0%) |
| $75,000 to $99,999 | 52 (100.0%) | 0 (0.0%) |
| $100,000 and over | 347 (97.5%) | 9 (2.5%) |
Public vs Private Health Insurance Coverage by Age in South Bethany
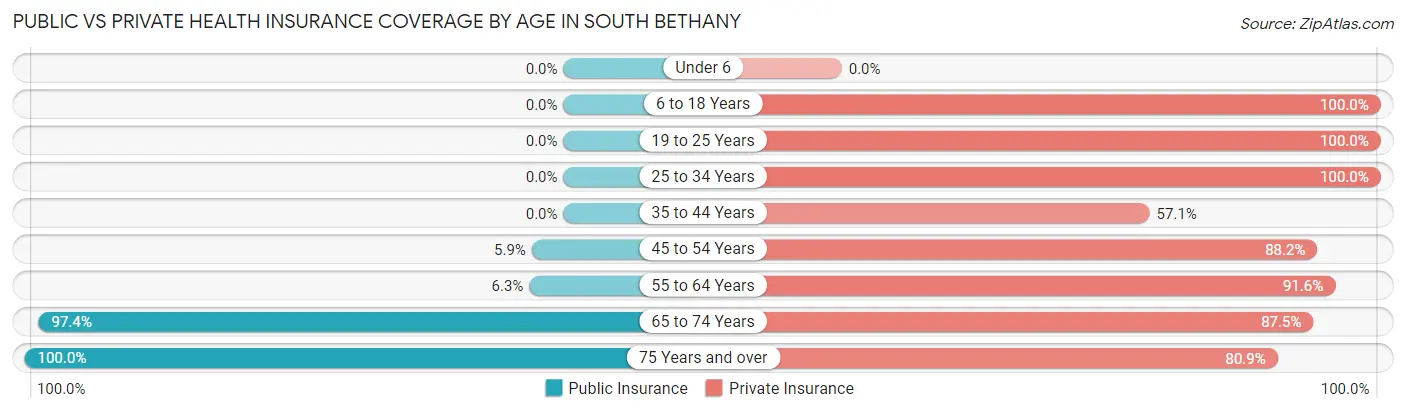
| Age Bracket | Public Insurance | Private Insurance |
| Under 6 | 0 (0.0%) | 0 (0.0%) |
| 6 to 18 Years | 0 (0.0%) | 4 (100.0%) |
| 19 to 25 Years | 0 (0.0%) | 6 (100.0%) |
| 25 to 34 Years | 0 (0.0%) | 7 (100.0%) |
| 35 to 44 Years | 0 (0.0%) | 4 (57.1%) |
| 45 to 54 Years | 1 (5.9%) | 15 (88.2%) |
| 55 to 64 Years | 9 (6.3%) | 130 (91.5%) |
| 65 to 74 Years | 187 (97.4%) | 168 (87.5%) |
| 75 Years and over | 115 (100.0%) | 93 (80.9%) |
| Total | 312 (63.7%) | 427 (87.1%) |
Disability Status by Sex by Age in South Bethany
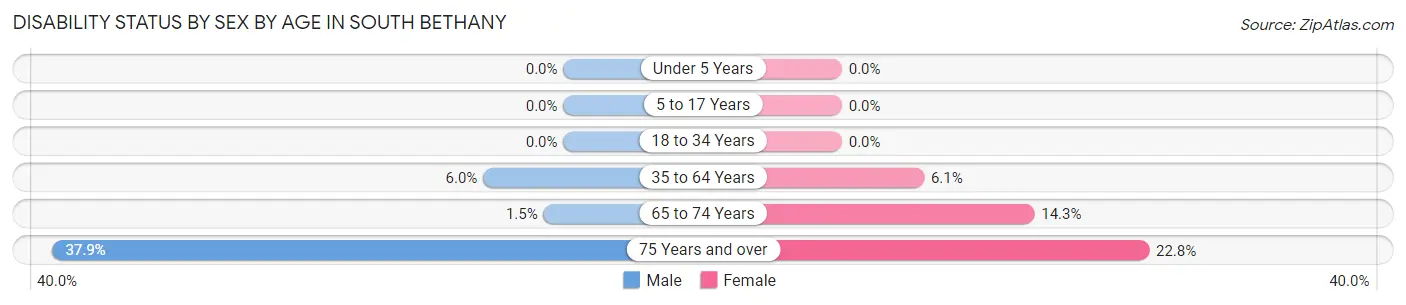
| Age Bracket | Male | Female |
| Under 5 Years | 0 (0.0%) | 0 (0.0%) |
| 5 to 17 Years | 0 (0.0%) | 0 (0.0%) |
| 18 to 34 Years | 0 (0.0%) | 0 (0.0%) |
| 35 to 64 Years | 5 (5.9%) | 5 (6.1%) |
| 65 to 74 Years | 2 (1.5%) | 8 (14.3%) |
| 75 Years and over | 22 (37.9%) | 13 (22.8%) |
Disability Class by Sex by Age in South Bethany
Disability Class: Hearing Difficulty
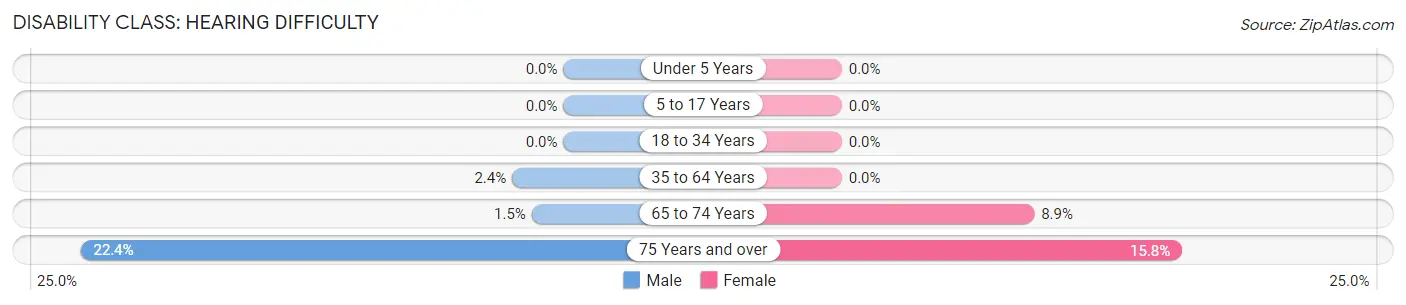
| Age Bracket | Male | Female |
| Under 5 Years | 0 (0.0%) | 0 (0.0%) |
| 5 to 17 Years | 0 (0.0%) | 0 (0.0%) |
| 18 to 34 Years | 0 (0.0%) | 0 (0.0%) |
| 35 to 64 Years | 2 (2.4%) | 0 (0.0%) |
| 65 to 74 Years | 2 (1.5%) | 5 (8.9%) |
| 75 Years and over | 13 (22.4%) | 9 (15.8%) |
Disability Class: Vision Difficulty
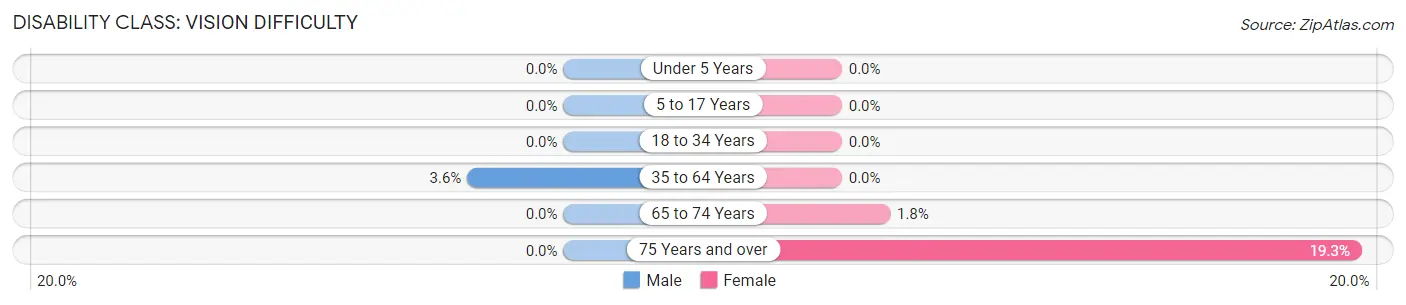
| Age Bracket | Male | Female |
| Under 5 Years | 0 (0.0%) | 0 (0.0%) |
| 5 to 17 Years | 0 (0.0%) | 0 (0.0%) |
| 18 to 34 Years | 0 (0.0%) | 0 (0.0%) |
| 35 to 64 Years | 3 (3.6%) | 0 (0.0%) |
| 65 to 74 Years | 0 (0.0%) | 1 (1.8%) |
| 75 Years and over | 0 (0.0%) | 11 (19.3%) |
Disability Class: Cognitive Difficulty
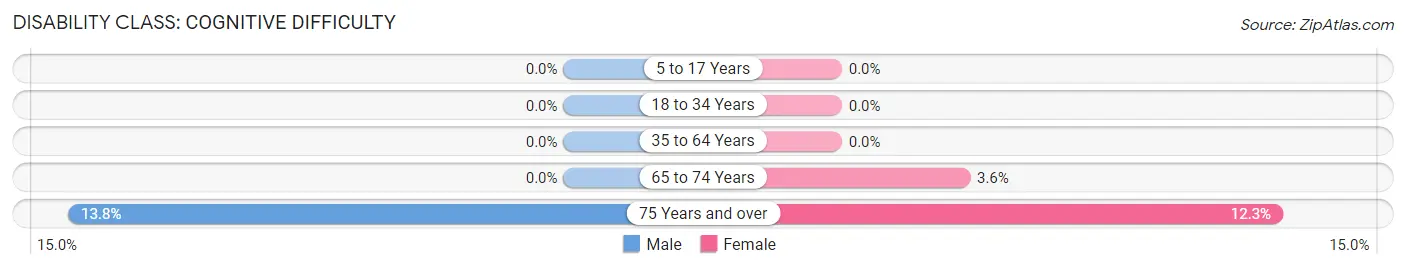
| Age Bracket | Male | Female |
| 5 to 17 Years | 0 (0.0%) | 0 (0.0%) |
| 18 to 34 Years | 0 (0.0%) | 0 (0.0%) |
| 35 to 64 Years | 0 (0.0%) | 0 (0.0%) |
| 65 to 74 Years | 0 (0.0%) | 2 (3.6%) |
| 75 Years and over | 8 (13.8%) | 7 (12.3%) |
Disability Class: Ambulatory Difficulty
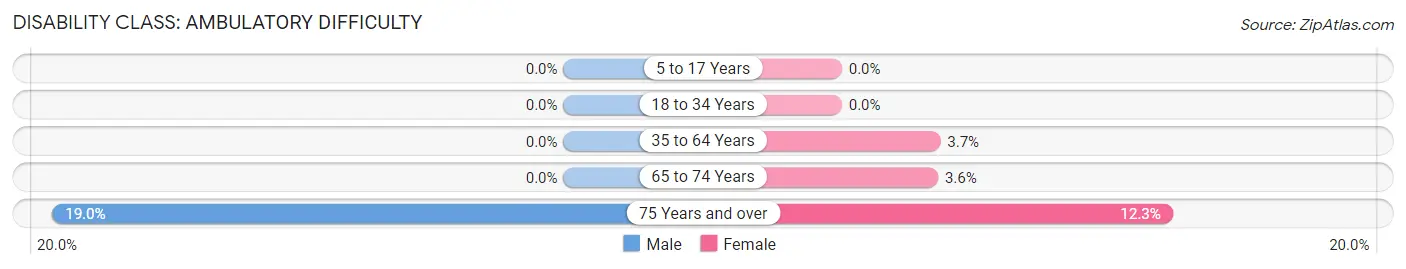
| Age Bracket | Male | Female |
| 5 to 17 Years | 0 (0.0%) | 0 (0.0%) |
| 18 to 34 Years | 0 (0.0%) | 0 (0.0%) |
| 35 to 64 Years | 0 (0.0%) | 3 (3.7%) |
| 65 to 74 Years | 0 (0.0%) | 2 (3.6%) |
| 75 Years and over | 11 (19.0%) | 7 (12.3%) |
Disability Class: Self-Care Difficulty
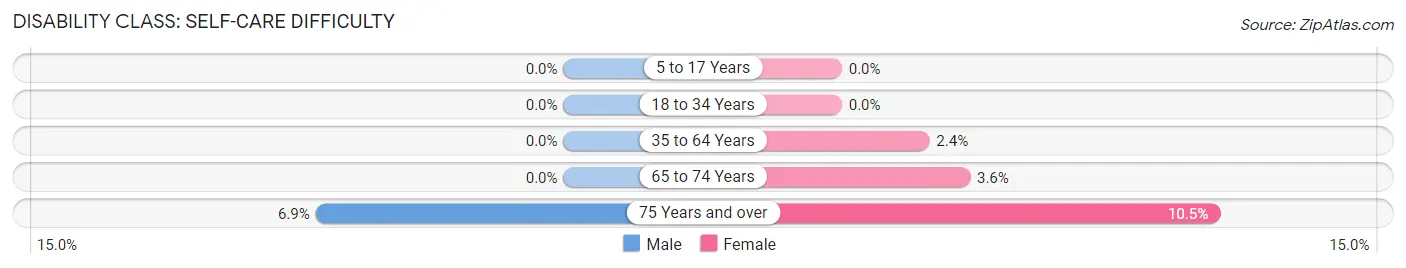
| Age Bracket | Male | Female |
| 5 to 17 Years | 0 (0.0%) | 0 (0.0%) |
| 18 to 34 Years | 0 (0.0%) | 0 (0.0%) |
| 35 to 64 Years | 0 (0.0%) | 2 (2.4%) |
| 65 to 74 Years | 0 (0.0%) | 2 (3.6%) |
| 75 Years and over | 4 (6.9%) | 6 (10.5%) |
Technology Access in South Bethany
Computing Device Access in South Bethany
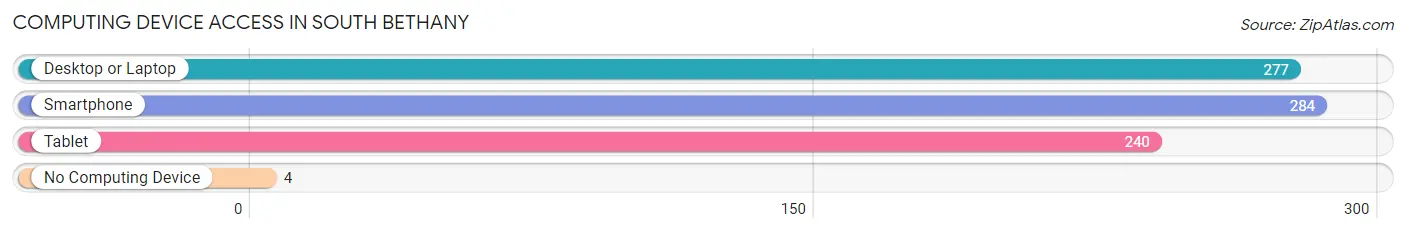
| Device Type | # Households | % Households |
| Desktop or Laptop | 277 | 91.7% |
| Smartphone | 284 | 94.0% |
| Tablet | 240 | 79.5% |
| No Computing Device | 4 | 1.3% |
| Total | 302 | 100.0% |
Internet Access in South Bethany
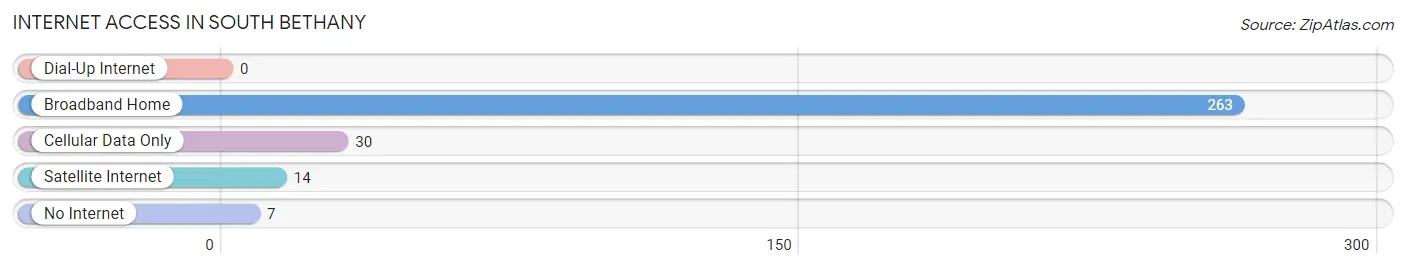
| Internet Type | # Households | % Households |
| Dial-Up Internet | 0 | 0.0% |
| Broadband Home | 263 | 87.1% |
| Cellular Data Only | 30 | 9.9% |
| Satellite Internet | 14 | 4.6% |
| No Internet | 7 | 2.3% |
| Total | 302 | 100.0% |
South Bethany Summary
History
South Bethany is a small town located in Sussex County, Delaware, United States. It is situated on the Atlantic Ocean, just south of Bethany Beach. The town was founded in 1959 by a group of local residents who wanted to create a beach community. The town was incorporated in 1967 and has since become a popular vacation destination.
The area was originally inhabited by the Nanticoke Indians, who were part of the Algonquian-speaking peoples. The Nanticoke were known for their fishing and hunting skills, and the area was a popular spot for them to gather. The first European settlers arrived in the area in the late 1600s, and the town was officially established in 1763.
The town was originally known as “Little Assawoman”, and was part of the larger Assawoman Bay area. The town was renamed South Bethany in 1959, when it was incorporated.
Geography
South Bethany is located in Sussex County, Delaware, United States. It is situated on the Atlantic Ocean, just south of Bethany Beach. The town is bordered by the Assawoman Bay to the west, and the Indian River Bay to the east. The town is located on a barrier island, and is surrounded by the Indian River, Rehoboth Bay, and the Atlantic Ocean.
The town has a total area of 0.9 square miles, all of which is land. The town has a humid subtropical climate, with hot, humid summers and mild winters.
Economy
The economy of South Bethany is largely based on tourism. The town is a popular vacation destination, and many visitors come to enjoy the beaches, fishing, and other outdoor activities. The town also has a number of restaurants, shops, and other businesses that cater to tourists.
The town also has a number of real estate developments, which provide housing for both permanent residents and vacationers. The town also has a number of marinas, which provide boat slips and other services to boaters.
Demographics
As of the 2010 census, the population of South Bethany was 1,060. The racial makeup of the town was 97.2% White, 0.7% African American, 0.3% Native American, 0.7% Asian, 0.1% Pacific Islander, and 0.9% from other races. Hispanic or Latino of any race were 1.7% of the population.
The median income for a household in the town was $62,500, and the median income for a family was $71,250. The per capita income for the town was $37,845. About 4.3% of families and 5.7% of the population were below the poverty line, including 8.3% of those under age 18 and none of those age 65 or over.
Common Questions
What is Per Capita Income in South Bethany?
Per Capita income in South Bethany is $104,454.
What is the Median Family Income in South Bethany?
Median Family Income in South Bethany is $107,500.
What is the Median Household income in South Bethany?
Median Household Income in South Bethany is $106,840.
What is Income or Wage Gap in South Bethany?
Income or Wage Gap in South Bethany is 45.6%.
Women in South Bethany earn 54.4 cents for every dollar earned by a man.
What is Inequality or Gini Index in South Bethany?
Inequality or Gini Index in South Bethany is 0.45.
What is the Total Population of South Bethany?
Total Population of South Bethany is 490.
What is the Total Male Population of South Bethany?
Total Male Population of South Bethany is 281.
What is the Total Female Population of South Bethany?
Total Female Population of South Bethany is 209.
What is the Ratio of Males per 100 Females in South Bethany?
There are 134.45 Males per 100 Females in South Bethany.
What is the Ratio of Females per 100 Males in South Bethany?
There are 74.38 Females per 100 Males in South Bethany.
What is the Median Population Age in South Bethany?
Median Population Age in South Bethany is 69.6 Years.
What is the Average Family Size in South Bethany
Average Family Size in South Bethany is 1.8 People.
What is the Average Household Size in South Bethany
Average Household Size in South Bethany is 1.6 People.
How Large is the Labor Force in South Bethany?
There are 150 People in the Labor Forcein in South Bethany.
What is the Percentage of People in the Labor Force in South Bethany?
30.7% of People are in the Labor Force in South Bethany.
What is the Unemployment Rate in South Bethany?
Unemployment Rate in South Bethany is 4.0%.