Little Creek, DE Map & Demographics
Little Creek Map
Little Creek Overview
$29,443
PER CAPITA INCOME
$46,875
AVG FAMILY INCOME
$57,917
AVG HOUSEHOLD INCOME
0.43
INEQUALITY / GINI INDEX
272
TOTAL POPULATION
150
MALE POPULATION
122
FEMALE POPULATION
122.95
MALES / 100 FEMALES
81.33
FEMALES / 100 MALES
36.8
MEDIAN AGE
3.1
AVG FAMILY SIZE
2.9
AVG HOUSEHOLD SIZE
146
LABOR FORCE [ PEOPLE ]
70.5%
PERCENT IN LABOR FORCE
6.8%
UNEMPLOYMENT RATE
Little Creek Area Codes
Income in Little Creek
Income Overview in Little Creek
Per Capita Income in Little Creek is $29,443, while median incomes of families and households are $46,875 and $57,917 respectively.
| Characteristic | Number | Measure |
| Per Capita Income | 272 | $29,443 |
| Median Family Income | 65 | $46,875 |
| Mean Family Income | 65 | $65,268 |
| Median Household Income | 93 | $57,917 |
| Mean Household Income | 93 | $76,480 |
| Income Deficit | 65 | $0 |
| Wage / Income Gap (%) | 272 | 0.00% |
| Wage / Income Gap ($) | 272 | 100.00¢ per $1 |
| Gini / Inequality Index | 272 | 0.43 |
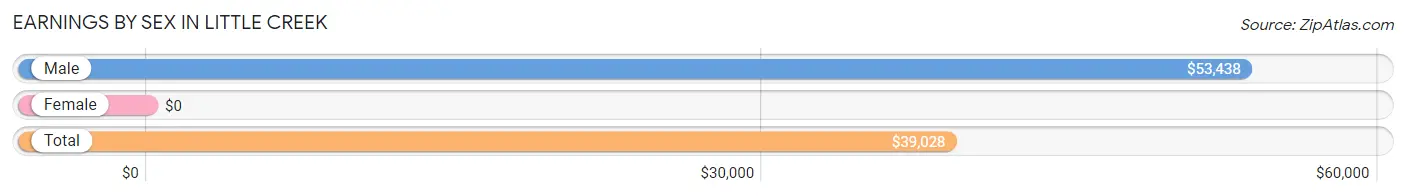
Earnings by Sex in Little Creek
| Sex | Number | Average Earnings |
| Male | 67 (46.9%) | $53,438 |
| Female | 76 (53.1%) | $0 |
| Total | 143 (100.0%) | $39,028 |
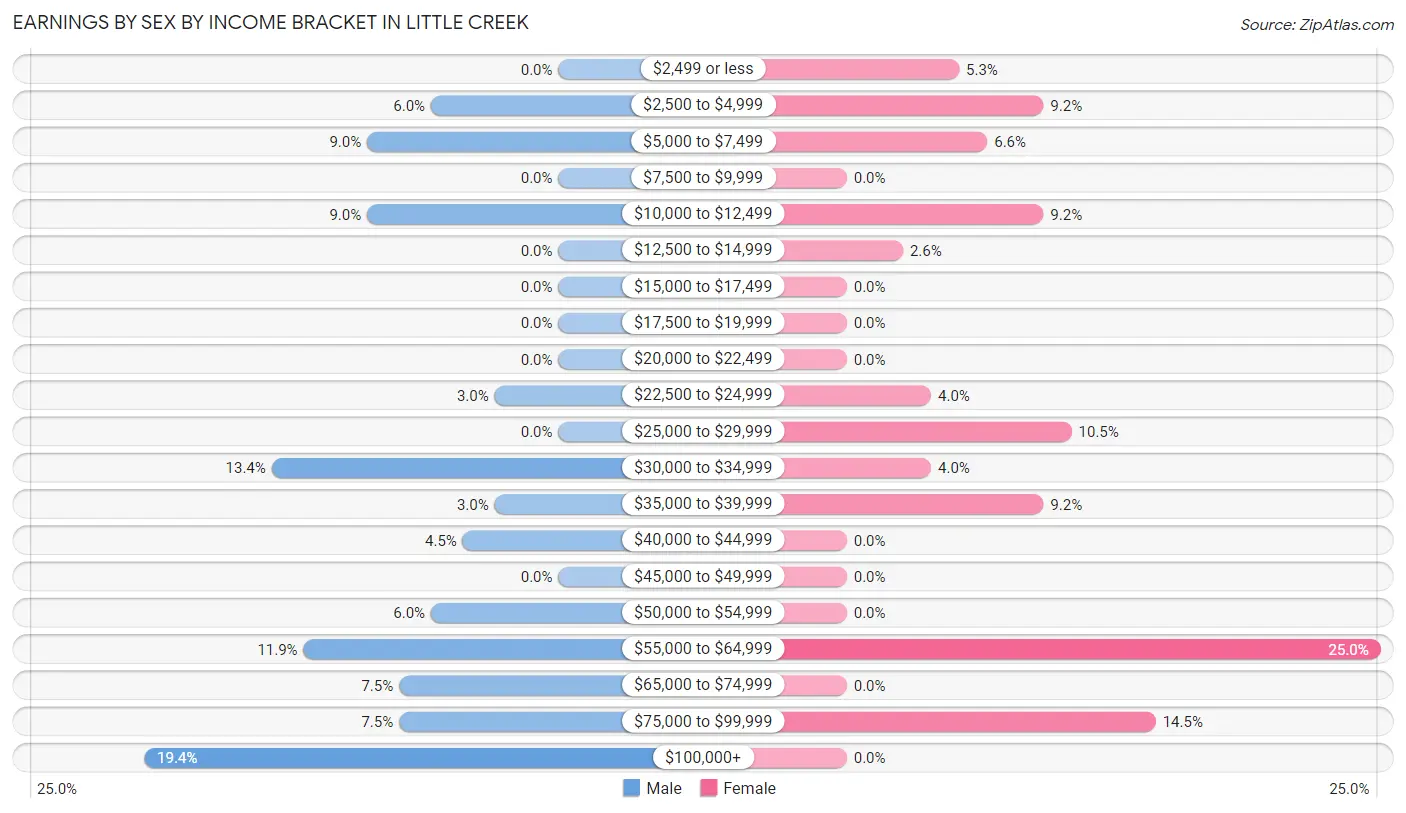
Earnings by Sex by Income Bracket in Little Creek
The most common earnings brackets in Little Creek are $100,000+ for men (13 | 19.4%) and $55,000 to $64,999 for women (19 | 25.0%).
| Income | Male | Female |
| $2,499 or less | 0 (0.0%) | 4 (5.3%) |
| $2,500 to $4,999 | 4 (6.0%) | 7 (9.2%) |
| $5,000 to $7,499 | 6 (9.0%) | 5 (6.6%) |
| $7,500 to $9,999 | 0 (0.0%) | 0 (0.0%) |
| $10,000 to $12,499 | 6 (9.0%) | 7 (9.2%) |
| $12,500 to $14,999 | 0 (0.0%) | 2 (2.6%) |
| $15,000 to $17,499 | 0 (0.0%) | 0 (0.0%) |
| $17,500 to $19,999 | 0 (0.0%) | 0 (0.0%) |
| $20,000 to $22,499 | 0 (0.0%) | 0 (0.0%) |
| $22,500 to $24,999 | 2 (3.0%) | 3 (4.0%) |
| $25,000 to $29,999 | 0 (0.0%) | 8 (10.5%) |
| $30,000 to $34,999 | 9 (13.4%) | 3 (4.0%) |
| $35,000 to $39,999 | 2 (3.0%) | 7 (9.2%) |
| $40,000 to $44,999 | 3 (4.5%) | 0 (0.0%) |
| $45,000 to $49,999 | 0 (0.0%) | 0 (0.0%) |
| $50,000 to $54,999 | 4 (6.0%) | 0 (0.0%) |
| $55,000 to $64,999 | 8 (11.9%) | 19 (25.0%) |
| $65,000 to $74,999 | 5 (7.5%) | 0 (0.0%) |
| $75,000 to $99,999 | 5 (7.5%) | 11 (14.5%) |
| $100,000+ | 13 (19.4%) | 0 (0.0%) |
| Total | 67 (100.0%) | 76 (100.0%) |
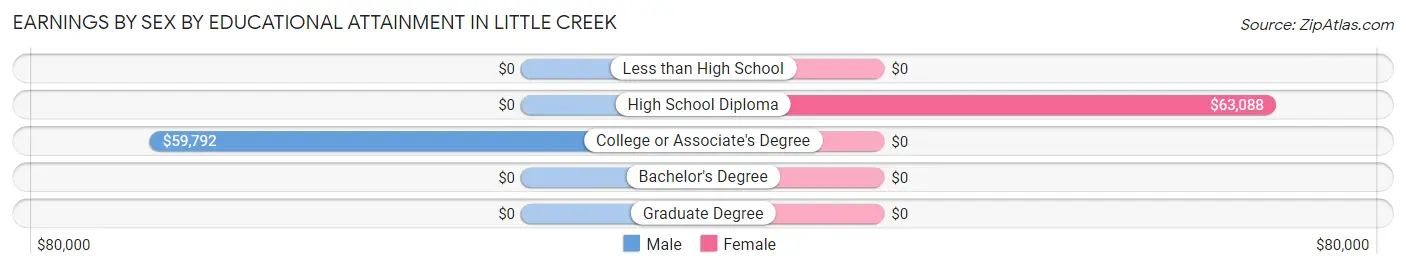
Earnings by Sex by Educational Attainment in Little Creek
| Educational Attainment | Male Income | Female Income |
| Less than High School | - | - |
| High School Diploma | - | - |
| College or Associate's Degree | $59,792 | $0 |
| Bachelor's Degree | - | - |
| Graduate Degree | - | - |
| Total | $58,125 | $0 |
Family Income in Little Creek
Family Income Brackets in Little Creek
According to the Little Creek family income data, there are 17 families falling into the $15,000 to $24,999 income range, which is the most common income bracket and makes up 26.2% of all families. Conversely, the $10,000 to $14,999 income bracket is the least frequent group with only 2 families (3.1%) belonging to this category.
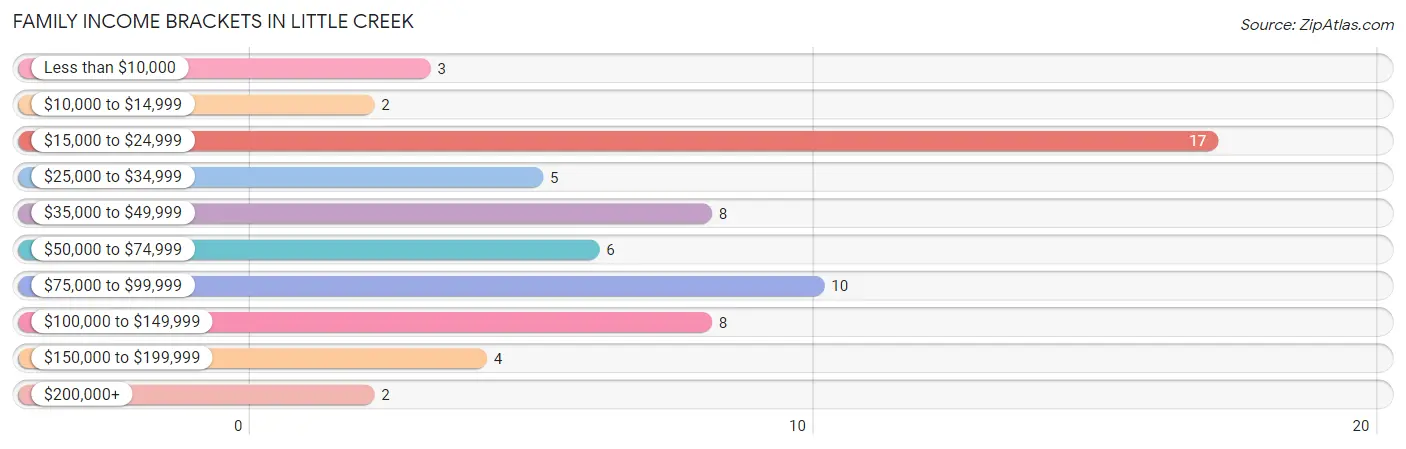
| Income Bracket | # Families | % Families |
| Less than $10,000 | 3 | 4.6% |
| $10,000 to $14,999 | 2 | 3.1% |
| $15,000 to $24,999 | 17 | 26.2% |
| $25,000 to $34,999 | 5 | 7.7% |
| $35,000 to $49,999 | 8 | 12.3% |
| $50,000 to $74,999 | 6 | 9.2% |
| $75,000 to $99,999 | 10 | 15.4% |
| $100,000 to $149,999 | 8 | 12.3% |
| $150,000 to $199,999 | 4 | 6.2% |
| $200,000+ | 2 | 3.1% |
Family Income by Famaliy Size in Little Creek
3-person families (4 | 6.1%) account for the highest median family income in Little Creek with $101,250 per family, while 3-person families (4 | 6.1%) have the highest median income of $33,750 per family member.
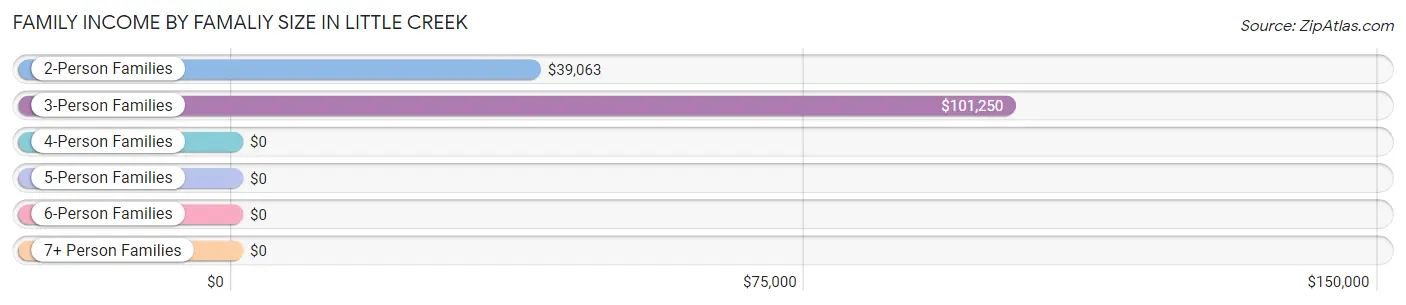
| Income Bracket | # Families | Median Income |
| 2-Person Families | 45 (69.2%) | $39,063 |
| 3-Person Families | 4 (6.1%) | $101,250 |
| 4-Person Families | 9 (13.9%) | $0 |
| 5-Person Families | 0 (0.0%) | $0 |
| 6-Person Families | 2 (3.1%) | $0 |
| 7+ Person Families | 5 (7.7%) | $0 |
| Total | 65 (100.0%) | $46,875 |
Family Income by Number of Earners in Little Creek
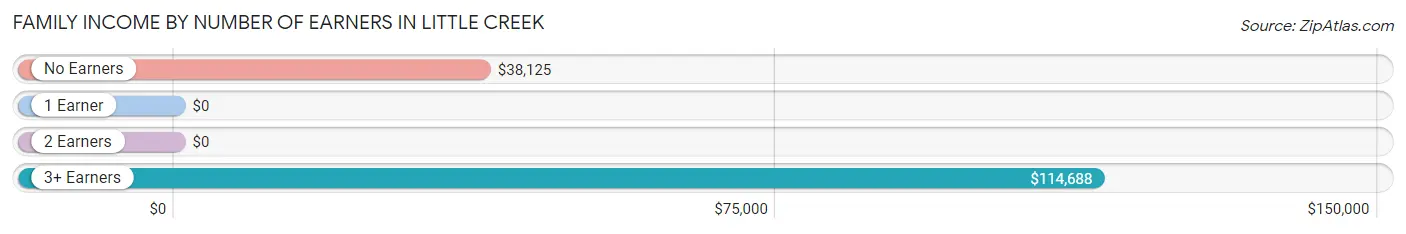
| Number of Earners | # Families | Median Income |
| No Earners | 18 (27.7%) | $38,125 |
| 1 Earner | 22 (33.9%) | $0 |
| 2 Earners | 16 (24.6%) | $0 |
| 3+ Earners | 9 (13.9%) | $114,688 |
| Total | 65 (100.0%) | $46,875 |
Household Income in Little Creek
Household Income Brackets in Little Creek
With 18 households falling in the category, the $15,000 to $24,999 income range is the most frequent in Little Creek, accounting for 19.4% of all households. In contrast, only 1 households (1.1%) fall into the $25,000 to $34,999 income bracket, making it the least populous group.
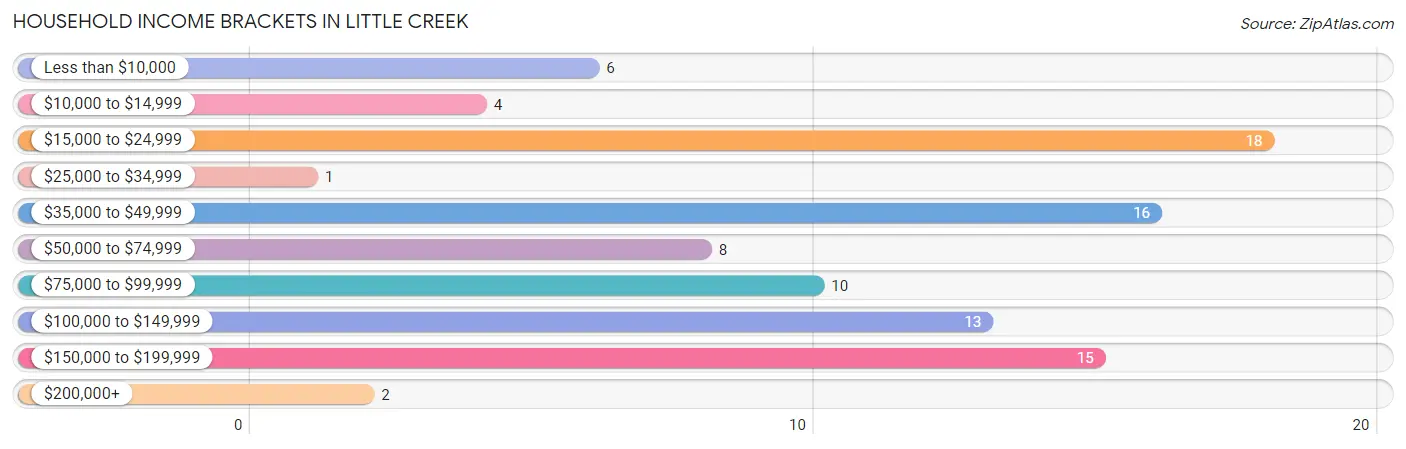
| Income Bracket | # Households | % Households |
| Less than $10,000 | 6 | 6.5% |
| $10,000 to $14,999 | 4 | 4.3% |
| $15,000 to $24,999 | 18 | 19.4% |
| $25,000 to $34,999 | 1 | 1.1% |
| $35,000 to $49,999 | 16 | 17.2% |
| $50,000 to $74,999 | 8 | 8.6% |
| $75,000 to $99,999 | 10 | 10.8% |
| $100,000 to $149,999 | 13 | 14.0% |
| $150,000 to $199,999 | 15 | 16.1% |
| $200,000+ | 2 | 2.2% |
Household Income by Householder Age in Little Creek
The median household income in Little Creek is $57,917, with the highest median household income of $113,750 found in the 45 to 64 years age bracket for the primary householder. A total of 34 households (36.6%) fall into this category. Meanwhile, the 15 to 24 years age bracket for the primary householder has the lowest median household income of $0, with 5 households (5.4%) in this group.
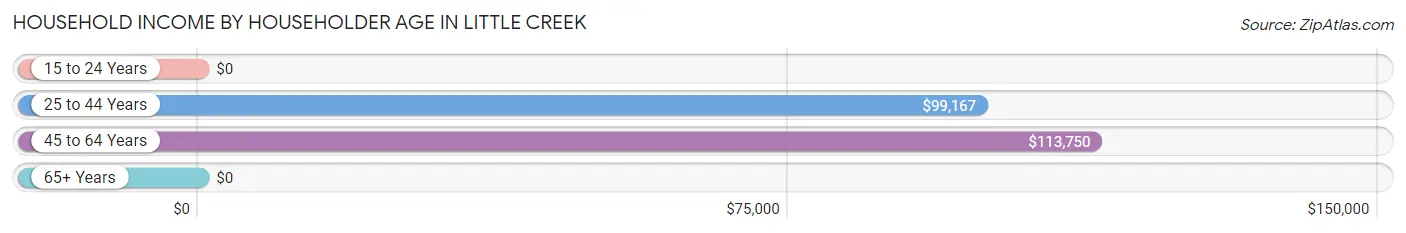
| Income Bracket | # Households | Median Income |
| 15 to 24 Years | 5 (5.4%) | $0 |
| 25 to 44 Years | 26 (28.0%) | $99,167 |
| 45 to 64 Years | 34 (36.6%) | $113,750 |
| 65+ Years | 28 (30.1%) | $0 |
| Total | 93 (100.0%) | $57,917 |
Poverty in Little Creek
Income Below Poverty by Sex and Age in Little Creek
With 27.3% poverty level for males and 26.2% for females among the residents of Little Creek, under 5 year old males and 6 to 11 year old females are the most vulnerable to poverty, with 6 males (100.0%) and 3 females (100.0%) in their respective age groups living below the poverty level.
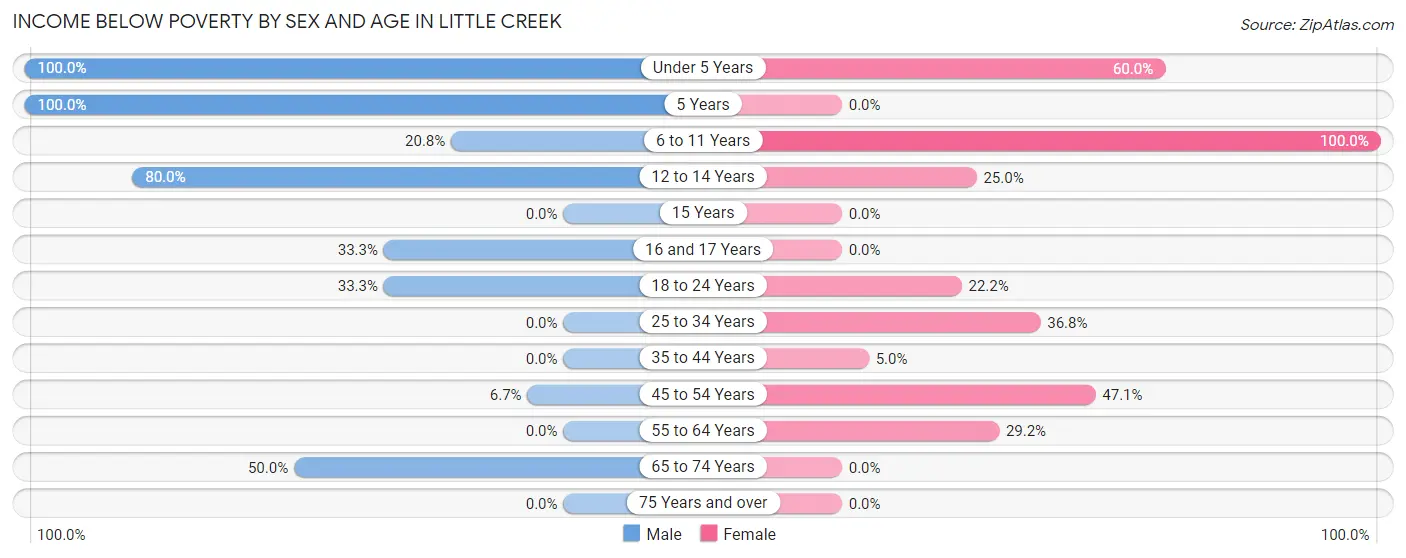
| Age Bracket | Male | Female |
| Under 5 Years | 6 (100.0%) | 3 (60.0%) |
| 5 Years | 2 (100.0%) | 0 (0.0%) |
| 6 to 11 Years | 5 (20.8%) | 3 (100.0%) |
| 12 to 14 Years | 8 (80.0%) | 1 (25.0%) |
| 15 Years | 0 (0.0%) | 0 (0.0%) |
| 16 and 17 Years | 4 (33.3%) | 0 (0.0%) |
| 18 to 24 Years | 2 (33.3%) | 2 (22.2%) |
| 25 to 34 Years | 0 (0.0%) | 7 (36.8%) |
| 35 to 44 Years | 0 (0.0%) | 1 (5.0%) |
| 45 to 54 Years | 1 (6.7%) | 8 (47.1%) |
| 55 to 64 Years | 0 (0.0%) | 7 (29.2%) |
| 65 to 74 Years | 10 (50.0%) | 0 (0.0%) |
| 75 Years and over | 0 (0.0%) | 0 (0.0%) |
| Total | 38 (27.3%) | 32 (26.2%) |
Income Above Poverty by Sex and Age in Little Creek
According to the poverty statistics in Little Creek, males aged 25 to 34 years and females aged 16 and 17 years are the age groups that are most secure financially, with 100.0% of males and 100.0% of females in these age groups living above the poverty line.
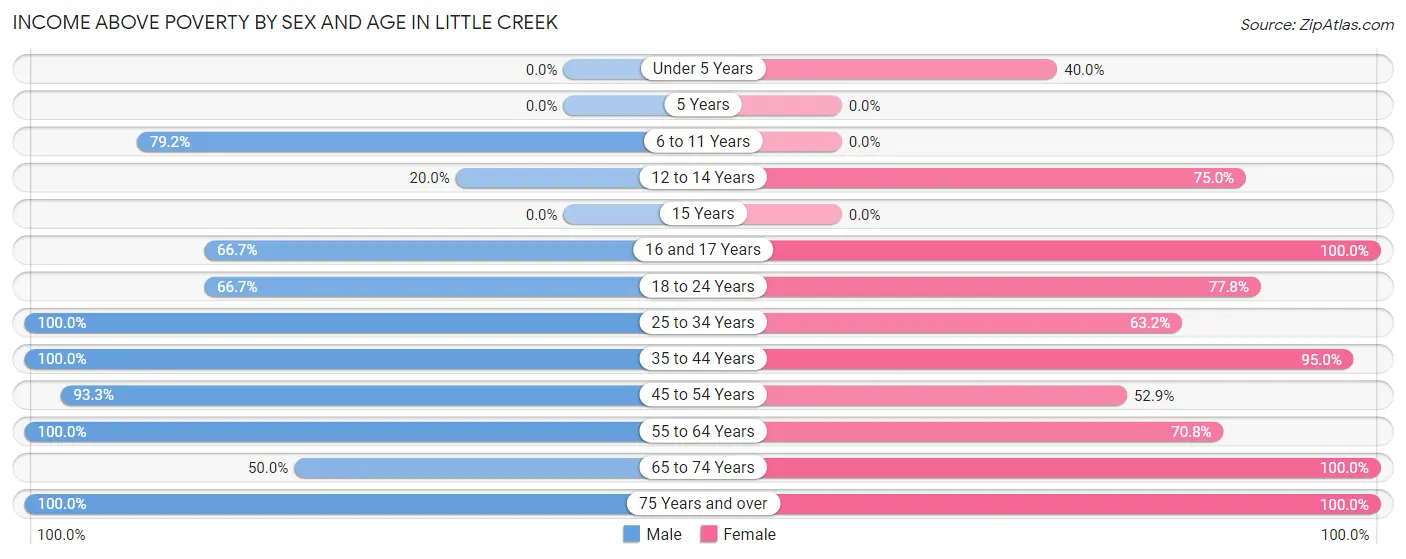
| Age Bracket | Male | Female |
| Under 5 Years | 0 (0.0%) | 2 (40.0%) |
| 5 Years | 0 (0.0%) | 0 (0.0%) |
| 6 to 11 Years | 19 (79.2%) | 0 (0.0%) |
| 12 to 14 Years | 2 (20.0%) | 3 (75.0%) |
| 15 Years | 0 (0.0%) | 0 (0.0%) |
| 16 and 17 Years | 8 (66.7%) | 5 (100.0%) |
| 18 to 24 Years | 4 (66.7%) | 7 (77.8%) |
| 25 to 34 Years | 14 (100.0%) | 12 (63.2%) |
| 35 to 44 Years | 12 (100.0%) | 19 (95.0%) |
| 45 to 54 Years | 14 (93.3%) | 9 (52.9%) |
| 55 to 64 Years | 12 (100.0%) | 17 (70.8%) |
| 65 to 74 Years | 10 (50.0%) | 10 (100.0%) |
| 75 Years and over | 6 (100.0%) | 6 (100.0%) |
| Total | 101 (72.7%) | 90 (73.8%) |
Income Below Poverty Among Married-Couple Families in Little Creek
The poverty statistics for married-couple families in Little Creek show that 17.8% or 8 of the total 45 families live below the poverty line. Families with no children have the highest poverty rate of 22.2%, comprising of 8 families. On the other hand, families with 1 or 2 children have the lowest poverty rate of 0.0%, which includes 0 families.
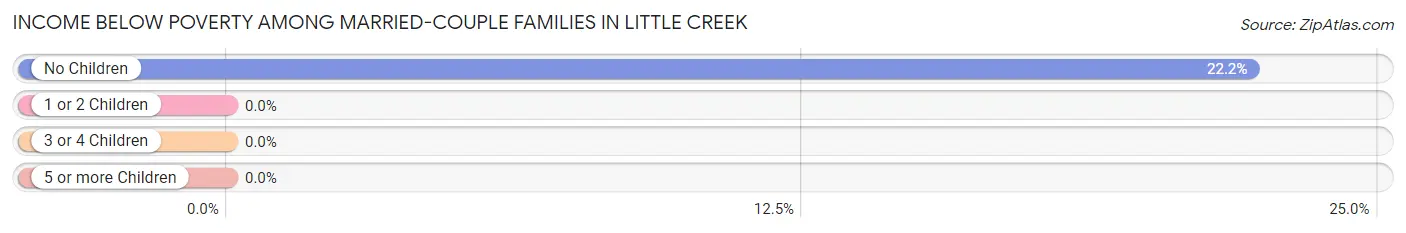
| Children | Above Poverty | Below Poverty |
| No Children | 28 (77.8%) | 8 (22.2%) |
| 1 or 2 Children | 7 (100.0%) | 0 (0.0%) |
| 3 or 4 Children | 2 (100.0%) | 0 (0.0%) |
| 5 or more Children | 0 (0.0%) | 0 (0.0%) |
| Total | 37 (82.2%) | 8 (17.8%) |
Income Below Poverty Among Single-Parent Households in Little Creek
According to the poverty data in Little Creek, 100.0% or 2 single-father households and 44.4% or 8 single-mother households are living below the poverty line. Among single-father households, those with 3 or 4 children have the highest poverty rate, with 2 households (100.0%) experiencing poverty. Likewise, among single-mother households, those with 5 or more children have the highest poverty rate, with 5 households (100.0%) falling below the poverty line.
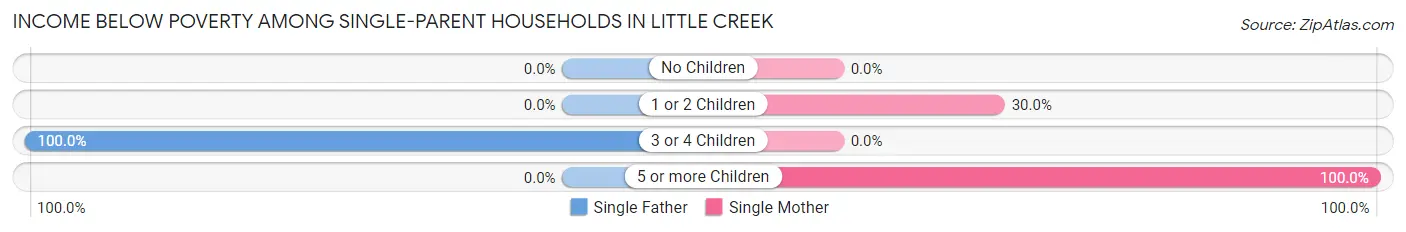
| Children | Single Father | Single Mother |
| No Children | 0 (0.0%) | 0 (0.0%) |
| 1 or 2 Children | 0 (0.0%) | 3 (30.0%) |
| 3 or 4 Children | 2 (100.0%) | 0 (0.0%) |
| 5 or more Children | 0 (0.0%) | 5 (100.0%) |
| Total | 2 (100.0%) | 8 (44.4%) |
Income Below Poverty Among Married-Couple vs Single-Parent Households in Little Creek
The poverty data for Little Creek shows that 8 of the married-couple family households (17.8%) and 10 of the single-parent households (50.0%) are living below the poverty level. Within the married-couple family households, those with no children have the highest poverty rate, with 8 households (22.2%) falling below the poverty line. Among the single-parent households, those with 3 or 4 children have the highest poverty rate, with 2 household (100.0%) living below poverty.
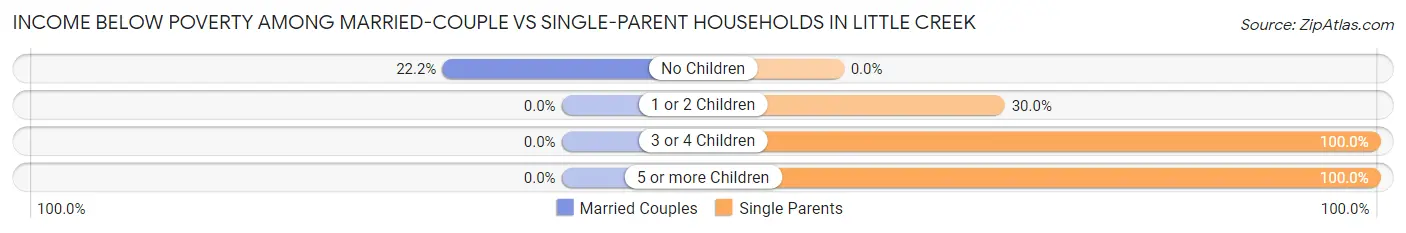
| Children | Married-Couple Families | Single-Parent Households |
| No Children | 8 (22.2%) | 0 (0.0%) |
| 1 or 2 Children | 0 (0.0%) | 3 (30.0%) |
| 3 or 4 Children | 0 (0.0%) | 2 (100.0%) |
| 5 or more Children | 0 (0.0%) | 5 (100.0%) |
| Total | 8 (17.8%) | 10 (50.0%) |
Race in Little Creek
The most populous races in Little Creek are White / Caucasian (255 | 93.8%), Two or more Races (15 | 5.5%), and Hispanic or Latino (7 | 2.6%).
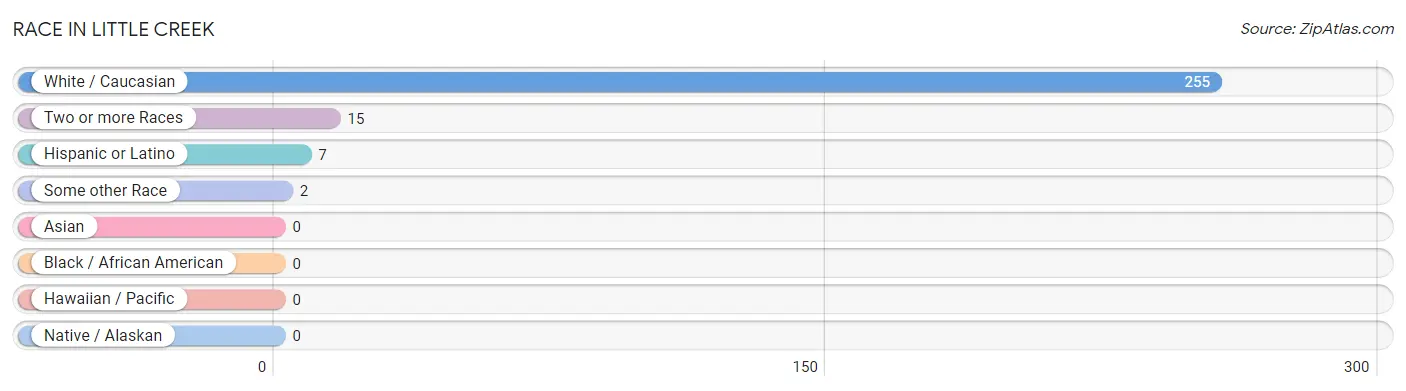
| Race | # Population | % Population |
| Asian | 0 | 0.0% |
| Black / African American | 0 | 0.0% |
| Hawaiian / Pacific | 0 | 0.0% |
| Hispanic or Latino | 7 | 2.6% |
| Native / Alaskan | 0 | 0.0% |
| White / Caucasian | 255 | 93.8% |
| Two or more Races | 15 | 5.5% |
| Some other Race | 2 | 0.7% |
| Total | 272 | 100.0% |
Ancestry in Little Creek
The most populous ancestries reported in Little Creek are English (43 | 15.8%), Irish (41 | 15.1%), German (34 | 12.5%), Italian (10 | 3.7%), and Russian (9 | 3.3%), together accounting for 50.4% of all Little Creek residents.
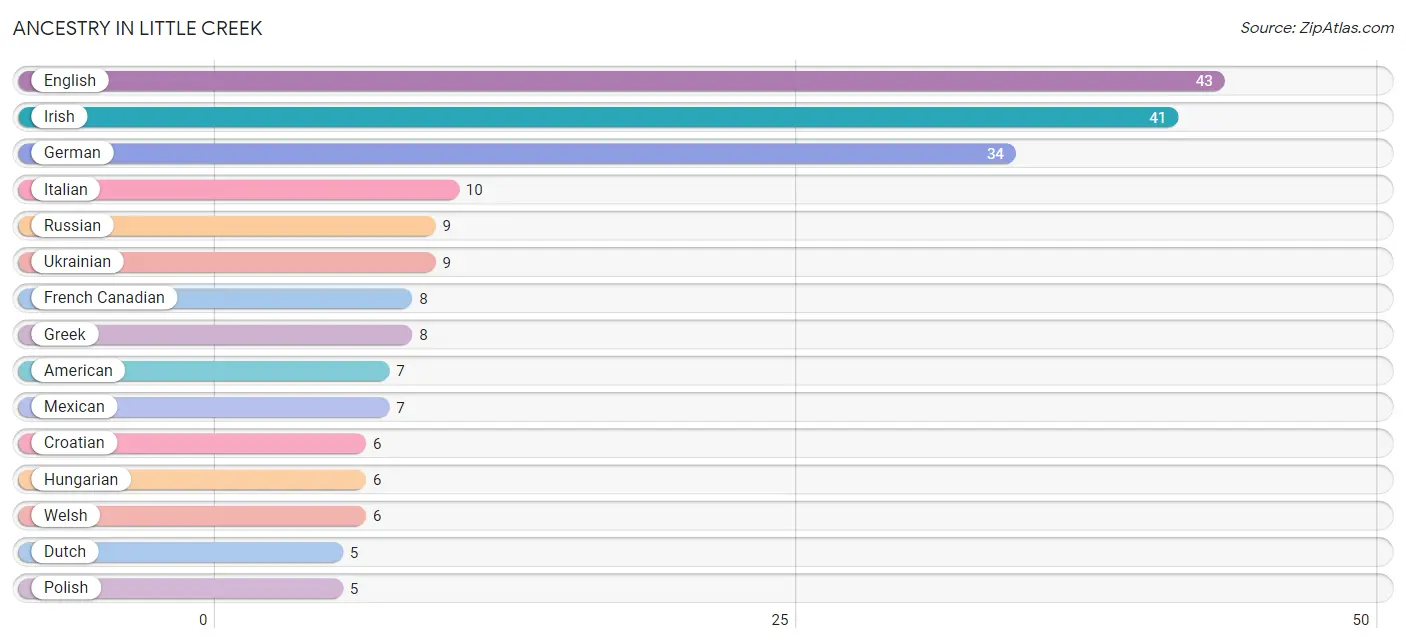
| Ancestry | # Population | % Population |
| American | 7 | 2.6% |
| Croatian | 6 | 2.2% |
| Czech | 2 | 0.7% |
| Delaware | 1 | 0.4% |
| Dutch | 5 | 1.8% |
| English | 43 | 15.8% |
| French Canadian | 8 | 2.9% |
| German | 34 | 12.5% |
| Greek | 8 | 2.9% |
| Hungarian | 6 | 2.2% |
| Irish | 41 | 15.1% |
| Italian | 10 | 3.7% |
| Mexican | 7 | 2.6% |
| Norwegian | 4 | 1.5% |
| Polish | 5 | 1.8% |
| Russian | 9 | 3.3% |
| Scotch-Irish | 2 | 0.7% |
| Slovak | 2 | 0.7% |
| Ukrainian | 9 | 3.3% |
| Welsh | 6 | 2.2% | View All 20 Rows |
Immigrants in Little Creek
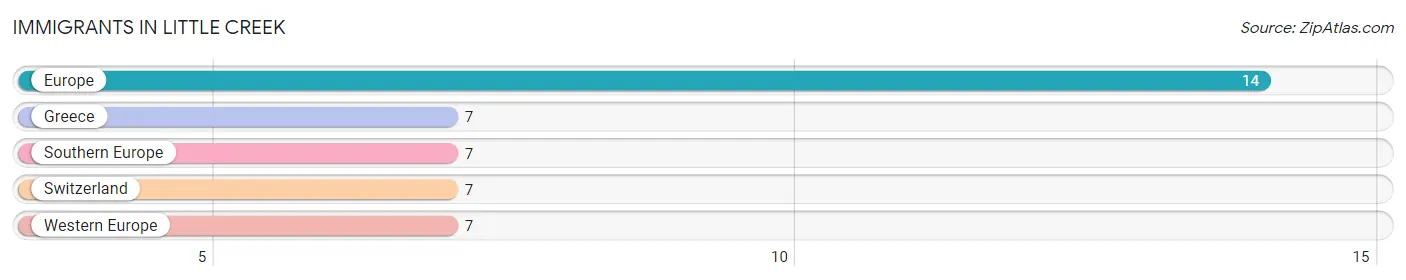
The most numerous immigrant groups reported in Little Creek came from Europe (14 | 5.1%), Greece (7 | 2.6%), Southern Europe (7 | 2.6%), Switzerland (7 | 2.6%), and Western Europe (7 | 2.6%), together accounting for 15.4% of all Little Creek residents.
| Immigration Origin | # Population | % Population |
| Europe | 14 | 5.1% |
| Greece | 7 | 2.6% |
| Southern Europe | 7 | 2.6% |
| Switzerland | 7 | 2.6% |
| Western Europe | 7 | 2.6% | View All 5 Rows |
Sex and Age in Little Creek
Sex and Age in Little Creek
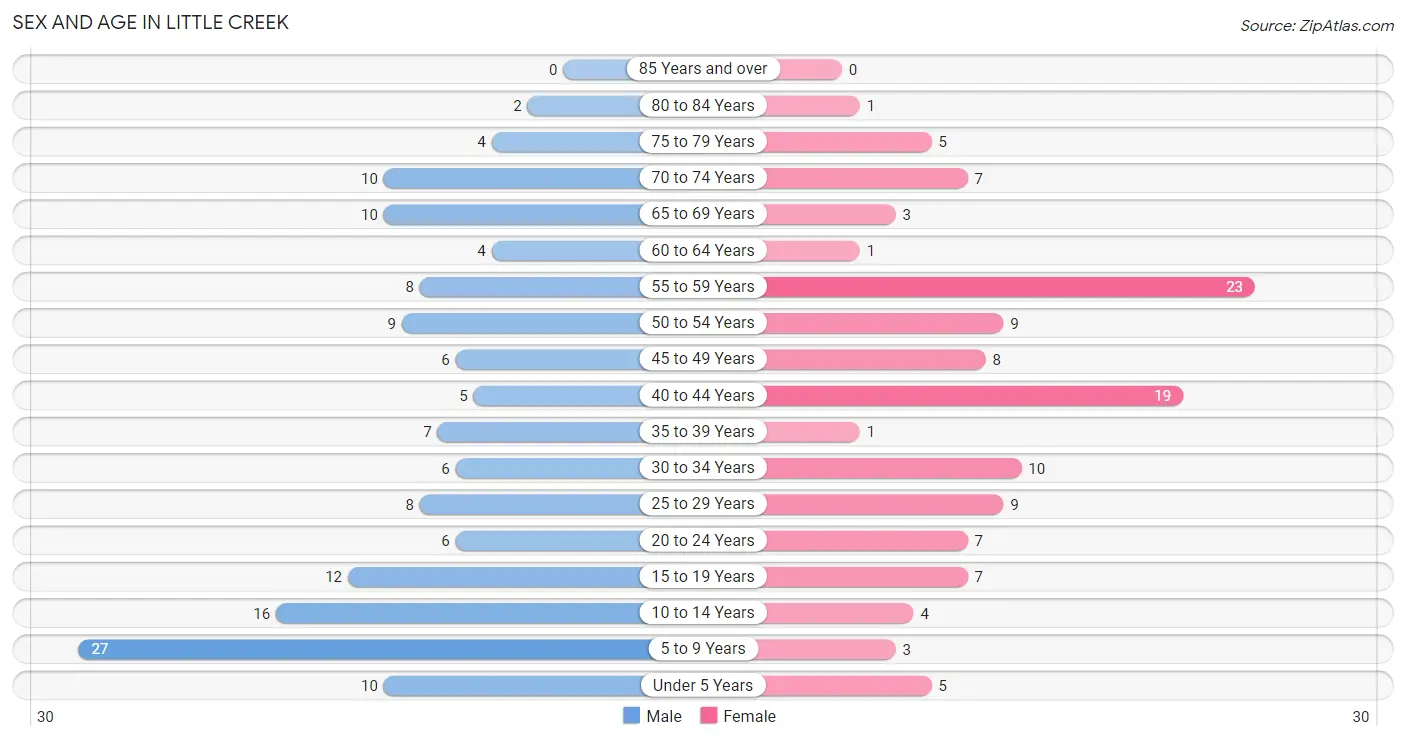
The most populous age groups in Little Creek are 5 to 9 Years (27 | 18.0%) for men and 55 to 59 Years (23 | 18.9%) for women.
| Age Bracket | Male | Female |
| Under 5 Years | 10 (6.7%) | 5 (4.1%) |
| 5 to 9 Years | 27 (18.0%) | 3 (2.5%) |
| 10 to 14 Years | 16 (10.7%) | 4 (3.3%) |
| 15 to 19 Years | 12 (8.0%) | 7 (5.7%) |
| 20 to 24 Years | 6 (4.0%) | 7 (5.7%) |
| 25 to 29 Years | 8 (5.3%) | 9 (7.4%) |
| 30 to 34 Years | 6 (4.0%) | 10 (8.2%) |
| 35 to 39 Years | 7 (4.7%) | 1 (0.8%) |
| 40 to 44 Years | 5 (3.3%) | 19 (15.6%) |
| 45 to 49 Years | 6 (4.0%) | 8 (6.6%) |
| 50 to 54 Years | 9 (6.0%) | 9 (7.4%) |
| 55 to 59 Years | 8 (5.3%) | 23 (18.9%) |
| 60 to 64 Years | 4 (2.7%) | 1 (0.8%) |
| 65 to 69 Years | 10 (6.7%) | 3 (2.5%) |
| 70 to 74 Years | 10 (6.7%) | 7 (5.7%) |
| 75 to 79 Years | 4 (2.7%) | 5 (4.1%) |
| 80 to 84 Years | 2 (1.3%) | 1 (0.8%) |
| 85 Years and over | 0 (0.0%) | 0 (0.0%) |
| Total | 150 (100.0%) | 122 (100.0%) |
Families and Households in Little Creek
Median Family Size in Little Creek
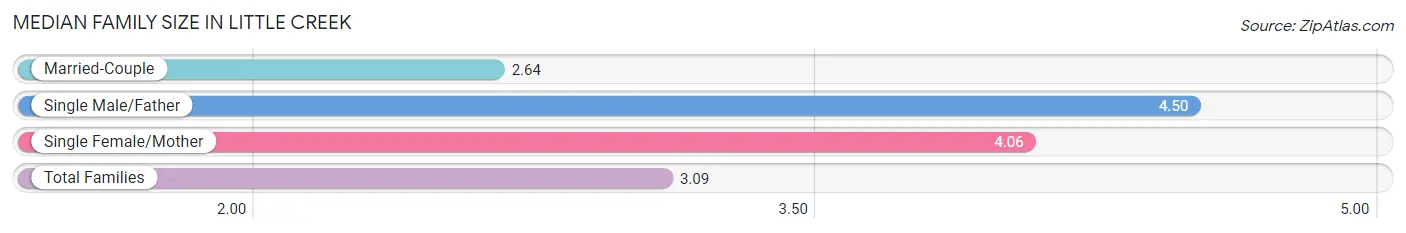
The median family size in Little Creek is 3.09 persons per family, with single male/father families (2 | 3.1%) accounting for the largest median family size of 4.5 persons per family. On the other hand, married-couple families (45 | 69.2%) represent the smallest median family size with 2.64 persons per family.
| Family Type | # Families | Family Size |
| Married-Couple | 45 (69.2%) | 2.64 |
| Single Male/Father | 2 (3.1%) | 4.50 |
| Single Female/Mother | 18 (27.7%) | 4.06 |
| Total Families | 65 (100.0%) | 3.09 |
Median Household Size in Little Creek
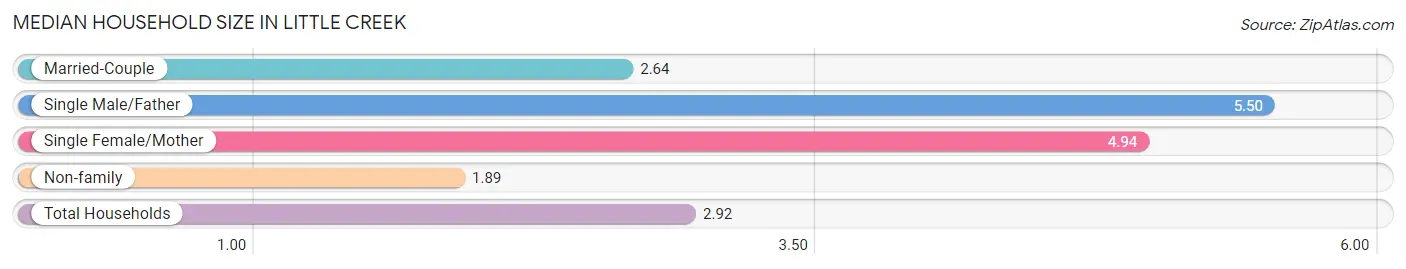
The median household size in Little Creek is 2.92 persons per household, with single male/father households (2 | 2.1%) accounting for the largest median household size of 5.5 persons per household. non-family households (28 | 30.1%) represent the smallest median household size with 1.89 persons per household.
| Household Type | # Households | Household Size |
| Married-Couple | 45 (48.4%) | 2.64 |
| Single Male/Father | 2 (2.1%) | 5.50 |
| Single Female/Mother | 18 (19.4%) | 4.94 |
| Non-family | 28 (30.1%) | 1.89 |
| Total Households | 93 (100.0%) | 2.92 |
Household Size by Marriage Status in Little Creek
Out of a total of 93 households in Little Creek, 65 (69.9%) are family households, while 28 (30.1%) are nonfamily households. The most numerous type of family households are 2-person households, comprising 45, and the most common type of nonfamily households are 1-person households, comprising 19.
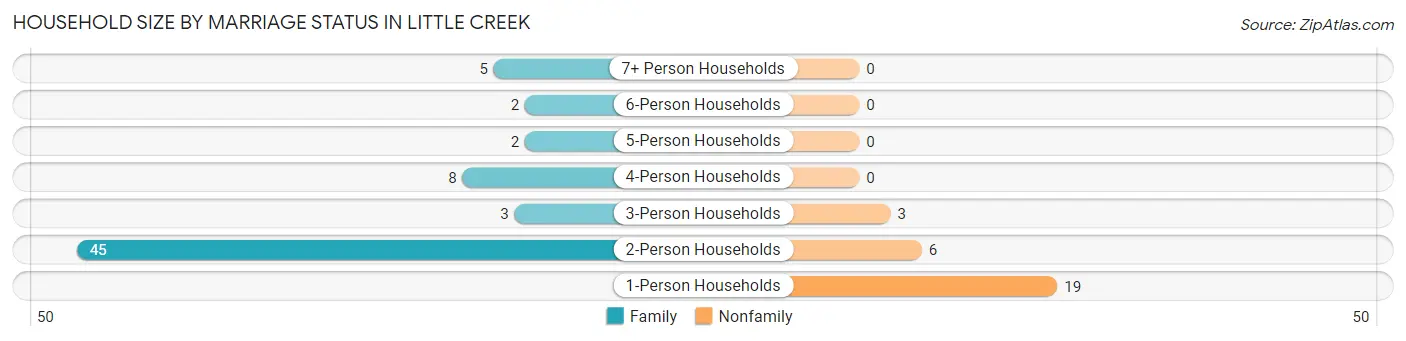
| Household Size | Family Households | Nonfamily Households |
| 1-Person Households | - | 19 (20.4%) |
| 2-Person Households | 45 (48.4%) | 6 (6.5%) |
| 3-Person Households | 3 (3.2%) | 3 (3.2%) |
| 4-Person Households | 8 (8.6%) | 0 (0.0%) |
| 5-Person Households | 2 (2.1%) | 0 (0.0%) |
| 6-Person Households | 2 (2.1%) | 0 (0.0%) |
| 7+ Person Households | 5 (5.4%) | 0 (0.0%) |
| Total | 65 (69.9%) | 28 (30.1%) |
Female Fertility in Little Creek
Fertility by Age in Little Creek
| Age Bracket | Women with Births | Births / 1,000 Women |
| 15 to 19 years | 0 (0.0%) | 0.0 |
| 20 to 34 years | 0 (0.0%) | 0.0 |
| 35 to 50 years | 0 (0.0%) | 0.0 |
| Total | 0 (0.0%) | 0.0 |
Fertility by Age by Marriage Status in Little Creek
| Age Bracket | Married | Unmarried |
| 15 to 19 years | 0 (0.0%) | 0 (0.0%) |
| 20 to 34 years | 0 (0.0%) | 0 (0.0%) |
| 35 to 50 years | 0 (0.0%) | 0 (0.0%) |
| Total | 0 (0.0%) | 0 (0.0%) |
Fertility by Education in Little Creek
| Educational Attainment | Women with Births | Births / 1,000 Women |
| Less than High School | 0 (0.0%) | 0.0 |
| High School Diploma | 0 (0.0%) | 0.0 |
| College or Associate's Degree | 0 (0.0%) | 0.0 |
| Bachelor's Degree | 0 (0.0%) | 0.0 |
| Graduate Degree | 0 (0.0%) | 0.0 |
| Total | 0 (0.0%) | 0.0 |
Fertility by Education by Marriage Status in Little Creek
| Educational Attainment | Married | Unmarried |
| Less than High School | 0 (0.0%) | 0 (0.0%) |
| High School Diploma | 0 (0.0%) | 0 (0.0%) |
| College or Associate's Degree | 0 (0.0%) | 0 (0.0%) |
| Bachelor's Degree | 0 (0.0%) | 0 (0.0%) |
| Graduate Degree | 0 (0.0%) | 0 (0.0%) |
| Total | 0 (0.0%) | 0 (0.0%) |
Employment Characteristics in Little Creek
Employment by Class of Employer in Little Creek
Among the 136 employed individuals in Little Creek, private company employees (78 | 57.4%), local government employees (32 | 23.5%), and not-for-profit organizations (15 | 11.0%) make up the most common classes of employment.
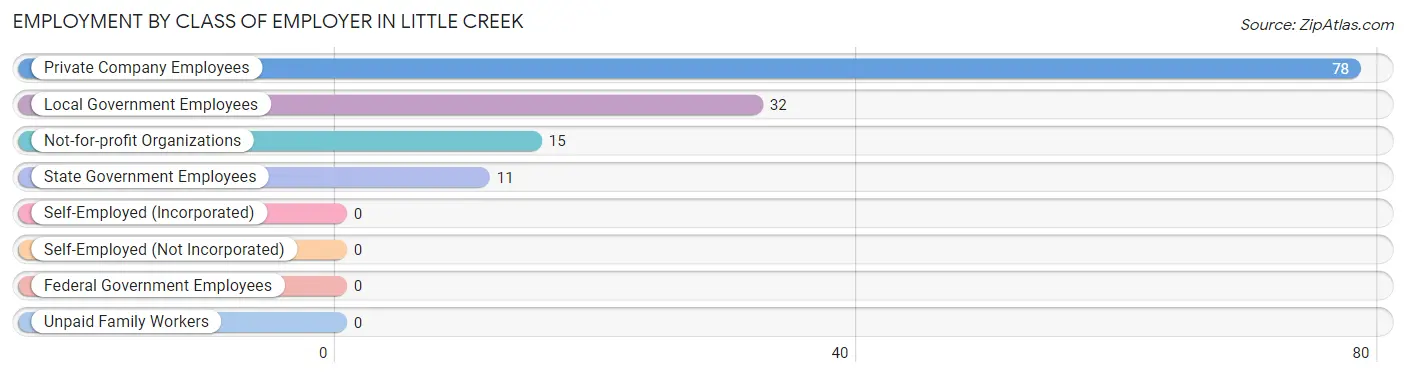
| Employer Class | # Employees | % Employees |
| Private Company Employees | 78 | 57.4% |
| Self-Employed (Incorporated) | 0 | 0.0% |
| Self-Employed (Not Incorporated) | 0 | 0.0% |
| Not-for-profit Organizations | 15 | 11.0% |
| Local Government Employees | 32 | 23.5% |
| State Government Employees | 11 | 8.1% |
| Federal Government Employees | 0 | 0.0% |
| Unpaid Family Workers | 0 | 0.0% |
| Total | 136 | 100.0% |
Employment Status by Age in Little Creek
According to the labor force statistics for Little Creek, out of the total population over 16 years of age (207), 70.5% or 146 individuals are in the labor force, with 6.8% or 10 of them unemployed. The age group with the highest labor force participation rate is 25 to 29 years, with 100.0% or 17 individuals in the labor force. Within the labor force, the 25 to 29 years age range has the highest percentage of unemployed individuals, with 35.3% or 6 of them being unemployed.
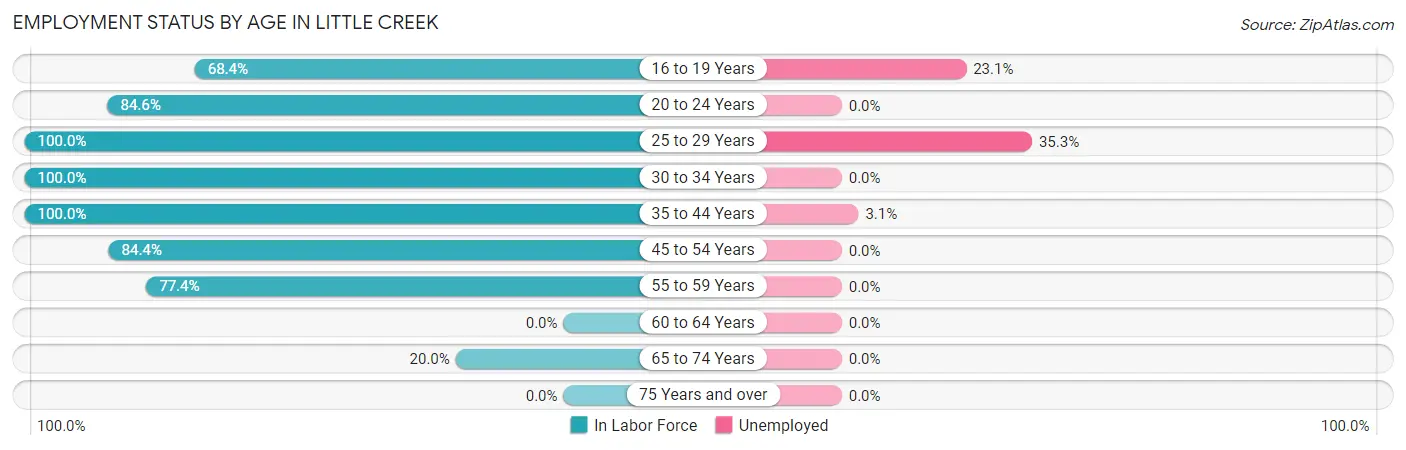
| Age Bracket | In Labor Force | Unemployed |
| 16 to 19 Years | 13 (68.4%) | 3 (23.1%) |
| 20 to 24 Years | 11 (84.6%) | 0 (0.0%) |
| 25 to 29 Years | 17 (100.0%) | 6 (35.3%) |
| 30 to 34 Years | 16 (100.0%) | 0 (0.0%) |
| 35 to 44 Years | 32 (100.0%) | 1 (3.1%) |
| 45 to 54 Years | 27 (84.4%) | 0 (0.0%) |
| 55 to 59 Years | 24 (77.4%) | 0 (0.0%) |
| 60 to 64 Years | 0 (0.0%) | 0 (0.0%) |
| 65 to 74 Years | 6 (20.0%) | 0 (0.0%) |
| 75 Years and over | 0 (0.0%) | 0 (0.0%) |
| Total | 146 (70.5%) | 10 (6.8%) |
Employment Status by Educational Attainment in Little Creek
According to labor force statistics for Little Creek, 87.2% of individuals (116) out of the total population between 25 and 64 years of age (133) are in the labor force, with 6.0% or 7 of them being unemployed. The group with the highest labor force participation rate are those with the educational attainment of bachelor's degree or higher, with 93.8% or 15 individuals in the labor force. Within the labor force, individuals with bachelor's degree or higher education have the highest percentage of unemployment, with 40.0% or 6 of them being unemployed.
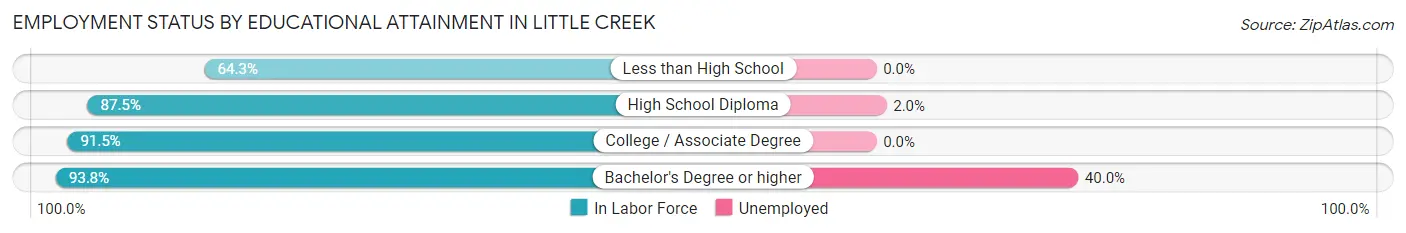
| Educational Attainment | In Labor Force | Unemployed |
| Less than High School | 9 (64.3%) | 0 (0.0%) |
| High School Diploma | 49 (87.5%) | 1 (2.0%) |
| College / Associate Degree | 43 (91.5%) | 0 (0.0%) |
| Bachelor's Degree or higher | 15 (93.8%) | 6 (40.0%) |
| Total | 116 (87.2%) | 8 (6.0%) |
Employment Occupations by Sex in Little Creek
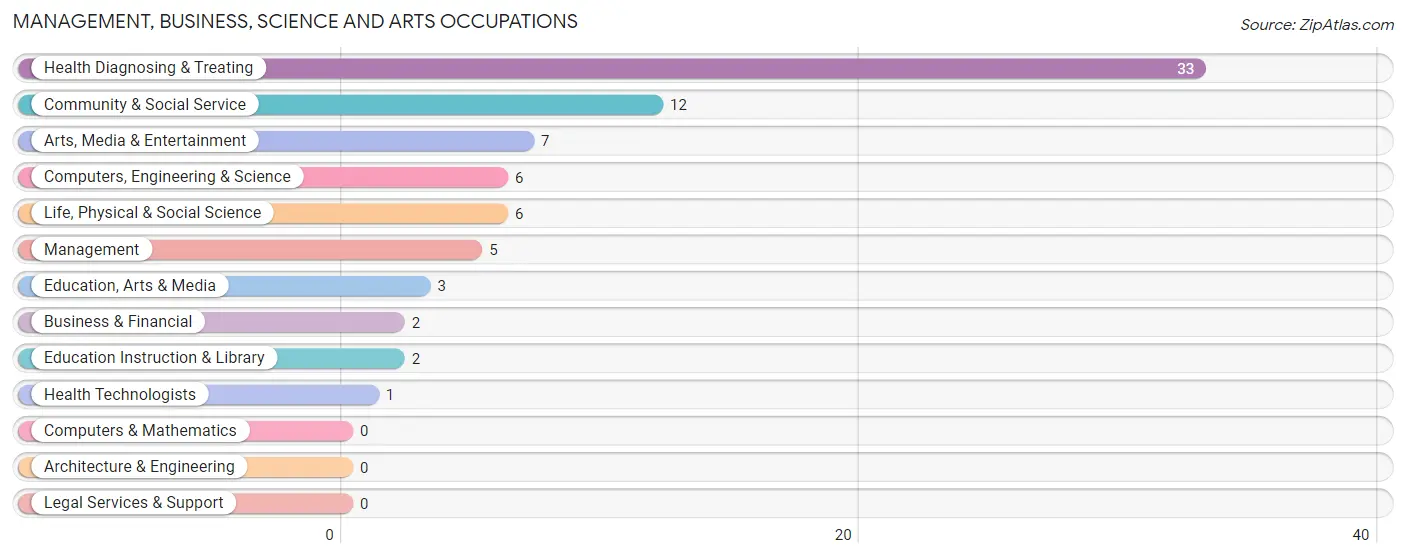
Management, Business, Science and Arts Occupations
The most common Management, Business, Science and Arts occupations in Little Creek are Health Diagnosing & Treating (33 | 24.3%), Community & Social Service (12 | 8.8%), Arts, Media & Entertainment (7 | 5.1%), Computers, Engineering & Science (6 | 4.4%), and Life, Physical & Social Science (6 | 4.4%).
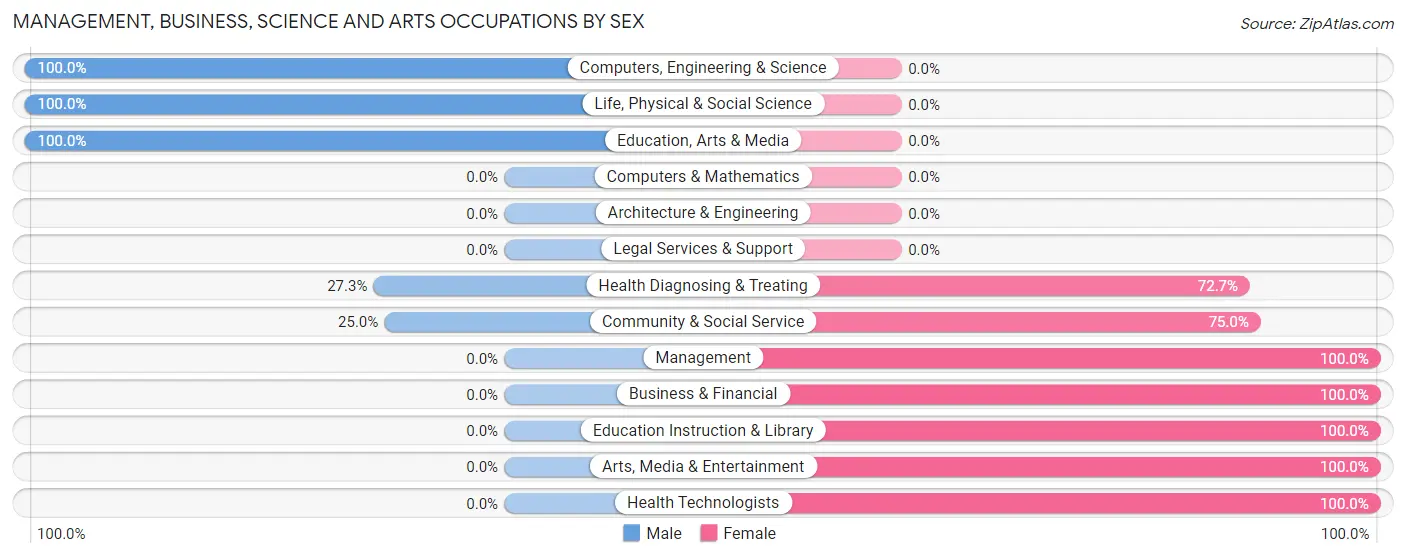
Management, Business, Science and Arts Occupations by Sex
Within the Management, Business, Science and Arts occupations in Little Creek, the most male-oriented occupations are Computers, Engineering & Science (100.0%), Life, Physical & Social Science (100.0%), and Education, Arts & Media (100.0%), while the most female-oriented occupations are Management (100.0%), Business & Financial (100.0%), and Education Instruction & Library (100.0%).
| Occupation | Male | Female |
| Management | 0 (0.0%) | 5 (100.0%) |
| Business & Financial | 0 (0.0%) | 2 (100.0%) |
| Computers, Engineering & Science | 6 (100.0%) | 0 (0.0%) |
| Computers & Mathematics | 0 (0.0%) | 0 (0.0%) |
| Architecture & Engineering | 0 (0.0%) | 0 (0.0%) |
| Life, Physical & Social Science | 6 (100.0%) | 0 (0.0%) |
| Community & Social Service | 3 (25.0%) | 9 (75.0%) |
| Education, Arts & Media | 3 (100.0%) | 0 (0.0%) |
| Legal Services & Support | 0 (0.0%) | 0 (0.0%) |
| Education Instruction & Library | 0 (0.0%) | 2 (100.0%) |
| Arts, Media & Entertainment | 0 (0.0%) | 7 (100.0%) |
| Health Diagnosing & Treating | 9 (27.3%) | 24 (72.7%) |
| Health Technologists | 0 (0.0%) | 1 (100.0%) |
| Total (Category) | 18 (31.0%) | 40 (69.0%) |
| Total (Overall) | 66 (48.5%) | 70 (51.5%) |
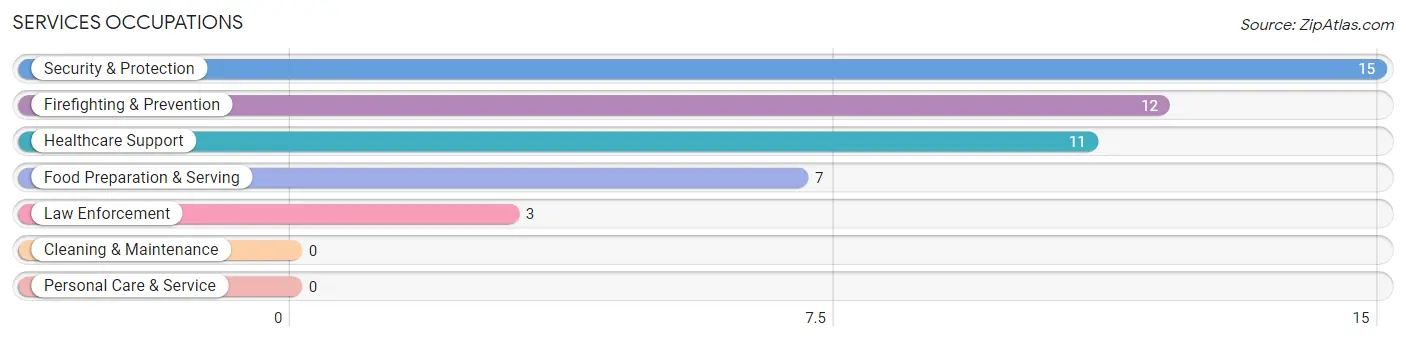
Services Occupations
The most common Services occupations in Little Creek are Security & Protection (15 | 11.0%), Firefighting & Prevention (12 | 8.8%), Healthcare Support (11 | 8.1%), Food Preparation & Serving (7 | 5.1%), and Law Enforcement (3 | 2.2%).
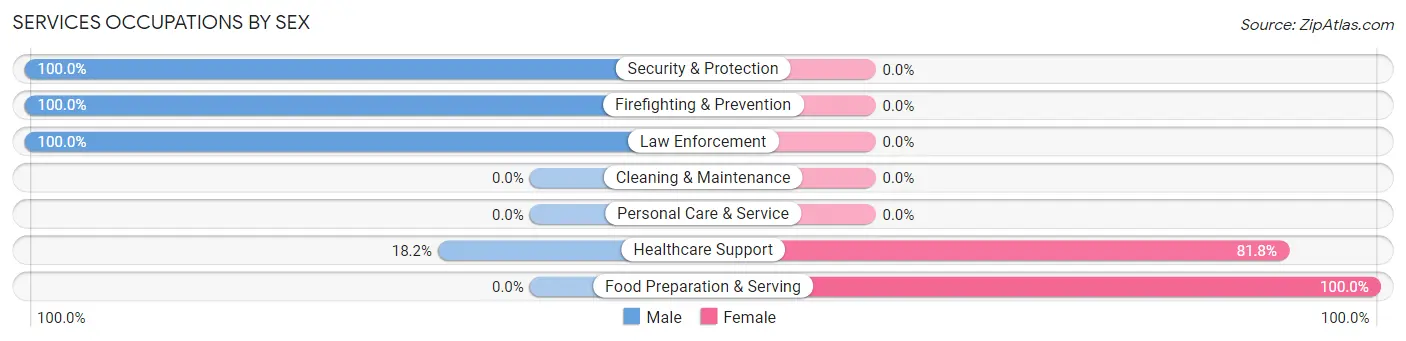
Services Occupations by Sex
Within the Services occupations in Little Creek, the most male-oriented occupations are Security & Protection (100.0%), Firefighting & Prevention (100.0%), and Law Enforcement (100.0%), while the most female-oriented occupations are Food Preparation & Serving (100.0%), and Healthcare Support (81.8%).
| Occupation | Male | Female |
| Healthcare Support | 2 (18.2%) | 9 (81.8%) |
| Security & Protection | 15 (100.0%) | 0 (0.0%) |
| Firefighting & Prevention | 12 (100.0%) | 0 (0.0%) |
| Law Enforcement | 3 (100.0%) | 0 (0.0%) |
| Food Preparation & Serving | 0 (0.0%) | 7 (100.0%) |
| Cleaning & Maintenance | 0 (0.0%) | 0 (0.0%) |
| Personal Care & Service | 0 (0.0%) | 0 (0.0%) |
| Total (Category) | 17 (51.5%) | 16 (48.5%) |
| Total (Overall) | 66 (48.5%) | 70 (51.5%) |
Sales and Office Occupations
The most common Sales and Office occupations in Little Creek are Sales & Related (18 | 13.2%), and Office & Administration (9 | 6.6%).
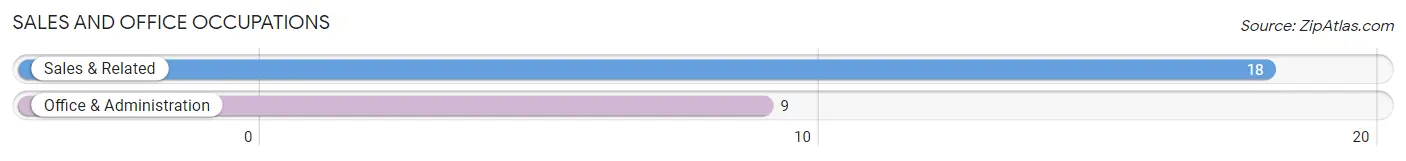
Sales and Office Occupations by Sex
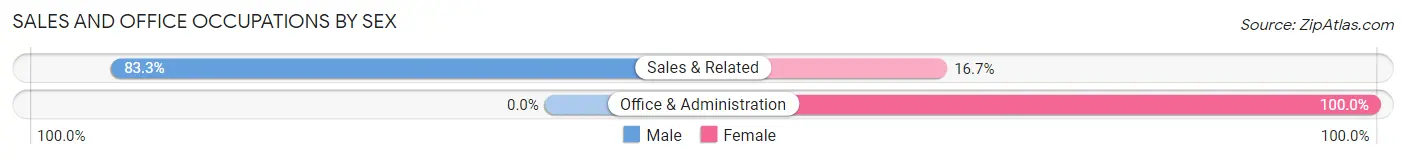
| Occupation | Male | Female |
| Sales & Related | 15 (83.3%) | 3 (16.7%) |
| Office & Administration | 0 (0.0%) | 9 (100.0%) |
| Total (Category) | 15 (55.6%) | 12 (44.4%) |
| Total (Overall) | 66 (48.5%) | 70 (51.5%) |
Natural Resources, Construction and Maintenance Occupations
The most common Natural Resources, Construction and Maintenance occupations in Little Creek are , and Construction & Extraction (2 | 1.5%).
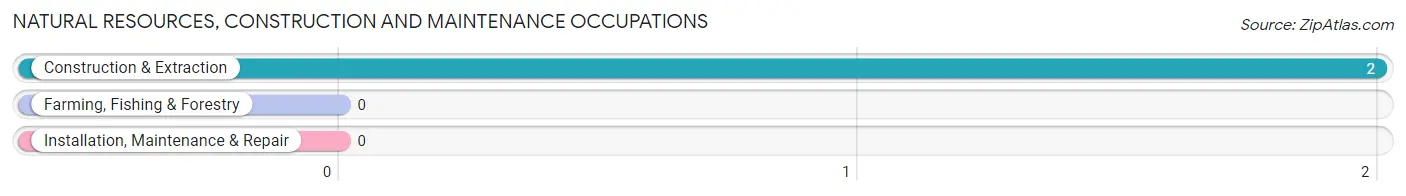
Natural Resources, Construction and Maintenance Occupations by Sex
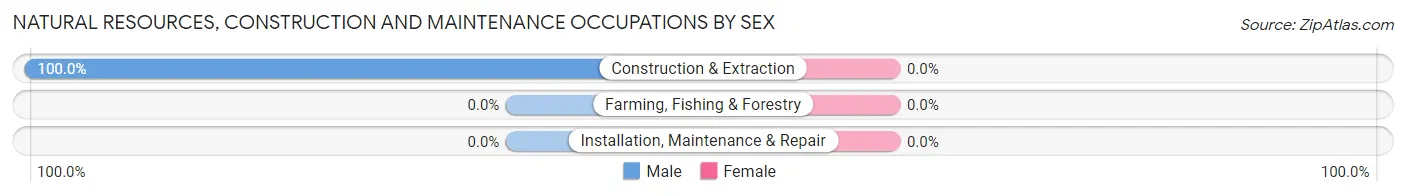
| Occupation | Male | Female |
| Farming, Fishing & Forestry | 0 (0.0%) | 0 (0.0%) |
| Construction & Extraction | 2 (100.0%) | 0 (0.0%) |
| Installation, Maintenance & Repair | 0 (0.0%) | 0 (0.0%) |
| Total (Category) | 2 (100.0%) | 0 (0.0%) |
| Total (Overall) | 66 (48.5%) | 70 (51.5%) |
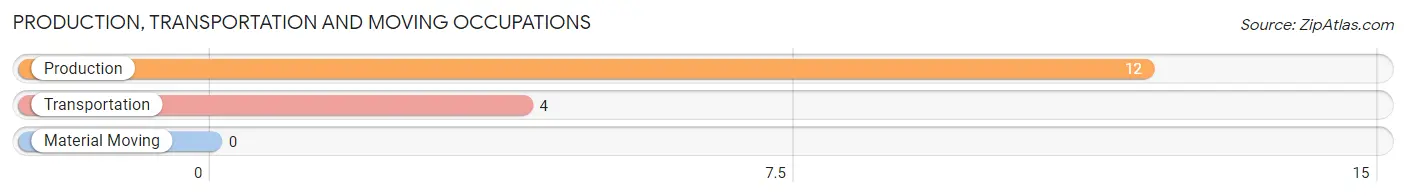
Production, Transportation and Moving Occupations
The most common Production, Transportation and Moving occupations in Little Creek are Production (12 | 8.8%), and Transportation (4 | 2.9%).
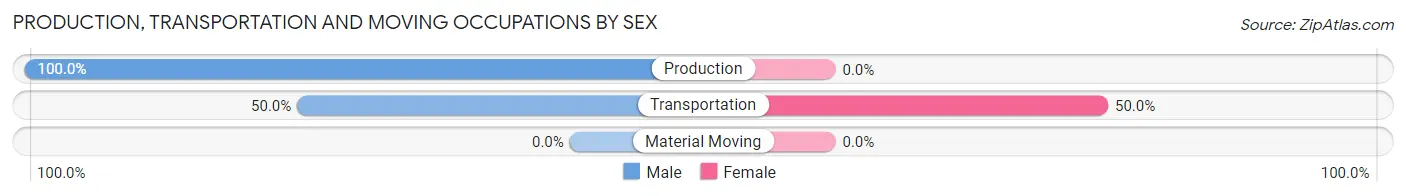
Production, Transportation and Moving Occupations by Sex
| Occupation | Male | Female |
| Production | 12 (100.0%) | 0 (0.0%) |
| Transportation | 2 (50.0%) | 2 (50.0%) |
| Material Moving | 0 (0.0%) | 0 (0.0%) |
| Total (Category) | 14 (87.5%) | 2 (12.5%) |
| Total (Overall) | 66 (48.5%) | 70 (51.5%) |
Employment Industries by Sex in Little Creek
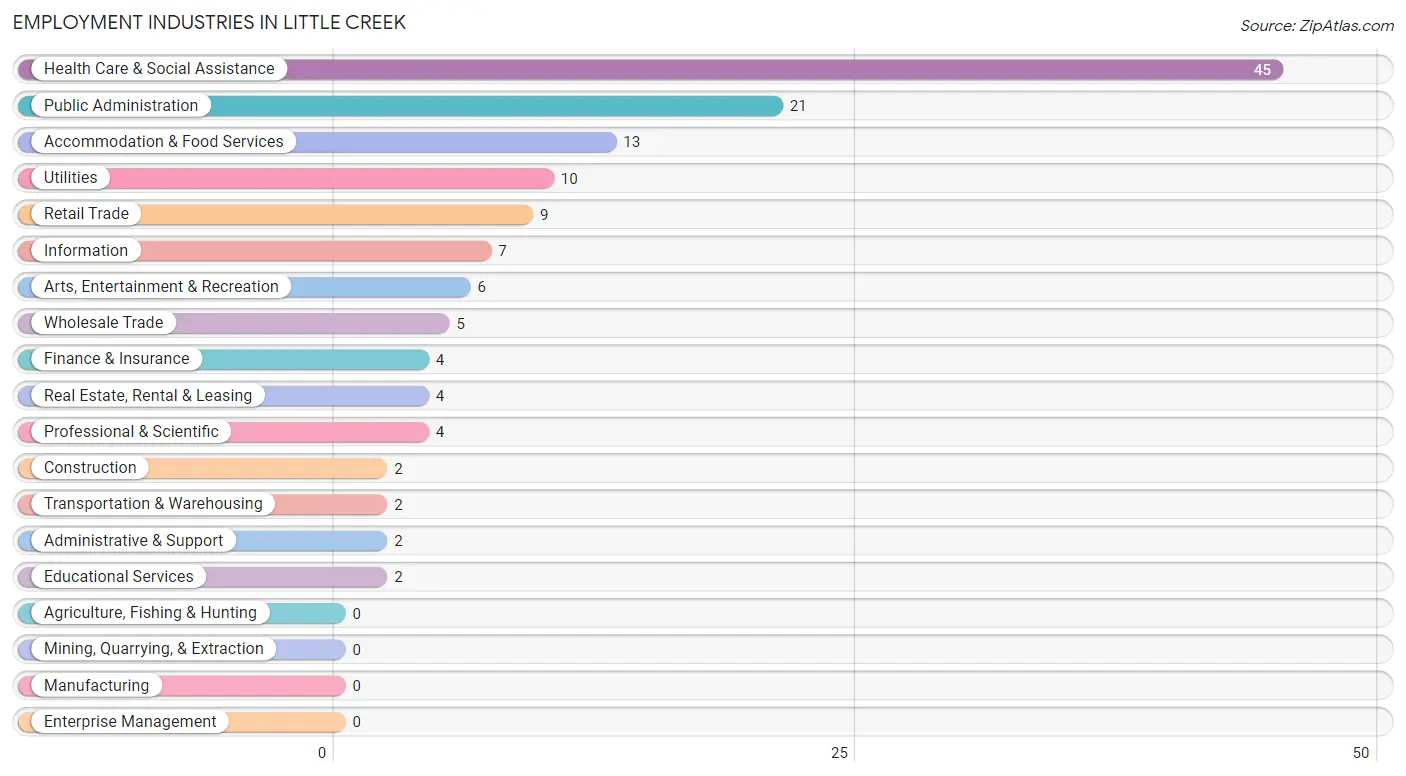
Employment Industries in Little Creek
The major employment industries in Little Creek include Health Care & Social Assistance (45 | 33.1%), Public Administration (21 | 15.4%), Accommodation & Food Services (13 | 9.6%), Utilities (10 | 7.3%), and Retail Trade (9 | 6.6%).
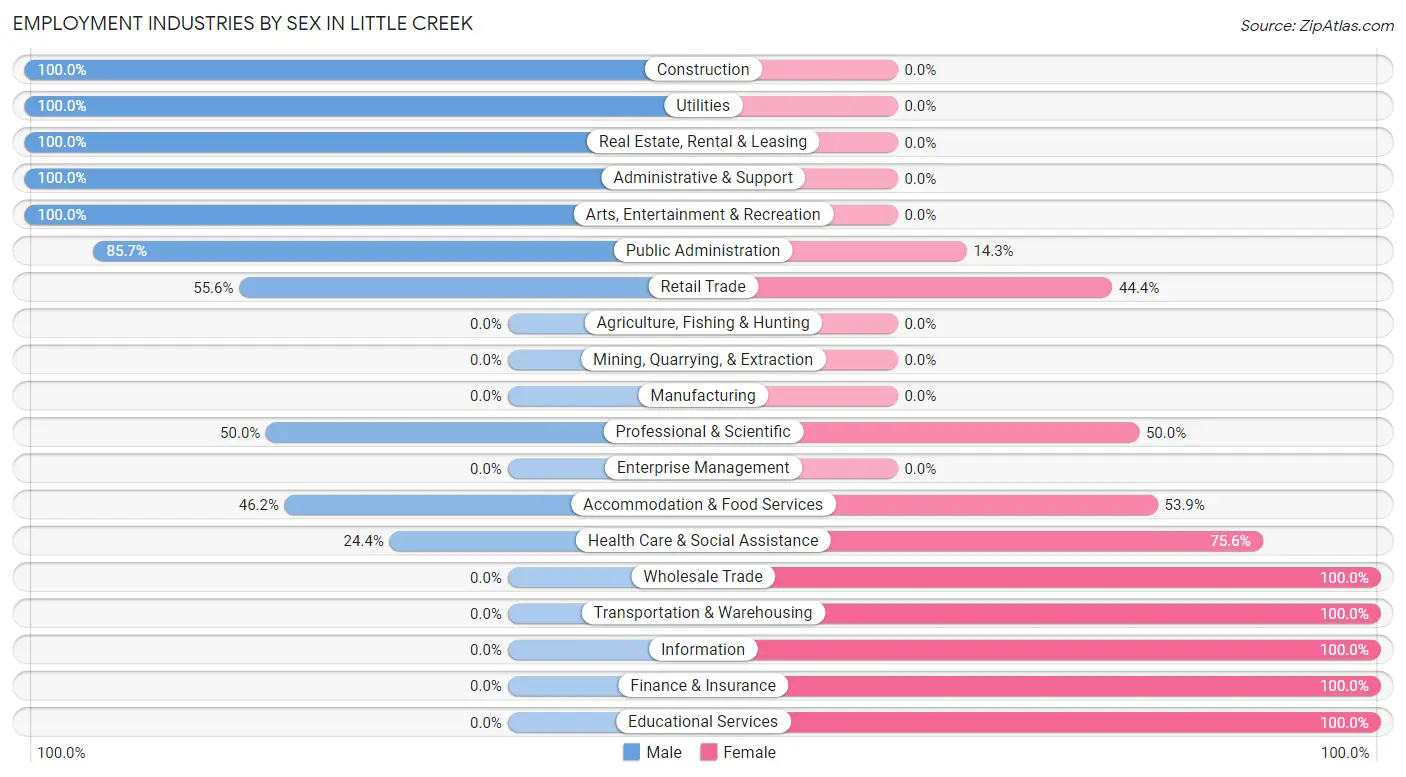
Employment Industries by Sex in Little Creek
The Little Creek industries that see more men than women are Construction (100.0%), Utilities (100.0%), and Real Estate, Rental & Leasing (100.0%), whereas the industries that tend to have a higher number of women are Wholesale Trade (100.0%), Transportation & Warehousing (100.0%), and Information (100.0%).
| Industry | Male | Female |
| Agriculture, Fishing & Hunting | 0 (0.0%) | 0 (0.0%) |
| Mining, Quarrying, & Extraction | 0 (0.0%) | 0 (0.0%) |
| Construction | 2 (100.0%) | 0 (0.0%) |
| Manufacturing | 0 (0.0%) | 0 (0.0%) |
| Wholesale Trade | 0 (0.0%) | 5 (100.0%) |
| Retail Trade | 5 (55.6%) | 4 (44.4%) |
| Transportation & Warehousing | 0 (0.0%) | 2 (100.0%) |
| Utilities | 10 (100.0%) | 0 (0.0%) |
| Information | 0 (0.0%) | 7 (100.0%) |
| Finance & Insurance | 0 (0.0%) | 4 (100.0%) |
| Real Estate, Rental & Leasing | 4 (100.0%) | 0 (0.0%) |
| Professional & Scientific | 2 (50.0%) | 2 (50.0%) |
| Enterprise Management | 0 (0.0%) | 0 (0.0%) |
| Administrative & Support | 2 (100.0%) | 0 (0.0%) |
| Educational Services | 0 (0.0%) | 2 (100.0%) |
| Health Care & Social Assistance | 11 (24.4%) | 34 (75.6%) |
| Arts, Entertainment & Recreation | 6 (100.0%) | 0 (0.0%) |
| Accommodation & Food Services | 6 (46.2%) | 7 (53.8%) |
| Public Administration | 18 (85.7%) | 3 (14.3%) |
| Total | 66 (48.5%) | 70 (51.5%) |
Education in Little Creek
School Enrollment in Little Creek
The most common levels of schooling among the 66 students in Little Creek are high school (21 | 31.8%), middle school (16 | 24.2%), and college / undergraduate (12 | 18.2%).
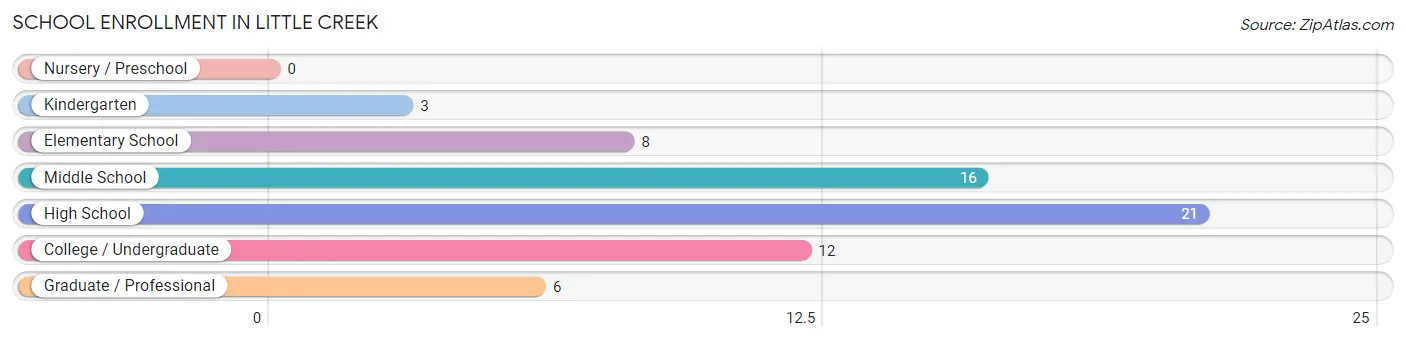
| School Level | # Students | % Students |
| Nursery / Preschool | 0 | 0.0% |
| Kindergarten | 3 | 4.5% |
| Elementary School | 8 | 12.1% |
| Middle School | 16 | 24.2% |
| High School | 21 | 31.8% |
| College / Undergraduate | 12 | 18.2% |
| Graduate / Professional | 6 | 9.1% |
| Total | 66 | 100.0% |
School Enrollment by Age by Funding Source in Little Creek
Out of a total of 66 students who are enrolled in schools in Little Creek, 3 (4.5%) attend a private institution, while the remaining 63 (95.5%) are enrolled in public schools. The age group of 10 to 14 year olds has the highest likelihood of being enrolled in private schools, with 3 (15.0% in the age bracket) enrolled. Conversely, the age group of 5 to 9 year old has the lowest likelihood of being enrolled in a private school, with 11 (100.0% in the age bracket) attending a public institution.
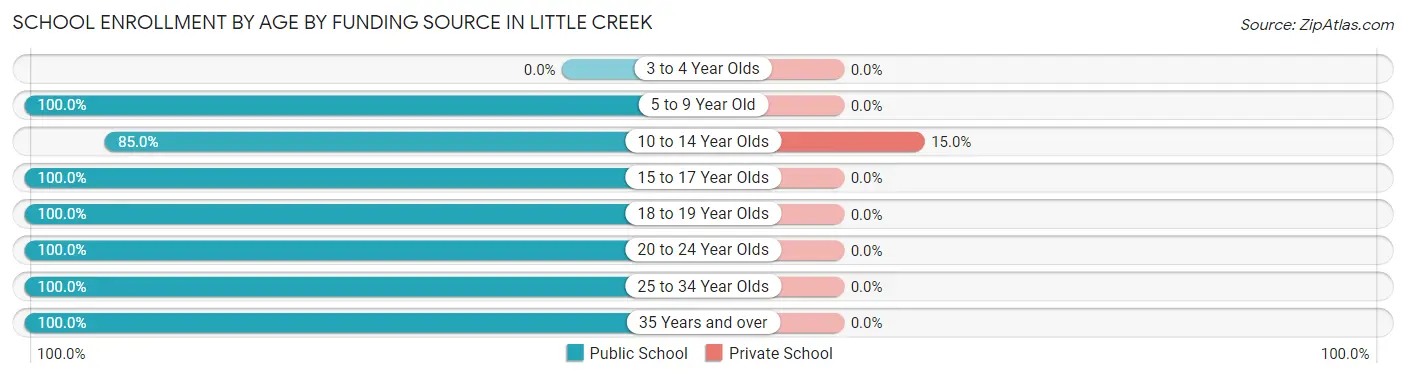
| Age Bracket | Public School | Private School |
| 3 to 4 Year Olds | 0 (0.0%) | 0 (0.0%) |
| 5 to 9 Year Old | 11 (100.0%) | 0 (0.0%) |
| 10 to 14 Year Olds | 17 (85.0%) | 3 (15.0%) |
| 15 to 17 Year Olds | 15 (100.0%) | 0 (0.0%) |
| 18 to 19 Year Olds | 2 (100.0%) | 0 (0.0%) |
| 20 to 24 Year Olds | 5 (100.0%) | 0 (0.0%) |
| 25 to 34 Year Olds | 11 (100.0%) | 0 (0.0%) |
| 35 Years and over | 2 (100.0%) | 0 (0.0%) |
| Total | 63 (95.5%) | 3 (4.5%) |
Educational Attainment by Field of Study in Little Creek
Science & technology (8 | 36.4%), multidisciplinary studies (6 | 27.3%), visual & performing arts (6 | 27.3%), computers & mathematics (1 | 4.5%), and business (1 | 4.5%) are the most common fields of study among 22 individuals in Little Creek who have obtained a bachelor's degree or higher.
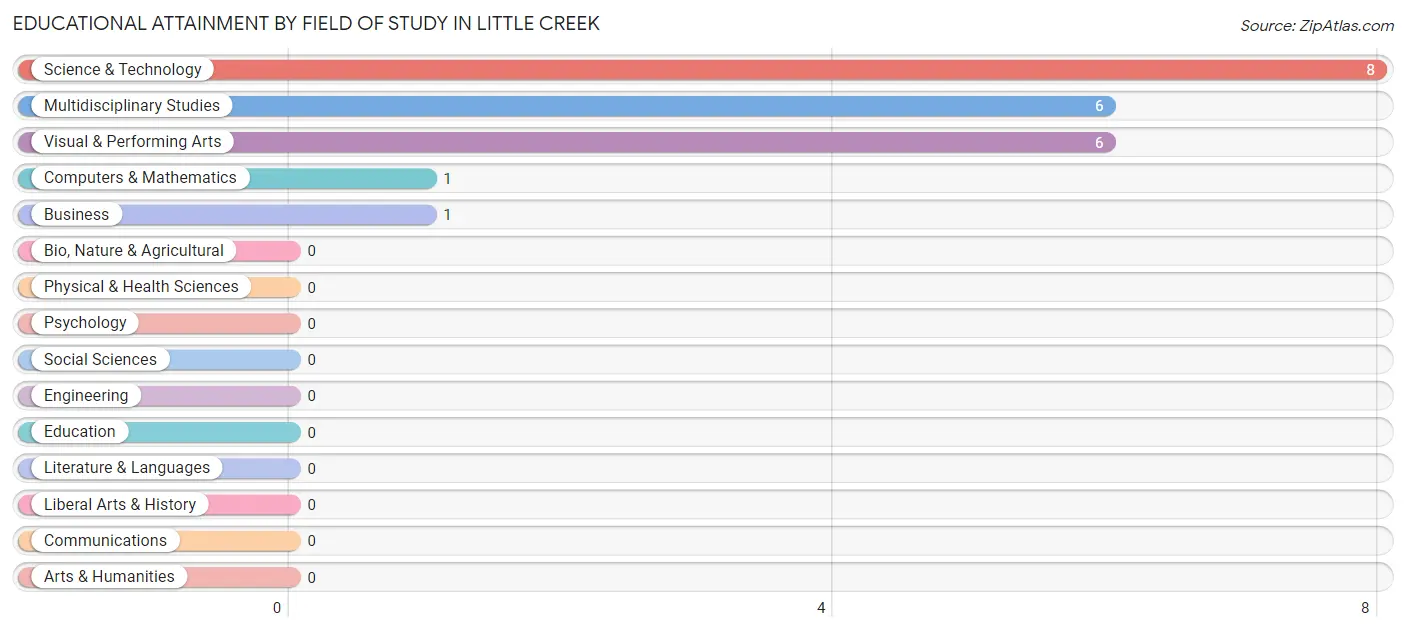
| Field of Study | # Graduates | % Graduates |
| Computers & Mathematics | 1 | 4.5% |
| Bio, Nature & Agricultural | 0 | 0.0% |
| Physical & Health Sciences | 0 | 0.0% |
| Psychology | 0 | 0.0% |
| Social Sciences | 0 | 0.0% |
| Engineering | 0 | 0.0% |
| Multidisciplinary Studies | 6 | 27.3% |
| Science & Technology | 8 | 36.4% |
| Business | 1 | 4.5% |
| Education | 0 | 0.0% |
| Literature & Languages | 0 | 0.0% |
| Liberal Arts & History | 0 | 0.0% |
| Visual & Performing Arts | 6 | 27.3% |
| Communications | 0 | 0.0% |
| Arts & Humanities | 0 | 0.0% |
| Total | 22 | 100.0% |
Transportation & Commute in Little Creek
Vehicle Availability by Sex in Little Creek
The most prevalent vehicle ownership categories in Little Creek are males with 3 vehicles (27, accounting for 40.9%) and females with 3 vehicles (18, making up 38.6%).
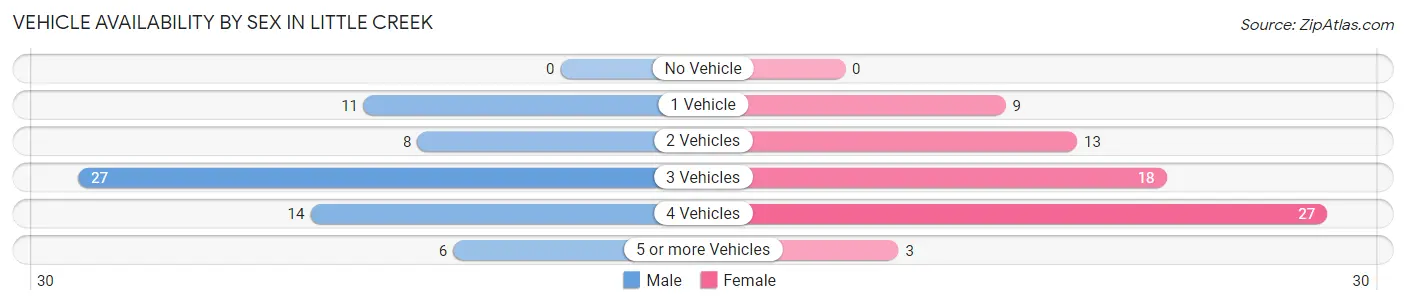
| Vehicles Available | Male | Female |
| No Vehicle | 0 (0.0%) | 0 (0.0%) |
| 1 Vehicle | 11 (16.7%) | 9 (12.9%) |
| 2 Vehicles | 8 (12.1%) | 13 (18.6%) |
| 3 Vehicles | 27 (40.9%) | 18 (25.7%) |
| 4 Vehicles | 14 (21.2%) | 27 (38.6%) |
| 5 or more Vehicles | 6 (9.1%) | 3 (4.3%) |
| Total | 66 (100.0%) | 70 (100.0%) |
Commute Time in Little Creek
The most frequently occuring commute durations in Little Creek are 25 to 29 minutes (36 commuters, 28.8%), 20 to 24 minutes (35 commuters, 28.0%), and 60 to 89 minutes (14 commuters, 11.2%).
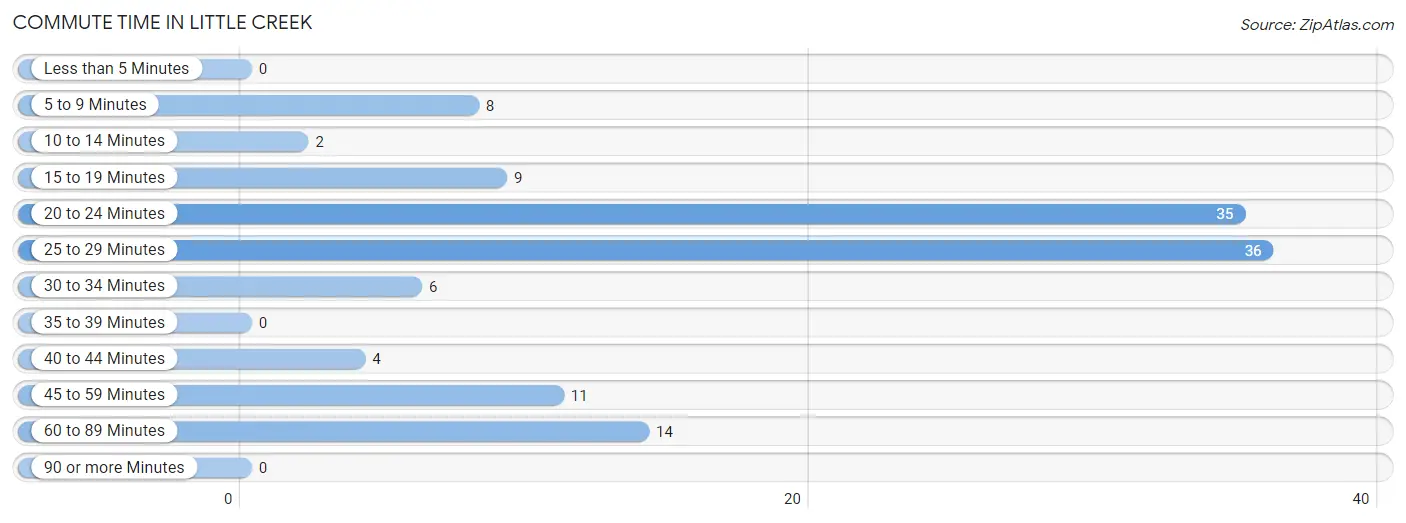
| Commute Time | # Commuters | % Commuters |
| Less than 5 Minutes | 0 | 0.0% |
| 5 to 9 Minutes | 8 | 6.4% |
| 10 to 14 Minutes | 2 | 1.6% |
| 15 to 19 Minutes | 9 | 7.2% |
| 20 to 24 Minutes | 35 | 28.0% |
| 25 to 29 Minutes | 36 | 28.8% |
| 30 to 34 Minutes | 6 | 4.8% |
| 35 to 39 Minutes | 0 | 0.0% |
| 40 to 44 Minutes | 4 | 3.2% |
| 45 to 59 Minutes | 11 | 8.8% |
| 60 to 89 Minutes | 14 | 11.2% |
| 90 or more Minutes | 0 | 0.0% |
Commute Time by Sex in Little Creek
The most common commute times in Little Creek are 25 to 29 minutes (17 commuters, 30.4%) for males and 20 to 24 minutes (20 commuters, 29.0%) for females.
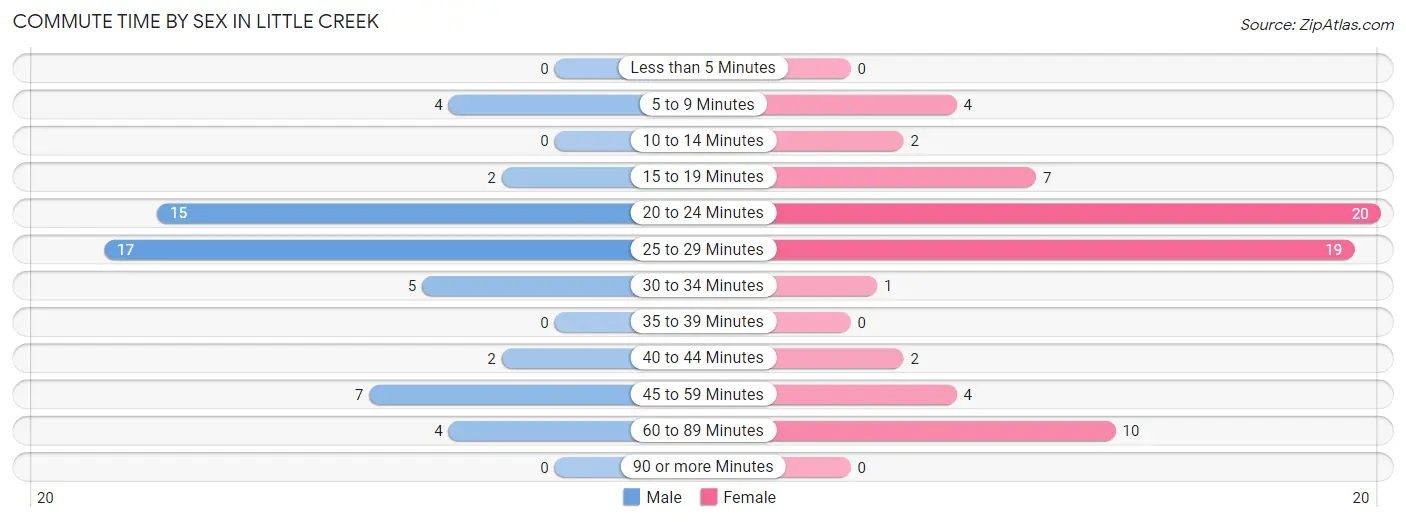
| Commute Time | Male | Female |
| Less than 5 Minutes | 0 (0.0%) | 0 (0.0%) |
| 5 to 9 Minutes | 4 (7.1%) | 4 (5.8%) |
| 10 to 14 Minutes | 0 (0.0%) | 2 (2.9%) |
| 15 to 19 Minutes | 2 (3.6%) | 7 (10.1%) |
| 20 to 24 Minutes | 15 (26.8%) | 20 (29.0%) |
| 25 to 29 Minutes | 17 (30.4%) | 19 (27.5%) |
| 30 to 34 Minutes | 5 (8.9%) | 1 (1.5%) |
| 35 to 39 Minutes | 0 (0.0%) | 0 (0.0%) |
| 40 to 44 Minutes | 2 (3.6%) | 2 (2.9%) |
| 45 to 59 Minutes | 7 (12.5%) | 4 (5.8%) |
| 60 to 89 Minutes | 4 (7.1%) | 10 (14.5%) |
| 90 or more Minutes | 0 (0.0%) | 0 (0.0%) |
Time of Departure to Work by Sex in Little Creek
The most frequent times of departure to work in Little Creek are 4:00 PM to 11:59 PM (20, 35.7%) for males and 4:00 PM to 11:59 PM (20, 29.0%) for females.
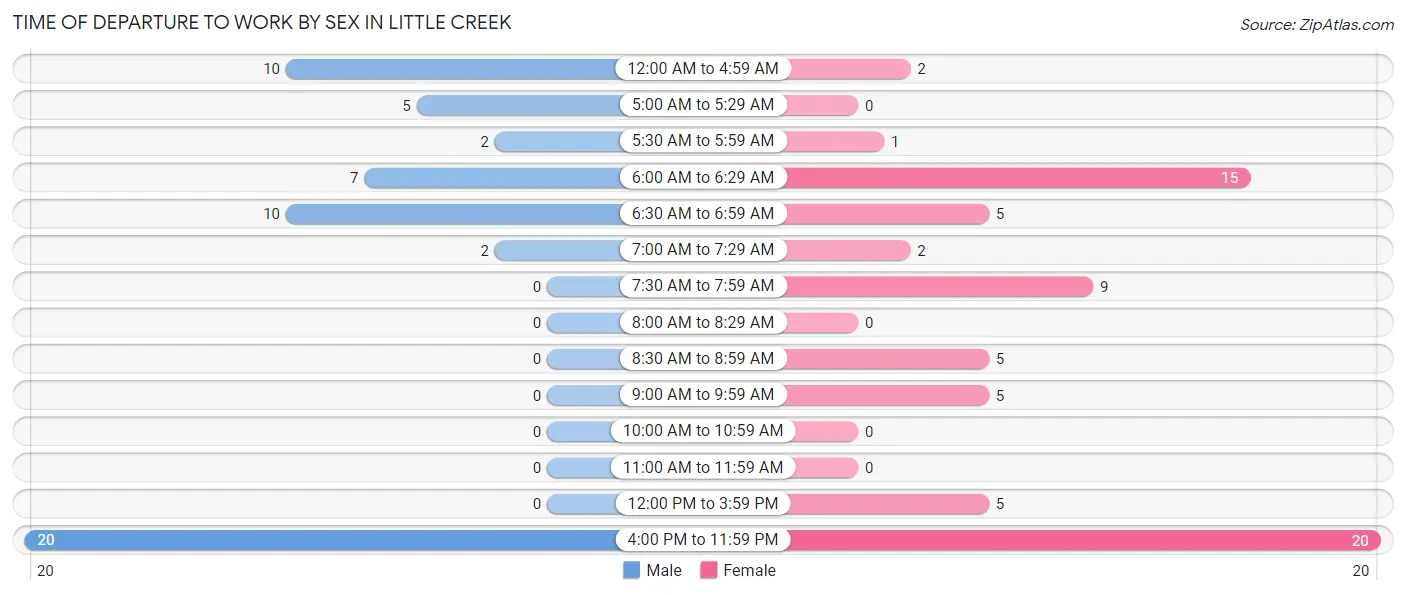
| Time of Departure | Male | Female |
| 12:00 AM to 4:59 AM | 10 (17.9%) | 2 (2.9%) |
| 5:00 AM to 5:29 AM | 5 (8.9%) | 0 (0.0%) |
| 5:30 AM to 5:59 AM | 2 (3.6%) | 1 (1.5%) |
| 6:00 AM to 6:29 AM | 7 (12.5%) | 15 (21.7%) |
| 6:30 AM to 6:59 AM | 10 (17.9%) | 5 (7.2%) |
| 7:00 AM to 7:29 AM | 2 (3.6%) | 2 (2.9%) |
| 7:30 AM to 7:59 AM | 0 (0.0%) | 9 (13.0%) |
| 8:00 AM to 8:29 AM | 0 (0.0%) | 0 (0.0%) |
| 8:30 AM to 8:59 AM | 0 (0.0%) | 5 (7.2%) |
| 9:00 AM to 9:59 AM | 0 (0.0%) | 5 (7.2%) |
| 10:00 AM to 10:59 AM | 0 (0.0%) | 0 (0.0%) |
| 11:00 AM to 11:59 AM | 0 (0.0%) | 0 (0.0%) |
| 12:00 PM to 3:59 PM | 0 (0.0%) | 5 (7.2%) |
| 4:00 PM to 11:59 PM | 20 (35.7%) | 20 (29.0%) |
| Total | 56 (100.0%) | 69 (100.0%) |
Housing Occupancy in Little Creek
Occupancy by Ownership in Little Creek
Of the total 93 dwellings in Little Creek, owner-occupied units account for 67 (72.0%), while renter-occupied units make up 26 (28.0%).
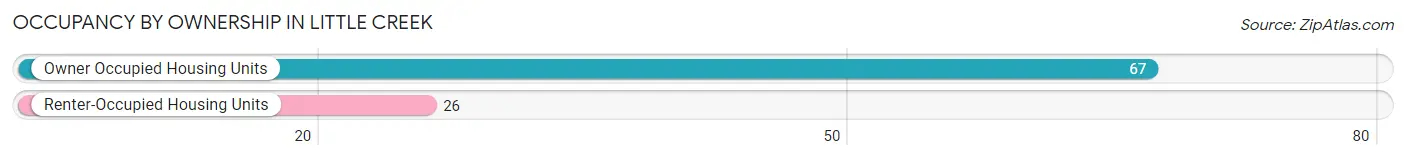
| Occupancy | # Housing Units | % Housing Units |
| Owner Occupied Housing Units | 67 | 72.0% |
| Renter-Occupied Housing Units | 26 | 28.0% |
| Total Occupied Housing Units | 93 | 100.0% |
Occupancy by Household Size in Little Creek
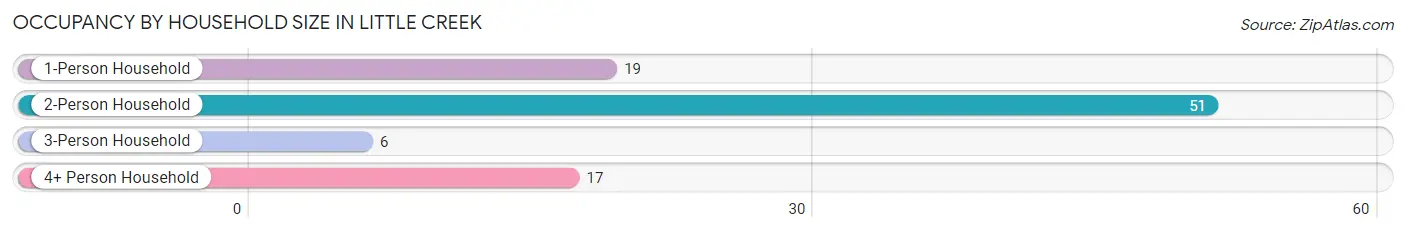
| Household Size | # Housing Units | % Housing Units |
| 1-Person Household | 19 | 20.4% |
| 2-Person Household | 51 | 54.8% |
| 3-Person Household | 6 | 6.5% |
| 4+ Person Household | 17 | 18.3% |
| Total Housing Units | 93 | 100.0% |
Occupancy by Ownership by Household Size in Little Creek
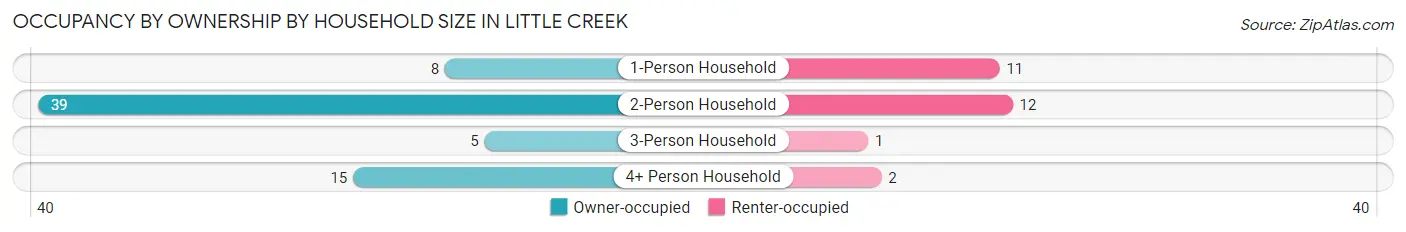
| Household Size | Owner-occupied | Renter-occupied |
| 1-Person Household | 8 (42.1%) | 11 (57.9%) |
| 2-Person Household | 39 (76.5%) | 12 (23.5%) |
| 3-Person Household | 5 (83.3%) | 1 (16.7%) |
| 4+ Person Household | 15 (88.2%) | 2 (11.8%) |
| Total Housing Units | 67 (72.0%) | 26 (28.0%) |
Occupancy by Educational Attainment in Little Creek
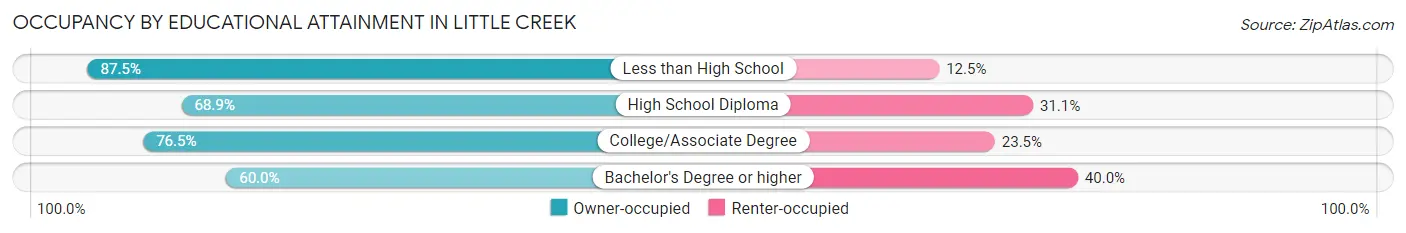
| Household Size | Owner-occupied | Renter-occupied |
| Less than High School | 14 (87.5%) | 2 (12.5%) |
| High School Diploma | 31 (68.9%) | 14 (31.1%) |
| College/Associate Degree | 13 (76.5%) | 4 (23.5%) |
| Bachelor's Degree or higher | 9 (60.0%) | 6 (40.0%) |
Occupancy by Age of Householder in Little Creek
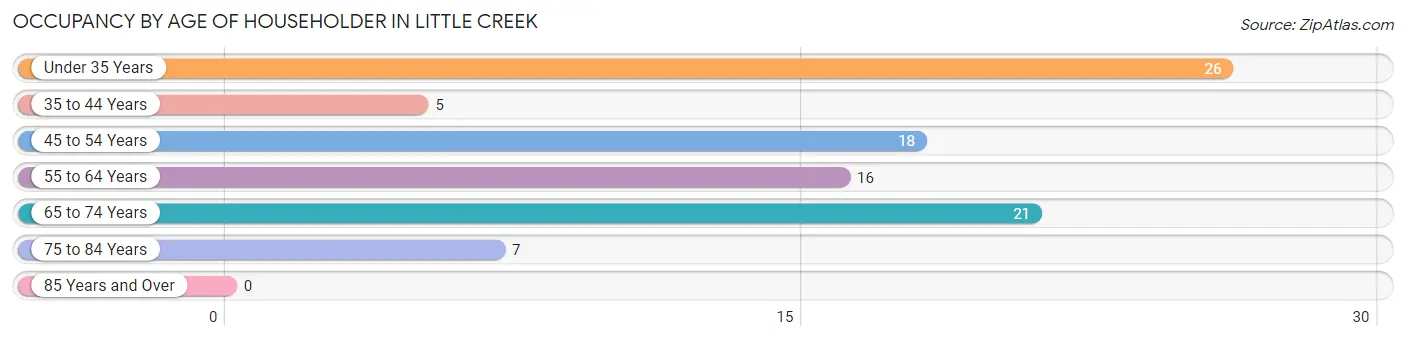
| Age Bracket | # Households | % Households |
| Under 35 Years | 26 | 28.0% |
| 35 to 44 Years | 5 | 5.4% |
| 45 to 54 Years | 18 | 19.4% |
| 55 to 64 Years | 16 | 17.2% |
| 65 to 74 Years | 21 | 22.6% |
| 75 to 84 Years | 7 | 7.5% |
| 85 Years and Over | 0 | 0.0% |
| Total | 93 | 100.0% |
Housing Finances in Little Creek
Median Income by Occupancy in Little Creek
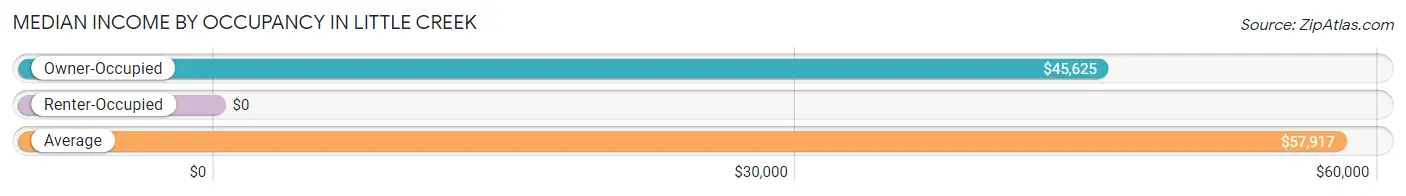
| Occupancy Type | # Households | Median Income |
| Owner-Occupied | 67 (72.0%) | $45,625 |
| Renter-Occupied | 26 (28.0%) | $0 |
| Average | 93 (100.0%) | $57,917 |
Occupancy by Householder Income Bracket in Little Creek
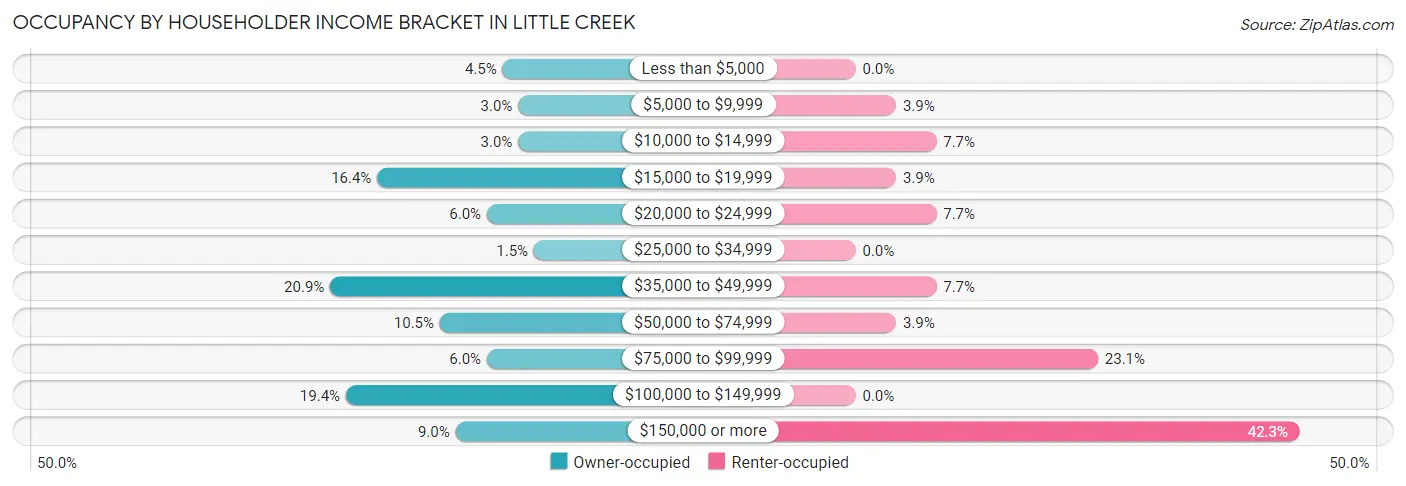
| Income Bracket | Owner-occupied | Renter-occupied |
| Less than $5,000 | 3 (4.5%) | 0 (0.0%) |
| $5,000 to $9,999 | 2 (3.0%) | 1 (3.8%) |
| $10,000 to $14,999 | 2 (3.0%) | 2 (7.7%) |
| $15,000 to $19,999 | 11 (16.4%) | 1 (3.8%) |
| $20,000 to $24,999 | 4 (6.0%) | 2 (7.7%) |
| $25,000 to $34,999 | 1 (1.5%) | 0 (0.0%) |
| $35,000 to $49,999 | 14 (20.9%) | 2 (7.7%) |
| $50,000 to $74,999 | 7 (10.4%) | 1 (3.8%) |
| $75,000 to $99,999 | 4 (6.0%) | 6 (23.1%) |
| $100,000 to $149,999 | 13 (19.4%) | 0 (0.0%) |
| $150,000 or more | 6 (9.0%) | 11 (42.3%) |
| Total | 67 (100.0%) | 26 (100.0%) |
Monthly Housing Cost Tiers in Little Creek
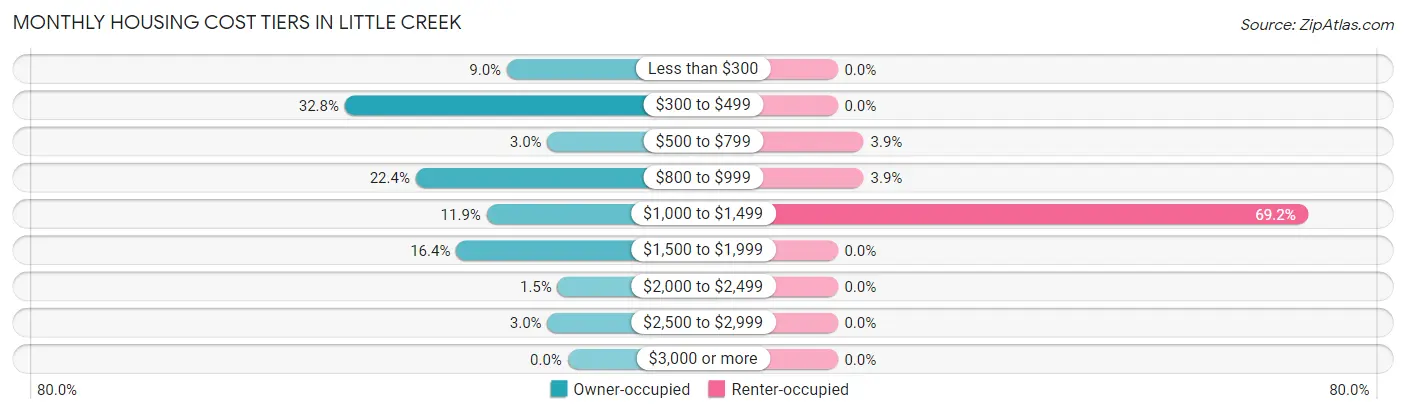
| Monthly Cost | Owner-occupied | Renter-occupied |
| Less than $300 | 6 (9.0%) | 0 (0.0%) |
| $300 to $499 | 22 (32.8%) | 0 (0.0%) |
| $500 to $799 | 2 (3.0%) | 1 (3.8%) |
| $800 to $999 | 15 (22.4%) | 1 (3.8%) |
| $1,000 to $1,499 | 8 (11.9%) | 18 (69.2%) |
| $1,500 to $1,999 | 11 (16.4%) | 0 (0.0%) |
| $2,000 to $2,499 | 1 (1.5%) | 0 (0.0%) |
| $2,500 to $2,999 | 2 (3.0%) | 0 (0.0%) |
| $3,000 or more | 0 (0.0%) | 0 (0.0%) |
| Total | 67 (100.0%) | 26 (100.0%) |
Physical Housing Characteristics in Little Creek
Housing Structures in Little Creek
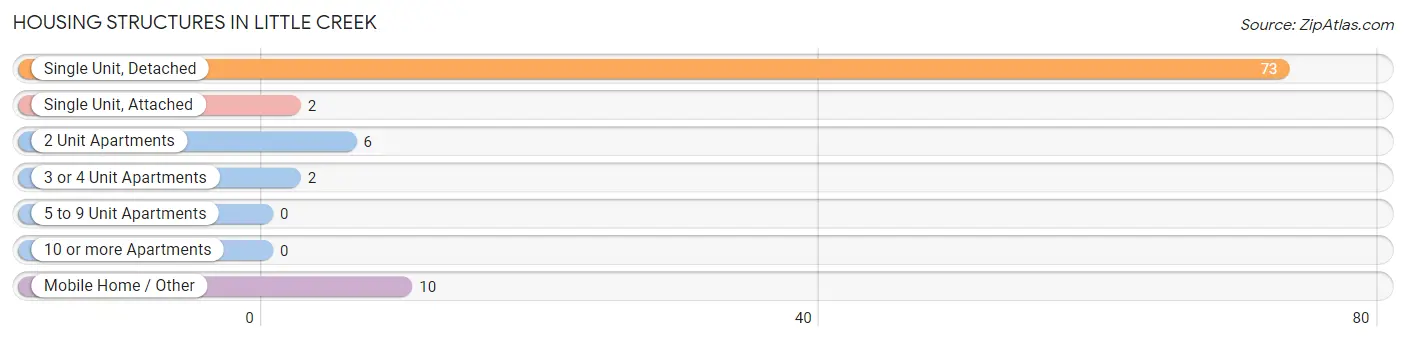
| Structure Type | # Housing Units | % Housing Units |
| Single Unit, Detached | 73 | 78.5% |
| Single Unit, Attached | 2 | 2.1% |
| 2 Unit Apartments | 6 | 6.5% |
| 3 or 4 Unit Apartments | 2 | 2.1% |
| 5 to 9 Unit Apartments | 0 | 0.0% |
| 10 or more Apartments | 0 | 0.0% |
| Mobile Home / Other | 10 | 10.7% |
| Total | 93 | 100.0% |
Housing Structures by Occupancy in Little Creek
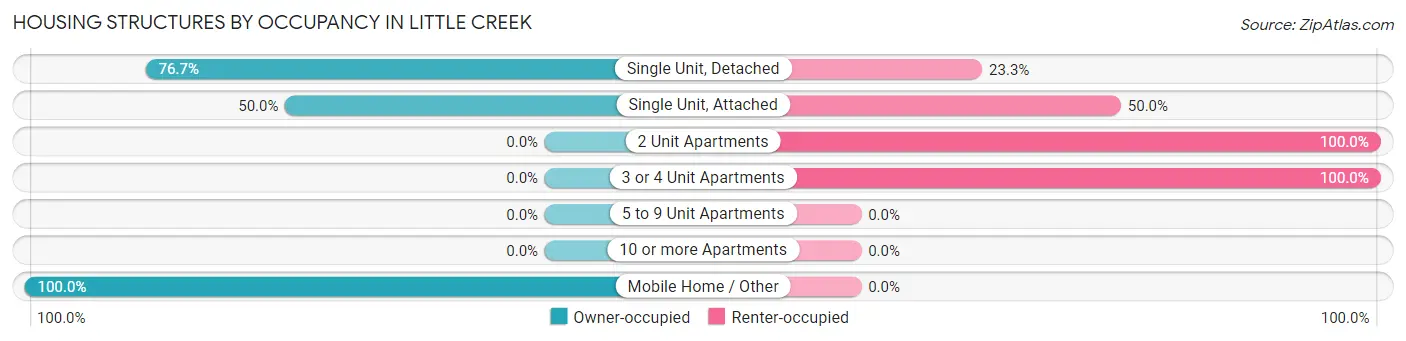
| Structure Type | Owner-occupied | Renter-occupied |
| Single Unit, Detached | 56 (76.7%) | 17 (23.3%) |
| Single Unit, Attached | 1 (50.0%) | 1 (50.0%) |
| 2 Unit Apartments | 0 (0.0%) | 6 (100.0%) |
| 3 or 4 Unit Apartments | 0 (0.0%) | 2 (100.0%) |
| 5 to 9 Unit Apartments | 0 (0.0%) | 0 (0.0%) |
| 10 or more Apartments | 0 (0.0%) | 0 (0.0%) |
| Mobile Home / Other | 10 (100.0%) | 0 (0.0%) |
| Total | 67 (72.0%) | 26 (28.0%) |
Housing Structures by Number of Rooms in Little Creek
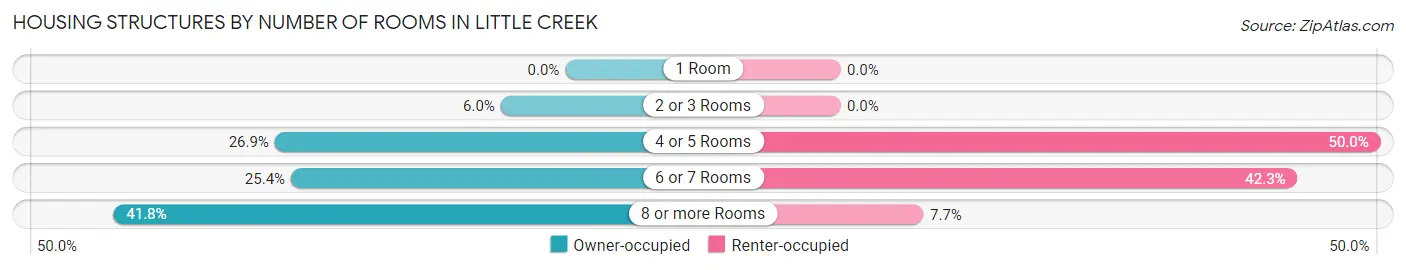
| Number of Rooms | Owner-occupied | Renter-occupied |
| 1 Room | 0 (0.0%) | 0 (0.0%) |
| 2 or 3 Rooms | 4 (6.0%) | 0 (0.0%) |
| 4 or 5 Rooms | 18 (26.9%) | 13 (50.0%) |
| 6 or 7 Rooms | 17 (25.4%) | 11 (42.3%) |
| 8 or more Rooms | 28 (41.8%) | 2 (7.7%) |
| Total | 67 (100.0%) | 26 (100.0%) |
Housing Structure by Heating Type in Little Creek
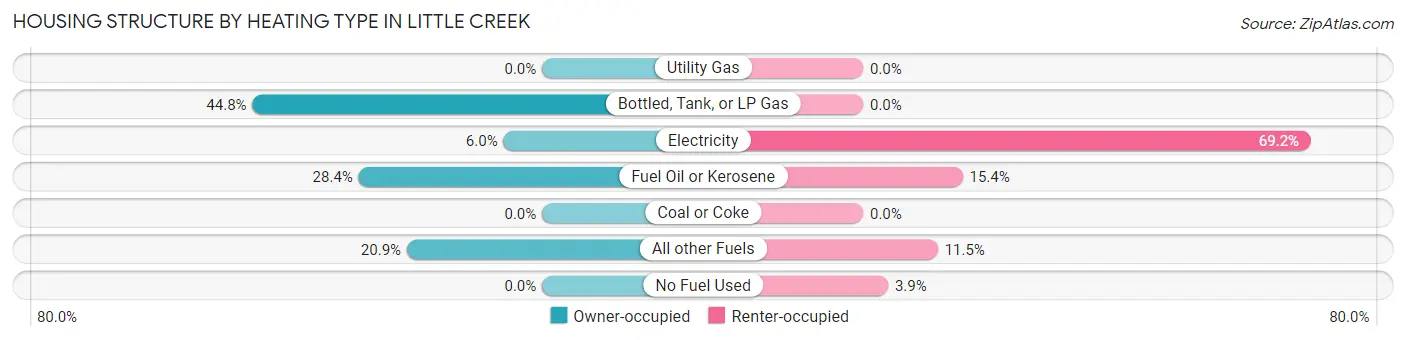
| Heating Type | Owner-occupied | Renter-occupied |
| Utility Gas | 0 (0.0%) | 0 (0.0%) |
| Bottled, Tank, or LP Gas | 30 (44.8%) | 0 (0.0%) |
| Electricity | 4 (6.0%) | 18 (69.2%) |
| Fuel Oil or Kerosene | 19 (28.4%) | 4 (15.4%) |
| Coal or Coke | 0 (0.0%) | 0 (0.0%) |
| All other Fuels | 14 (20.9%) | 3 (11.5%) |
| No Fuel Used | 0 (0.0%) | 1 (3.8%) |
| Total | 67 (100.0%) | 26 (100.0%) |
Household Vehicle Usage in Little Creek
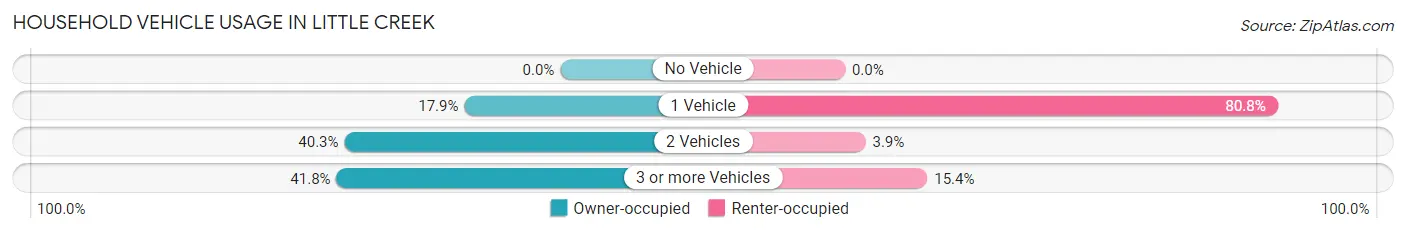
| Vehicles per Household | Owner-occupied | Renter-occupied |
| No Vehicle | 0 (0.0%) | 0 (0.0%) |
| 1 Vehicle | 12 (17.9%) | 21 (80.8%) |
| 2 Vehicles | 27 (40.3%) | 1 (3.8%) |
| 3 or more Vehicles | 28 (41.8%) | 4 (15.4%) |
| Total | 67 (100.0%) | 26 (100.0%) |
Real Estate & Mortgages in Little Creek
Real Estate and Mortgage Overview in Little Creek
| Characteristic | Without Mortgage | With Mortgage |
| Housing Units | 39 | 28 |
| Median Property Value | $137,500 | $183,300 |
| Median Household Income | $43,750 | $6 |
| Monthly Housing Costs | $381 | $0 |
| Real Estate Taxes | $833 | $0 |
Property Value by Mortgage Status in Little Creek
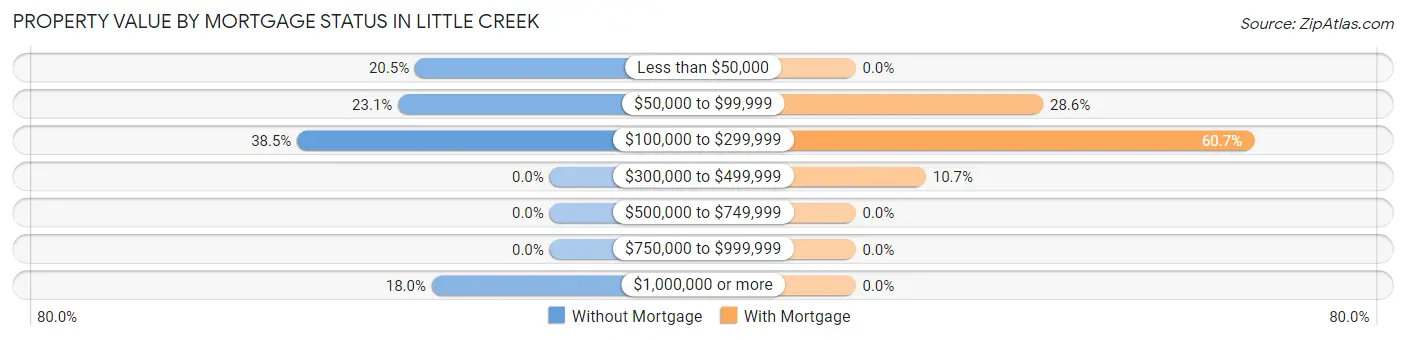
| Property Value | Without Mortgage | With Mortgage |
| Less than $50,000 | 8 (20.5%) | 0 (0.0%) |
| $50,000 to $99,999 | 9 (23.1%) | 8 (28.6%) |
| $100,000 to $299,999 | 15 (38.5%) | 17 (60.7%) |
| $300,000 to $499,999 | 0 (0.0%) | 3 (10.7%) |
| $500,000 to $749,999 | 0 (0.0%) | 0 (0.0%) |
| $750,000 to $999,999 | 0 (0.0%) | 0 (0.0%) |
| $1,000,000 or more | 7 (17.9%) | 0 (0.0%) |
| Total | 39 (100.0%) | 28 (100.0%) |
Household Income by Mortgage Status in Little Creek
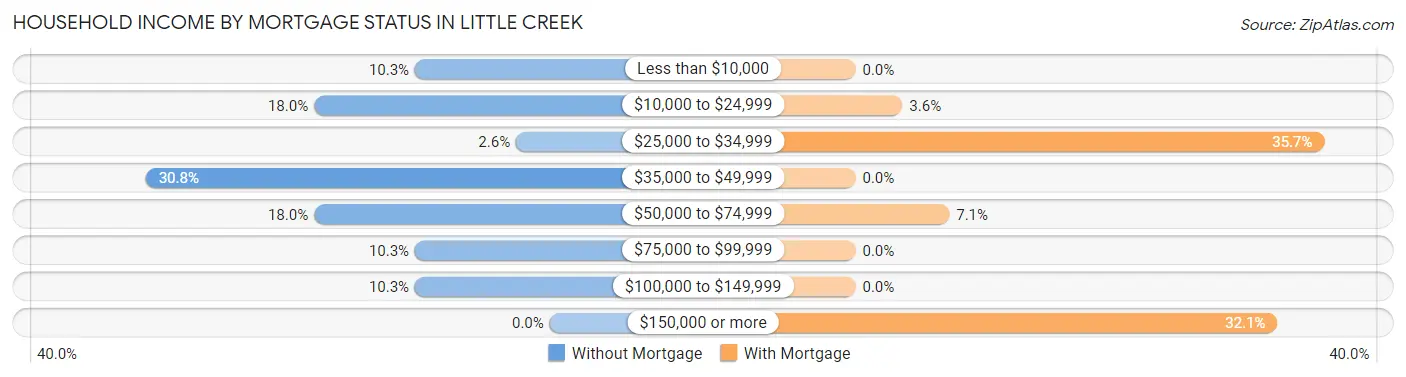
| Household Income | Without Mortgage | With Mortgage |
| Less than $10,000 | 4 (10.3%) | 0 (0.0%) |
| $10,000 to $24,999 | 7 (17.9%) | 1 (3.6%) |
| $25,000 to $34,999 | 1 (2.6%) | 10 (35.7%) |
| $35,000 to $49,999 | 12 (30.8%) | 0 (0.0%) |
| $50,000 to $74,999 | 7 (17.9%) | 2 (7.1%) |
| $75,000 to $99,999 | 4 (10.3%) | 0 (0.0%) |
| $100,000 to $149,999 | 4 (10.3%) | 0 (0.0%) |
| $150,000 or more | 0 (0.0%) | 9 (32.1%) |
| Total | 39 (100.0%) | 28 (100.0%) |
Property Value to Household Income Ratio in Little Creek
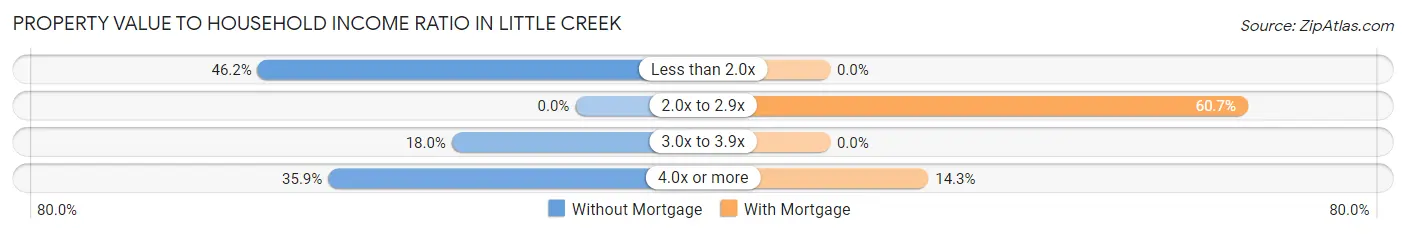
| Value-to-Income Ratio | Without Mortgage | With Mortgage |
| Less than 2.0x | 18 (46.2%) | 0 (0.0%) |
| 2.0x to 2.9x | 0 (0.0%) | 17 (60.7%) |
| 3.0x to 3.9x | 7 (17.9%) | 0 (0.0%) |
| 4.0x or more | 14 (35.9%) | 4 (14.3%) |
| Total | 39 (100.0%) | 28 (100.0%) |
Real Estate Taxes by Mortgage Status in Little Creek
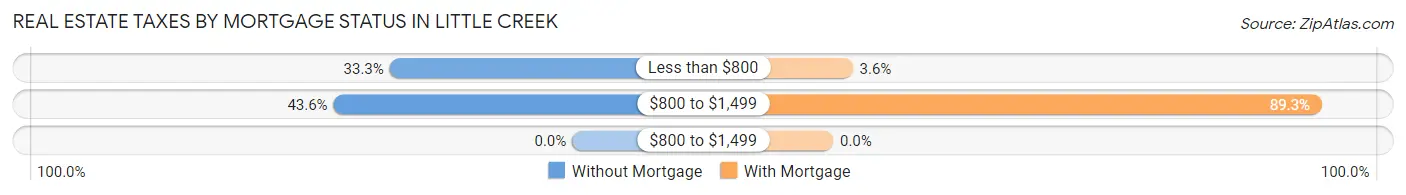
| Property Taxes | Without Mortgage | With Mortgage |
| Less than $800 | 13 (33.3%) | 1 (3.6%) |
| $800 to $1,499 | 17 (43.6%) | 25 (89.3%) |
| $800 to $1,499 | 0 (0.0%) | 0 (0.0%) |
| Total | 39 (100.0%) | 28 (100.0%) |
Health & Disability in Little Creek
Health Insurance Coverage by Age in Little Creek
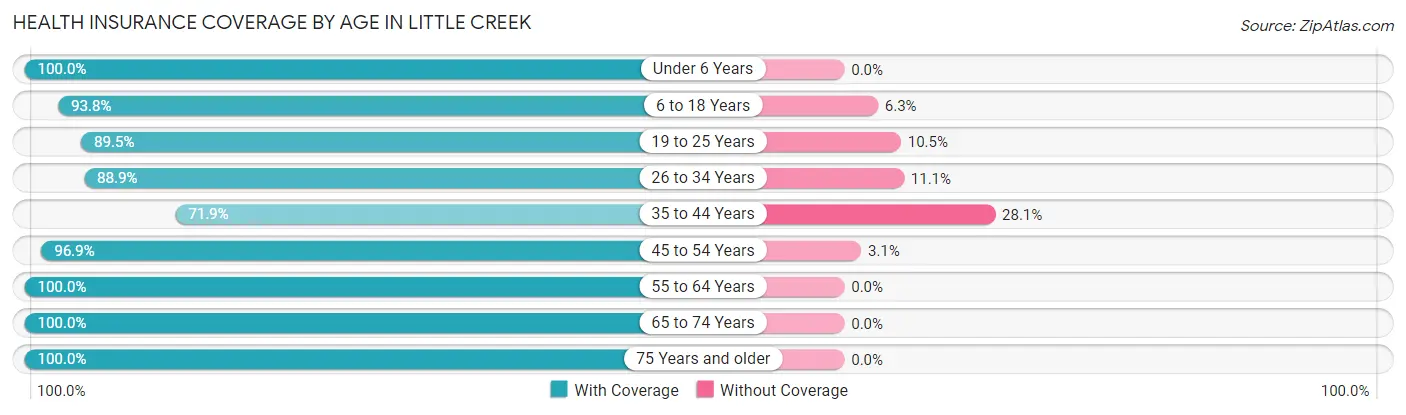
| Age Bracket | With Coverage | Without Coverage |
| Under 6 Years | 20 (100.0%) | 0 (0.0%) |
| 6 to 18 Years | 60 (93.8%) | 4 (6.2%) |
| 19 to 25 Years | 17 (89.5%) | 2 (10.5%) |
| 26 to 34 Years | 24 (88.9%) | 3 (11.1%) |
| 35 to 44 Years | 23 (71.9%) | 9 (28.1%) |
| 45 to 54 Years | 31 (96.9%) | 1 (3.1%) |
| 55 to 64 Years | 36 (100.0%) | 0 (0.0%) |
| 65 to 74 Years | 30 (100.0%) | 0 (0.0%) |
| 75 Years and older | 12 (100.0%) | 0 (0.0%) |
| Total | 253 (93.0%) | 19 (7.0%) |
Health Insurance Coverage by Citizenship Status in Little Creek
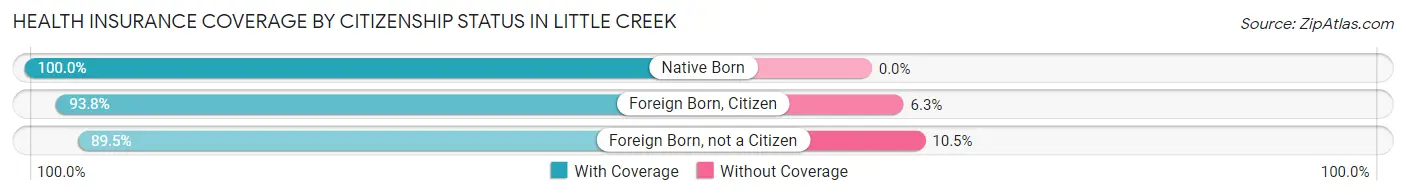
| Citizenship Status | With Coverage | Without Coverage |
| Native Born | 20 (100.0%) | 0 (0.0%) |
| Foreign Born, Citizen | 60 (93.8%) | 4 (6.2%) |
| Foreign Born, not a Citizen | 17 (89.5%) | 2 (10.5%) |
Health Insurance Coverage by Household Income in Little Creek
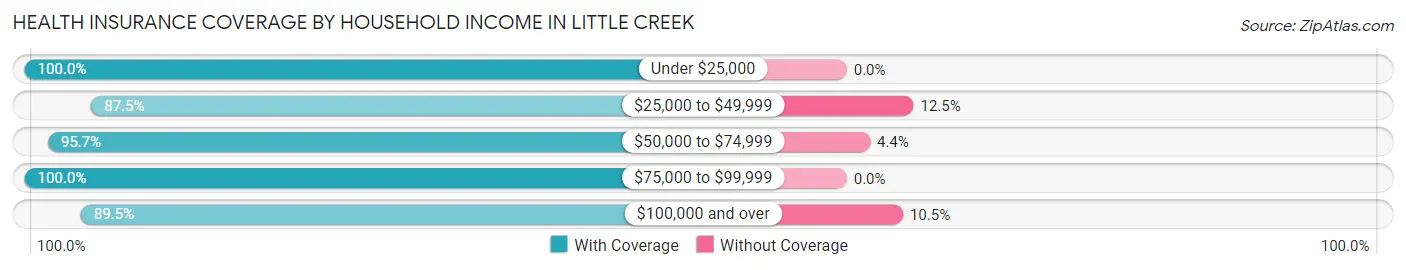
| Household Income | With Coverage | Without Coverage |
| Under $25,000 | 60 (100.0%) | 0 (0.0%) |
| $25,000 to $49,999 | 56 (87.5%) | 8 (12.5%) |
| $50,000 to $74,999 | 22 (95.7%) | 1 (4.3%) |
| $75,000 to $99,999 | 30 (100.0%) | 0 (0.0%) |
| $100,000 and over | 85 (89.5%) | 10 (10.5%) |
Public vs Private Health Insurance Coverage by Age in Little Creek
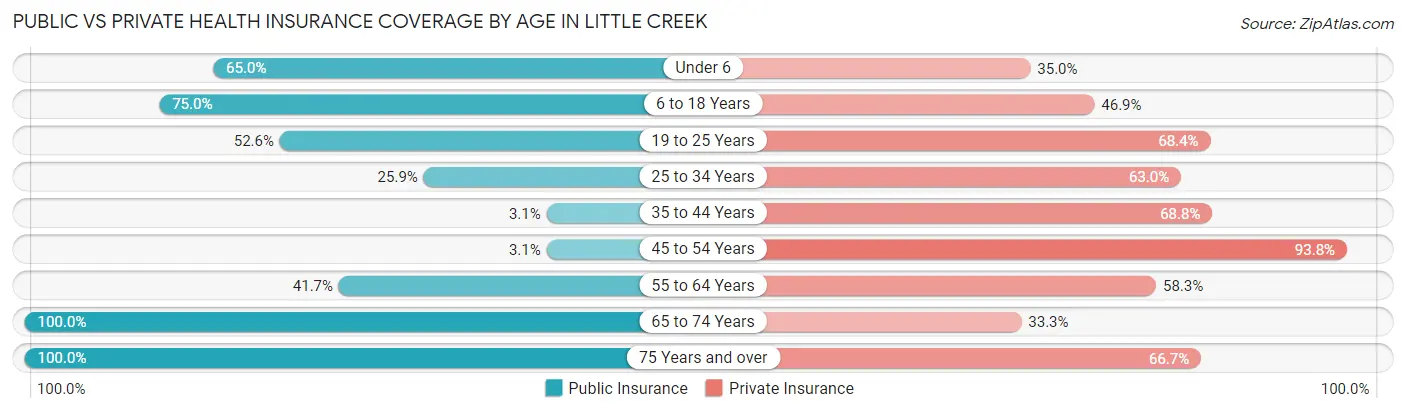
| Age Bracket | Public Insurance | Private Insurance |
| Under 6 | 13 (65.0%) | 7 (35.0%) |
| 6 to 18 Years | 48 (75.0%) | 30 (46.9%) |
| 19 to 25 Years | 10 (52.6%) | 13 (68.4%) |
| 25 to 34 Years | 7 (25.9%) | 17 (63.0%) |
| 35 to 44 Years | 1 (3.1%) | 22 (68.8%) |
| 45 to 54 Years | 1 (3.1%) | 30 (93.8%) |
| 55 to 64 Years | 15 (41.7%) | 21 (58.3%) |
| 65 to 74 Years | 30 (100.0%) | 10 (33.3%) |
| 75 Years and over | 12 (100.0%) | 8 (66.7%) |
| Total | 137 (50.4%) | 158 (58.1%) |
Disability Status by Sex by Age in Little Creek
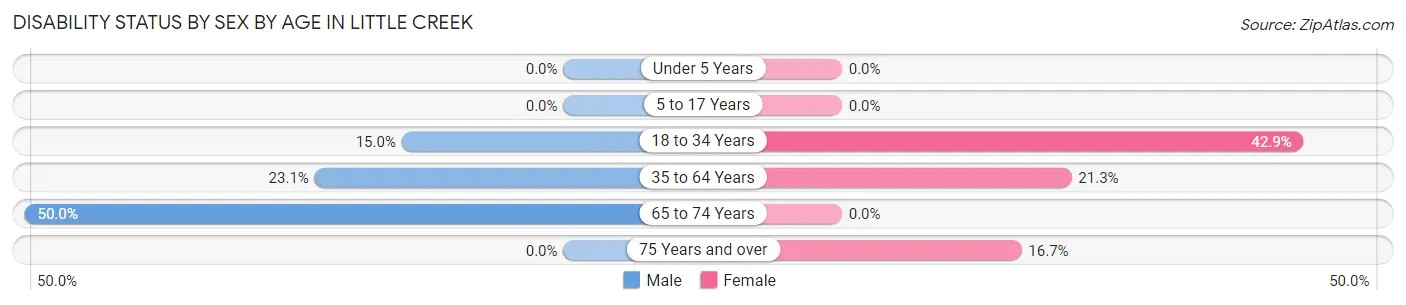
| Age Bracket | Male | Female |
| Under 5 Years | 0 (0.0%) | 0 (0.0%) |
| 5 to 17 Years | 0 (0.0%) | 0 (0.0%) |
| 18 to 34 Years | 3 (15.0%) | 12 (42.9%) |
| 35 to 64 Years | 9 (23.1%) | 13 (21.3%) |
| 65 to 74 Years | 10 (50.0%) | 0 (0.0%) |
| 75 Years and over | 0 (0.0%) | 1 (16.7%) |
Disability Class by Sex by Age in Little Creek
Disability Class: Hearing Difficulty
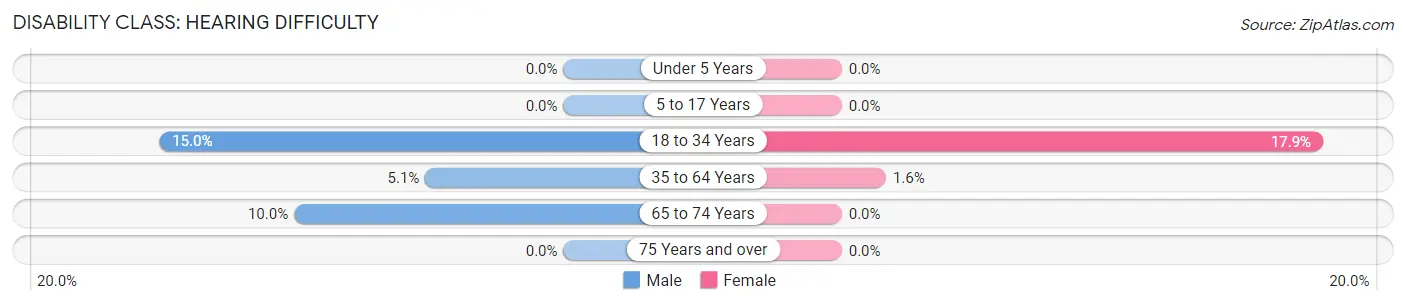
| Age Bracket | Male | Female |
| Under 5 Years | 0 (0.0%) | 0 (0.0%) |
| 5 to 17 Years | 0 (0.0%) | 0 (0.0%) |
| 18 to 34 Years | 3 (15.0%) | 5 (17.9%) |
| 35 to 64 Years | 2 (5.1%) | 1 (1.6%) |
| 65 to 74 Years | 2 (10.0%) | 0 (0.0%) |
| 75 Years and over | 0 (0.0%) | 0 (0.0%) |
Disability Class: Vision Difficulty
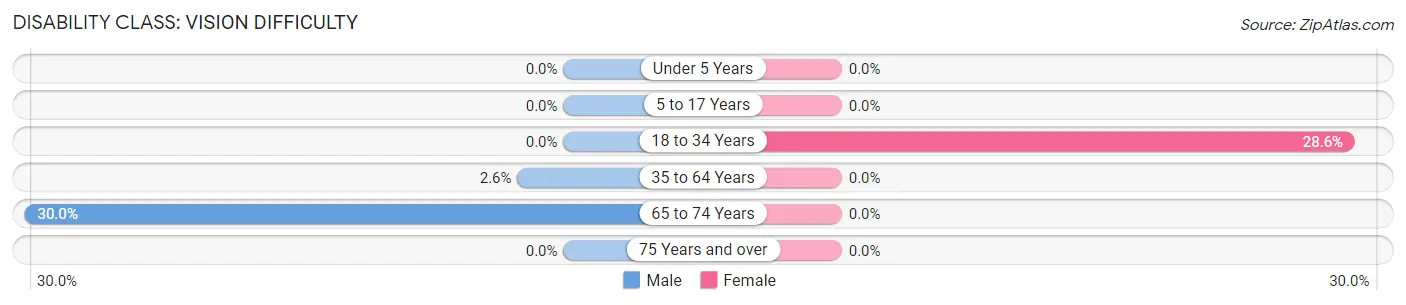
| Age Bracket | Male | Female |
| Under 5 Years | 0 (0.0%) | 0 (0.0%) |
| 5 to 17 Years | 0 (0.0%) | 0 (0.0%) |
| 18 to 34 Years | 0 (0.0%) | 8 (28.6%) |
| 35 to 64 Years | 1 (2.6%) | 0 (0.0%) |
| 65 to 74 Years | 6 (30.0%) | 0 (0.0%) |
| 75 Years and over | 0 (0.0%) | 0 (0.0%) |
Disability Class: Cognitive Difficulty
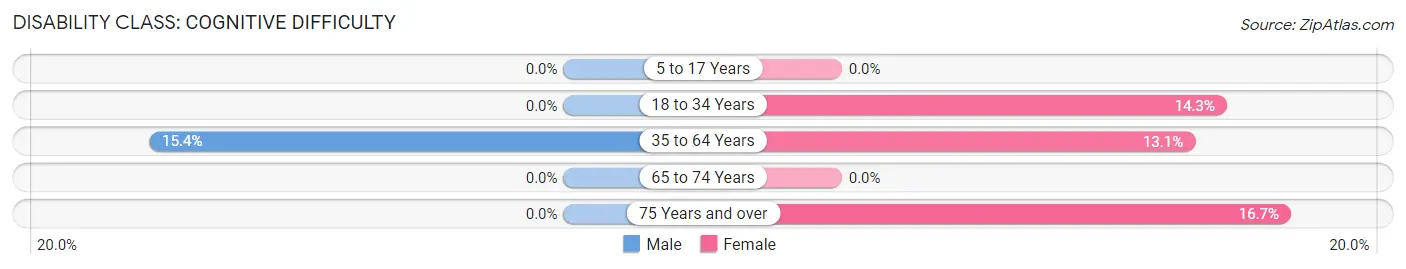
| Age Bracket | Male | Female |
| 5 to 17 Years | 0 (0.0%) | 0 (0.0%) |
| 18 to 34 Years | 0 (0.0%) | 4 (14.3%) |
| 35 to 64 Years | 6 (15.4%) | 8 (13.1%) |
| 65 to 74 Years | 0 (0.0%) | 0 (0.0%) |
| 75 Years and over | 0 (0.0%) | 1 (16.7%) |
Disability Class: Ambulatory Difficulty
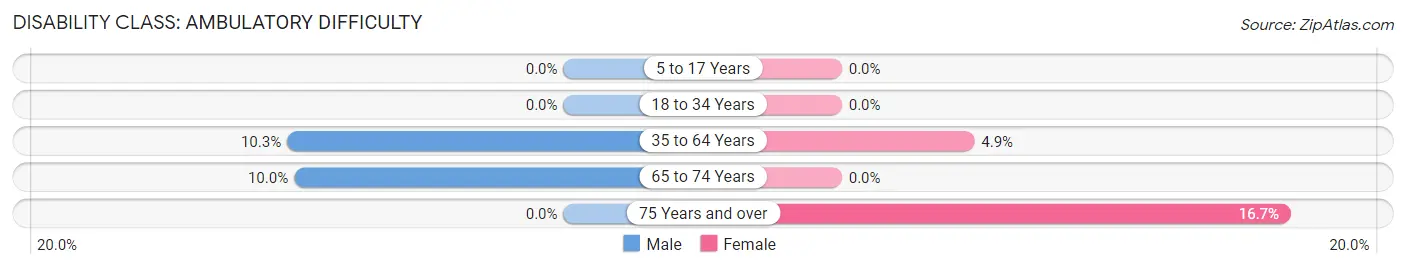
| Age Bracket | Male | Female |
| 5 to 17 Years | 0 (0.0%) | 0 (0.0%) |
| 18 to 34 Years | 0 (0.0%) | 0 (0.0%) |
| 35 to 64 Years | 4 (10.3%) | 3 (4.9%) |
| 65 to 74 Years | 2 (10.0%) | 0 (0.0%) |
| 75 Years and over | 0 (0.0%) | 1 (16.7%) |
Disability Class: Self-Care Difficulty
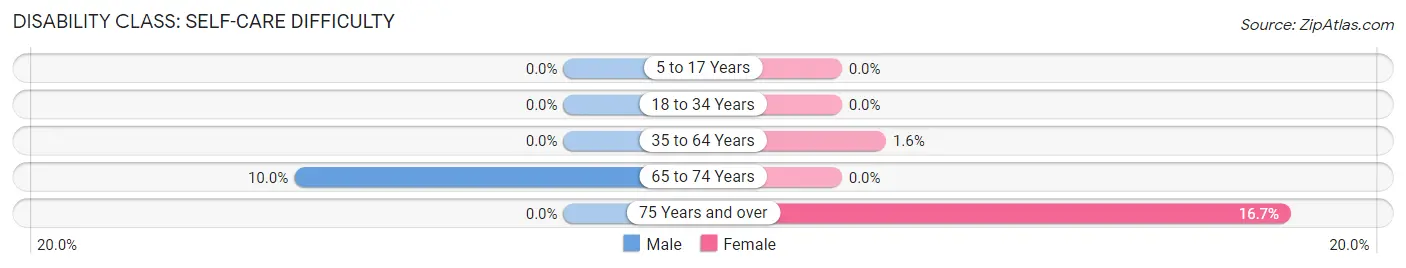
| Age Bracket | Male | Female |
| 5 to 17 Years | 0 (0.0%) | 0 (0.0%) |
| 18 to 34 Years | 0 (0.0%) | 0 (0.0%) |
| 35 to 64 Years | 0 (0.0%) | 1 (1.6%) |
| 65 to 74 Years | 2 (10.0%) | 0 (0.0%) |
| 75 Years and over | 0 (0.0%) | 1 (16.7%) |
Technology Access in Little Creek
Computing Device Access in Little Creek
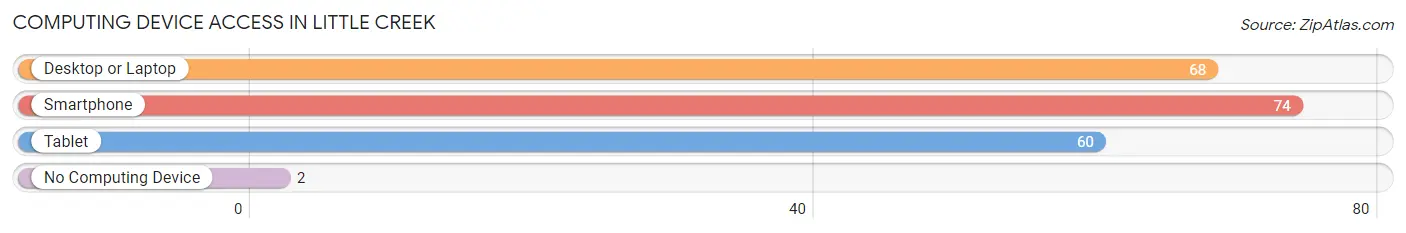
| Device Type | # Households | % Households |
| Desktop or Laptop | 68 | 73.1% |
| Smartphone | 74 | 79.6% |
| Tablet | 60 | 64.5% |
| No Computing Device | 2 | 2.1% |
| Total | 93 | 100.0% |
Internet Access in Little Creek
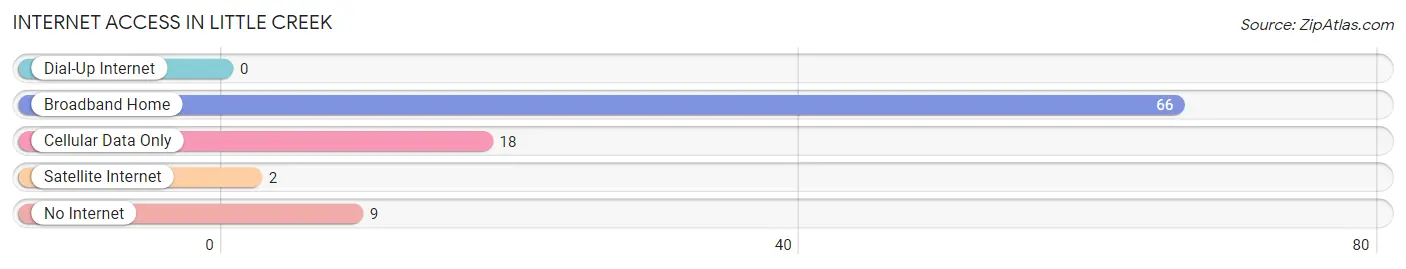
| Internet Type | # Households | % Households |
| Dial-Up Internet | 0 | 0.0% |
| Broadband Home | 66 | 71.0% |
| Cellular Data Only | 18 | 19.4% |
| Satellite Internet | 2 | 2.1% |
| No Internet | 9 | 9.7% |
| Total | 93 | 100.0% |
Little Creek Summary
History
Little Creek is a small unincorporated community located in Kent County, Delaware. It is situated on the Little Creek River, which is a tributary of the Murderkill River. The area was first settled in the late 1600s by English colonists, who established a small fishing village. The village was known as “Little Creek” due to its location on the river. The area was primarily used for farming and fishing until the early 1900s, when the town began to grow and develop.
In the early 1900s, the town was home to a number of small businesses, including a general store, a post office, a blacksmith shop, and a sawmill. The town also had a school, a church, and a few other small businesses. The town was also home to a number of small farms, which provided the town with much of its food.
In the mid-1900s, the town began to decline as the population moved away and businesses closed. The town was largely abandoned by the late 1900s, and the population had dropped to just a few hundred people.
Geography
Little Creek is located in Kent County, Delaware, and is situated on the Little Creek River. The town is located about 10 miles south of Dover, the state capital. The town is surrounded by rural farmland and is bordered by the towns of Frederica and Viola to the north, and the towns of Hartly and Marydel to the south.
The town is located in a flat, low-lying area, with an elevation of just 25 feet above sea level. The area is mostly flat, with some rolling hills and small valleys. The climate in the area is humid subtropical, with hot, humid summers and mild winters.
Economy
The economy of Little Creek is largely based on agriculture and tourism. The town is home to a number of small farms, which produce a variety of crops, including corn, soybeans, wheat, and hay. The town is also home to a number of small businesses, including a general store, a post office, and a few other small businesses.
The town is also a popular tourist destination, as it is located close to the Delaware beaches and other attractions. The town is home to a number of bed and breakfasts, as well as a few restaurants and bars. The town also hosts a number of festivals and events throughout the year, including the Little Creek Festival, which is held every summer.
Demographics
As of the 2010 census, the population of Little Creek was 1,093. The population is largely white (94.3%), with a small percentage of African Americans (2.2%) and Hispanics (2.2%). The median household income in the town is $45,000, and the median age is 44. The town is largely rural, with a population density of just 39 people per square mile.
Common Questions
What is Per Capita Income in Little Creek?
Per Capita income in Little Creek is $29,443.
What is the Median Family Income in Little Creek?
Median Family Income in Little Creek is $46,875.
What is the Median Household income in Little Creek?
Median Household Income in Little Creek is $57,917.
What is Inequality or Gini Index in Little Creek?
Inequality or Gini Index in Little Creek is 0.43.
What is the Total Population of Little Creek?
Total Population of Little Creek is 272.
What is the Total Male Population of Little Creek?
Total Male Population of Little Creek is 150.
What is the Total Female Population of Little Creek?
Total Female Population of Little Creek is 122.
What is the Ratio of Males per 100 Females in Little Creek?
There are 122.95 Males per 100 Females in Little Creek.
What is the Ratio of Females per 100 Males in Little Creek?
There are 81.33 Females per 100 Males in Little Creek.
What is the Median Population Age in Little Creek?
Median Population Age in Little Creek is 36.8 Years.
What is the Average Family Size in Little Creek
Average Family Size in Little Creek is 3.1 People.
What is the Average Household Size in Little Creek
Average Household Size in Little Creek is 2.9 People.
How Large is the Labor Force in Little Creek?
There are 146 People in the Labor Forcein in Little Creek.
What is the Percentage of People in the Labor Force in Little Creek?
70.5% of People are in the Labor Force in Little Creek.
What is the Unemployment Rate in Little Creek?
Unemployment Rate in Little Creek is 6.8%.