Cities with the Oldest Male Population in Delaware
RELATED REPORTS & OPTIONS
Oldest Population | Male
Delaware
Compare Cities
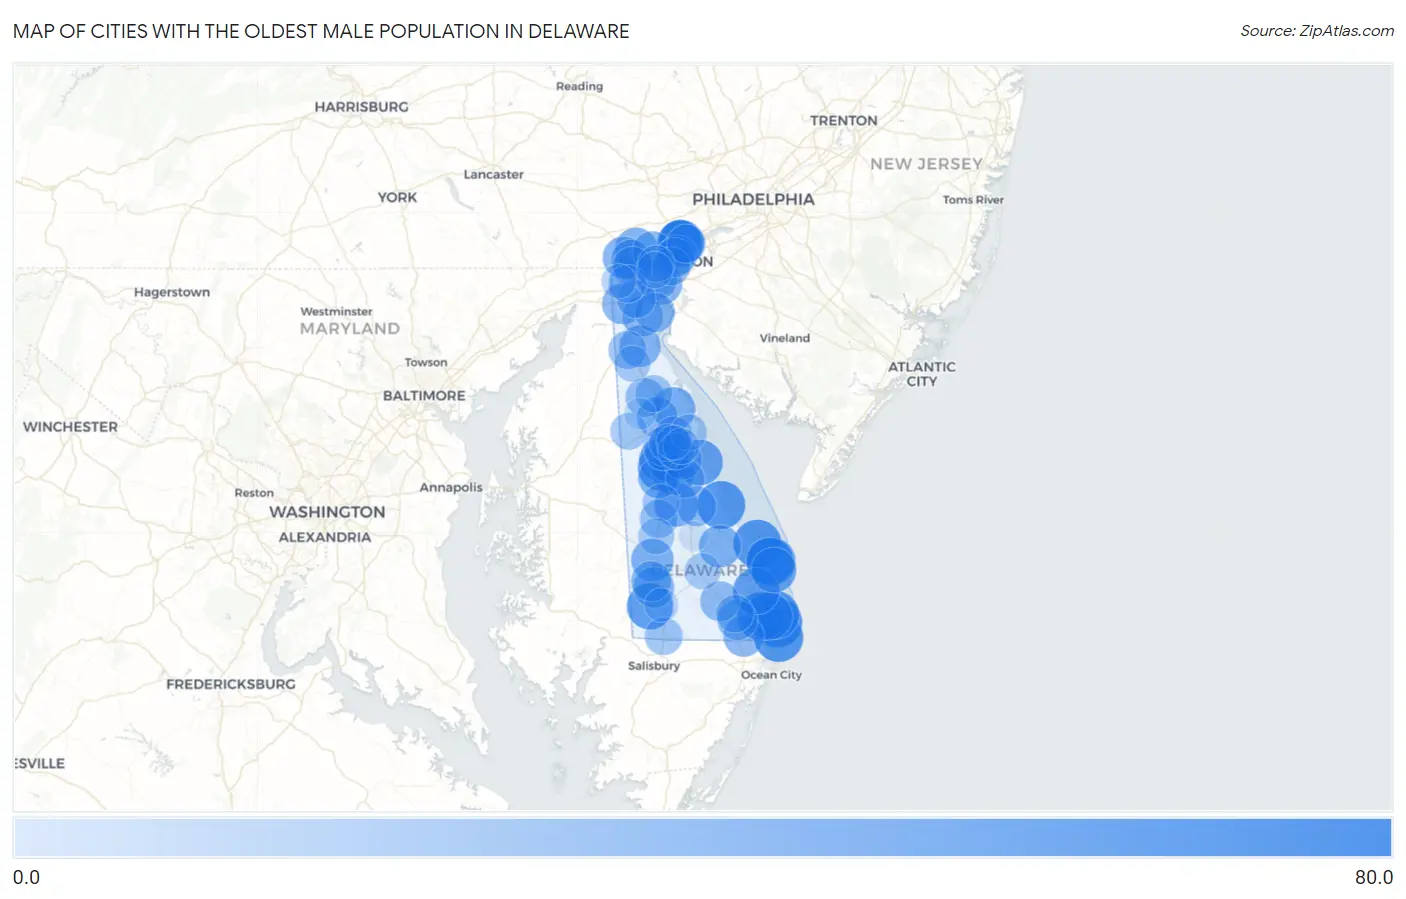
Map of Cities with the Oldest Male Population in Delaware
0.0
80.0
Cities with the Oldest Male Population in Delaware
| City | Median Age | vs State | vs National | |
| 1. | South Bethany | 71.2 | 39.7(+31.5)#1 | 37.4(+33.8)#307 |
| 2. | Fenwick Island | 69.4 | 39.7(+29.7)#2 | 37.4(+32.0)#438 |
| 3. | Bethany Beach | 68.0 | 39.7(+28.3)#3 | 37.4(+30.6)#573 |
| 4. | Henlopen Acres | 67.5 | 39.7(+27.8)#4 | 37.4(+30.1)#608 |
| 5. | Millville | 66.9 | 39.7(+27.2)#5 | 37.4(+29.5)#682 |
| 6. | Lewes | 66.6 | 39.7(+26.9)#6 | 37.4(+29.2)#712 |
| 7. | Slaughter Beach | 66.5 | 39.7(+26.8)#7 | 37.4(+29.1)#723 |
| 8. | Ocean View | 64.6 | 39.7(+24.9)#8 | 37.4(+27.2)#988 |
| 9. | Rehoboth Beach | 63.8 | 39.7(+24.1)#9 | 37.4(+26.4)#1,150 |
| 10. | Viola | 62.8 | 39.7(+23.1)#10 | 37.4(+25.4)#1,371 |
| 11. | Long Neck | 61.6 | 39.7(+21.9)#11 | 37.4(+24.2)#1,603 |
| 12. | Ardencroft | 61.1 | 39.7(+21.4)#12 | 37.4(+23.7)#1,764 |
| 13. | Bethel | 60.8 | 39.7(+21.1)#13 | 37.4(+23.4)#1,805 |
| 14. | Bowers | 58.7 | 39.7(+19.0)#14 | 37.4(+21.3)#2,361 |
| 15. | Dewey Beach | 57.3 | 39.7(+17.6)#15 | 37.4(+19.9)#2,825 |
| 16. | Ardentown | 57.3 | 39.7(+17.6)#16 | 37.4(+19.9)#2,830 |
| 17. | Woodside | 55.1 | 39.7(+15.4)#17 | 37.4(+17.7)#3,635 |
| 18. | Houston | 52.1 | 39.7(+12.4)#18 | 37.4(+14.7)#4,887 |
| 19. | Leipsic | 50.6 | 39.7(+10.9)#19 | 37.4(+13.2)#5,579 |
| 20. | Arden | 49.7 | 39.7(+10.00)#20 | 37.4(+12.3)#6,082 |
| 21. | Riverview | 49.6 | 39.7(+9.90)#21 | 37.4(+12.2)#6,123 |
| 22. | Bridgeville | 48.8 | 39.7(+9.10)#22 | 37.4(+11.4)#6,564 |
| 23. | Milton | 48.0 | 39.7(+8.30)#23 | 37.4(+10.6)#7,076 |
| 24. | Hockessin | 47.8 | 39.7(+8.10)#24 | 37.4(+10.4)#7,192 |
| 25. | New Castle | 47.1 | 39.7(+7.40)#25 | 37.4(+9.70)#7,694 |
| 26. | North Star | 46.9 | 39.7(+7.20)#26 | 37.4(+9.50)#7,853 |
| 27. | Odessa | 45.6 | 39.7(+5.90)#27 | 37.4(+8.20)#8,790 |
| 28. | Highland Acres | 44.8 | 39.7(+5.10)#28 | 37.4(+7.40)#9,442 |
| 29. | Woodside East | 44.6 | 39.7(+4.90)#29 | 37.4(+7.20)#9,588 |
| 30. | Felton | 44.1 | 39.7(+4.40)#30 | 37.4(+6.70)#10,037 |
| 31. | Blades | 43.5 | 39.7(+3.80)#31 | 37.4(+6.10)#10,614 |
| 32. | Glasgow | 43.3 | 39.7(+3.60)#32 | 37.4(+5.90)#10,786 |
| 33. | Selbyville | 43.2 | 39.7(+3.50)#33 | 37.4(+5.80)#10,907 |
| 34. | Cheswold | 43.2 | 39.7(+3.50)#34 | 37.4(+5.80)#10,916 |
| 35. | St Georges | 42.9 | 39.7(+3.20)#35 | 37.4(+5.50)#11,216 |
| 36. | Pike Creek | 42.7 | 39.7(+3.00)#36 | 37.4(+5.30)#11,357 |
| 37. | Seaford | 41.4 | 39.7(+1.70)#37 | 37.4(+4.00)#12,883 |
| 38. | Greenville | 40.7 | 39.7(+1.000)#38 | 37.4(+3.30)#13,735 |
| 39. | Frankford | 40.7 | 39.7(+1.000)#39 | 37.4(+3.30)#13,766 |
| 40. | Wilmington Manor | 40.1 | 39.7(+0.400)#40 | 37.4(+2.70)#14,529 |
| 41. | Milford | 40.0 | 39.7(+0.300)#41 | 37.4(+2.60)#14,658 |
| 42. | Millsboro | 39.6 | 39.7(-0.100)#42 | 37.4(+2.20)#15,194 |
| 43. | Delaware City | 39.5 | 39.7(-0.200)#43 | 37.4(+2.10)#15,379 |
| 44. | Bellefonte | 38.8 | 39.7(-0.900)#44 | 37.4(+1.40)#16,389 |
| 45. | Edgemoor | 38.6 | 39.7(-1.10)#45 | 37.4(+1.20)#16,621 |
| 46. | Pike Creek Valley | 38.1 | 39.7(-1.60)#46 | 37.4(+0.700)#17,335 |
| 47. | Clayton | 37.4 | 39.7(-2.30)#47 | 37.4(=0.000)#18,344 |
| 48. | Magnolia | 36.9 | 39.7(-2.80)#48 | 37.4(-0.500)#19,115 |
| 49. | Bear | 36.8 | 39.7(-2.90)#49 | 37.4(-0.600)#19,139 |
| 50. | Wyoming | 36.5 | 39.7(-3.20)#50 | 37.4(-0.900)#19,678 |
| 51. | Frederica | 36.0 | 39.7(-3.70)#51 | 37.4(-1.40)#20,402 |
| 52. | Wilmington | 35.8 | 39.7(-3.90)#52 | 37.4(-1.60)#20,574 |
| 53. | Claymont | 35.7 | 39.7(-4.00)#53 | 37.4(-1.70)#20,759 |
| 54. | Camden | 35.5 | 39.7(-4.20)#54 | 37.4(-1.90)#21,036 |
| 55. | Farmington | 35.0 | 39.7(-4.70)#55 | 37.4(-2.40)#21,738 |
| 56. | Middletown | 34.6 | 39.7(-5.10)#56 | 37.4(-2.80)#22,151 |
| 57. | Brookside | 34.1 | 39.7(-5.60)#57 | 37.4(-3.30)#22,807 |
| 58. | Delmar | 33.7 | 39.7(-6.00)#58 | 37.4(-3.70)#23,331 |
| 59. | Dagsboro | 32.9 | 39.7(-6.80)#59 | 37.4(-4.50)#24,237 |
| 60. | Dover | 32.5 | 39.7(-7.20)#60 | 37.4(-4.90)#24,559 |
| 61. | Smyrna | 31.9 | 39.7(-7.80)#61 | 37.4(-5.50)#25,102 |
| 62. | Rodney Village | 31.1 | 39.7(-8.60)#62 | 37.4(-6.30)#25,835 |
| 63. | Harrington | 30.7 | 39.7(-9.00)#63 | 37.4(-6.70)#26,111 |
| 64. | Hartly | 30.5 | 39.7(-9.20)#64 | 37.4(-6.90)#26,317 |
| 65. | Elsmere | 30.2 | 39.7(-9.50)#65 | 37.4(-7.20)#26,499 |
| 66. | Rising Sun Lebanon | 29.4 | 39.7(-10.3)#66 | 37.4(-8.00)#27,043 |
| 67. | Newport | 29.4 | 39.7(-10.3)#67 | 37.4(-8.00)#27,057 |
| 68. | Little Creek | 29.2 | 39.7(-10.5)#68 | 37.4(-8.20)#27,167 |
| 69. | Greenwood | 28.4 | 39.7(-11.3)#69 | 37.4(-9.00)#27,592 |
| 70. | Dover Base Housing | 28.2 | 39.7(-11.5)#70 | 37.4(-9.20)#27,669 |
| 71. | Georgetown | 27.8 | 39.7(-11.9)#71 | 37.4(-9.60)#27,837 |
| 72. | Townsend | 27.7 | 39.7(-12.0)#72 | 37.4(-9.70)#27,912 |
| 73. | Newark | 23.3 | 39.7(-16.4)#73 | 37.4(-14.1)#29,235 |
| 74. | Kent Acres | 22.7 | 39.7(-17.0)#74 | 37.4(-14.7)#29,385 |
| 75. | Lincoln | 21.5 | 39.7(-18.2)#75 | 37.4(-15.9)#29,668 |
| 76. | Laurel | 20.8 | 39.7(-18.9)#76 | 37.4(-16.6)#29,775 |
| 77. | Kenton | 14.3 | 39.7(-25.4)#77 | 37.4(-23.1)#30,330 |
| 78. | Ellendale | 9.7 | 39.7(-30.0)#78 | 37.4(-27.7)#30,469 |
1
Common Questions
What are the Top 10 Cities with the Oldest Male Population in Delaware?
Top 10 Cities with the Oldest Male Population in Delaware are:
#1
71.2
#2
69.4
#3
68.0
#4
67.5
#5
66.9
#6
66.6
#7
66.5
#8
64.6
#9
63.8
#10
62.8
What city has the Oldest Male Population in Delaware?
South Bethany has the Oldest Male Population in Delaware with 71.2.
What is the Median Male Age in the State of Delaware?
Median Male Age in Delaware is 39.7.
What is the Median Male Age in the United States?
Median Male Age in the United States is 37.4.