Henlopen Acres, DE Map & Demographics
Henlopen Acres Map
Henlopen Acres Overview
$110,969
PER CAPITA INCOME
$235,179
AVG FAMILY INCOME
$168,750
AVG HOUSEHOLD INCOME
58.8%
WAGE / INCOME GAP [ % ]
41.2¢/ $1
WAGE / INCOME GAP [ $ ]
0.51
INEQUALITY / GINI INDEX
193
TOTAL POPULATION
92
MALE POPULATION
101
FEMALE POPULATION
91.09
MALES / 100 FEMALES
109.78
FEMALES / 100 MALES
69.2
MEDIAN AGE
2.2
AVG FAMILY SIZE
1.9
AVG HOUSEHOLD SIZE
66
LABOR FORCE [ PEOPLE ]
36.5%
PERCENT IN LABOR FORCE
3.0%
UNEMPLOYMENT RATE
Income in Henlopen Acres
Income Overview in Henlopen Acres
Per Capita Income in Henlopen Acres is $110,969, while median incomes of families and households are $235,179 and $168,750 respectively.
| Characteristic | Number | Measure |
| Per Capita Income | 193 | $110,969 |
| Median Family Income | 68 | $235,179 |
| Mean Family Income | 68 | $257,269 |
| Median Household Income | 103 | $168,750 |
| Mean Household Income | 103 | $212,263 |
| Income Deficit | 68 | $0 |
| Wage / Income Gap (%) | 193 | 58.79% |
| Wage / Income Gap ($) | 193 | 41.21¢ per $1 |
| Gini / Inequality Index | 193 | 0.51 |
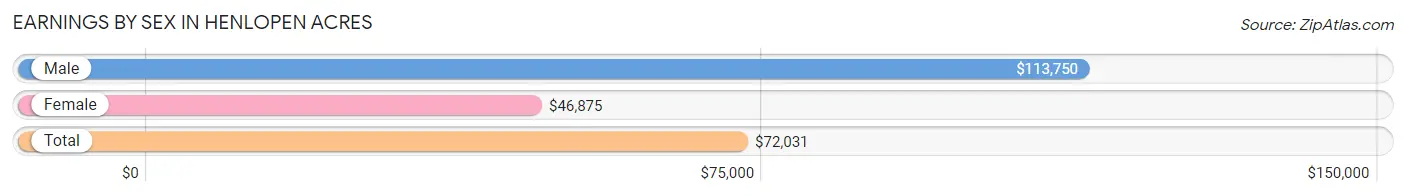
Earnings by Sex in Henlopen Acres
Average Earnings in Henlopen Acres are $72,031, $113,750 for men and $46,875 for women, a difference of 58.8%.
| Sex | Number | Average Earnings |
| Male | 42 (57.5%) | $113,750 |
| Female | 31 (42.5%) | $46,875 |
| Total | 73 (100.0%) | $72,031 |
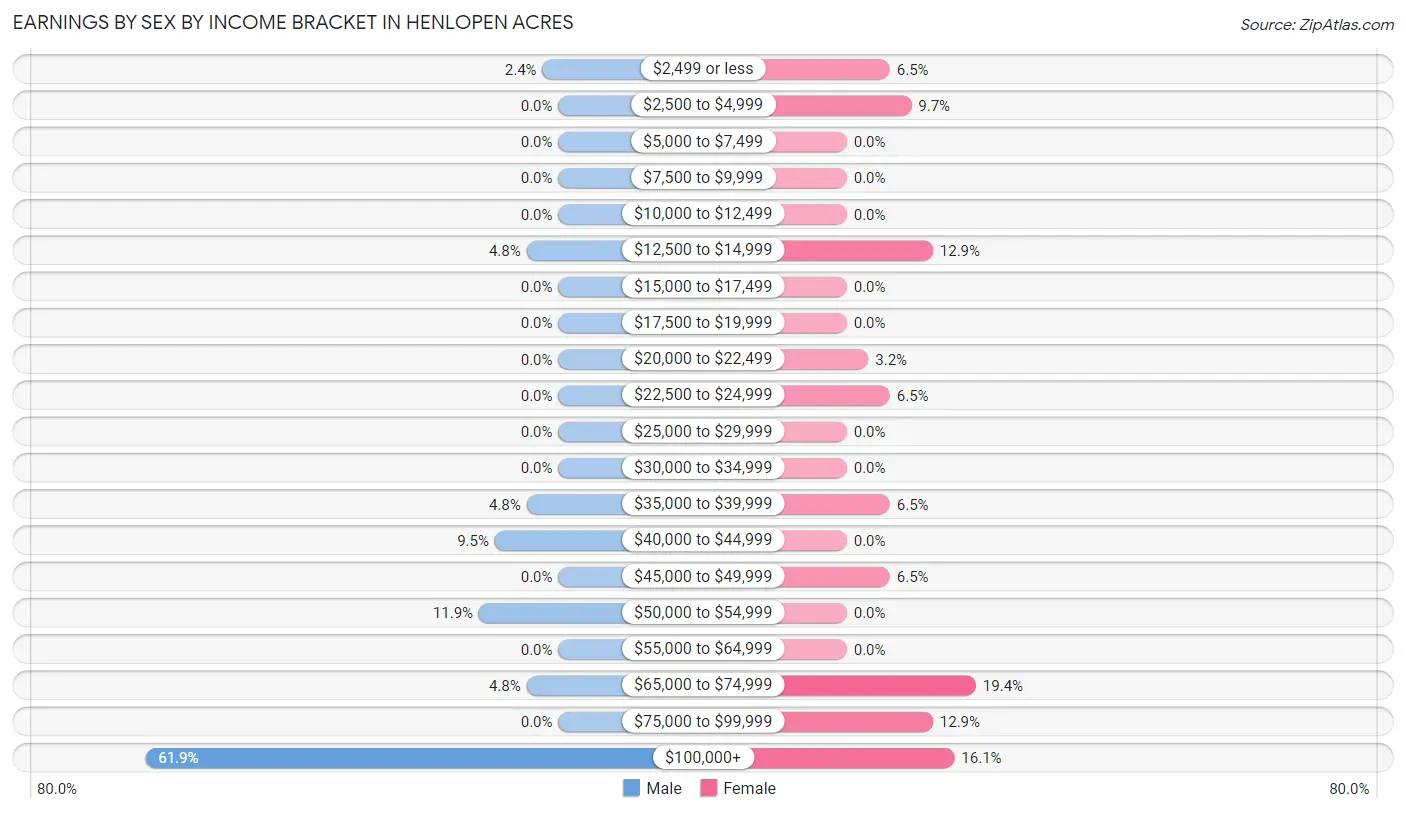
Earnings by Sex by Income Bracket in Henlopen Acres
The most common earnings brackets in Henlopen Acres are $100,000+ for men (26 | 61.9%) and $65,000 to $74,999 for women (6 | 19.4%).
| Income | Male | Female |
| $2,499 or less | 1 (2.4%) | 2 (6.5%) |
| $2,500 to $4,999 | 0 (0.0%) | 3 (9.7%) |
| $5,000 to $7,499 | 0 (0.0%) | 0 (0.0%) |
| $7,500 to $9,999 | 0 (0.0%) | 0 (0.0%) |
| $10,000 to $12,499 | 0 (0.0%) | 0 (0.0%) |
| $12,500 to $14,999 | 2 (4.8%) | 4 (12.9%) |
| $15,000 to $17,499 | 0 (0.0%) | 0 (0.0%) |
| $17,500 to $19,999 | 0 (0.0%) | 0 (0.0%) |
| $20,000 to $22,499 | 0 (0.0%) | 1 (3.2%) |
| $22,500 to $24,999 | 0 (0.0%) | 2 (6.5%) |
| $25,000 to $29,999 | 0 (0.0%) | 0 (0.0%) |
| $30,000 to $34,999 | 0 (0.0%) | 0 (0.0%) |
| $35,000 to $39,999 | 2 (4.8%) | 2 (6.5%) |
| $40,000 to $44,999 | 4 (9.5%) | 0 (0.0%) |
| $45,000 to $49,999 | 0 (0.0%) | 2 (6.5%) |
| $50,000 to $54,999 | 5 (11.9%) | 0 (0.0%) |
| $55,000 to $64,999 | 0 (0.0%) | 0 (0.0%) |
| $65,000 to $74,999 | 2 (4.8%) | 6 (19.4%) |
| $75,000 to $99,999 | 0 (0.0%) | 4 (12.9%) |
| $100,000+ | 26 (61.9%) | 5 (16.1%) |
| Total | 42 (100.0%) | 31 (100.0%) |
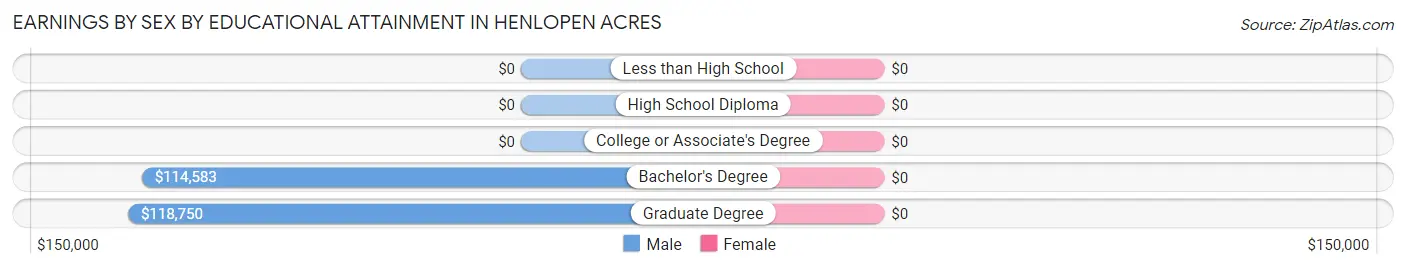
Earnings by Sex by Educational Attainment in Henlopen Acres
| Educational Attainment | Male Income | Female Income |
| Less than High School | - | - |
| High School Diploma | - | - |
| College or Associate's Degree | - | - |
| Bachelor's Degree | $114,583 | $0 |
| Graduate Degree | $118,750 | $0 |
| Total | $113,906 | $70,625 |
Family Income in Henlopen Acres
Family Income Brackets in Henlopen Acres
According to the Henlopen Acres family income data, there are 40 families falling into the $200,000+ income range, which is the most common income bracket and makes up 58.8% of all families.
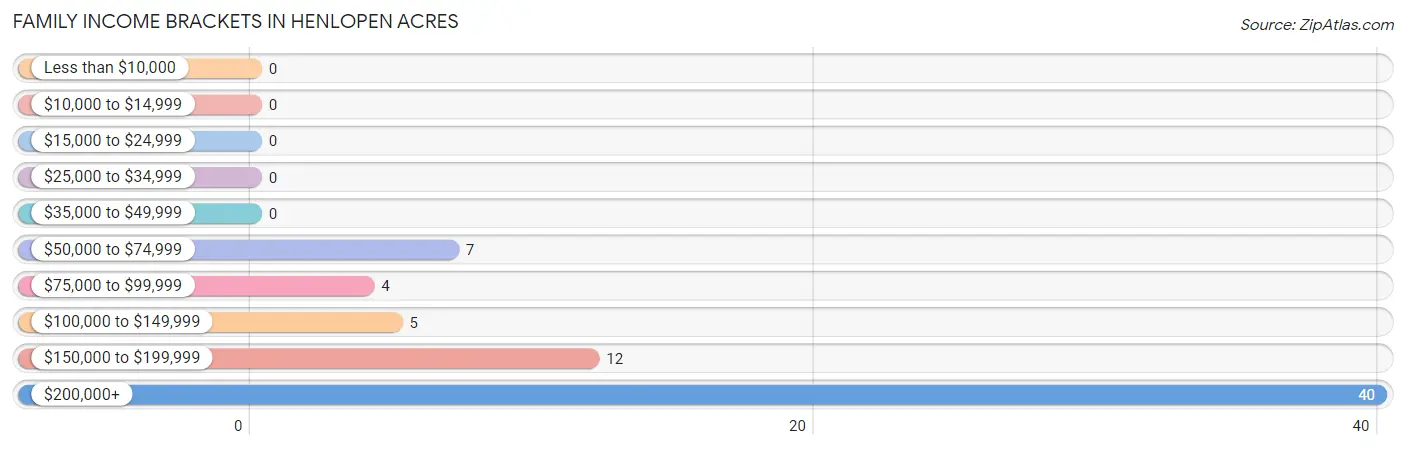
| Income Bracket | # Families | % Families |
| Less than $10,000 | 0 | 0.0% |
| $10,000 to $14,999 | 0 | 0.0% |
| $15,000 to $24,999 | 0 | 0.0% |
| $25,000 to $34,999 | 0 | 0.0% |
| $35,000 to $49,999 | 0 | 0.0% |
| $50,000 to $74,999 | 7 | 10.3% |
| $75,000 to $99,999 | 4 | 5.9% |
| $100,000 to $149,999 | 5 | 7.4% |
| $150,000 to $199,999 | 12 | 17.6% |
| $200,000+ | 40 | 58.8% |
Family Income by Famaliy Size in Henlopen Acres
2-person families (52 | 76.5%) account for the highest median family income in Henlopen Acres with $235,714 per family, while 2-person families (52 | 76.5%) have the highest median income of $117,857 per family member.
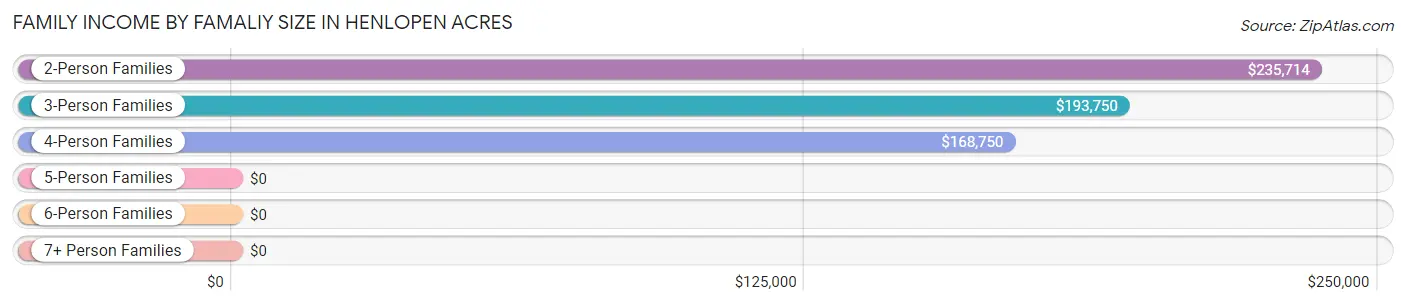
| Income Bracket | # Families | Median Income |
| 2-Person Families | 52 (76.5%) | $235,714 |
| 3-Person Families | 6 (8.8%) | $193,750 |
| 4-Person Families | 8 (11.8%) | $168,750 |
| 5-Person Families | 2 (2.9%) | $0 |
| 6-Person Families | 0 (0.0%) | $0 |
| 7+ Person Families | 0 (0.0%) | $0 |
| Total | 68 (100.0%) | $235,179 |
Family Income by Number of Earners in Henlopen Acres
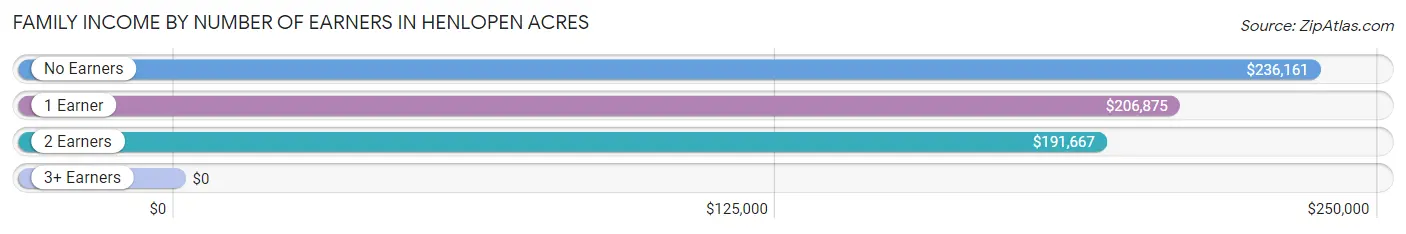
| Number of Earners | # Families | Median Income |
| No Earners | 25 (36.8%) | $236,161 |
| 1 Earner | 21 (30.9%) | $206,875 |
| 2 Earners | 22 (32.4%) | $191,667 |
| 3+ Earners | 0 (0.0%) | $0 |
| Total | 68 (100.0%) | $235,179 |
Household Income in Henlopen Acres
Household Income Brackets in Henlopen Acres
With 44 households falling in the category, the $200,000+ income range is the most frequent in Henlopen Acres, accounting for 42.7% of all households.
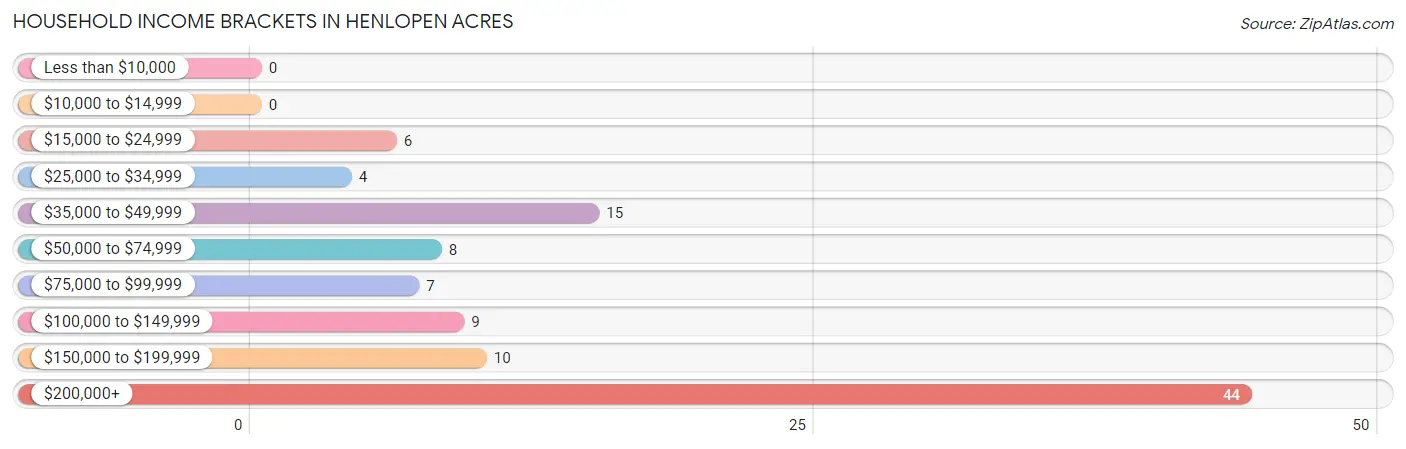
| Income Bracket | # Households | % Households |
| Less than $10,000 | 0 | 0.0% |
| $10,000 to $14,999 | 0 | 0.0% |
| $15,000 to $24,999 | 6 | 5.8% |
| $25,000 to $34,999 | 4 | 3.9% |
| $35,000 to $49,999 | 15 | 14.6% |
| $50,000 to $74,999 | 8 | 7.8% |
| $75,000 to $99,999 | 7 | 6.8% |
| $100,000 to $149,999 | 9 | 8.7% |
| $150,000 to $199,999 | 10 | 9.7% |
| $200,000+ | 44 | 42.7% |
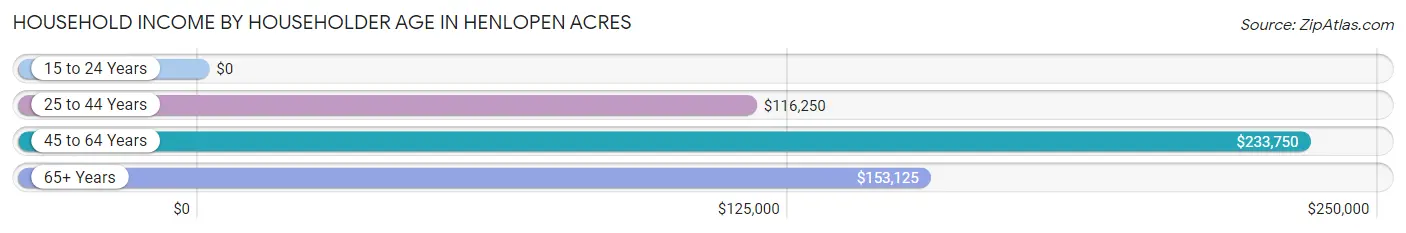
Household Income by Householder Age in Henlopen Acres
The median household income in Henlopen Acres is $168,750, with the highest median household income of $233,750 found in the 45 to 64 years age bracket for the primary householder. A total of 16 households (15.5%) fall into this category.
| Income Bracket | # Households | Median Income |
| 15 to 24 Years | 0 (0.0%) | $0 |
| 25 to 44 Years | 6 (5.8%) | $116,250 |
| 45 to 64 Years | 16 (15.5%) | $233,750 |
| 65+ Years | 81 (78.6%) | $153,125 |
| Total | 103 (100.0%) | $168,750 |
Poverty in Henlopen Acres
Income Below Poverty by Sex and Age in Henlopen Acres
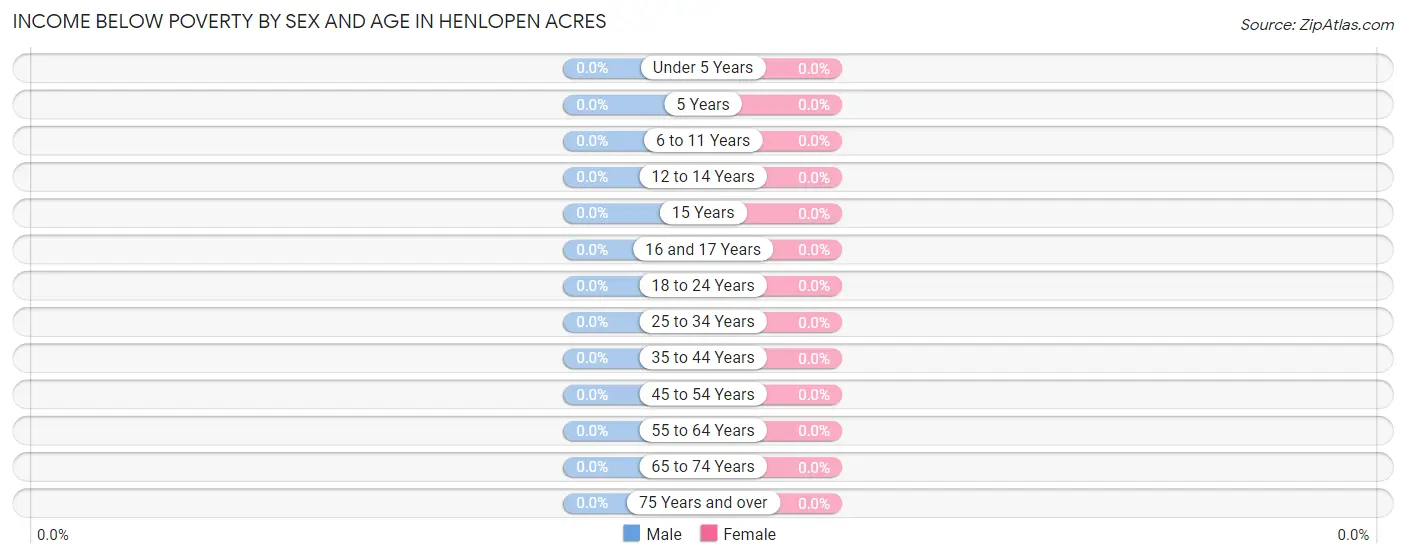
| Age Bracket | Male | Female |
| Under 5 Years | 0 (0.0%) | 0 (0.0%) |
| 5 Years | 0 (0.0%) | 0 (0.0%) |
| 6 to 11 Years | 0 (0.0%) | 0 (0.0%) |
| 12 to 14 Years | 0 (0.0%) | 0 (0.0%) |
| 15 Years | 0 (0.0%) | 0 (0.0%) |
| 16 and 17 Years | 0 (0.0%) | 0 (0.0%) |
| 18 to 24 Years | 0 (0.0%) | 0 (0.0%) |
| 25 to 34 Years | 0 (0.0%) | 0 (0.0%) |
| 35 to 44 Years | 0 (0.0%) | 0 (0.0%) |
| 45 to 54 Years | 0 (0.0%) | 0 (0.0%) |
| 55 to 64 Years | 0 (0.0%) | 0 (0.0%) |
| 65 to 74 Years | 0 (0.0%) | 0 (0.0%) |
| 75 Years and over | 0 (0.0%) | 0 (0.0%) |
| Total | 0 (0.0%) | 0 (0.0%) |
Income Above Poverty by Sex and Age in Henlopen Acres
According to the poverty statistics in Henlopen Acres, males aged under 5 years and females aged 6 to 11 years are the age groups that are most secure financially, with 100.0% of males and 100.0% of females in these age groups living above the poverty line.
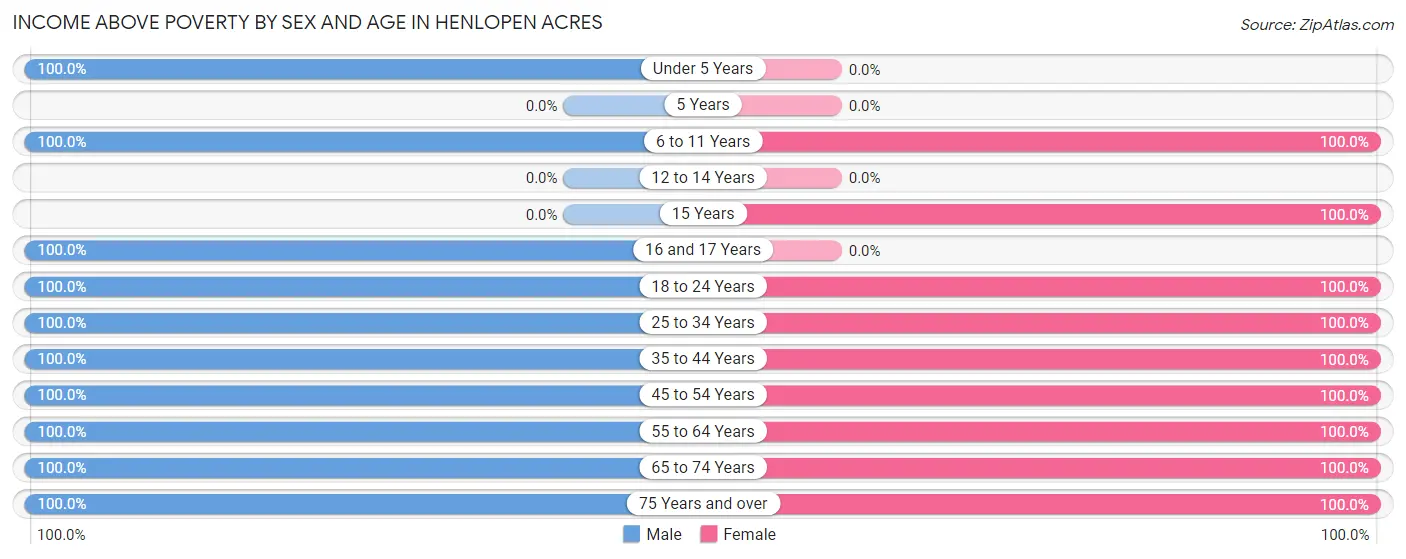
| Age Bracket | Male | Female |
| Under 5 Years | 6 (100.0%) | 0 (0.0%) |
| 5 Years | 0 (0.0%) | 0 (0.0%) |
| 6 to 11 Years | 1 (100.0%) | 1 (100.0%) |
| 12 to 14 Years | 0 (0.0%) | 0 (0.0%) |
| 15 Years | 0 (0.0%) | 4 (100.0%) |
| 16 and 17 Years | 2 (100.0%) | 0 (0.0%) |
| 18 to 24 Years | 1 (100.0%) | 4 (100.0%) |
| 25 to 34 Years | 17 (100.0%) | 2 (100.0%) |
| 35 to 44 Years | 2 (100.0%) | 4 (100.0%) |
| 45 to 54 Years | 4 (100.0%) | 9 (100.0%) |
| 55 to 64 Years | 6 (100.0%) | 15 (100.0%) |
| 65 to 74 Years | 29 (100.0%) | 24 (100.0%) |
| 75 Years and over | 24 (100.0%) | 38 (100.0%) |
| Total | 92 (100.0%) | 101 (100.0%) |
Income Below Poverty Among Married-Couple Families in Henlopen Acres
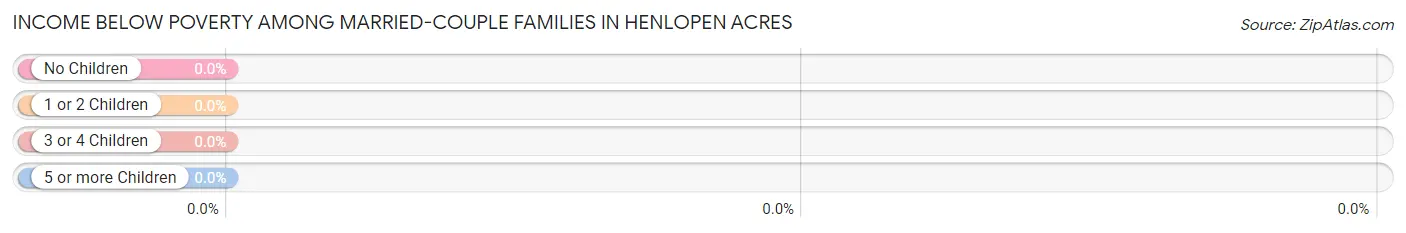
| Children | Above Poverty | Below Poverty |
| No Children | 47 (100.0%) | 0 (0.0%) |
| 1 or 2 Children | 6 (100.0%) | 0 (0.0%) |
| 3 or 4 Children | 0 (0.0%) | 0 (0.0%) |
| 5 or more Children | 0 (0.0%) | 0 (0.0%) |
| Total | 53 (100.0%) | 0 (0.0%) |
Income Below Poverty Among Single-Parent Households in Henlopen Acres
| Children | Single Father | Single Mother |
| No Children | 0 (0.0%) | 0 (0.0%) |
| 1 or 2 Children | 0 (0.0%) | 0 (0.0%) |
| 3 or 4 Children | 0 (0.0%) | 0 (0.0%) |
| 5 or more Children | 0 (0.0%) | 0 (0.0%) |
| Total | 0 (0.0%) | 0 (0.0%) |
Income Below Poverty Among Married-Couple vs Single-Parent Households in Henlopen Acres
| Children | Married-Couple Families | Single-Parent Households |
| No Children | 0 (0.0%) | 0 (0.0%) |
| 1 or 2 Children | 0 (0.0%) | 0 (0.0%) |
| 3 or 4 Children | 0 (0.0%) | 0 (0.0%) |
| 5 or more Children | 0 (0.0%) | 0 (0.0%) |
| Total | 0 (0.0%) | 0 (0.0%) |
Race in Henlopen Acres
The most populous races in Henlopen Acres are White / Caucasian (182 | 94.3%), and Two or more Races (11 | 5.7%).
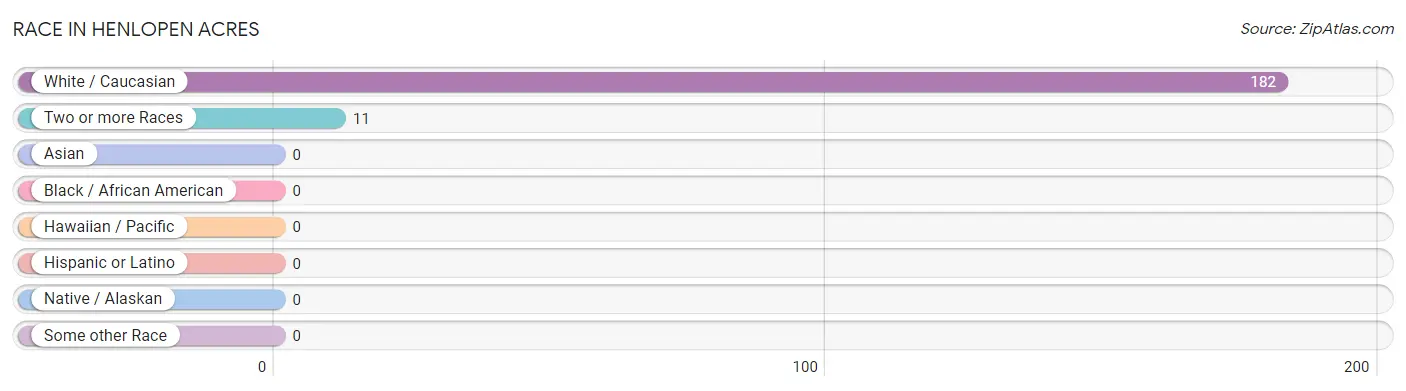
| Race | # Population | % Population |
| Asian | 0 | 0.0% |
| Black / African American | 0 | 0.0% |
| Hawaiian / Pacific | 0 | 0.0% |
| Hispanic or Latino | 0 | 0.0% |
| Native / Alaskan | 0 | 0.0% |
| White / Caucasian | 182 | 94.3% |
| Two or more Races | 11 | 5.7% |
| Some other Race | 0 | 0.0% |
| Total | 193 | 100.0% |
Ancestry in Henlopen Acres
The most populous ancestries reported in Henlopen Acres are English (52 | 26.9%), Scottish (43 | 22.3%), Irish (28 | 14.5%), Polish (22 | 11.4%), and German (21 | 10.9%), together accounting for 86.0% of all Henlopen Acres residents.
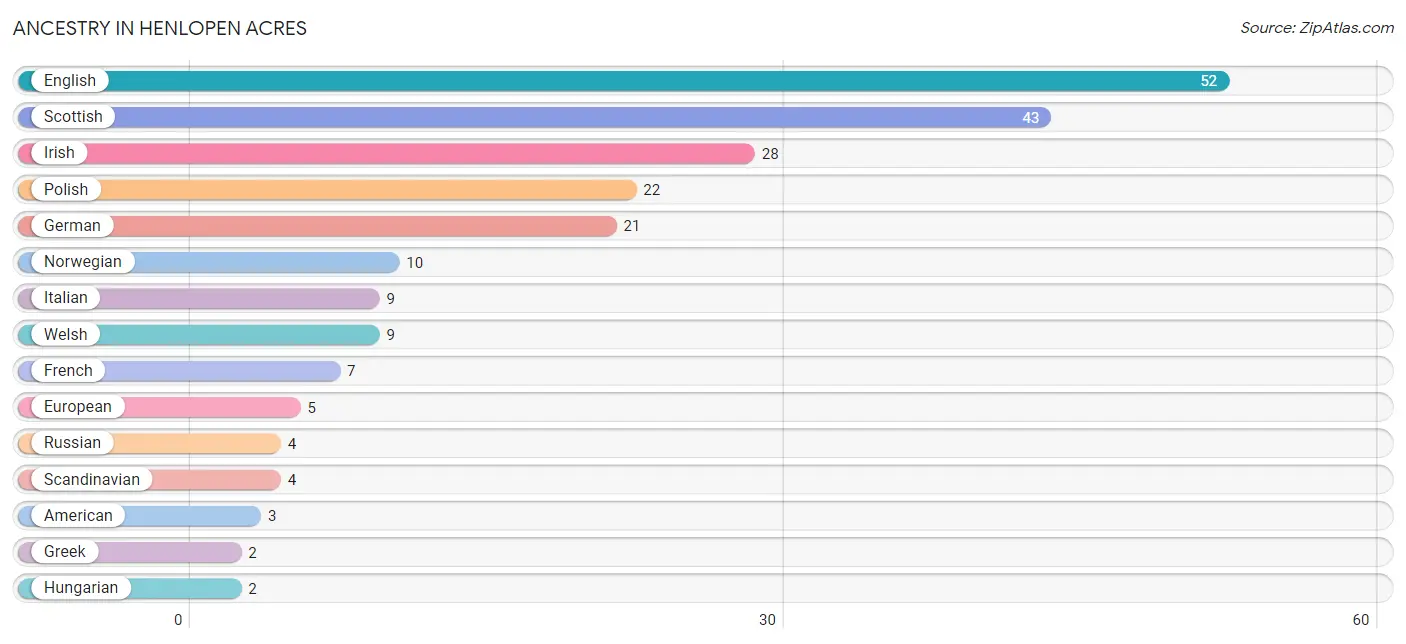
| Ancestry | # Population | % Population |
| American | 3 | 1.5% |
| Arab | 1 | 0.5% |
| Austrian | 1 | 0.5% |
| British | 1 | 0.5% |
| English | 52 | 26.9% |
| European | 5 | 2.6% |
| French | 7 | 3.6% |
| German | 21 | 10.9% |
| Greek | 2 | 1.0% |
| Hungarian | 2 | 1.0% |
| Irish | 28 | 14.5% |
| Italian | 9 | 4.7% |
| Norwegian | 10 | 5.2% |
| Polish | 22 | 11.4% |
| Russian | 4 | 2.1% |
| Scandinavian | 4 | 2.1% |
| Scotch-Irish | 2 | 1.0% |
| Scottish | 43 | 22.3% |
| Serbian | 2 | 1.0% |
| Slovak | 1 | 0.5% |
| Swiss | 2 | 1.0% |
| Syrian | 1 | 0.5% |
| Welsh | 9 | 4.7% | View All 23 Rows |
Immigrants in Henlopen Acres
The most numerous immigrant groups reported in Henlopen Acres came from Eastern Europe (2 | 1.0%), Europe (2 | 1.0%), Asia (1 | 0.5%), Syria (1 | 0.5%), and Western Asia (1 | 0.5%), together accounting for 3.6% of all Henlopen Acres residents.
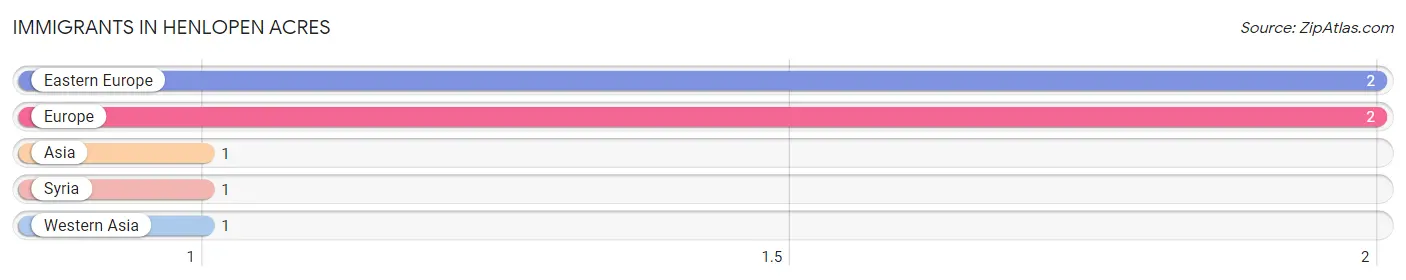
| Immigration Origin | # Population | % Population |
| Asia | 1 | 0.5% |
| Eastern Europe | 2 | 1.0% |
| Europe | 2 | 1.0% |
| Syria | 1 | 0.5% |
| Western Asia | 1 | 0.5% | View All 5 Rows |
Sex and Age in Henlopen Acres
Sex and Age in Henlopen Acres
The most populous age groups in Henlopen Acres are 75 to 79 Years (18 | 19.6%) for men and 85 Years and over (18 | 17.8%) for women.
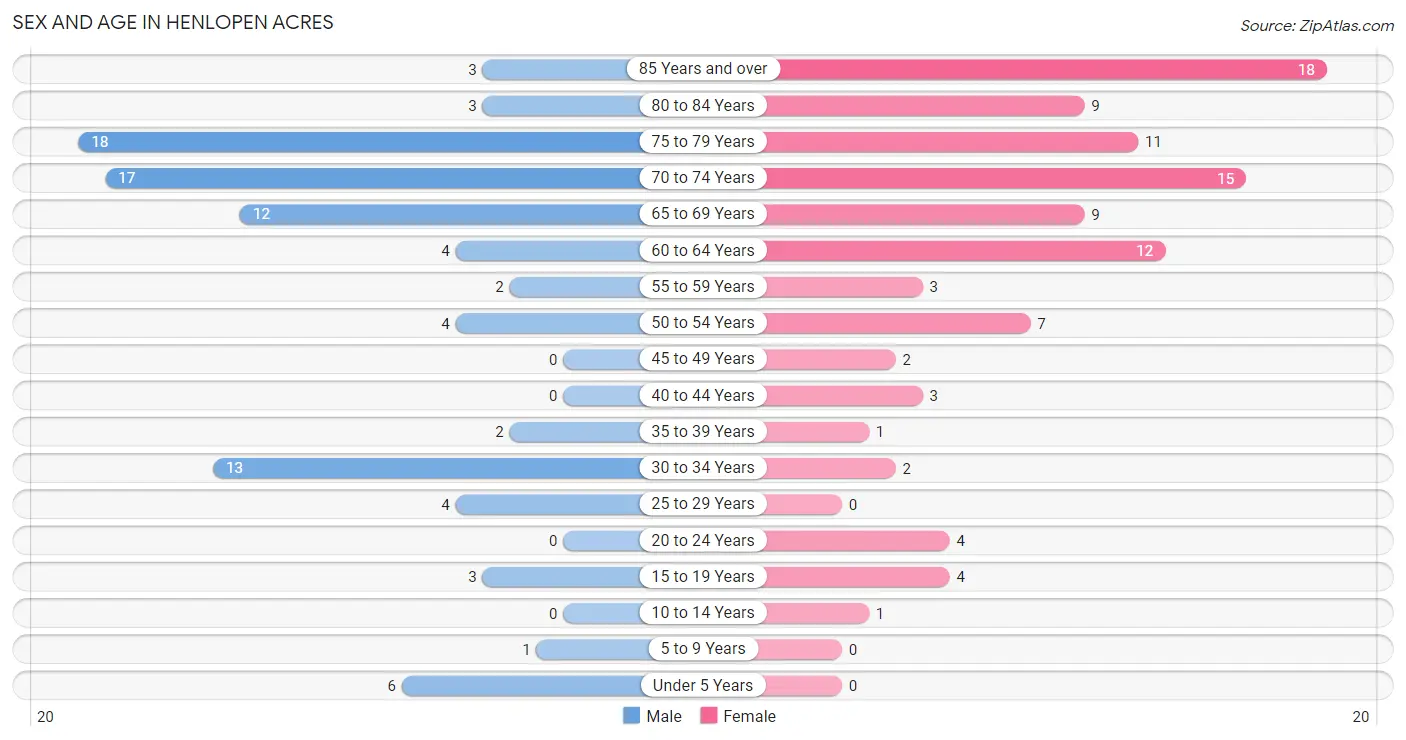
| Age Bracket | Male | Female |
| Under 5 Years | 6 (6.5%) | 0 (0.0%) |
| 5 to 9 Years | 1 (1.1%) | 0 (0.0%) |
| 10 to 14 Years | 0 (0.0%) | 1 (1.0%) |
| 15 to 19 Years | 3 (3.3%) | 4 (4.0%) |
| 20 to 24 Years | 0 (0.0%) | 4 (4.0%) |
| 25 to 29 Years | 4 (4.3%) | 0 (0.0%) |
| 30 to 34 Years | 13 (14.1%) | 2 (2.0%) |
| 35 to 39 Years | 2 (2.2%) | 1 (1.0%) |
| 40 to 44 Years | 0 (0.0%) | 3 (3.0%) |
| 45 to 49 Years | 0 (0.0%) | 2 (2.0%) |
| 50 to 54 Years | 4 (4.3%) | 7 (6.9%) |
| 55 to 59 Years | 2 (2.2%) | 3 (3.0%) |
| 60 to 64 Years | 4 (4.3%) | 12 (11.9%) |
| 65 to 69 Years | 12 (13.0%) | 9 (8.9%) |
| 70 to 74 Years | 17 (18.5%) | 15 (14.8%) |
| 75 to 79 Years | 18 (19.6%) | 11 (10.9%) |
| 80 to 84 Years | 3 (3.3%) | 9 (8.9%) |
| 85 Years and over | 3 (3.3%) | 18 (17.8%) |
| Total | 92 (100.0%) | 101 (100.0%) |
Families and Households in Henlopen Acres
Median Family Size in Henlopen Acres
The median family size in Henlopen Acres is 2.22 persons per family, with single male/father families (5 | 7.3%) accounting for the largest median family size of 2.8 persons per family. On the other hand, married-couple families (53 | 77.9%) represent the smallest median family size with 2.06 persons per family.
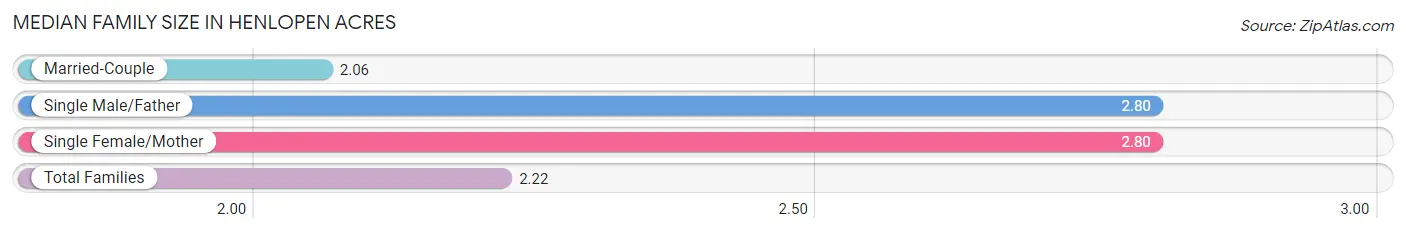
| Family Type | # Families | Family Size |
| Married-Couple | 53 (77.9%) | 2.06 |
| Single Male/Father | 5 (7.3%) | 2.80 |
| Single Female/Mother | 10 (14.7%) | 2.80 |
| Total Families | 68 (100.0%) | 2.22 |
Median Household Size in Henlopen Acres
The median household size in Henlopen Acres is 1.87 persons per household, with single female/mother households (10 | 9.7%) accounting for the largest median household size of 3 persons per household. non-family households (35 | 34.0%) represent the smallest median household size with 1.14 persons per household.
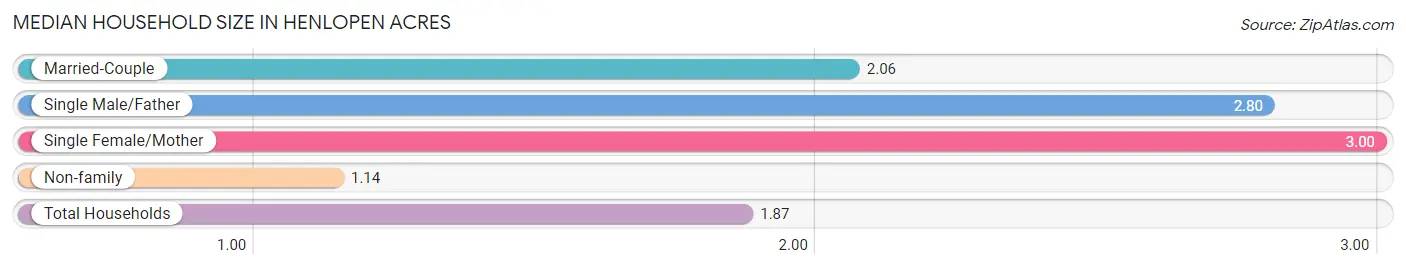
| Household Type | # Households | Household Size |
| Married-Couple | 53 (51.5%) | 2.06 |
| Single Male/Father | 5 (4.9%) | 2.80 |
| Single Female/Mother | 10 (9.7%) | 3.00 |
| Non-family | 35 (34.0%) | 1.14 |
| Total Households | 103 (100.0%) | 1.87 |
Household Size by Marriage Status in Henlopen Acres
Out of a total of 103 households in Henlopen Acres, 68 (66.0%) are family households, while 35 (34.0%) are nonfamily households. The most numerous type of family households are 2-person households, comprising 52, and the most common type of nonfamily households are 1-person households, comprising 31.
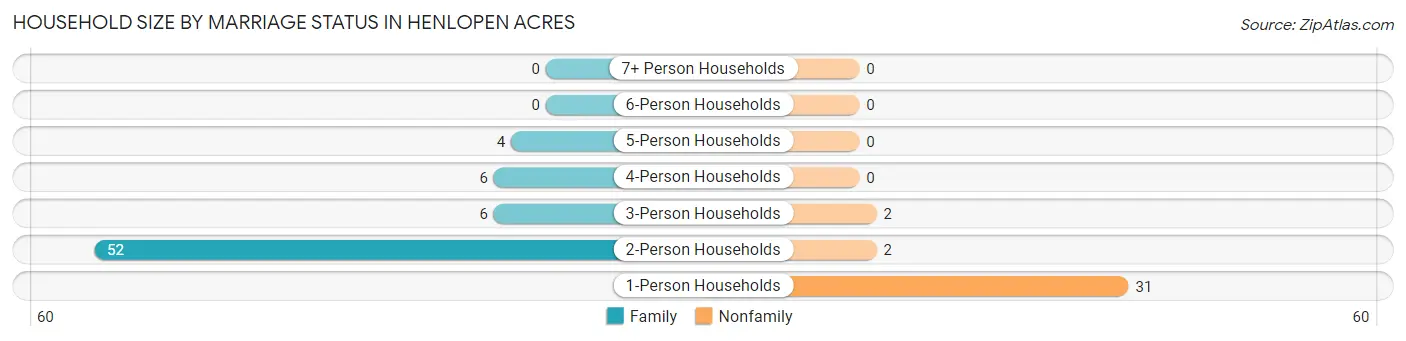
| Household Size | Family Households | Nonfamily Households |
| 1-Person Households | - | 31 (30.1%) |
| 2-Person Households | 52 (50.5%) | 2 (1.9%) |
| 3-Person Households | 6 (5.8%) | 2 (1.9%) |
| 4-Person Households | 6 (5.8%) | 0 (0.0%) |
| 5-Person Households | 4 (3.9%) | 0 (0.0%) |
| 6-Person Households | 0 (0.0%) | 0 (0.0%) |
| 7+ Person Households | 0 (0.0%) | 0 (0.0%) |
| Total | 68 (66.0%) | 35 (34.0%) |
Female Fertility in Henlopen Acres
Fertility by Age in Henlopen Acres
Average fertility rate in Henlopen Acres is 56.0 births per 1,000 women. Women in the age bracket of 35 to 50 years have the highest fertility rate with 125.0 births per 1,000 women. Women in the age bracket of 35 to 50 years acount for 100.0% of all women with births.
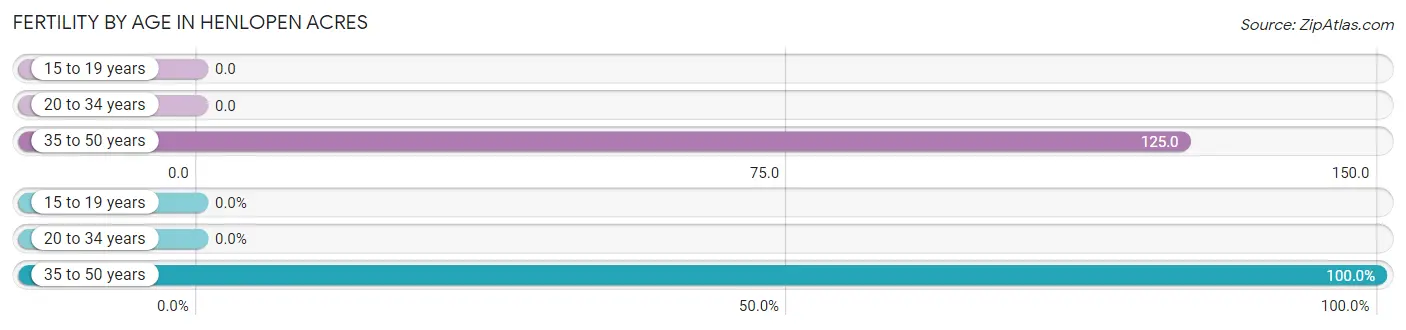
| Age Bracket | Women with Births | Births / 1,000 Women |
| 15 to 19 years | 0 (0.0%) | 0.0 |
| 20 to 34 years | 0 (0.0%) | 0.0 |
| 35 to 50 years | 1 (100.0%) | 125.0 |
| Total | 1 (100.0%) | 56.0 |
Fertility by Age by Marriage Status in Henlopen Acres
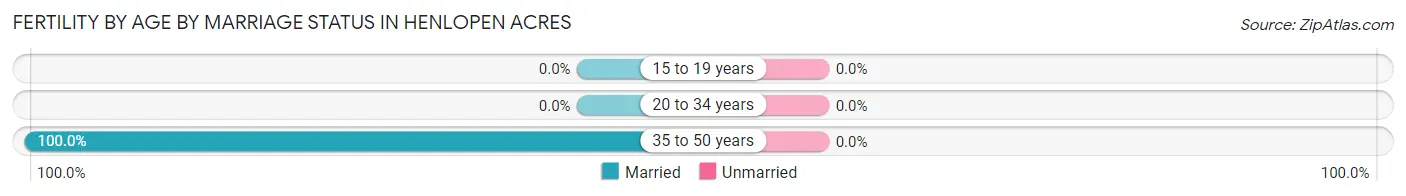
| Age Bracket | Married | Unmarried |
| 15 to 19 years | 0 (0.0%) | 0 (0.0%) |
| 20 to 34 years | 0 (0.0%) | 0 (0.0%) |
| 35 to 50 years | 1 (100.0%) | 0 (0.0%) |
| Total | 1 (100.0%) | 0 (0.0%) |
Fertility by Education in Henlopen Acres
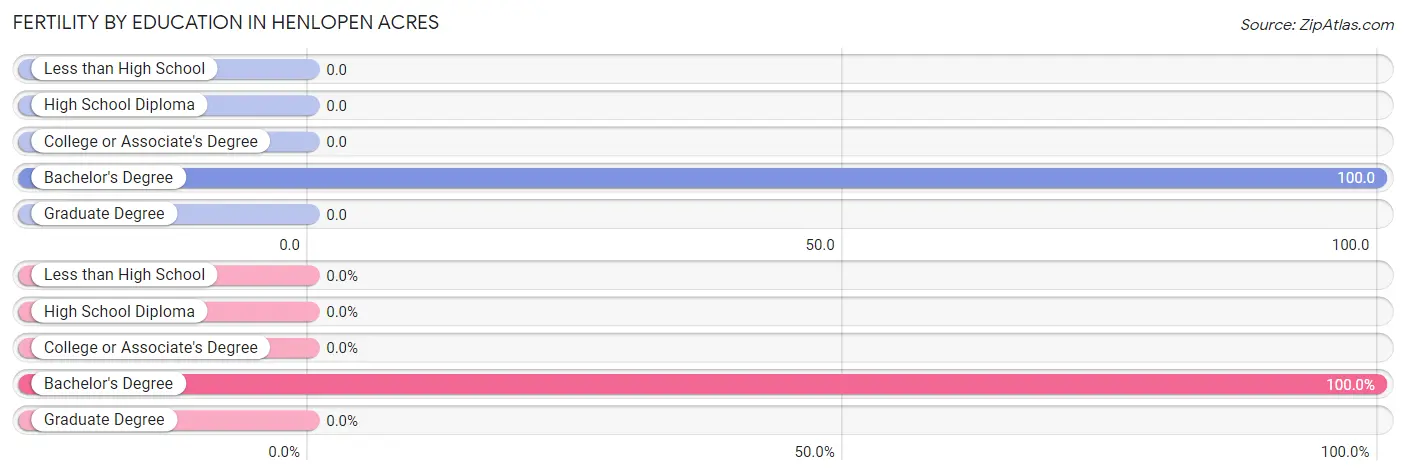
| Educational Attainment | Women with Births | Births / 1,000 Women |
| Less than High School | 0 (0.0%) | 0.0 |
| High School Diploma | 0 (0.0%) | 0.0 |
| College or Associate's Degree | 0 (0.0%) | 0.0 |
| Bachelor's Degree | 1 (100.0%) | 100.0 |
| Graduate Degree | 0 (0.0%) | 0.0 |
| Total | 1 (100.0%) | 56.0 |
Fertility by Education by Marriage Status in Henlopen Acres
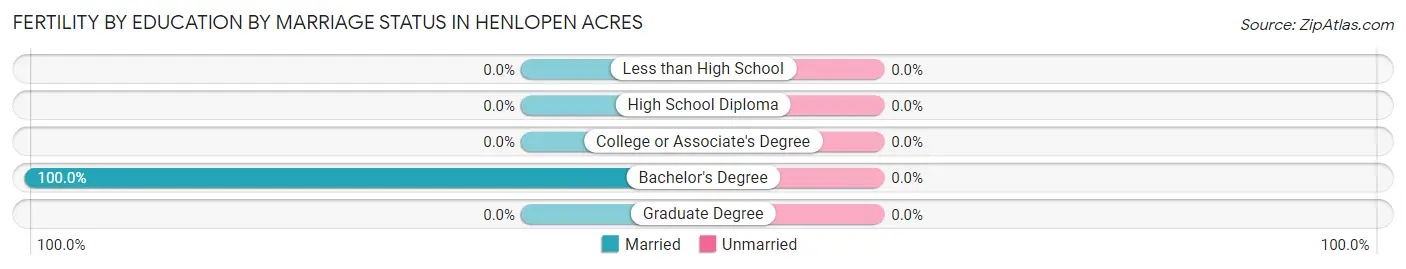
| Educational Attainment | Married | Unmarried |
| Less than High School | 0 (0.0%) | 0 (0.0%) |
| High School Diploma | 0 (0.0%) | 0 (0.0%) |
| College or Associate's Degree | 0 (0.0%) | 0 (0.0%) |
| Bachelor's Degree | 1 (100.0%) | 0 (0.0%) |
| Graduate Degree | 0 (0.0%) | 0 (0.0%) |
| Total | 1 (100.0%) | 0 (0.0%) |
Employment Characteristics in Henlopen Acres
Employment by Class of Employer in Henlopen Acres
Among the 64 employed individuals in Henlopen Acres, private company employees (21 | 32.8%), self-employed (incorporated) (19 | 29.7%), and self-employed (not incorporated) (10 | 15.6%) make up the most common classes of employment.
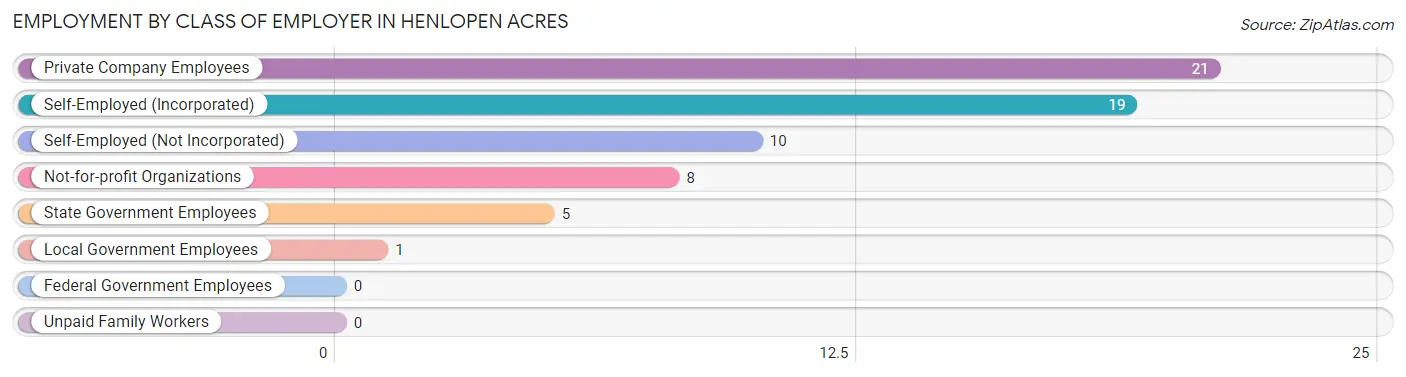
| Employer Class | # Employees | % Employees |
| Private Company Employees | 21 | 32.8% |
| Self-Employed (Incorporated) | 19 | 29.7% |
| Self-Employed (Not Incorporated) | 10 | 15.6% |
| Not-for-profit Organizations | 8 | 12.5% |
| Local Government Employees | 1 | 1.6% |
| State Government Employees | 5 | 7.8% |
| Federal Government Employees | 0 | 0.0% |
| Unpaid Family Workers | 0 | 0.0% |
| Total | 64 | 100.0% |
Employment Status by Age in Henlopen Acres
According to the labor force statistics for Henlopen Acres, out of the total population over 16 years of age (181), 36.5% or 66 individuals are in the labor force, with 3.0% or 2 of them unemployed. The age group with the highest labor force participation rate is 35 to 44 years, with 100.0% or 6 individuals in the labor force. Within the labor force, the 35 to 44 years age range has the highest percentage of unemployed individuals, with 33.3% or 2 of them being unemployed.
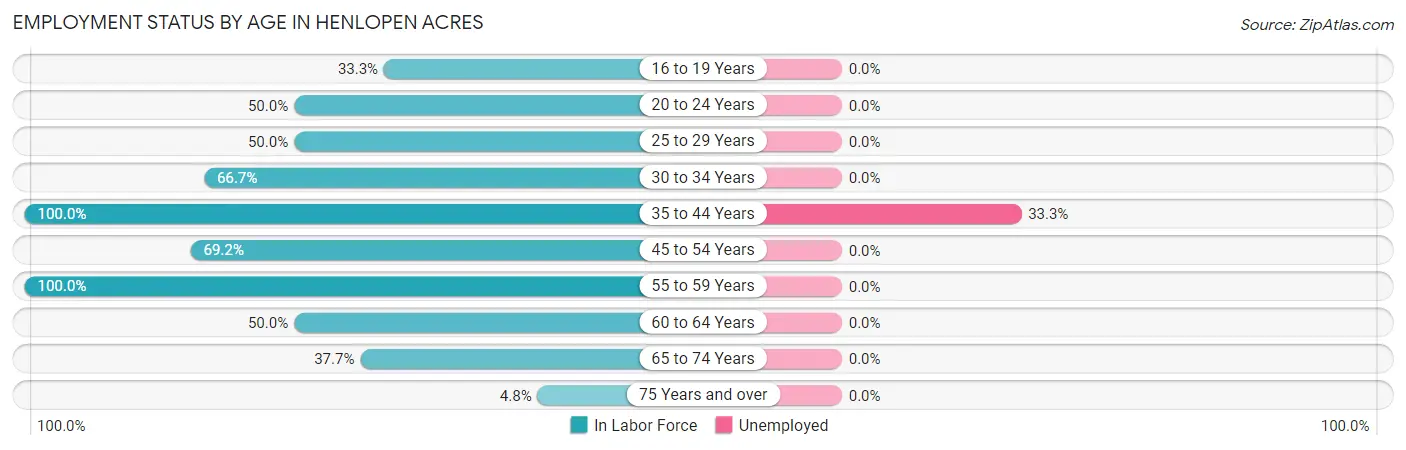
| Age Bracket | In Labor Force | Unemployed |
| 16 to 19 Years | 1 (33.3%) | 0 (0.0%) |
| 20 to 24 Years | 2 (50.0%) | 0 (0.0%) |
| 25 to 29 Years | 2 (50.0%) | 0 (0.0%) |
| 30 to 34 Years | 10 (66.7%) | 0 (0.0%) |
| 35 to 44 Years | 6 (100.0%) | 2 (33.3%) |
| 45 to 54 Years | 9 (69.2%) | 0 (0.0%) |
| 55 to 59 Years | 5 (100.0%) | 0 (0.0%) |
| 60 to 64 Years | 8 (50.0%) | 0 (0.0%) |
| 65 to 74 Years | 20 (37.7%) | 0 (0.0%) |
| 75 Years and over | 3 (4.8%) | 0 (0.0%) |
| Total | 66 (36.5%) | 2 (3.0%) |
Employment Status by Educational Attainment in Henlopen Acres
According to labor force statistics for Henlopen Acres, 67.8% of individuals (40) out of the total population between 25 and 64 years of age (59) are in the labor force, with 5.0% or 2 of them being unemployed. The group with the highest labor force participation rate are those with the educational attainment of college / associate degree, with 100.0% or 1 individuals in the labor force. Within the labor force, individuals with bachelor's degree or higher education have the highest percentage of unemployment, with 5.9% or 2 of them being unemployed.
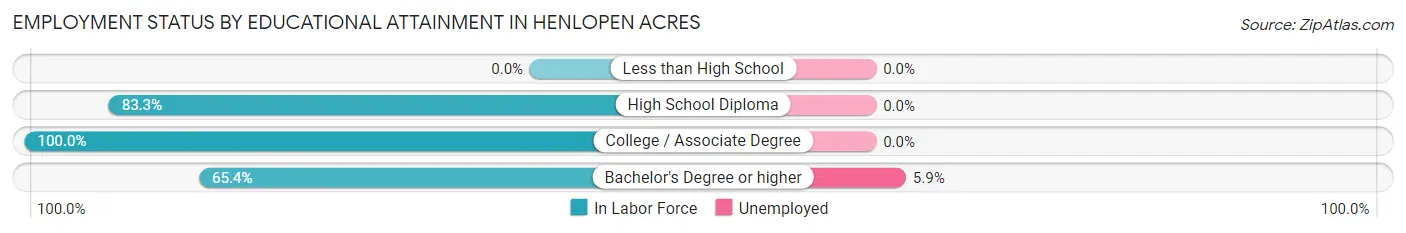
| Educational Attainment | In Labor Force | Unemployed |
| Less than High School | 0 (0.0%) | 0 (0.0%) |
| High School Diploma | 5 (83.3%) | 0 (0.0%) |
| College / Associate Degree | 1 (100.0%) | 0 (0.0%) |
| Bachelor's Degree or higher | 34 (65.4%) | 3 (5.9%) |
| Total | 40 (67.8%) | 3 (5.0%) |
Employment Occupations by Sex in Henlopen Acres
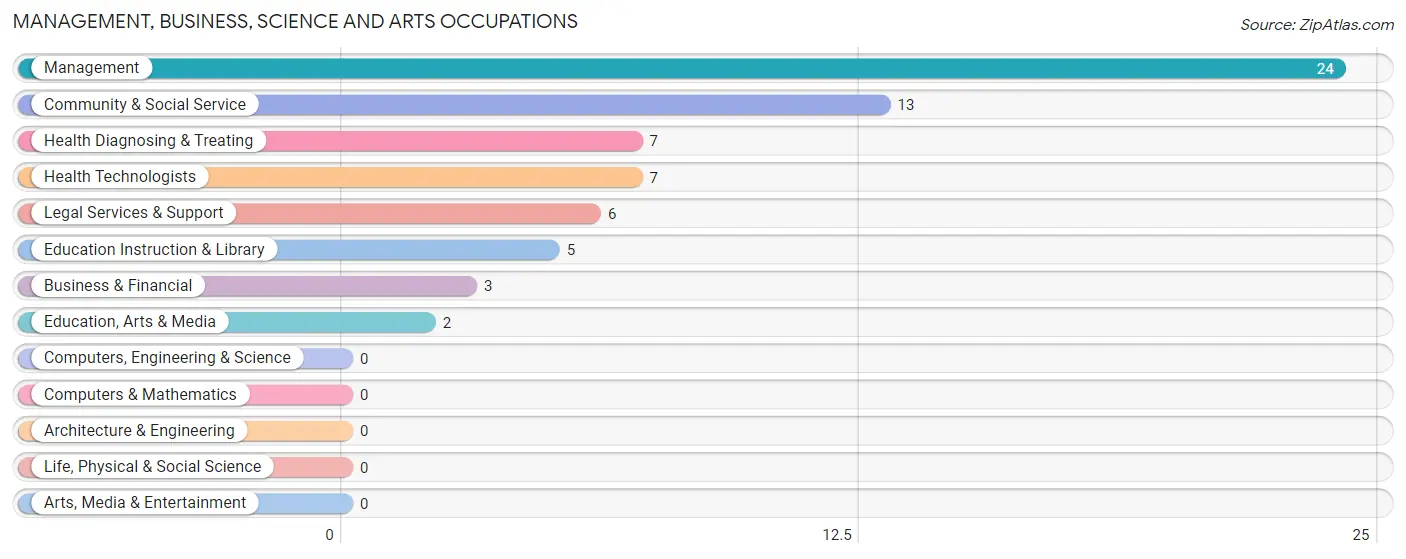
Management, Business, Science and Arts Occupations
The most common Management, Business, Science and Arts occupations in Henlopen Acres are Management (24 | 37.5%), Community & Social Service (13 | 20.3%), Health Diagnosing & Treating (7 | 10.9%), Health Technologists (7 | 10.9%), and Legal Services & Support (6 | 9.4%).
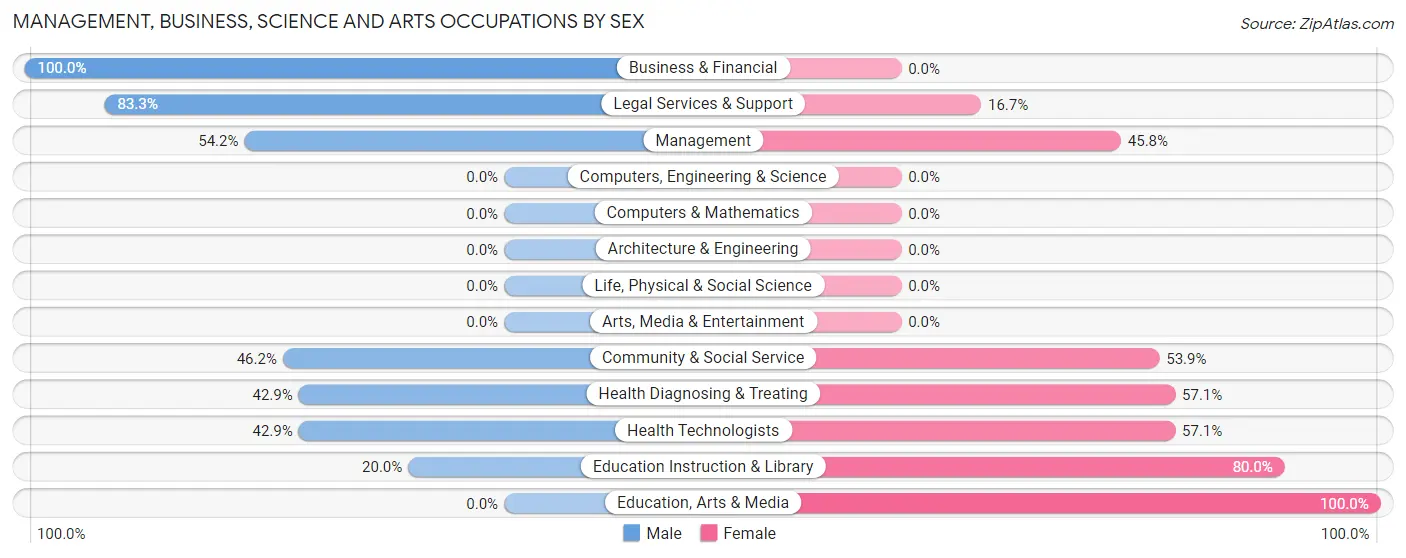
Management, Business, Science and Arts Occupations by Sex
Within the Management, Business, Science and Arts occupations in Henlopen Acres, the most male-oriented occupations are Business & Financial (100.0%), Legal Services & Support (83.3%), and Management (54.2%), while the most female-oriented occupations are Education, Arts & Media (100.0%), Education Instruction & Library (80.0%), and Health Diagnosing & Treating (57.1%).
| Occupation | Male | Female |
| Management | 13 (54.2%) | 11 (45.8%) |
| Business & Financial | 3 (100.0%) | 0 (0.0%) |
| Computers, Engineering & Science | 0 (0.0%) | 0 (0.0%) |
| Computers & Mathematics | 0 (0.0%) | 0 (0.0%) |
| Architecture & Engineering | 0 (0.0%) | 0 (0.0%) |
| Life, Physical & Social Science | 0 (0.0%) | 0 (0.0%) |
| Community & Social Service | 6 (46.2%) | 7 (53.8%) |
| Education, Arts & Media | 0 (0.0%) | 2 (100.0%) |
| Legal Services & Support | 5 (83.3%) | 1 (16.7%) |
| Education Instruction & Library | 1 (20.0%) | 4 (80.0%) |
| Arts, Media & Entertainment | 0 (0.0%) | 0 (0.0%) |
| Health Diagnosing & Treating | 3 (42.9%) | 4 (57.1%) |
| Health Technologists | 3 (42.9%) | 4 (57.1%) |
| Total (Category) | 25 (53.2%) | 22 (46.8%) |
| Total (Overall) | 37 (57.8%) | 27 (42.2%) |
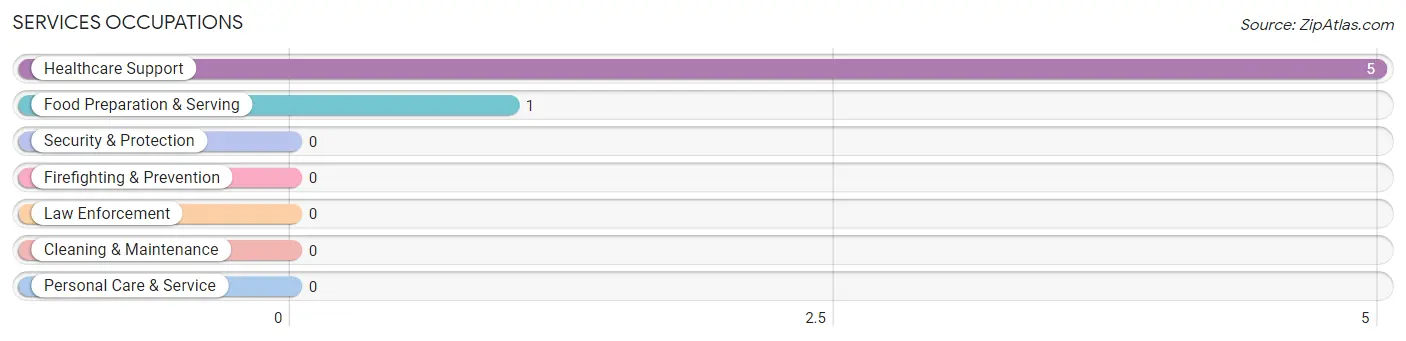
Services Occupations
The most common Services occupations in Henlopen Acres are Healthcare Support (5 | 7.8%), and Food Preparation & Serving (1 | 1.6%).
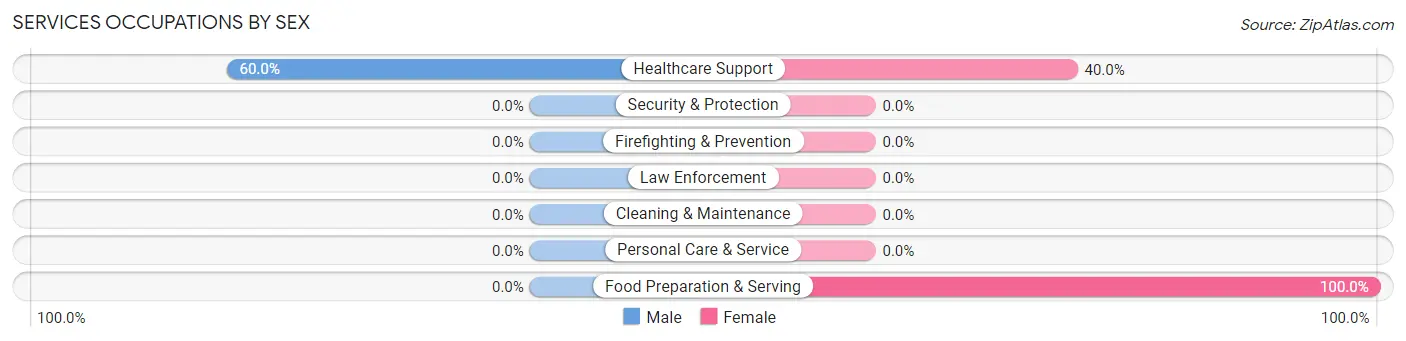
Services Occupations by Sex
| Occupation | Male | Female |
| Healthcare Support | 3 (60.0%) | 2 (40.0%) |
| Security & Protection | 0 (0.0%) | 0 (0.0%) |
| Firefighting & Prevention | 0 (0.0%) | 0 (0.0%) |
| Law Enforcement | 0 (0.0%) | 0 (0.0%) |
| Food Preparation & Serving | 0 (0.0%) | 1 (100.0%) |
| Cleaning & Maintenance | 0 (0.0%) | 0 (0.0%) |
| Personal Care & Service | 0 (0.0%) | 0 (0.0%) |
| Total (Category) | 3 (50.0%) | 3 (50.0%) |
| Total (Overall) | 37 (57.8%) | 27 (42.2%) |
Sales and Office Occupations
The most common Sales and Office occupations in Henlopen Acres are , and Sales & Related (6 | 9.4%).
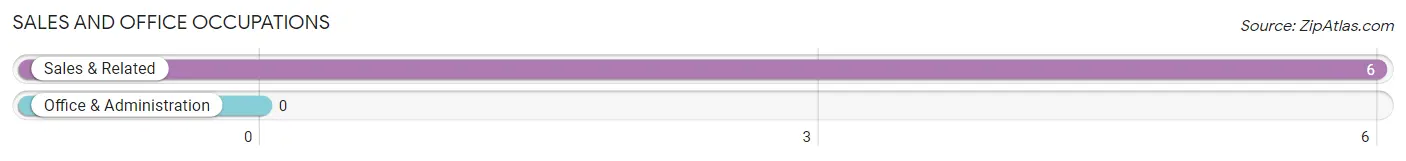
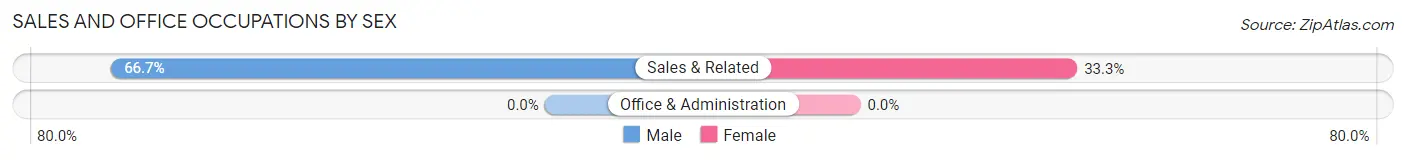
Sales and Office Occupations by Sex
| Occupation | Male | Female |
| Sales & Related | 4 (66.7%) | 2 (33.3%) |
| Office & Administration | 0 (0.0%) | 0 (0.0%) |
| Total (Category) | 4 (66.7%) | 2 (33.3%) |
| Total (Overall) | 37 (57.8%) | 27 (42.2%) |
Natural Resources, Construction and Maintenance Occupations
The most common Natural Resources, Construction and Maintenance occupations in Henlopen Acres are , and Construction & Extraction (5 | 7.8%).
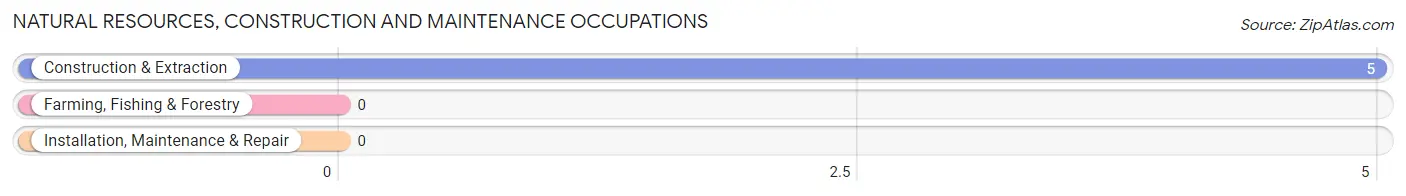
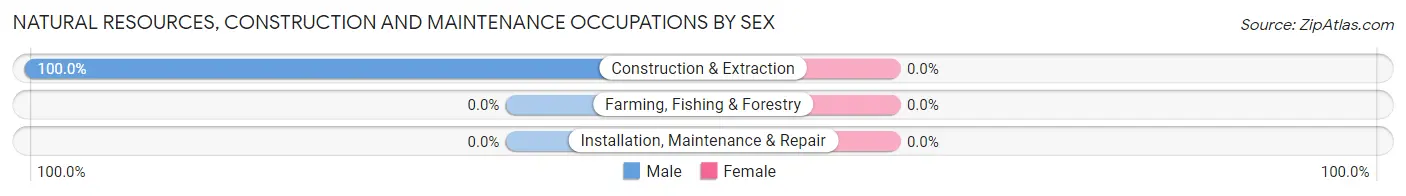
Natural Resources, Construction and Maintenance Occupations by Sex
| Occupation | Male | Female |
| Farming, Fishing & Forestry | 0 (0.0%) | 0 (0.0%) |
| Construction & Extraction | 5 (100.0%) | 0 (0.0%) |
| Installation, Maintenance & Repair | 0 (0.0%) | 0 (0.0%) |
| Total (Category) | 5 (100.0%) | 0 (0.0%) |
| Total (Overall) | 37 (57.8%) | 27 (42.2%) |
Production, Transportation and Moving Occupations
Production, Transportation and Moving Occupations by Sex
| Occupation | Male | Female |
| Production | 0 (0.0%) | 0 (0.0%) |
| Transportation | 0 (0.0%) | 0 (0.0%) |
| Material Moving | 0 (0.0%) | 0 (0.0%) |
| Total (Category) | 0 (0.0%) | 0 (0.0%) |
| Total (Overall) | 37 (57.8%) | 27 (42.2%) |
Employment Industries by Sex in Henlopen Acres
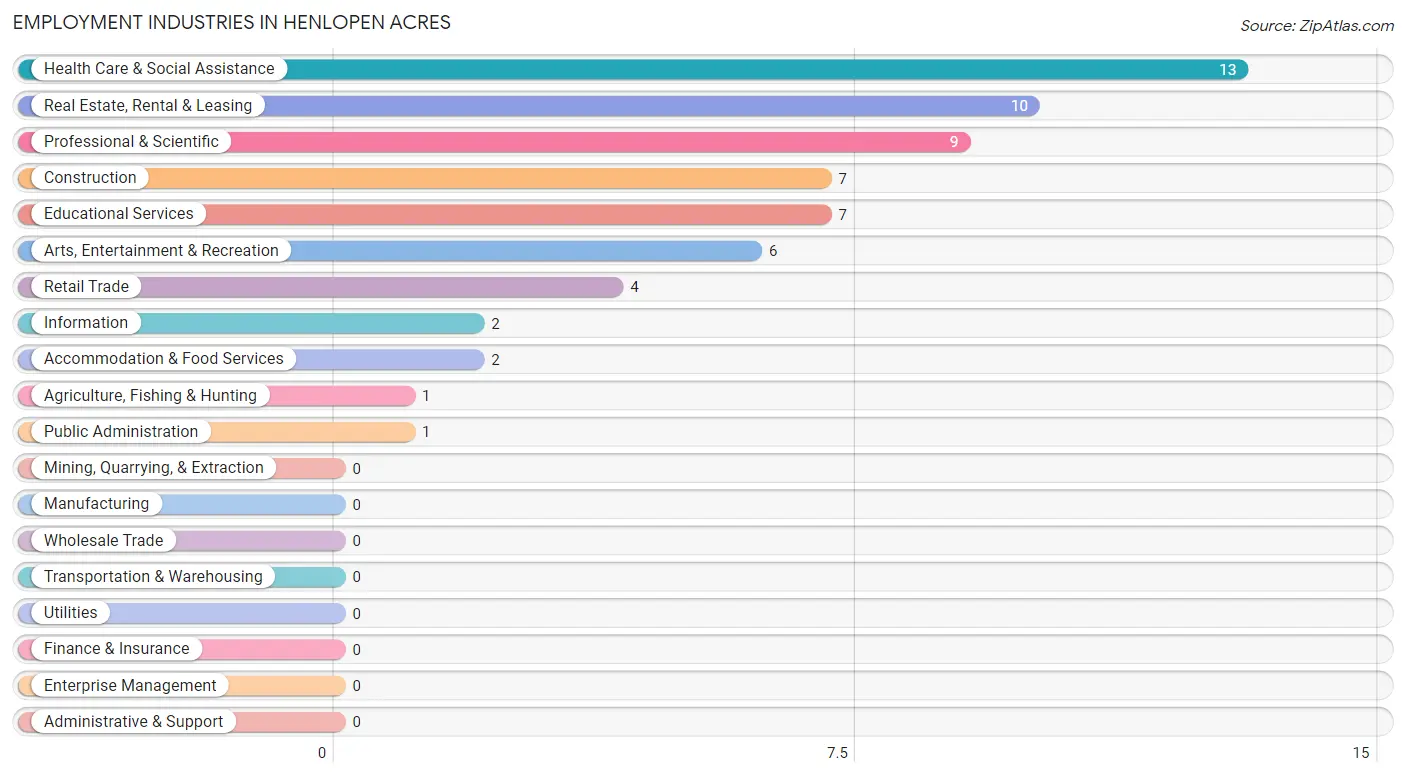
Employment Industries in Henlopen Acres
The major employment industries in Henlopen Acres include Health Care & Social Assistance (13 | 20.3%), Real Estate, Rental & Leasing (10 | 15.6%), Professional & Scientific (9 | 14.1%), Construction (7 | 10.9%), and Educational Services (7 | 10.9%).
Employment Industries by Sex in Henlopen Acres
The Henlopen Acres industries that see more men than women are Construction (100.0%), Retail Trade (100.0%), and Professional & Scientific (100.0%), whereas the industries that tend to have a higher number of women are Agriculture, Fishing & Hunting (100.0%), Information (100.0%), and Arts, Entertainment & Recreation (100.0%).
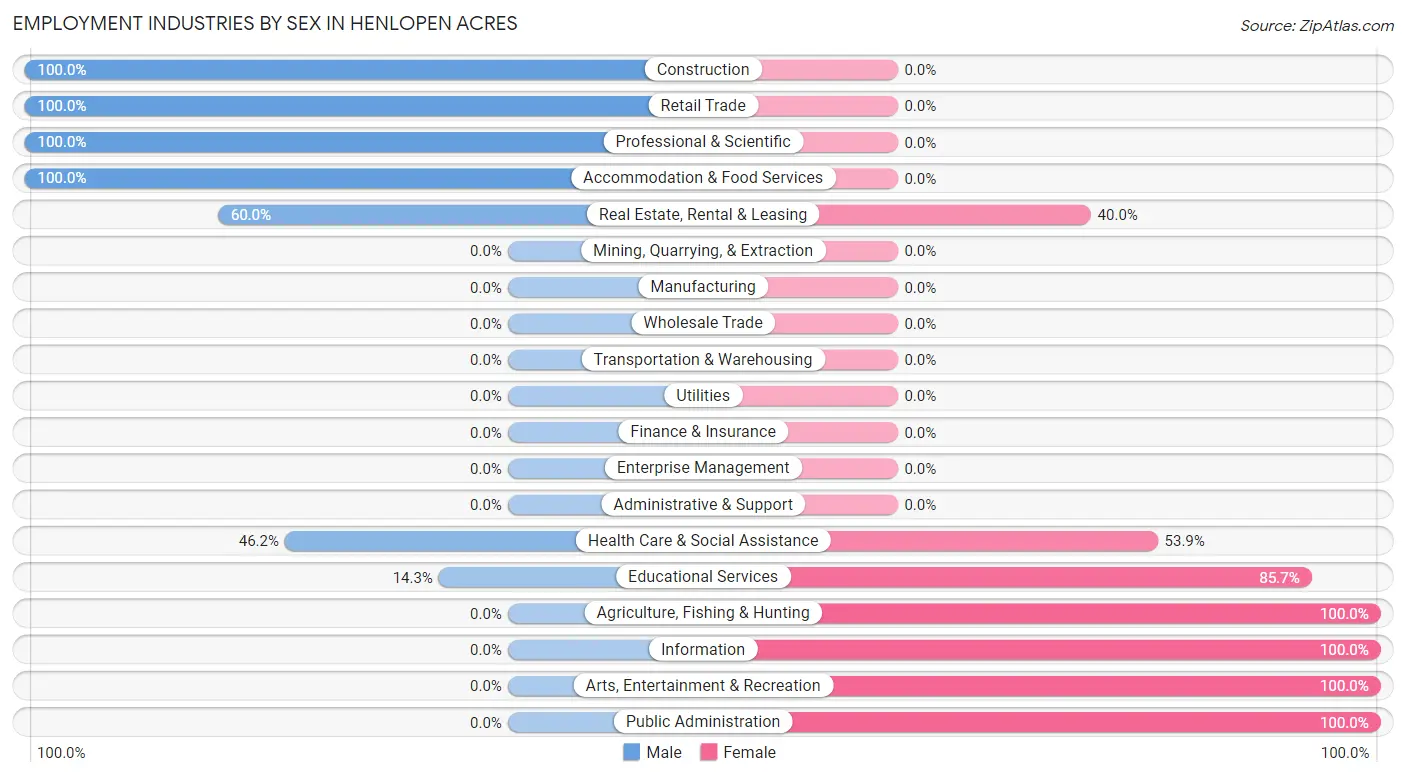
| Industry | Male | Female |
| Agriculture, Fishing & Hunting | 0 (0.0%) | 1 (100.0%) |
| Mining, Quarrying, & Extraction | 0 (0.0%) | 0 (0.0%) |
| Construction | 7 (100.0%) | 0 (0.0%) |
| Manufacturing | 0 (0.0%) | 0 (0.0%) |
| Wholesale Trade | 0 (0.0%) | 0 (0.0%) |
| Retail Trade | 4 (100.0%) | 0 (0.0%) |
| Transportation & Warehousing | 0 (0.0%) | 0 (0.0%) |
| Utilities | 0 (0.0%) | 0 (0.0%) |
| Information | 0 (0.0%) | 2 (100.0%) |
| Finance & Insurance | 0 (0.0%) | 0 (0.0%) |
| Real Estate, Rental & Leasing | 6 (60.0%) | 4 (40.0%) |
| Professional & Scientific | 9 (100.0%) | 0 (0.0%) |
| Enterprise Management | 0 (0.0%) | 0 (0.0%) |
| Administrative & Support | 0 (0.0%) | 0 (0.0%) |
| Educational Services | 1 (14.3%) | 6 (85.7%) |
| Health Care & Social Assistance | 6 (46.2%) | 7 (53.8%) |
| Arts, Entertainment & Recreation | 0 (0.0%) | 6 (100.0%) |
| Accommodation & Food Services | 2 (100.0%) | 0 (0.0%) |
| Public Administration | 0 (0.0%) | 1 (100.0%) |
| Total | 37 (57.8%) | 27 (42.2%) |
Education in Henlopen Acres
School Enrollment in Henlopen Acres
The most common levels of schooling among the 20 students in Henlopen Acres are college / undergraduate (9 | 45.0%), high school (4 | 20.0%), and middle school (3 | 15.0%).
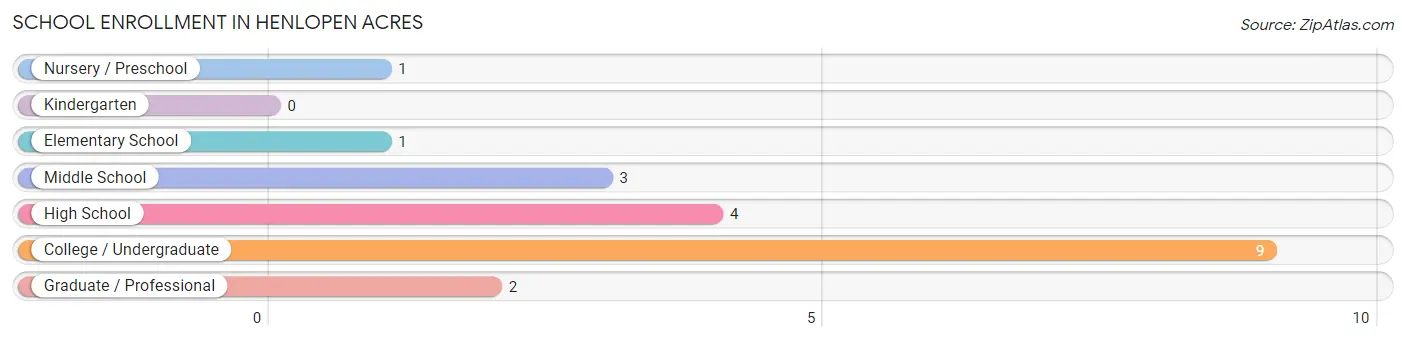
| School Level | # Students | % Students |
| Nursery / Preschool | 1 | 5.0% |
| Kindergarten | 0 | 0.0% |
| Elementary School | 1 | 5.0% |
| Middle School | 3 | 15.0% |
| High School | 4 | 20.0% |
| College / Undergraduate | 9 | 45.0% |
| Graduate / Professional | 2 | 10.0% |
| Total | 20 | 100.0% |
School Enrollment by Age by Funding Source in Henlopen Acres
Out of a total of 20 students who are enrolled in schools in Henlopen Acres, 9 (45.0%) attend a private institution, while the remaining 11 (55.0%) are enrolled in public schools. The age group of 3 to 4 year olds has the highest likelihood of being enrolled in private schools, with 1 (100.0% in the age bracket) enrolled. Conversely, the age group of 18 to 19 year olds has the lowest likelihood of being enrolled in a private school, with 1 (100.0% in the age bracket) attending a public institution.
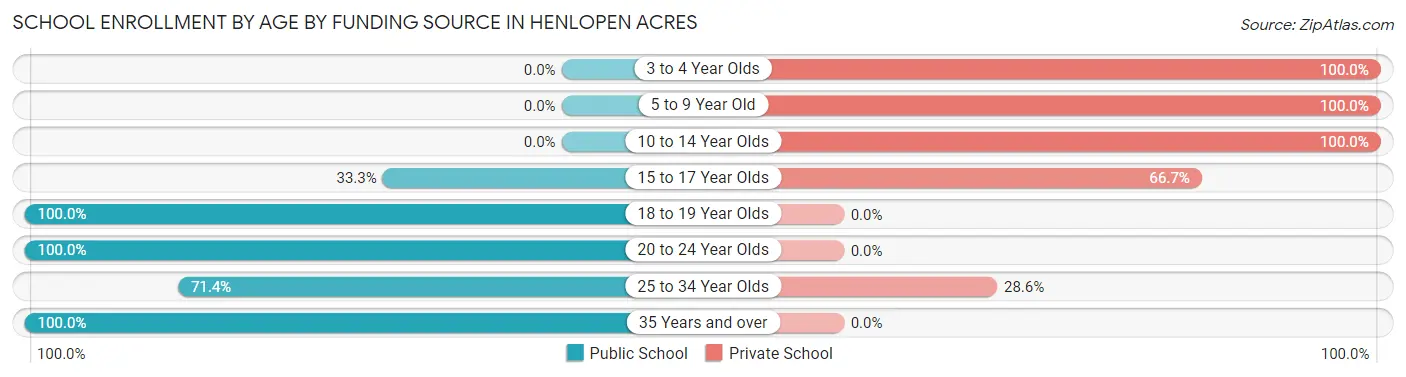
| Age Bracket | Public School | Private School |
| 3 to 4 Year Olds | 0 (0.0%) | 1 (100.0%) |
| 5 to 9 Year Old | 0 (0.0%) | 1 (100.0%) |
| 10 to 14 Year Olds | 0 (0.0%) | 1 (100.0%) |
| 15 to 17 Year Olds | 2 (33.3%) | 4 (66.7%) |
| 18 to 19 Year Olds | 1 (100.0%) | 0 (0.0%) |
| 20 to 24 Year Olds | 2 (100.0%) | 0 (0.0%) |
| 25 to 34 Year Olds | 5 (71.4%) | 2 (28.6%) |
| 35 Years and over | 1 (100.0%) | 0 (0.0%) |
| Total | 11 (55.0%) | 9 (45.0%) |
Educational Attainment by Field of Study in Henlopen Acres
Education (44 | 27.5%), social sciences (23 | 14.4%), business (23 | 14.4%), liberal arts & history (16 | 10.0%), and visual & performing arts (16 | 10.0%) are the most common fields of study among 160 individuals in Henlopen Acres who have obtained a bachelor's degree or higher.
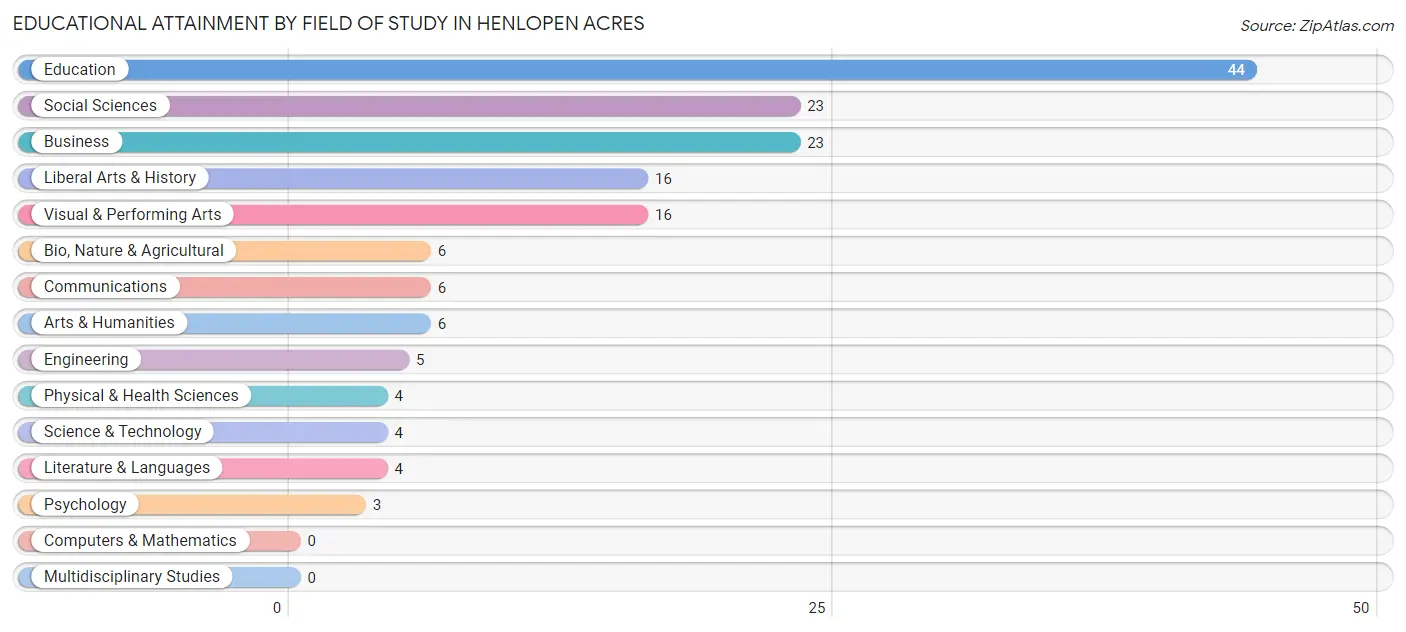
| Field of Study | # Graduates | % Graduates |
| Computers & Mathematics | 0 | 0.0% |
| Bio, Nature & Agricultural | 6 | 3.7% |
| Physical & Health Sciences | 4 | 2.5% |
| Psychology | 3 | 1.9% |
| Social Sciences | 23 | 14.4% |
| Engineering | 5 | 3.1% |
| Multidisciplinary Studies | 0 | 0.0% |
| Science & Technology | 4 | 2.5% |
| Business | 23 | 14.4% |
| Education | 44 | 27.5% |
| Literature & Languages | 4 | 2.5% |
| Liberal Arts & History | 16 | 10.0% |
| Visual & Performing Arts | 16 | 10.0% |
| Communications | 6 | 3.7% |
| Arts & Humanities | 6 | 3.7% |
| Total | 160 | 100.0% |
Transportation & Commute in Henlopen Acres
Vehicle Availability by Sex in Henlopen Acres
The most prevalent vehicle ownership categories in Henlopen Acres are males with 2 vehicles (21, accounting for 56.8%) and females with 2 vehicles (15, making up 77.8%).
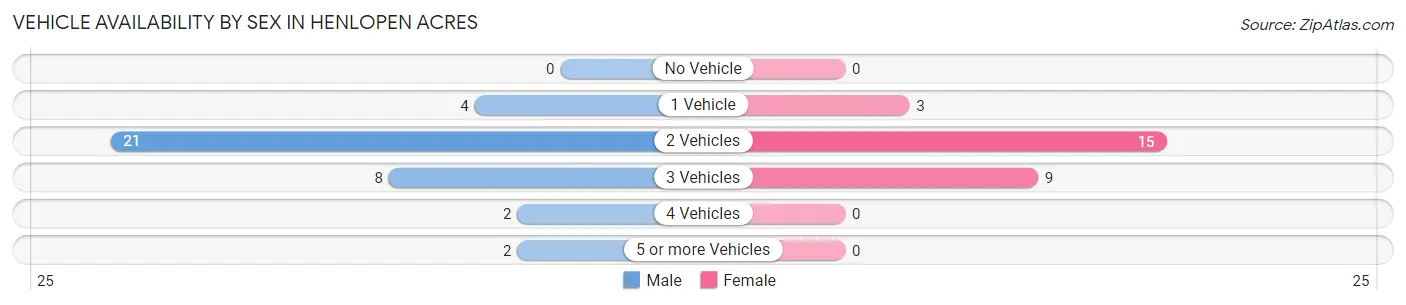
| Vehicles Available | Male | Female |
| No Vehicle | 0 (0.0%) | 0 (0.0%) |
| 1 Vehicle | 4 (10.8%) | 3 (11.1%) |
| 2 Vehicles | 21 (56.8%) | 15 (55.6%) |
| 3 Vehicles | 8 (21.6%) | 9 (33.3%) |
| 4 Vehicles | 2 (5.4%) | 0 (0.0%) |
| 5 or more Vehicles | 2 (5.4%) | 0 (0.0%) |
| Total | 37 (100.0%) | 27 (100.0%) |
Commute Time in Henlopen Acres
The most frequently occuring commute durations in Henlopen Acres are 15 to 19 minutes (12 commuters, 25.5%), 10 to 14 minutes (11 commuters, 23.4%), and 5 to 9 minutes (9 commuters, 19.2%).
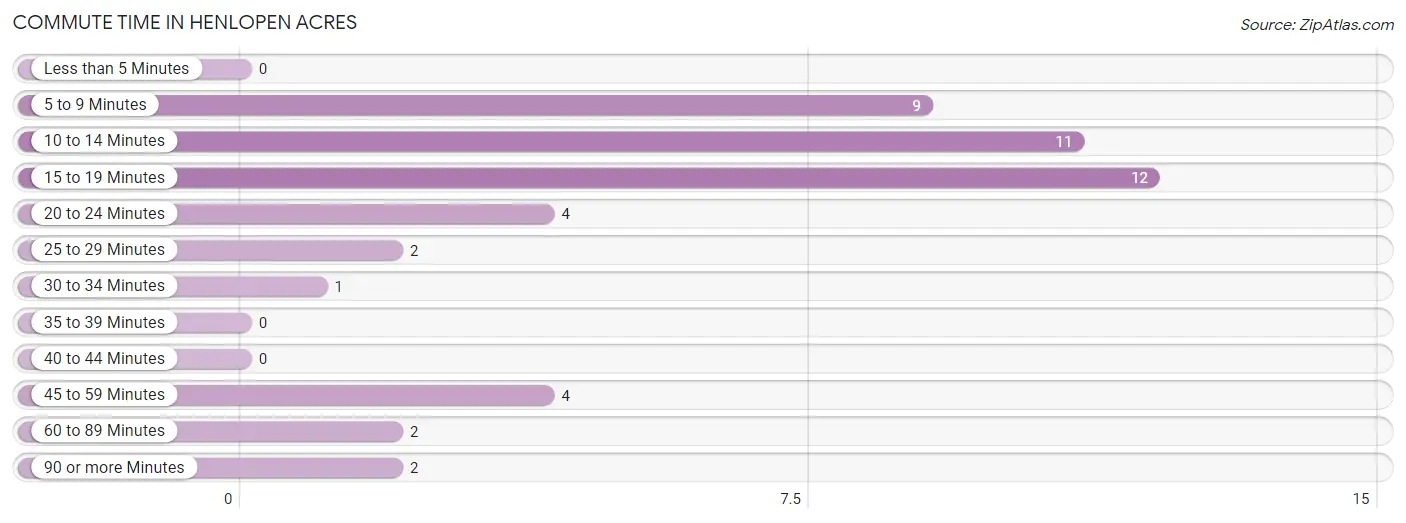
| Commute Time | # Commuters | % Commuters |
| Less than 5 Minutes | 0 | 0.0% |
| 5 to 9 Minutes | 9 | 19.2% |
| 10 to 14 Minutes | 11 | 23.4% |
| 15 to 19 Minutes | 12 | 25.5% |
| 20 to 24 Minutes | 4 | 8.5% |
| 25 to 29 Minutes | 2 | 4.3% |
| 30 to 34 Minutes | 1 | 2.1% |
| 35 to 39 Minutes | 0 | 0.0% |
| 40 to 44 Minutes | 0 | 0.0% |
| 45 to 59 Minutes | 4 | 8.5% |
| 60 to 89 Minutes | 2 | 4.3% |
| 90 or more Minutes | 2 | 4.3% |
Commute Time by Sex in Henlopen Acres
The most common commute times in Henlopen Acres are 5 to 9 minutes (7 commuters, 31.8%) for males and 15 to 19 minutes (9 commuters, 36.0%) for females.
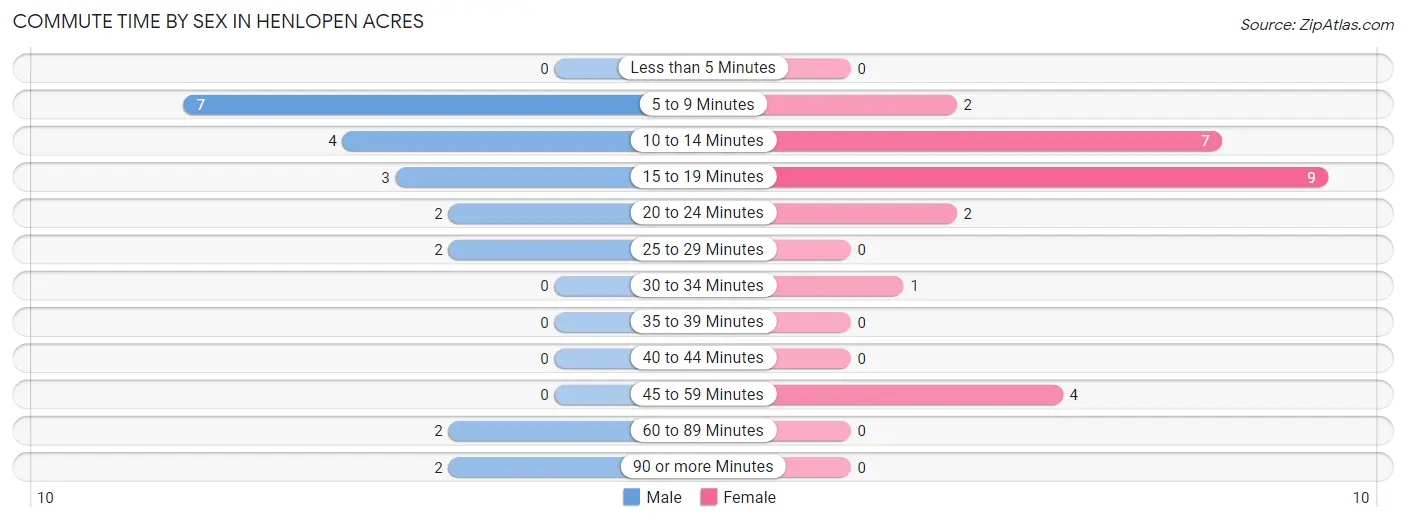
| Commute Time | Male | Female |
| Less than 5 Minutes | 0 (0.0%) | 0 (0.0%) |
| 5 to 9 Minutes | 7 (31.8%) | 2 (8.0%) |
| 10 to 14 Minutes | 4 (18.2%) | 7 (28.0%) |
| 15 to 19 Minutes | 3 (13.6%) | 9 (36.0%) |
| 20 to 24 Minutes | 2 (9.1%) | 2 (8.0%) |
| 25 to 29 Minutes | 2 (9.1%) | 0 (0.0%) |
| 30 to 34 Minutes | 0 (0.0%) | 1 (4.0%) |
| 35 to 39 Minutes | 0 (0.0%) | 0 (0.0%) |
| 40 to 44 Minutes | 0 (0.0%) | 0 (0.0%) |
| 45 to 59 Minutes | 0 (0.0%) | 4 (16.0%) |
| 60 to 89 Minutes | 2 (9.1%) | 0 (0.0%) |
| 90 or more Minutes | 2 (9.1%) | 0 (0.0%) |
Time of Departure to Work by Sex in Henlopen Acres
The most frequent times of departure to work in Henlopen Acres are 9:00 AM to 9:59 AM (8, 36.4%) for males and 9:00 AM to 9:59 AM (19, 76.0%) for females.
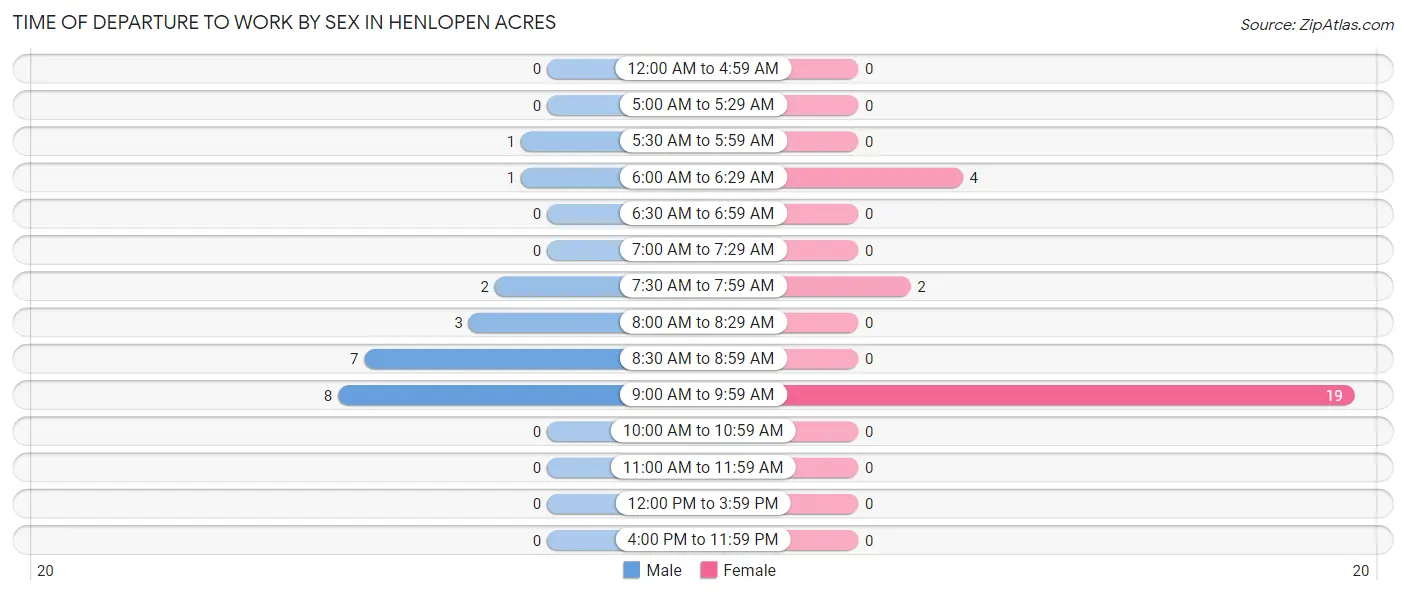
| Time of Departure | Male | Female |
| 12:00 AM to 4:59 AM | 0 (0.0%) | 0 (0.0%) |
| 5:00 AM to 5:29 AM | 0 (0.0%) | 0 (0.0%) |
| 5:30 AM to 5:59 AM | 1 (4.5%) | 0 (0.0%) |
| 6:00 AM to 6:29 AM | 1 (4.5%) | 4 (16.0%) |
| 6:30 AM to 6:59 AM | 0 (0.0%) | 0 (0.0%) |
| 7:00 AM to 7:29 AM | 0 (0.0%) | 0 (0.0%) |
| 7:30 AM to 7:59 AM | 2 (9.1%) | 2 (8.0%) |
| 8:00 AM to 8:29 AM | 3 (13.6%) | 0 (0.0%) |
| 8:30 AM to 8:59 AM | 7 (31.8%) | 0 (0.0%) |
| 9:00 AM to 9:59 AM | 8 (36.4%) | 19 (76.0%) |
| 10:00 AM to 10:59 AM | 0 (0.0%) | 0 (0.0%) |
| 11:00 AM to 11:59 AM | 0 (0.0%) | 0 (0.0%) |
| 12:00 PM to 3:59 PM | 0 (0.0%) | 0 (0.0%) |
| 4:00 PM to 11:59 PM | 0 (0.0%) | 0 (0.0%) |
| Total | 22 (100.0%) | 25 (100.0%) |
Housing Occupancy in Henlopen Acres
Occupancy by Ownership in Henlopen Acres
Of the total 103 dwellings in Henlopen Acres, owner-occupied units account for 103 (100.0%), while renter-occupied units make up 0 (0.0%).
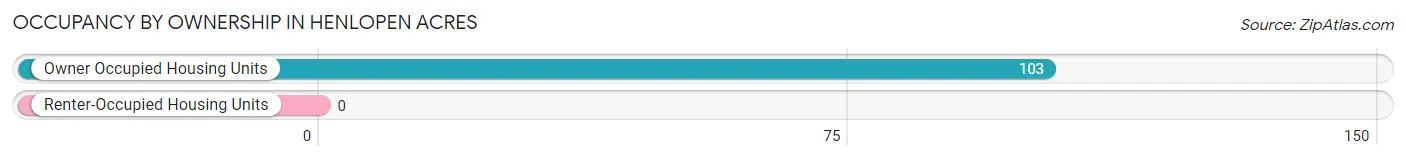
| Occupancy | # Housing Units | % Housing Units |
| Owner Occupied Housing Units | 103 | 100.0% |
| Renter-Occupied Housing Units | 0 | 0.0% |
| Total Occupied Housing Units | 103 | 100.0% |
Occupancy by Household Size in Henlopen Acres
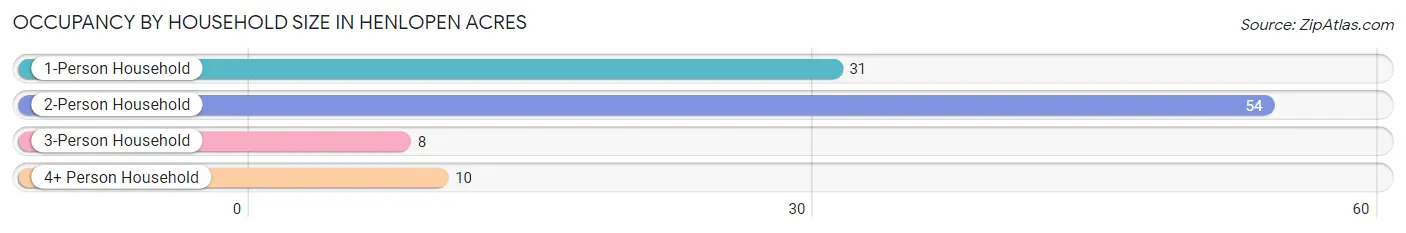
| Household Size | # Housing Units | % Housing Units |
| 1-Person Household | 31 | 30.1% |
| 2-Person Household | 54 | 52.4% |
| 3-Person Household | 8 | 7.8% |
| 4+ Person Household | 10 | 9.7% |
| Total Housing Units | 103 | 100.0% |
Occupancy by Ownership by Household Size in Henlopen Acres
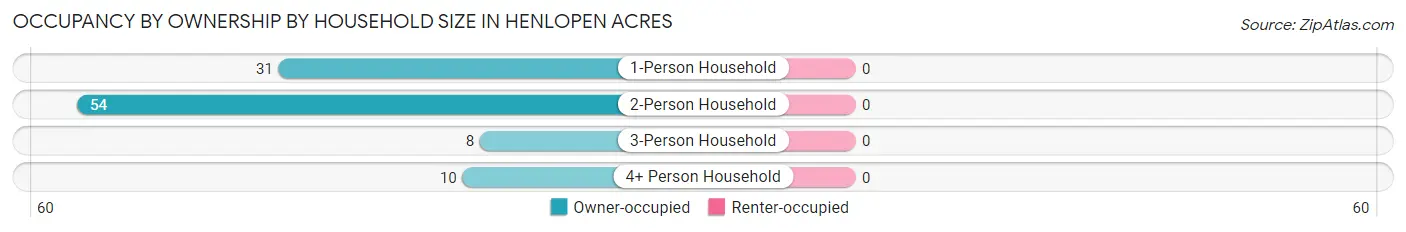
| Household Size | Owner-occupied | Renter-occupied |
| 1-Person Household | 31 (100.0%) | 0 (0.0%) |
| 2-Person Household | 54 (100.0%) | 0 (0.0%) |
| 3-Person Household | 8 (100.0%) | 0 (0.0%) |
| 4+ Person Household | 10 (100.0%) | 0 (0.0%) |
| Total Housing Units | 103 (100.0%) | 0 (0.0%) |
Occupancy by Educational Attainment in Henlopen Acres
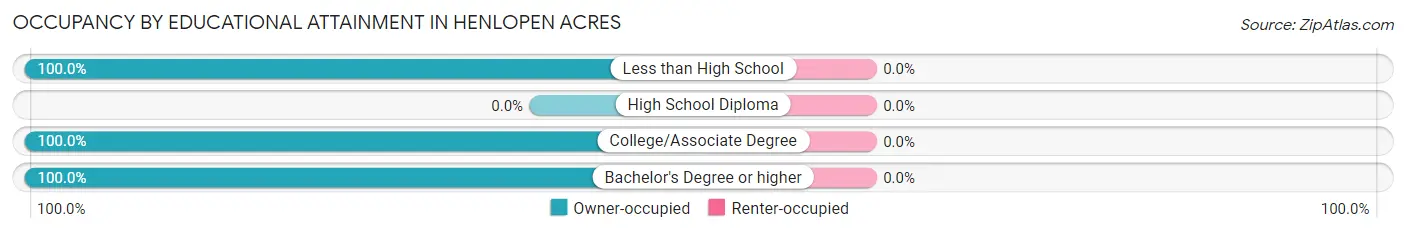
| Household Size | Owner-occupied | Renter-occupied |
| Less than High School | 1 (100.0%) | 0 (0.0%) |
| High School Diploma | 0 (0.0%) | 0 (0.0%) |
| College/Associate Degree | 19 (100.0%) | 0 (0.0%) |
| Bachelor's Degree or higher | 83 (100.0%) | 0 (0.0%) |
Occupancy by Age of Householder in Henlopen Acres
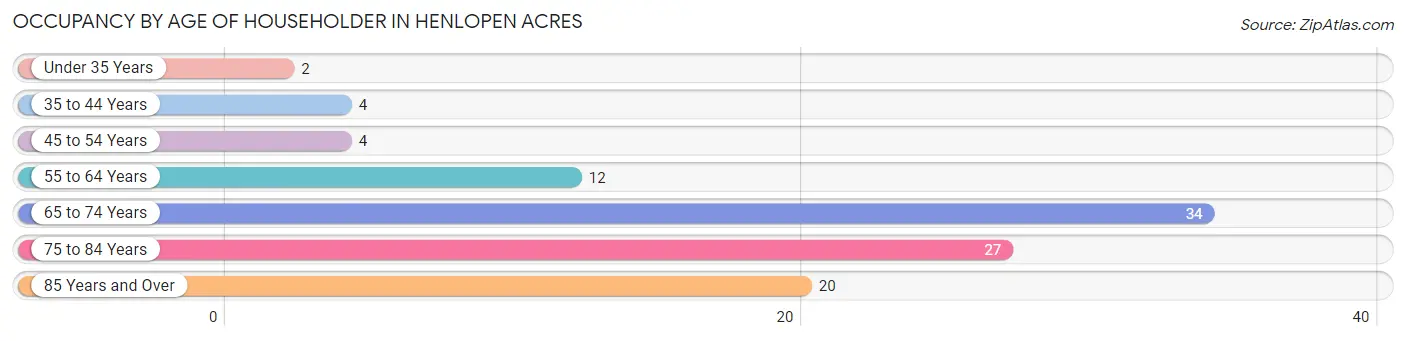
| Age Bracket | # Households | % Households |
| Under 35 Years | 2 | 1.9% |
| 35 to 44 Years | 4 | 3.9% |
| 45 to 54 Years | 4 | 3.9% |
| 55 to 64 Years | 12 | 11.7% |
| 65 to 74 Years | 34 | 33.0% |
| 75 to 84 Years | 27 | 26.2% |
| 85 Years and Over | 20 | 19.4% |
| Total | 103 | 100.0% |
Housing Finances in Henlopen Acres
Median Income by Occupancy in Henlopen Acres
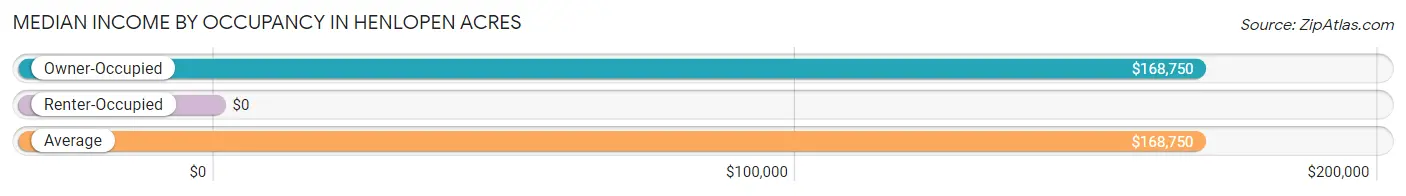
| Occupancy Type | # Households | Median Income |
| Owner-Occupied | 103 (100.0%) | $168,750 |
| Renter-Occupied | 0 (0.0%) | $0 |
| Average | 103 (100.0%) | $168,750 |
Occupancy by Householder Income Bracket in Henlopen Acres
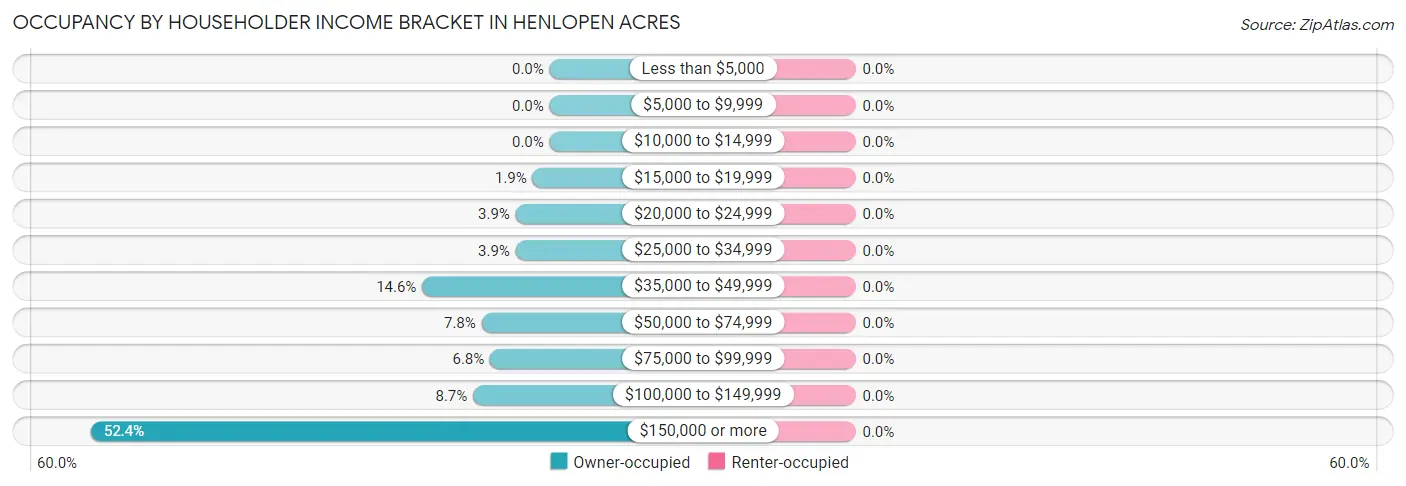
| Income Bracket | Owner-occupied | Renter-occupied |
| Less than $5,000 | 0 (0.0%) | 0 (0.0%) |
| $5,000 to $9,999 | 0 (0.0%) | 0 (0.0%) |
| $10,000 to $14,999 | 0 (0.0%) | 0 (0.0%) |
| $15,000 to $19,999 | 2 (1.9%) | 0 (0.0%) |
| $20,000 to $24,999 | 4 (3.9%) | 0 (0.0%) |
| $25,000 to $34,999 | 4 (3.9%) | 0 (0.0%) |
| $35,000 to $49,999 | 15 (14.6%) | 0 (0.0%) |
| $50,000 to $74,999 | 8 (7.8%) | 0 (0.0%) |
| $75,000 to $99,999 | 7 (6.8%) | 0 (0.0%) |
| $100,000 to $149,999 | 9 (8.7%) | 0 (0.0%) |
| $150,000 or more | 54 (52.4%) | 0 (0.0%) |
| Total | 103 (100.0%) | 0 (0.0%) |
Monthly Housing Cost Tiers in Henlopen Acres
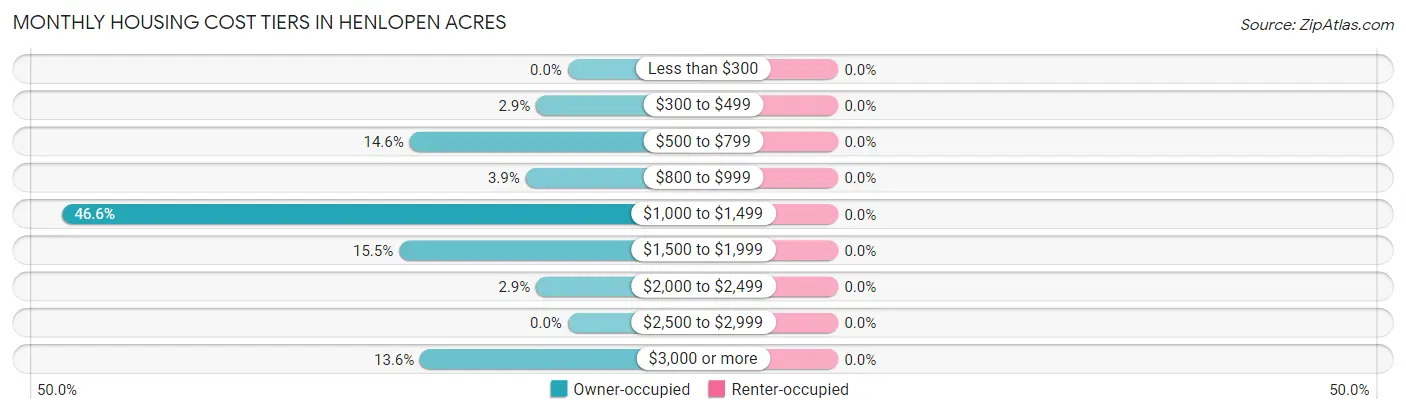
| Monthly Cost | Owner-occupied | Renter-occupied |
| Less than $300 | 0 (0.0%) | 0 (0.0%) |
| $300 to $499 | 3 (2.9%) | 0 (0.0%) |
| $500 to $799 | 15 (14.6%) | 0 (0.0%) |
| $800 to $999 | 4 (3.9%) | 0 (0.0%) |
| $1,000 to $1,499 | 48 (46.6%) | 0 (0.0%) |
| $1,500 to $1,999 | 16 (15.5%) | 0 (0.0%) |
| $2,000 to $2,499 | 3 (2.9%) | 0 (0.0%) |
| $2,500 to $2,999 | 0 (0.0%) | 0 (0.0%) |
| $3,000 or more | 14 (13.6%) | 0 (0.0%) |
| Total | 103 (100.0%) | 0 (0.0%) |
Physical Housing Characteristics in Henlopen Acres
Housing Structures in Henlopen Acres
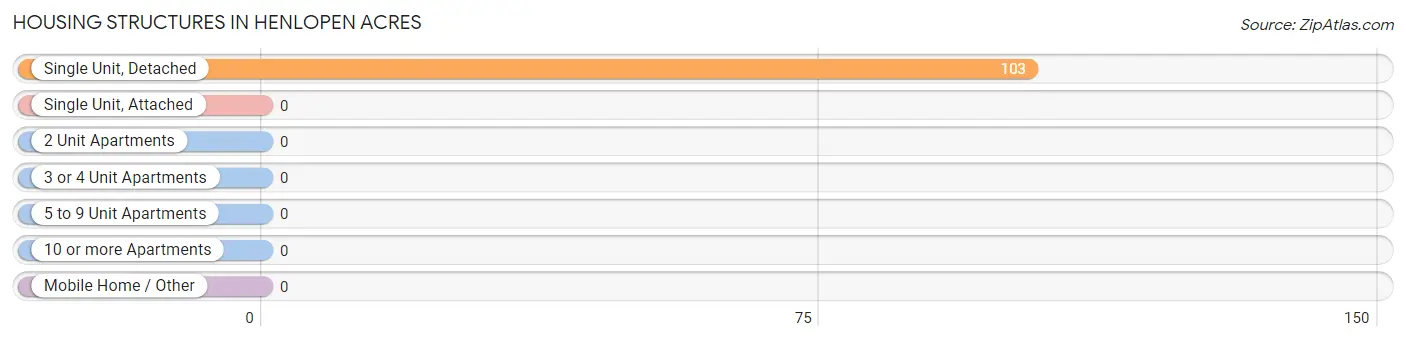
| Structure Type | # Housing Units | % Housing Units |
| Single Unit, Detached | 103 | 100.0% |
| Single Unit, Attached | 0 | 0.0% |
| 2 Unit Apartments | 0 | 0.0% |
| 3 or 4 Unit Apartments | 0 | 0.0% |
| 5 to 9 Unit Apartments | 0 | 0.0% |
| 10 or more Apartments | 0 | 0.0% |
| Mobile Home / Other | 0 | 0.0% |
| Total | 103 | 100.0% |
Housing Structures by Occupancy in Henlopen Acres
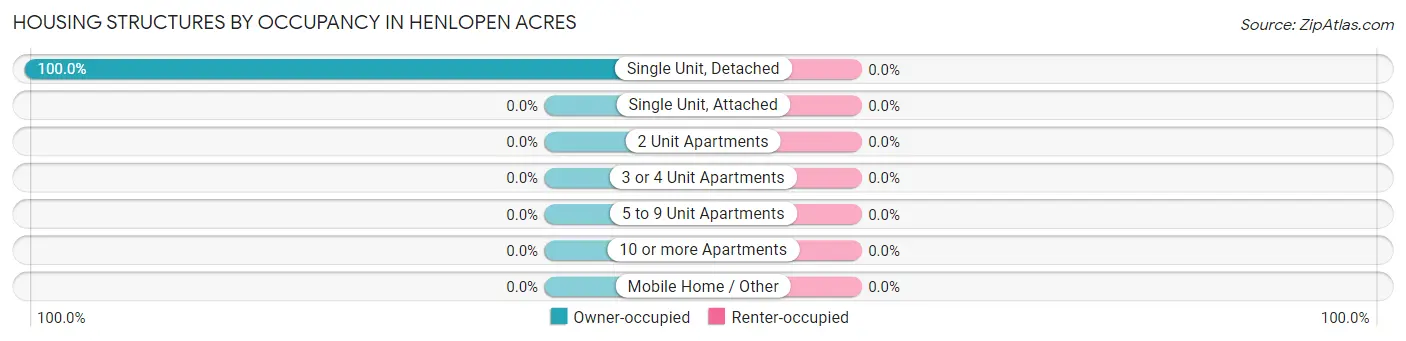
| Structure Type | Owner-occupied | Renter-occupied |
| Single Unit, Detached | 103 (100.0%) | 0 (0.0%) |
| Single Unit, Attached | 0 (0.0%) | 0 (0.0%) |
| 2 Unit Apartments | 0 (0.0%) | 0 (0.0%) |
| 3 or 4 Unit Apartments | 0 (0.0%) | 0 (0.0%) |
| 5 to 9 Unit Apartments | 0 (0.0%) | 0 (0.0%) |
| 10 or more Apartments | 0 (0.0%) | 0 (0.0%) |
| Mobile Home / Other | 0 (0.0%) | 0 (0.0%) |
| Total | 103 (100.0%) | 0 (0.0%) |
Housing Structures by Number of Rooms in Henlopen Acres
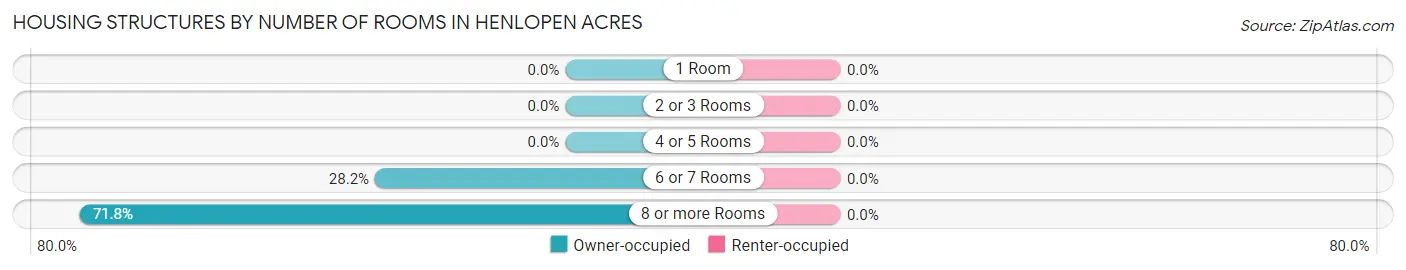
| Number of Rooms | Owner-occupied | Renter-occupied |
| 1 Room | 0 (0.0%) | 0 (0.0%) |
| 2 or 3 Rooms | 0 (0.0%) | 0 (0.0%) |
| 4 or 5 Rooms | 0 (0.0%) | 0 (0.0%) |
| 6 or 7 Rooms | 29 (28.2%) | 0 (0.0%) |
| 8 or more Rooms | 74 (71.8%) | 0 (0.0%) |
| Total | 103 (100.0%) | 0 (0.0%) |
Housing Structure by Heating Type in Henlopen Acres
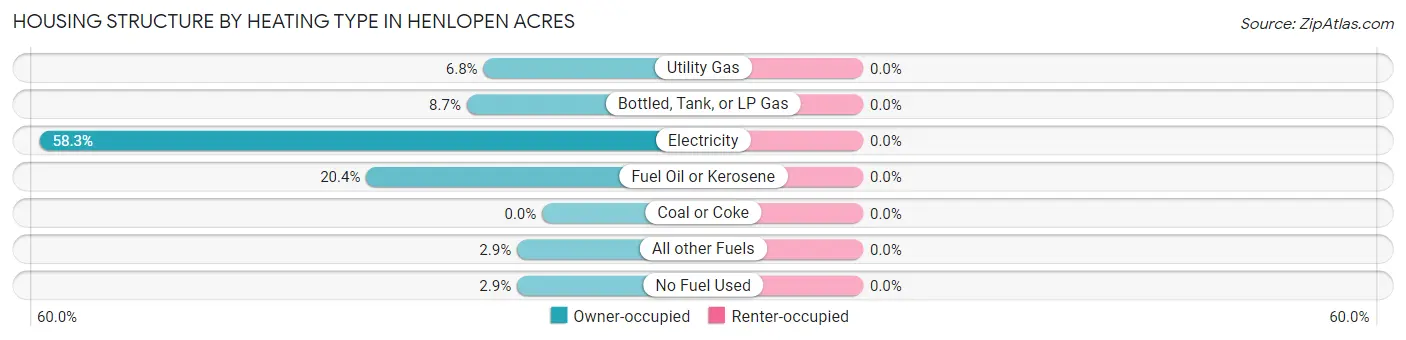
| Heating Type | Owner-occupied | Renter-occupied |
| Utility Gas | 7 (6.8%) | 0 (0.0%) |
| Bottled, Tank, or LP Gas | 9 (8.7%) | 0 (0.0%) |
| Electricity | 60 (58.3%) | 0 (0.0%) |
| Fuel Oil or Kerosene | 21 (20.4%) | 0 (0.0%) |
| Coal or Coke | 0 (0.0%) | 0 (0.0%) |
| All other Fuels | 3 (2.9%) | 0 (0.0%) |
| No Fuel Used | 3 (2.9%) | 0 (0.0%) |
| Total | 103 (100.0%) | 0 (0.0%) |
Household Vehicle Usage in Henlopen Acres
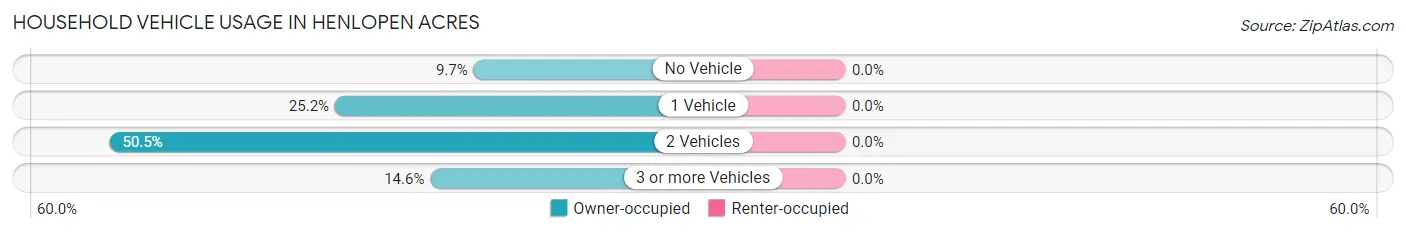
| Vehicles per Household | Owner-occupied | Renter-occupied |
| No Vehicle | 10 (9.7%) | 0 (0.0%) |
| 1 Vehicle | 26 (25.2%) | 0 (0.0%) |
| 2 Vehicles | 52 (50.5%) | 0 (0.0%) |
| 3 or more Vehicles | 15 (14.6%) | 0 (0.0%) |
| Total | 103 (100.0%) | 0 (0.0%) |
Real Estate & Mortgages in Henlopen Acres
Real Estate and Mortgage Overview in Henlopen Acres
| Characteristic | Without Mortgage | With Mortgage |
| Housing Units | 80 | 23 |
| Median Property Value | $2,000,001 | $2,000,001 |
| Median Household Income | $190,833 | $9 |
| Monthly Housing Costs | $1,161 | $13 |
| Real Estate Taxes | $4,484 | $0 |
Property Value by Mortgage Status in Henlopen Acres
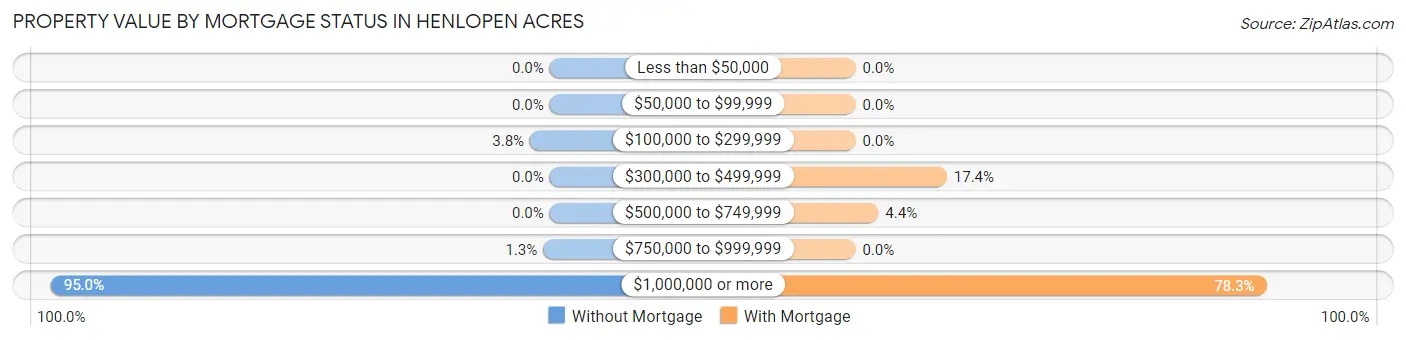
| Property Value | Without Mortgage | With Mortgage |
| Less than $50,000 | 0 (0.0%) | 0 (0.0%) |
| $50,000 to $99,999 | 0 (0.0%) | 0 (0.0%) |
| $100,000 to $299,999 | 3 (3.7%) | 0 (0.0%) |
| $300,000 to $499,999 | 0 (0.0%) | 4 (17.4%) |
| $500,000 to $749,999 | 0 (0.0%) | 1 (4.3%) |
| $750,000 to $999,999 | 1 (1.3%) | 0 (0.0%) |
| $1,000,000 or more | 76 (95.0%) | 18 (78.3%) |
| Total | 80 (100.0%) | 23 (100.0%) |
Household Income by Mortgage Status in Henlopen Acres
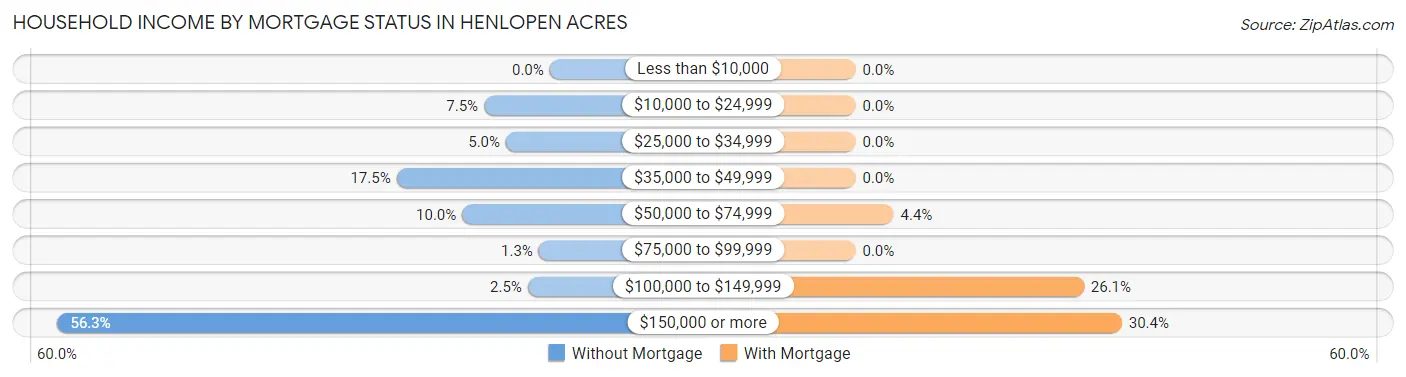
| Household Income | Without Mortgage | With Mortgage |
| Less than $10,000 | 0 (0.0%) | 0 (0.0%) |
| $10,000 to $24,999 | 6 (7.5%) | 0 (0.0%) |
| $25,000 to $34,999 | 4 (5.0%) | 0 (0.0%) |
| $35,000 to $49,999 | 14 (17.5%) | 0 (0.0%) |
| $50,000 to $74,999 | 8 (10.0%) | 1 (4.3%) |
| $75,000 to $99,999 | 1 (1.3%) | 0 (0.0%) |
| $100,000 to $149,999 | 2 (2.5%) | 6 (26.1%) |
| $150,000 or more | 45 (56.2%) | 7 (30.4%) |
| Total | 80 (100.0%) | 23 (100.0%) |
Property Value to Household Income Ratio in Henlopen Acres
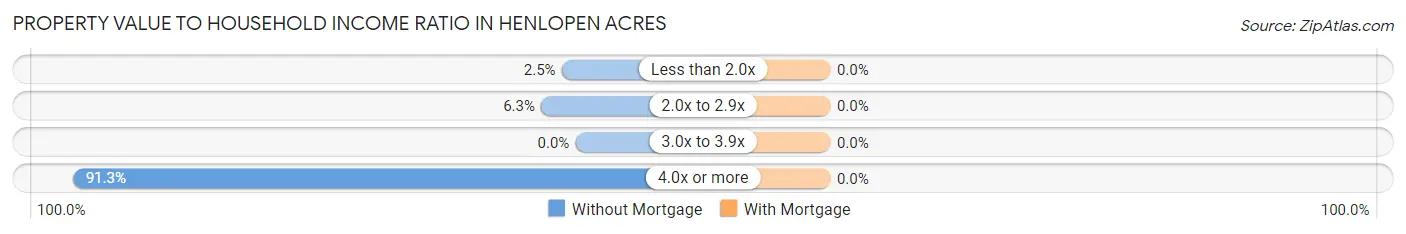
| Value-to-Income Ratio | Without Mortgage | With Mortgage |
| Less than 2.0x | 2 (2.5%) | 0 (0.0%) |
| 2.0x to 2.9x | 5 (6.2%) | 0 (0.0%) |
| 3.0x to 3.9x | 0 (0.0%) | 0 (0.0%) |
| 4.0x or more | 73 (91.2%) | 0 (0.0%) |
| Total | 80 (100.0%) | 23 (100.0%) |
Real Estate Taxes by Mortgage Status in Henlopen Acres
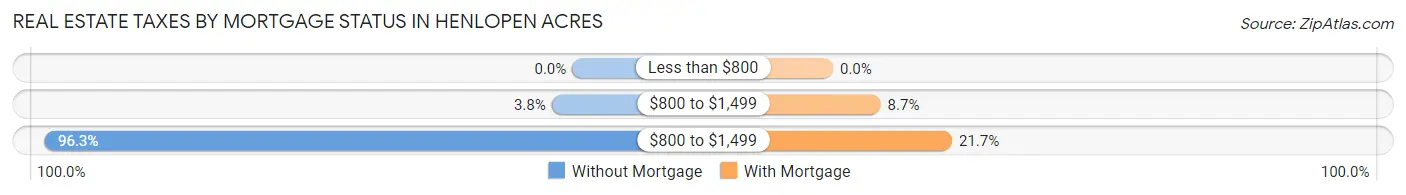
| Property Taxes | Without Mortgage | With Mortgage |
| Less than $800 | 0 (0.0%) | 0 (0.0%) |
| $800 to $1,499 | 3 (3.7%) | 2 (8.7%) |
| $800 to $1,499 | 77 (96.3%) | 5 (21.7%) |
| Total | 80 (100.0%) | 23 (100.0%) |
Health & Disability in Henlopen Acres
Health Insurance Coverage by Age in Henlopen Acres
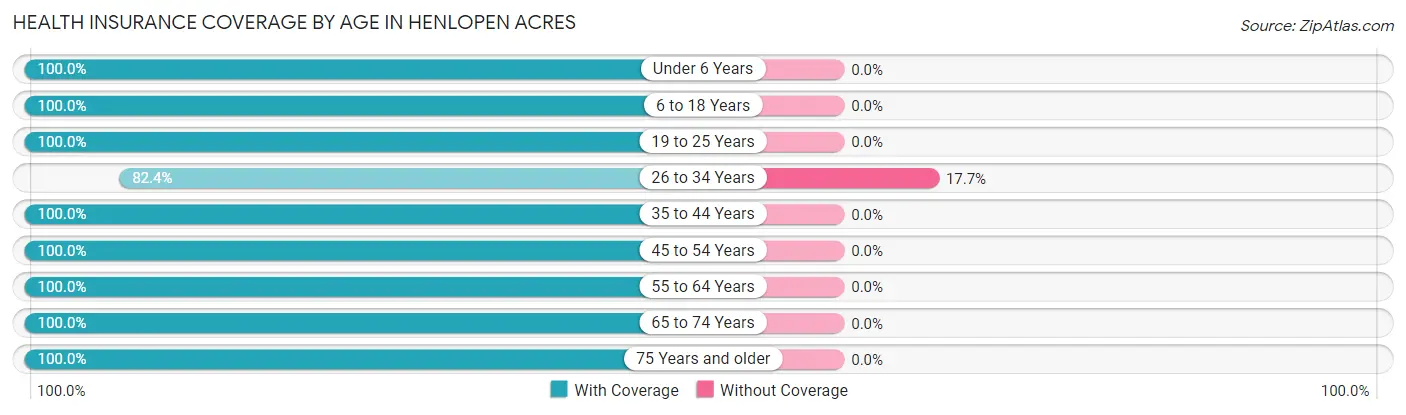
| Age Bracket | With Coverage | Without Coverage |
| Under 6 Years | 6 (100.0%) | 0 (0.0%) |
| 6 to 18 Years | 8 (100.0%) | 0 (0.0%) |
| 19 to 25 Years | 7 (100.0%) | 0 (0.0%) |
| 26 to 34 Years | 14 (82.4%) | 3 (17.6%) |
| 35 to 44 Years | 6 (100.0%) | 0 (0.0%) |
| 45 to 54 Years | 13 (100.0%) | 0 (0.0%) |
| 55 to 64 Years | 21 (100.0%) | 0 (0.0%) |
| 65 to 74 Years | 53 (100.0%) | 0 (0.0%) |
| 75 Years and older | 62 (100.0%) | 0 (0.0%) |
| Total | 190 (98.5%) | 3 (1.5%) |
Health Insurance Coverage by Citizenship Status in Henlopen Acres
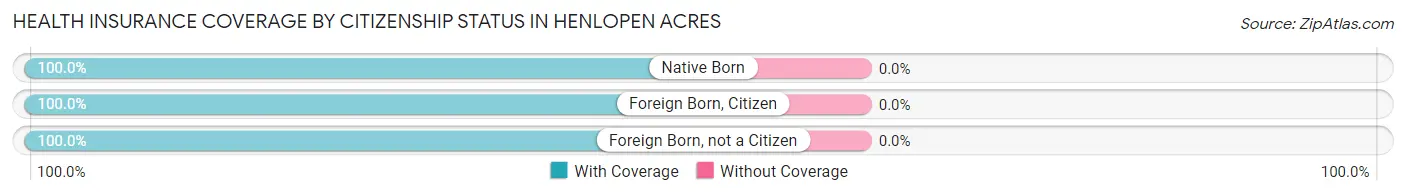
| Citizenship Status | With Coverage | Without Coverage |
| Native Born | 6 (100.0%) | 0 (0.0%) |
| Foreign Born, Citizen | 8 (100.0%) | 0 (0.0%) |
| Foreign Born, not a Citizen | 7 (100.0%) | 0 (0.0%) |
Health Insurance Coverage by Household Income in Henlopen Acres
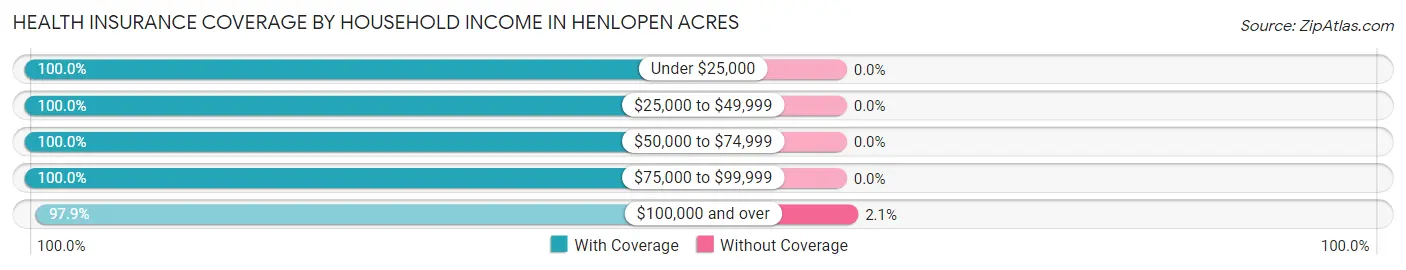
| Household Income | With Coverage | Without Coverage |
| Under $25,000 | 6 (100.0%) | 0 (0.0%) |
| $25,000 to $49,999 | 19 (100.0%) | 0 (0.0%) |
| $50,000 to $74,999 | 16 (100.0%) | 0 (0.0%) |
| $75,000 to $99,999 | 12 (100.0%) | 0 (0.0%) |
| $100,000 and over | 137 (97.9%) | 3 (2.1%) |
Public vs Private Health Insurance Coverage by Age in Henlopen Acres
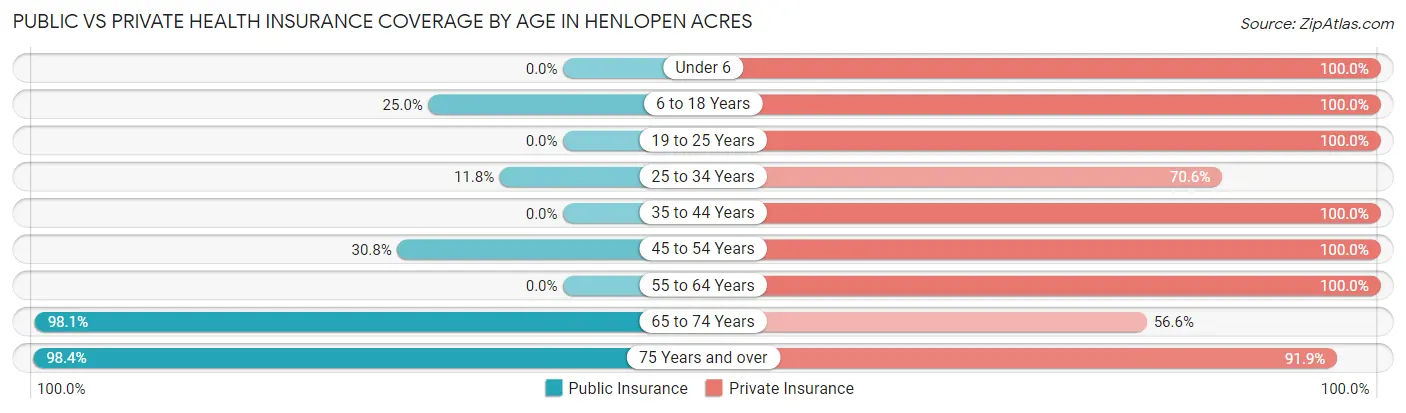
| Age Bracket | Public Insurance | Private Insurance |
| Under 6 | 0 (0.0%) | 6 (100.0%) |
| 6 to 18 Years | 2 (25.0%) | 8 (100.0%) |
| 19 to 25 Years | 0 (0.0%) | 7 (100.0%) |
| 25 to 34 Years | 2 (11.8%) | 12 (70.6%) |
| 35 to 44 Years | 0 (0.0%) | 6 (100.0%) |
| 45 to 54 Years | 4 (30.8%) | 13 (100.0%) |
| 55 to 64 Years | 0 (0.0%) | 21 (100.0%) |
| 65 to 74 Years | 52 (98.1%) | 30 (56.6%) |
| 75 Years and over | 61 (98.4%) | 57 (91.9%) |
| Total | 121 (62.7%) | 160 (82.9%) |
Disability Status by Sex by Age in Henlopen Acres
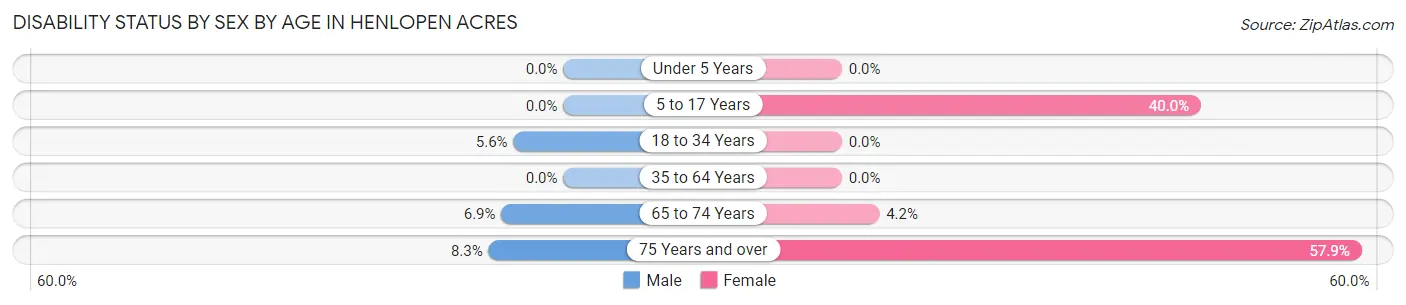
| Age Bracket | Male | Female |
| Under 5 Years | 0 (0.0%) | 0 (0.0%) |
| 5 to 17 Years | 0 (0.0%) | 2 (40.0%) |
| 18 to 34 Years | 1 (5.6%) | 0 (0.0%) |
| 35 to 64 Years | 0 (0.0%) | 0 (0.0%) |
| 65 to 74 Years | 2 (6.9%) | 1 (4.2%) |
| 75 Years and over | 2 (8.3%) | 22 (57.9%) |
Disability Class by Sex by Age in Henlopen Acres
Disability Class: Hearing Difficulty
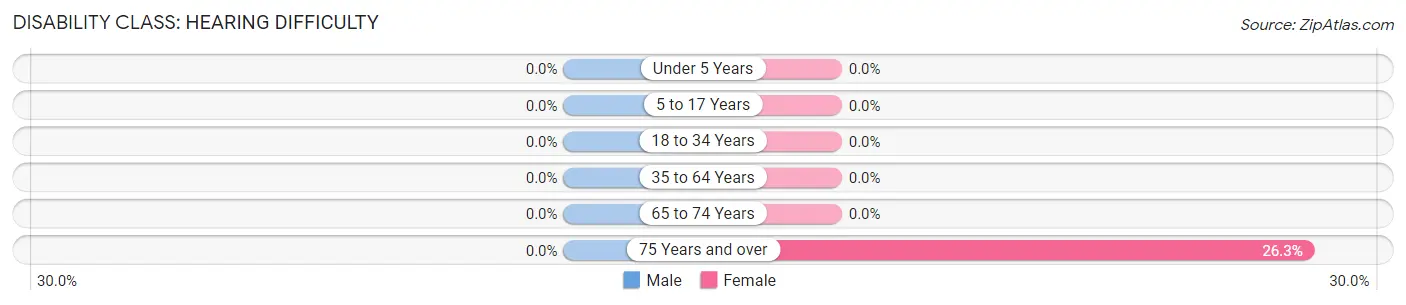
| Age Bracket | Male | Female |
| Under 5 Years | 0 (0.0%) | 0 (0.0%) |
| 5 to 17 Years | 0 (0.0%) | 0 (0.0%) |
| 18 to 34 Years | 0 (0.0%) | 0 (0.0%) |
| 35 to 64 Years | 0 (0.0%) | 0 (0.0%) |
| 65 to 74 Years | 0 (0.0%) | 0 (0.0%) |
| 75 Years and over | 0 (0.0%) | 10 (26.3%) |
Disability Class: Vision Difficulty
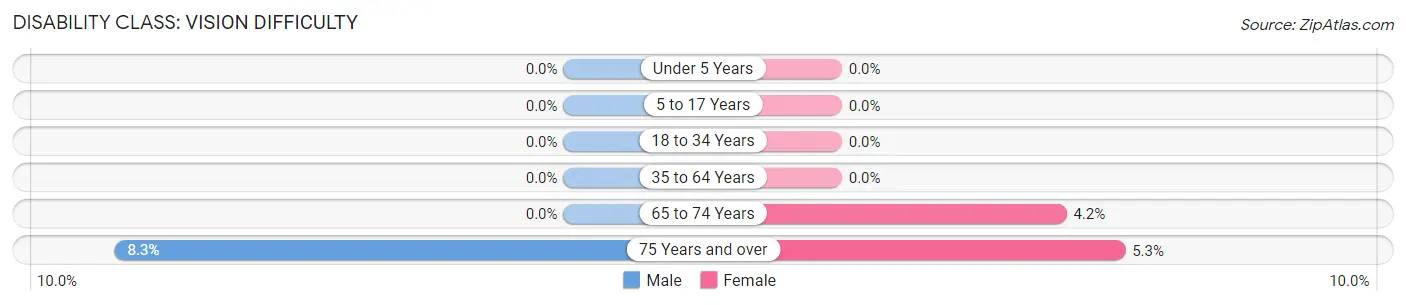
| Age Bracket | Male | Female |
| Under 5 Years | 0 (0.0%) | 0 (0.0%) |
| 5 to 17 Years | 0 (0.0%) | 0 (0.0%) |
| 18 to 34 Years | 0 (0.0%) | 0 (0.0%) |
| 35 to 64 Years | 0 (0.0%) | 0 (0.0%) |
| 65 to 74 Years | 0 (0.0%) | 1 (4.2%) |
| 75 Years and over | 2 (8.3%) | 2 (5.3%) |
Disability Class: Cognitive Difficulty
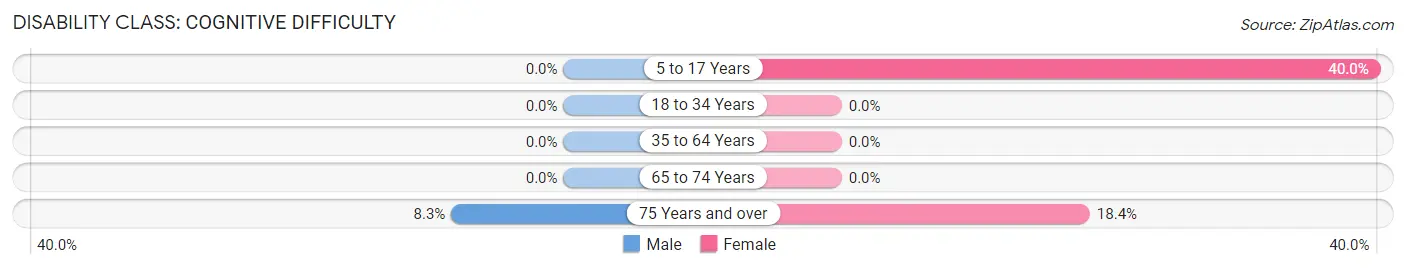
| Age Bracket | Male | Female |
| 5 to 17 Years | 0 (0.0%) | 2 (40.0%) |
| 18 to 34 Years | 0 (0.0%) | 0 (0.0%) |
| 35 to 64 Years | 0 (0.0%) | 0 (0.0%) |
| 65 to 74 Years | 0 (0.0%) | 0 (0.0%) |
| 75 Years and over | 2 (8.3%) | 7 (18.4%) |
Disability Class: Ambulatory Difficulty
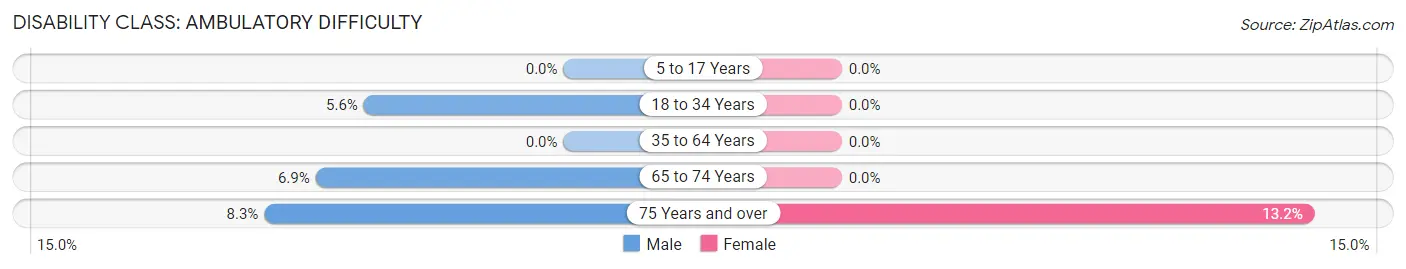
| Age Bracket | Male | Female |
| 5 to 17 Years | 0 (0.0%) | 0 (0.0%) |
| 18 to 34 Years | 1 (5.6%) | 0 (0.0%) |
| 35 to 64 Years | 0 (0.0%) | 0 (0.0%) |
| 65 to 74 Years | 2 (6.9%) | 0 (0.0%) |
| 75 Years and over | 2 (8.3%) | 5 (13.2%) |
Disability Class: Self-Care Difficulty
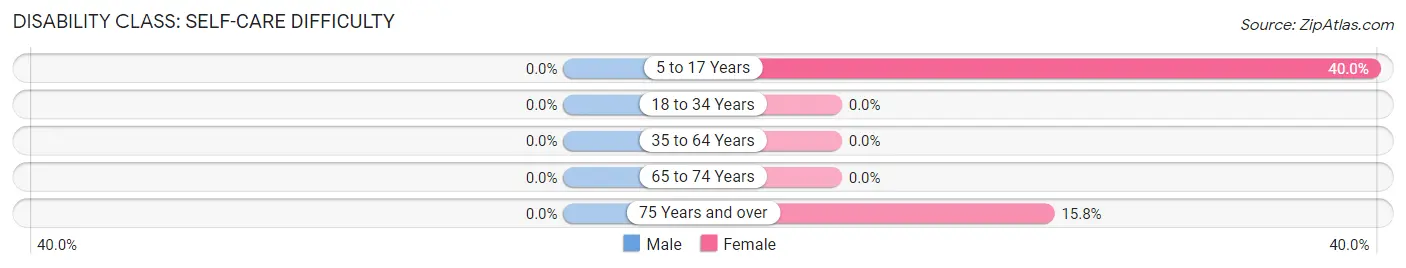
| Age Bracket | Male | Female |
| 5 to 17 Years | 0 (0.0%) | 2 (40.0%) |
| 18 to 34 Years | 0 (0.0%) | 0 (0.0%) |
| 35 to 64 Years | 0 (0.0%) | 0 (0.0%) |
| 65 to 74 Years | 0 (0.0%) | 0 (0.0%) |
| 75 Years and over | 0 (0.0%) | 6 (15.8%) |
Technology Access in Henlopen Acres
Computing Device Access in Henlopen Acres
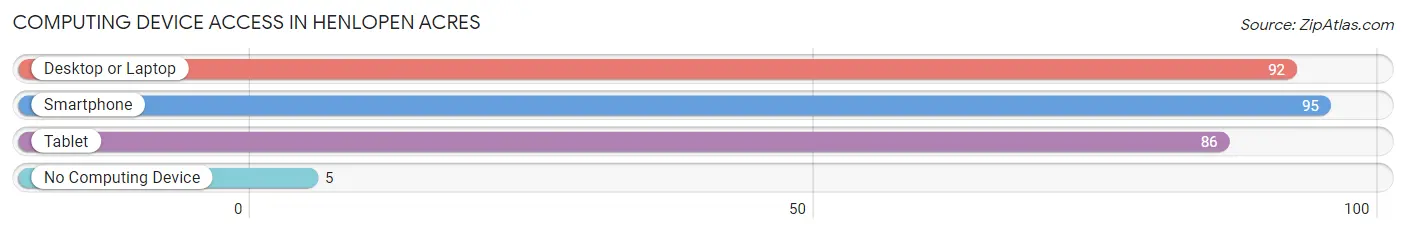
| Device Type | # Households | % Households |
| Desktop or Laptop | 92 | 89.3% |
| Smartphone | 95 | 92.2% |
| Tablet | 86 | 83.5% |
| No Computing Device | 5 | 4.9% |
| Total | 103 | 100.0% |
Internet Access in Henlopen Acres
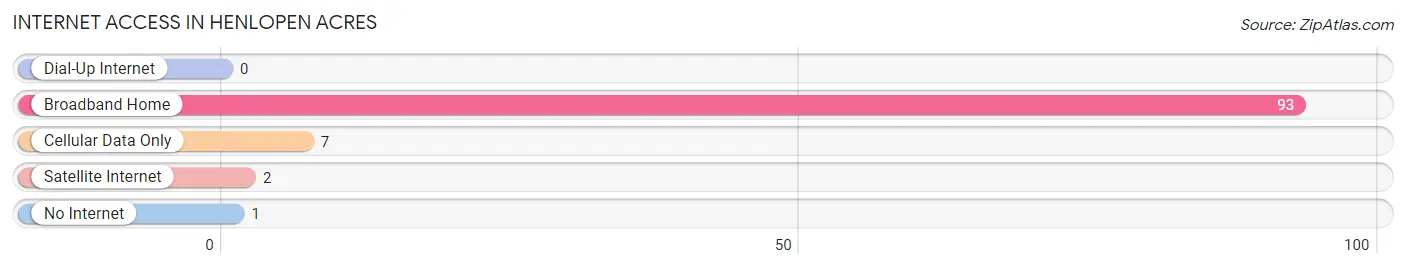
| Internet Type | # Households | % Households |
| Dial-Up Internet | 0 | 0.0% |
| Broadband Home | 93 | 90.3% |
| Cellular Data Only | 7 | 6.8% |
| Satellite Internet | 2 | 1.9% |
| No Internet | 1 | 1.0% |
| Total | 103 | 100.0% |
Henlopen Acres Summary
Henlopen Acres is a small town located in Sussex County, Delaware. It is situated on the Atlantic Ocean, just south of Rehoboth Beach. The town was founded in 1929 by a group of wealthy businessmen from Philadelphia, who wanted to create a private beach community. The town was incorporated in 1931 and has since become a popular summer destination for tourists and locals alike.
Henlopen Acres is a small town with a population of just over 500 people. The town is located on a peninsula, surrounded by the Atlantic Ocean on one side and Rehoboth Bay on the other. The town is home to a variety of businesses, including restaurants, shops, and a marina. The town also has a public beach, which is popular with locals and tourists alike.
The geography of Henlopen Acres is characterized by its coastal location. The town is situated on a peninsula, surrounded by the Atlantic Ocean on one side and Rehoboth Bay on the other. The town is also home to a variety of wildlife, including birds, fish, and other marine life.
The economy of Henlopen Acres is largely based on tourism. The town is a popular summer destination for tourists and locals alike. The town is home to a variety of businesses, including restaurants, shops, and a marina. The town also has a public beach, which is popular with locals and tourists alike.
The demographics of Henlopen Acres are largely made up of white residents. According to the 2010 census, the town had a population of 517 people, of which 95.7% were white. The median household income in Henlopen Acres was $68,750, and the median age was 48.7 years.
Henlopen Acres is a small town with a rich history and a vibrant economy. The town is home to a variety of businesses, including restaurants, shops, and a marina. The town also has a public beach, which is popular with locals and tourists alike. The town is also home to a variety of wildlife, including birds, fish, and other marine life. The town is a popular summer destination for tourists and locals alike, and its economy is largely based on tourism. The town has a population of just over 500 people, and the median household income is $68,750. Henlopen Acres is a unique and vibrant town, and it is a great place to live and visit.
Common Questions
What is Per Capita Income in Henlopen Acres?
Per Capita income in Henlopen Acres is $110,969.
What is the Median Family Income in Henlopen Acres?
Median Family Income in Henlopen Acres is $235,179.
What is the Median Household income in Henlopen Acres?
Median Household Income in Henlopen Acres is $168,750.
What is Income or Wage Gap in Henlopen Acres?
Income or Wage Gap in Henlopen Acres is 58.8%.
Women in Henlopen Acres earn 41.2 cents for every dollar earned by a man.
What is Inequality or Gini Index in Henlopen Acres?
Inequality or Gini Index in Henlopen Acres is 0.51.
What is the Total Population of Henlopen Acres?
Total Population of Henlopen Acres is 193.
What is the Total Male Population of Henlopen Acres?
Total Male Population of Henlopen Acres is 92.
What is the Total Female Population of Henlopen Acres?
Total Female Population of Henlopen Acres is 101.
What is the Ratio of Males per 100 Females in Henlopen Acres?
There are 91.09 Males per 100 Females in Henlopen Acres.
What is the Ratio of Females per 100 Males in Henlopen Acres?
There are 109.78 Females per 100 Males in Henlopen Acres.
What is the Median Population Age in Henlopen Acres?
Median Population Age in Henlopen Acres is 69.2 Years.
What is the Average Family Size in Henlopen Acres
Average Family Size in Henlopen Acres is 2.2 People.
What is the Average Household Size in Henlopen Acres
Average Household Size in Henlopen Acres is 1.9 People.
How Large is the Labor Force in Henlopen Acres?
There are 66 People in the Labor Forcein in Henlopen Acres.
What is the Percentage of People in the Labor Force in Henlopen Acres?
36.5% of People are in the Labor Force in Henlopen Acres.
What is the Unemployment Rate in Henlopen Acres?
Unemployment Rate in Henlopen Acres is 3.0%.