Townsend, DE Map & Demographics
Townsend Map
Townsend Overview
$41,503
PER CAPITA INCOME
$132,460
AVG FAMILY INCOME
$147,917
AVG HOUSEHOLD INCOME
12.5%
WAGE / INCOME GAP [ % ]
87.5¢/ $1
WAGE / INCOME GAP [ $ ]
$11,670
FAMILY INCOME DEFICIT
0.29
INEQUALITY / GINI INDEX
2,728
TOTAL POPULATION
1,308
MALE POPULATION
1,420
FEMALE POPULATION
92.11
MALES / 100 FEMALES
108.56
FEMALES / 100 MALES
35.0
MEDIAN AGE
4.5
AVG FAMILY SIZE
3.8
AVG HOUSEHOLD SIZE
1,579
LABOR FORCE [ PEOPLE ]
82.7%
PERCENT IN LABOR FORCE
2.5%
UNEMPLOYMENT RATE
Townsend Zip Codes
Townsend Area Codes
Income in Townsend
Income Overview in Townsend
Per Capita Income in Townsend is $41,503, while median incomes of families and households are $132,460 and $147,917 respectively.
| Characteristic | Number | Measure |
| Per Capita Income | 2,728 | $41,503 |
| Median Family Income | 527 | $132,460 |
| Mean Family Income | 527 | $152,715 |
| Median Household Income | 715 | $147,917 |
| Mean Household Income | 715 | $151,780 |
| Income Deficit | 527 | $11,670 |
| Wage / Income Gap (%) | 2,728 | 12.50% |
| Wage / Income Gap ($) | 2,728 | 87.50¢ per $1 |
| Gini / Inequality Index | 2,728 | 0.29 |
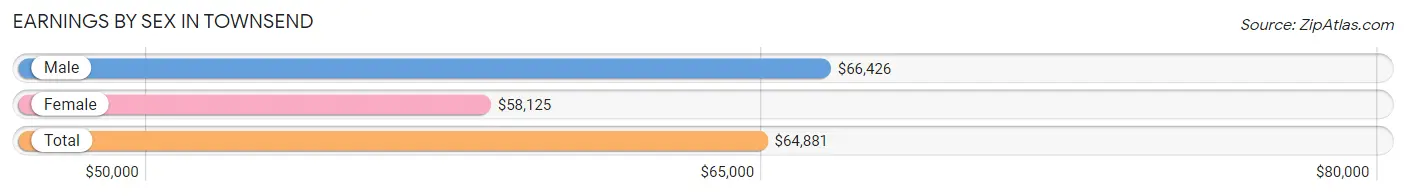
Earnings by Sex in Townsend
Average Earnings in Townsend are $64,881, $66,426 for men and $58,125 for women, a difference of 12.5%.
| Sex | Number | Average Earnings |
| Male | 769 (48.2%) | $66,426 |
| Female | 825 (51.8%) | $58,125 |
| Total | 1,594 (100.0%) | $64,881 |
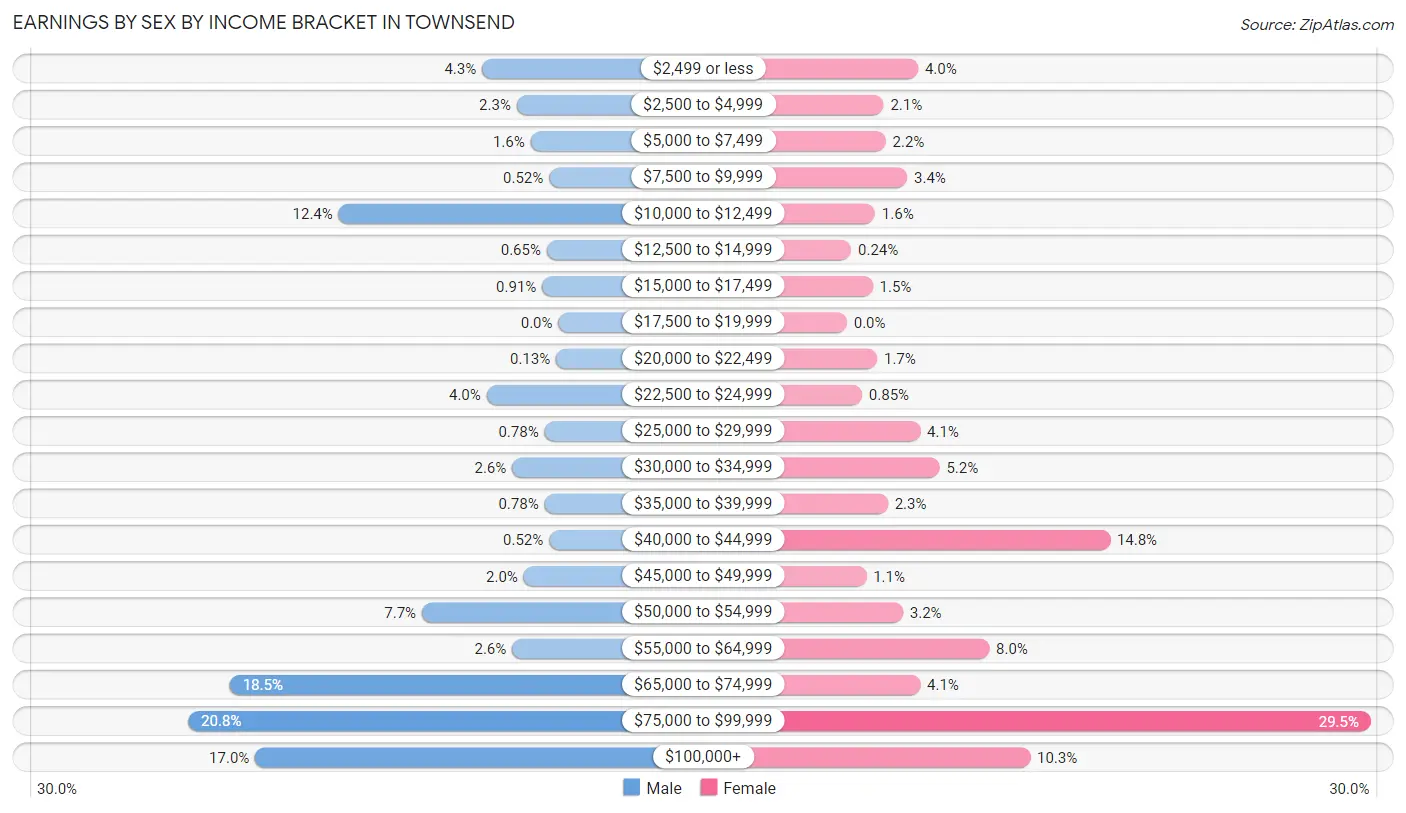
Earnings by Sex by Income Bracket in Townsend
The most common earnings brackets in Townsend are $75,000 to $99,999 for men (160 | 20.8%) and $75,000 to $99,999 for women (243 | 29.4%).
| Income | Male | Female |
| $2,499 or less | 33 (4.3%) | 33 (4.0%) |
| $2,500 to $4,999 | 18 (2.3%) | 17 (2.1%) |
| $5,000 to $7,499 | 12 (1.6%) | 18 (2.2%) |
| $7,500 to $9,999 | 4 (0.5%) | 28 (3.4%) |
| $10,000 to $12,499 | 95 (12.3%) | 13 (1.6%) |
| $12,500 to $14,999 | 5 (0.6%) | 2 (0.2%) |
| $15,000 to $17,499 | 7 (0.9%) | 12 (1.5%) |
| $17,500 to $19,999 | 0 (0.0%) | 0 (0.0%) |
| $20,000 to $22,499 | 1 (0.1%) | 14 (1.7%) |
| $22,500 to $24,999 | 31 (4.0%) | 7 (0.9%) |
| $25,000 to $29,999 | 6 (0.8%) | 34 (4.1%) |
| $30,000 to $34,999 | 20 (2.6%) | 43 (5.2%) |
| $35,000 to $39,999 | 6 (0.8%) | 19 (2.3%) |
| $40,000 to $44,999 | 4 (0.5%) | 122 (14.8%) |
| $45,000 to $49,999 | 15 (1.9%) | 9 (1.1%) |
| $50,000 to $54,999 | 59 (7.7%) | 26 (3.2%) |
| $55,000 to $64,999 | 20 (2.6%) | 66 (8.0%) |
| $65,000 to $74,999 | 142 (18.5%) | 34 (4.1%) |
| $75,000 to $99,999 | 160 (20.8%) | 243 (29.4%) |
| $100,000+ | 131 (17.0%) | 85 (10.3%) |
| Total | 769 (100.0%) | 825 (100.0%) |
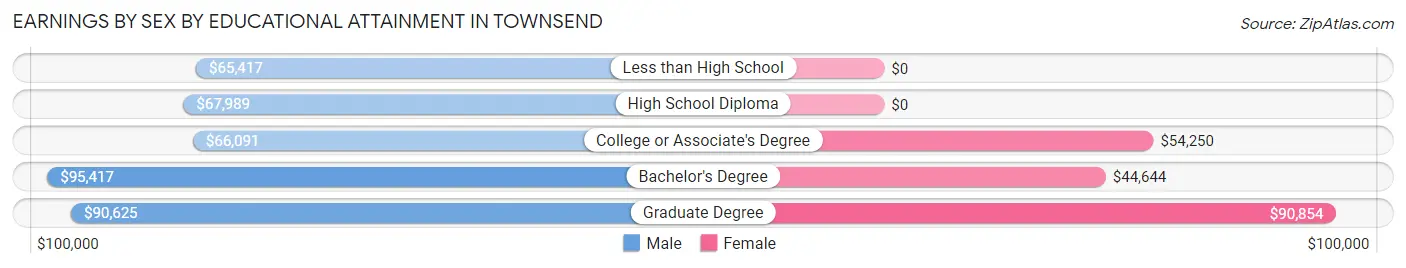
Earnings by Sex by Educational Attainment in Townsend
Average earnings in Townsend are $68,589 for men and $63,594 for women, a difference of 7.3%. Men with an educational attainment of bachelor's degree enjoy the highest average annual earnings of $95,417, while those with less than high school education earn the least with $65,417. Women with an educational attainment of graduate degree earn the most with the average annual earnings of $90,854, while those with bachelor's degree education have the smallest earnings of $44,644.
| Educational Attainment | Male Income | Female Income |
| Less than High School | $65,417 | $0 |
| High School Diploma | $67,989 | $0 |
| College or Associate's Degree | $66,091 | $54,250 |
| Bachelor's Degree | $95,417 | $44,644 |
| Graduate Degree | $90,625 | $90,854 |
| Total | $68,589 | $63,594 |
Family Income in Townsend
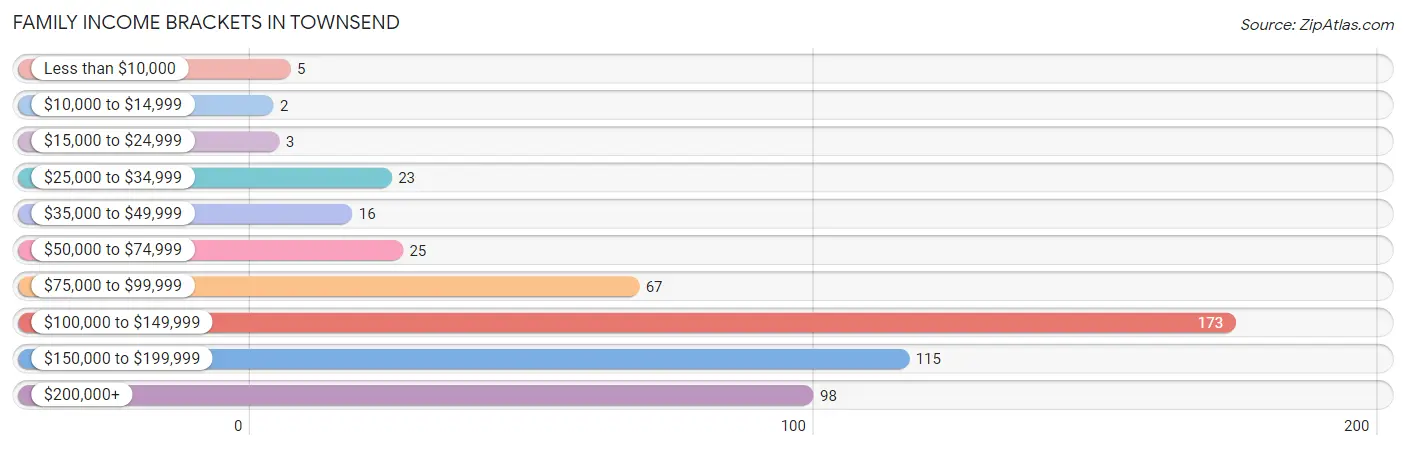
Family Income Brackets in Townsend
According to the Townsend family income data, there are 173 families falling into the $100,000 to $149,999 income range, which is the most common income bracket and makes up 32.8% of all families. Conversely, the $10,000 to $14,999 income bracket is the least frequent group with only 2 families (0.4%) belonging to this category.
| Income Bracket | # Families | % Families |
| Less than $10,000 | 5 | 0.9% |
| $10,000 to $14,999 | 2 | 0.4% |
| $15,000 to $24,999 | 3 | 0.6% |
| $25,000 to $34,999 | 23 | 4.4% |
| $35,000 to $49,999 | 16 | 3.0% |
| $50,000 to $74,999 | 25 | 4.7% |
| $75,000 to $99,999 | 67 | 12.7% |
| $100,000 to $149,999 | 173 | 32.8% |
| $150,000 to $199,999 | 115 | 21.8% |
| $200,000+ | 98 | 18.6% |
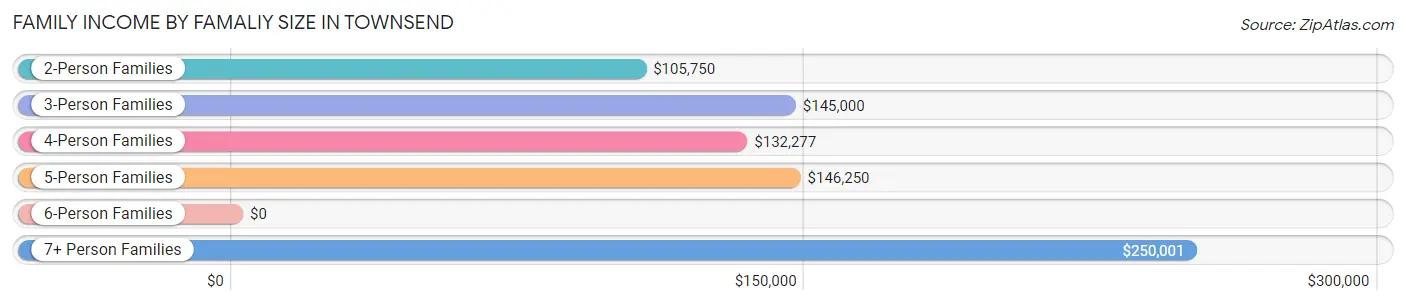
Family Income by Famaliy Size in Townsend
7+ person families (23 | 4.4%) account for the highest median family income in Townsend with $250,001 per family, while 2-person families (101 | 19.2%) have the highest median income of $52,875 per family member.
| Income Bracket | # Families | Median Income |
| 2-Person Families | 101 (19.2%) | $105,750 |
| 3-Person Families | 126 (23.9%) | $145,000 |
| 4-Person Families | 161 (30.5%) | $132,277 |
| 5-Person Families | 80 (15.2%) | $146,250 |
| 6-Person Families | 36 (6.8%) | $0 |
| 7+ Person Families | 23 (4.4%) | $250,001 |
| Total | 527 (100.0%) | $132,460 |
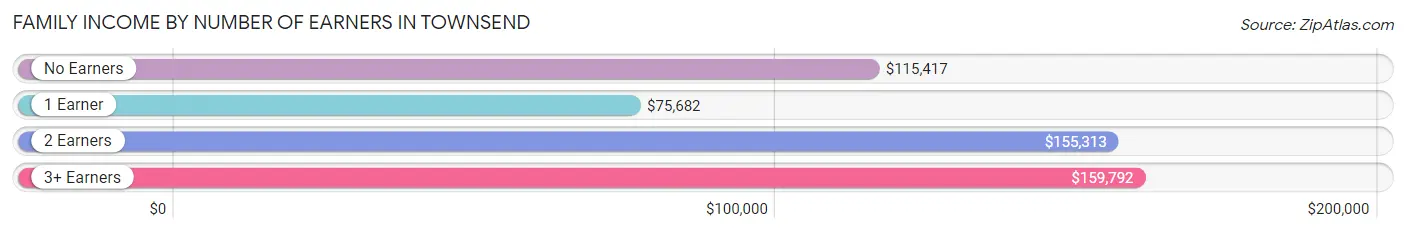
Family Income by Number of Earners in Townsend
The median family income in Townsend is $132,460, with families comprising 3+ earners (85) having the highest median family income of $159,792, while families with 1 earner (120) have the lowest median family income of $75,682, accounting for 16.1% and 22.8% of families, respectively.
| Number of Earners | # Families | Median Income |
| No Earners | 15 (2.9%) | $115,417 |
| 1 Earner | 120 (22.8%) | $75,682 |
| 2 Earners | 307 (58.3%) | $155,313 |
| 3+ Earners | 85 (16.1%) | $159,792 |
| Total | 527 (100.0%) | $132,460 |
Household Income in Townsend
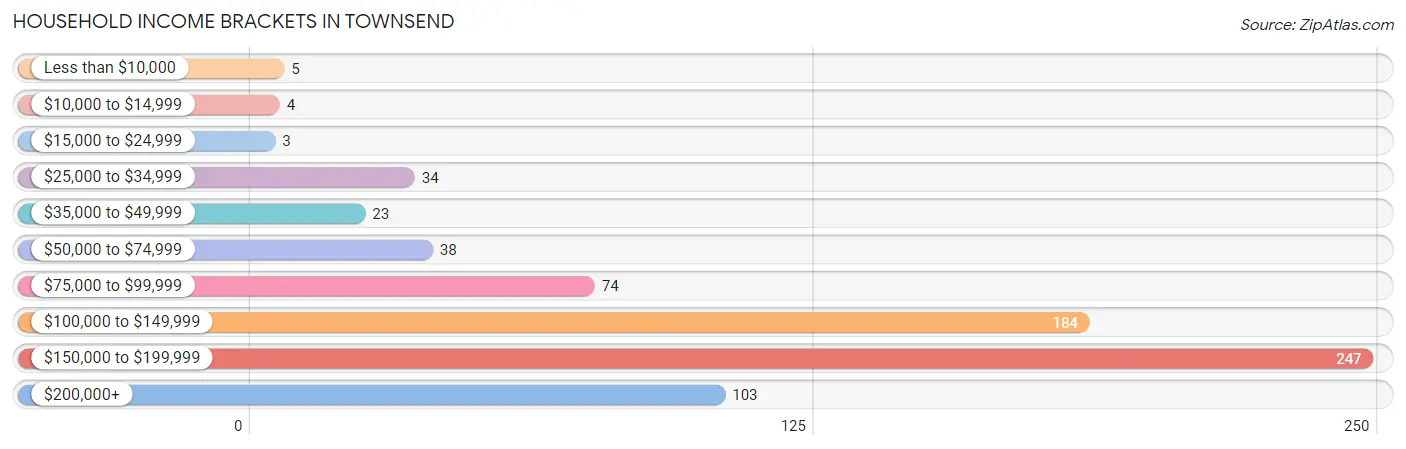
Household Income Brackets in Townsend
With 247 households falling in the category, the $150,000 to $199,999 income range is the most frequent in Townsend, accounting for 34.5% of all households. In contrast, only 3 households (0.4%) fall into the $15,000 to $24,999 income bracket, making it the least populous group.
| Income Bracket | # Households | % Households |
| Less than $10,000 | 5 | 0.7% |
| $10,000 to $14,999 | 4 | 0.6% |
| $15,000 to $24,999 | 3 | 0.4% |
| $25,000 to $34,999 | 34 | 4.8% |
| $35,000 to $49,999 | 23 | 3.2% |
| $50,000 to $74,999 | 38 | 5.3% |
| $75,000 to $99,999 | 74 | 10.3% |
| $100,000 to $149,999 | 184 | 25.7% |
| $150,000 to $199,999 | 247 | 34.5% |
| $200,000+ | 103 | 14.4% |
Household Income by Householder Age in Townsend
The median household income in Townsend is $147,917, with the highest median household income of $156,059 found in the 45 to 64 years age bracket for the primary householder. A total of 348 households (48.7%) fall into this category. Meanwhile, the 15 to 24 years age bracket for the primary householder has the lowest median household income of $0, with 5 households (0.7%) in this group.
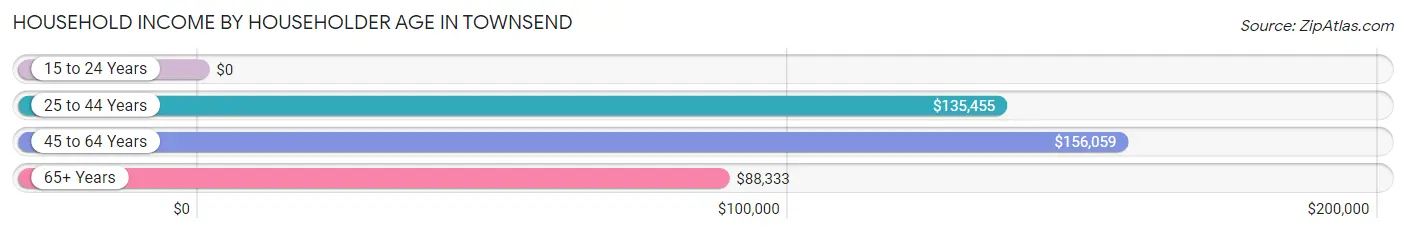
| Income Bracket | # Households | Median Income |
| 15 to 24 Years | 5 (0.7%) | $0 |
| 25 to 44 Years | 294 (41.1%) | $135,455 |
| 45 to 64 Years | 348 (48.7%) | $156,059 |
| 65+ Years | 68 (9.5%) | $88,333 |
| Total | 715 (100.0%) | $147,917 |
Poverty in Townsend
Income Below Poverty by Sex and Age in Townsend
With 0.8% poverty level for males and 2.1% for females among the residents of Townsend, 5 year old males and 18 to 24 year old females are the most vulnerable to poverty, with 2 males (3.8%) and 5 females (12.8%) in their respective age groups living below the poverty level.
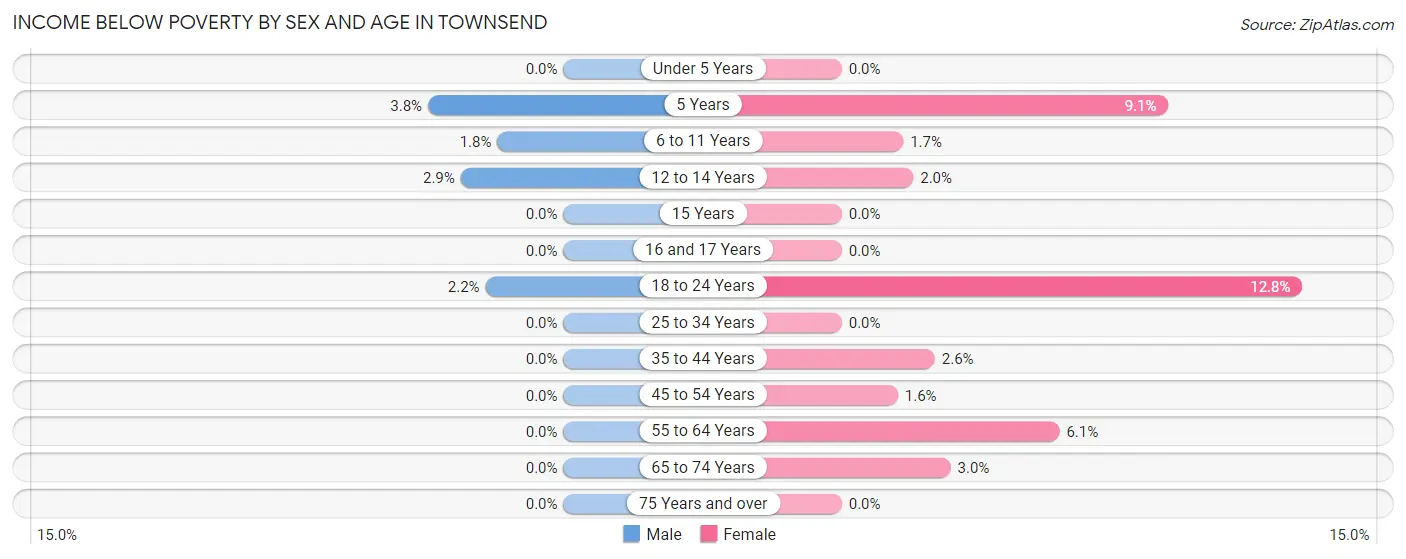
| Age Bracket | Male | Female |
| Under 5 Years | 0 (0.0%) | 0 (0.0%) |
| 5 Years | 2 (3.8%) | 2 (9.1%) |
| 6 to 11 Years | 3 (1.8%) | 2 (1.7%) |
| 12 to 14 Years | 3 (2.9%) | 3 (2.0%) |
| 15 Years | 0 (0.0%) | 0 (0.0%) |
| 16 and 17 Years | 0 (0.0%) | 0 (0.0%) |
| 18 to 24 Years | 3 (2.2%) | 5 (12.8%) |
| 25 to 34 Years | 0 (0.0%) | 0 (0.0%) |
| 35 to 44 Years | 0 (0.0%) | 5 (2.6%) |
| 45 to 54 Years | 0 (0.0%) | 7 (1.6%) |
| 55 to 64 Years | 0 (0.0%) | 4 (6.1%) |
| 65 to 74 Years | 0 (0.0%) | 2 (3.0%) |
| 75 Years and over | 0 (0.0%) | 0 (0.0%) |
| Total | 11 (0.8%) | 30 (2.1%) |
Income Above Poverty by Sex and Age in Townsend
According to the poverty statistics in Townsend, males aged under 5 years and females aged under 5 years are the age groups that are most secure financially, with 100.0% of males and 100.0% of females in these age groups living above the poverty line.
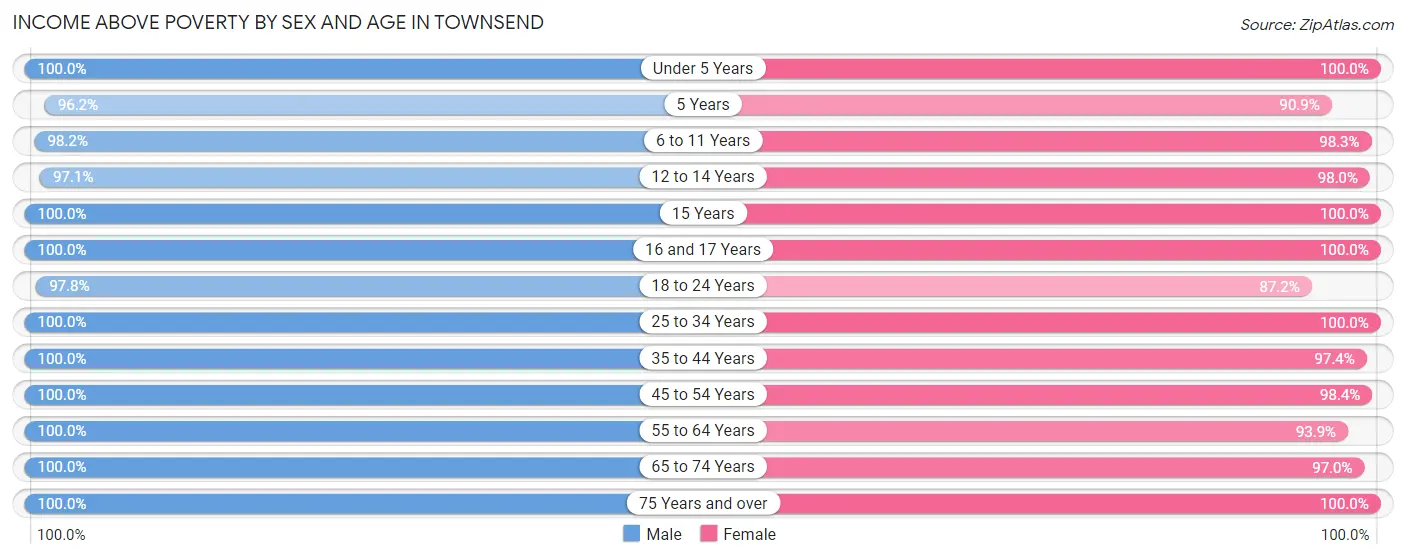
| Age Bracket | Male | Female |
| Under 5 Years | 62 (100.0%) | 104 (100.0%) |
| 5 Years | 51 (96.2%) | 20 (90.9%) |
| 6 to 11 Years | 160 (98.2%) | 115 (98.3%) |
| 12 to 14 Years | 102 (97.1%) | 148 (98.0%) |
| 15 Years | 17 (100.0%) | 12 (100.0%) |
| 16 and 17 Years | 21 (100.0%) | 46 (100.0%) |
| 18 to 24 Years | 135 (97.8%) | 34 (87.2%) |
| 25 to 34 Years | 183 (100.0%) | 121 (100.0%) |
| 35 to 44 Years | 235 (100.0%) | 188 (97.4%) |
| 45 to 54 Years | 209 (100.0%) | 443 (98.4%) |
| 55 to 64 Years | 55 (100.0%) | 62 (93.9%) |
| 65 to 74 Years | 48 (100.0%) | 64 (97.0%) |
| 75 Years and over | 16 (100.0%) | 23 (100.0%) |
| Total | 1,294 (99.2%) | 1,380 (97.9%) |
Income Below Poverty Among Married-Couple Families in Townsend
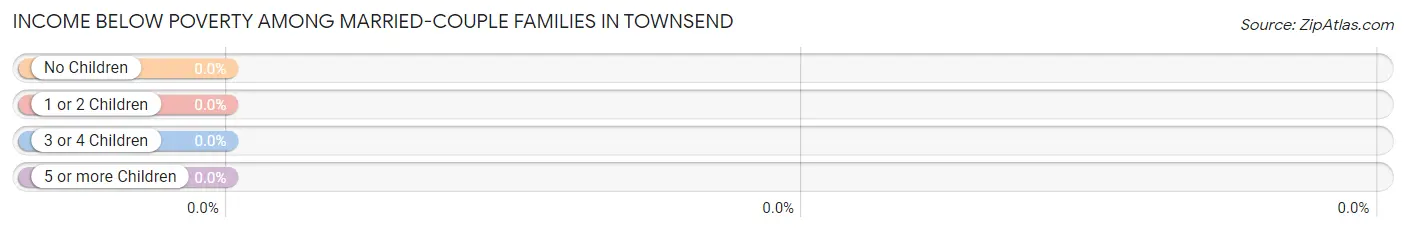
| Children | Above Poverty | Below Poverty |
| No Children | 129 (100.0%) | 0 (0.0%) |
| 1 or 2 Children | 222 (100.0%) | 0 (0.0%) |
| 3 or 4 Children | 83 (100.0%) | 0 (0.0%) |
| 5 or more Children | 3 (100.0%) | 0 (0.0%) |
| Total | 437 (100.0%) | 0 (0.0%) |
Income Below Poverty Among Single-Parent Households in Townsend
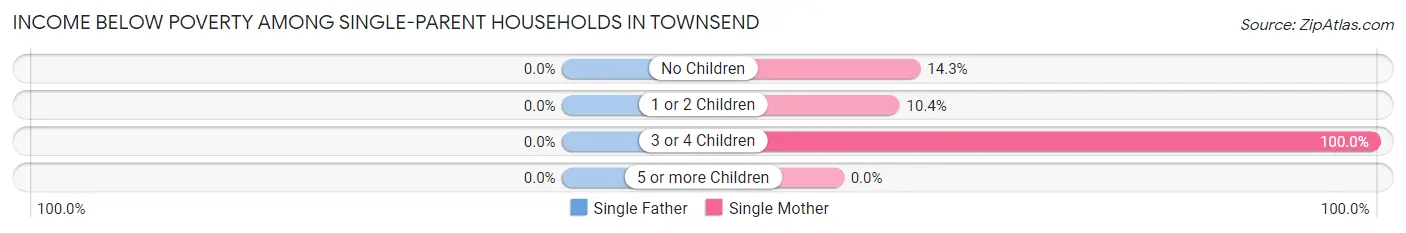
| Children | Single Father | Single Mother |
| No Children | 0 (0.0%) | 3 (14.3%) |
| 1 or 2 Children | 0 (0.0%) | 5 (10.4%) |
| 3 or 4 Children | 0 (0.0%) | 2 (100.0%) |
| 5 or more Children | 0 (0.0%) | 0 (0.0%) |
| Total | 0 (0.0%) | 10 (14.1%) |
Income Below Poverty Among Married-Couple vs Single-Parent Households in Townsend
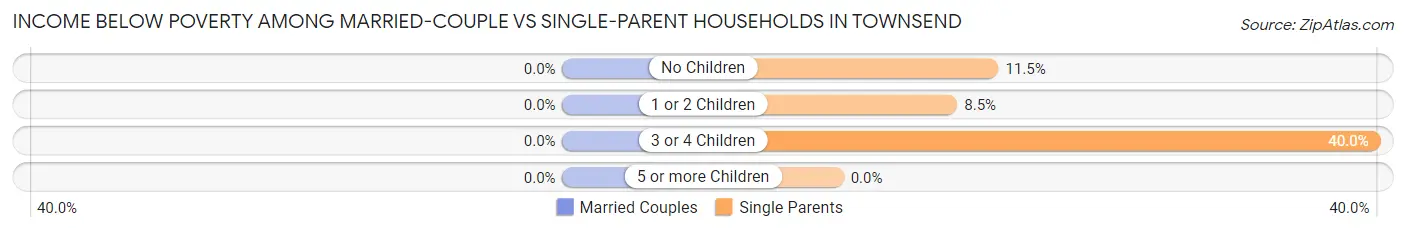
| Children | Married-Couple Families | Single-Parent Households |
| No Children | 0 (0.0%) | 3 (11.5%) |
| 1 or 2 Children | 0 (0.0%) | 5 (8.5%) |
| 3 or 4 Children | 0 (0.0%) | 2 (40.0%) |
| 5 or more Children | 0 (0.0%) | 0 (0.0%) |
| Total | 0 (0.0%) | 10 (11.1%) |
Race in Townsend
The most populous races in Townsend are White / Caucasian (1,229 | 45.1%), Black / African American (1,083 | 39.7%), and Two or more Races (284 | 10.4%).
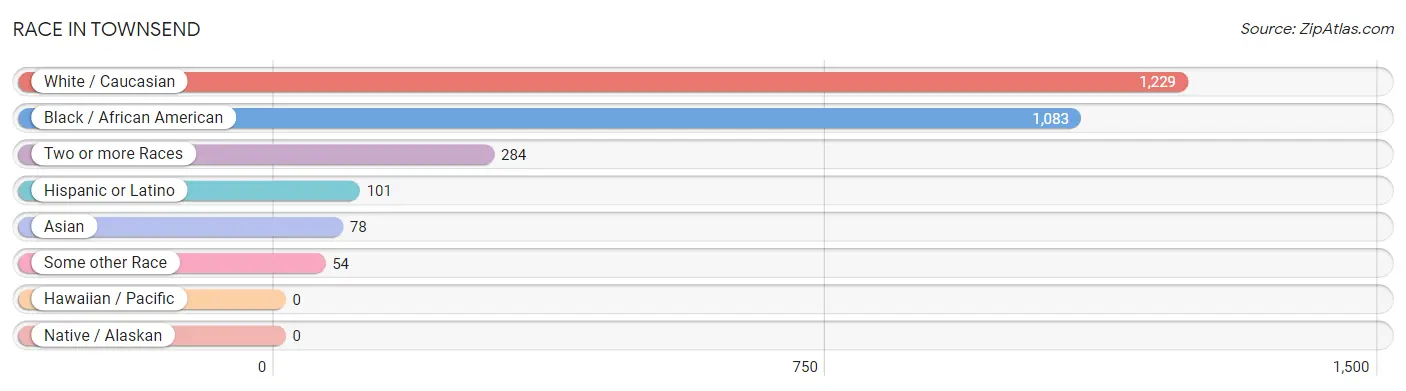
| Race | # Population | % Population |
| Asian | 78 | 2.9% |
| Black / African American | 1,083 | 39.7% |
| Hawaiian / Pacific | 0 | 0.0% |
| Hispanic or Latino | 101 | 3.7% |
| Native / Alaskan | 0 | 0.0% |
| White / Caucasian | 1,229 | 45.1% |
| Two or more Races | 284 | 10.4% |
| Some other Race | 54 | 2.0% |
| Total | 2,728 | 100.0% |
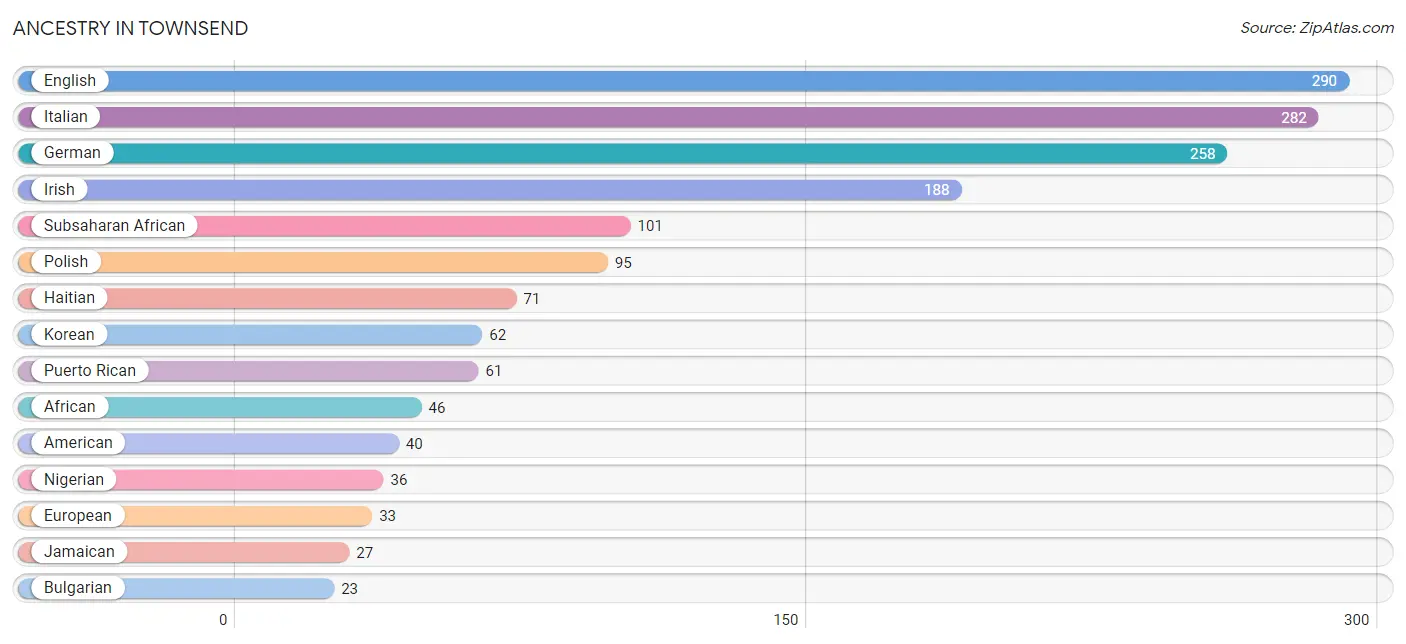
Ancestry in Townsend
The most populous ancestries reported in Townsend are English (290 | 10.6%), Italian (282 | 10.3%), German (258 | 9.5%), Irish (188 | 6.9%), and Subsaharan African (101 | 3.7%), together accounting for 41.0% of all Townsend residents.
| Ancestry | # Population | % Population |
| African | 46 | 1.7% |
| American | 40 | 1.5% |
| Arab | 1 | 0.0% |
| Austrian | 3 | 0.1% |
| Brazilian | 3 | 0.1% |
| British | 3 | 0.1% |
| Bulgarian | 23 | 0.8% |
| Burmese | 7 | 0.3% |
| Canadian | 17 | 0.6% |
| Central American | 2 | 0.1% |
| Crow | 2 | 0.1% |
| Danish | 6 | 0.2% |
| Dominican | 8 | 0.3% |
| Dutch | 12 | 0.4% |
| Eastern European | 5 | 0.2% |
| Ecuadorian | 5 | 0.2% |
| English | 290 | 10.6% |
| European | 33 | 1.2% |
| French | 20 | 0.7% |
| French Canadian | 5 | 0.2% |
| German | 258 | 9.5% |
| Ghanaian | 16 | 0.6% |
| Greek | 11 | 0.4% |
| Guyanese | 13 | 0.5% |
| Haitian | 71 | 2.6% |
| Honduran | 2 | 0.1% |
| Indian (Asian) | 6 | 0.2% |
| Irish | 188 | 6.9% |
| Italian | 282 | 10.3% |
| Jamaican | 27 | 1.0% |
| Kenyan | 3 | 0.1% |
| Korean | 62 | 2.3% |
| Lebanese | 1 | 0.0% |
| Mexican | 17 | 0.6% |
| Nigerian | 36 | 1.3% |
| Northern European | 22 | 0.8% |
| Pennsylvania German | 3 | 0.1% |
| Polish | 95 | 3.5% |
| Puerto Rican | 61 | 2.2% |
| Russian | 13 | 0.5% |
| Scandinavian | 3 | 0.1% |
| Scottish | 16 | 0.6% |
| South American | 5 | 0.2% |
| Spanish | 3 | 0.1% |
| Sri Lankan | 10 | 0.4% |
| Subsaharan African | 101 | 3.7% |
| Swedish | 2 | 0.1% |
| Thai | 10 | 0.4% |
| Trinidadian and Tobagonian | 21 | 0.8% |
| Welsh | 2 | 0.1% | View All 50 Rows |
Immigrants in Townsend
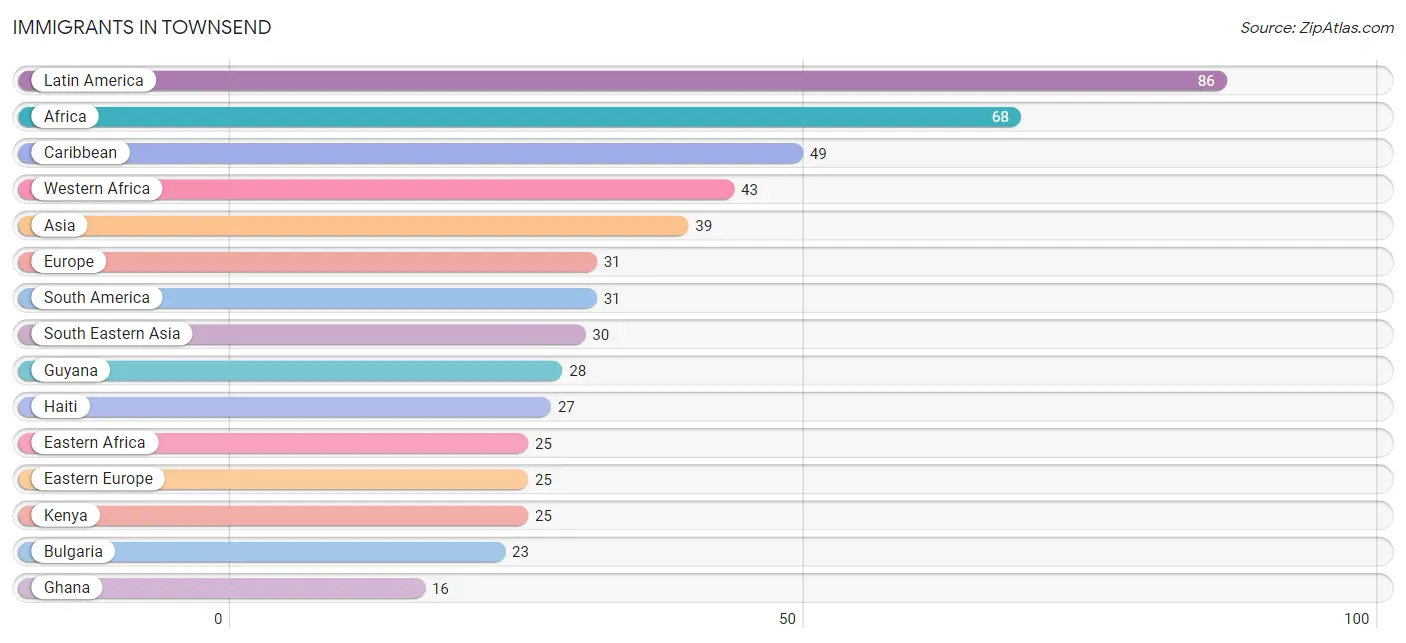
The most numerous immigrant groups reported in Townsend came from Latin America (86 | 3.2%), Africa (68 | 2.5%), Caribbean (49 | 1.8%), Western Africa (43 | 1.6%), and Asia (39 | 1.4%), together accounting for 10.5% of all Townsend residents.
| Immigration Origin | # Population | % Population |
| Africa | 68 | 2.5% |
| Asia | 39 | 1.4% |
| Barbados | 4 | 0.2% |
| Brazil | 3 | 0.1% |
| Bulgaria | 23 | 0.8% |
| Caribbean | 49 | 1.8% |
| Central America | 6 | 0.2% |
| China | 6 | 0.2% |
| Dominican Republic | 9 | 0.3% |
| Eastern Africa | 25 | 0.9% |
| Eastern Asia | 8 | 0.3% |
| Eastern Europe | 25 | 0.9% |
| Europe | 31 | 1.1% |
| Germany | 6 | 0.2% |
| Ghana | 16 | 0.6% |
| Guyana | 28 | 1.0% |
| Haiti | 27 | 1.0% |
| Honduras | 2 | 0.1% |
| India | 1 | 0.0% |
| Jamaica | 9 | 0.3% |
| Kenya | 25 | 0.9% |
| Korea | 2 | 0.1% |
| Latin America | 86 | 3.2% |
| Mexico | 4 | 0.2% |
| Nigeria | 16 | 0.6% |
| Philippines | 16 | 0.6% |
| Poland | 2 | 0.1% |
| South America | 31 | 1.1% |
| South Central Asia | 1 | 0.0% |
| South Eastern Asia | 30 | 1.1% |
| Vietnam | 14 | 0.5% |
| Western Africa | 43 | 1.6% |
| Western Europe | 6 | 0.2% | View All 33 Rows |
Sex and Age in Townsend
Sex and Age in Townsend
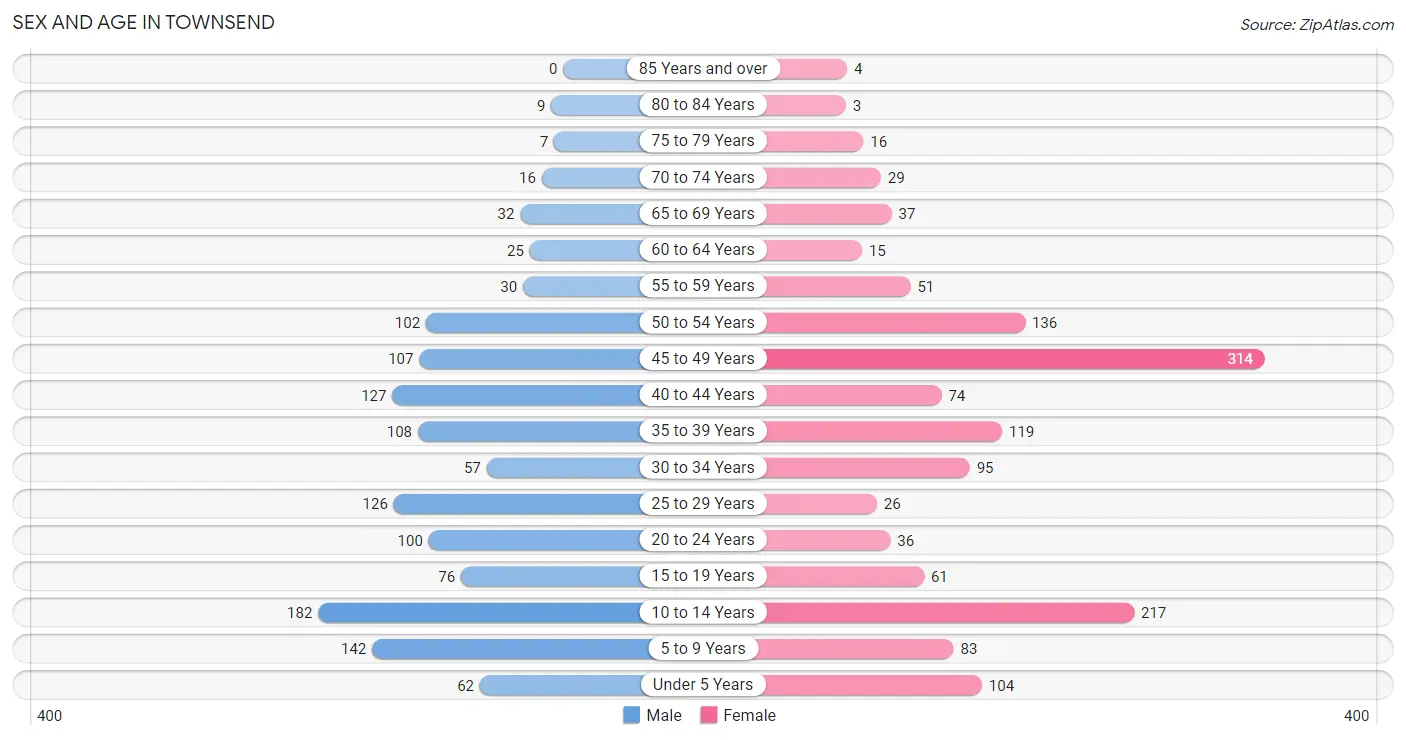
The most populous age groups in Townsend are 10 to 14 Years (182 | 13.9%) for men and 45 to 49 Years (314 | 22.1%) for women.
| Age Bracket | Male | Female |
| Under 5 Years | 62 (4.7%) | 104 (7.3%) |
| 5 to 9 Years | 142 (10.9%) | 83 (5.9%) |
| 10 to 14 Years | 182 (13.9%) | 217 (15.3%) |
| 15 to 19 Years | 76 (5.8%) | 61 (4.3%) |
| 20 to 24 Years | 100 (7.6%) | 36 (2.5%) |
| 25 to 29 Years | 126 (9.6%) | 26 (1.8%) |
| 30 to 34 Years | 57 (4.4%) | 95 (6.7%) |
| 35 to 39 Years | 108 (8.3%) | 119 (8.4%) |
| 40 to 44 Years | 127 (9.7%) | 74 (5.2%) |
| 45 to 49 Years | 107 (8.2%) | 314 (22.1%) |
| 50 to 54 Years | 102 (7.8%) | 136 (9.6%) |
| 55 to 59 Years | 30 (2.3%) | 51 (3.6%) |
| 60 to 64 Years | 25 (1.9%) | 15 (1.1%) |
| 65 to 69 Years | 32 (2.5%) | 37 (2.6%) |
| 70 to 74 Years | 16 (1.2%) | 29 (2.0%) |
| 75 to 79 Years | 7 (0.5%) | 16 (1.1%) |
| 80 to 84 Years | 9 (0.7%) | 3 (0.2%) |
| 85 Years and over | 0 (0.0%) | 4 (0.3%) |
| Total | 1,308 (100.0%) | 1,420 (100.0%) |
Families and Households in Townsend
Median Family Size in Townsend
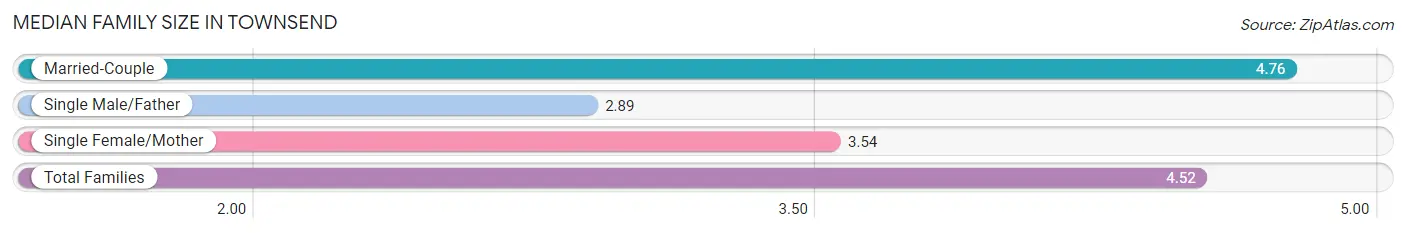
The median family size in Townsend is 4.52 persons per family, with married-couple families (437 | 82.9%) accounting for the largest median family size of 4.76 persons per family. On the other hand, single male/father families (19 | 3.6%) represent the smallest median family size with 2.89 persons per family.
| Family Type | # Families | Family Size |
| Married-Couple | 437 (82.9%) | 4.76 |
| Single Male/Father | 19 (3.6%) | 2.89 |
| Single Female/Mother | 71 (13.5%) | 3.54 |
| Total Families | 527 (100.0%) | 4.52 |
Median Household Size in Townsend
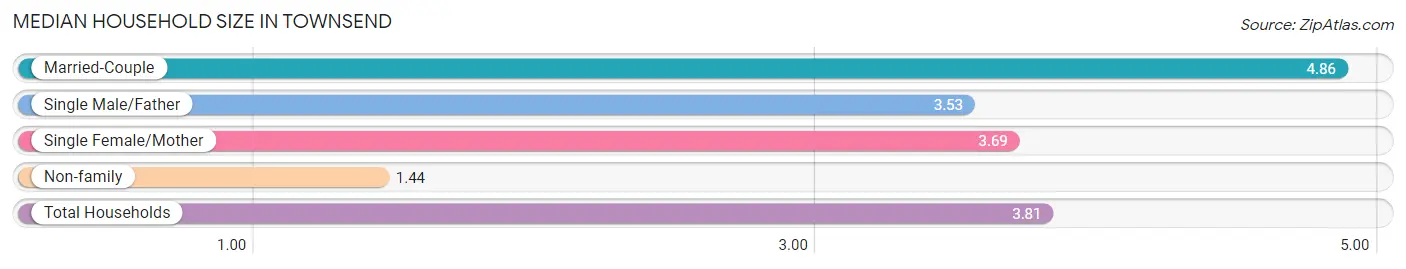
The median household size in Townsend is 3.81 persons per household, with married-couple households (437 | 61.1%) accounting for the largest median household size of 4.86 persons per household. non-family households (188 | 26.3%) represent the smallest median household size with 1.44 persons per household.
| Household Type | # Households | Household Size |
| Married-Couple | 437 (61.1%) | 4.86 |
| Single Male/Father | 19 (2.7%) | 3.53 |
| Single Female/Mother | 71 (9.9%) | 3.69 |
| Non-family | 188 (26.3%) | 1.44 |
| Total Households | 715 (100.0%) | 3.81 |
Household Size by Marriage Status in Townsend
Out of a total of 715 households in Townsend, 527 (73.7%) are family households, while 188 (26.3%) are nonfamily households. The most numerous type of family households are 4-person households, comprising 158, and the most common type of nonfamily households are 2-person households, comprising 131.
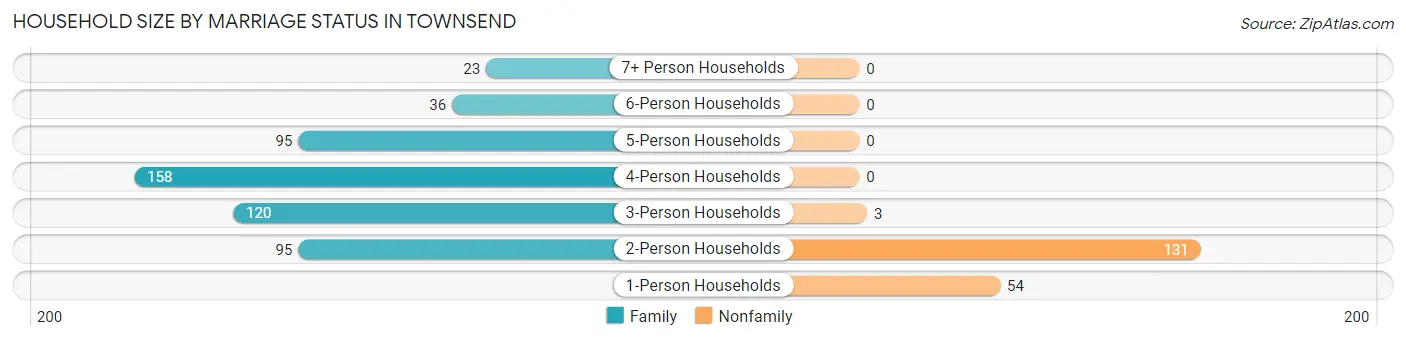
| Household Size | Family Households | Nonfamily Households |
| 1-Person Households | - | 54 (7.5%) |
| 2-Person Households | 95 (13.3%) | 131 (18.3%) |
| 3-Person Households | 120 (16.8%) | 3 (0.4%) |
| 4-Person Households | 158 (22.1%) | 0 (0.0%) |
| 5-Person Households | 95 (13.3%) | 0 (0.0%) |
| 6-Person Households | 36 (5.0%) | 0 (0.0%) |
| 7+ Person Households | 23 (3.2%) | 0 (0.0%) |
| Total | 527 (73.7%) | 188 (26.3%) |
Female Fertility in Townsend
Fertility by Age in Townsend
Average fertility rate in Townsend is 34.0 births per 1,000 women. Women in the age bracket of 20 to 34 years have the highest fertility rate with 45.0 births per 1,000 women. Women in the age bracket of 35 to 50 years acount for 72.0% of all women with births.
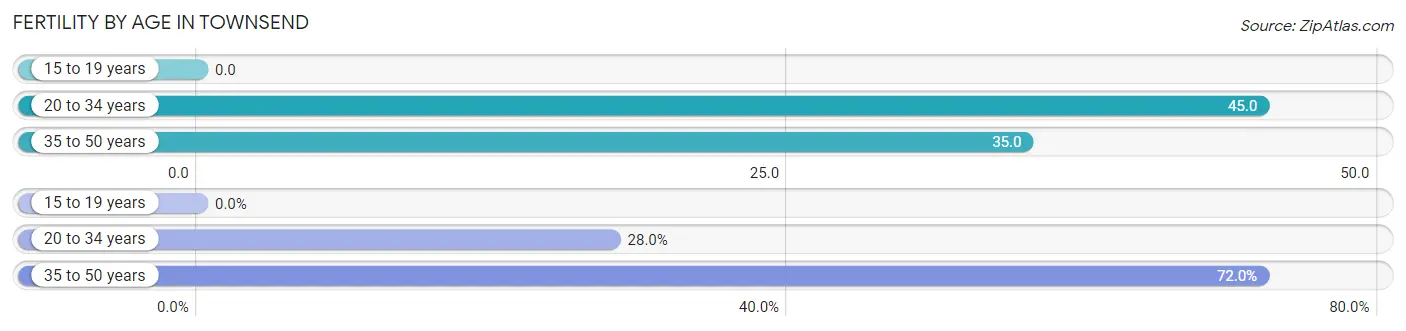
| Age Bracket | Women with Births | Births / 1,000 Women |
| 15 to 19 years | 0 (0.0%) | 0.0 |
| 20 to 34 years | 7 (28.0%) | 45.0 |
| 35 to 50 years | 18 (72.0%) | 35.0 |
| Total | 25 (100.0%) | 34.0 |
Fertility by Age by Marriage Status in Townsend
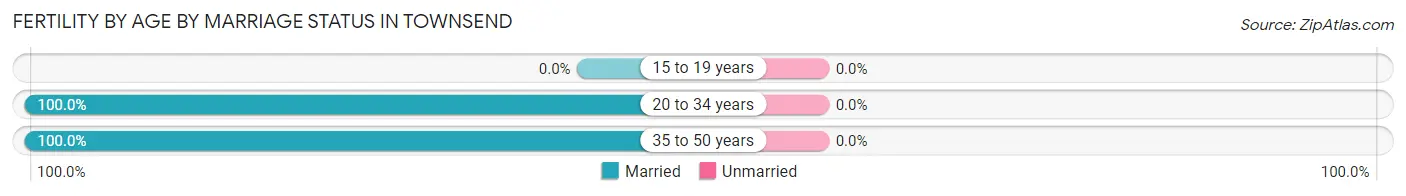
| Age Bracket | Married | Unmarried |
| 15 to 19 years | 0 (0.0%) | 0 (0.0%) |
| 20 to 34 years | 7 (100.0%) | 0 (0.0%) |
| 35 to 50 years | 18 (100.0%) | 0 (0.0%) |
| Total | 25 (100.0%) | 0 (0.0%) |
Fertility by Education in Townsend
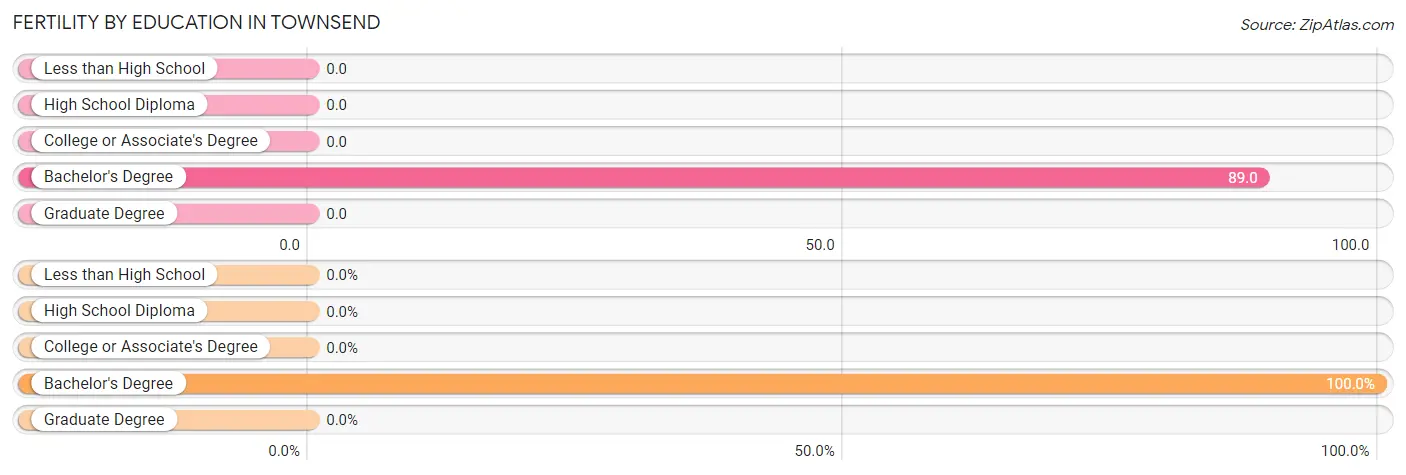
| Educational Attainment | Women with Births | Births / 1,000 Women |
| Less than High School | 0 (0.0%) | 0.0 |
| High School Diploma | 0 (0.0%) | 0.0 |
| College or Associate's Degree | 0 (0.0%) | 0.0 |
| Bachelor's Degree | 25 (100.0%) | 89.0 |
| Graduate Degree | 0 (0.0%) | 0.0 |
| Total | 25 (100.0%) | 34.0 |
Fertility by Education by Marriage Status in Townsend
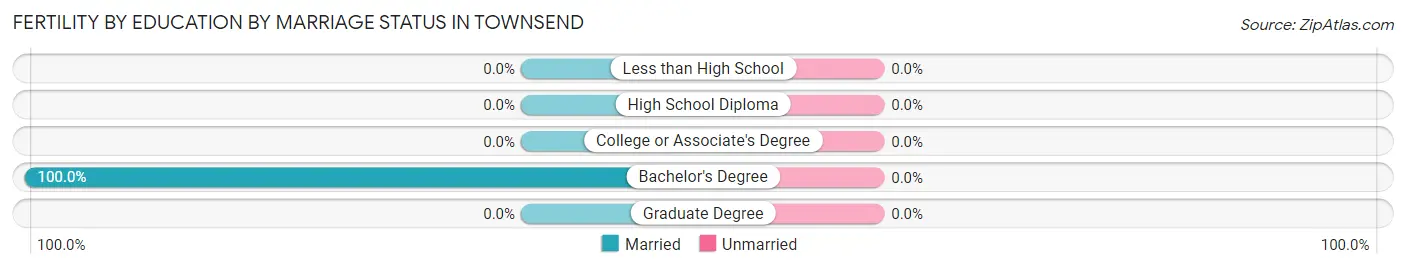
| Educational Attainment | Married | Unmarried |
| Less than High School | 0 (0.0%) | 0 (0.0%) |
| High School Diploma | 0 (0.0%) | 0 (0.0%) |
| College or Associate's Degree | 0 (0.0%) | 0 (0.0%) |
| Bachelor's Degree | 25 (100.0%) | 0 (0.0%) |
| Graduate Degree | 0 (0.0%) | 0 (0.0%) |
| Total | 25 (100.0%) | 0 (0.0%) |
Employment Characteristics in Townsend
Employment by Class of Employer in Townsend
Among the 1,522 employed individuals in Townsend, private company employees (1,061 | 69.7%), state government employees (217 | 14.3%), and not-for-profit organizations (89 | 5.9%) make up the most common classes of employment.
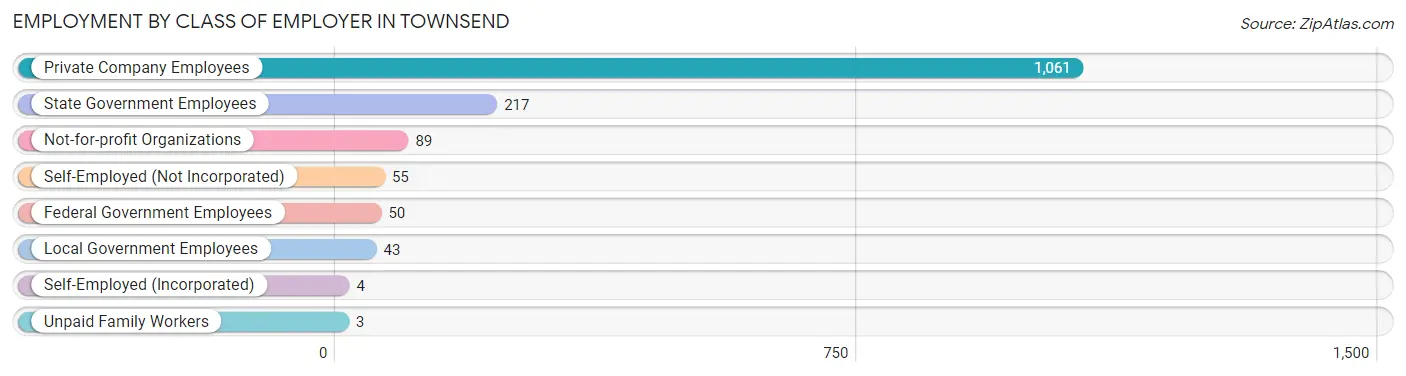
| Employer Class | # Employees | % Employees |
| Private Company Employees | 1,061 | 69.7% |
| Self-Employed (Incorporated) | 4 | 0.3% |
| Self-Employed (Not Incorporated) | 55 | 3.6% |
| Not-for-profit Organizations | 89 | 5.9% |
| Local Government Employees | 43 | 2.8% |
| State Government Employees | 217 | 14.3% |
| Federal Government Employees | 50 | 3.3% |
| Unpaid Family Workers | 3 | 0.2% |
| Total | 1,522 | 100.0% |
Employment Status by Age in Townsend
According to the labor force statistics for Townsend, out of the total population over 16 years of age (1,909), 82.7% or 1,579 individuals are in the labor force, with 2.5% or 39 of them unemployed. The age group with the highest labor force participation rate is 25 to 29 years, with 97.4% or 148 individuals in the labor force. Within the labor force, the 20 to 24 years age range has the highest percentage of unemployed individuals, with 17.2% or 16 of them being unemployed.
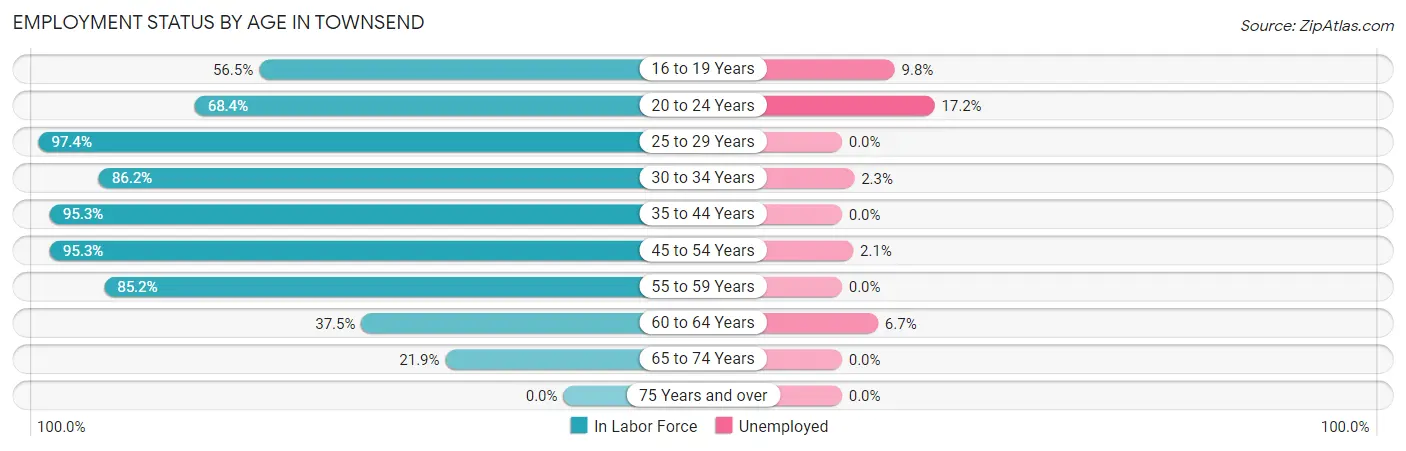
| Age Bracket | In Labor Force | Unemployed |
| 16 to 19 Years | 61 (56.5%) | 6 (9.8%) |
| 20 to 24 Years | 93 (68.4%) | 16 (17.2%) |
| 25 to 29 Years | 148 (97.4%) | 0 (0.0%) |
| 30 to 34 Years | 131 (86.2%) | 3 (2.3%) |
| 35 to 44 Years | 408 (95.3%) | 0 (0.0%) |
| 45 to 54 Years | 628 (95.3%) | 13 (2.1%) |
| 55 to 59 Years | 69 (85.2%) | 0 (0.0%) |
| 60 to 64 Years | 15 (37.5%) | 1 (6.7%) |
| 65 to 74 Years | 25 (21.9%) | 0 (0.0%) |
| 75 Years and over | 0 (0.0%) | 0 (0.0%) |
| Total | 1,579 (82.7%) | 39 (2.5%) |
Employment Status by Educational Attainment in Townsend
According to labor force statistics for Townsend, 92.5% of individuals (1,399) out of the total population between 25 and 64 years of age (1,512) are in the labor force, with 1.2% or 17 of them being unemployed. The group with the highest labor force participation rate are those with the educational attainment of college / associate degree, with 93.7% or 433 individuals in the labor force. Within the labor force, individuals with high school diploma education have the highest percentage of unemployment, with 2.4% or 7 of them being unemployed.
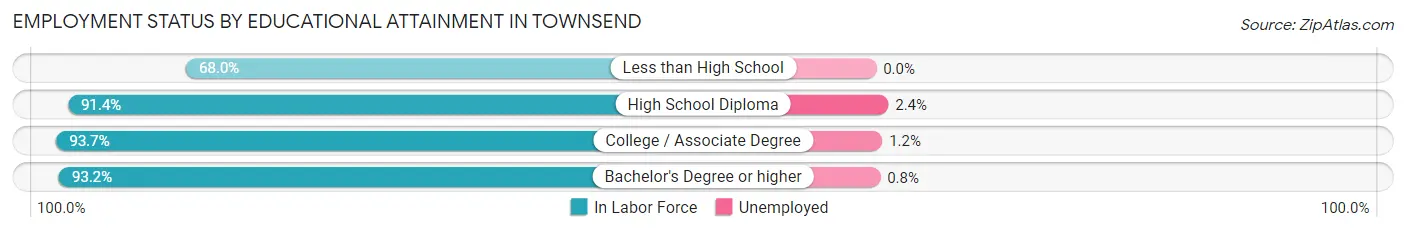
| Educational Attainment | In Labor Force | Unemployed |
| Less than High School | 17 (68.0%) | 0 (0.0%) |
| High School Diploma | 296 (91.4%) | 8 (2.4%) |
| College / Associate Degree | 433 (93.7%) | 6 (1.2%) |
| Bachelor's Degree or higher | 653 (93.2%) | 6 (0.8%) |
| Total | 1,399 (92.5%) | 18 (1.2%) |
Employment Occupations by Sex in Townsend
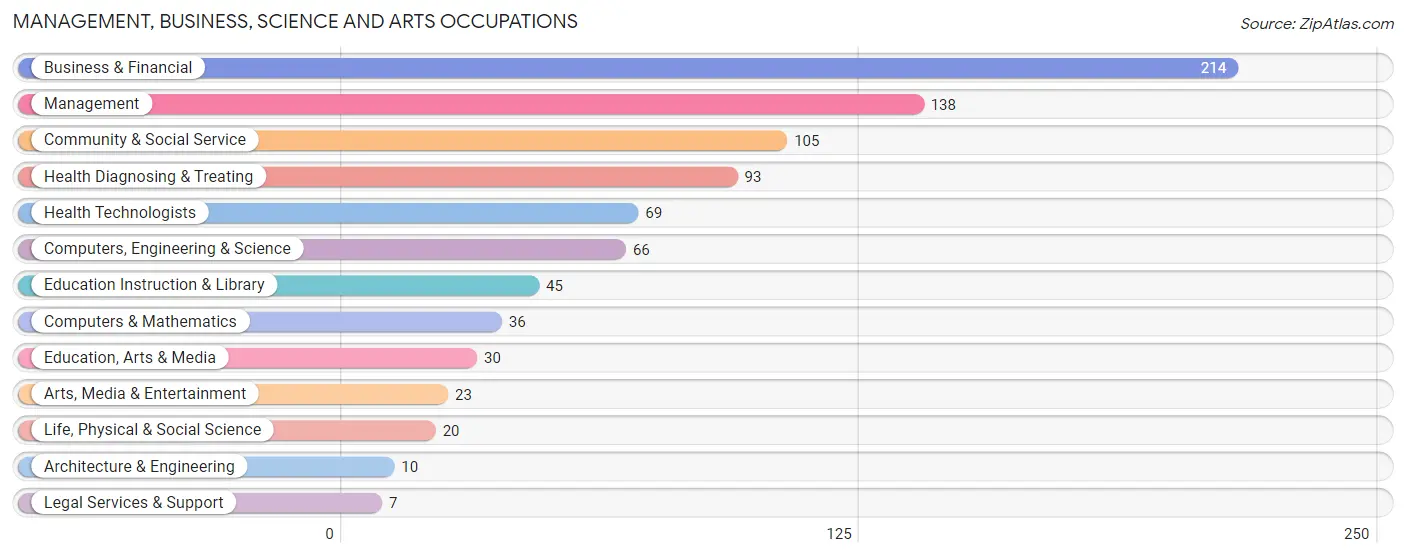
Management, Business, Science and Arts Occupations
The most common Management, Business, Science and Arts occupations in Townsend are Business & Financial (214 | 13.9%), Management (138 | 9.0%), Community & Social Service (105 | 6.8%), Health Diagnosing & Treating (93 | 6.1%), and Health Technologists (69 | 4.5%).
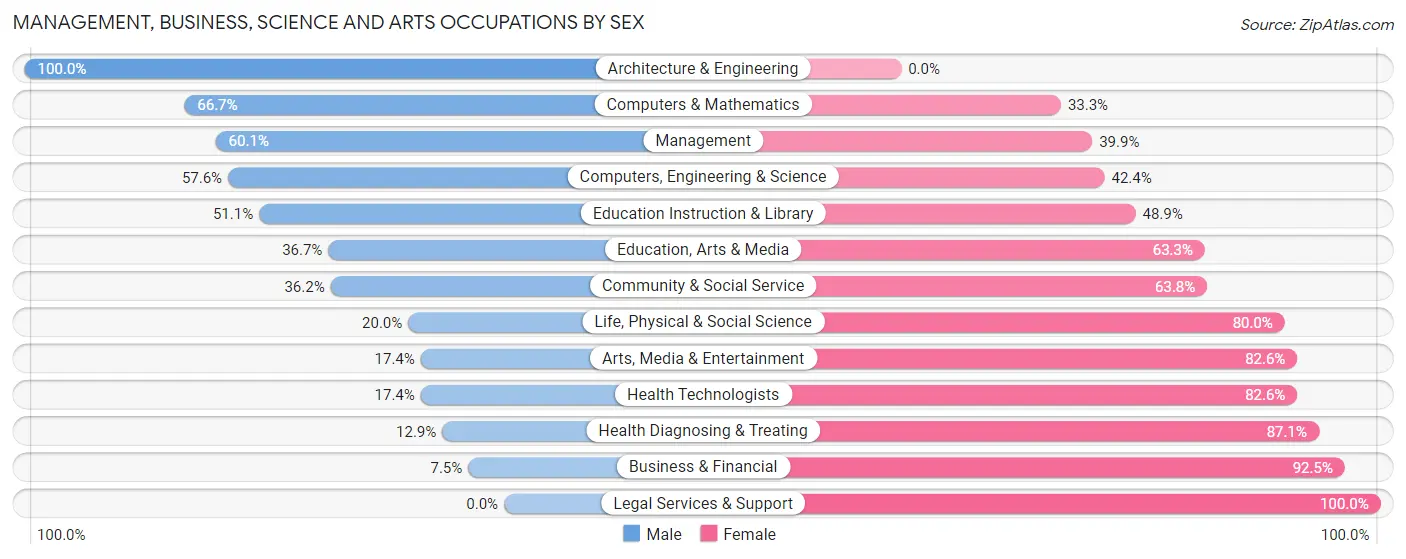
Management, Business, Science and Arts Occupations by Sex
Within the Management, Business, Science and Arts occupations in Townsend, the most male-oriented occupations are Architecture & Engineering (100.0%), Computers & Mathematics (66.7%), and Management (60.1%), while the most female-oriented occupations are Legal Services & Support (100.0%), Business & Financial (92.5%), and Health Diagnosing & Treating (87.1%).
| Occupation | Male | Female |
| Management | 83 (60.1%) | 55 (39.9%) |
| Business & Financial | 16 (7.5%) | 198 (92.5%) |
| Computers, Engineering & Science | 38 (57.6%) | 28 (42.4%) |
| Computers & Mathematics | 24 (66.7%) | 12 (33.3%) |
| Architecture & Engineering | 10 (100.0%) | 0 (0.0%) |
| Life, Physical & Social Science | 4 (20.0%) | 16 (80.0%) |
| Community & Social Service | 38 (36.2%) | 67 (63.8%) |
| Education, Arts & Media | 11 (36.7%) | 19 (63.3%) |
| Legal Services & Support | 0 (0.0%) | 7 (100.0%) |
| Education Instruction & Library | 23 (51.1%) | 22 (48.9%) |
| Arts, Media & Entertainment | 4 (17.4%) | 19 (82.6%) |
| Health Diagnosing & Treating | 12 (12.9%) | 81 (87.1%) |
| Health Technologists | 12 (17.4%) | 57 (82.6%) |
| Total (Category) | 187 (30.4%) | 429 (69.6%) |
| Total (Overall) | 743 (48.4%) | 792 (51.6%) |
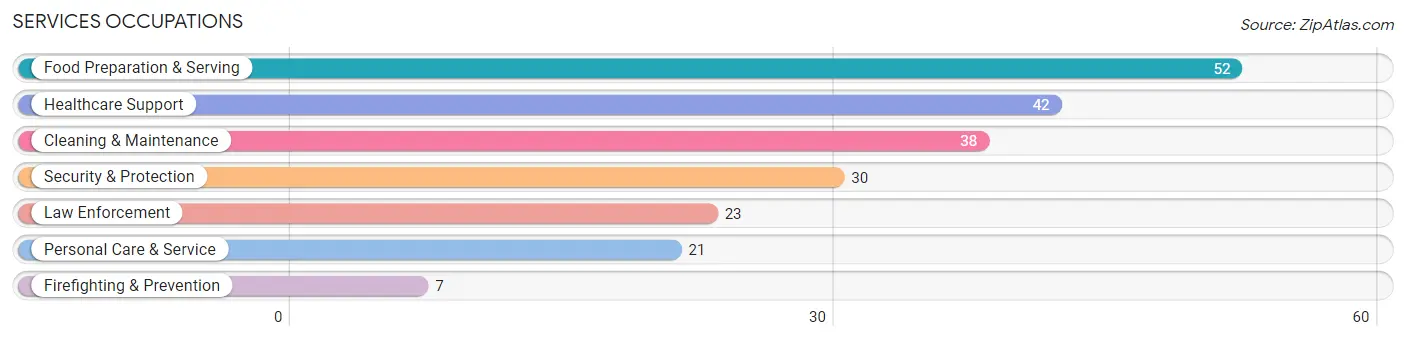
Services Occupations
The most common Services occupations in Townsend are Food Preparation & Serving (52 | 3.4%), Healthcare Support (42 | 2.7%), Cleaning & Maintenance (38 | 2.5%), Security & Protection (30 | 1.9%), and Law Enforcement (23 | 1.5%).
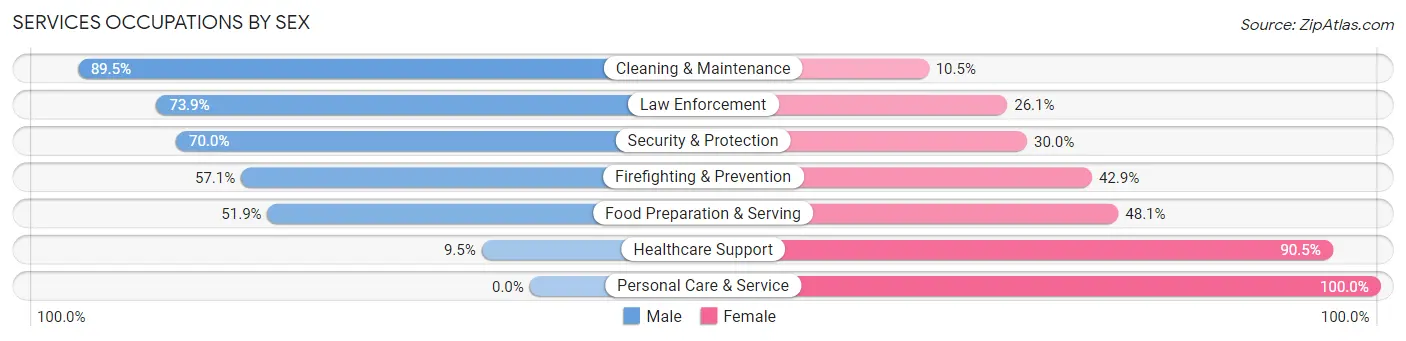
Services Occupations by Sex
Within the Services occupations in Townsend, the most male-oriented occupations are Cleaning & Maintenance (89.5%), Law Enforcement (73.9%), and Security & Protection (70.0%), while the most female-oriented occupations are Personal Care & Service (100.0%), Healthcare Support (90.5%), and Food Preparation & Serving (48.1%).
| Occupation | Male | Female |
| Healthcare Support | 4 (9.5%) | 38 (90.5%) |
| Security & Protection | 21 (70.0%) | 9 (30.0%) |
| Firefighting & Prevention | 4 (57.1%) | 3 (42.9%) |
| Law Enforcement | 17 (73.9%) | 6 (26.1%) |
| Food Preparation & Serving | 27 (51.9%) | 25 (48.1%) |
| Cleaning & Maintenance | 34 (89.5%) | 4 (10.5%) |
| Personal Care & Service | 0 (0.0%) | 21 (100.0%) |
| Total (Category) | 86 (47.0%) | 97 (53.0%) |
| Total (Overall) | 743 (48.4%) | 792 (51.6%) |
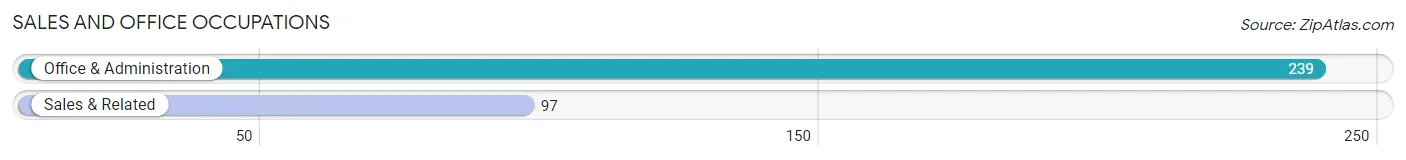
Sales and Office Occupations
The most common Sales and Office occupations in Townsend are Office & Administration (239 | 15.6%), and Sales & Related (97 | 6.3%).
Sales and Office Occupations by Sex
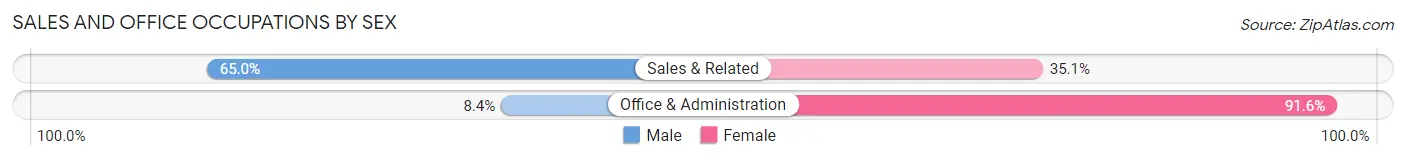
| Occupation | Male | Female |
| Sales & Related | 63 (64.9%) | 34 (35.0%) |
| Office & Administration | 20 (8.4%) | 219 (91.6%) |
| Total (Category) | 83 (24.7%) | 253 (75.3%) |
| Total (Overall) | 743 (48.4%) | 792 (51.6%) |
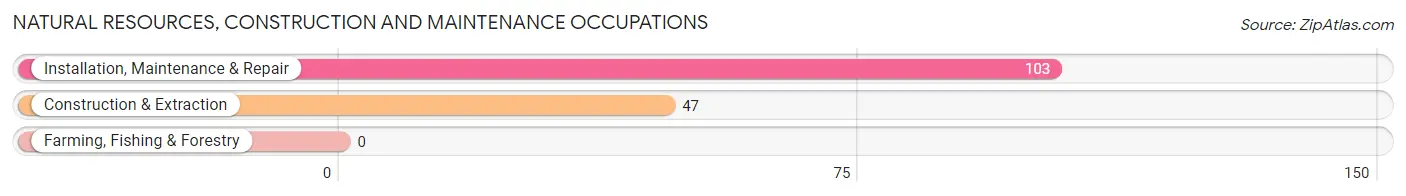
Natural Resources, Construction and Maintenance Occupations
The most common Natural Resources, Construction and Maintenance occupations in Townsend are Installation, Maintenance & Repair (103 | 6.7%), and Construction & Extraction (47 | 3.1%).
Natural Resources, Construction and Maintenance Occupations by Sex
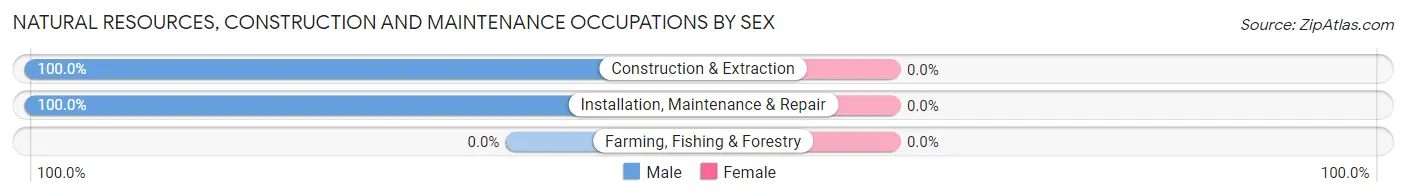
| Occupation | Male | Female |
| Farming, Fishing & Forestry | 0 (0.0%) | 0 (0.0%) |
| Construction & Extraction | 47 (100.0%) | 0 (0.0%) |
| Installation, Maintenance & Repair | 103 (100.0%) | 0 (0.0%) |
| Total (Category) | 150 (100.0%) | 0 (0.0%) |
| Total (Overall) | 743 (48.4%) | 792 (51.6%) |
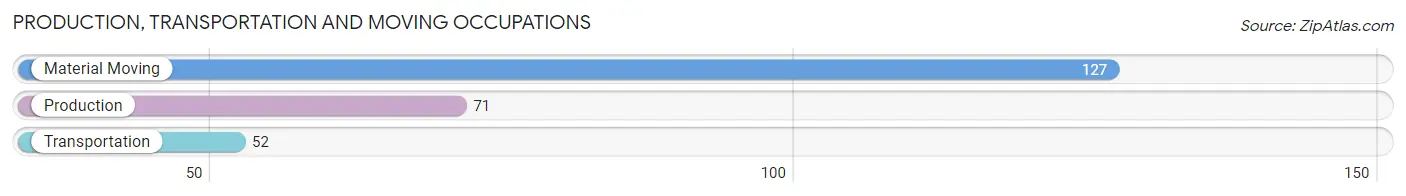
Production, Transportation and Moving Occupations
The most common Production, Transportation and Moving occupations in Townsend are Material Moving (127 | 8.3%), Production (71 | 4.6%), and Transportation (52 | 3.4%).
Production, Transportation and Moving Occupations by Sex
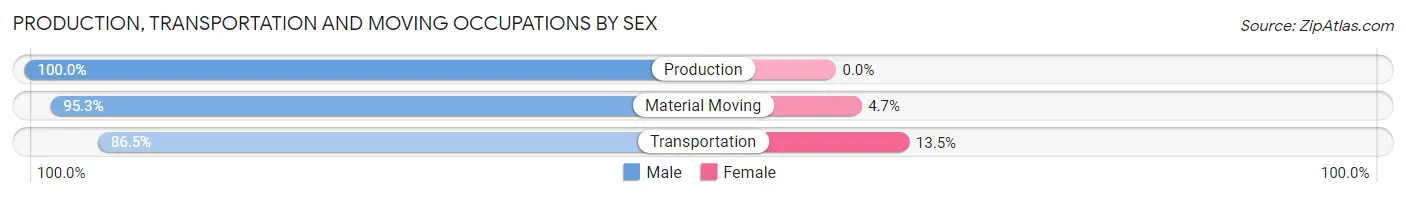
| Occupation | Male | Female |
| Production | 71 (100.0%) | 0 (0.0%) |
| Transportation | 45 (86.5%) | 7 (13.5%) |
| Material Moving | 121 (95.3%) | 6 (4.7%) |
| Total (Category) | 237 (94.8%) | 13 (5.2%) |
| Total (Overall) | 743 (48.4%) | 792 (51.6%) |
Employment Industries by Sex in Townsend
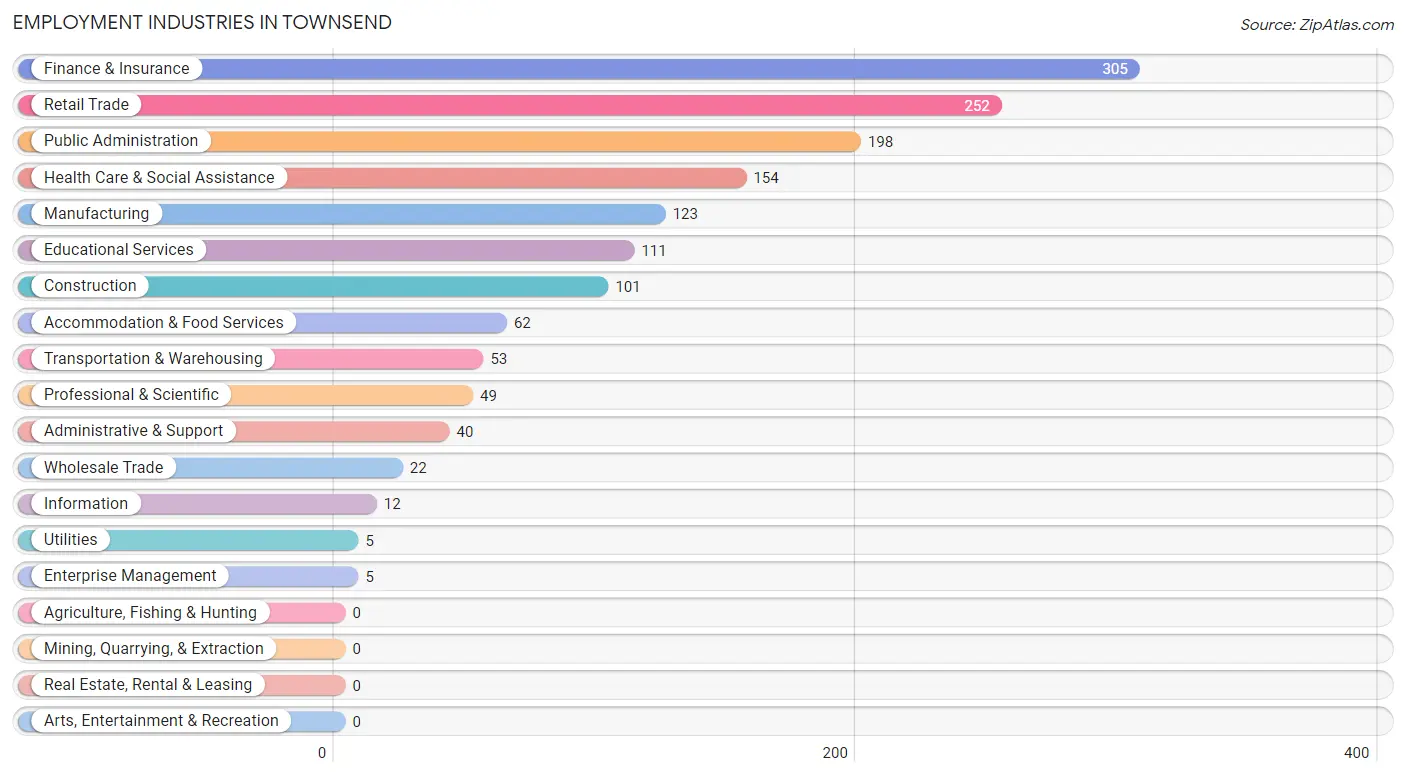
Employment Industries in Townsend
The major employment industries in Townsend include Finance & Insurance (305 | 19.9%), Retail Trade (252 | 16.4%), Public Administration (198 | 12.9%), Health Care & Social Assistance (154 | 10.0%), and Manufacturing (123 | 8.0%).
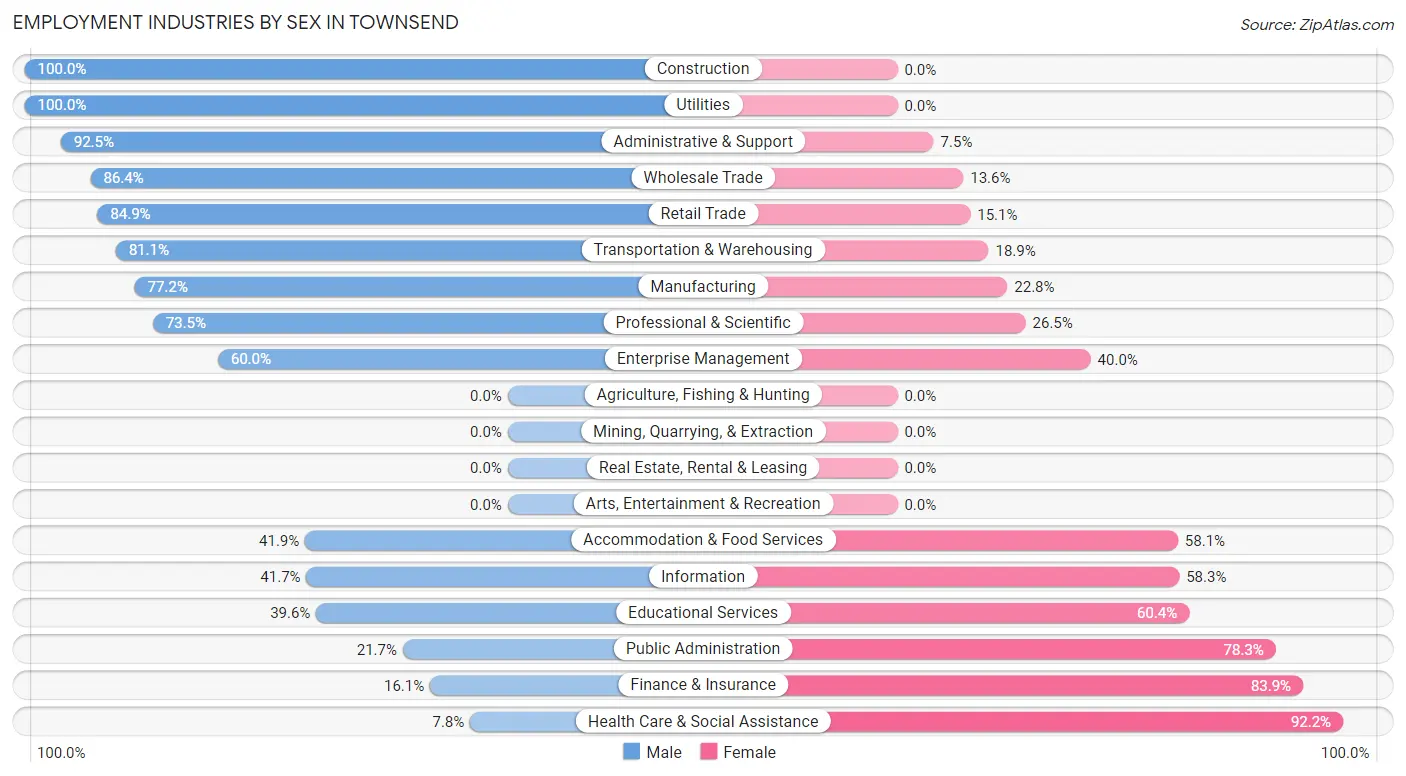
Employment Industries by Sex in Townsend
The Townsend industries that see more men than women are Construction (100.0%), Utilities (100.0%), and Administrative & Support (92.5%), whereas the industries that tend to have a higher number of women are Health Care & Social Assistance (92.2%), Finance & Insurance (83.9%), and Public Administration (78.3%).
| Industry | Male | Female |
| Agriculture, Fishing & Hunting | 0 (0.0%) | 0 (0.0%) |
| Mining, Quarrying, & Extraction | 0 (0.0%) | 0 (0.0%) |
| Construction | 101 (100.0%) | 0 (0.0%) |
| Manufacturing | 95 (77.2%) | 28 (22.8%) |
| Wholesale Trade | 19 (86.4%) | 3 (13.6%) |
| Retail Trade | 214 (84.9%) | 38 (15.1%) |
| Transportation & Warehousing | 43 (81.1%) | 10 (18.9%) |
| Utilities | 5 (100.0%) | 0 (0.0%) |
| Information | 5 (41.7%) | 7 (58.3%) |
| Finance & Insurance | 49 (16.1%) | 256 (83.9%) |
| Real Estate, Rental & Leasing | 0 (0.0%) | 0 (0.0%) |
| Professional & Scientific | 36 (73.5%) | 13 (26.5%) |
| Enterprise Management | 3 (60.0%) | 2 (40.0%) |
| Administrative & Support | 37 (92.5%) | 3 (7.5%) |
| Educational Services | 44 (39.6%) | 67 (60.4%) |
| Health Care & Social Assistance | 12 (7.8%) | 142 (92.2%) |
| Arts, Entertainment & Recreation | 0 (0.0%) | 0 (0.0%) |
| Accommodation & Food Services | 26 (41.9%) | 36 (58.1%) |
| Public Administration | 43 (21.7%) | 155 (78.3%) |
| Total | 743 (48.4%) | 792 (51.6%) |
Education in Townsend
School Enrollment in Townsend
The most common levels of schooling among the 978 students in Townsend are middle school (355 | 36.3%), elementary school (178 | 18.2%), and college / undergraduate (154 | 15.8%).
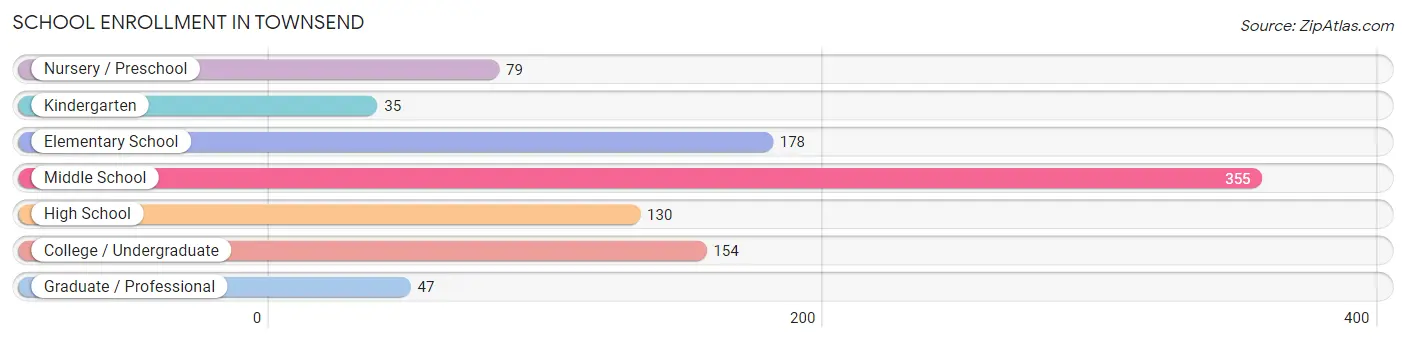
| School Level | # Students | % Students |
| Nursery / Preschool | 79 | 8.1% |
| Kindergarten | 35 | 3.6% |
| Elementary School | 178 | 18.2% |
| Middle School | 355 | 36.3% |
| High School | 130 | 13.3% |
| College / Undergraduate | 154 | 15.8% |
| Graduate / Professional | 47 | 4.8% |
| Total | 978 | 100.0% |
School Enrollment by Age by Funding Source in Townsend
Out of a total of 978 students who are enrolled in schools in Townsend, 194 (19.8%) attend a private institution, while the remaining 784 (80.2%) are enrolled in public schools. The age group of 25 to 34 year olds has the highest likelihood of being enrolled in private schools, with 86 (81.1% in the age bracket) enrolled. Conversely, the age group of 18 to 19 year olds has the lowest likelihood of being enrolled in a private school, with 30 (100.0% in the age bracket) attending a public institution.
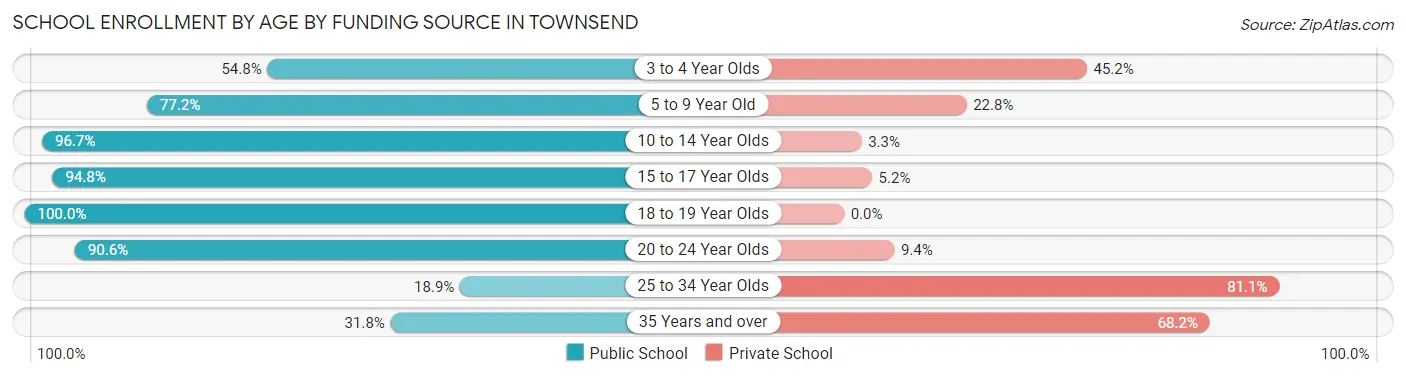
| Age Bracket | Public School | Private School |
| 3 to 4 Year Olds | 23 (54.8%) | 19 (45.2%) |
| 5 to 9 Year Old | 169 (77.2%) | 50 (22.8%) |
| 10 to 14 Year Olds | 386 (96.7%) | 13 (3.3%) |
| 15 to 17 Year Olds | 91 (94.8%) | 5 (5.2%) |
| 18 to 19 Year Olds | 30 (100.0%) | 0 (0.0%) |
| 20 to 24 Year Olds | 58 (90.6%) | 6 (9.4%) |
| 25 to 34 Year Olds | 20 (18.9%) | 86 (81.1%) |
| 35 Years and over | 7 (31.8%) | 15 (68.2%) |
| Total | 784 (80.2%) | 194 (19.8%) |
Educational Attainment by Field of Study in Townsend
Business (353 | 46.3%), science & technology (107 | 14.0%), arts & humanities (57 | 7.5%), bio, nature & agricultural (42 | 5.5%), and social sciences (34 | 4.5%) are the most common fields of study among 762 individuals in Townsend who have obtained a bachelor's degree or higher.
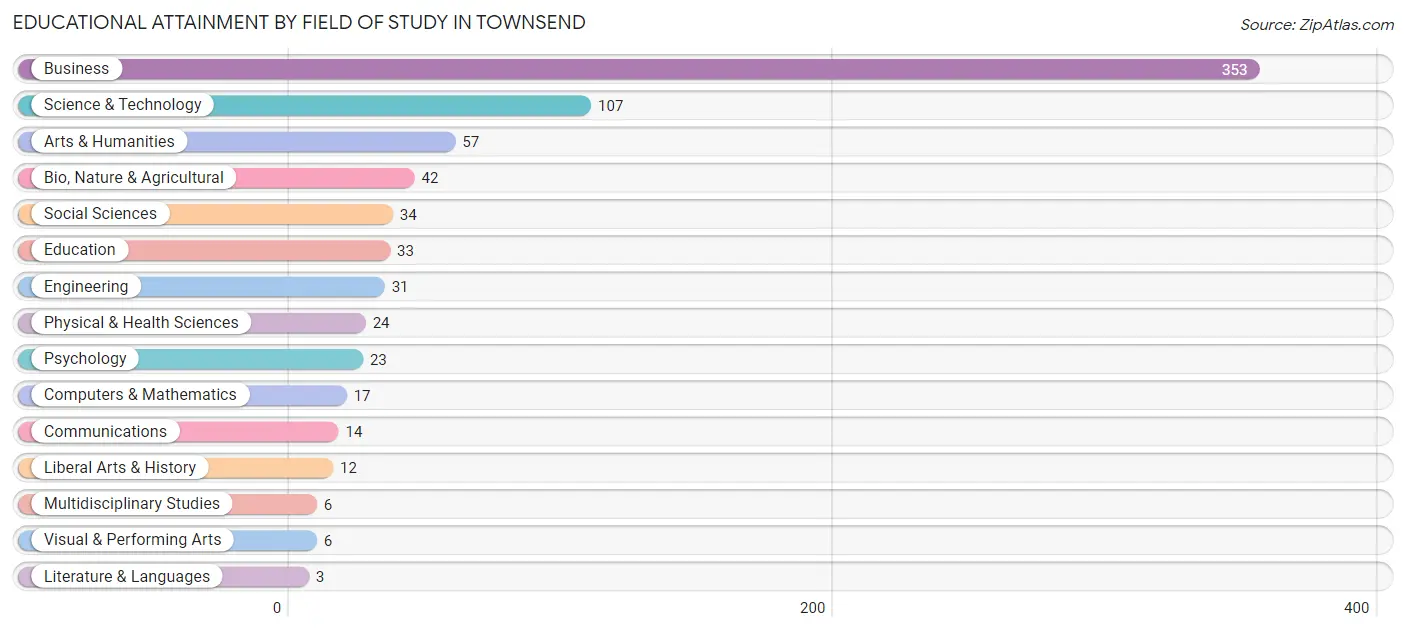
| Field of Study | # Graduates | % Graduates |
| Computers & Mathematics | 17 | 2.2% |
| Bio, Nature & Agricultural | 42 | 5.5% |
| Physical & Health Sciences | 24 | 3.2% |
| Psychology | 23 | 3.0% |
| Social Sciences | 34 | 4.5% |
| Engineering | 31 | 4.1% |
| Multidisciplinary Studies | 6 | 0.8% |
| Science & Technology | 107 | 14.0% |
| Business | 353 | 46.3% |
| Education | 33 | 4.3% |
| Literature & Languages | 3 | 0.4% |
| Liberal Arts & History | 12 | 1.6% |
| Visual & Performing Arts | 6 | 0.8% |
| Communications | 14 | 1.8% |
| Arts & Humanities | 57 | 7.5% |
| Total | 762 | 100.0% |
Transportation & Commute in Townsend
Vehicle Availability by Sex in Townsend
The most prevalent vehicle ownership categories in Townsend are males with 2 vehicles (396, accounting for 53.8%) and females with 2 vehicles (409, making up 50.4%).
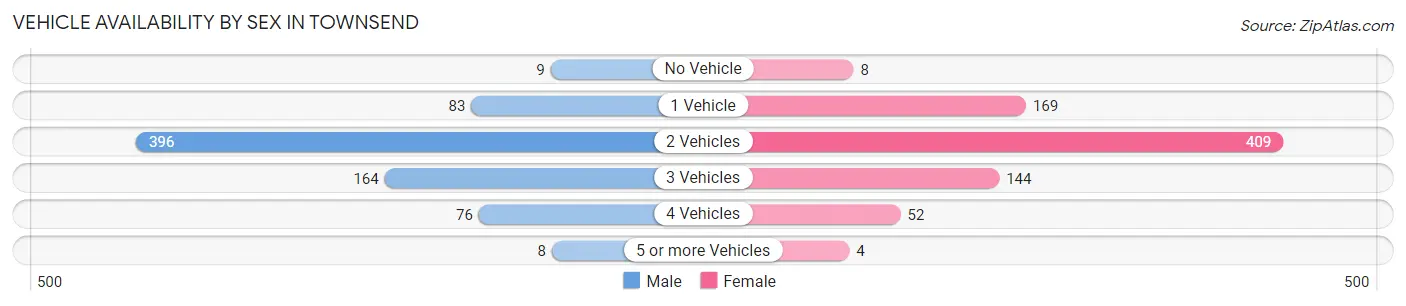
| Vehicles Available | Male | Female |
| No Vehicle | 9 (1.2%) | 8 (1.0%) |
| 1 Vehicle | 83 (11.3%) | 169 (21.5%) |
| 2 Vehicles | 396 (53.8%) | 409 (52.0%) |
| 3 Vehicles | 164 (22.3%) | 144 (18.3%) |
| 4 Vehicles | 76 (10.3%) | 52 (6.6%) |
| 5 or more Vehicles | 8 (1.1%) | 4 (0.5%) |
| Total | 736 (100.0%) | 786 (100.0%) |
Commute Time in Townsend
The most frequently occuring commute durations in Townsend are 30 to 34 minutes (218 commuters, 19.8%), 10 to 14 minutes (204 commuters, 18.5%), and 45 to 59 minutes (172 commuters, 15.6%).
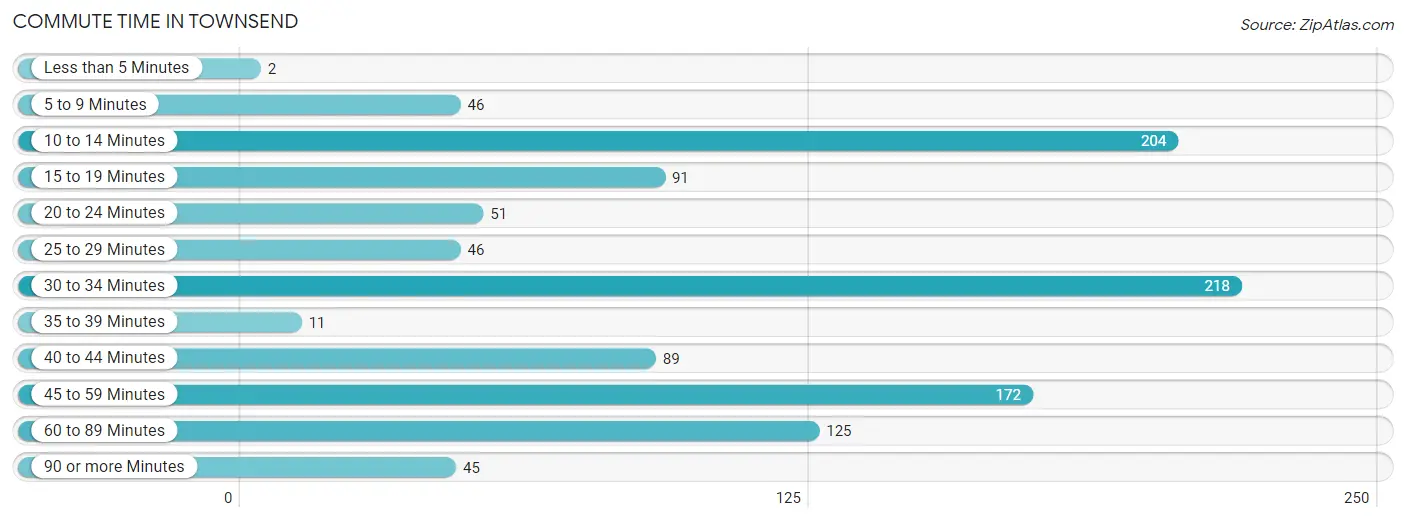
| Commute Time | # Commuters | % Commuters |
| Less than 5 Minutes | 2 | 0.2% |
| 5 to 9 Minutes | 46 | 4.2% |
| 10 to 14 Minutes | 204 | 18.5% |
| 15 to 19 Minutes | 91 | 8.3% |
| 20 to 24 Minutes | 51 | 4.6% |
| 25 to 29 Minutes | 46 | 4.2% |
| 30 to 34 Minutes | 218 | 19.8% |
| 35 to 39 Minutes | 11 | 1.0% |
| 40 to 44 Minutes | 89 | 8.1% |
| 45 to 59 Minutes | 172 | 15.6% |
| 60 to 89 Minutes | 125 | 11.4% |
| 90 or more Minutes | 45 | 4.1% |
Commute Time by Sex in Townsend
The most common commute times in Townsend are 30 to 34 minutes (192 commuters, 28.9%) for males and 10 to 14 minutes (105 commuters, 24.1%) for females.
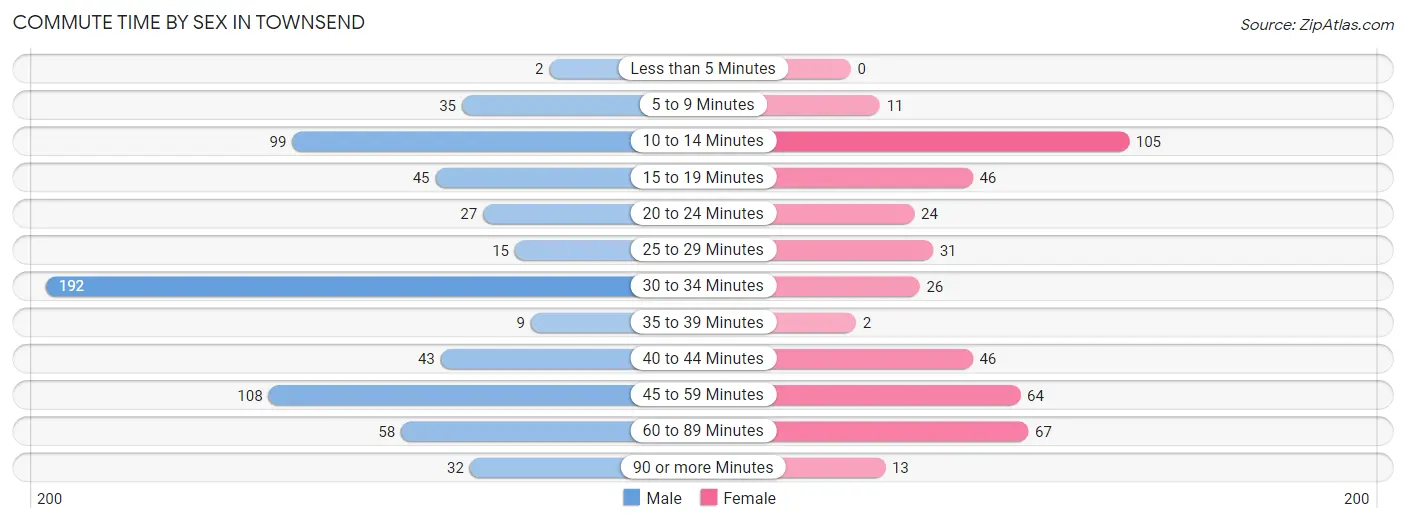
| Commute Time | Male | Female |
| Less than 5 Minutes | 2 (0.3%) | 0 (0.0%) |
| 5 to 9 Minutes | 35 (5.3%) | 11 (2.5%) |
| 10 to 14 Minutes | 99 (14.9%) | 105 (24.1%) |
| 15 to 19 Minutes | 45 (6.8%) | 46 (10.6%) |
| 20 to 24 Minutes | 27 (4.1%) | 24 (5.5%) |
| 25 to 29 Minutes | 15 (2.3%) | 31 (7.1%) |
| 30 to 34 Minutes | 192 (28.9%) | 26 (6.0%) |
| 35 to 39 Minutes | 9 (1.3%) | 2 (0.5%) |
| 40 to 44 Minutes | 43 (6.5%) | 46 (10.6%) |
| 45 to 59 Minutes | 108 (16.2%) | 64 (14.7%) |
| 60 to 89 Minutes | 58 (8.7%) | 67 (15.4%) |
| 90 or more Minutes | 32 (4.8%) | 13 (3.0%) |
Time of Departure to Work by Sex in Townsend
The most frequent times of departure to work in Townsend are 7:00 AM to 7:29 AM (245, 36.8%) for males and 7:30 AM to 7:59 AM (67, 15.4%) for females.
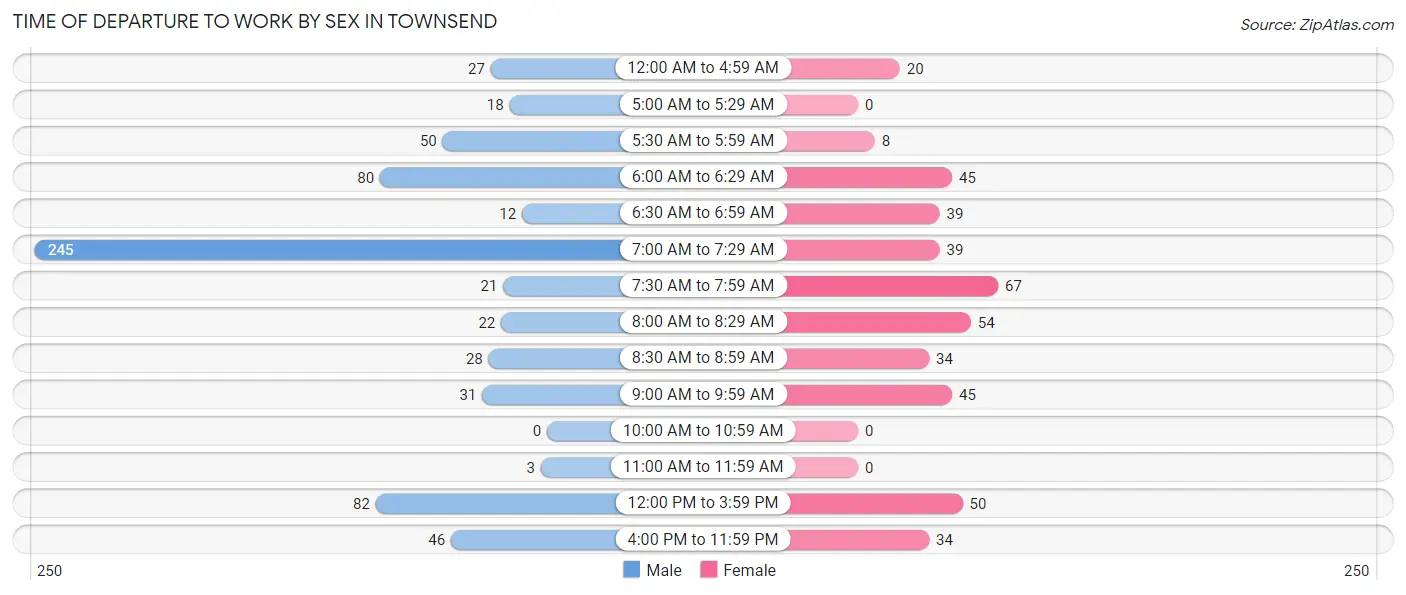
| Time of Departure | Male | Female |
| 12:00 AM to 4:59 AM | 27 (4.1%) | 20 (4.6%) |
| 5:00 AM to 5:29 AM | 18 (2.7%) | 0 (0.0%) |
| 5:30 AM to 5:59 AM | 50 (7.5%) | 8 (1.8%) |
| 6:00 AM to 6:29 AM | 80 (12.0%) | 45 (10.3%) |
| 6:30 AM to 6:59 AM | 12 (1.8%) | 39 (9.0%) |
| 7:00 AM to 7:29 AM | 245 (36.8%) | 39 (9.0%) |
| 7:30 AM to 7:59 AM | 21 (3.2%) | 67 (15.4%) |
| 8:00 AM to 8:29 AM | 22 (3.3%) | 54 (12.4%) |
| 8:30 AM to 8:59 AM | 28 (4.2%) | 34 (7.8%) |
| 9:00 AM to 9:59 AM | 31 (4.7%) | 45 (10.3%) |
| 10:00 AM to 10:59 AM | 0 (0.0%) | 0 (0.0%) |
| 11:00 AM to 11:59 AM | 3 (0.4%) | 0 (0.0%) |
| 12:00 PM to 3:59 PM | 82 (12.3%) | 50 (11.5%) |
| 4:00 PM to 11:59 PM | 46 (6.9%) | 34 (7.8%) |
| Total | 665 (100.0%) | 435 (100.0%) |
Housing Occupancy in Townsend
Occupancy by Ownership in Townsend
Of the total 715 dwellings in Townsend, owner-occupied units account for 684 (95.7%), while renter-occupied units make up 31 (4.3%).
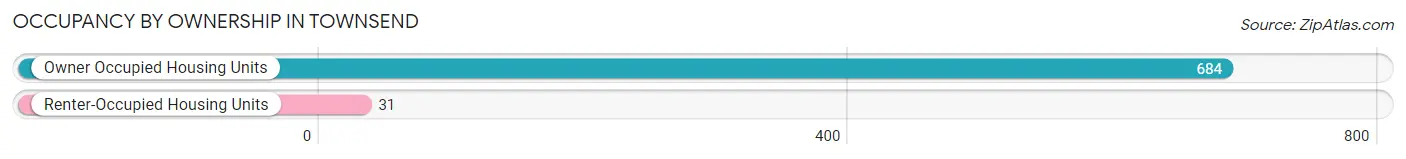
| Occupancy | # Housing Units | % Housing Units |
| Owner Occupied Housing Units | 684 | 95.7% |
| Renter-Occupied Housing Units | 31 | 4.3% |
| Total Occupied Housing Units | 715 | 100.0% |
Occupancy by Household Size in Townsend
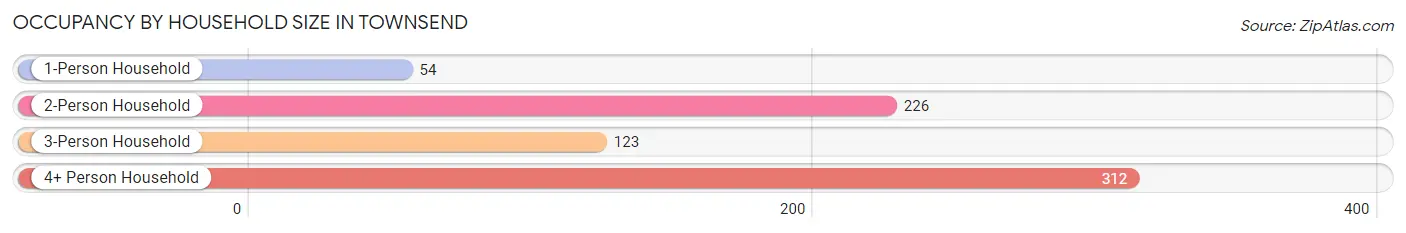
| Household Size | # Housing Units | % Housing Units |
| 1-Person Household | 54 | 7.5% |
| 2-Person Household | 226 | 31.6% |
| 3-Person Household | 123 | 17.2% |
| 4+ Person Household | 312 | 43.6% |
| Total Housing Units | 715 | 100.0% |
Occupancy by Ownership by Household Size in Townsend
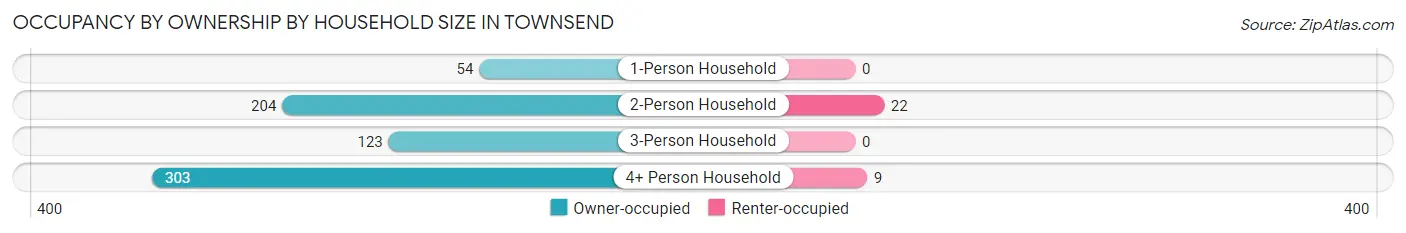
| Household Size | Owner-occupied | Renter-occupied |
| 1-Person Household | 54 (100.0%) | 0 (0.0%) |
| 2-Person Household | 204 (90.3%) | 22 (9.7%) |
| 3-Person Household | 123 (100.0%) | 0 (0.0%) |
| 4+ Person Household | 303 (97.1%) | 9 (2.9%) |
| Total Housing Units | 684 (95.7%) | 31 (4.3%) |
Occupancy by Educational Attainment in Townsend
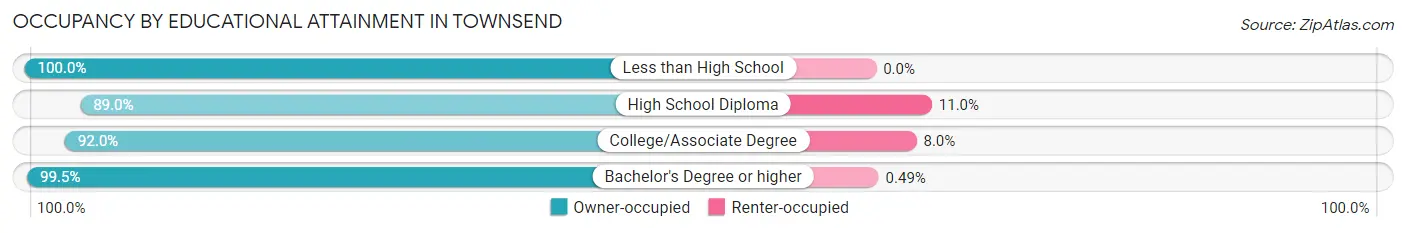
| Household Size | Owner-occupied | Renter-occupied |
| Less than High School | 5 (100.0%) | 0 (0.0%) |
| High School Diploma | 137 (89.0%) | 17 (11.0%) |
| College/Associate Degree | 138 (92.0%) | 12 (8.0%) |
| Bachelor's Degree or higher | 404 (99.5%) | 2 (0.5%) |
Occupancy by Age of Householder in Townsend
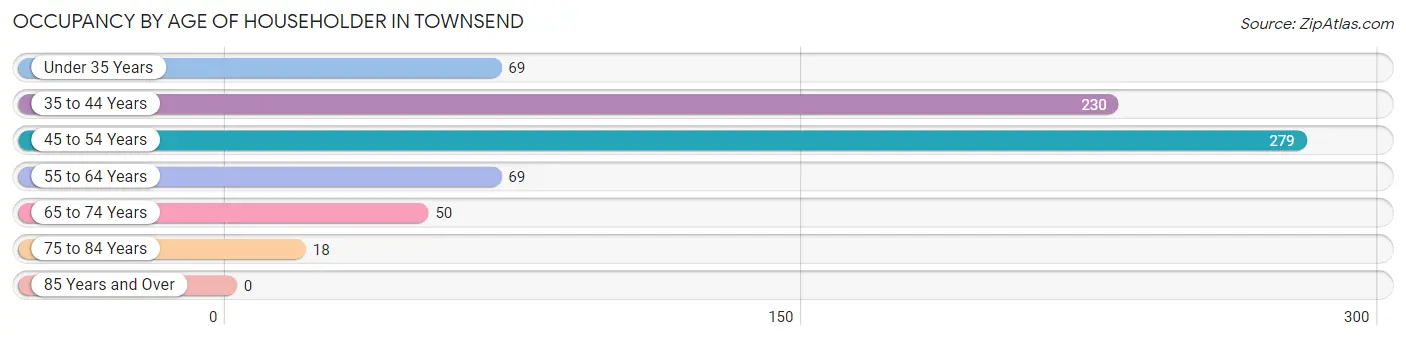
| Age Bracket | # Households | % Households |
| Under 35 Years | 69 | 9.7% |
| 35 to 44 Years | 230 | 32.2% |
| 45 to 54 Years | 279 | 39.0% |
| 55 to 64 Years | 69 | 9.7% |
| 65 to 74 Years | 50 | 7.0% |
| 75 to 84 Years | 18 | 2.5% |
| 85 Years and Over | 0 | 0.0% |
| Total | 715 | 100.0% |
Housing Finances in Townsend
Median Income by Occupancy in Townsend
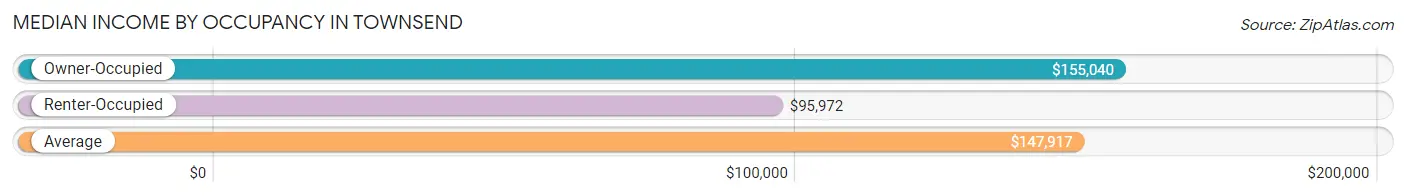
| Occupancy Type | # Households | Median Income |
| Owner-Occupied | 684 (95.7%) | $155,040 |
| Renter-Occupied | 31 (4.3%) | $95,972 |
| Average | 715 (100.0%) | $147,917 |
Occupancy by Householder Income Bracket in Townsend
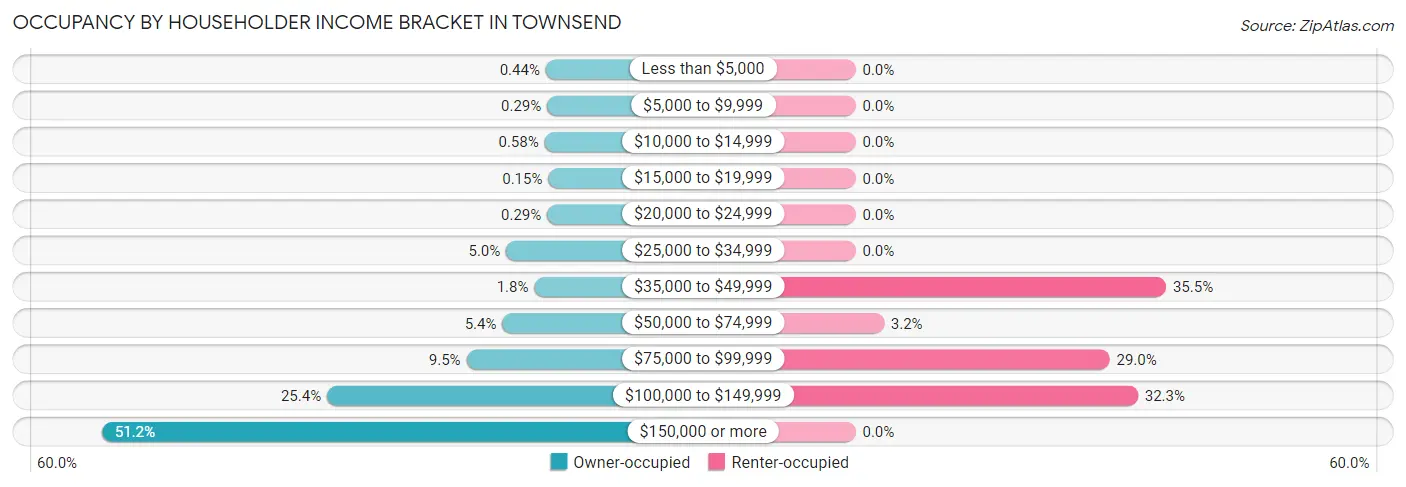
| Income Bracket | Owner-occupied | Renter-occupied |
| Less than $5,000 | 3 (0.4%) | 0 (0.0%) |
| $5,000 to $9,999 | 2 (0.3%) | 0 (0.0%) |
| $10,000 to $14,999 | 4 (0.6%) | 0 (0.0%) |
| $15,000 to $19,999 | 1 (0.2%) | 0 (0.0%) |
| $20,000 to $24,999 | 2 (0.3%) | 0 (0.0%) |
| $25,000 to $34,999 | 34 (5.0%) | 0 (0.0%) |
| $35,000 to $49,999 | 12 (1.8%) | 11 (35.5%) |
| $50,000 to $74,999 | 37 (5.4%) | 1 (3.2%) |
| $75,000 to $99,999 | 65 (9.5%) | 9 (29.0%) |
| $100,000 to $149,999 | 174 (25.4%) | 10 (32.3%) |
| $150,000 or more | 350 (51.2%) | 0 (0.0%) |
| Total | 684 (100.0%) | 31 (100.0%) |
Monthly Housing Cost Tiers in Townsend
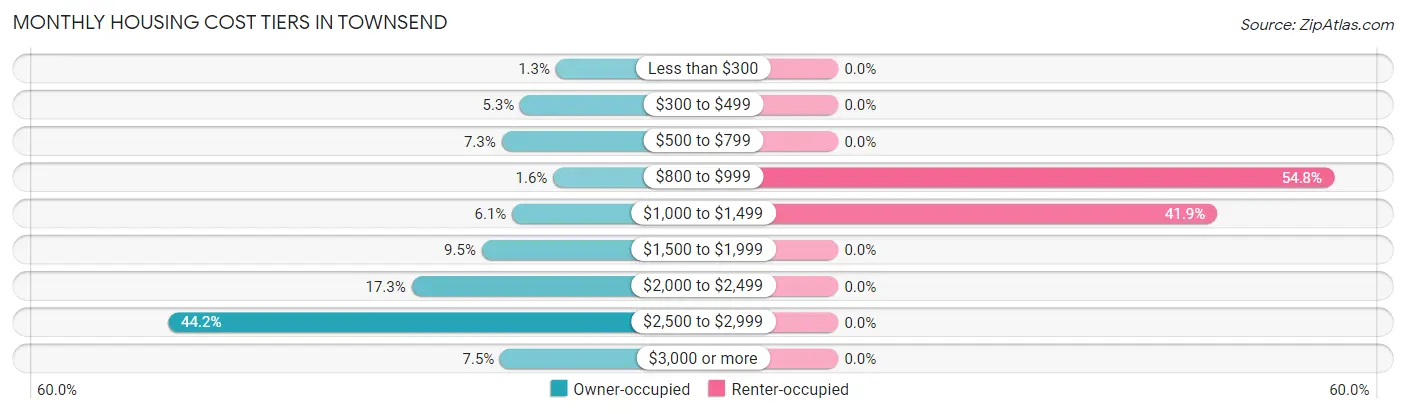
| Monthly Cost | Owner-occupied | Renter-occupied |
| Less than $300 | 9 (1.3%) | 0 (0.0%) |
| $300 to $499 | 36 (5.3%) | 0 (0.0%) |
| $500 to $799 | 50 (7.3%) | 0 (0.0%) |
| $800 to $999 | 11 (1.6%) | 17 (54.8%) |
| $1,000 to $1,499 | 42 (6.1%) | 13 (41.9%) |
| $1,500 to $1,999 | 65 (9.5%) | 0 (0.0%) |
| $2,000 to $2,499 | 118 (17.2%) | 0 (0.0%) |
| $2,500 to $2,999 | 302 (44.2%) | 0 (0.0%) |
| $3,000 or more | 51 (7.5%) | 0 (0.0%) |
| Total | 684 (100.0%) | 31 (100.0%) |
Physical Housing Characteristics in Townsend
Housing Structures in Townsend
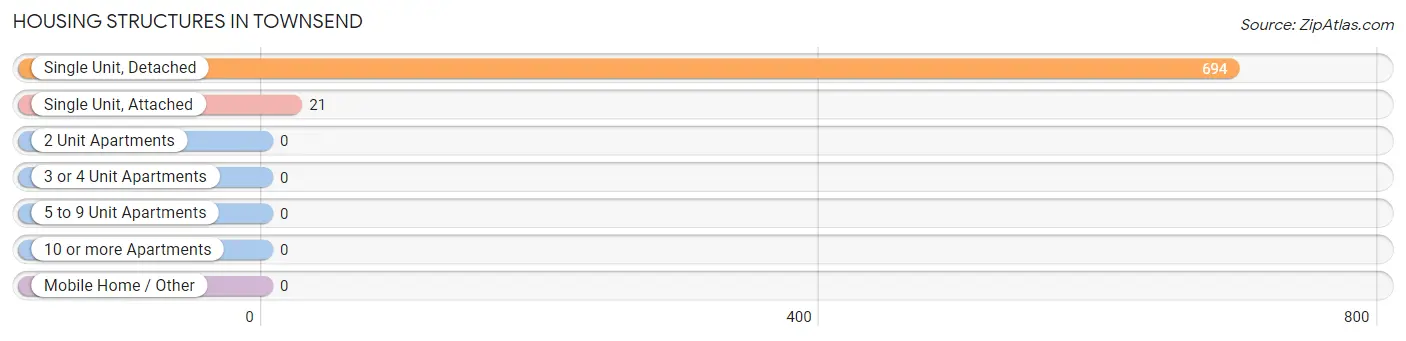
| Structure Type | # Housing Units | % Housing Units |
| Single Unit, Detached | 694 | 97.1% |
| Single Unit, Attached | 21 | 2.9% |
| 2 Unit Apartments | 0 | 0.0% |
| 3 or 4 Unit Apartments | 0 | 0.0% |
| 5 to 9 Unit Apartments | 0 | 0.0% |
| 10 or more Apartments | 0 | 0.0% |
| Mobile Home / Other | 0 | 0.0% |
| Total | 715 | 100.0% |
Housing Structures by Occupancy in Townsend
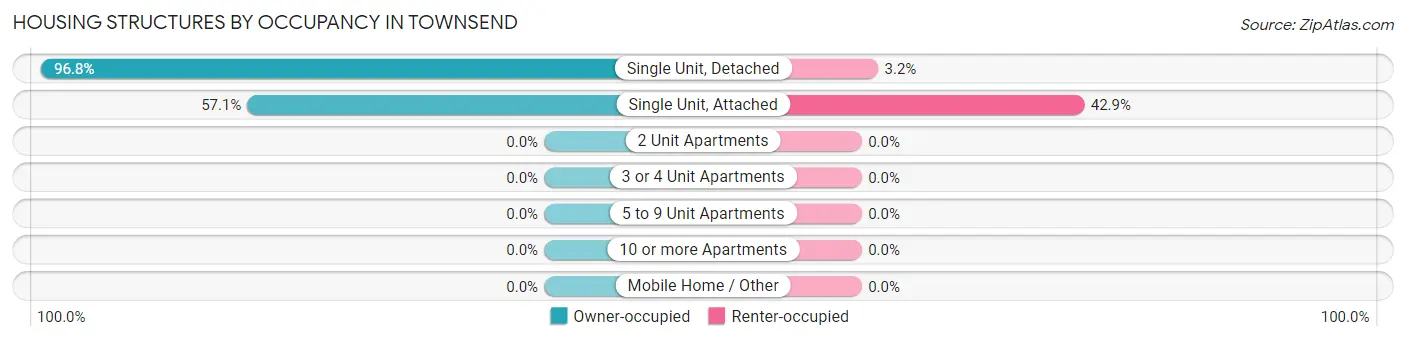
| Structure Type | Owner-occupied | Renter-occupied |
| Single Unit, Detached | 672 (96.8%) | 22 (3.2%) |
| Single Unit, Attached | 12 (57.1%) | 9 (42.9%) |
| 2 Unit Apartments | 0 (0.0%) | 0 (0.0%) |
| 3 or 4 Unit Apartments | 0 (0.0%) | 0 (0.0%) |
| 5 to 9 Unit Apartments | 0 (0.0%) | 0 (0.0%) |
| 10 or more Apartments | 0 (0.0%) | 0 (0.0%) |
| Mobile Home / Other | 0 (0.0%) | 0 (0.0%) |
| Total | 684 (95.7%) | 31 (4.3%) |
Housing Structures by Number of Rooms in Townsend
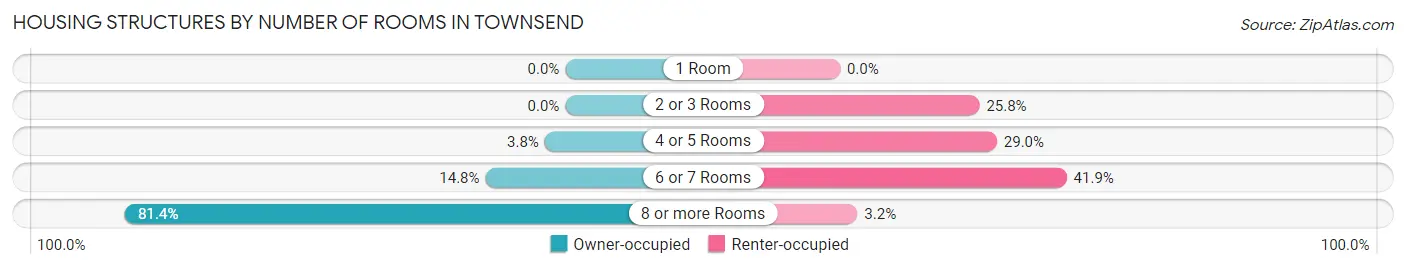
| Number of Rooms | Owner-occupied | Renter-occupied |
| 1 Room | 0 (0.0%) | 0 (0.0%) |
| 2 or 3 Rooms | 0 (0.0%) | 8 (25.8%) |
| 4 or 5 Rooms | 26 (3.8%) | 9 (29.0%) |
| 6 or 7 Rooms | 101 (14.8%) | 13 (41.9%) |
| 8 or more Rooms | 557 (81.4%) | 1 (3.2%) |
| Total | 684 (100.0%) | 31 (100.0%) |
Housing Structure by Heating Type in Townsend
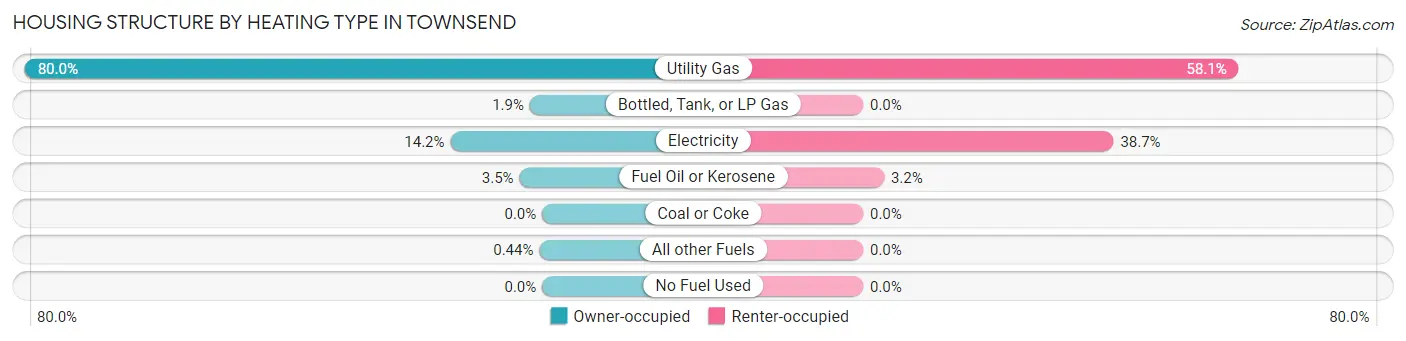
| Heating Type | Owner-occupied | Renter-occupied |
| Utility Gas | 547 (80.0%) | 18 (58.1%) |
| Bottled, Tank, or LP Gas | 13 (1.9%) | 0 (0.0%) |
| Electricity | 97 (14.2%) | 12 (38.7%) |
| Fuel Oil or Kerosene | 24 (3.5%) | 1 (3.2%) |
| Coal or Coke | 0 (0.0%) | 0 (0.0%) |
| All other Fuels | 3 (0.4%) | 0 (0.0%) |
| No Fuel Used | 0 (0.0%) | 0 (0.0%) |
| Total | 684 (100.0%) | 31 (100.0%) |
Household Vehicle Usage in Townsend
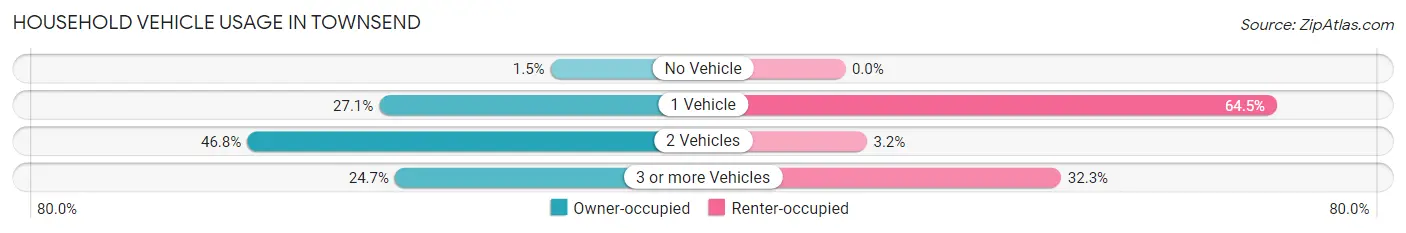
| Vehicles per Household | Owner-occupied | Renter-occupied |
| No Vehicle | 10 (1.5%) | 0 (0.0%) |
| 1 Vehicle | 185 (27.1%) | 20 (64.5%) |
| 2 Vehicles | 320 (46.8%) | 1 (3.2%) |
| 3 or more Vehicles | 169 (24.7%) | 10 (32.3%) |
| Total | 684 (100.0%) | 31 (100.0%) |
Real Estate & Mortgages in Townsend
Real Estate and Mortgage Overview in Townsend
| Characteristic | Without Mortgage | With Mortgage |
| Housing Units | 86 | 598 |
| Median Property Value | $366,700 | $379,000 |
| Median Household Income | $98,750 | $341 |
| Monthly Housing Costs | $603 | $51 |
| Real Estate Taxes | $1,571 | $28 |
Property Value by Mortgage Status in Townsend
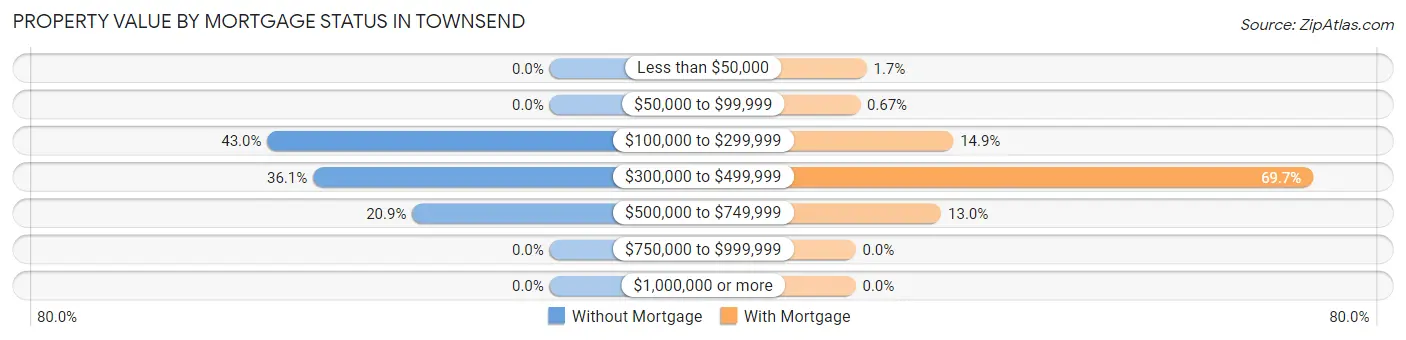
| Property Value | Without Mortgage | With Mortgage |
| Less than $50,000 | 0 (0.0%) | 10 (1.7%) |
| $50,000 to $99,999 | 0 (0.0%) | 4 (0.7%) |
| $100,000 to $299,999 | 37 (43.0%) | 89 (14.9%) |
| $300,000 to $499,999 | 31 (36.0%) | 417 (69.7%) |
| $500,000 to $749,999 | 18 (20.9%) | 78 (13.0%) |
| $750,000 to $999,999 | 0 (0.0%) | 0 (0.0%) |
| $1,000,000 or more | 0 (0.0%) | 0 (0.0%) |
| Total | 86 (100.0%) | 598 (100.0%) |
Household Income by Mortgage Status in Townsend
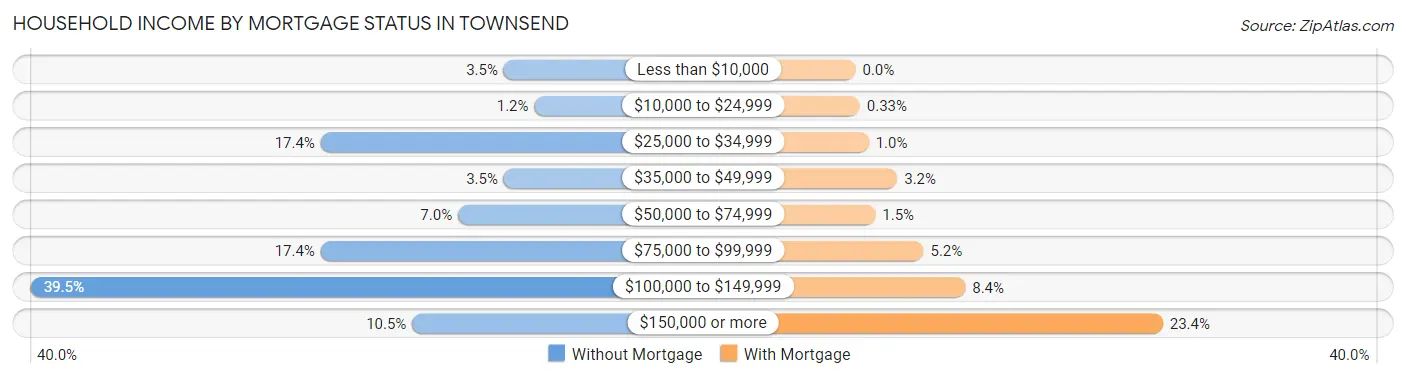
| Household Income | Without Mortgage | With Mortgage |
| Less than $10,000 | 3 (3.5%) | 0 (0.0%) |
| $10,000 to $24,999 | 1 (1.2%) | 2 (0.3%) |
| $25,000 to $34,999 | 15 (17.4%) | 6 (1.0%) |
| $35,000 to $49,999 | 3 (3.5%) | 19 (3.2%) |
| $50,000 to $74,999 | 6 (7.0%) | 9 (1.5%) |
| $75,000 to $99,999 | 15 (17.4%) | 31 (5.2%) |
| $100,000 to $149,999 | 34 (39.5%) | 50 (8.4%) |
| $150,000 or more | 9 (10.5%) | 140 (23.4%) |
| Total | 86 (100.0%) | 598 (100.0%) |
Property Value to Household Income Ratio in Townsend
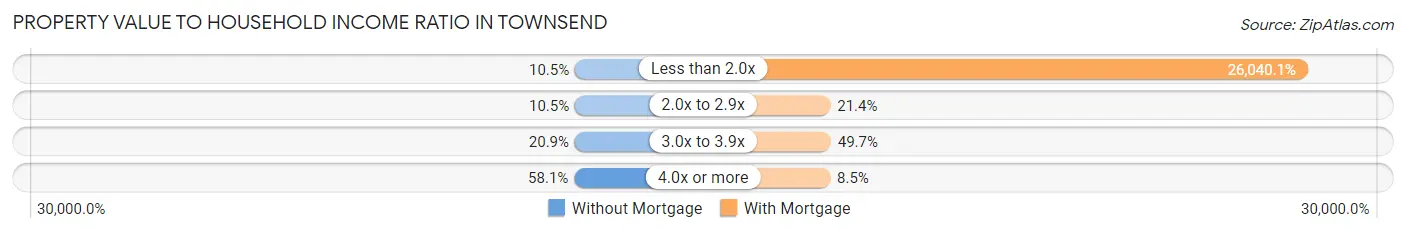
| Value-to-Income Ratio | Without Mortgage | With Mortgage |
| Less than 2.0x | 9 (10.5%) | 155,720 (26,040.1%) |
| 2.0x to 2.9x | 9 (10.5%) | 128 (21.4%) |
| 3.0x to 3.9x | 18 (20.9%) | 297 (49.7%) |
| 4.0x or more | 50 (58.1%) | 51 (8.5%) |
| Total | 86 (100.0%) | 598 (100.0%) |
Real Estate Taxes by Mortgage Status in Townsend
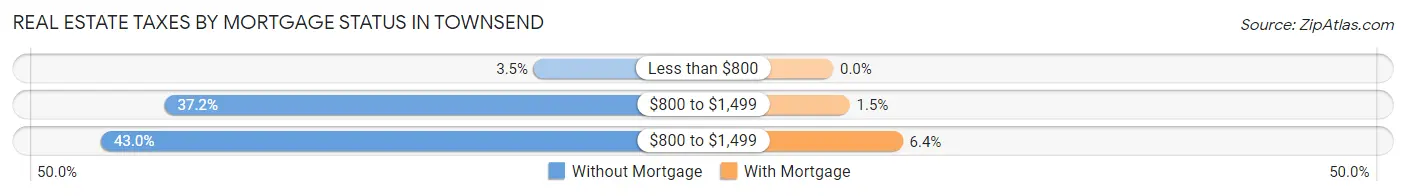
| Property Taxes | Without Mortgage | With Mortgage |
| Less than $800 | 3 (3.5%) | 0 (0.0%) |
| $800 to $1,499 | 32 (37.2%) | 9 (1.5%) |
| $800 to $1,499 | 37 (43.0%) | 38 (6.4%) |
| Total | 86 (100.0%) | 598 (100.0%) |
Health & Disability in Townsend
Health Insurance Coverage by Age in Townsend
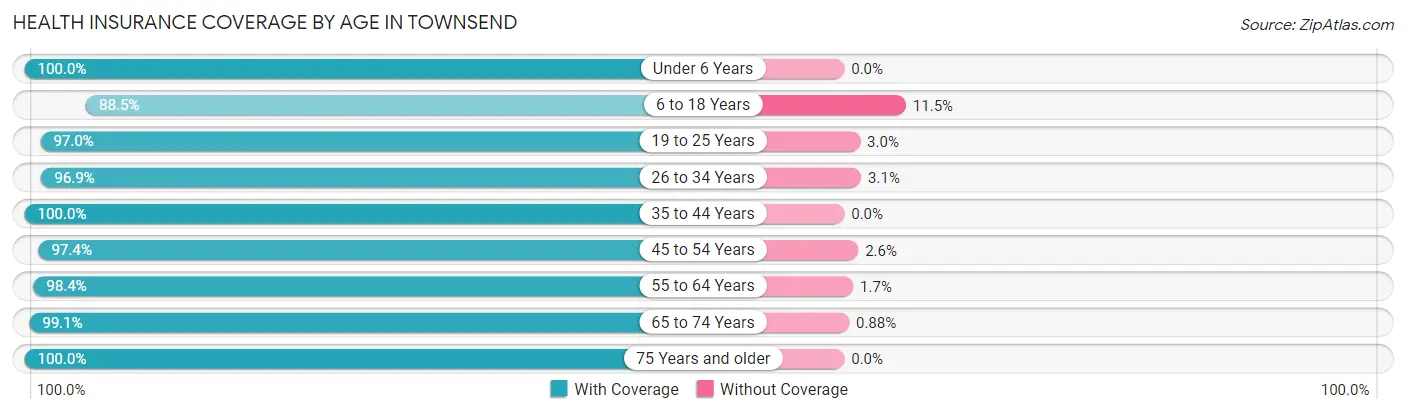
| Age Bracket | With Coverage | Without Coverage |
| Under 6 Years | 241 (100.0%) | 0 (0.0%) |
| 6 to 18 Years | 593 (88.5%) | 77 (11.5%) |
| 19 to 25 Years | 164 (97.0%) | 5 (3.0%) |
| 26 to 34 Years | 278 (96.9%) | 9 (3.1%) |
| 35 to 44 Years | 428 (100.0%) | 0 (0.0%) |
| 45 to 54 Years | 638 (97.4%) | 17 (2.6%) |
| 55 to 64 Years | 119 (98.4%) | 2 (1.7%) |
| 65 to 74 Years | 113 (99.1%) | 1 (0.9%) |
| 75 Years and older | 39 (100.0%) | 0 (0.0%) |
| Total | 2,613 (95.9%) | 111 (4.1%) |
Health Insurance Coverage by Citizenship Status in Townsend
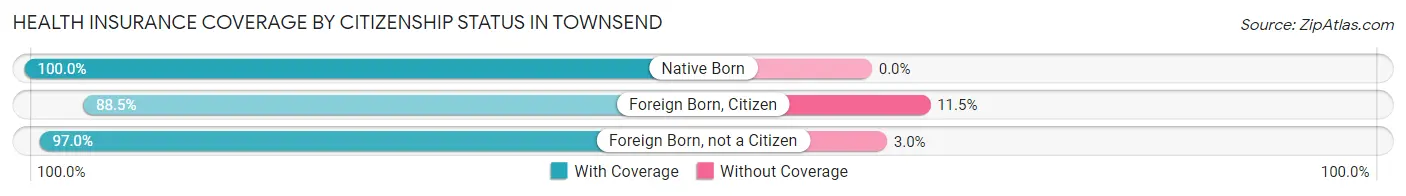
| Citizenship Status | With Coverage | Without Coverage |
| Native Born | 241 (100.0%) | 0 (0.0%) |
| Foreign Born, Citizen | 593 (88.5%) | 77 (11.5%) |
| Foreign Born, not a Citizen | 164 (97.0%) | 5 (3.0%) |
Health Insurance Coverage by Household Income in Townsend
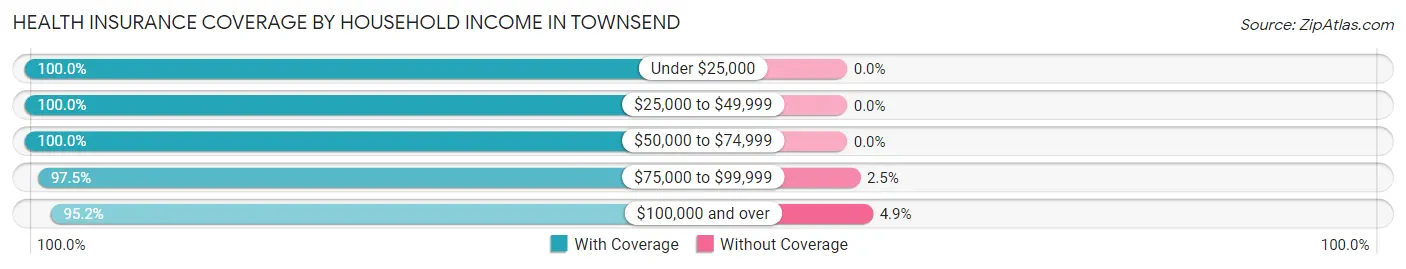
| Household Income | With Coverage | Without Coverage |
| Under $25,000 | 29 (100.0%) | 0 (0.0%) |
| $25,000 to $49,999 | 128 (100.0%) | 0 (0.0%) |
| $50,000 to $74,999 | 136 (100.0%) | 0 (0.0%) |
| $75,000 to $99,999 | 276 (97.5%) | 7 (2.5%) |
| $100,000 and over | 2,040 (95.2%) | 104 (4.9%) |
Public vs Private Health Insurance Coverage by Age in Townsend
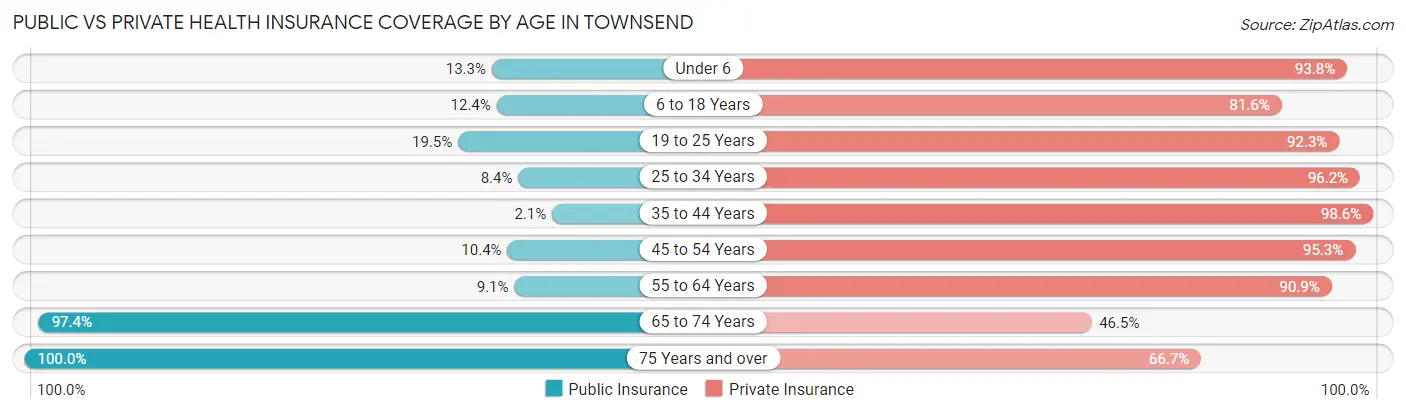
| Age Bracket | Public Insurance | Private Insurance |
| Under 6 | 32 (13.3%) | 226 (93.8%) |
| 6 to 18 Years | 83 (12.4%) | 547 (81.6%) |
| 19 to 25 Years | 33 (19.5%) | 156 (92.3%) |
| 25 to 34 Years | 24 (8.4%) | 276 (96.2%) |
| 35 to 44 Years | 9 (2.1%) | 422 (98.6%) |
| 45 to 54 Years | 68 (10.4%) | 624 (95.3%) |
| 55 to 64 Years | 11 (9.1%) | 110 (90.9%) |
| 65 to 74 Years | 111 (97.4%) | 53 (46.5%) |
| 75 Years and over | 39 (100.0%) | 26 (66.7%) |
| Total | 410 (15.0%) | 2,440 (89.6%) |
Disability Status by Sex by Age in Townsend
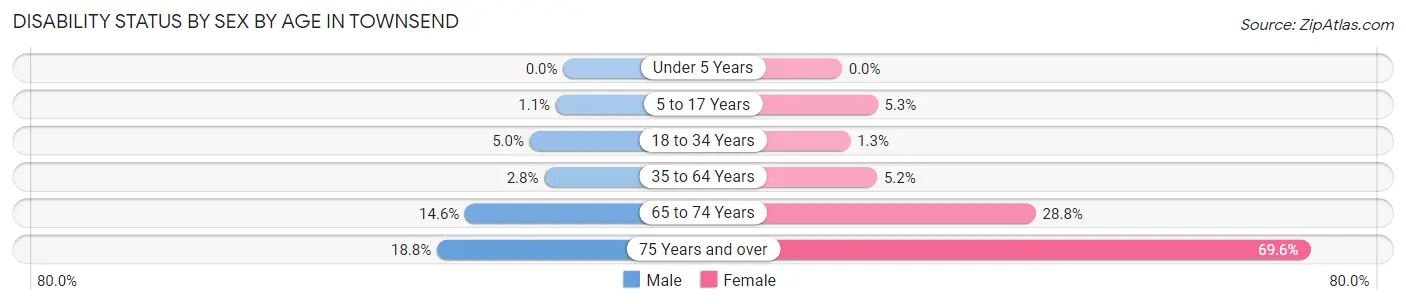
| Age Bracket | Male | Female |
| Under 5 Years | 0 (0.0%) | 0 (0.0%) |
| 5 to 17 Years | 4 (1.1%) | 19 (5.3%) |
| 18 to 34 Years | 16 (5.0%) | 2 (1.3%) |
| 35 to 64 Years | 14 (2.8%) | 37 (5.2%) |
| 65 to 74 Years | 7 (14.6%) | 19 (28.8%) |
| 75 Years and over | 3 (18.8%) | 16 (69.6%) |
Disability Class by Sex by Age in Townsend
Disability Class: Hearing Difficulty
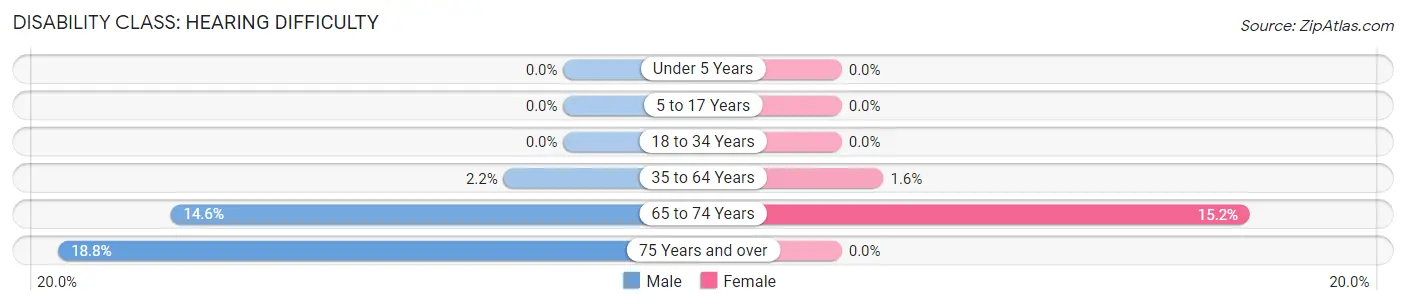
| Age Bracket | Male | Female |
| Under 5 Years | 0 (0.0%) | 0 (0.0%) |
| 5 to 17 Years | 0 (0.0%) | 0 (0.0%) |
| 18 to 34 Years | 0 (0.0%) | 0 (0.0%) |
| 35 to 64 Years | 11 (2.2%) | 11 (1.5%) |
| 65 to 74 Years | 7 (14.6%) | 10 (15.1%) |
| 75 Years and over | 3 (18.8%) | 0 (0.0%) |
Disability Class: Vision Difficulty
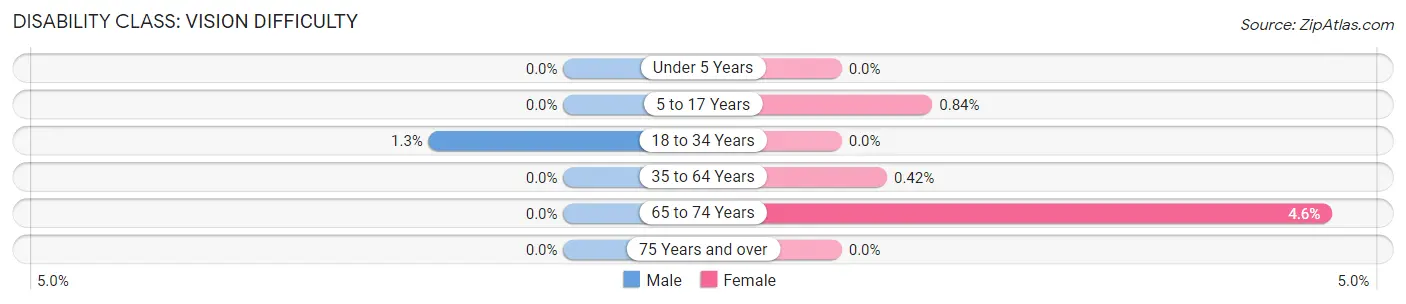
| Age Bracket | Male | Female |
| Under 5 Years | 0 (0.0%) | 0 (0.0%) |
| 5 to 17 Years | 0 (0.0%) | 3 (0.8%) |
| 18 to 34 Years | 4 (1.3%) | 0 (0.0%) |
| 35 to 64 Years | 0 (0.0%) | 3 (0.4%) |
| 65 to 74 Years | 0 (0.0%) | 3 (4.5%) |
| 75 Years and over | 0 (0.0%) | 0 (0.0%) |
Disability Class: Cognitive Difficulty
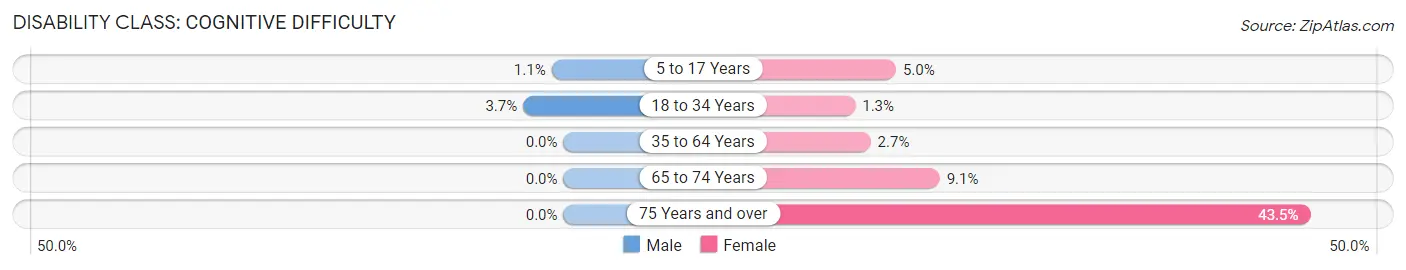
| Age Bracket | Male | Female |
| 5 to 17 Years | 4 (1.1%) | 18 (5.0%) |
| 18 to 34 Years | 12 (3.7%) | 2 (1.3%) |
| 35 to 64 Years | 0 (0.0%) | 19 (2.7%) |
| 65 to 74 Years | 0 (0.0%) | 6 (9.1%) |
| 75 Years and over | 0 (0.0%) | 10 (43.5%) |
Disability Class: Ambulatory Difficulty
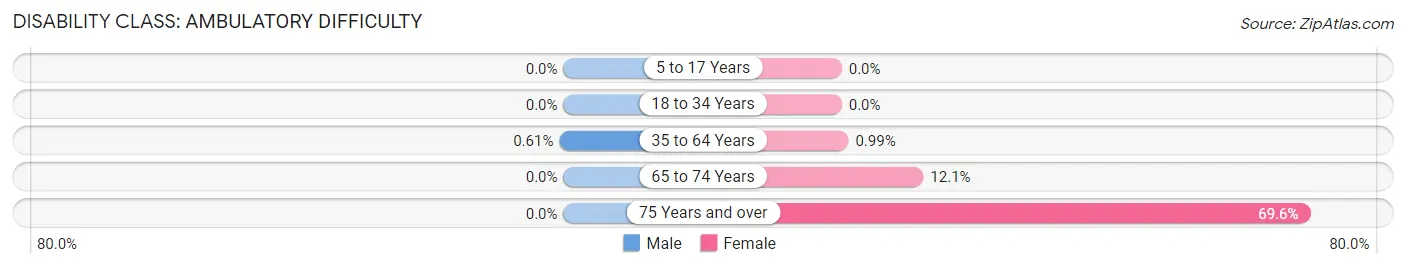
| Age Bracket | Male | Female |
| 5 to 17 Years | 0 (0.0%) | 0 (0.0%) |
| 18 to 34 Years | 0 (0.0%) | 0 (0.0%) |
| 35 to 64 Years | 3 (0.6%) | 7 (1.0%) |
| 65 to 74 Years | 0 (0.0%) | 8 (12.1%) |
| 75 Years and over | 0 (0.0%) | 16 (69.6%) |
Disability Class: Self-Care Difficulty
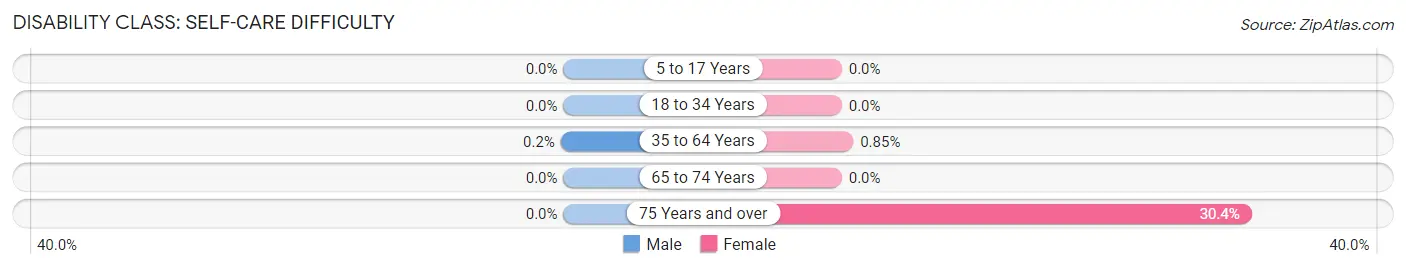
| Age Bracket | Male | Female |
| 5 to 17 Years | 0 (0.0%) | 0 (0.0%) |
| 18 to 34 Years | 0 (0.0%) | 0 (0.0%) |
| 35 to 64 Years | 1 (0.2%) | 6 (0.9%) |
| 65 to 74 Years | 0 (0.0%) | 0 (0.0%) |
| 75 Years and over | 0 (0.0%) | 7 (30.4%) |
Technology Access in Townsend
Computing Device Access in Townsend
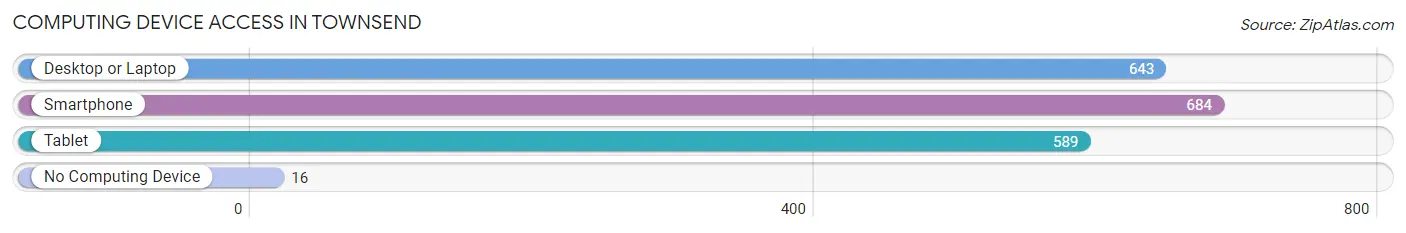
| Device Type | # Households | % Households |
| Desktop or Laptop | 643 | 89.9% |
| Smartphone | 684 | 95.7% |
| Tablet | 589 | 82.4% |
| No Computing Device | 16 | 2.2% |
| Total | 715 | 100.0% |
Internet Access in Townsend
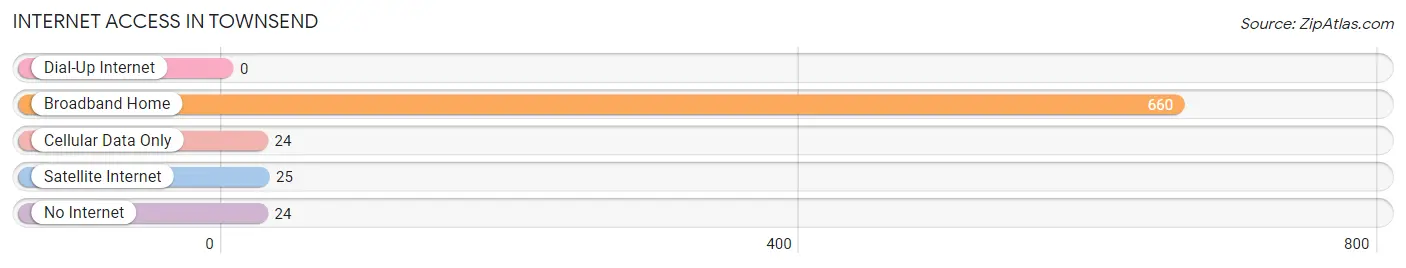
| Internet Type | # Households | % Households |
| Dial-Up Internet | 0 | 0.0% |
| Broadband Home | 660 | 92.3% |
| Cellular Data Only | 24 | 3.4% |
| Satellite Internet | 25 | 3.5% |
| No Internet | 24 | 3.4% |
| Total | 715 | 100.0% |
Townsend Summary
Townsend, Delaware is a small town located in New Castle County, Delaware. It is situated on the banks of the Christina River, and is part of the Wilmington Metropolitan Statistical Area. The town has a population of approximately 1,800 people, and is known for its rural charm and small-town atmosphere.
Geography
Townsend is located in the northern part of New Castle County, Delaware, and is situated on the banks of the Christina River. The town is bordered by the towns of Middletown and Odessa to the north, and by the towns of Smyrna and Clayton to the south. The town is located approximately 25 miles south of Wilmington, Delaware, and is part of the Wilmington Metropolitan Statistical Area.
The town is situated on a flat plain, with the Christina River running through the center of town. The town is surrounded by farmland, and is home to several small lakes and ponds. The town is also home to several parks, including the Townsend State Park, which offers a variety of outdoor activities, such as fishing, hiking, and camping.
Demographics
As of the 2010 census, the population of Townsend was 1,814 people. The racial makeup of the town was 94.3% White, 2.2% African American, 0.3% Native American, 0.7% Asian, 0.1% Pacific Islander, 0.9% from other races, and 1.5% from two or more races. Hispanic or Latino of any race were 2.7% of the population.
The median household income in Townsend was $50,938, and the median family income was $60,938. The per capita income for the town was $25,938. About 8.3% of families and 10.2% of the population were below the poverty line, including 14.3% of those under age 18 and 6.2% of those age 65 or over.
Economy
The economy of Townsend is largely based on agriculture and tourism. The town is home to several farms, which produce a variety of crops, including corn, soybeans, and wheat. The town is also home to several wineries, which produce a variety of wines.
The town is also home to several small businesses, including restaurants, retail stores, and service providers. The town is also home to several bed and breakfasts, which attract tourists from all over the country.
Conclusion
Townsend, Delaware is a small town located in New Castle County, Delaware. It is situated on the banks of the Christina River, and is part of the Wilmington Metropolitan Statistical Area. The town has a population of approximately 1,800 people, and is known for its rural charm and small-town atmosphere. The economy of Townsend is largely based on agriculture and tourism, and the town is home to several farms, wineries, restaurants, retail stores, and bed and breakfasts. Townsend is a charming town with a rich history and a vibrant economy.
Common Questions
What is Per Capita Income in Townsend?
Per Capita income in Townsend is $41,503.
What is the Median Family Income in Townsend?
Median Family Income in Townsend is $132,460.
What is the Median Household income in Townsend?
Median Household Income in Townsend is $147,917.
What is Income or Wage Gap in Townsend?
Income or Wage Gap in Townsend is 12.5%.
Women in Townsend earn 87.5 cents for every dollar earned by a man.
What is Family Income Deficit in Townsend?
Family Income Deficit in Townsend is $11,670.
Families that are below poverty line in Townsend earn $11,670 less on average than the poverty threshold level.
What is Inequality or Gini Index in Townsend?
Inequality or Gini Index in Townsend is 0.29.
What is the Total Population of Townsend?
Total Population of Townsend is 2,728.
What is the Total Male Population of Townsend?
Total Male Population of Townsend is 1,308.
What is the Total Female Population of Townsend?
Total Female Population of Townsend is 1,420.
What is the Ratio of Males per 100 Females in Townsend?
There are 92.11 Males per 100 Females in Townsend.
What is the Ratio of Females per 100 Males in Townsend?
There are 108.56 Females per 100 Males in Townsend.
What is the Median Population Age in Townsend?
Median Population Age in Townsend is 35.0 Years.
What is the Average Family Size in Townsend
Average Family Size in Townsend is 4.5 People.
What is the Average Household Size in Townsend
Average Household Size in Townsend is 3.8 People.
How Large is the Labor Force in Townsend?
There are 1,579 People in the Labor Forcein in Townsend.
What is the Percentage of People in the Labor Force in Townsend?
82.7% of People are in the Labor Force in Townsend.
What is the Unemployment Rate in Townsend?
Unemployment Rate in Townsend is 2.5%.