Rehoboth Beach, DE Map & Demographics
Rehoboth Beach Map
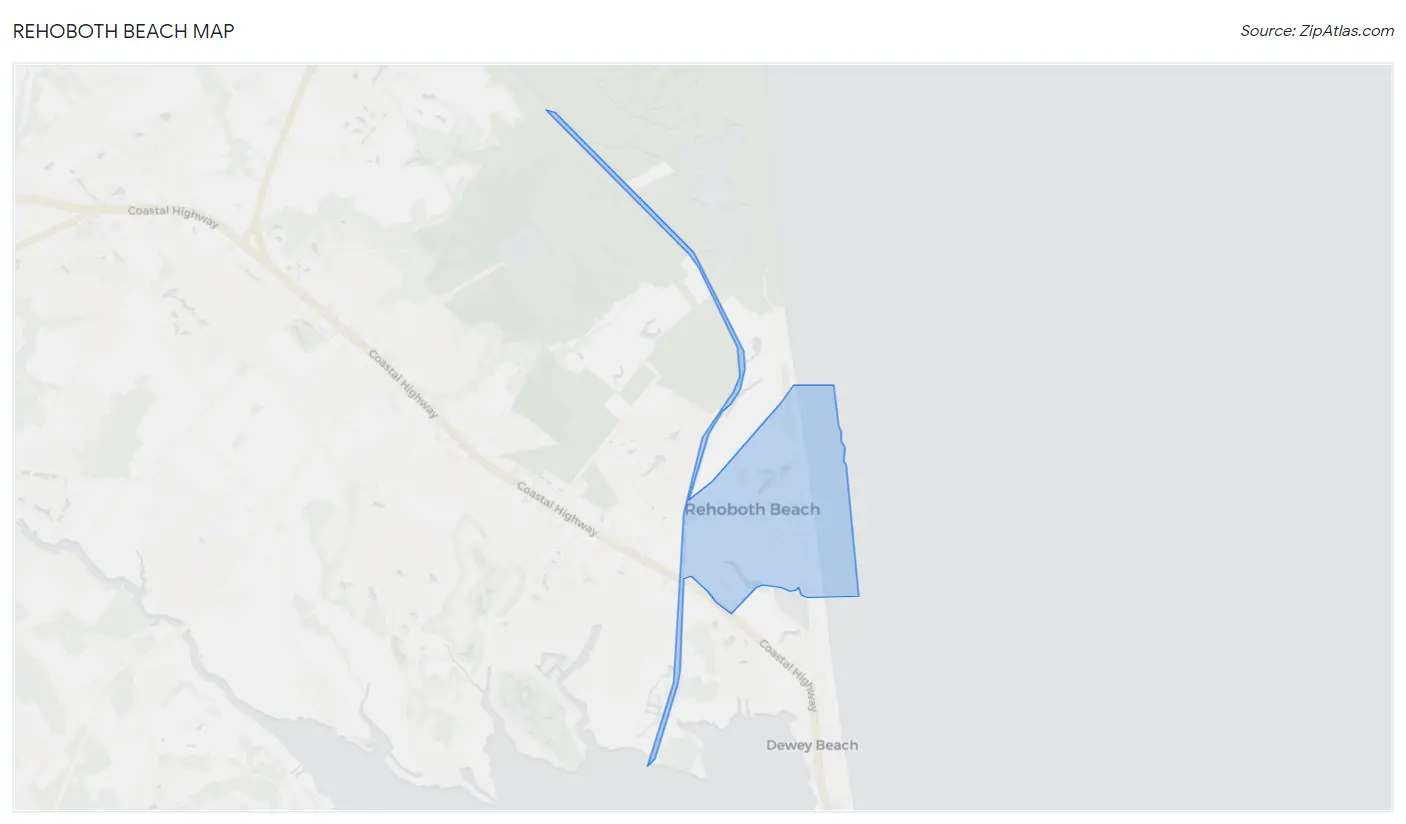
Rehoboth Beach Overview
$114,683
PER CAPITA INCOME
$170,833
AVG FAMILY INCOME
$147,273
AVG HOUSEHOLD INCOME
65.3%
WAGE / INCOME GAP [ % ]
34.7¢/ $1
WAGE / INCOME GAP [ $ ]
0.52
INEQUALITY / GINI INDEX
1,357
TOTAL POPULATION
716
MALE POPULATION
641
FEMALE POPULATION
111.70
MALES / 100 FEMALES
89.53
FEMALES / 100 MALES
64.1
MEDIAN AGE
2.1
AVG FAMILY SIZE
1.8
AVG HOUSEHOLD SIZE
655
LABOR FORCE [ PEOPLE ]
51.4%
PERCENT IN LABOR FORCE
7.0%
UNEMPLOYMENT RATE
Rehoboth Beach Zip Codes
Rehoboth Beach Area Codes
Income in Rehoboth Beach
Income Overview in Rehoboth Beach
Per Capita Income in Rehoboth Beach is $114,683, while median incomes of families and households are $170,833 and $147,273 respectively.
| Characteristic | Number | Measure |
| Per Capita Income | 1,357 | $114,683 |
| Median Family Income | 442 | $170,833 |
| Mean Family Income | 442 | $258,599 |
| Median Household Income | 766 | $147,273 |
| Mean Household Income | 766 | $210,228 |
| Income Deficit | 442 | $0 |
| Wage / Income Gap (%) | 1,357 | 65.34% |
| Wage / Income Gap ($) | 1,357 | 34.66¢ per $1 |
| Gini / Inequality Index | 1,357 | 0.52 |
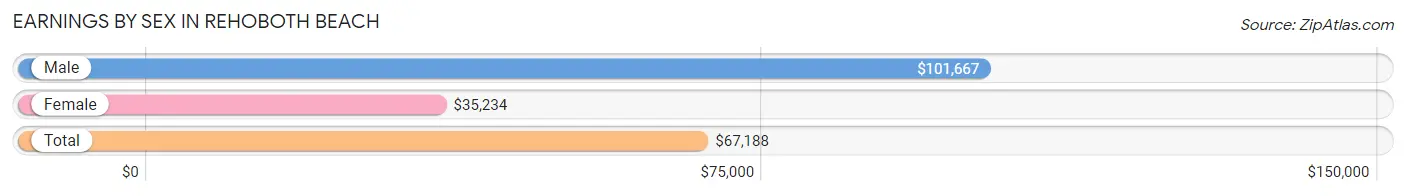
Earnings by Sex in Rehoboth Beach
Average Earnings in Rehoboth Beach are $67,188, $101,667 for men and $35,234 for women, a difference of 65.3%.
| Sex | Number | Average Earnings |
| Male | 414 (59.1%) | $101,667 |
| Female | 287 (40.9%) | $35,234 |
| Total | 701 (100.0%) | $67,188 |
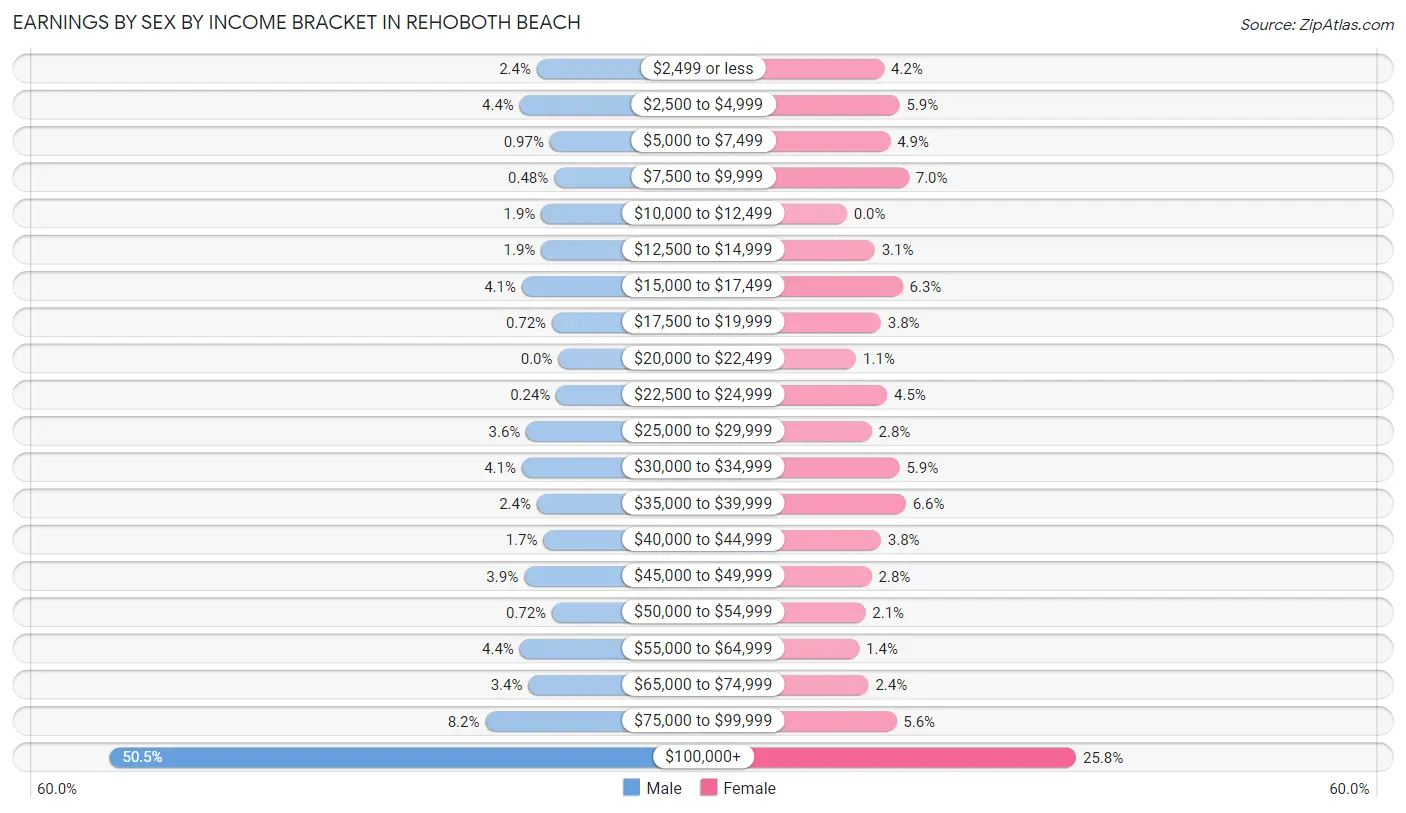
Earnings by Sex by Income Bracket in Rehoboth Beach
The most common earnings brackets in Rehoboth Beach are $100,000+ for men (209 | 50.5%) and $100,000+ for women (74 | 25.8%).
| Income | Male | Female |
| $2,499 or less | 10 (2.4%) | 12 (4.2%) |
| $2,500 to $4,999 | 18 (4.3%) | 17 (5.9%) |
| $5,000 to $7,499 | 4 (1.0%) | 14 (4.9%) |
| $7,500 to $9,999 | 2 (0.5%) | 20 (7.0%) |
| $10,000 to $12,499 | 8 (1.9%) | 0 (0.0%) |
| $12,500 to $14,999 | 8 (1.9%) | 9 (3.1%) |
| $15,000 to $17,499 | 17 (4.1%) | 18 (6.3%) |
| $17,500 to $19,999 | 3 (0.7%) | 11 (3.8%) |
| $20,000 to $22,499 | 0 (0.0%) | 3 (1.1%) |
| $22,500 to $24,999 | 1 (0.2%) | 13 (4.5%) |
| $25,000 to $29,999 | 15 (3.6%) | 8 (2.8%) |
| $30,000 to $34,999 | 17 (4.1%) | 17 (5.9%) |
| $35,000 to $39,999 | 10 (2.4%) | 19 (6.6%) |
| $40,000 to $44,999 | 7 (1.7%) | 11 (3.8%) |
| $45,000 to $49,999 | 16 (3.9%) | 8 (2.8%) |
| $50,000 to $54,999 | 3 (0.7%) | 6 (2.1%) |
| $55,000 to $64,999 | 18 (4.3%) | 4 (1.4%) |
| $65,000 to $74,999 | 14 (3.4%) | 7 (2.4%) |
| $75,000 to $99,999 | 34 (8.2%) | 16 (5.6%) |
| $100,000+ | 209 (50.5%) | 74 (25.8%) |
| Total | 414 (100.0%) | 287 (100.0%) |
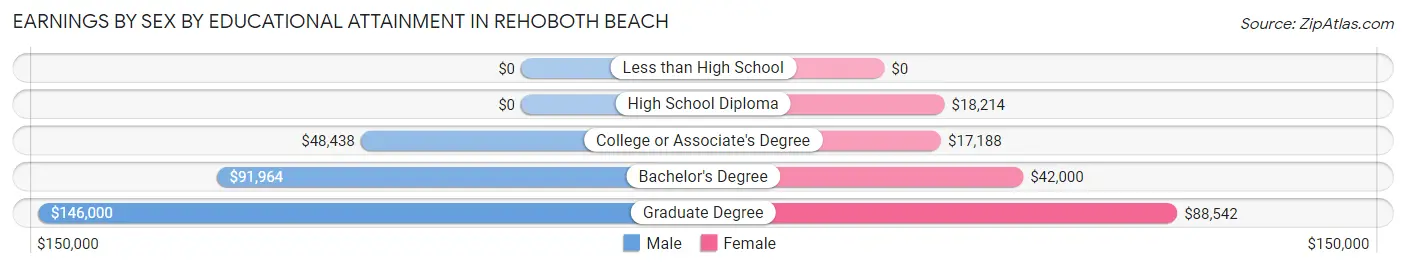
Earnings by Sex by Educational Attainment in Rehoboth Beach
Average earnings in Rehoboth Beach are $106,563 for men and $35,469 for women, a difference of 66.7%. Men with an educational attainment of graduate degree enjoy the highest average annual earnings of $146,000, while those with college or associate's degree education earn the least with $48,438. Women with an educational attainment of graduate degree earn the most with the average annual earnings of $88,542, while those with college or associate's degree education have the smallest earnings of $17,188.
| Educational Attainment | Male Income | Female Income |
| Less than High School | - | - |
| High School Diploma | - | - |
| College or Associate's Degree | $48,438 | $17,188 |
| Bachelor's Degree | $91,964 | $42,000 |
| Graduate Degree | $146,000 | $88,542 |
| Total | $106,563 | $35,469 |
Family Income in Rehoboth Beach
Family Income Brackets in Rehoboth Beach
According to the Rehoboth Beach family income data, there are 185 families falling into the $200,000+ income range, which is the most common income bracket and makes up 41.9% of all families.
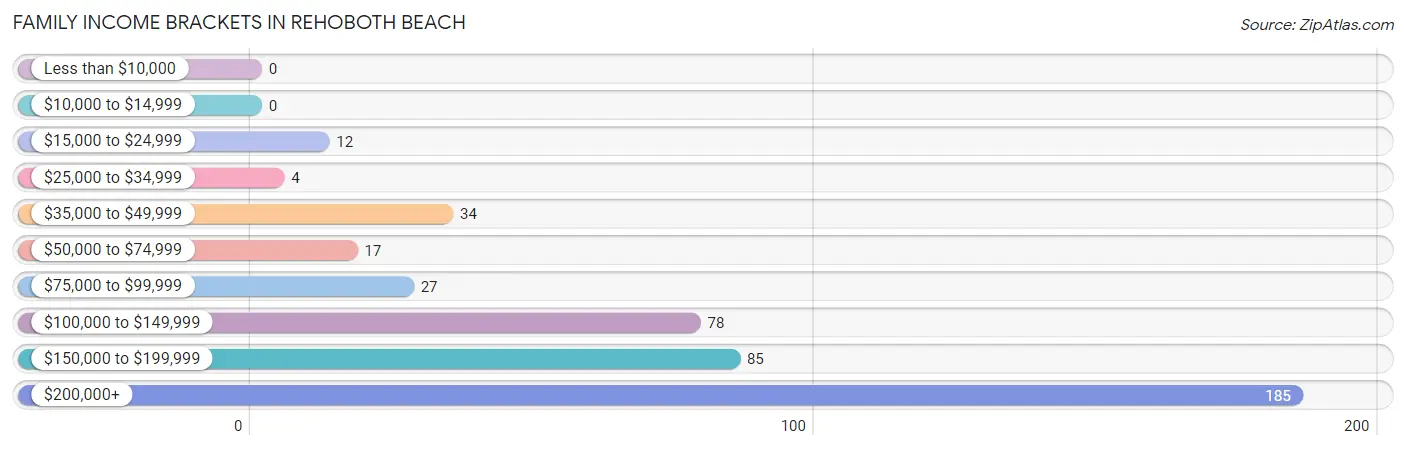
| Income Bracket | # Families | % Families |
| Less than $10,000 | 0 | 0.0% |
| $10,000 to $14,999 | 0 | 0.0% |
| $15,000 to $24,999 | 12 | 2.7% |
| $25,000 to $34,999 | 4 | 0.9% |
| $35,000 to $49,999 | 34 | 7.7% |
| $50,000 to $74,999 | 17 | 3.8% |
| $75,000 to $99,999 | 27 | 6.1% |
| $100,000 to $149,999 | 78 | 17.6% |
| $150,000 to $199,999 | 85 | 19.2% |
| $200,000+ | 185 | 41.9% |
Family Income by Famaliy Size in Rehoboth Beach
3-person families (58 | 13.1%) account for the highest median family income in Rehoboth Beach with $177,045 per family, while 2-person families (373 | 84.4%) have the highest median income of $79,792 per family member.
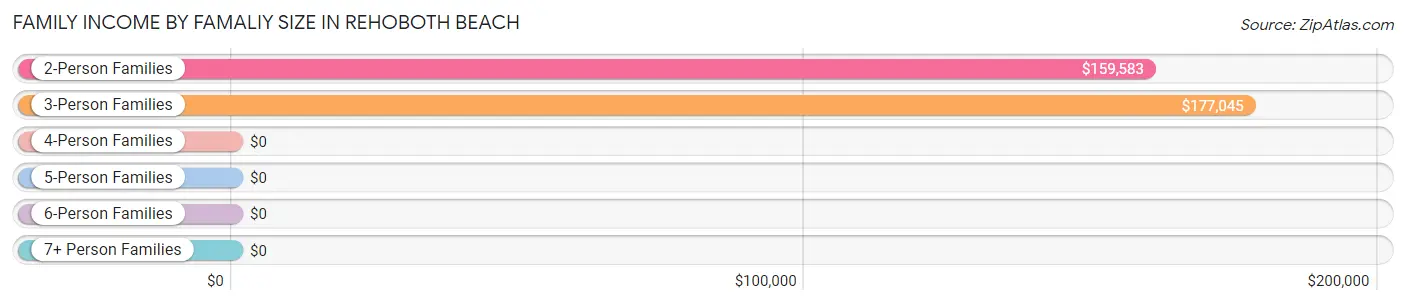
| Income Bracket | # Families | Median Income |
| 2-Person Families | 373 (84.4%) | $159,583 |
| 3-Person Families | 58 (13.1%) | $177,045 |
| 4-Person Families | 3 (0.7%) | $0 |
| 5-Person Families | 8 (1.8%) | $0 |
| 6-Person Families | 0 (0.0%) | $0 |
| 7+ Person Families | 0 (0.0%) | $0 |
| Total | 442 (100.0%) | $170,833 |
Family Income by Number of Earners in Rehoboth Beach
The median family income in Rehoboth Beach is $170,833, with families comprising 2 earners (136) having the highest median family income of $250,001, while families with 1 earner (131) have the lowest median family income of $147,917, accounting for 30.8% and 29.6% of families, respectively.
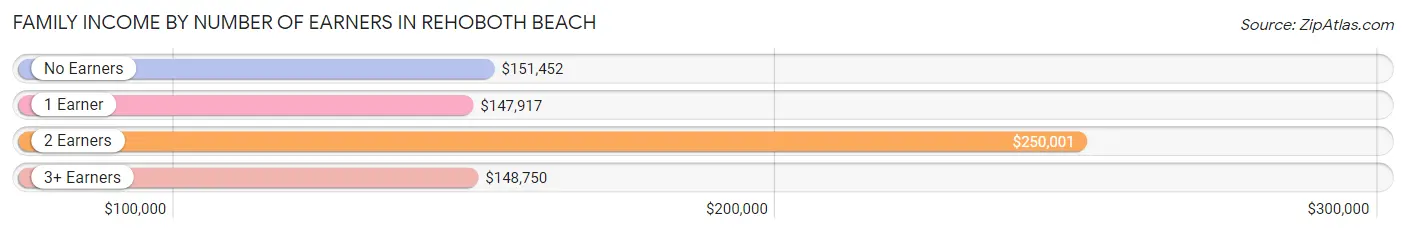
| Number of Earners | # Families | Median Income |
| No Earners | 160 (36.2%) | $151,452 |
| 1 Earner | 131 (29.6%) | $147,917 |
| 2 Earners | 136 (30.8%) | $250,001 |
| 3+ Earners | 15 (3.4%) | $148,750 |
| Total | 442 (100.0%) | $170,833 |
Household Income in Rehoboth Beach
Household Income Brackets in Rehoboth Beach
With 262 households falling in the category, the $200,000+ income range is the most frequent in Rehoboth Beach, accounting for 34.2% of all households. In contrast, only 3 households (0.4%) fall into the $10,000 to $14,999 income bracket, making it the least populous group.
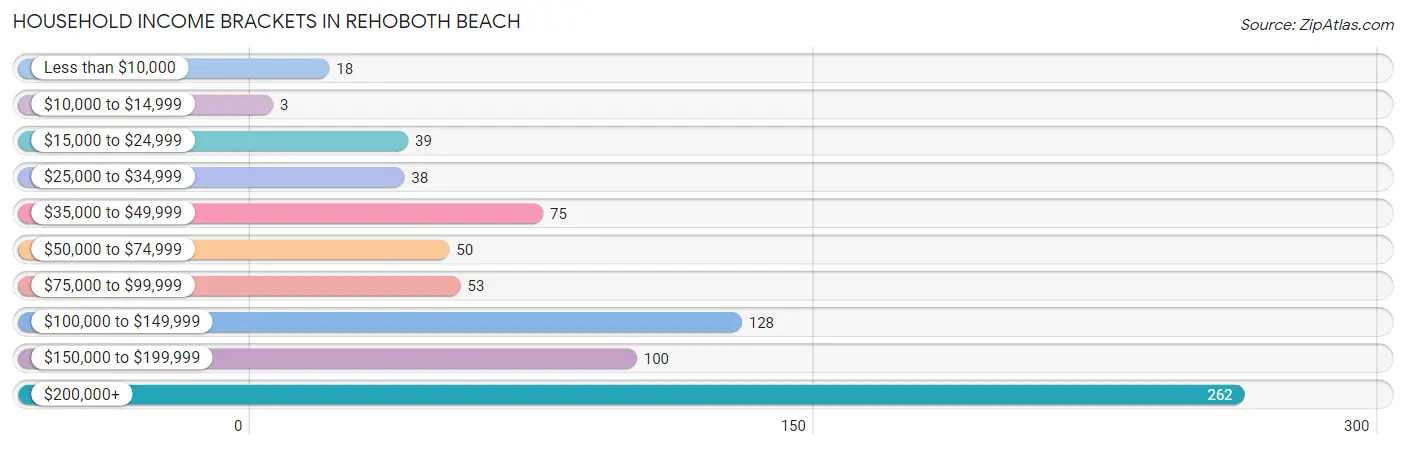
| Income Bracket | # Households | % Households |
| Less than $10,000 | 18 | 2.3% |
| $10,000 to $14,999 | 3 | 0.4% |
| $15,000 to $24,999 | 39 | 5.1% |
| $25,000 to $34,999 | 38 | 5.0% |
| $35,000 to $49,999 | 75 | 9.8% |
| $50,000 to $74,999 | 50 | 6.5% |
| $75,000 to $99,999 | 53 | 6.9% |
| $100,000 to $149,999 | 128 | 16.7% |
| $150,000 to $199,999 | 100 | 13.1% |
| $200,000+ | 262 | 34.2% |
Household Income by Householder Age in Rehoboth Beach
The median household income in Rehoboth Beach is $147,273, with the highest median household income of $200,000 found in the 45 to 64 years age bracket for the primary householder. A total of 292 households (38.1%) fall into this category. Meanwhile, the 15 to 24 years age bracket for the primary householder has the lowest median household income of $0, with 2 households (0.3%) in this group.
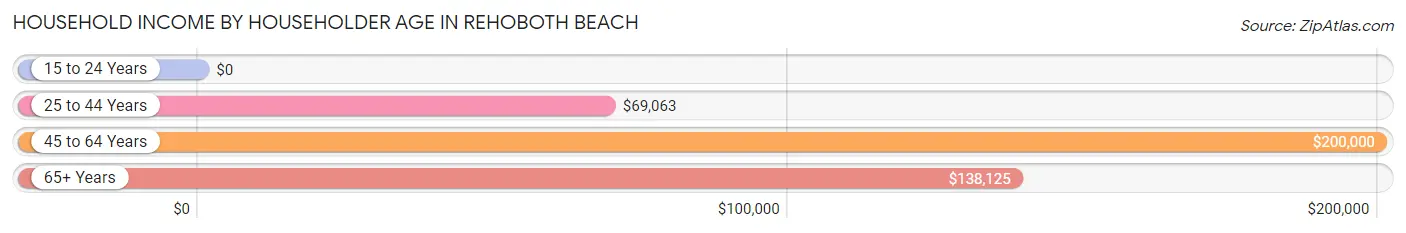
| Income Bracket | # Households | Median Income |
| 15 to 24 Years | 2 (0.3%) | $0 |
| 25 to 44 Years | 87 (11.4%) | $69,063 |
| 45 to 64 Years | 292 (38.1%) | $200,000 |
| 65+ Years | 385 (50.3%) | $138,125 |
| Total | 766 (100.0%) | $147,273 |
Poverty in Rehoboth Beach
Income Below Poverty by Sex and Age in Rehoboth Beach
With 3.1% poverty level for males and 6.3% for females among the residents of Rehoboth Beach, 35 to 44 year old males and under 5 year old females are the most vulnerable to poverty, with 7 males (14.9%) and 19 females (100.0%) in their respective age groups living below the poverty level.
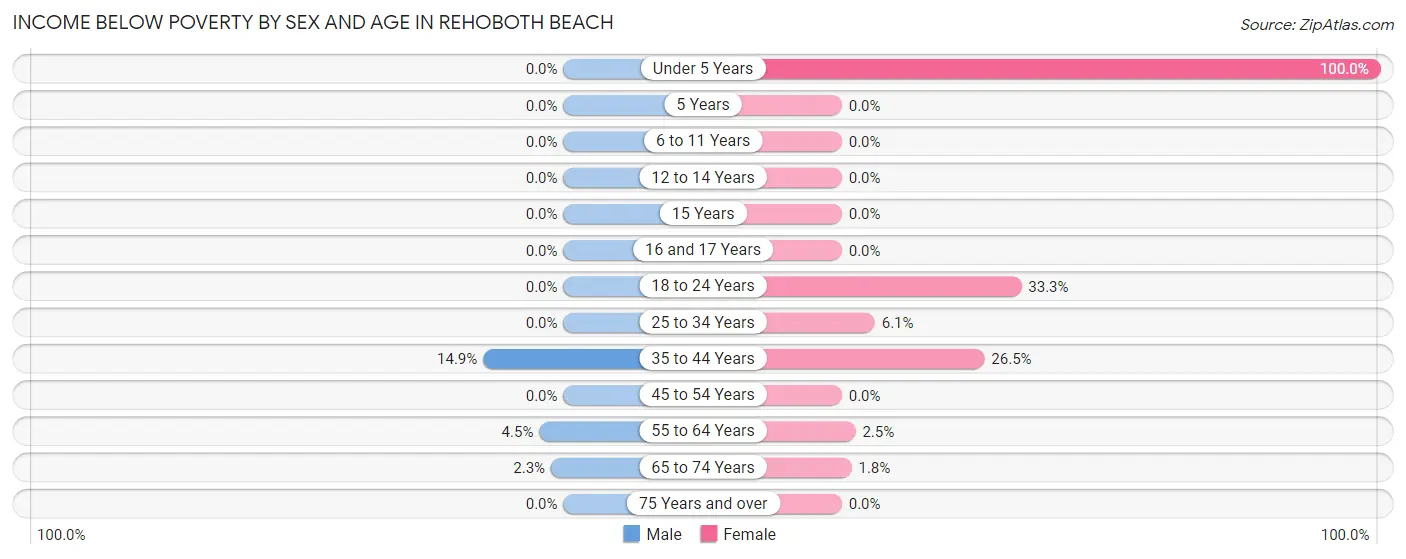
| Age Bracket | Male | Female |
| Under 5 Years | 0 (0.0%) | 19 (100.0%) |
| 5 Years | 0 (0.0%) | 0 (0.0%) |
| 6 to 11 Years | 0 (0.0%) | 0 (0.0%) |
| 12 to 14 Years | 0 (0.0%) | 0 (0.0%) |
| 15 Years | 0 (0.0%) | 0 (0.0%) |
| 16 and 17 Years | 0 (0.0%) | 0 (0.0%) |
| 18 to 24 Years | 0 (0.0%) | 3 (33.3%) |
| 25 to 34 Years | 0 (0.0%) | 3 (6.1%) |
| 35 to 44 Years | 7 (14.9%) | 9 (26.5%) |
| 45 to 54 Years | 0 (0.0%) | 0 (0.0%) |
| 55 to 64 Years | 10 (4.5%) | 3 (2.5%) |
| 65 to 74 Years | 5 (2.3%) | 3 (1.8%) |
| 75 Years and over | 0 (0.0%) | 0 (0.0%) |
| Total | 22 (3.1%) | 40 (6.3%) |
Income Above Poverty by Sex and Age in Rehoboth Beach
According to the poverty statistics in Rehoboth Beach, males aged 6 to 11 years and females aged 6 to 11 years are the age groups that are most secure financially, with 100.0% of males and 100.0% of females in these age groups living above the poverty line.
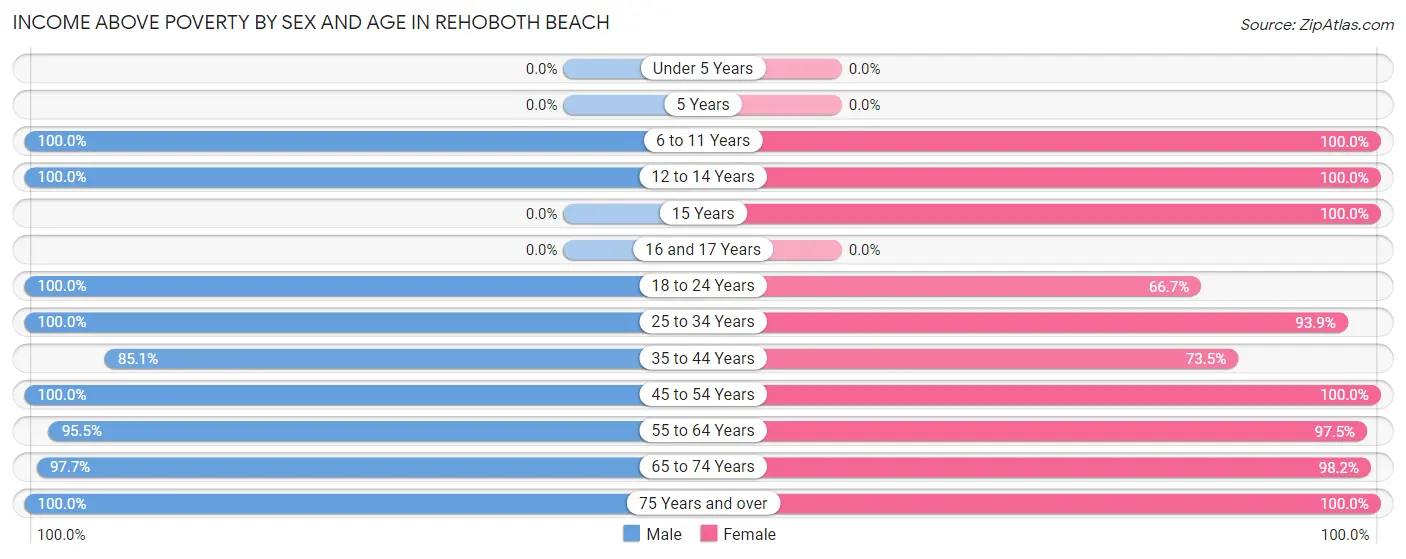
| Age Bracket | Male | Female |
| Under 5 Years | 0 (0.0%) | 0 (0.0%) |
| 5 Years | 0 (0.0%) | 0 (0.0%) |
| 6 to 11 Years | 11 (100.0%) | 4 (100.0%) |
| 12 to 14 Years | 6 (100.0%) | 23 (100.0%) |
| 15 Years | 0 (0.0%) | 9 (100.0%) |
| 16 and 17 Years | 0 (0.0%) | 0 (0.0%) |
| 18 to 24 Years | 7 (100.0%) | 6 (66.7%) |
| 25 to 34 Years | 28 (100.0%) | 46 (93.9%) |
| 35 to 44 Years | 40 (85.1%) | 25 (73.5%) |
| 45 to 54 Years | 77 (100.0%) | 49 (100.0%) |
| 55 to 64 Years | 213 (95.5%) | 115 (97.5%) |
| 65 to 74 Years | 212 (97.7%) | 163 (98.2%) |
| 75 Years and over | 99 (100.0%) | 151 (100.0%) |
| Total | 693 (96.9%) | 591 (93.7%) |
Income Below Poverty Among Married-Couple Families in Rehoboth Beach
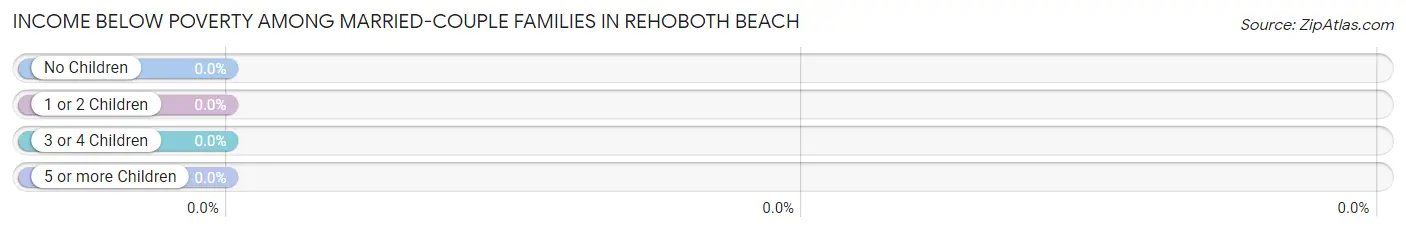
| Children | Above Poverty | Below Poverty |
| No Children | 378 (100.0%) | 0 (0.0%) |
| 1 or 2 Children | 38 (100.0%) | 0 (0.0%) |
| 3 or 4 Children | 5 (100.0%) | 0 (0.0%) |
| 5 or more Children | 0 (0.0%) | 0 (0.0%) |
| Total | 421 (100.0%) | 0 (0.0%) |
Income Below Poverty Among Single-Parent Households in Rehoboth Beach
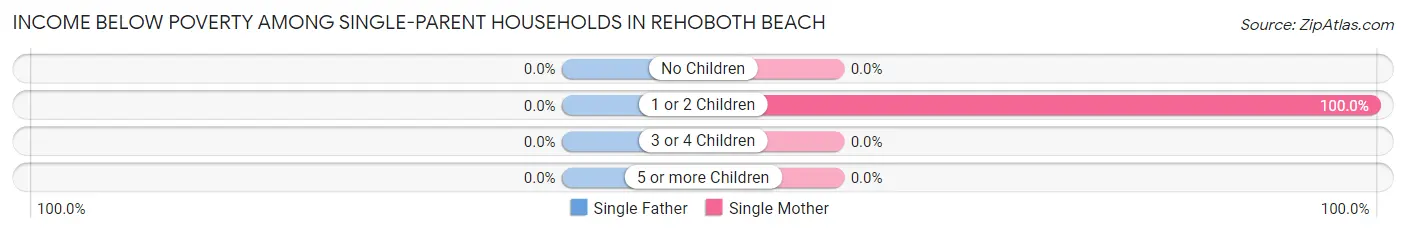
| Children | Single Father | Single Mother |
| No Children | 0 (0.0%) | 0 (0.0%) |
| 1 or 2 Children | 0 (0.0%) | 9 (100.0%) |
| 3 or 4 Children | 0 (0.0%) | 0 (0.0%) |
| 5 or more Children | 0 (0.0%) | 0 (0.0%) |
| Total | 0 (0.0%) | 9 (56.2%) |
Income Below Poverty Among Married-Couple vs Single-Parent Households in Rehoboth Beach
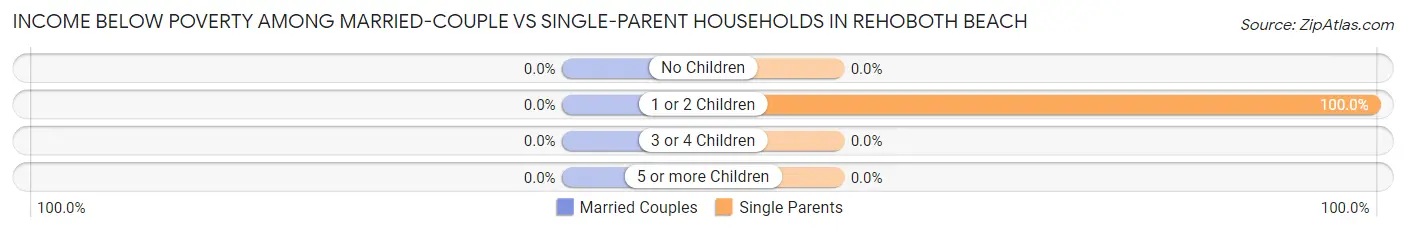
| Children | Married-Couple Families | Single-Parent Households |
| No Children | 0 (0.0%) | 0 (0.0%) |
| 1 or 2 Children | 0 (0.0%) | 9 (100.0%) |
| 3 or 4 Children | 0 (0.0%) | 0 (0.0%) |
| 5 or more Children | 0 (0.0%) | 0 (0.0%) |
| Total | 0 (0.0%) | 9 (42.9%) |
Race in Rehoboth Beach
The most populous races in Rehoboth Beach are White / Caucasian (1,276 | 94.0%), Hispanic or Latino (38 | 2.8%), and Two or more Races (36 | 2.6%).
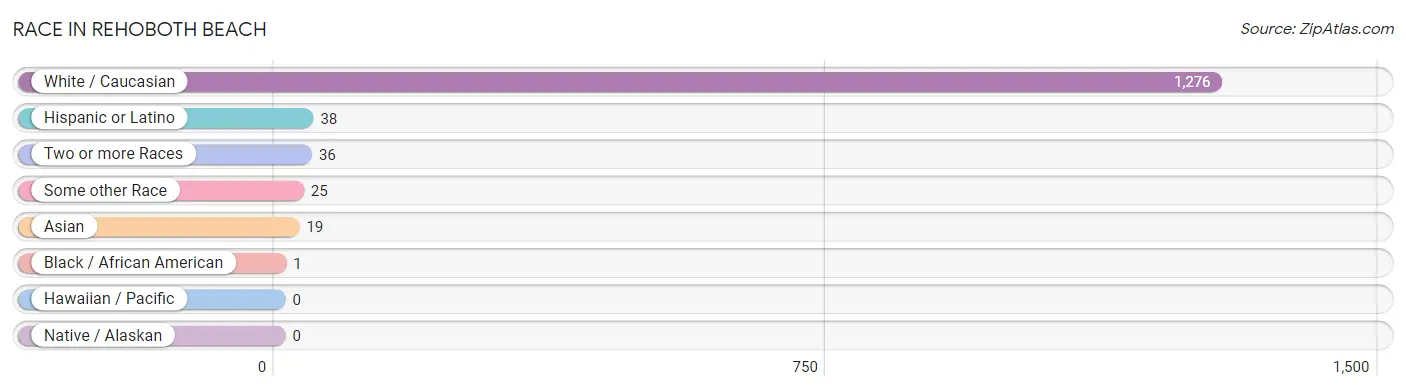
| Race | # Population | % Population |
| Asian | 19 | 1.4% |
| Black / African American | 1 | 0.1% |
| Hawaiian / Pacific | 0 | 0.0% |
| Hispanic or Latino | 38 | 2.8% |
| Native / Alaskan | 0 | 0.0% |
| White / Caucasian | 1,276 | 94.0% |
| Two or more Races | 36 | 2.6% |
| Some other Race | 25 | 1.8% |
| Total | 1,357 | 100.0% |
Ancestry in Rehoboth Beach
The most populous ancestries reported in Rehoboth Beach are English (293 | 21.6%), German (218 | 16.1%), Irish (207 | 15.2%), Italian (161 | 11.9%), and American (131 | 9.7%), together accounting for 74.4% of all Rehoboth Beach residents.
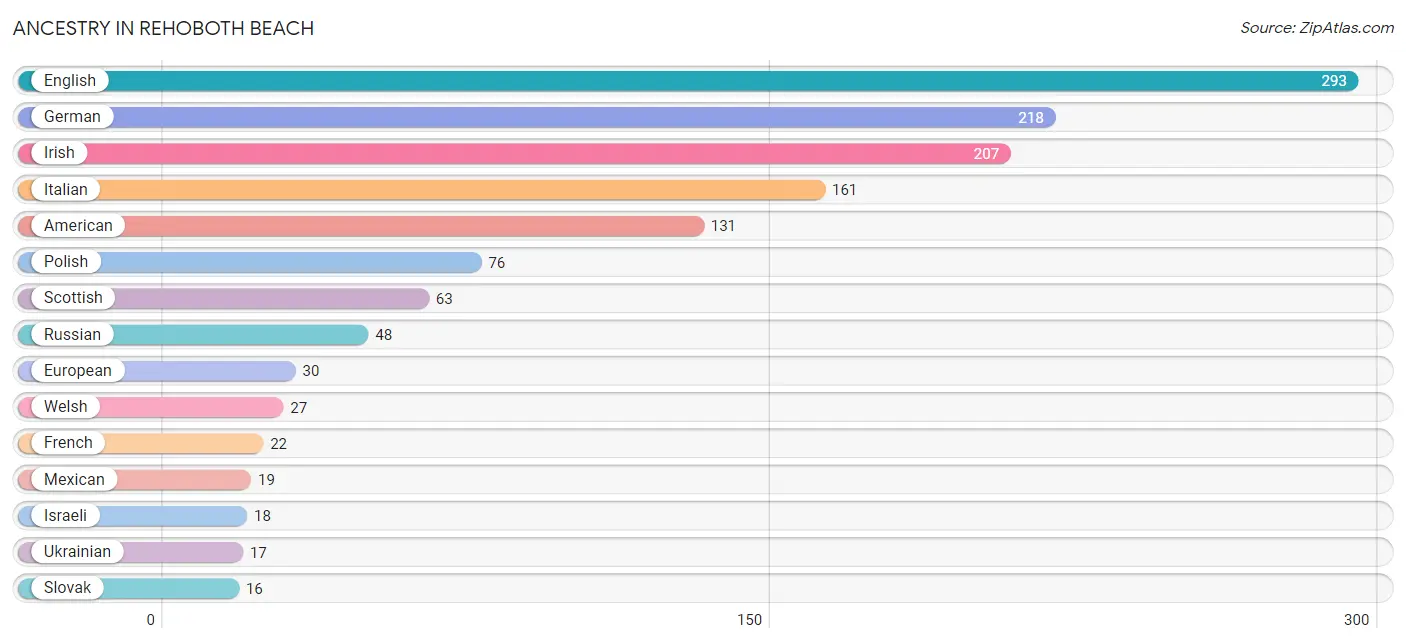
| Ancestry | # Population | % Population |
| American | 131 | 9.7% |
| Armenian | 5 | 0.4% |
| Bolivian | 1 | 0.1% |
| British | 12 | 0.9% |
| Burmese | 7 | 0.5% |
| Canadian | 7 | 0.5% |
| Celtic | 4 | 0.3% |
| Cherokee | 6 | 0.4% |
| Chilean | 4 | 0.3% |
| Croatian | 4 | 0.3% |
| Cuban | 3 | 0.2% |
| Czech | 8 | 0.6% |
| Danish | 3 | 0.2% |
| Dutch | 7 | 0.5% |
| Eastern European | 9 | 0.7% |
| English | 293 | 21.6% |
| European | 30 | 2.2% |
| French | 22 | 1.6% |
| French Canadian | 3 | 0.2% |
| German | 218 | 16.1% |
| Greek | 15 | 1.1% |
| Haitian | 1 | 0.1% |
| Hungarian | 12 | 0.9% |
| Indian (Asian) | 5 | 0.4% |
| Irish | 207 | 15.2% |
| Israeli | 18 | 1.3% |
| Italian | 161 | 11.9% |
| Jamaican | 1 | 0.1% |
| Korean | 1 | 0.1% |
| Lithuanian | 3 | 0.2% |
| Mexican | 19 | 1.4% |
| Norwegian | 3 | 0.2% |
| Polish | 76 | 5.6% |
| Portuguese | 3 | 0.2% |
| Puerto Rican | 10 | 0.7% |
| Romanian | 6 | 0.4% |
| Russian | 48 | 3.5% |
| Scandinavian | 4 | 0.3% |
| Scotch-Irish | 9 | 0.7% |
| Scottish | 63 | 4.6% |
| Slovak | 16 | 1.2% |
| Slovene | 4 | 0.3% |
| South American | 5 | 0.4% |
| Swedish | 12 | 0.9% |
| Swiss | 3 | 0.2% |
| Thai | 7 | 0.5% |
| Ukrainian | 17 | 1.3% |
| Welsh | 27 | 2.0% | View All 48 Rows |
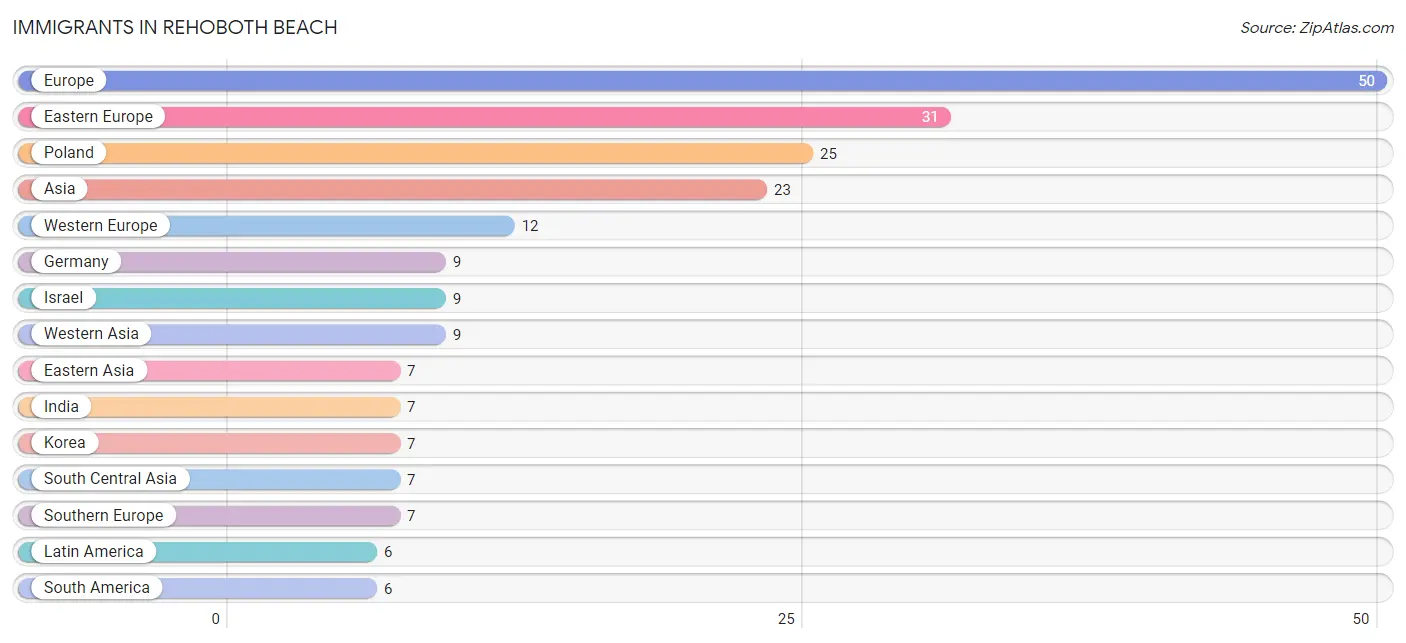
Immigrants in Rehoboth Beach
The most numerous immigrant groups reported in Rehoboth Beach came from Europe (50 | 3.7%), Eastern Europe (31 | 2.3%), Poland (25 | 1.8%), Asia (23 | 1.7%), and Western Europe (12 | 0.9%), together accounting for 10.4% of all Rehoboth Beach residents.
| Immigration Origin | # Population | % Population |
| Argentina | 2 | 0.2% |
| Asia | 23 | 1.7% |
| Belgium | 3 | 0.2% |
| Canada | 3 | 0.2% |
| Chile | 4 | 0.3% |
| Eastern Asia | 7 | 0.5% |
| Eastern Europe | 31 | 2.3% |
| Europe | 50 | 3.7% |
| Germany | 9 | 0.7% |
| Greece | 4 | 0.3% |
| India | 7 | 0.5% |
| Israel | 9 | 0.7% |
| Italy | 3 | 0.2% |
| Korea | 7 | 0.5% |
| Latin America | 6 | 0.4% |
| Poland | 25 | 1.8% |
| Russia | 3 | 0.2% |
| South America | 6 | 0.4% |
| South Central Asia | 7 | 0.5% |
| Southern Europe | 7 | 0.5% |
| Ukraine | 3 | 0.2% |
| Western Asia | 9 | 0.7% |
| Western Europe | 12 | 0.9% | View All 23 Rows |
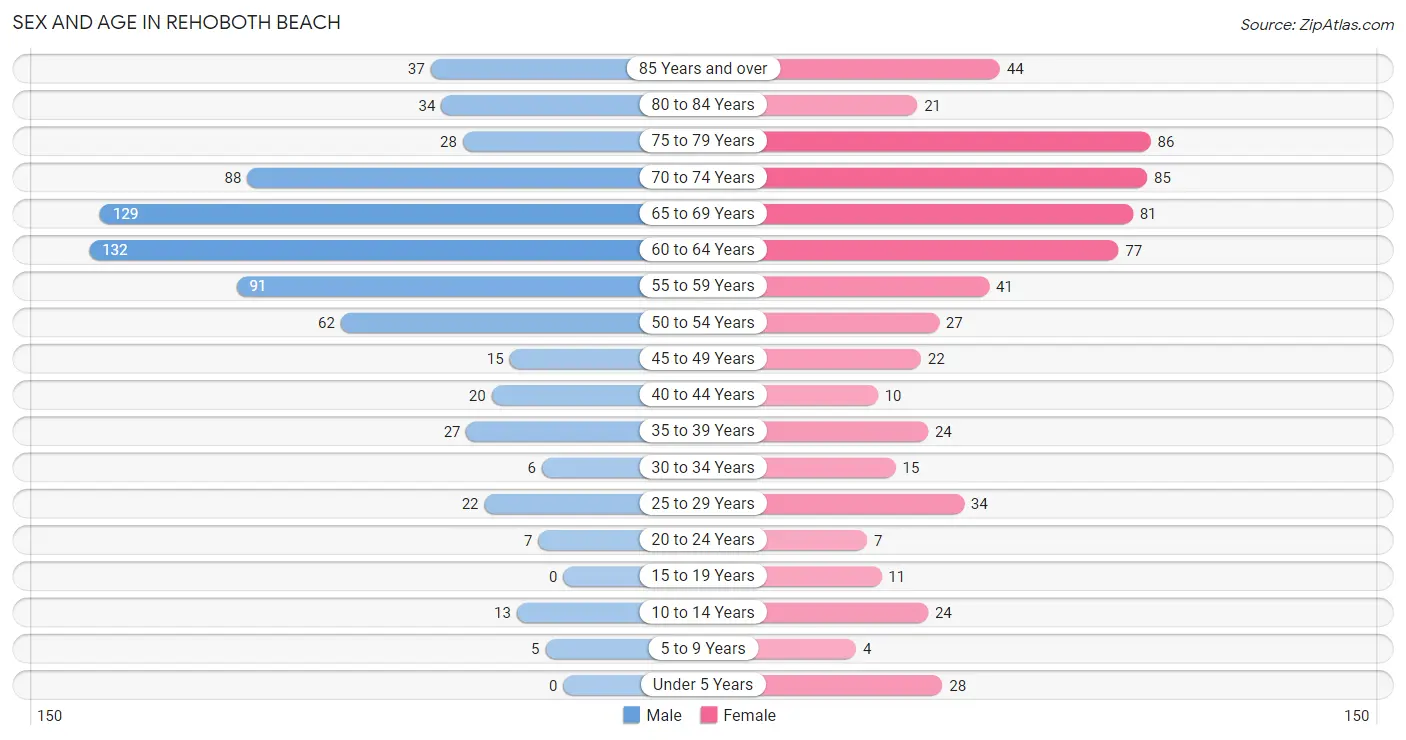
Sex and Age in Rehoboth Beach
Sex and Age in Rehoboth Beach
The most populous age groups in Rehoboth Beach are 60 to 64 Years (132 | 18.4%) for men and 75 to 79 Years (86 | 13.4%) for women.
| Age Bracket | Male | Female |
| Under 5 Years | 0 (0.0%) | 28 (4.4%) |
| 5 to 9 Years | 5 (0.7%) | 4 (0.6%) |
| 10 to 14 Years | 13 (1.8%) | 24 (3.7%) |
| 15 to 19 Years | 0 (0.0%) | 11 (1.7%) |
| 20 to 24 Years | 7 (1.0%) | 7 (1.1%) |
| 25 to 29 Years | 22 (3.1%) | 34 (5.3%) |
| 30 to 34 Years | 6 (0.8%) | 15 (2.3%) |
| 35 to 39 Years | 27 (3.8%) | 24 (3.7%) |
| 40 to 44 Years | 20 (2.8%) | 10 (1.6%) |
| 45 to 49 Years | 15 (2.1%) | 22 (3.4%) |
| 50 to 54 Years | 62 (8.7%) | 27 (4.2%) |
| 55 to 59 Years | 91 (12.7%) | 41 (6.4%) |
| 60 to 64 Years | 132 (18.4%) | 77 (12.0%) |
| 65 to 69 Years | 129 (18.0%) | 81 (12.6%) |
| 70 to 74 Years | 88 (12.3%) | 85 (13.3%) |
| 75 to 79 Years | 28 (3.9%) | 86 (13.4%) |
| 80 to 84 Years | 34 (4.8%) | 21 (3.3%) |
| 85 Years and over | 37 (5.2%) | 44 (6.9%) |
| Total | 716 (100.0%) | 641 (100.0%) |
Families and Households in Rehoboth Beach
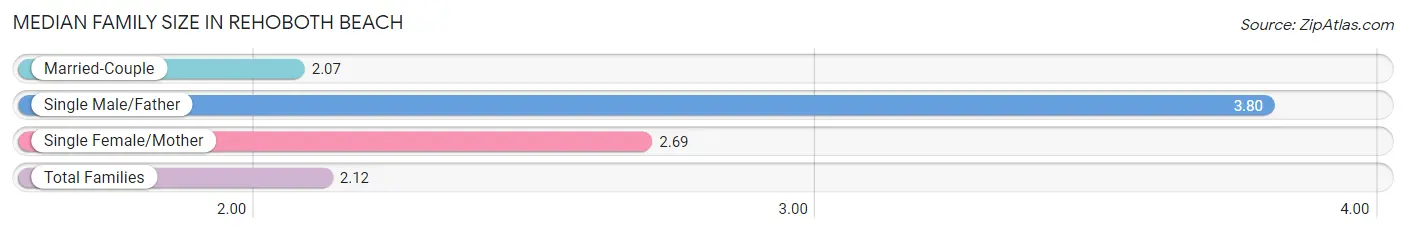
Median Family Size in Rehoboth Beach
The median family size in Rehoboth Beach is 2.12 persons per family, with single male/father families (5 | 1.1%) accounting for the largest median family size of 3.8 persons per family. On the other hand, married-couple families (421 | 95.3%) represent the smallest median family size with 2.07 persons per family.
| Family Type | # Families | Family Size |
| Married-Couple | 421 (95.3%) | 2.07 |
| Single Male/Father | 5 (1.1%) | 3.80 |
| Single Female/Mother | 16 (3.6%) | 2.69 |
| Total Families | 442 (100.0%) | 2.12 |
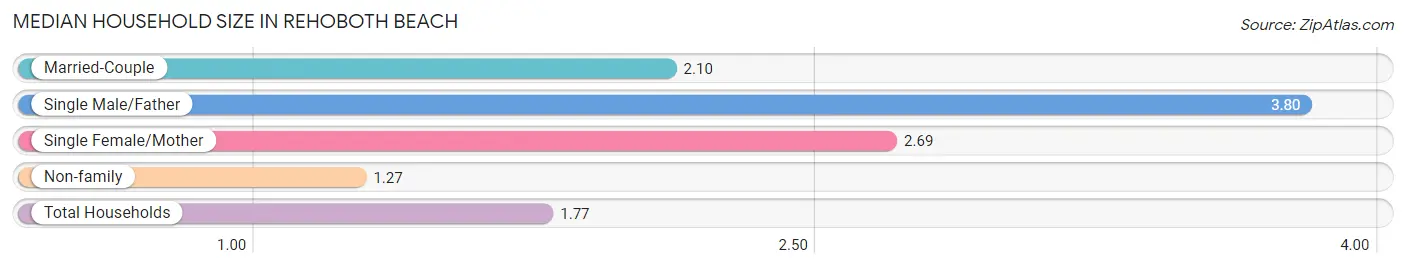
Median Household Size in Rehoboth Beach
The median household size in Rehoboth Beach is 1.77 persons per household, with single male/father households (5 | 0.6%) accounting for the largest median household size of 3.8 persons per household. non-family households (324 | 42.3%) represent the smallest median household size with 1.27 persons per household.
| Household Type | # Households | Household Size |
| Married-Couple | 421 (55.0%) | 2.10 |
| Single Male/Father | 5 (0.6%) | 3.80 |
| Single Female/Mother | 16 (2.1%) | 2.69 |
| Non-family | 324 (42.3%) | 1.27 |
| Total Households | 766 (100.0%) | 1.77 |
Household Size by Marriage Status in Rehoboth Beach
Out of a total of 766 households in Rehoboth Beach, 442 (57.7%) are family households, while 324 (42.3%) are nonfamily households. The most numerous type of family households are 2-person households, comprising 363, and the most common type of nonfamily households are 1-person households, comprising 268.
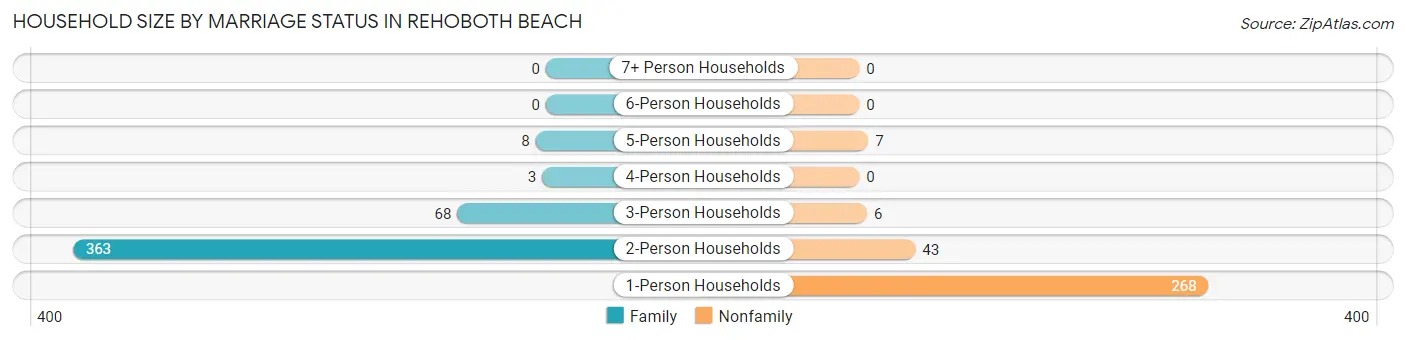
| Household Size | Family Households | Nonfamily Households |
| 1-Person Households | - | 268 (35.0%) |
| 2-Person Households | 363 (47.4%) | 43 (5.6%) |
| 3-Person Households | 68 (8.9%) | 6 (0.8%) |
| 4-Person Households | 3 (0.4%) | 0 (0.0%) |
| 5-Person Households | 8 (1.0%) | 7 (0.9%) |
| 6-Person Households | 0 (0.0%) | 0 (0.0%) |
| 7+ Person Households | 0 (0.0%) | 0 (0.0%) |
| Total | 442 (57.7%) | 324 (42.3%) |
Female Fertility in Rehoboth Beach
Fertility by Age in Rehoboth Beach
| Age Bracket | Women with Births | Births / 1,000 Women |
| 15 to 19 years | 0 (0.0%) | 0.0 |
| 20 to 34 years | 0 (0.0%) | 0.0 |
| 35 to 50 years | 0 (0.0%) | 0.0 |
| Total | 0 (0.0%) | 0.0 |
Fertility by Age by Marriage Status in Rehoboth Beach
| Age Bracket | Married | Unmarried |
| 15 to 19 years | 0 (0.0%) | 0 (0.0%) |
| 20 to 34 years | 0 (0.0%) | 0 (0.0%) |
| 35 to 50 years | 0 (0.0%) | 0 (0.0%) |
| Total | 0 (0.0%) | 0 (0.0%) |
Fertility by Education in Rehoboth Beach
| Educational Attainment | Women with Births | Births / 1,000 Women |
| Less than High School | 0 (0.0%) | 0.0 |
| High School Diploma | 0 (0.0%) | 0.0 |
| College or Associate's Degree | 0 (0.0%) | 0.0 |
| Bachelor's Degree | 0 (0.0%) | 0.0 |
| Graduate Degree | 0 (0.0%) | 0.0 |
| Total | 0 (0.0%) | 0.0 |
Fertility by Education by Marriage Status in Rehoboth Beach
| Educational Attainment | Married | Unmarried |
| Less than High School | 0 (0.0%) | 0 (0.0%) |
| High School Diploma | 0 (0.0%) | 0 (0.0%) |
| College or Associate's Degree | 0 (0.0%) | 0 (0.0%) |
| Bachelor's Degree | 0 (0.0%) | 0 (0.0%) |
| Graduate Degree | 0 (0.0%) | 0 (0.0%) |
| Total | 0 (0.0%) | 0 (0.0%) |
Employment Characteristics in Rehoboth Beach
Employment by Class of Employer in Rehoboth Beach
Among the 602 employed individuals in Rehoboth Beach, private company employees (298 | 49.5%), not-for-profit organizations (84 | 14.0%), and self-employed (not incorporated) (83 | 13.8%) make up the most common classes of employment.
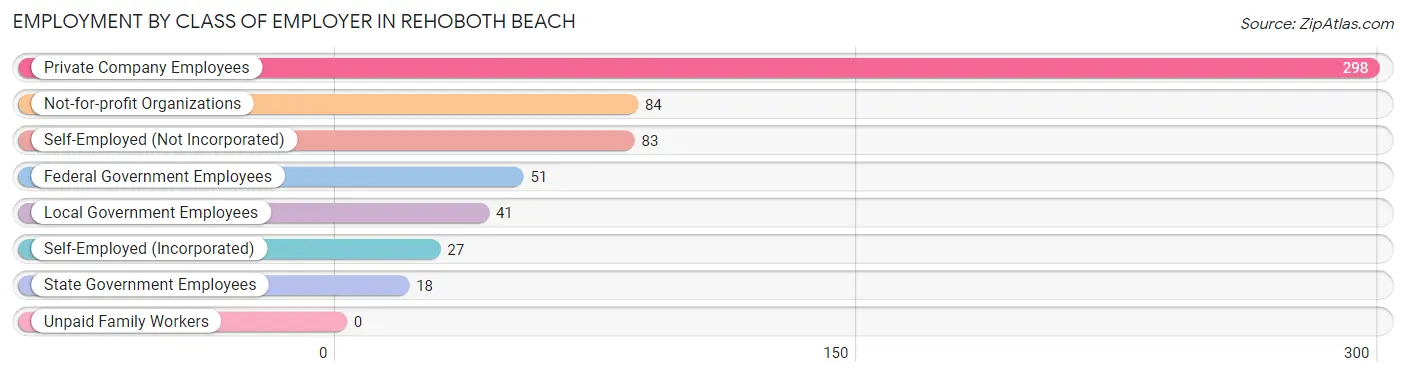
| Employer Class | # Employees | % Employees |
| Private Company Employees | 298 | 49.5% |
| Self-Employed (Incorporated) | 27 | 4.5% |
| Self-Employed (Not Incorporated) | 83 | 13.8% |
| Not-for-profit Organizations | 84 | 14.0% |
| Local Government Employees | 41 | 6.8% |
| State Government Employees | 18 | 3.0% |
| Federal Government Employees | 51 | 8.5% |
| Unpaid Family Workers | 0 | 0.0% |
| Total | 602 | 100.0% |
Employment Status by Age in Rehoboth Beach
According to the labor force statistics for Rehoboth Beach, out of the total population over 16 years of age (1,274), 51.4% or 655 individuals are in the labor force, with 7.0% or 46 of them unemployed. The age group with the highest labor force participation rate is 20 to 24 years, with 100.0% or 14 individuals in the labor force. Within the labor force, the 35 to 44 years age range has the highest percentage of unemployed individuals, with 13.4% or 9 of them being unemployed.
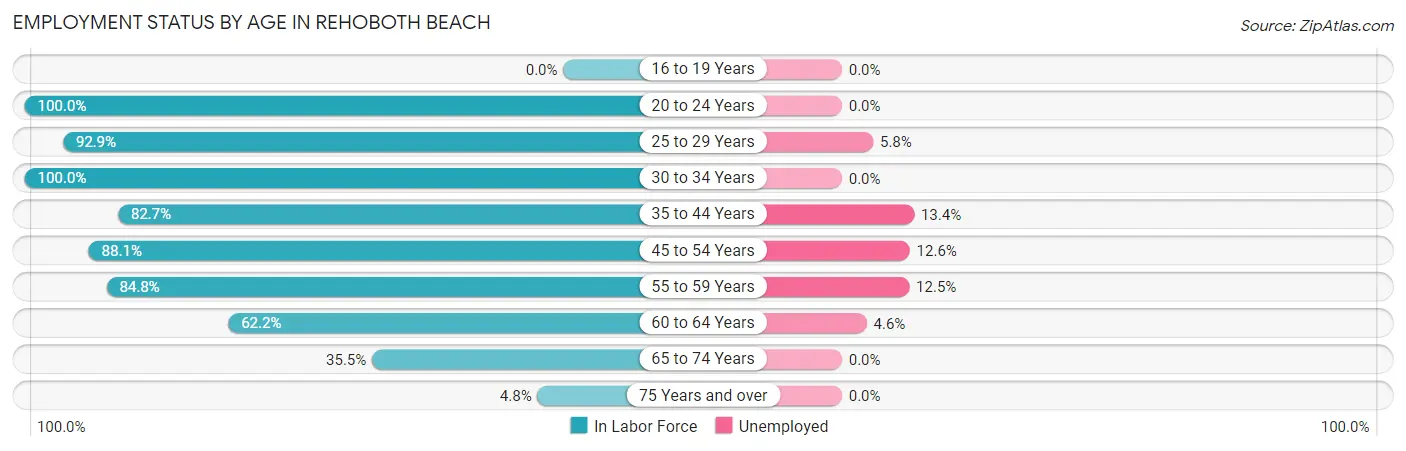
| Age Bracket | In Labor Force | Unemployed |
| 16 to 19 Years | 0 (0.0%) | 0 (0.0%) |
| 20 to 24 Years | 14 (100.0%) | 0 (0.0%) |
| 25 to 29 Years | 52 (92.9%) | 3 (5.8%) |
| 30 to 34 Years | 21 (100.0%) | 0 (0.0%) |
| 35 to 44 Years | 67 (82.7%) | 9 (13.4%) |
| 45 to 54 Years | 111 (88.1%) | 14 (12.6%) |
| 55 to 59 Years | 112 (84.8%) | 14 (12.5%) |
| 60 to 64 Years | 130 (62.2%) | 6 (4.6%) |
| 65 to 74 Years | 136 (35.5%) | 0 (0.0%) |
| 75 Years and over | 12 (4.8%) | 0 (0.0%) |
| Total | 655 (51.4%) | 46 (7.0%) |
Employment Status by Educational Attainment in Rehoboth Beach
According to labor force statistics for Rehoboth Beach, 78.9% of individuals (493) out of the total population between 25 and 64 years of age (625) are in the labor force, with 9.3% or 46 of them being unemployed. The group with the highest labor force participation rate are those with the educational attainment of bachelor's degree or higher, with 83.3% or 349 individuals in the labor force. Within the labor force, individuals with high school diploma education have the highest percentage of unemployment, with 24.4% or 10 of them being unemployed.
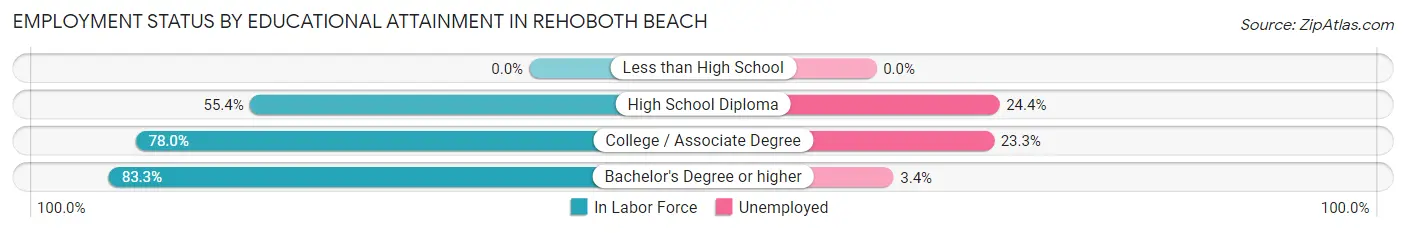
| Educational Attainment | In Labor Force | Unemployed |
| Less than High School | 0 (0.0%) | 0 (0.0%) |
| High School Diploma | 41 (55.4%) | 18 (24.4%) |
| College / Associate Degree | 103 (78.0%) | 31 (23.3%) |
| Bachelor's Degree or higher | 349 (83.3%) | 14 (3.4%) |
| Total | 493 (78.9%) | 58 (9.3%) |
Employment Occupations by Sex in Rehoboth Beach
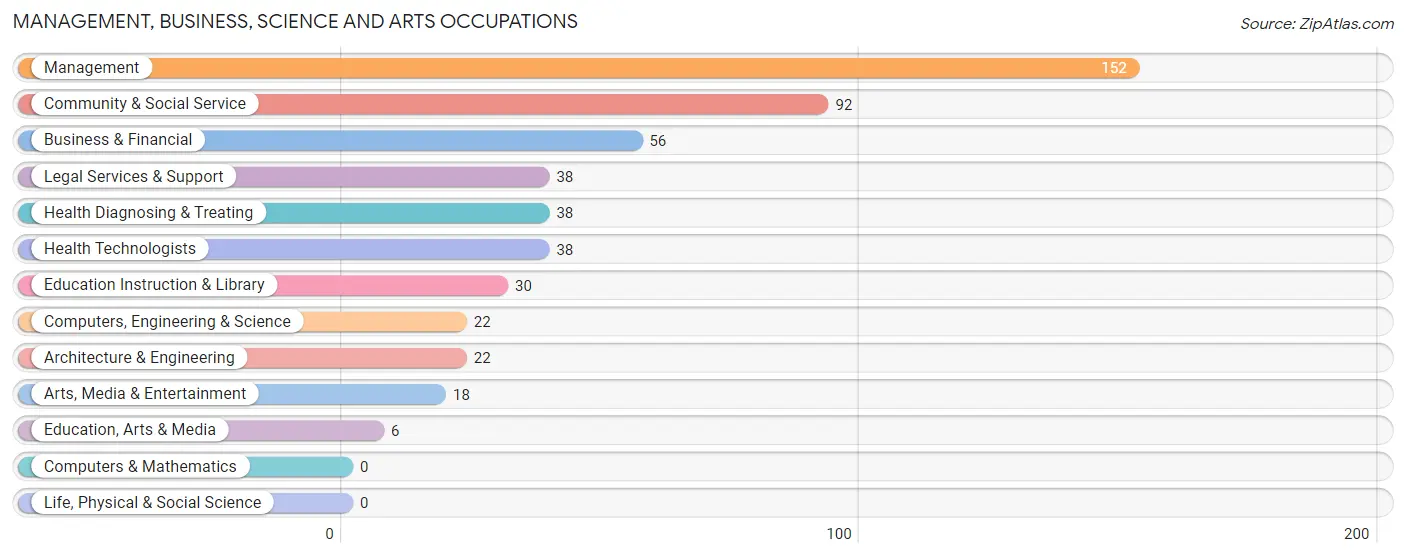
Management, Business, Science and Arts Occupations
The most common Management, Business, Science and Arts occupations in Rehoboth Beach are Management (152 | 25.0%), Community & Social Service (92 | 15.1%), Business & Financial (56 | 9.2%), Legal Services & Support (38 | 6.2%), and Health Diagnosing & Treating (38 | 6.2%).
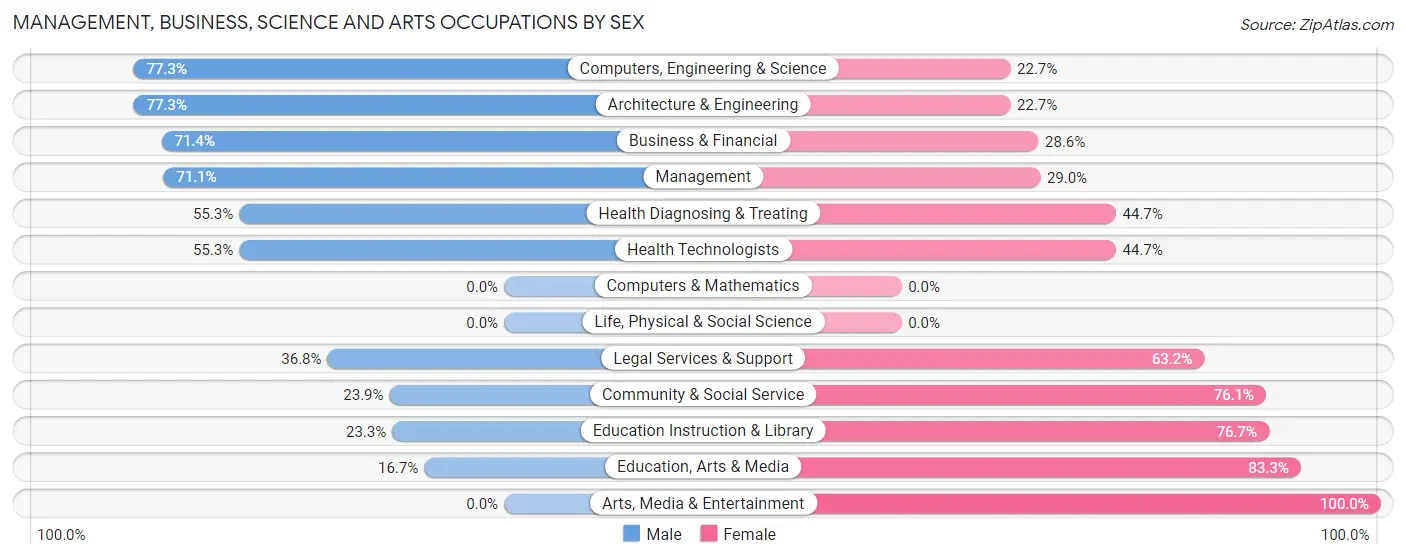
Management, Business, Science and Arts Occupations by Sex
Within the Management, Business, Science and Arts occupations in Rehoboth Beach, the most male-oriented occupations are Computers, Engineering & Science (77.3%), Architecture & Engineering (77.3%), and Business & Financial (71.4%), while the most female-oriented occupations are Arts, Media & Entertainment (100.0%), Education, Arts & Media (83.3%), and Education Instruction & Library (76.7%).
| Occupation | Male | Female |
| Management | 108 (71.1%) | 44 (28.9%) |
| Business & Financial | 40 (71.4%) | 16 (28.6%) |
| Computers, Engineering & Science | 17 (77.3%) | 5 (22.7%) |
| Computers & Mathematics | 0 (0.0%) | 0 (0.0%) |
| Architecture & Engineering | 17 (77.3%) | 5 (22.7%) |
| Life, Physical & Social Science | 0 (0.0%) | 0 (0.0%) |
| Community & Social Service | 22 (23.9%) | 70 (76.1%) |
| Education, Arts & Media | 1 (16.7%) | 5 (83.3%) |
| Legal Services & Support | 14 (36.8%) | 24 (63.2%) |
| Education Instruction & Library | 7 (23.3%) | 23 (76.7%) |
| Arts, Media & Entertainment | 0 (0.0%) | 18 (100.0%) |
| Health Diagnosing & Treating | 21 (55.3%) | 17 (44.7%) |
| Health Technologists | 21 (55.3%) | 17 (44.7%) |
| Total (Category) | 208 (57.8%) | 152 (42.2%) |
| Total (Overall) | 358 (58.8%) | 251 (41.2%) |
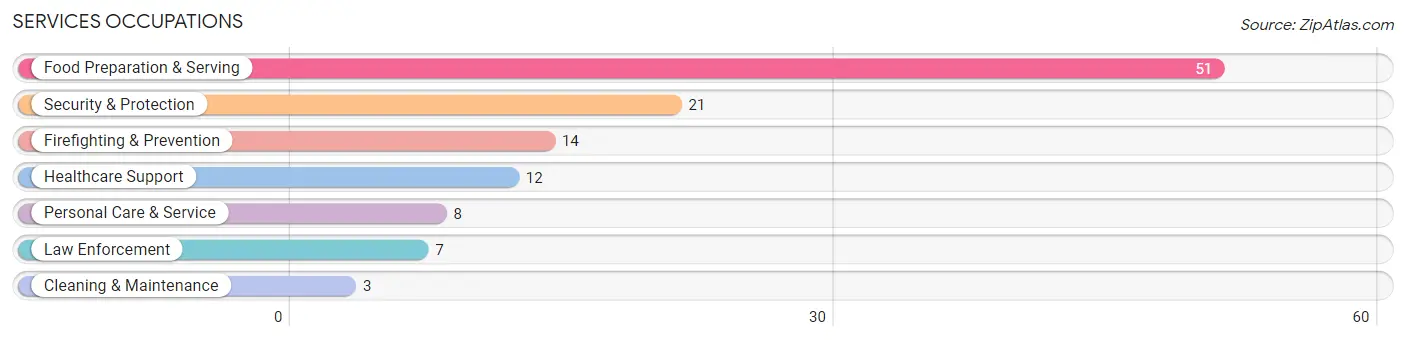
Services Occupations
The most common Services occupations in Rehoboth Beach are Food Preparation & Serving (51 | 8.4%), Security & Protection (21 | 3.5%), Firefighting & Prevention (14 | 2.3%), Healthcare Support (12 | 2.0%), and Personal Care & Service (8 | 1.3%).
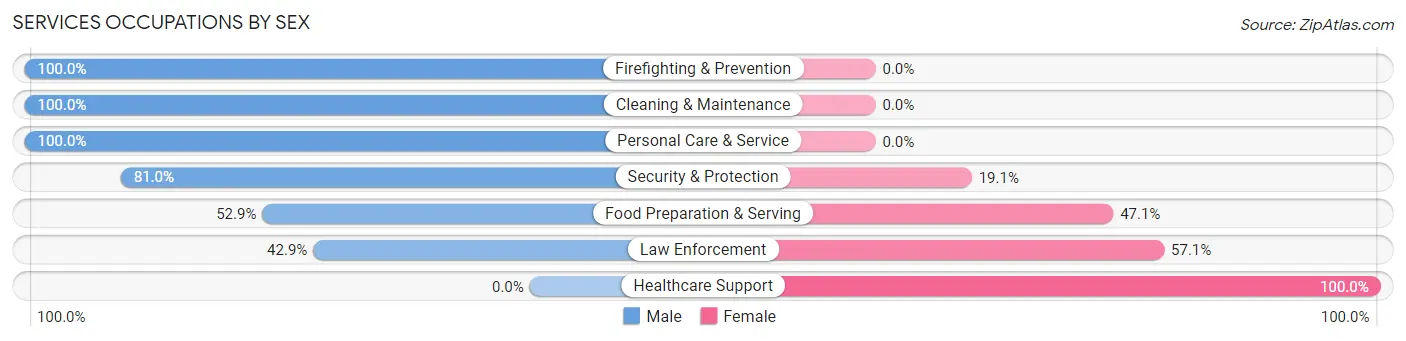
Services Occupations by Sex
Within the Services occupations in Rehoboth Beach, the most male-oriented occupations are Firefighting & Prevention (100.0%), Cleaning & Maintenance (100.0%), and Personal Care & Service (100.0%), while the most female-oriented occupations are Healthcare Support (100.0%), Law Enforcement (57.1%), and Food Preparation & Serving (47.1%).
| Occupation | Male | Female |
| Healthcare Support | 0 (0.0%) | 12 (100.0%) |
| Security & Protection | 17 (80.9%) | 4 (19.1%) |
| Firefighting & Prevention | 14 (100.0%) | 0 (0.0%) |
| Law Enforcement | 3 (42.9%) | 4 (57.1%) |
| Food Preparation & Serving | 27 (52.9%) | 24 (47.1%) |
| Cleaning & Maintenance | 3 (100.0%) | 0 (0.0%) |
| Personal Care & Service | 8 (100.0%) | 0 (0.0%) |
| Total (Category) | 55 (57.9%) | 40 (42.1%) |
| Total (Overall) | 358 (58.8%) | 251 (41.2%) |
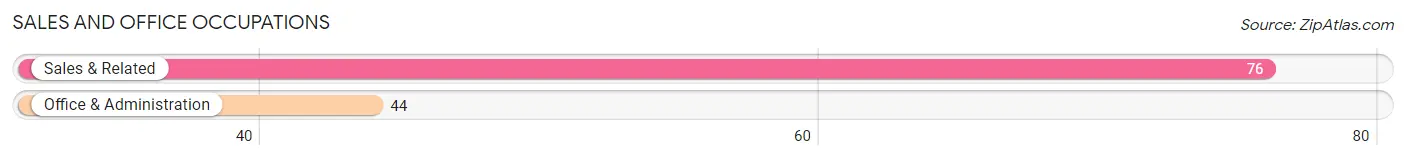
Sales and Office Occupations
The most common Sales and Office occupations in Rehoboth Beach are Sales & Related (76 | 12.5%), and Office & Administration (44 | 7.2%).
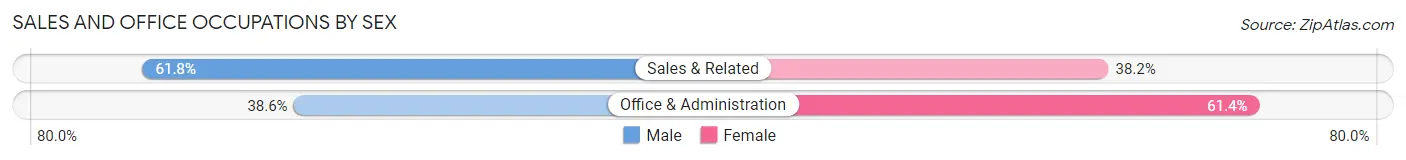
Sales and Office Occupations by Sex
| Occupation | Male | Female |
| Sales & Related | 47 (61.8%) | 29 (38.2%) |
| Office & Administration | 17 (38.6%) | 27 (61.4%) |
| Total (Category) | 64 (53.3%) | 56 (46.7%) |
| Total (Overall) | 358 (58.8%) | 251 (41.2%) |
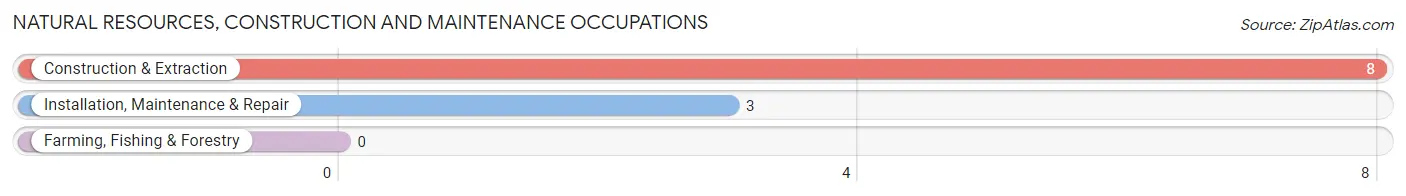
Natural Resources, Construction and Maintenance Occupations
The most common Natural Resources, Construction and Maintenance occupations in Rehoboth Beach are Construction & Extraction (8 | 1.3%), and Installation, Maintenance & Repair (3 | 0.5%).
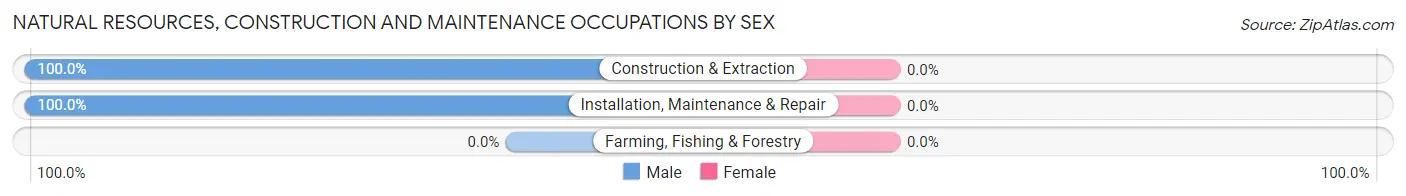
Natural Resources, Construction and Maintenance Occupations by Sex
| Occupation | Male | Female |
| Farming, Fishing & Forestry | 0 (0.0%) | 0 (0.0%) |
| Construction & Extraction | 8 (100.0%) | 0 (0.0%) |
| Installation, Maintenance & Repair | 3 (100.0%) | 0 (0.0%) |
| Total (Category) | 11 (100.0%) | 0 (0.0%) |
| Total (Overall) | 358 (58.8%) | 251 (41.2%) |
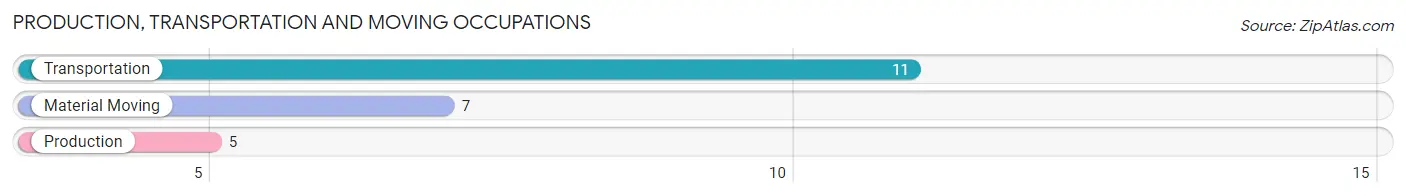
Production, Transportation and Moving Occupations
The most common Production, Transportation and Moving occupations in Rehoboth Beach are Transportation (11 | 1.8%), Material Moving (7 | 1.1%), and Production (5 | 0.8%).
Production, Transportation and Moving Occupations by Sex
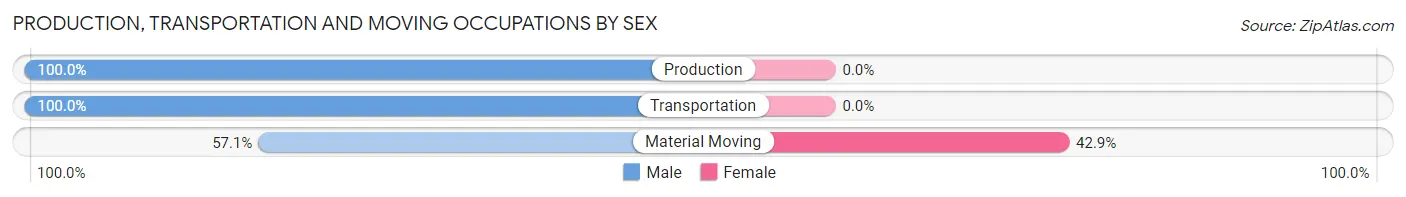
| Occupation | Male | Female |
| Production | 5 (100.0%) | 0 (0.0%) |
| Transportation | 11 (100.0%) | 0 (0.0%) |
| Material Moving | 4 (57.1%) | 3 (42.9%) |
| Total (Category) | 20 (87.0%) | 3 (13.0%) |
| Total (Overall) | 358 (58.8%) | 251 (41.2%) |
Employment Industries by Sex in Rehoboth Beach
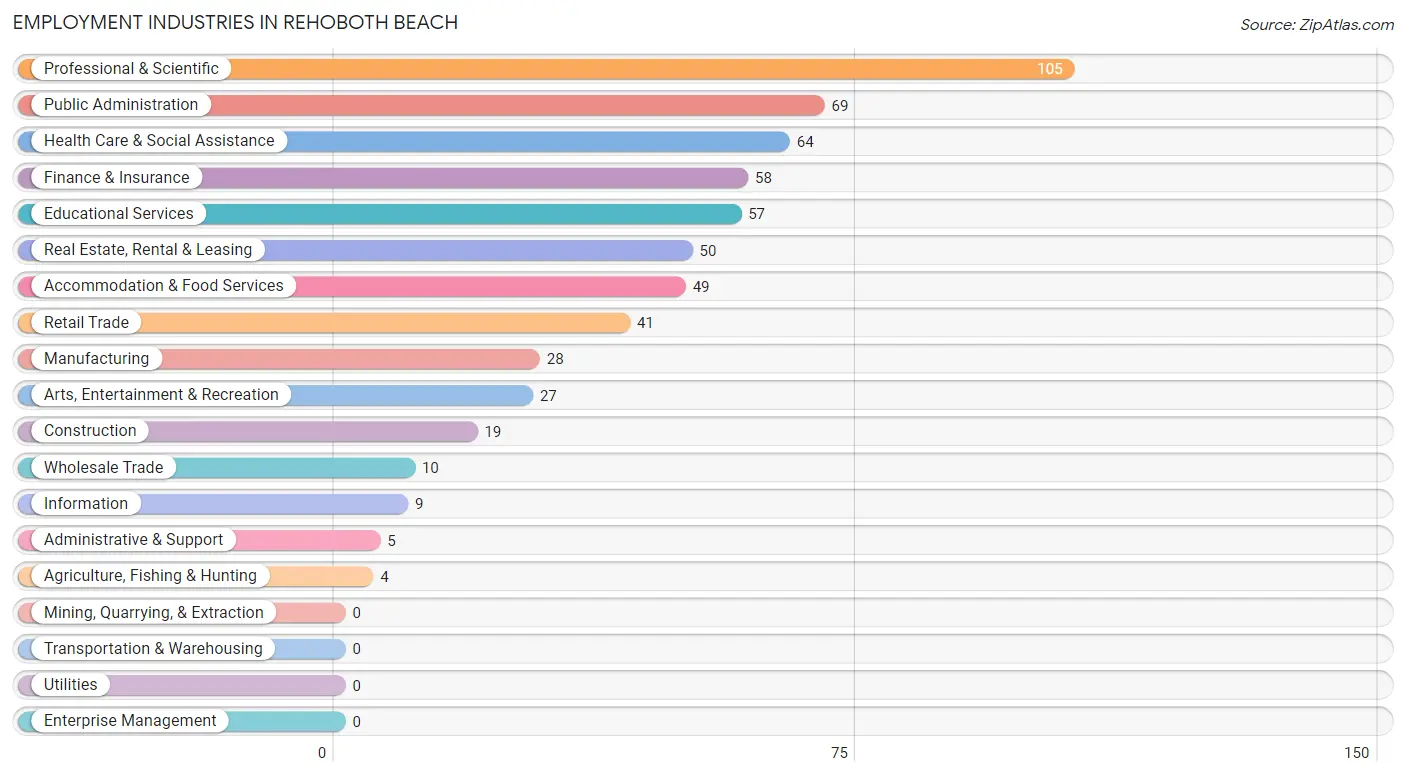
Employment Industries in Rehoboth Beach
The major employment industries in Rehoboth Beach include Professional & Scientific (105 | 17.2%), Public Administration (69 | 11.3%), Health Care & Social Assistance (64 | 10.5%), Finance & Insurance (58 | 9.5%), and Educational Services (57 | 9.4%).
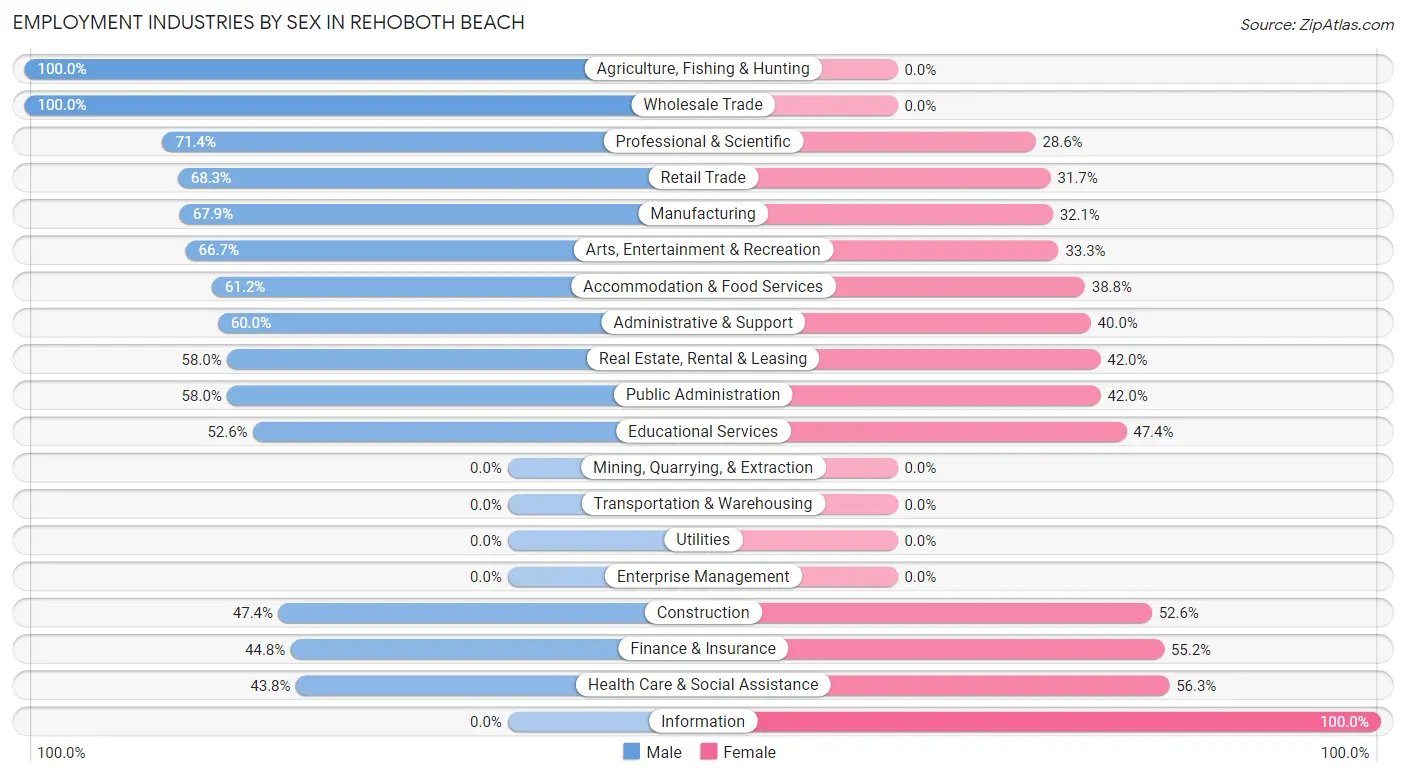
Employment Industries by Sex in Rehoboth Beach
The Rehoboth Beach industries that see more men than women are Agriculture, Fishing & Hunting (100.0%), Wholesale Trade (100.0%), and Professional & Scientific (71.4%), whereas the industries that tend to have a higher number of women are Information (100.0%), Health Care & Social Assistance (56.2%), and Finance & Insurance (55.2%).
| Industry | Male | Female |
| Agriculture, Fishing & Hunting | 4 (100.0%) | 0 (0.0%) |
| Mining, Quarrying, & Extraction | 0 (0.0%) | 0 (0.0%) |
| Construction | 9 (47.4%) | 10 (52.6%) |
| Manufacturing | 19 (67.9%) | 9 (32.1%) |
| Wholesale Trade | 10 (100.0%) | 0 (0.0%) |
| Retail Trade | 28 (68.3%) | 13 (31.7%) |
| Transportation & Warehousing | 0 (0.0%) | 0 (0.0%) |
| Utilities | 0 (0.0%) | 0 (0.0%) |
| Information | 0 (0.0%) | 9 (100.0%) |
| Finance & Insurance | 26 (44.8%) | 32 (55.2%) |
| Real Estate, Rental & Leasing | 29 (58.0%) | 21 (42.0%) |
| Professional & Scientific | 75 (71.4%) | 30 (28.6%) |
| Enterprise Management | 0 (0.0%) | 0 (0.0%) |
| Administrative & Support | 3 (60.0%) | 2 (40.0%) |
| Educational Services | 30 (52.6%) | 27 (47.4%) |
| Health Care & Social Assistance | 28 (43.8%) | 36 (56.2%) |
| Arts, Entertainment & Recreation | 18 (66.7%) | 9 (33.3%) |
| Accommodation & Food Services | 30 (61.2%) | 19 (38.8%) |
| Public Administration | 40 (58.0%) | 29 (42.0%) |
| Total | 358 (58.8%) | 251 (41.2%) |
Education in Rehoboth Beach
School Enrollment in Rehoboth Beach
The most common levels of schooling among the 84 students in Rehoboth Beach are middle school (33 | 39.3%), graduate / professional (17 | 20.2%), and elementary school (12 | 14.3%).
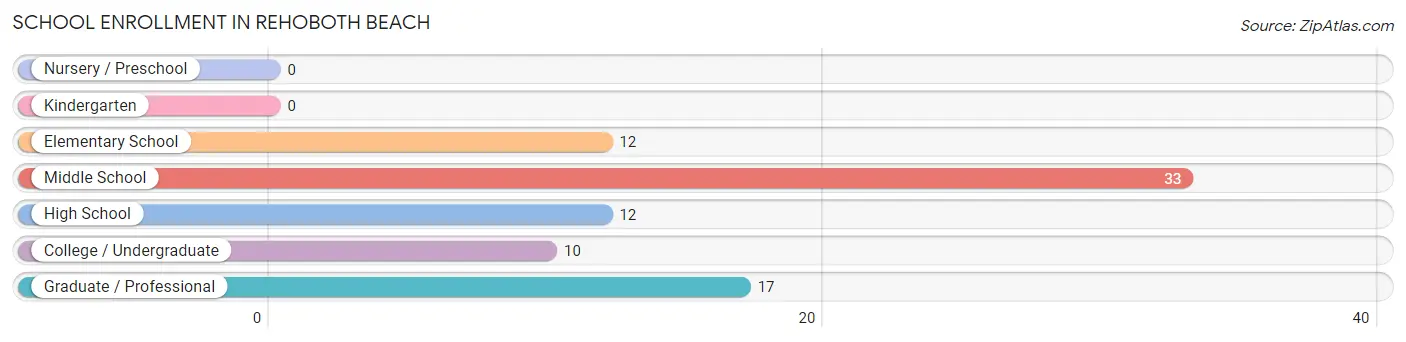
| School Level | # Students | % Students |
| Nursery / Preschool | 0 | 0.0% |
| Kindergarten | 0 | 0.0% |
| Elementary School | 12 | 14.3% |
| Middle School | 33 | 39.3% |
| High School | 12 | 14.3% |
| College / Undergraduate | 10 | 11.9% |
| Graduate / Professional | 17 | 20.2% |
| Total | 84 | 100.0% |
School Enrollment by Age by Funding Source in Rehoboth Beach
Out of a total of 84 students who are enrolled in schools in Rehoboth Beach, 42 (50.0%) attend a private institution, while the remaining 42 (50.0%) are enrolled in public schools. The age group of 15 to 17 year olds has the highest likelihood of being enrolled in private schools, with 9 (100.0% in the age bracket) enrolled. Conversely, the age group of 20 to 24 year olds has the lowest likelihood of being enrolled in a private school, with 3 (100.0% in the age bracket) attending a public institution.
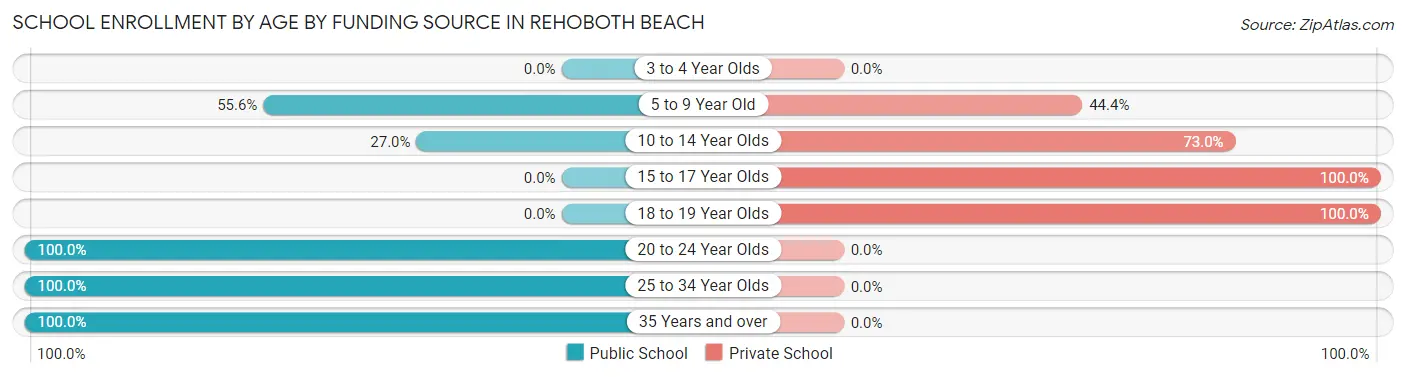
| Age Bracket | Public School | Private School |
| 3 to 4 Year Olds | 0 (0.0%) | 0 (0.0%) |
| 5 to 9 Year Old | 5 (55.6%) | 4 (44.4%) |
| 10 to 14 Year Olds | 10 (27.0%) | 27 (73.0%) |
| 15 to 17 Year Olds | 0 (0.0%) | 9 (100.0%) |
| 18 to 19 Year Olds | 0 (0.0%) | 2 (100.0%) |
| 20 to 24 Year Olds | 3 (100.0%) | 0 (0.0%) |
| 25 to 34 Year Olds | 19 (100.0%) | 0 (0.0%) |
| 35 Years and over | 5 (100.0%) | 0 (0.0%) |
| Total | 42 (50.0%) | 42 (50.0%) |
Educational Attainment by Field of Study in Rehoboth Beach
Business (148 | 15.3%), social sciences (142 | 14.6%), science & technology (133 | 13.7%), engineering (77 | 8.0%), and education (77 | 8.0%) are the most common fields of study among 969 individuals in Rehoboth Beach who have obtained a bachelor's degree or higher.
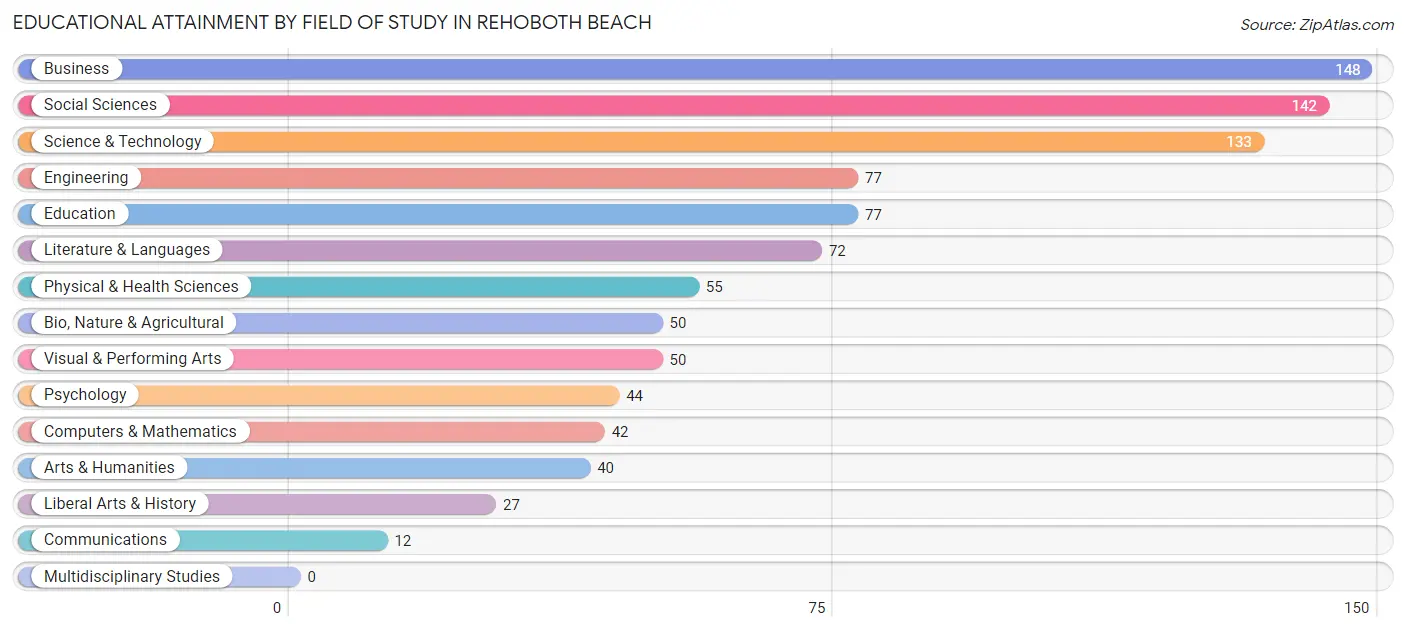
| Field of Study | # Graduates | % Graduates |
| Computers & Mathematics | 42 | 4.3% |
| Bio, Nature & Agricultural | 50 | 5.2% |
| Physical & Health Sciences | 55 | 5.7% |
| Psychology | 44 | 4.5% |
| Social Sciences | 142 | 14.6% |
| Engineering | 77 | 8.0% |
| Multidisciplinary Studies | 0 | 0.0% |
| Science & Technology | 133 | 13.7% |
| Business | 148 | 15.3% |
| Education | 77 | 8.0% |
| Literature & Languages | 72 | 7.4% |
| Liberal Arts & History | 27 | 2.8% |
| Visual & Performing Arts | 50 | 5.2% |
| Communications | 12 | 1.2% |
| Arts & Humanities | 40 | 4.1% |
| Total | 969 | 100.0% |
Transportation & Commute in Rehoboth Beach
Vehicle Availability by Sex in Rehoboth Beach
The most prevalent vehicle ownership categories in Rehoboth Beach are males with 2 vehicles (182, accounting for 51.8%) and females with 2 vehicles (89, making up 72.5%).
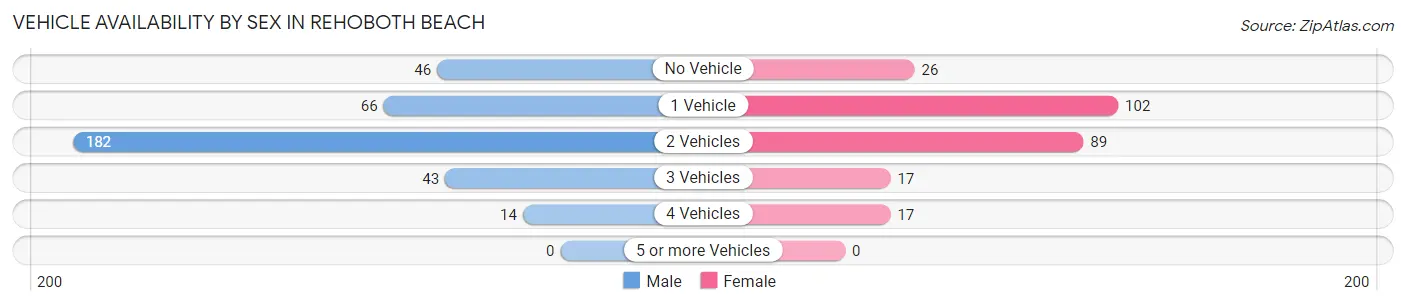
| Vehicles Available | Male | Female |
| No Vehicle | 46 (13.1%) | 26 (10.4%) |
| 1 Vehicle | 66 (18.8%) | 102 (40.6%) |
| 2 Vehicles | 182 (51.8%) | 89 (35.5%) |
| 3 Vehicles | 43 (12.2%) | 17 (6.8%) |
| 4 Vehicles | 14 (4.0%) | 17 (6.8%) |
| 5 or more Vehicles | 0 (0.0%) | 0 (0.0%) |
| Total | 351 (100.0%) | 251 (100.0%) |
Commute Time in Rehoboth Beach
The most frequently occuring commute durations in Rehoboth Beach are 5 to 9 minutes (93 commuters, 22.3%), 10 to 14 minutes (56 commuters, 13.4%), and 15 to 19 minutes (50 commuters, 12.0%).
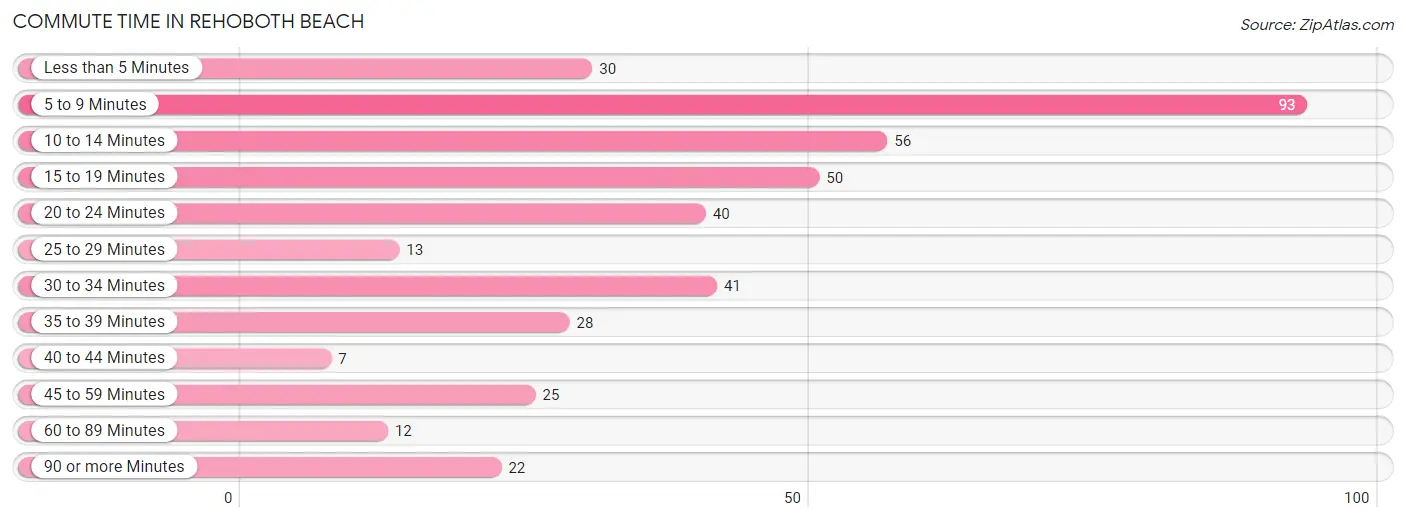
| Commute Time | # Commuters | % Commuters |
| Less than 5 Minutes | 30 | 7.2% |
| 5 to 9 Minutes | 93 | 22.3% |
| 10 to 14 Minutes | 56 | 13.4% |
| 15 to 19 Minutes | 50 | 12.0% |
| 20 to 24 Minutes | 40 | 9.6% |
| 25 to 29 Minutes | 13 | 3.1% |
| 30 to 34 Minutes | 41 | 9.8% |
| 35 to 39 Minutes | 28 | 6.7% |
| 40 to 44 Minutes | 7 | 1.7% |
| 45 to 59 Minutes | 25 | 6.0% |
| 60 to 89 Minutes | 12 | 2.9% |
| 90 or more Minutes | 22 | 5.3% |
Commute Time by Sex in Rehoboth Beach
The most common commute times in Rehoboth Beach are 5 to 9 minutes (73 commuters, 30.2%) for males and 30 to 34 minutes (28 commuters, 16.0%) for females.
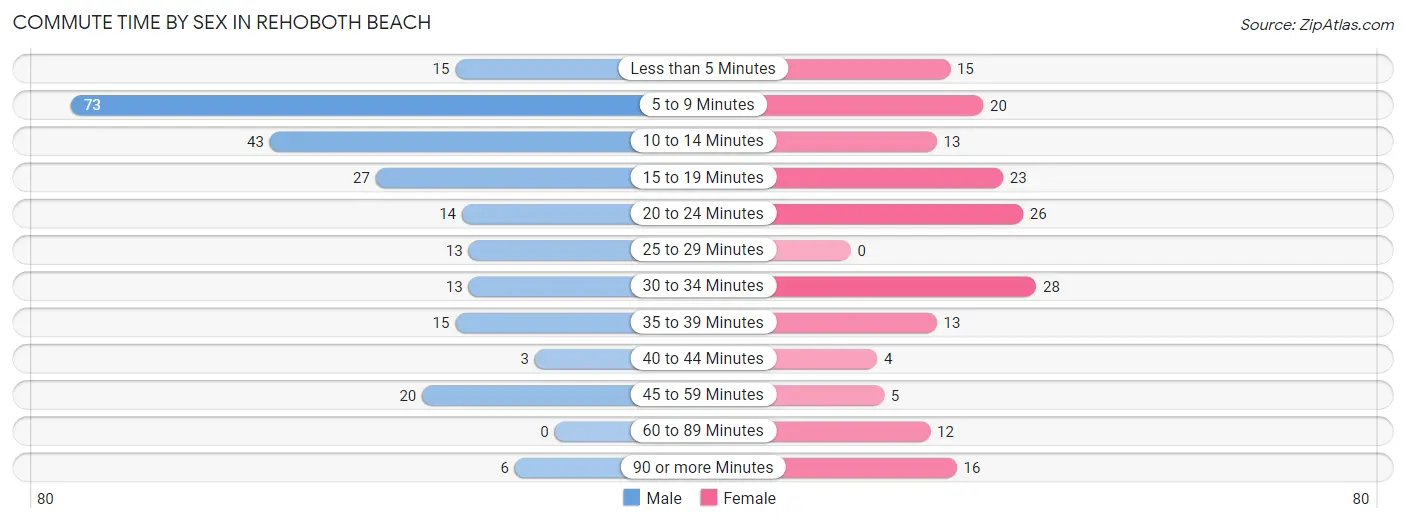
| Commute Time | Male | Female |
| Less than 5 Minutes | 15 (6.2%) | 15 (8.6%) |
| 5 to 9 Minutes | 73 (30.2%) | 20 (11.4%) |
| 10 to 14 Minutes | 43 (17.8%) | 13 (7.4%) |
| 15 to 19 Minutes | 27 (11.2%) | 23 (13.1%) |
| 20 to 24 Minutes | 14 (5.8%) | 26 (14.9%) |
| 25 to 29 Minutes | 13 (5.4%) | 0 (0.0%) |
| 30 to 34 Minutes | 13 (5.4%) | 28 (16.0%) |
| 35 to 39 Minutes | 15 (6.2%) | 13 (7.4%) |
| 40 to 44 Minutes | 3 (1.2%) | 4 (2.3%) |
| 45 to 59 Minutes | 20 (8.3%) | 5 (2.9%) |
| 60 to 89 Minutes | 0 (0.0%) | 12 (6.9%) |
| 90 or more Minutes | 6 (2.5%) | 16 (9.1%) |
Time of Departure to Work by Sex in Rehoboth Beach
The most frequent times of departure to work in Rehoboth Beach are 8:00 AM to 8:29 AM (54, 22.3%) for males and 7:30 AM to 7:59 AM (41, 23.4%) for females.
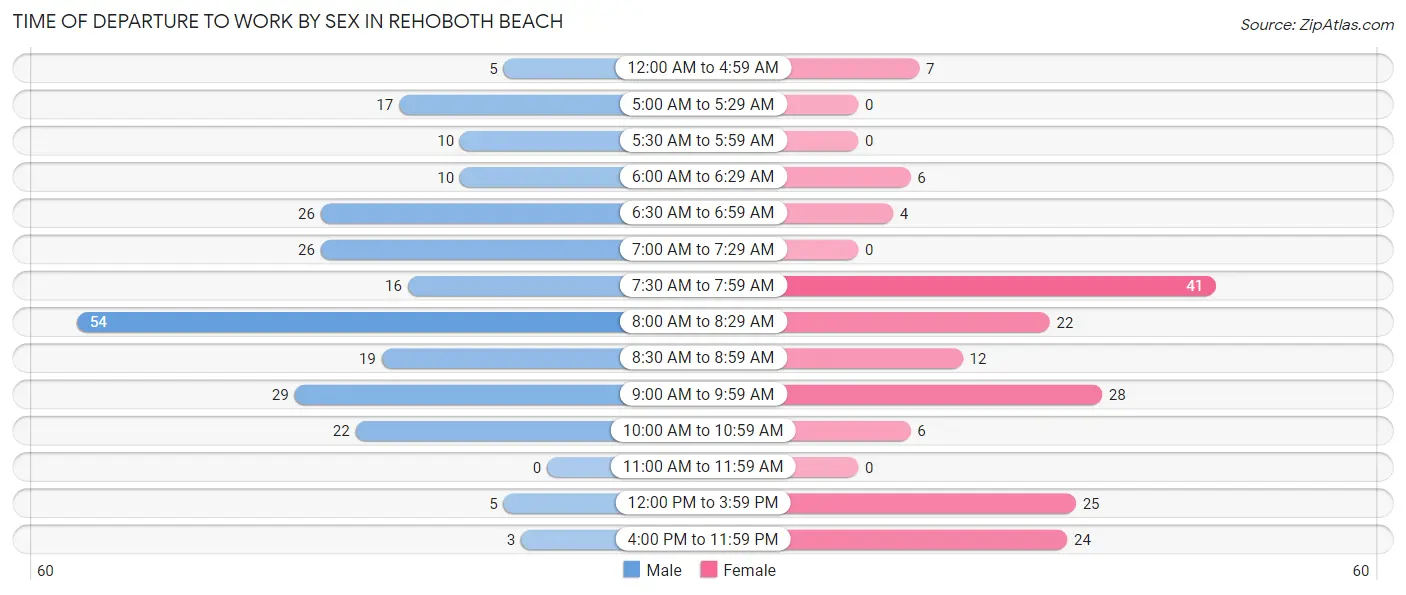
| Time of Departure | Male | Female |
| 12:00 AM to 4:59 AM | 5 (2.1%) | 7 (4.0%) |
| 5:00 AM to 5:29 AM | 17 (7.0%) | 0 (0.0%) |
| 5:30 AM to 5:59 AM | 10 (4.1%) | 0 (0.0%) |
| 6:00 AM to 6:29 AM | 10 (4.1%) | 6 (3.4%) |
| 6:30 AM to 6:59 AM | 26 (10.7%) | 4 (2.3%) |
| 7:00 AM to 7:29 AM | 26 (10.7%) | 0 (0.0%) |
| 7:30 AM to 7:59 AM | 16 (6.6%) | 41 (23.4%) |
| 8:00 AM to 8:29 AM | 54 (22.3%) | 22 (12.6%) |
| 8:30 AM to 8:59 AM | 19 (7.9%) | 12 (6.9%) |
| 9:00 AM to 9:59 AM | 29 (12.0%) | 28 (16.0%) |
| 10:00 AM to 10:59 AM | 22 (9.1%) | 6 (3.4%) |
| 11:00 AM to 11:59 AM | 0 (0.0%) | 0 (0.0%) |
| 12:00 PM to 3:59 PM | 5 (2.1%) | 25 (14.3%) |
| 4:00 PM to 11:59 PM | 3 (1.2%) | 24 (13.7%) |
| Total | 242 (100.0%) | 175 (100.0%) |
Housing Occupancy in Rehoboth Beach
Occupancy by Ownership in Rehoboth Beach
Of the total 766 dwellings in Rehoboth Beach, owner-occupied units account for 651 (85.0%), while renter-occupied units make up 115 (15.0%).
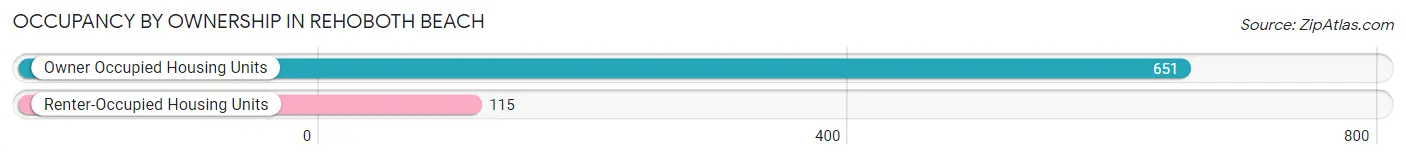
| Occupancy | # Housing Units | % Housing Units |
| Owner Occupied Housing Units | 651 | 85.0% |
| Renter-Occupied Housing Units | 115 | 15.0% |
| Total Occupied Housing Units | 766 | 100.0% |
Occupancy by Household Size in Rehoboth Beach
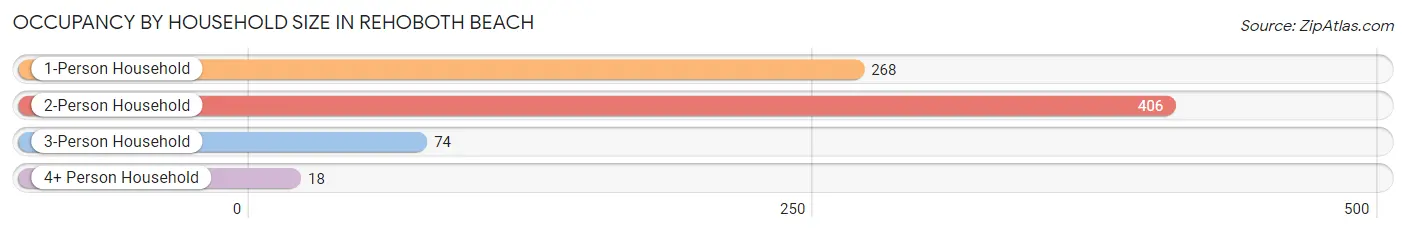
| Household Size | # Housing Units | % Housing Units |
| 1-Person Household | 268 | 35.0% |
| 2-Person Household | 406 | 53.0% |
| 3-Person Household | 74 | 9.7% |
| 4+ Person Household | 18 | 2.4% |
| Total Housing Units | 766 | 100.0% |
Occupancy by Ownership by Household Size in Rehoboth Beach
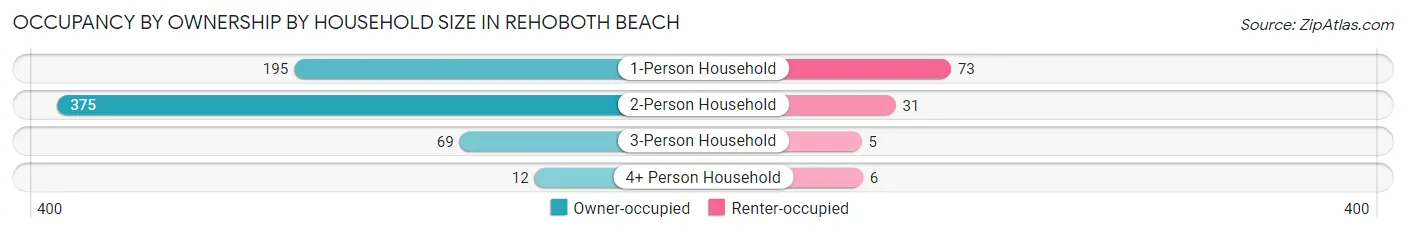
| Household Size | Owner-occupied | Renter-occupied |
| 1-Person Household | 195 (72.8%) | 73 (27.2%) |
| 2-Person Household | 375 (92.4%) | 31 (7.6%) |
| 3-Person Household | 69 (93.2%) | 5 (6.8%) |
| 4+ Person Household | 12 (66.7%) | 6 (33.3%) |
| Total Housing Units | 651 (85.0%) | 115 (15.0%) |
Occupancy by Educational Attainment in Rehoboth Beach
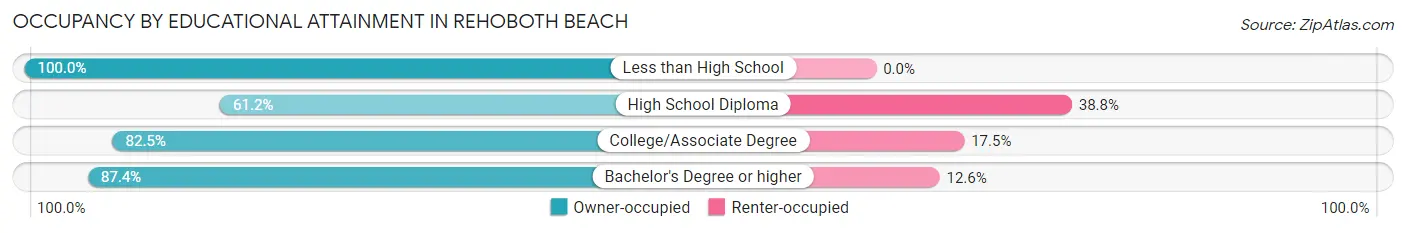
| Household Size | Owner-occupied | Renter-occupied |
| Less than High School | 2 (100.0%) | 0 (0.0%) |
| High School Diploma | 30 (61.2%) | 19 (38.8%) |
| College/Associate Degree | 104 (82.5%) | 22 (17.5%) |
| Bachelor's Degree or higher | 515 (87.4%) | 74 (12.6%) |
Occupancy by Age of Householder in Rehoboth Beach
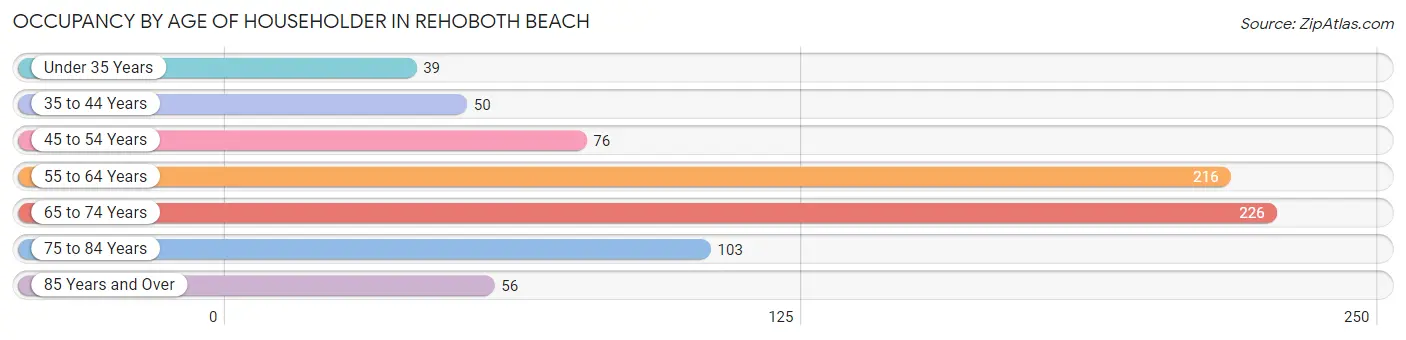
| Age Bracket | # Households | % Households |
| Under 35 Years | 39 | 5.1% |
| 35 to 44 Years | 50 | 6.5% |
| 45 to 54 Years | 76 | 9.9% |
| 55 to 64 Years | 216 | 28.2% |
| 65 to 74 Years | 226 | 29.5% |
| 75 to 84 Years | 103 | 13.5% |
| 85 Years and Over | 56 | 7.3% |
| Total | 766 | 100.0% |
Housing Finances in Rehoboth Beach
Median Income by Occupancy in Rehoboth Beach
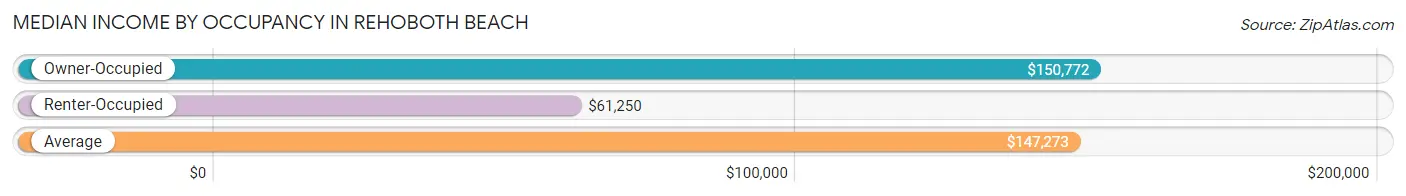
| Occupancy Type | # Households | Median Income |
| Owner-Occupied | 651 (85.0%) | $150,772 |
| Renter-Occupied | 115 (15.0%) | $61,250 |
| Average | 766 (100.0%) | $147,273 |
Occupancy by Householder Income Bracket in Rehoboth Beach
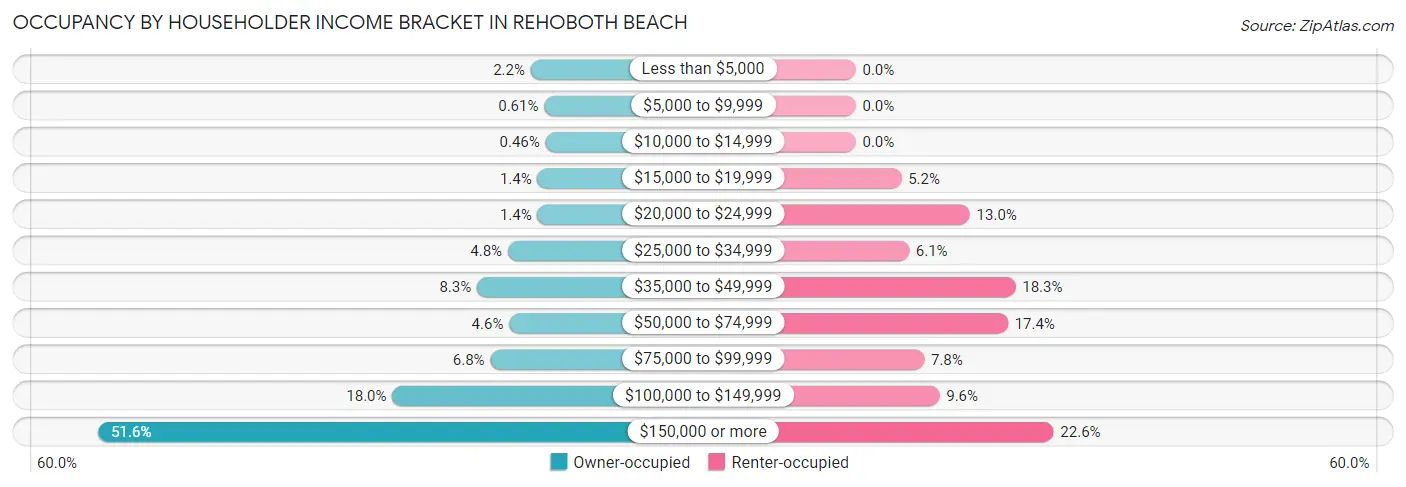
| Income Bracket | Owner-occupied | Renter-occupied |
| Less than $5,000 | 14 (2.1%) | 0 (0.0%) |
| $5,000 to $9,999 | 4 (0.6%) | 0 (0.0%) |
| $10,000 to $14,999 | 3 (0.5%) | 0 (0.0%) |
| $15,000 to $19,999 | 9 (1.4%) | 6 (5.2%) |
| $20,000 to $24,999 | 9 (1.4%) | 15 (13.0%) |
| $25,000 to $34,999 | 31 (4.8%) | 7 (6.1%) |
| $35,000 to $49,999 | 54 (8.3%) | 21 (18.3%) |
| $50,000 to $74,999 | 30 (4.6%) | 20 (17.4%) |
| $75,000 to $99,999 | 44 (6.8%) | 9 (7.8%) |
| $100,000 to $149,999 | 117 (18.0%) | 11 (9.6%) |
| $150,000 or more | 336 (51.6%) | 26 (22.6%) |
| Total | 651 (100.0%) | 115 (100.0%) |
Monthly Housing Cost Tiers in Rehoboth Beach
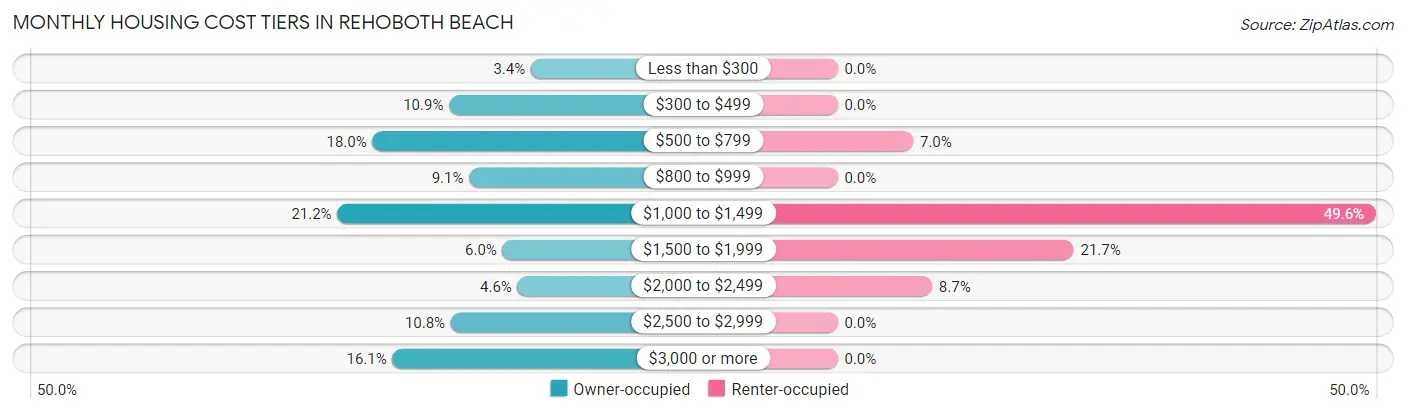
| Monthly Cost | Owner-occupied | Renter-occupied |
| Less than $300 | 22 (3.4%) | 0 (0.0%) |
| $300 to $499 | 71 (10.9%) | 0 (0.0%) |
| $500 to $799 | 117 (18.0%) | 8 (7.0%) |
| $800 to $999 | 59 (9.1%) | 0 (0.0%) |
| $1,000 to $1,499 | 138 (21.2%) | 57 (49.6%) |
| $1,500 to $1,999 | 39 (6.0%) | 25 (21.7%) |
| $2,000 to $2,499 | 30 (4.6%) | 10 (8.7%) |
| $2,500 to $2,999 | 70 (10.7%) | 0 (0.0%) |
| $3,000 or more | 105 (16.1%) | 0 (0.0%) |
| Total | 651 (100.0%) | 115 (100.0%) |
Physical Housing Characteristics in Rehoboth Beach
Housing Structures in Rehoboth Beach
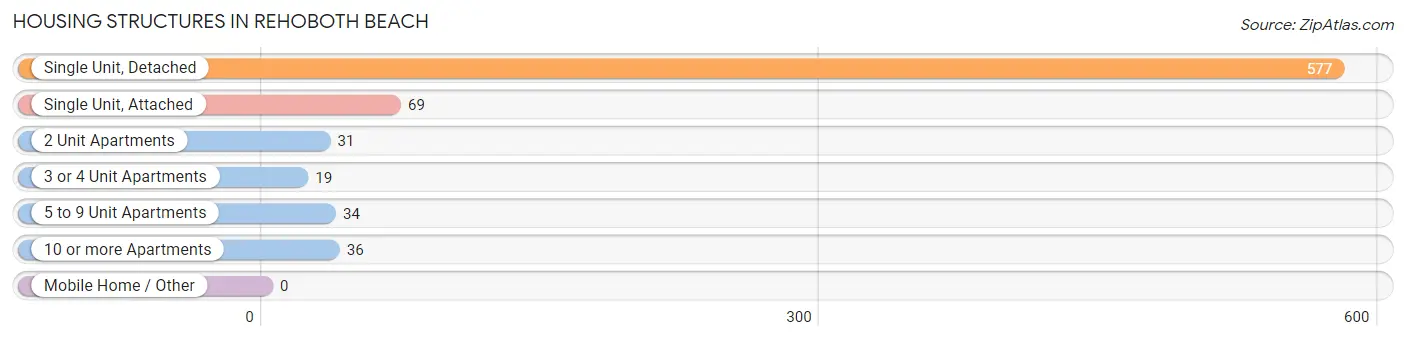
| Structure Type | # Housing Units | % Housing Units |
| Single Unit, Detached | 577 | 75.3% |
| Single Unit, Attached | 69 | 9.0% |
| 2 Unit Apartments | 31 | 4.1% |
| 3 or 4 Unit Apartments | 19 | 2.5% |
| 5 to 9 Unit Apartments | 34 | 4.4% |
| 10 or more Apartments | 36 | 4.7% |
| Mobile Home / Other | 0 | 0.0% |
| Total | 766 | 100.0% |
Housing Structures by Occupancy in Rehoboth Beach
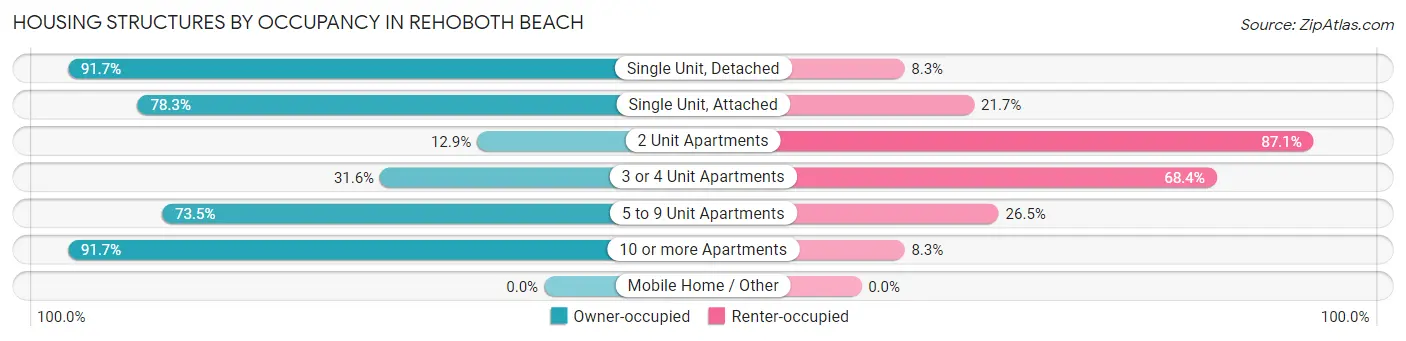
| Structure Type | Owner-occupied | Renter-occupied |
| Single Unit, Detached | 529 (91.7%) | 48 (8.3%) |
| Single Unit, Attached | 54 (78.3%) | 15 (21.7%) |
| 2 Unit Apartments | 4 (12.9%) | 27 (87.1%) |
| 3 or 4 Unit Apartments | 6 (31.6%) | 13 (68.4%) |
| 5 to 9 Unit Apartments | 25 (73.5%) | 9 (26.5%) |
| 10 or more Apartments | 33 (91.7%) | 3 (8.3%) |
| Mobile Home / Other | 0 (0.0%) | 0 (0.0%) |
| Total | 651 (85.0%) | 115 (15.0%) |
Housing Structures by Number of Rooms in Rehoboth Beach
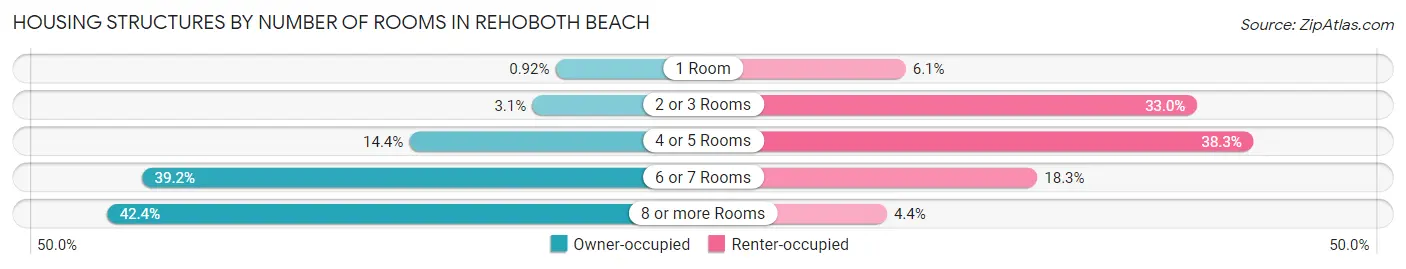
| Number of Rooms | Owner-occupied | Renter-occupied |
| 1 Room | 6 (0.9%) | 7 (6.1%) |
| 2 or 3 Rooms | 20 (3.1%) | 38 (33.0%) |
| 4 or 5 Rooms | 94 (14.4%) | 44 (38.3%) |
| 6 or 7 Rooms | 255 (39.2%) | 21 (18.3%) |
| 8 or more Rooms | 276 (42.4%) | 5 (4.3%) |
| Total | 651 (100.0%) | 115 (100.0%) |
Housing Structure by Heating Type in Rehoboth Beach
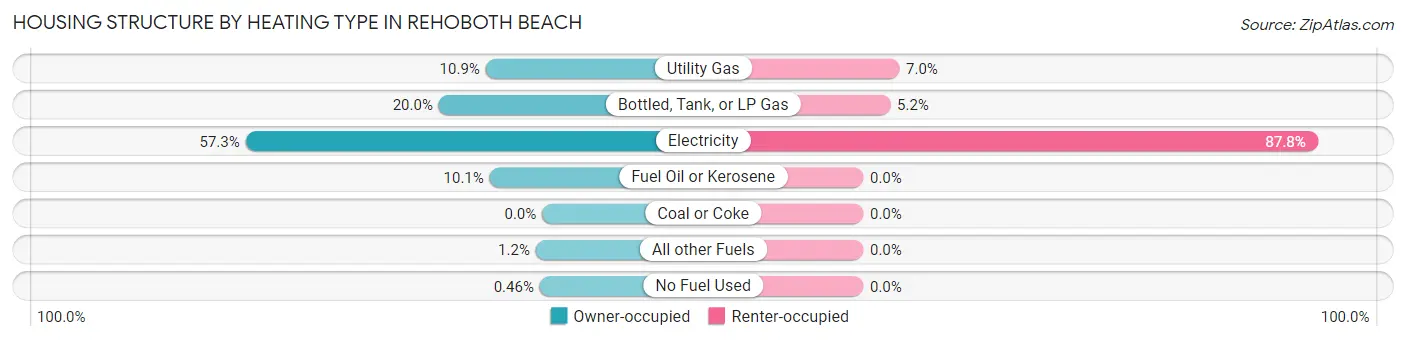
| Heating Type | Owner-occupied | Renter-occupied |
| Utility Gas | 71 (10.9%) | 8 (7.0%) |
| Bottled, Tank, or LP Gas | 130 (20.0%) | 6 (5.2%) |
| Electricity | 373 (57.3%) | 101 (87.8%) |
| Fuel Oil or Kerosene | 66 (10.1%) | 0 (0.0%) |
| Coal or Coke | 0 (0.0%) | 0 (0.0%) |
| All other Fuels | 8 (1.2%) | 0 (0.0%) |
| No Fuel Used | 3 (0.5%) | 0 (0.0%) |
| Total | 651 (100.0%) | 115 (100.0%) |
Household Vehicle Usage in Rehoboth Beach
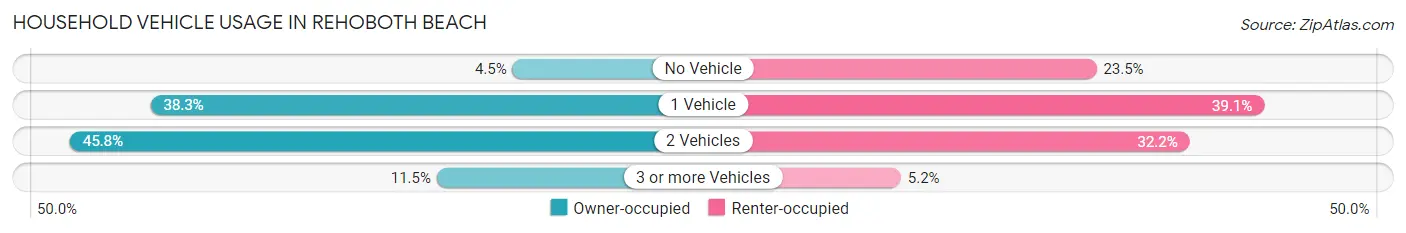
| Vehicles per Household | Owner-occupied | Renter-occupied |
| No Vehicle | 29 (4.4%) | 27 (23.5%) |
| 1 Vehicle | 249 (38.3%) | 45 (39.1%) |
| 2 Vehicles | 298 (45.8%) | 37 (32.2%) |
| 3 or more Vehicles | 75 (11.5%) | 6 (5.2%) |
| Total | 651 (100.0%) | 115 (100.0%) |
Real Estate & Mortgages in Rehoboth Beach
Real Estate and Mortgage Overview in Rehoboth Beach
| Characteristic | Without Mortgage | With Mortgage |
| Housing Units | 375 | 276 |
| Median Property Value | $1,324,200 | $1,144,400 |
| Median Household Income | $142,188 | $164 |
| Monthly Housing Costs | $745 | $105 |
| Real Estate Taxes | $2,071 | $0 |
Property Value by Mortgage Status in Rehoboth Beach
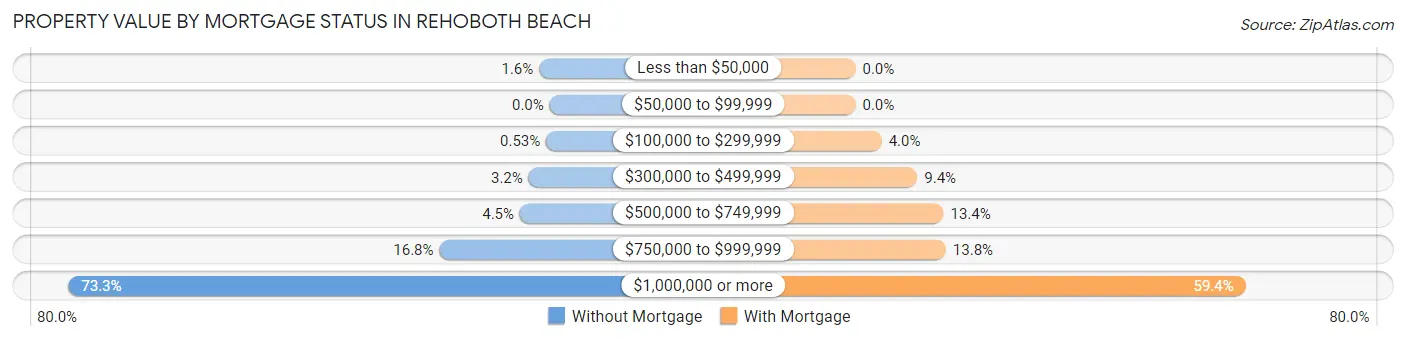
| Property Value | Without Mortgage | With Mortgage |
| Less than $50,000 | 6 (1.6%) | 0 (0.0%) |
| $50,000 to $99,999 | 0 (0.0%) | 0 (0.0%) |
| $100,000 to $299,999 | 2 (0.5%) | 11 (4.0%) |
| $300,000 to $499,999 | 12 (3.2%) | 26 (9.4%) |
| $500,000 to $749,999 | 17 (4.5%) | 37 (13.4%) |
| $750,000 to $999,999 | 63 (16.8%) | 38 (13.8%) |
| $1,000,000 or more | 275 (73.3%) | 164 (59.4%) |
| Total | 375 (100.0%) | 276 (100.0%) |
Household Income by Mortgage Status in Rehoboth Beach
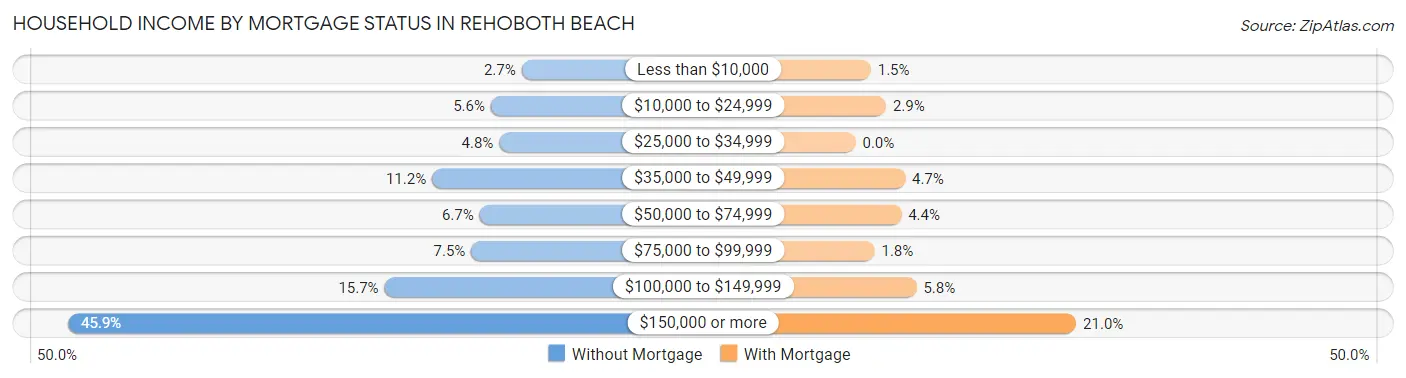
| Household Income | Without Mortgage | With Mortgage |
| Less than $10,000 | 10 (2.7%) | 4 (1.5%) |
| $10,000 to $24,999 | 21 (5.6%) | 8 (2.9%) |
| $25,000 to $34,999 | 18 (4.8%) | 0 (0.0%) |
| $35,000 to $49,999 | 42 (11.2%) | 13 (4.7%) |
| $50,000 to $74,999 | 25 (6.7%) | 12 (4.3%) |
| $75,000 to $99,999 | 28 (7.5%) | 5 (1.8%) |
| $100,000 to $149,999 | 59 (15.7%) | 16 (5.8%) |
| $150,000 or more | 172 (45.9%) | 58 (21.0%) |
| Total | 375 (100.0%) | 276 (100.0%) |
Property Value to Household Income Ratio in Rehoboth Beach
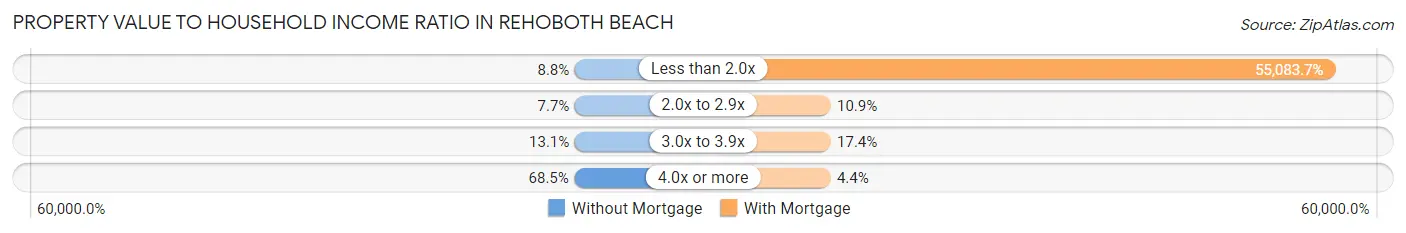
| Value-to-Income Ratio | Without Mortgage | With Mortgage |
| Less than 2.0x | 33 (8.8%) | 152,031 (55,083.7%) |
| 2.0x to 2.9x | 29 (7.7%) | 30 (10.9%) |
| 3.0x to 3.9x | 49 (13.1%) | 48 (17.4%) |
| 4.0x or more | 257 (68.5%) | 12 (4.3%) |
| Total | 375 (100.0%) | 276 (100.0%) |
Real Estate Taxes by Mortgage Status in Rehoboth Beach
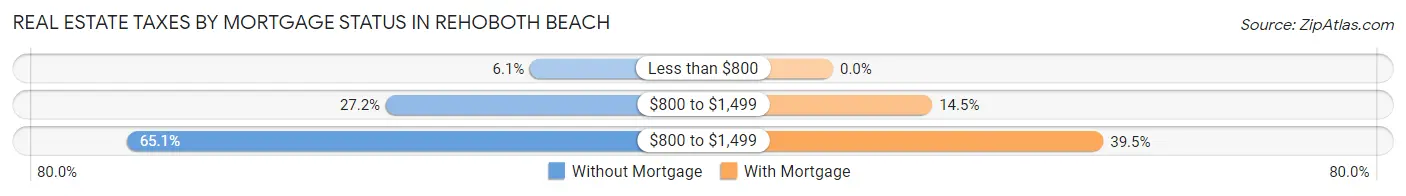
| Property Taxes | Without Mortgage | With Mortgage |
| Less than $800 | 23 (6.1%) | 0 (0.0%) |
| $800 to $1,499 | 102 (27.2%) | 40 (14.5%) |
| $800 to $1,499 | 244 (65.1%) | 109 (39.5%) |
| Total | 375 (100.0%) | 276 (100.0%) |
Health & Disability in Rehoboth Beach
Health Insurance Coverage by Age in Rehoboth Beach
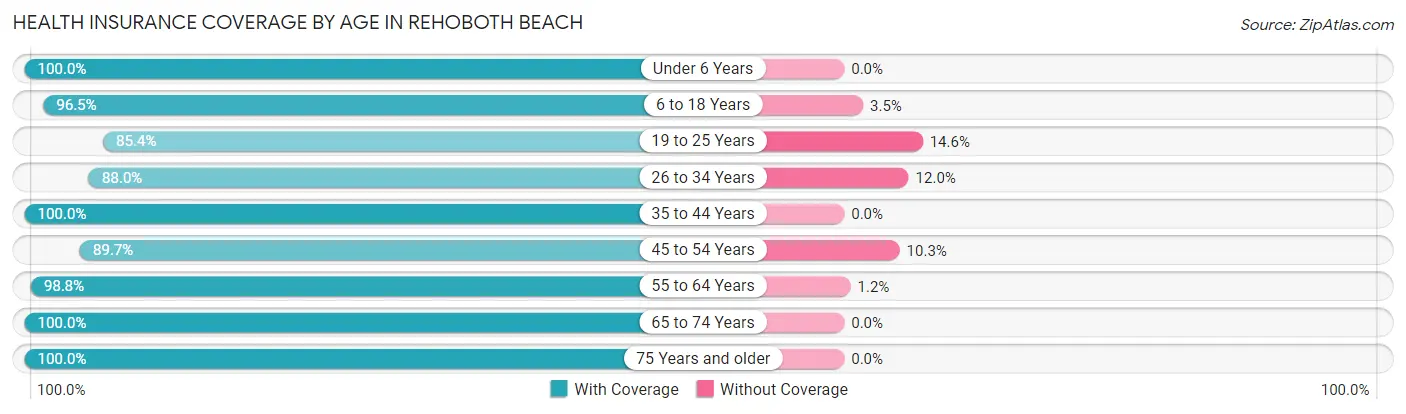
| Age Bracket | With Coverage | Without Coverage |
| Under 6 Years | 28 (100.0%) | 0 (0.0%) |
| 6 to 18 Years | 55 (96.5%) | 2 (3.5%) |
| 19 to 25 Years | 35 (85.4%) | 6 (14.6%) |
| 26 to 34 Years | 44 (88.0%) | 6 (12.0%) |
| 35 to 44 Years | 81 (100.0%) | 0 (0.0%) |
| 45 to 54 Years | 113 (89.7%) | 13 (10.3%) |
| 55 to 64 Years | 337 (98.8%) | 4 (1.2%) |
| 65 to 74 Years | 383 (100.0%) | 0 (0.0%) |
| 75 Years and older | 250 (100.0%) | 0 (0.0%) |
| Total | 1,326 (97.7%) | 31 (2.3%) |
Health Insurance Coverage by Citizenship Status in Rehoboth Beach
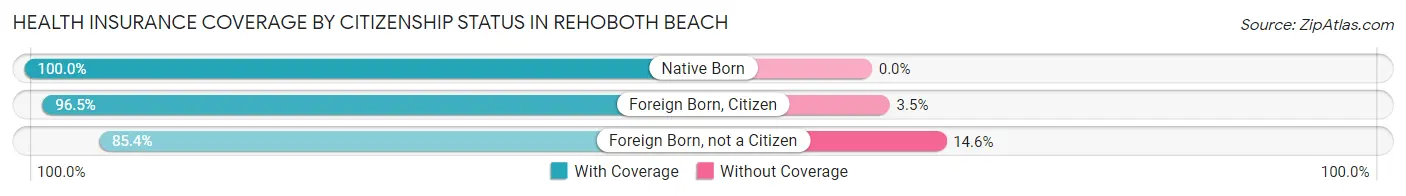
| Citizenship Status | With Coverage | Without Coverage |
| Native Born | 28 (100.0%) | 0 (0.0%) |
| Foreign Born, Citizen | 55 (96.5%) | 2 (3.5%) |
| Foreign Born, not a Citizen | 35 (85.4%) | 6 (14.6%) |
Health Insurance Coverage by Household Income in Rehoboth Beach
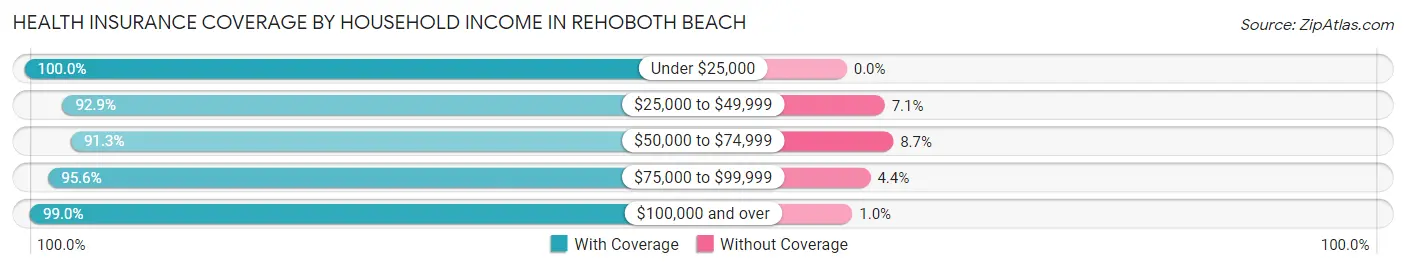
| Household Income | With Coverage | Without Coverage |
| Under $25,000 | 82 (100.0%) | 0 (0.0%) |
| $25,000 to $49,999 | 144 (92.9%) | 11 (7.1%) |
| $50,000 to $74,999 | 63 (91.3%) | 6 (8.7%) |
| $75,000 to $99,999 | 86 (95.6%) | 4 (4.4%) |
| $100,000 and over | 949 (99.0%) | 10 (1.0%) |
Public vs Private Health Insurance Coverage by Age in Rehoboth Beach
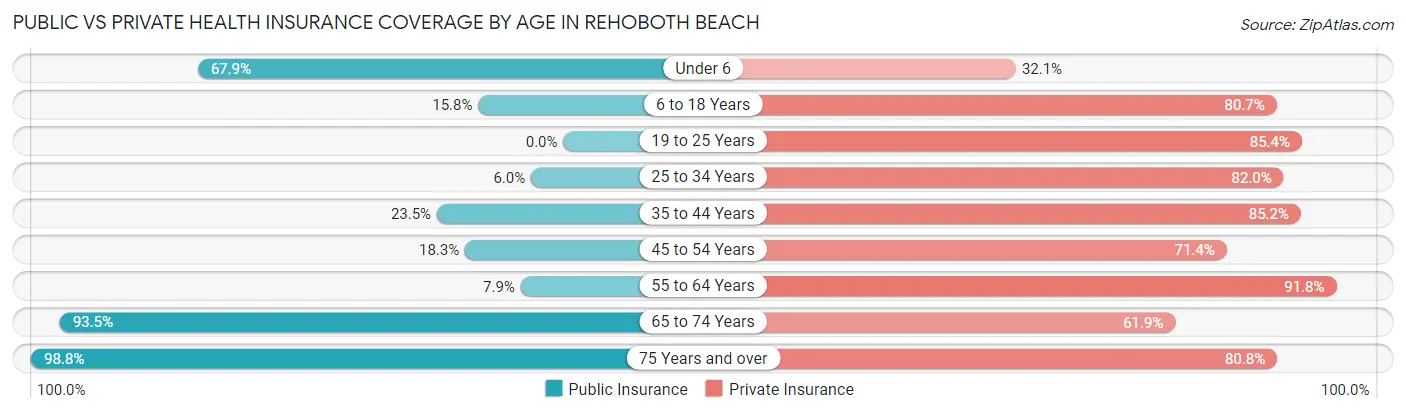
| Age Bracket | Public Insurance | Private Insurance |
| Under 6 | 19 (67.9%) | 9 (32.1%) |
| 6 to 18 Years | 9 (15.8%) | 46 (80.7%) |
| 19 to 25 Years | 0 (0.0%) | 35 (85.4%) |
| 25 to 34 Years | 3 (6.0%) | 41 (82.0%) |
| 35 to 44 Years | 19 (23.5%) | 69 (85.2%) |
| 45 to 54 Years | 23 (18.2%) | 90 (71.4%) |
| 55 to 64 Years | 27 (7.9%) | 313 (91.8%) |
| 65 to 74 Years | 358 (93.5%) | 237 (61.9%) |
| 75 Years and over | 247 (98.8%) | 202 (80.8%) |
| Total | 705 (51.9%) | 1,042 (76.8%) |
Disability Status by Sex by Age in Rehoboth Beach
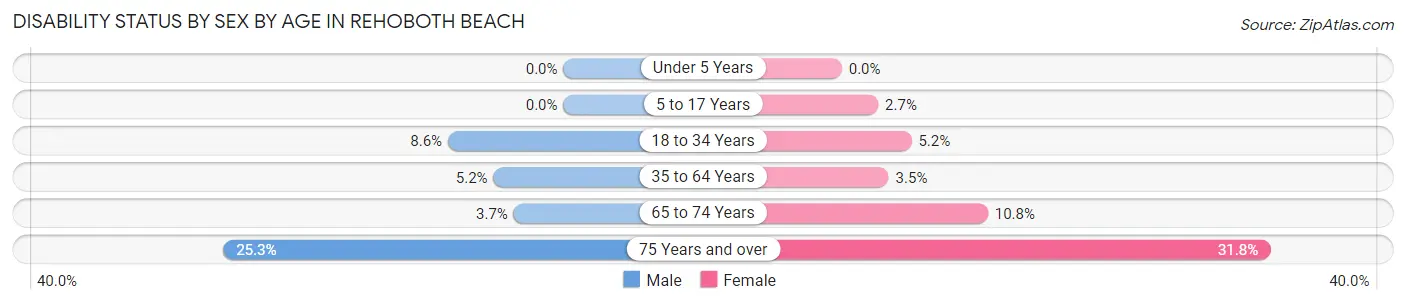
| Age Bracket | Male | Female |
| Under 5 Years | 0 (0.0%) | 0 (0.0%) |
| 5 to 17 Years | 0 (0.0%) | 1 (2.7%) |
| 18 to 34 Years | 3 (8.6%) | 3 (5.2%) |
| 35 to 64 Years | 18 (5.2%) | 7 (3.5%) |
| 65 to 74 Years | 8 (3.7%) | 18 (10.8%) |
| 75 Years and over | 25 (25.3%) | 48 (31.8%) |
Disability Class by Sex by Age in Rehoboth Beach
Disability Class: Hearing Difficulty
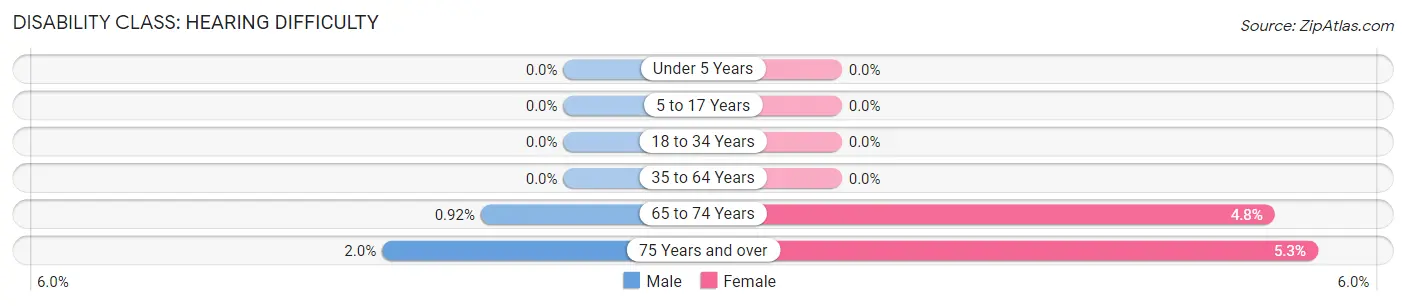
| Age Bracket | Male | Female |
| Under 5 Years | 0 (0.0%) | 0 (0.0%) |
| 5 to 17 Years | 0 (0.0%) | 0 (0.0%) |
| 18 to 34 Years | 0 (0.0%) | 0 (0.0%) |
| 35 to 64 Years | 0 (0.0%) | 0 (0.0%) |
| 65 to 74 Years | 2 (0.9%) | 8 (4.8%) |
| 75 Years and over | 2 (2.0%) | 8 (5.3%) |
Disability Class: Vision Difficulty
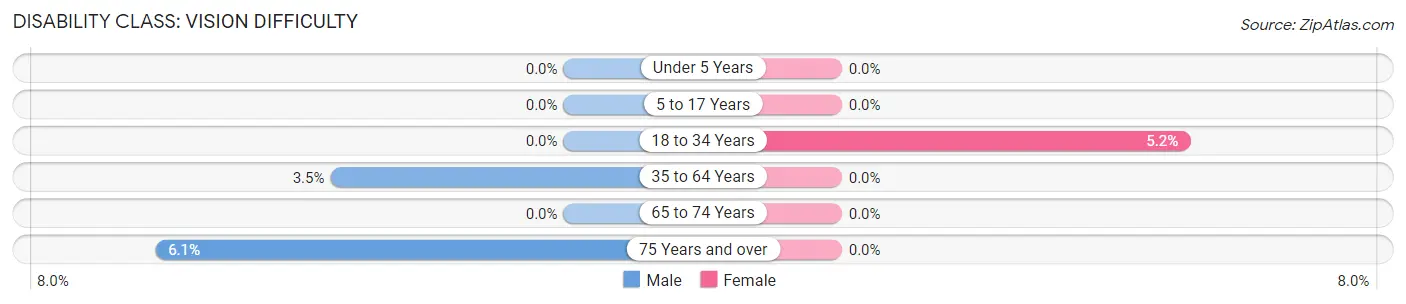
| Age Bracket | Male | Female |
| Under 5 Years | 0 (0.0%) | 0 (0.0%) |
| 5 to 17 Years | 0 (0.0%) | 0 (0.0%) |
| 18 to 34 Years | 0 (0.0%) | 3 (5.2%) |
| 35 to 64 Years | 12 (3.5%) | 0 (0.0%) |
| 65 to 74 Years | 0 (0.0%) | 0 (0.0%) |
| 75 Years and over | 6 (6.1%) | 0 (0.0%) |
Disability Class: Cognitive Difficulty
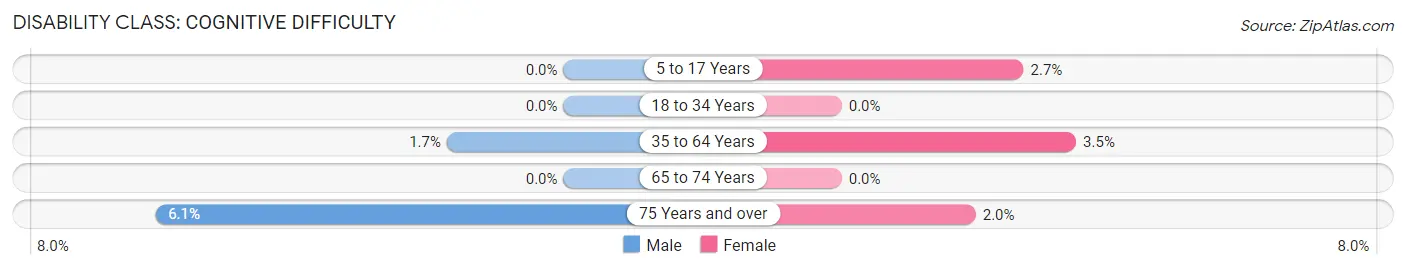
| Age Bracket | Male | Female |
| 5 to 17 Years | 0 (0.0%) | 1 (2.7%) |
| 18 to 34 Years | 0 (0.0%) | 0 (0.0%) |
| 35 to 64 Years | 6 (1.7%) | 7 (3.5%) |
| 65 to 74 Years | 0 (0.0%) | 0 (0.0%) |
| 75 Years and over | 6 (6.1%) | 3 (2.0%) |
Disability Class: Ambulatory Difficulty
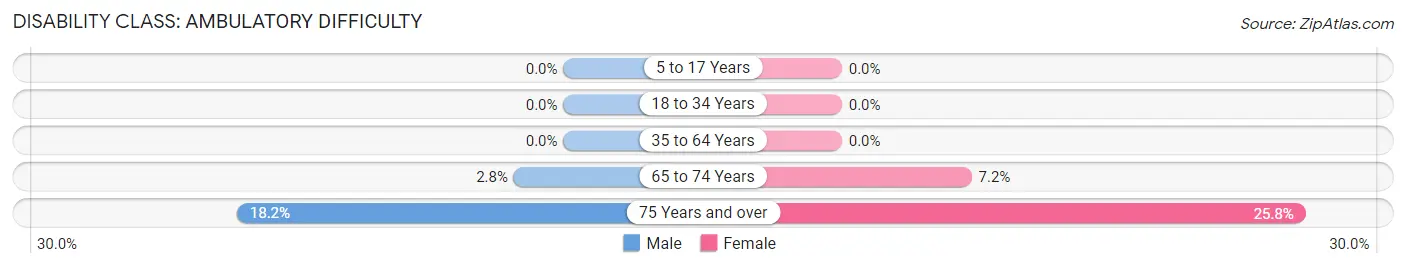
| Age Bracket | Male | Female |
| 5 to 17 Years | 0 (0.0%) | 0 (0.0%) |
| 18 to 34 Years | 0 (0.0%) | 0 (0.0%) |
| 35 to 64 Years | 0 (0.0%) | 0 (0.0%) |
| 65 to 74 Years | 6 (2.8%) | 12 (7.2%) |
| 75 Years and over | 18 (18.2%) | 39 (25.8%) |
Disability Class: Self-Care Difficulty
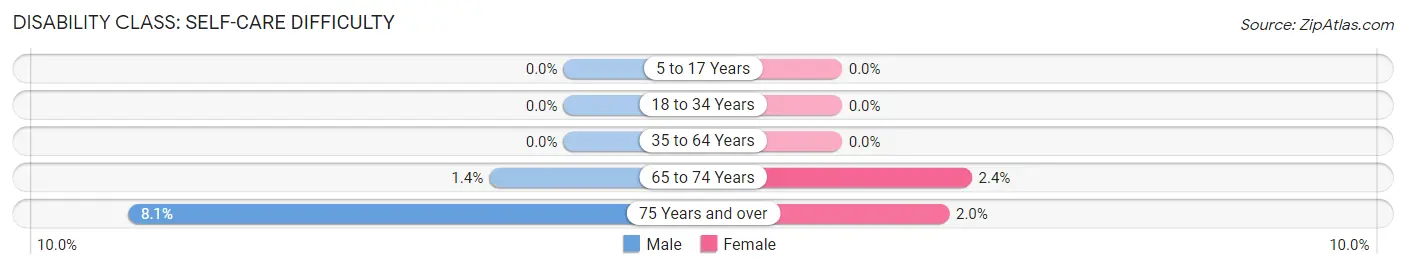
| Age Bracket | Male | Female |
| 5 to 17 Years | 0 (0.0%) | 0 (0.0%) |
| 18 to 34 Years | 0 (0.0%) | 0 (0.0%) |
| 35 to 64 Years | 0 (0.0%) | 0 (0.0%) |
| 65 to 74 Years | 3 (1.4%) | 4 (2.4%) |
| 75 Years and over | 8 (8.1%) | 3 (2.0%) |
Technology Access in Rehoboth Beach
Computing Device Access in Rehoboth Beach
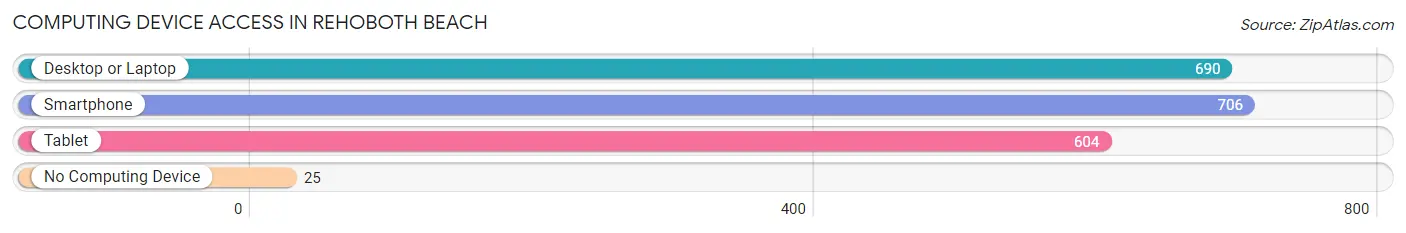
| Device Type | # Households | % Households |
| Desktop or Laptop | 690 | 90.1% |
| Smartphone | 706 | 92.2% |
| Tablet | 604 | 78.8% |
| No Computing Device | 25 | 3.3% |
| Total | 766 | 100.0% |
Internet Access in Rehoboth Beach
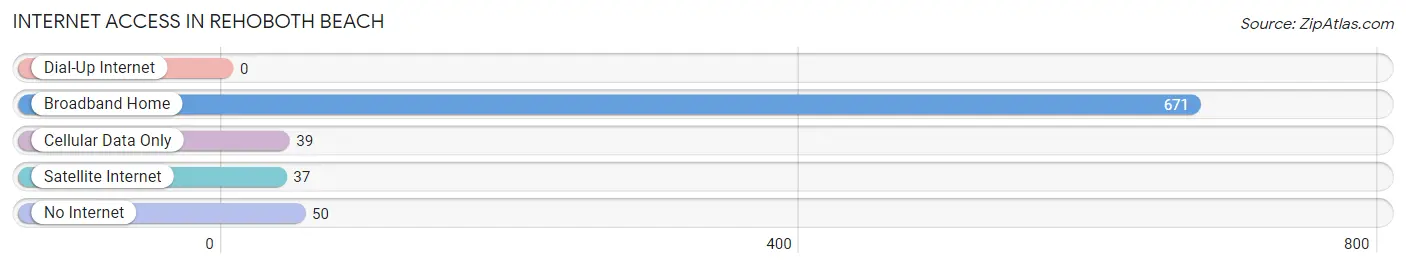
| Internet Type | # Households | % Households |
| Dial-Up Internet | 0 | 0.0% |
| Broadband Home | 671 | 87.6% |
| Cellular Data Only | 39 | 5.1% |
| Satellite Internet | 37 | 4.8% |
| No Internet | 50 | 6.5% |
| Total | 766 | 100.0% |
Rehoboth Beach Summary
Rehoboth Beach, Delaware is a small coastal town located in Sussex County, Delaware. It is a popular summer destination for tourists and locals alike, and is known for its boardwalk, beaches, and family-friendly atmosphere. The town has a population of 1,327 as of the 2010 census, and is part of the larger Rehoboth Beach-Dewey Beach metropolitan area.
History
Rehoboth Beach was founded in 1873 by the Reverend Robert W. Todd, who named the town after the biblical city of Rehoboth. The town was originally a Methodist camp meeting ground, and the first boardwalk was built in 1873. The town was incorporated in 1891, and the first hotel was built in 1894.
In the early 20th century, Rehoboth Beach became a popular summer destination for wealthy families from Philadelphia and Baltimore. The town was known for its luxurious hotels and resorts, and was a popular destination for celebrities and politicians.
In the 1950s, Rehoboth Beach began to attract a more diverse crowd, and the town became a popular destination for LGBT visitors. The town has since become a popular destination for LGBT travelers, and is known for its welcoming atmosphere.
Geography
Rehoboth Beach is located in Sussex County, Delaware, on the Atlantic Ocean. The town is situated on a barrier island, and is bordered by the Rehoboth Bay to the west and the Indian River Bay to the east. The town is located approximately 30 miles south of Wilmington, Delaware, and is part of the larger Rehoboth Beach-Dewey Beach metropolitan area.
The town has a total area of 1.2 square miles, all of which is land. The town is located at an elevation of 8 feet above sea level.
Economy
Rehoboth Beach is a popular summer destination for tourists and locals alike, and the town’s economy is largely driven by tourism. The town is home to numerous hotels, restaurants, and shops, and is known for its boardwalk and beaches.
The town is also home to several corporate headquarters, including the headquarters of the Delaware State Lottery and the Delaware State Police.
Demographics
As of the 2010 census, Rehoboth Beach had a population of 1,327. The racial makeup of the town was 92.3% White, 4.2% African American, 0.7% Asian, 0.2% Native American, 0.1% Pacific Islander, and 2.5% from other races. Hispanic or Latino of any race were 3.2% of the population.
The median income for a household in the town was $50,972, and the median income for a family was $62,500. The per capita income for the town was $35,945. About 8.2% of families and 11.2% of the population were below the poverty line, including 16.2% of those under age 18 and 5.2% of those age 65 or over.
Common Questions
What is Per Capita Income in Rehoboth Beach?
Per Capita income in Rehoboth Beach is $114,683.
What is the Median Family Income in Rehoboth Beach?
Median Family Income in Rehoboth Beach is $170,833.
What is the Median Household income in Rehoboth Beach?
Median Household Income in Rehoboth Beach is $147,273.
What is Income or Wage Gap in Rehoboth Beach?
Income or Wage Gap in Rehoboth Beach is 65.3%.
Women in Rehoboth Beach earn 34.7 cents for every dollar earned by a man.
What is Inequality or Gini Index in Rehoboth Beach?
Inequality or Gini Index in Rehoboth Beach is 0.52.
What is the Total Population of Rehoboth Beach?
Total Population of Rehoboth Beach is 1,357.
What is the Total Male Population of Rehoboth Beach?
Total Male Population of Rehoboth Beach is 716.
What is the Total Female Population of Rehoboth Beach?
Total Female Population of Rehoboth Beach is 641.
What is the Ratio of Males per 100 Females in Rehoboth Beach?
There are 111.70 Males per 100 Females in Rehoboth Beach.
What is the Ratio of Females per 100 Males in Rehoboth Beach?
There are 89.53 Females per 100 Males in Rehoboth Beach.
What is the Median Population Age in Rehoboth Beach?
Median Population Age in Rehoboth Beach is 64.1 Years.
What is the Average Family Size in Rehoboth Beach
Average Family Size in Rehoboth Beach is 2.1 People.
What is the Average Household Size in Rehoboth Beach
Average Household Size in Rehoboth Beach is 1.8 People.
How Large is the Labor Force in Rehoboth Beach?
There are 655 People in the Labor Forcein in Rehoboth Beach.
What is the Percentage of People in the Labor Force in Rehoboth Beach?
51.4% of People are in the Labor Force in Rehoboth Beach.
What is the Unemployment Rate in Rehoboth Beach?
Unemployment Rate in Rehoboth Beach is 7.0%.