Millville, DE Map & Demographics
Millville Map
Millville Overview
$59,054
PER CAPITA INCOME
$120,662
AVG FAMILY INCOME
$92,961
AVG HOUSEHOLD INCOME
40.2%
WAGE / INCOME GAP [ % ]
59.8¢/ $1
WAGE / INCOME GAP [ $ ]
0.38
INEQUALITY / GINI INDEX
2,052
TOTAL POPULATION
872
MALE POPULATION
1,180
FEMALE POPULATION
73.90
MALES / 100 FEMALES
135.32
FEMALES / 100 MALES
65.5
MEDIAN AGE
2.2
AVG FAMILY SIZE
1.8
AVG HOUSEHOLD SIZE
681
LABOR FORCE [ PEOPLE ]
35.1%
PERCENT IN LABOR FORCE
2.3%
UNEMPLOYMENT RATE
Millville Zip Codes
Millville Area Codes
Income in Millville
Income Overview in Millville
Per Capita Income in Millville is $59,054, while median incomes of families and households are $120,662 and $92,961 respectively.
| Characteristic | Number | Measure |
| Per Capita Income | 2,052 | $59,054 |
| Median Family Income | 713 | $120,662 |
| Mean Family Income | 713 | $134,603 |
| Median Household Income | 1,123 | $92,961 |
| Mean Household Income | 1,123 | $109,270 |
| Income Deficit | 713 | $0 |
| Wage / Income Gap (%) | 2,052 | 40.20% |
| Wage / Income Gap ($) | 2,052 | 59.80¢ per $1 |
| Gini / Inequality Index | 2,052 | 0.38 |
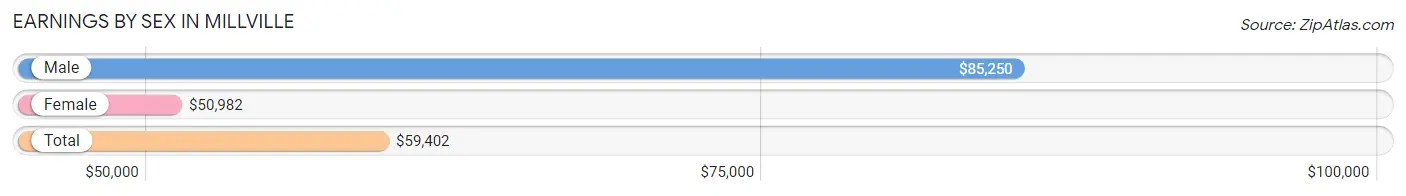
Earnings by Sex in Millville
Average Earnings in Millville are $59,402, $85,250 for men and $50,982 for women, a difference of 40.2%.
| Sex | Number | Average Earnings |
| Male | 360 (42.1%) | $85,250 |
| Female | 495 (57.9%) | $50,982 |
| Total | 855 (100.0%) | $59,402 |
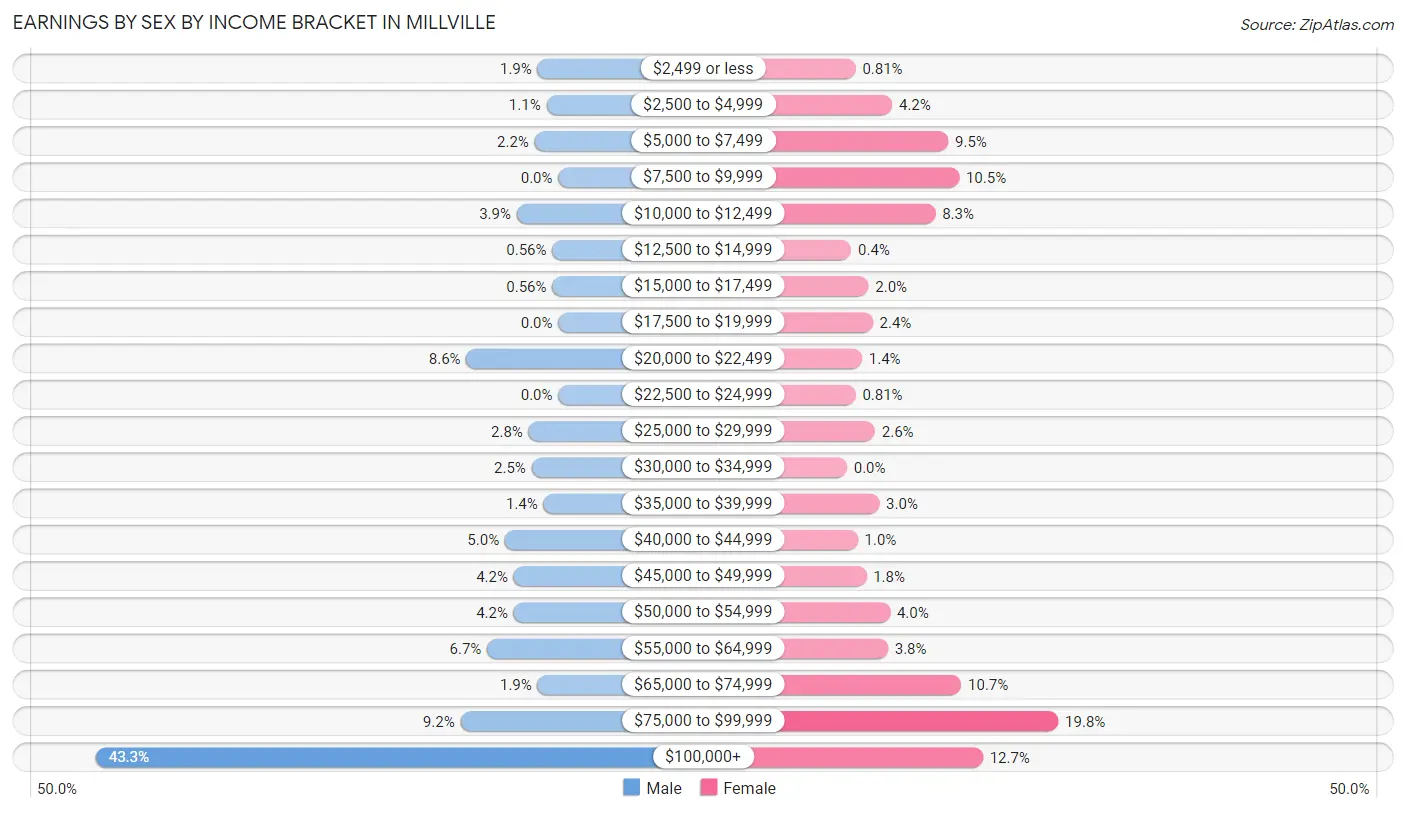
Earnings by Sex by Income Bracket in Millville
The most common earnings brackets in Millville are $100,000+ for men (156 | 43.3%) and $75,000 to $99,999 for women (98 | 19.8%).
| Income | Male | Female |
| $2,499 or less | 7 (1.9%) | 4 (0.8%) |
| $2,500 to $4,999 | 4 (1.1%) | 21 (4.2%) |
| $5,000 to $7,499 | 8 (2.2%) | 47 (9.5%) |
| $7,500 to $9,999 | 0 (0.0%) | 52 (10.5%) |
| $10,000 to $12,499 | 14 (3.9%) | 41 (8.3%) |
| $12,500 to $14,999 | 2 (0.6%) | 2 (0.4%) |
| $15,000 to $17,499 | 2 (0.6%) | 10 (2.0%) |
| $17,500 to $19,999 | 0 (0.0%) | 12 (2.4%) |
| $20,000 to $22,499 | 31 (8.6%) | 7 (1.4%) |
| $22,500 to $24,999 | 0 (0.0%) | 4 (0.8%) |
| $25,000 to $29,999 | 10 (2.8%) | 13 (2.6%) |
| $30,000 to $34,999 | 9 (2.5%) | 0 (0.0%) |
| $35,000 to $39,999 | 5 (1.4%) | 15 (3.0%) |
| $40,000 to $44,999 | 18 (5.0%) | 5 (1.0%) |
| $45,000 to $49,999 | 15 (4.2%) | 9 (1.8%) |
| $50,000 to $54,999 | 15 (4.2%) | 20 (4.0%) |
| $55,000 to $64,999 | 24 (6.7%) | 19 (3.8%) |
| $65,000 to $74,999 | 7 (1.9%) | 53 (10.7%) |
| $75,000 to $99,999 | 33 (9.2%) | 98 (19.8%) |
| $100,000+ | 156 (43.3%) | 63 (12.7%) |
| Total | 360 (100.0%) | 495 (100.0%) |
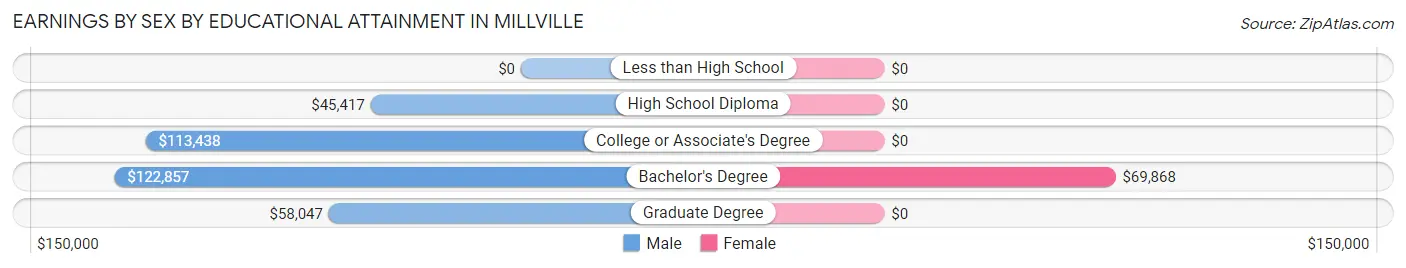
Earnings by Sex by Educational Attainment in Millville
Average earnings in Millville are $87,000 for men and $58,125 for women, a difference of 33.2%. Men with an educational attainment of bachelor's degree enjoy the highest average annual earnings of $122,857, while those with high school diploma education earn the least with $45,417. Women with an educational attainment of bachelor's degree earn the most with the average annual earnings of $69,868, while those with bachelor's degree education have the smallest earnings of $69,868.
| Educational Attainment | Male Income | Female Income |
| Less than High School | - | - |
| High School Diploma | $45,417 | $0 |
| College or Associate's Degree | $113,438 | $0 |
| Bachelor's Degree | $122,857 | $69,868 |
| Graduate Degree | $58,047 | $0 |
| Total | $87,000 | $58,125 |
Family Income in Millville
Family Income Brackets in Millville
According to the Millville family income data, there are 191 families falling into the $100,000 to $149,999 income range, which is the most common income bracket and makes up 26.8% of all families.
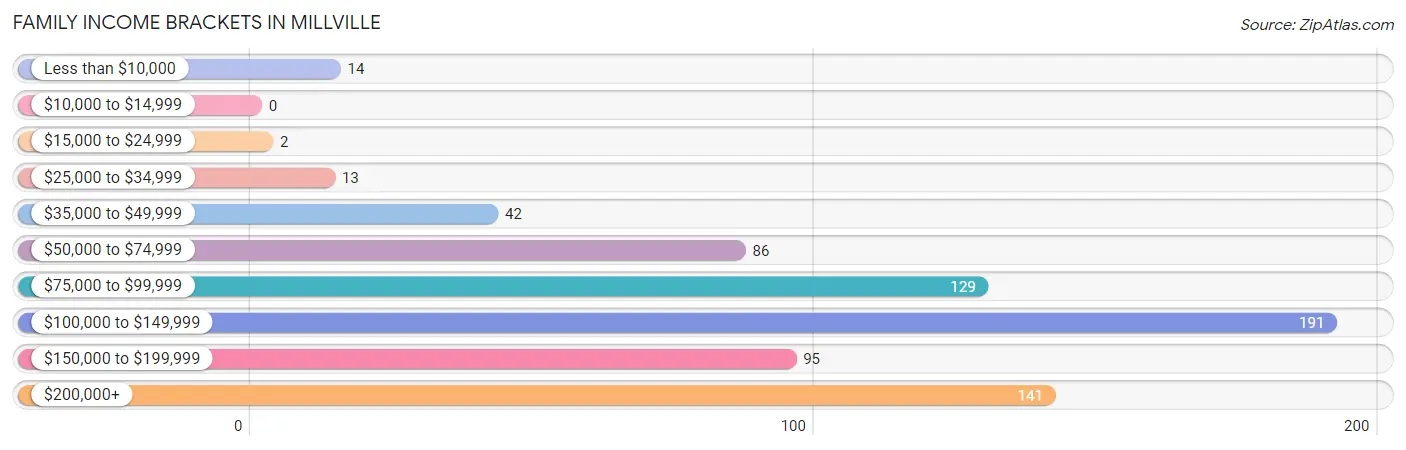
| Income Bracket | # Families | % Families |
| Less than $10,000 | 14 | 2.0% |
| $10,000 to $14,999 | 0 | 0.0% |
| $15,000 to $24,999 | 2 | 0.3% |
| $25,000 to $34,999 | 13 | 1.8% |
| $35,000 to $49,999 | 42 | 5.9% |
| $50,000 to $74,999 | 86 | 12.1% |
| $75,000 to $99,999 | 129 | 18.1% |
| $100,000 to $149,999 | 191 | 26.8% |
| $150,000 to $199,999 | 95 | 13.3% |
| $200,000+ | 141 | 19.8% |
Family Income by Famaliy Size in Millville
4-person families (25 | 3.5%) account for the highest median family income in Millville with $250,001 per family, while 4-person families (25 | 3.5%) have the highest median income of $62,500 per family member.
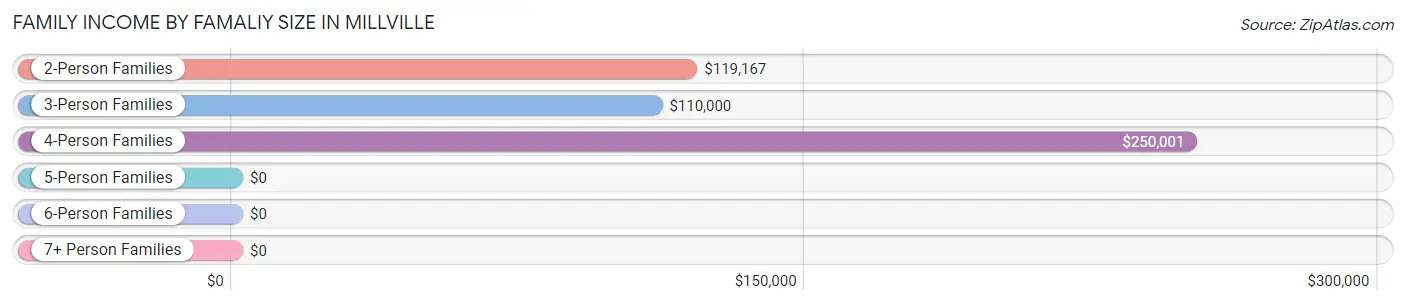
| Income Bracket | # Families | Median Income |
| 2-Person Families | 562 (78.8%) | $119,167 |
| 3-Person Families | 116 (16.3%) | $110,000 |
| 4-Person Families | 25 (3.5%) | $250,001 |
| 5-Person Families | 10 (1.4%) | $0 |
| 6-Person Families | 0 (0.0%) | $0 |
| 7+ Person Families | 0 (0.0%) | $0 |
| Total | 713 (100.0%) | $120,662 |
Family Income by Number of Earners in Millville
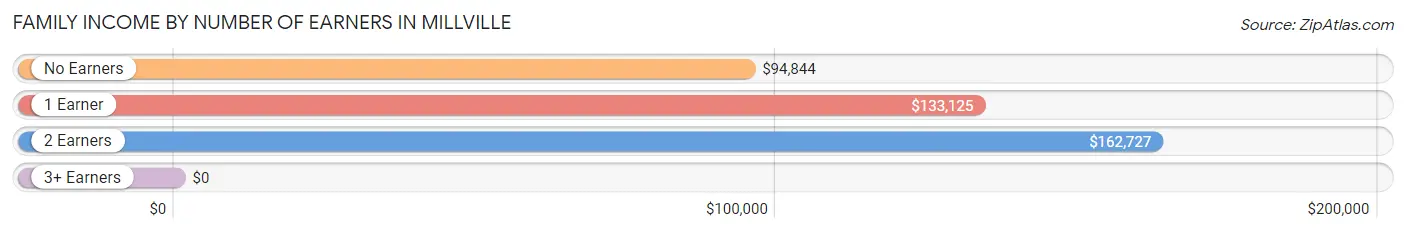
| Number of Earners | # Families | Median Income |
| No Earners | 305 (42.8%) | $94,844 |
| 1 Earner | 207 (29.0%) | $133,125 |
| 2 Earners | 146 (20.5%) | $162,727 |
| 3+ Earners | 55 (7.7%) | $0 |
| Total | 713 (100.0%) | $120,662 |
Household Income in Millville
Household Income Brackets in Millville
With 241 households falling in the category, the $100,000 to $149,999 income range is the most frequent in Millville, accounting for 21.5% of all households. In contrast, only 15 households (1.3%) fall into the $15,000 to $24,999 income bracket, making it the least populous group.
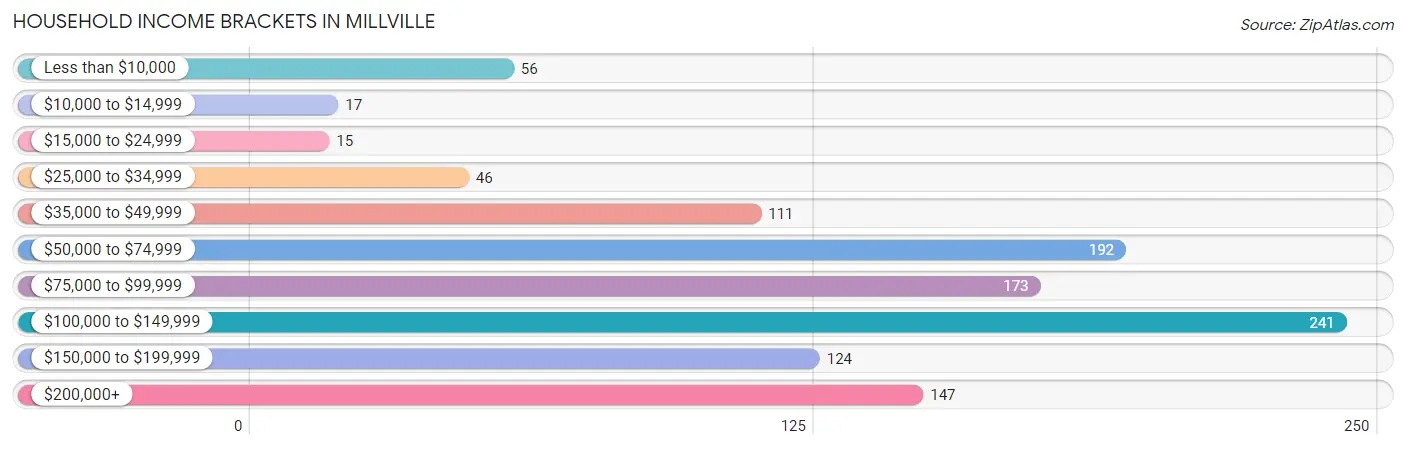
| Income Bracket | # Households | % Households |
| Less than $10,000 | 56 | 5.0% |
| $10,000 to $14,999 | 17 | 1.5% |
| $15,000 to $24,999 | 15 | 1.3% |
| $25,000 to $34,999 | 46 | 4.1% |
| $35,000 to $49,999 | 111 | 9.9% |
| $50,000 to $74,999 | 192 | 17.1% |
| $75,000 to $99,999 | 173 | 15.4% |
| $100,000 to $149,999 | 241 | 21.5% |
| $150,000 to $199,999 | 124 | 11.0% |
| $200,000+ | 147 | 13.1% |
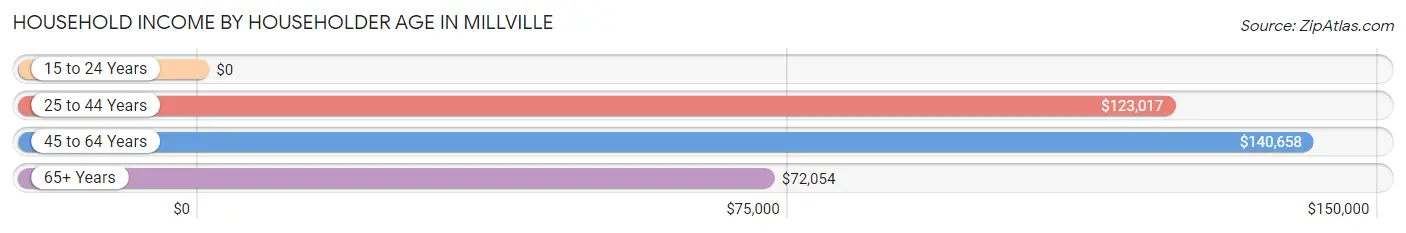
Household Income by Householder Age in Millville
The median household income in Millville is $92,961, with the highest median household income of $140,658 found in the 45 to 64 years age bracket for the primary householder. A total of 314 households (28.0%) fall into this category.
| Income Bracket | # Households | Median Income |
| 15 to 24 Years | 0 (0.0%) | $0 |
| 25 to 44 Years | 102 (9.1%) | $123,017 |
| 45 to 64 Years | 314 (28.0%) | $140,658 |
| 65+ Years | 707 (63.0%) | $72,054 |
| Total | 1,123 (100.0%) | $92,961 |
Poverty in Millville
Income Below Poverty by Sex and Age in Millville
With 6.3% poverty level for males and 5.0% for females among the residents of Millville, 5 year old males and 35 to 44 year old females are the most vulnerable to poverty, with 6 males (100.0%) and 4 females (20.0%) in their respective age groups living below the poverty level.
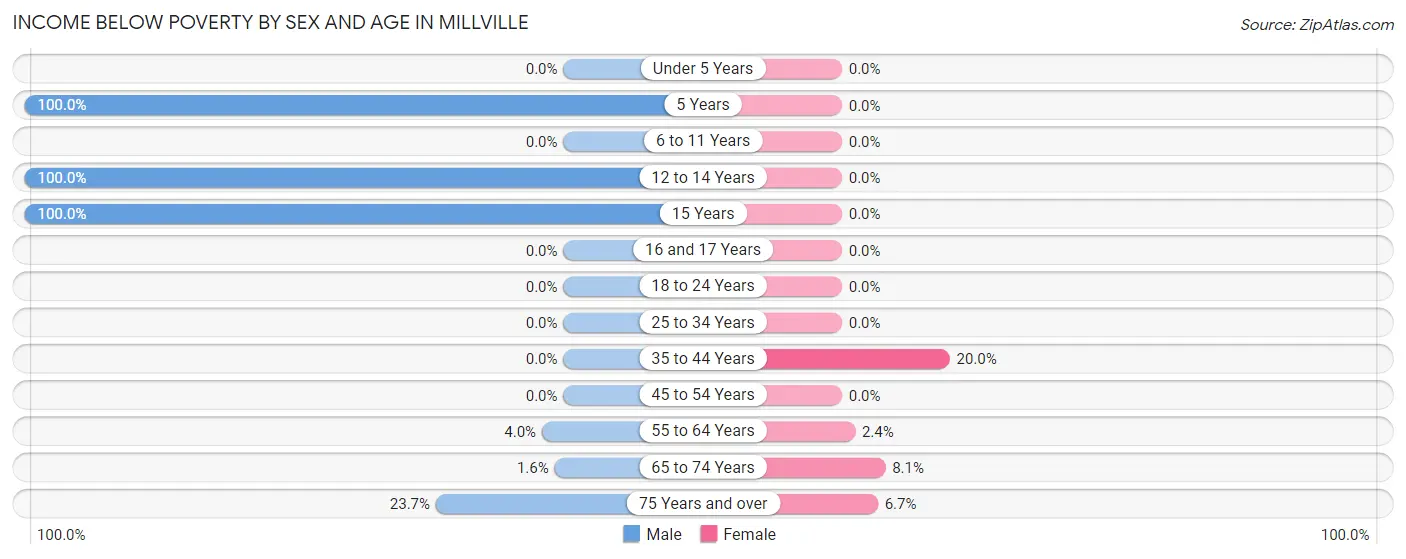
| Age Bracket | Male | Female |
| Under 5 Years | 0 (0.0%) | 0 (0.0%) |
| 5 Years | 6 (100.0%) | 0 (0.0%) |
| 6 to 11 Years | 0 (0.0%) | 0 (0.0%) |
| 12 to 14 Years | 7 (100.0%) | 0 (0.0%) |
| 15 Years | 7 (100.0%) | 0 (0.0%) |
| 16 and 17 Years | 0 (0.0%) | 0 (0.0%) |
| 18 to 24 Years | 0 (0.0%) | 0 (0.0%) |
| 25 to 34 Years | 0 (0.0%) | 0 (0.0%) |
| 35 to 44 Years | 0 (0.0%) | 4 (20.0%) |
| 45 to 54 Years | 0 (0.0%) | 0 (0.0%) |
| 55 to 64 Years | 7 (4.0%) | 5 (2.4%) |
| 65 to 74 Years | 6 (1.6%) | 45 (8.1%) |
| 75 Years and over | 22 (23.7%) | 5 (6.7%) |
| Total | 55 (6.3%) | 59 (5.0%) |
Income Above Poverty by Sex and Age in Millville
According to the poverty statistics in Millville, males aged under 5 years and females aged under 5 years are the age groups that are most secure financially, with 100.0% of males and 100.0% of females in these age groups living above the poverty line.
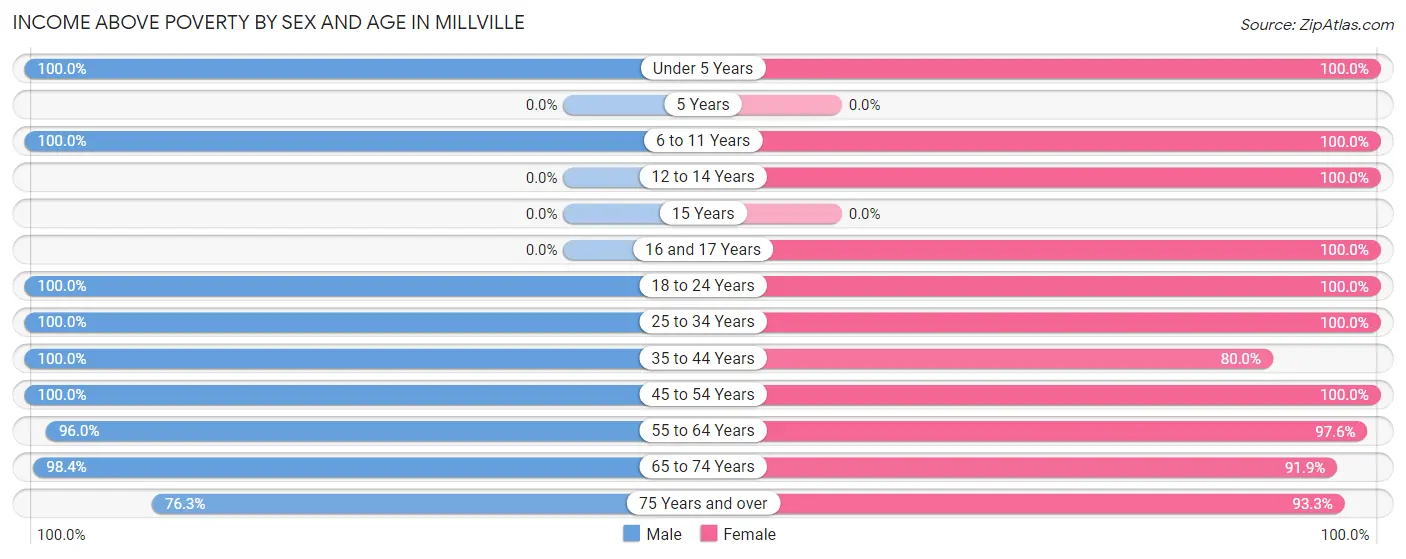
| Age Bracket | Male | Female |
| Under 5 Years | 19 (100.0%) | 43 (100.0%) |
| 5 Years | 0 (0.0%) | 0 (0.0%) |
| 6 to 11 Years | 2 (100.0%) | 17 (100.0%) |
| 12 to 14 Years | 0 (0.0%) | 8 (100.0%) |
| 15 Years | 0 (0.0%) | 0 (0.0%) |
| 16 and 17 Years | 0 (0.0%) | 30 (100.0%) |
| 18 to 24 Years | 28 (100.0%) | 17 (100.0%) |
| 25 to 34 Years | 68 (100.0%) | 88 (100.0%) |
| 35 to 44 Years | 45 (100.0%) | 16 (80.0%) |
| 45 to 54 Years | 56 (100.0%) | 117 (100.0%) |
| 55 to 64 Years | 169 (96.0%) | 200 (97.6%) |
| 65 to 74 Years | 359 (98.4%) | 513 (91.9%) |
| 75 Years and over | 71 (76.3%) | 70 (93.3%) |
| Total | 817 (93.7%) | 1,119 (95.0%) |
Income Below Poverty Among Married-Couple Families in Millville
The poverty statistics for married-couple families in Millville show that 1.6% or 10 of the total 631 families live below the poverty line. Families with no children have the highest poverty rate of 1.8%, comprising of 10 families. On the other hand, families with 1 or 2 children have the lowest poverty rate of 0.0%, which includes 0 families.
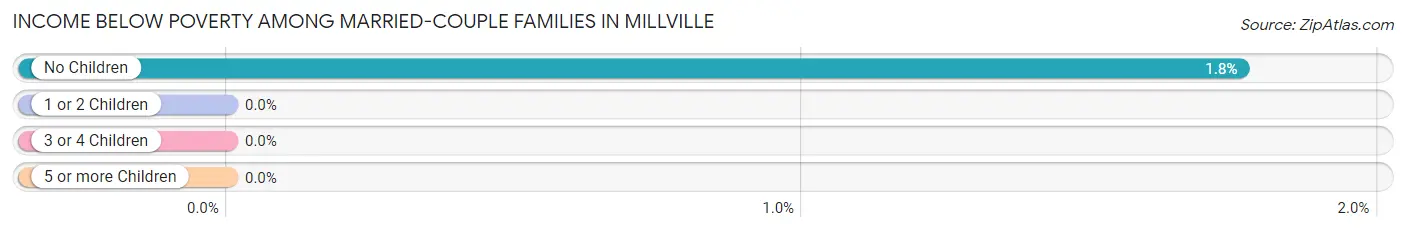
| Children | Above Poverty | Below Poverty |
| No Children | 557 (98.2%) | 10 (1.8%) |
| 1 or 2 Children | 64 (100.0%) | 0 (0.0%) |
| 3 or 4 Children | 0 (0.0%) | 0 (0.0%) |
| 5 or more Children | 0 (0.0%) | 0 (0.0%) |
| Total | 621 (98.4%) | 10 (1.6%) |
Income Below Poverty Among Single-Parent Households in Millville
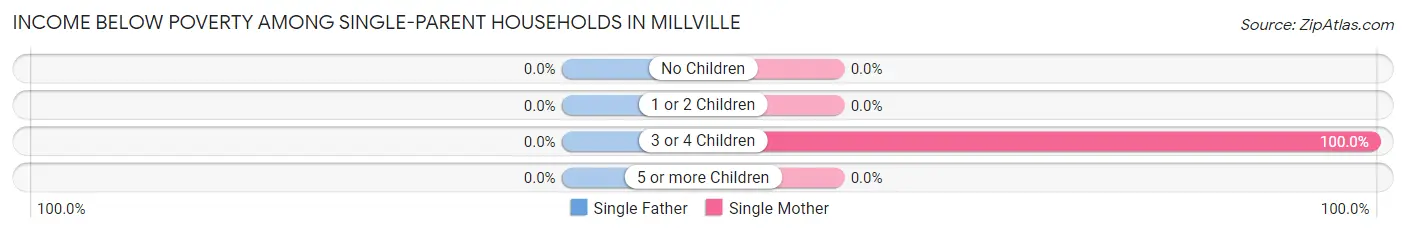
| Children | Single Father | Single Mother |
| No Children | 0 (0.0%) | 0 (0.0%) |
| 1 or 2 Children | 0 (0.0%) | 0 (0.0%) |
| 3 or 4 Children | 0 (0.0%) | 4 (100.0%) |
| 5 or more Children | 0 (0.0%) | 0 (0.0%) |
| Total | 0 (0.0%) | 4 (5.6%) |
Income Below Poverty Among Married-Couple vs Single-Parent Households in Millville
The poverty data for Millville shows that 10 of the married-couple family households (1.6%) and 4 of the single-parent households (4.9%) are living below the poverty level. Within the married-couple family households, those with no children have the highest poverty rate, with 10 households (1.8%) falling below the poverty line. Among the single-parent households, those with 3 or 4 children have the highest poverty rate, with 4 household (100.0%) living below poverty.
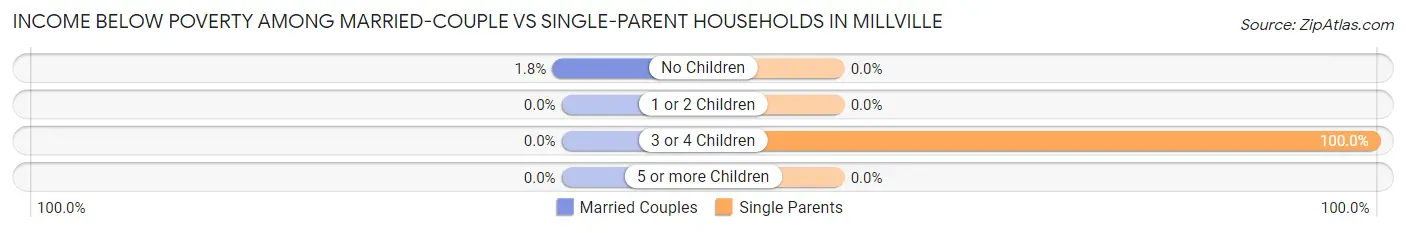
| Children | Married-Couple Families | Single-Parent Households |
| No Children | 10 (1.8%) | 0 (0.0%) |
| 1 or 2 Children | 0 (0.0%) | 0 (0.0%) |
| 3 or 4 Children | 0 (0.0%) | 4 (100.0%) |
| 5 or more Children | 0 (0.0%) | 0 (0.0%) |
| Total | 10 (1.6%) | 4 (4.9%) |
Race in Millville
The most populous races in Millville are White / Caucasian (1,961 | 95.6%), Hispanic or Latino (57 | 2.8%), and Two or more Races (29 | 1.4%).
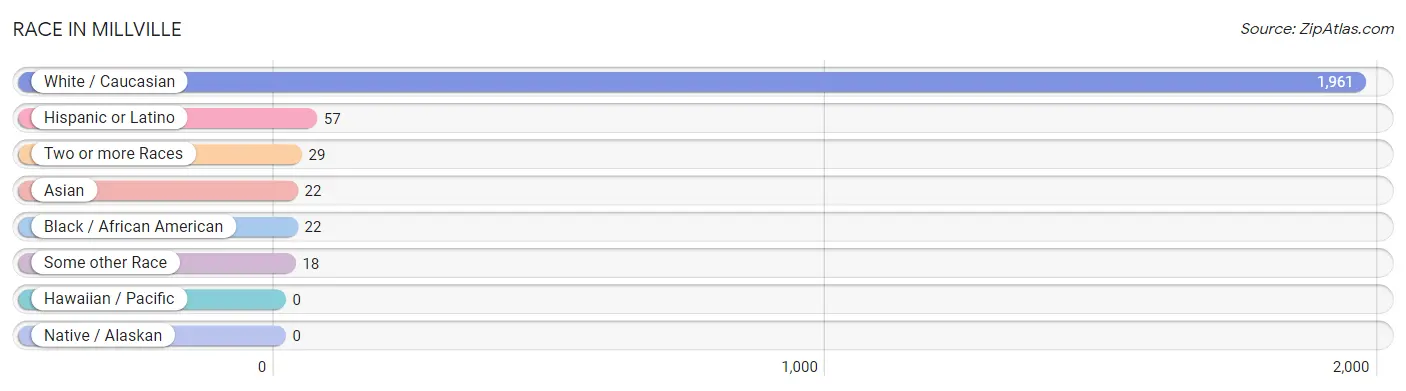
| Race | # Population | % Population |
| Asian | 22 | 1.1% |
| Black / African American | 22 | 1.1% |
| Hawaiian / Pacific | 0 | 0.0% |
| Hispanic or Latino | 57 | 2.8% |
| Native / Alaskan | 0 | 0.0% |
| White / Caucasian | 1,961 | 95.6% |
| Two or more Races | 29 | 1.4% |
| Some other Race | 18 | 0.9% |
| Total | 2,052 | 100.0% |
Ancestry in Millville
The most populous ancestries reported in Millville are Irish (568 | 27.7%), German (334 | 16.3%), Italian (297 | 14.5%), American (203 | 9.9%), and English (193 | 9.4%), together accounting for 77.7% of all Millville residents.
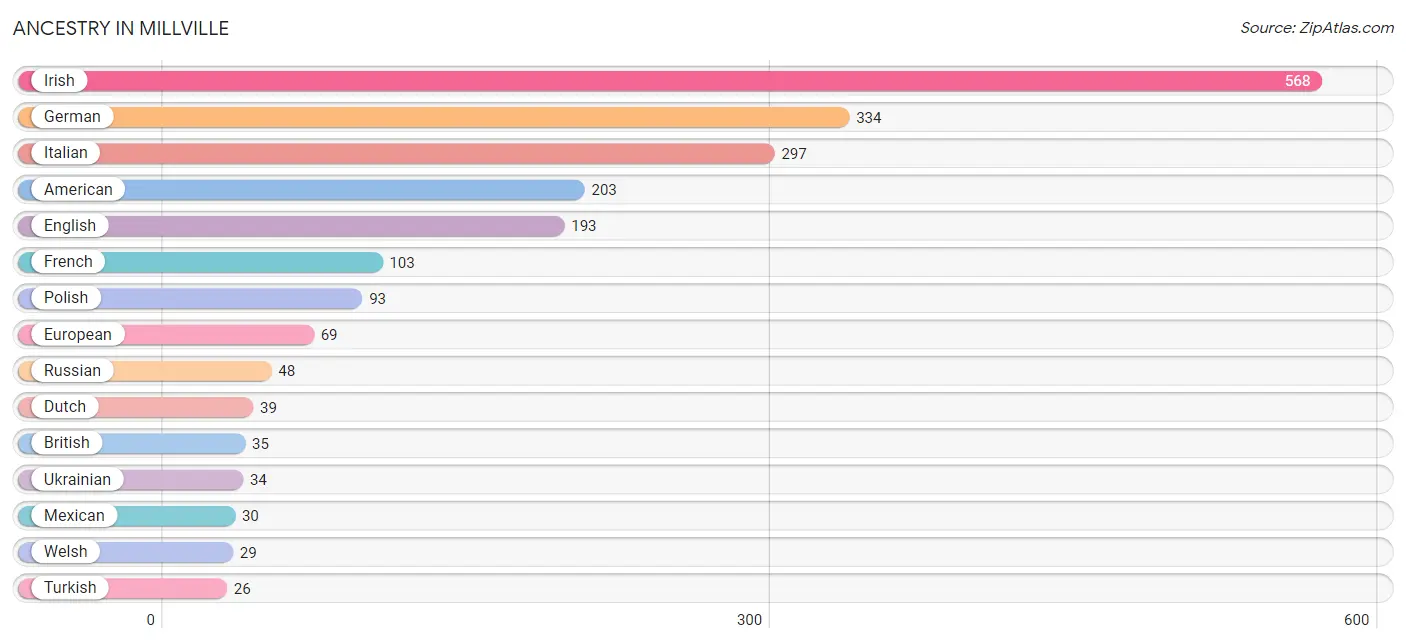
| Ancestry | # Population | % Population |
| African | 15 | 0.7% |
| American | 203 | 9.9% |
| Arab | 2 | 0.1% |
| Austrian | 4 | 0.2% |
| Bhutanese | 7 | 0.3% |
| British | 35 | 1.7% |
| Cherokee | 2 | 0.1% |
| Colombian | 5 | 0.2% |
| Czech | 11 | 0.5% |
| Danish | 8 | 0.4% |
| Dutch | 39 | 1.9% |
| Eastern European | 6 | 0.3% |
| English | 193 | 9.4% |
| European | 69 | 3.4% |
| French | 103 | 5.0% |
| German | 334 | 16.3% |
| Greek | 23 | 1.1% |
| Hungarian | 14 | 0.7% |
| Irish | 568 | 27.7% |
| Italian | 297 | 14.5% |
| Korean | 22 | 1.1% |
| Lithuanian | 4 | 0.2% |
| Maltese | 2 | 0.1% |
| Mexican | 30 | 1.5% |
| Northern European | 19 | 0.9% |
| Norwegian | 3 | 0.2% |
| Paiute | 3 | 0.2% |
| Pennsylvania German | 3 | 0.2% |
| Polish | 93 | 4.5% |
| Puerto Rican | 22 | 1.1% |
| Romanian | 1 | 0.1% |
| Russian | 48 | 2.3% |
| Scotch-Irish | 5 | 0.2% |
| Scottish | 9 | 0.4% |
| Slovak | 20 | 1.0% |
| South American | 5 | 0.2% |
| Subsaharan African | 15 | 0.7% |
| Swedish | 13 | 0.6% |
| Swiss | 19 | 0.9% |
| Turkish | 26 | 1.3% |
| Ukrainian | 34 | 1.7% |
| Welsh | 29 | 1.4% | View All 42 Rows |
Immigrants in Millville
The most numerous immigrant groups reported in Millville came from Asia (45 | 2.2%), Europe (34 | 1.7%), Western Asia (28 | 1.4%), Turkey (26 | 1.3%), and Italy (17 | 0.8%), together accounting for 7.3% of all Millville residents.
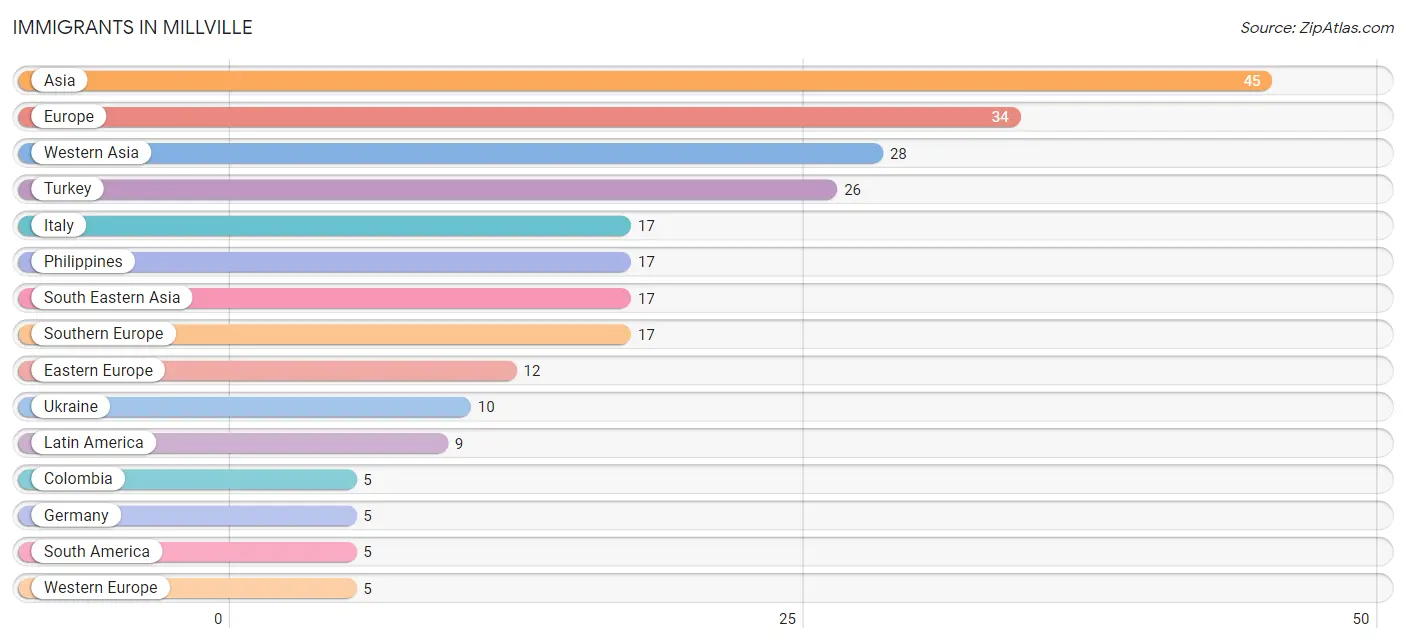
| Immigration Origin | # Population | % Population |
| Asia | 45 | 2.2% |
| Central America | 4 | 0.2% |
| Colombia | 5 | 0.2% |
| Eastern Europe | 12 | 0.6% |
| Europe | 34 | 1.7% |
| Germany | 5 | 0.2% |
| Italy | 17 | 0.8% |
| Jordan | 2 | 0.1% |
| Latin America | 9 | 0.4% |
| Mexico | 4 | 0.2% |
| Philippines | 17 | 0.8% |
| Russia | 2 | 0.1% |
| South America | 5 | 0.2% |
| South Eastern Asia | 17 | 0.8% |
| Southern Europe | 17 | 0.8% |
| Turkey | 26 | 1.3% |
| Ukraine | 10 | 0.5% |
| Western Asia | 28 | 1.4% |
| Western Europe | 5 | 0.2% | View All 19 Rows |
Sex and Age in Millville
Sex and Age in Millville
The most populous age groups in Millville are 65 to 69 Years (211 | 24.2%) for men and 65 to 69 Years (387 | 32.8%) for women.
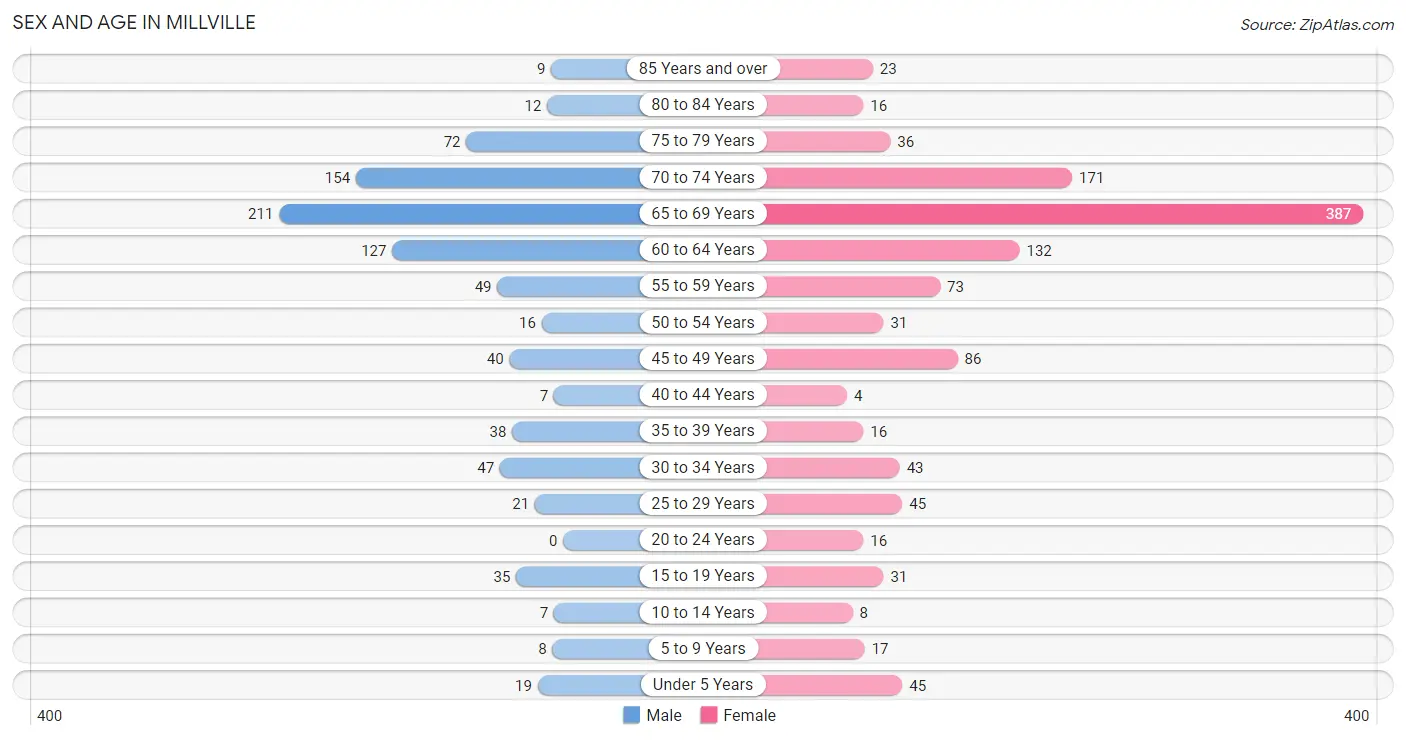
| Age Bracket | Male | Female |
| Under 5 Years | 19 (2.2%) | 45 (3.8%) |
| 5 to 9 Years | 8 (0.9%) | 17 (1.4%) |
| 10 to 14 Years | 7 (0.8%) | 8 (0.7%) |
| 15 to 19 Years | 35 (4.0%) | 31 (2.6%) |
| 20 to 24 Years | 0 (0.0%) | 16 (1.4%) |
| 25 to 29 Years | 21 (2.4%) | 45 (3.8%) |
| 30 to 34 Years | 47 (5.4%) | 43 (3.6%) |
| 35 to 39 Years | 38 (4.4%) | 16 (1.4%) |
| 40 to 44 Years | 7 (0.8%) | 4 (0.3%) |
| 45 to 49 Years | 40 (4.6%) | 86 (7.3%) |
| 50 to 54 Years | 16 (1.8%) | 31 (2.6%) |
| 55 to 59 Years | 49 (5.6%) | 73 (6.2%) |
| 60 to 64 Years | 127 (14.6%) | 132 (11.2%) |
| 65 to 69 Years | 211 (24.2%) | 387 (32.8%) |
| 70 to 74 Years | 154 (17.7%) | 171 (14.5%) |
| 75 to 79 Years | 72 (8.3%) | 36 (3.0%) |
| 80 to 84 Years | 12 (1.4%) | 16 (1.4%) |
| 85 Years and over | 9 (1.0%) | 23 (1.9%) |
| Total | 872 (100.0%) | 1,180 (100.0%) |
Families and Households in Millville
Median Family Size in Millville
The median family size in Millville is 2.24 persons per family, with single female/mother families (71 | 10.0%) accounting for the largest median family size of 2.83 persons per family. On the other hand, single male/father families (11 | 1.5%) represent the smallest median family size with 1.91 persons per family.
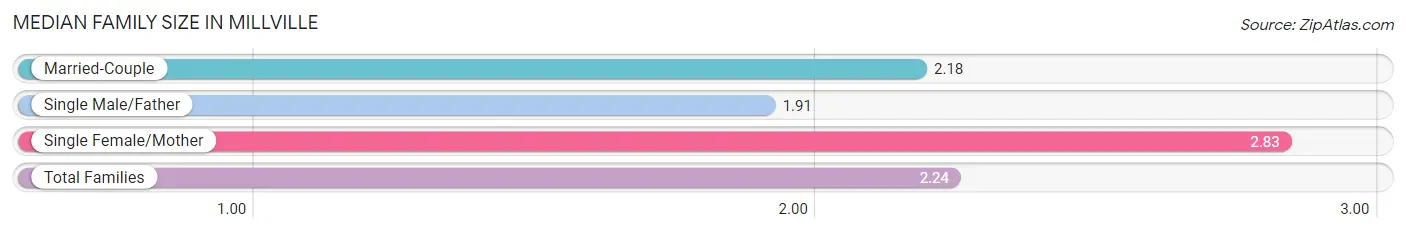
| Family Type | # Families | Family Size |
| Married-Couple | 631 (88.5%) | 2.18 |
| Single Male/Father | 11 (1.5%) | 1.91 |
| Single Female/Mother | 71 (10.0%) | 2.83 |
| Total Families | 713 (100.0%) | 2.24 |
Median Household Size in Millville
The median household size in Millville is 1.83 persons per household, with single female/mother households (71 | 6.3%) accounting for the largest median household size of 2.99 persons per household. non-family households (410 | 36.5%) represent the smallest median household size with 1.06 persons per household.
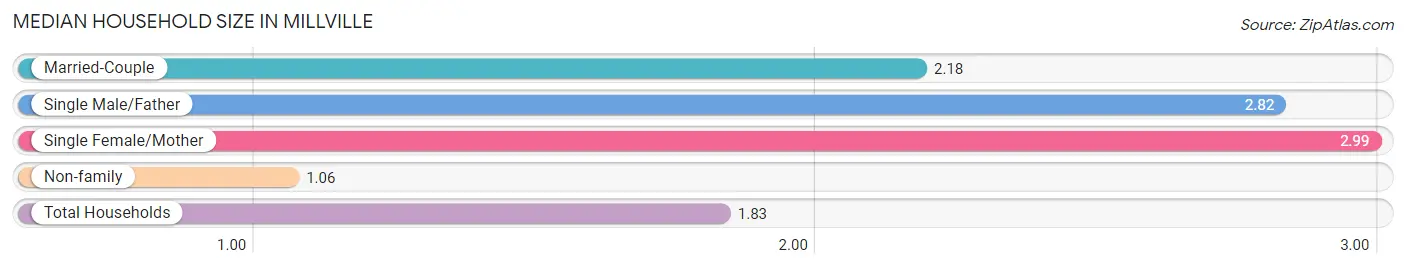
| Household Type | # Households | Household Size |
| Married-Couple | 631 (56.2%) | 2.18 |
| Single Male/Father | 11 (1.0%) | 2.82 |
| Single Female/Mother | 71 (6.3%) | 2.99 |
| Non-family | 410 (36.5%) | 1.06 |
| Total Households | 1,123 (100.0%) | 1.83 |
Household Size by Marriage Status in Millville
Out of a total of 1,123 households in Millville, 713 (63.5%) are family households, while 410 (36.5%) are nonfamily households. The most numerous type of family households are 2-person households, comprising 551, and the most common type of nonfamily households are 1-person households, comprising 383.
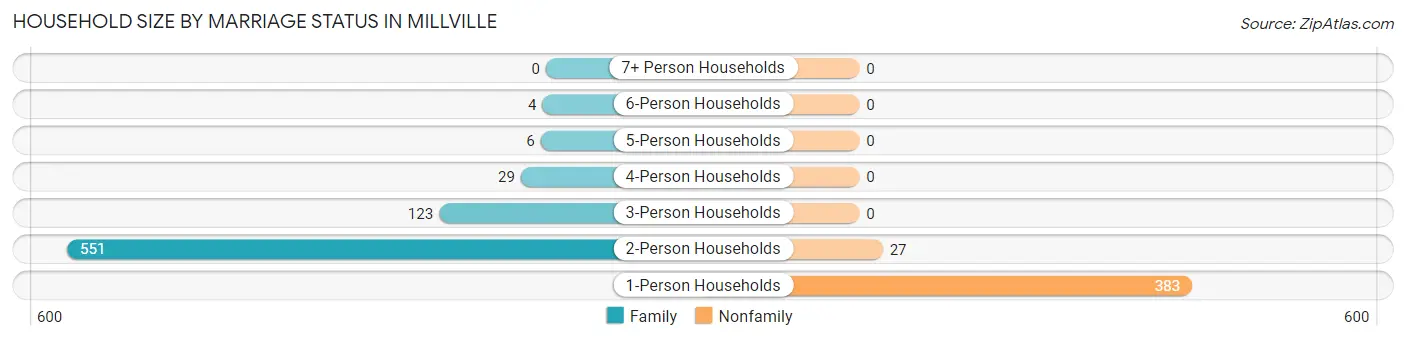
| Household Size | Family Households | Nonfamily Households |
| 1-Person Households | - | 383 (34.1%) |
| 2-Person Households | 551 (49.1%) | 27 (2.4%) |
| 3-Person Households | 123 (11.0%) | 0 (0.0%) |
| 4-Person Households | 29 (2.6%) | 0 (0.0%) |
| 5-Person Households | 6 (0.5%) | 0 (0.0%) |
| 6-Person Households | 4 (0.4%) | 0 (0.0%) |
| 7+ Person Households | 0 (0.0%) | 0 (0.0%) |
| Total | 713 (63.5%) | 410 (36.5%) |
Female Fertility in Millville
Fertility by Age in Millville
Average fertility rate in Millville is 41.0 births per 1,000 women. Women in the age bracket of 20 to 34 years have the highest fertility rate with 96.0 births per 1,000 women. Women in the age bracket of 20 to 34 years acount for 100.0% of all women with births.
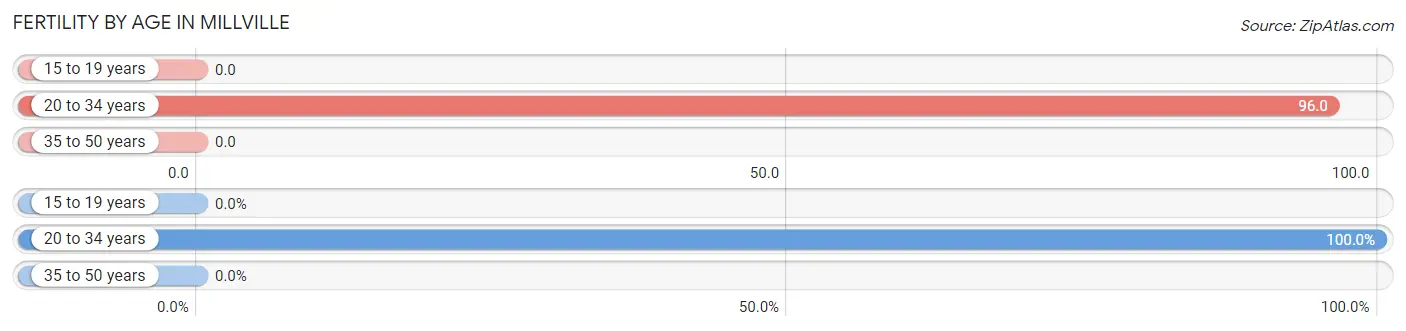
| Age Bracket | Women with Births | Births / 1,000 Women |
| 15 to 19 years | 0 (0.0%) | 0.0 |
| 20 to 34 years | 10 (100.0%) | 96.0 |
| 35 to 50 years | 0 (0.0%) | 0.0 |
| Total | 10 (100.0%) | 41.0 |
Fertility by Age by Marriage Status in Millville
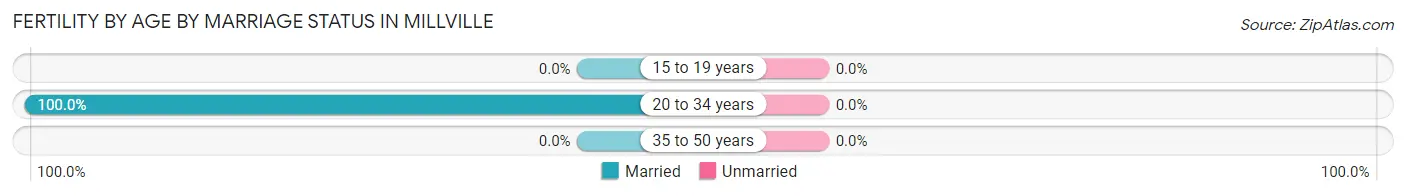
| Age Bracket | Married | Unmarried |
| 15 to 19 years | 0 (0.0%) | 0 (0.0%) |
| 20 to 34 years | 10 (100.0%) | 0 (0.0%) |
| 35 to 50 years | 0 (0.0%) | 0 (0.0%) |
| Total | 10 (100.0%) | 0 (0.0%) |
Fertility by Education in Millville
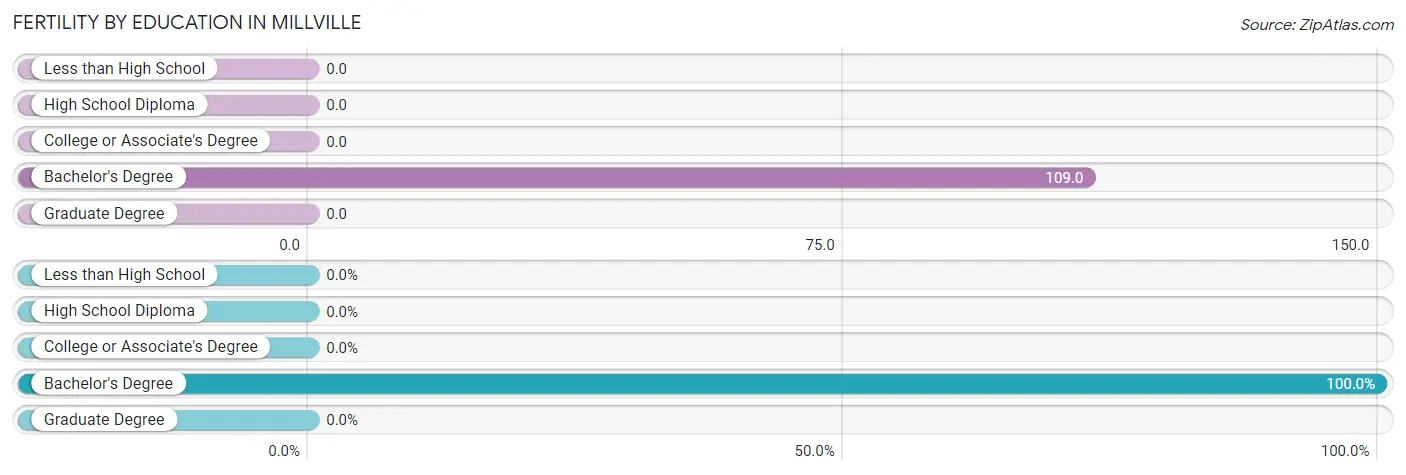
| Educational Attainment | Women with Births | Births / 1,000 Women |
| Less than High School | 0 (0.0%) | 0.0 |
| High School Diploma | 0 (0.0%) | 0.0 |
| College or Associate's Degree | 0 (0.0%) | 0.0 |
| Bachelor's Degree | 10 (100.0%) | 109.0 |
| Graduate Degree | 0 (0.0%) | 0.0 |
| Total | 10 (100.0%) | 41.0 |
Fertility by Education by Marriage Status in Millville
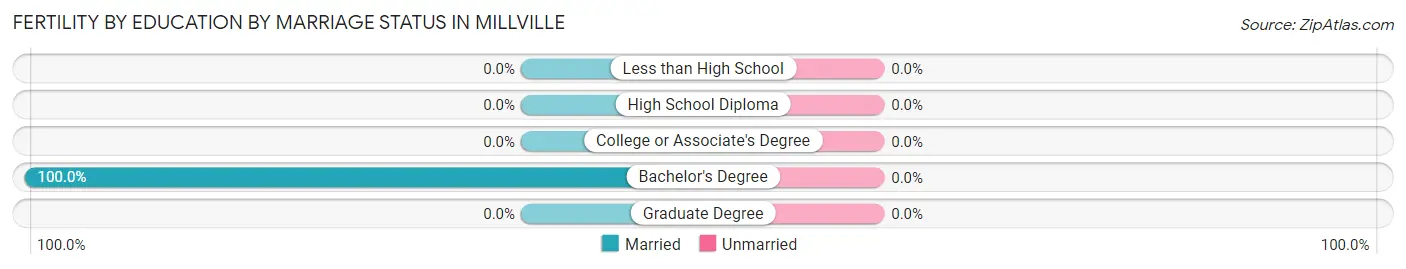
| Educational Attainment | Married | Unmarried |
| Less than High School | 0 (0.0%) | 0 (0.0%) |
| High School Diploma | 0 (0.0%) | 0 (0.0%) |
| College or Associate's Degree | 0 (0.0%) | 0 (0.0%) |
| Bachelor's Degree | 10 (100.0%) | 0 (0.0%) |
| Graduate Degree | 0 (0.0%) | 0 (0.0%) |
| Total | 10 (100.0%) | 0 (0.0%) |
Employment Characteristics in Millville
Employment by Class of Employer in Millville
Among the 631 employed individuals in Millville, private company employees (452 | 71.6%), self-employed (not incorporated) (52 | 8.2%), and not-for-profit organizations (49 | 7.8%) make up the most common classes of employment.
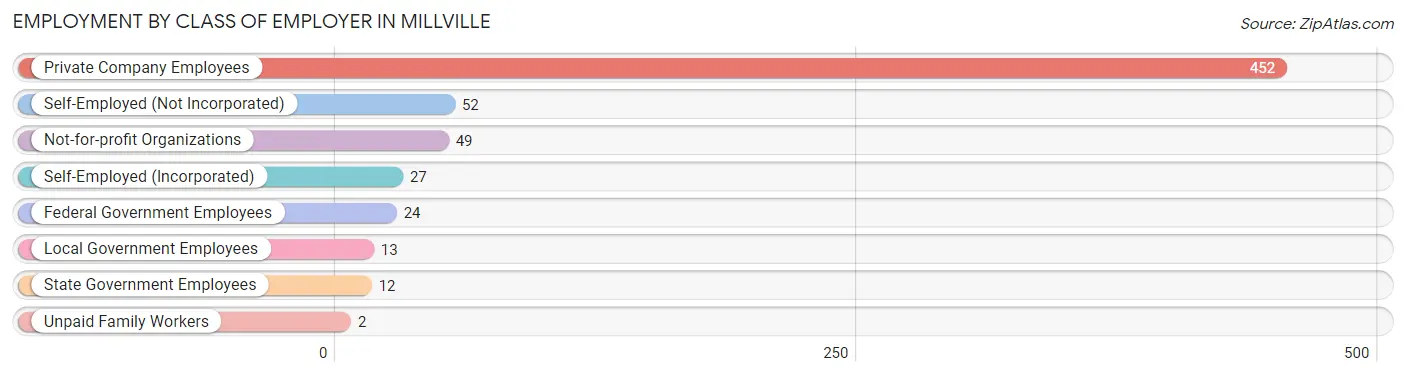
| Employer Class | # Employees | % Employees |
| Private Company Employees | 452 | 71.6% |
| Self-Employed (Incorporated) | 27 | 4.3% |
| Self-Employed (Not Incorporated) | 52 | 8.2% |
| Not-for-profit Organizations | 49 | 7.8% |
| Local Government Employees | 13 | 2.1% |
| State Government Employees | 12 | 1.9% |
| Federal Government Employees | 24 | 3.8% |
| Unpaid Family Workers | 2 | 0.3% |
| Total | 631 | 100.0% |
Employment Status by Age in Millville
According to the labor force statistics for Millville, out of the total population over 16 years of age (1,941), 35.1% or 681 individuals are in the labor force, with 2.3% or 16 of them unemployed. The age group with the highest labor force participation rate is 16 to 19 years, with 100.0% or 59 individuals in the labor force. Within the labor force, the 75 years and over age range has the highest percentage of unemployed individuals, with 100.0% or 3 of them being unemployed.
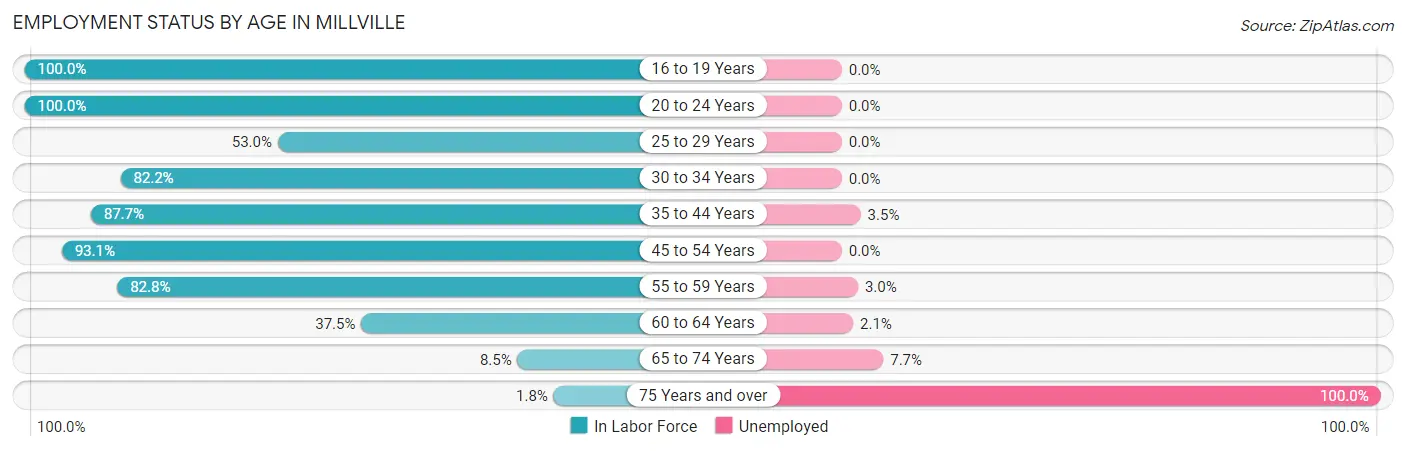
| Age Bracket | In Labor Force | Unemployed |
| 16 to 19 Years | 59 (100.0%) | 0 (0.0%) |
| 20 to 24 Years | 16 (100.0%) | 0 (0.0%) |
| 25 to 29 Years | 35 (53.0%) | 0 (0.0%) |
| 30 to 34 Years | 74 (82.2%) | 0 (0.0%) |
| 35 to 44 Years | 57 (87.7%) | 2 (3.5%) |
| 45 to 54 Years | 161 (93.1%) | 0 (0.0%) |
| 55 to 59 Years | 101 (82.8%) | 3 (3.0%) |
| 60 to 64 Years | 97 (37.5%) | 2 (2.1%) |
| 65 to 74 Years | 78 (8.5%) | 6 (7.7%) |
| 75 Years and over | 3 (1.8%) | 3 (100.0%) |
| Total | 681 (35.1%) | 16 (2.3%) |
Employment Status by Educational Attainment in Millville
According to labor force statistics for Millville, 67.7% of individuals (525) out of the total population between 25 and 64 years of age (775) are in the labor force, with 1.3% or 7 of them being unemployed. The group with the highest labor force participation rate are those with the educational attainment of high school diploma, with 76.7% or 102 individuals in the labor force. Within the labor force, individuals with high school diploma education have the highest percentage of unemployment, with 2.0% or 2 of them being unemployed.
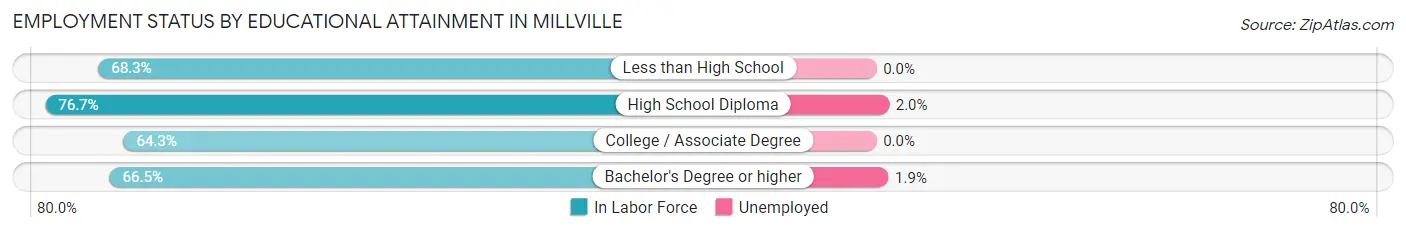
| Educational Attainment | In Labor Force | Unemployed |
| Less than High School | 28 (68.3%) | 0 (0.0%) |
| High School Diploma | 102 (76.7%) | 3 (2.0%) |
| College / Associate Degree | 133 (64.3%) | 0 (0.0%) |
| Bachelor's Degree or higher | 262 (66.5%) | 7 (1.9%) |
| Total | 525 (67.7%) | 10 (1.3%) |
Employment Occupations by Sex in Millville
Management, Business, Science and Arts Occupations
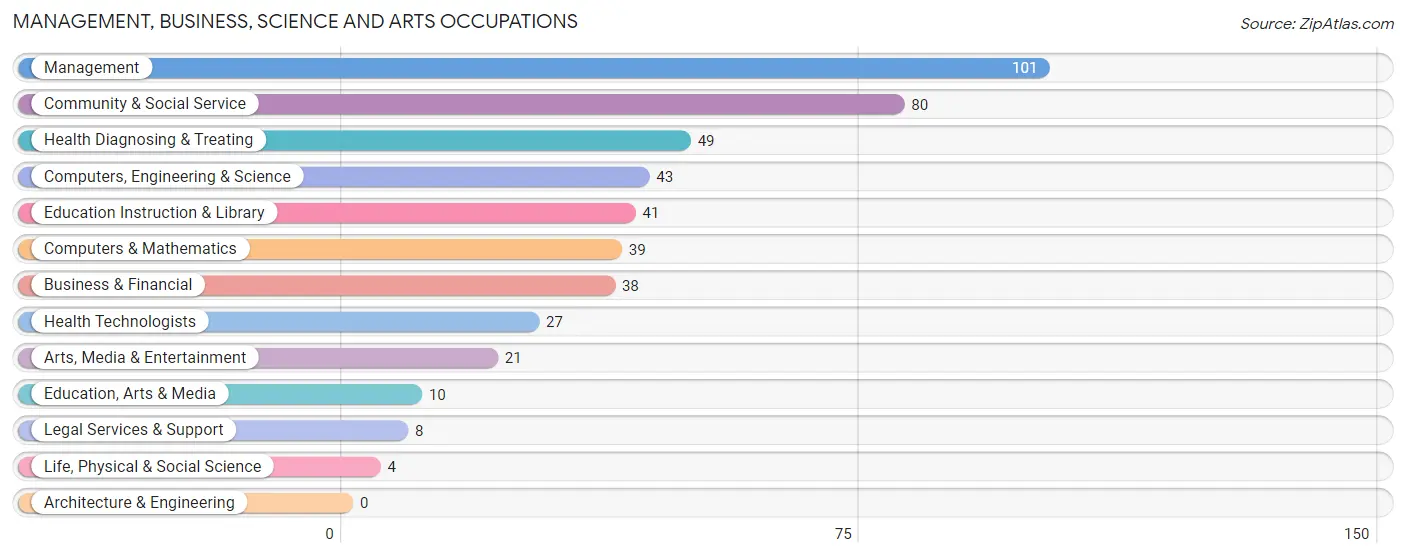
The most common Management, Business, Science and Arts occupations in Millville are Management (101 | 15.2%), Community & Social Service (80 | 12.0%), Health Diagnosing & Treating (49 | 7.4%), Computers, Engineering & Science (43 | 6.5%), and Education Instruction & Library (41 | 6.2%).
Management, Business, Science and Arts Occupations by Sex
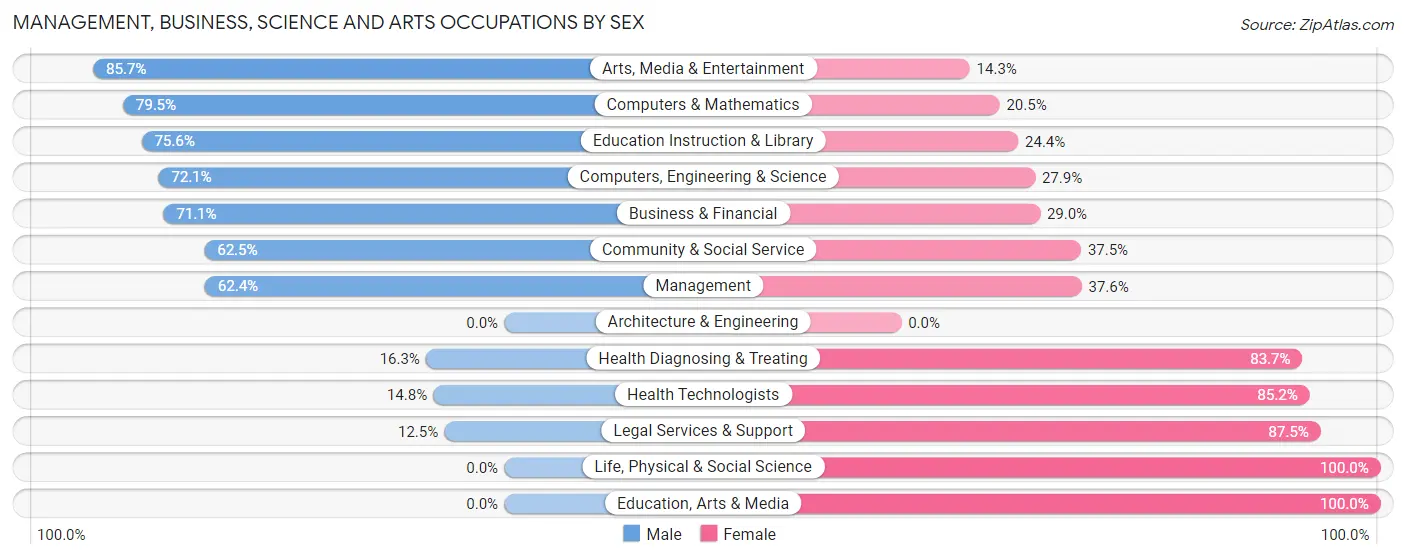
Within the Management, Business, Science and Arts occupations in Millville, the most male-oriented occupations are Arts, Media & Entertainment (85.7%), Computers & Mathematics (79.5%), and Education Instruction & Library (75.6%), while the most female-oriented occupations are Life, Physical & Social Science (100.0%), Education, Arts & Media (100.0%), and Legal Services & Support (87.5%).
| Occupation | Male | Female |
| Management | 63 (62.4%) | 38 (37.6%) |
| Business & Financial | 27 (71.1%) | 11 (28.9%) |
| Computers, Engineering & Science | 31 (72.1%) | 12 (27.9%) |
| Computers & Mathematics | 31 (79.5%) | 8 (20.5%) |
| Architecture & Engineering | 0 (0.0%) | 0 (0.0%) |
| Life, Physical & Social Science | 0 (0.0%) | 4 (100.0%) |
| Community & Social Service | 50 (62.5%) | 30 (37.5%) |
| Education, Arts & Media | 0 (0.0%) | 10 (100.0%) |
| Legal Services & Support | 1 (12.5%) | 7 (87.5%) |
| Education Instruction & Library | 31 (75.6%) | 10 (24.4%) |
| Arts, Media & Entertainment | 18 (85.7%) | 3 (14.3%) |
| Health Diagnosing & Treating | 8 (16.3%) | 41 (83.7%) |
| Health Technologists | 4 (14.8%) | 23 (85.2%) |
| Total (Category) | 179 (57.6%) | 132 (42.4%) |
| Total (Overall) | 328 (49.3%) | 337 (50.7%) |
Services Occupations
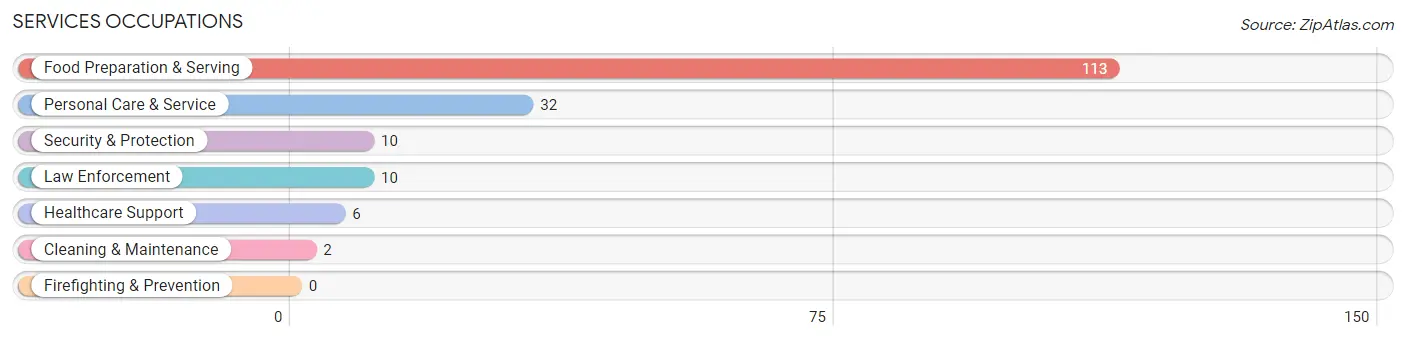
The most common Services occupations in Millville are Food Preparation & Serving (113 | 17.0%), Personal Care & Service (32 | 4.8%), Security & Protection (10 | 1.5%), Law Enforcement (10 | 1.5%), and Healthcare Support (6 | 0.9%).
Services Occupations by Sex
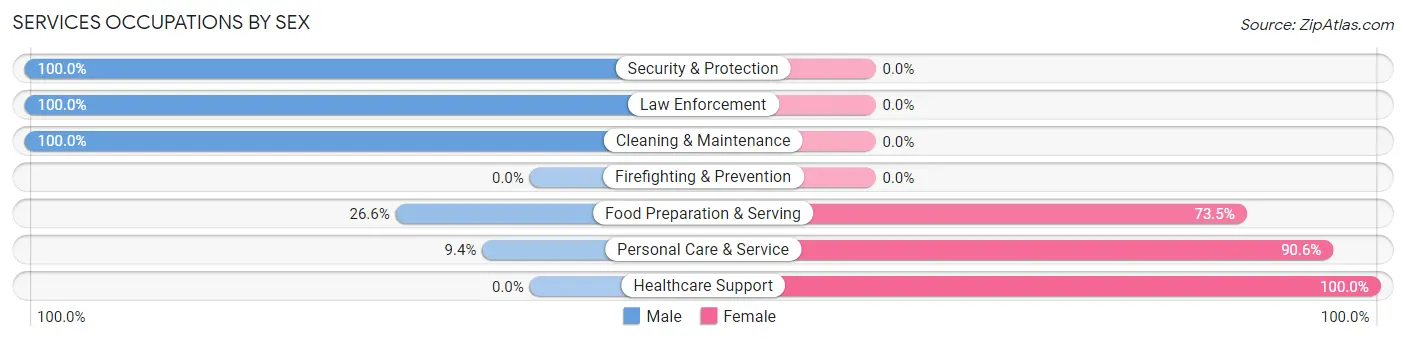
Within the Services occupations in Millville, the most male-oriented occupations are Security & Protection (100.0%), Law Enforcement (100.0%), and Cleaning & Maintenance (100.0%), while the most female-oriented occupations are Healthcare Support (100.0%), Personal Care & Service (90.6%), and Food Preparation & Serving (73.5%).
| Occupation | Male | Female |
| Healthcare Support | 0 (0.0%) | 6 (100.0%) |
| Security & Protection | 10 (100.0%) | 0 (0.0%) |
| Firefighting & Prevention | 0 (0.0%) | 0 (0.0%) |
| Law Enforcement | 10 (100.0%) | 0 (0.0%) |
| Food Preparation & Serving | 30 (26.6%) | 83 (73.5%) |
| Cleaning & Maintenance | 2 (100.0%) | 0 (0.0%) |
| Personal Care & Service | 3 (9.4%) | 29 (90.6%) |
| Total (Category) | 45 (27.6%) | 118 (72.4%) |
| Total (Overall) | 328 (49.3%) | 337 (50.7%) |
Sales and Office Occupations
The most common Sales and Office occupations in Millville are Sales & Related (66 | 9.9%), and Office & Administration (59 | 8.9%).
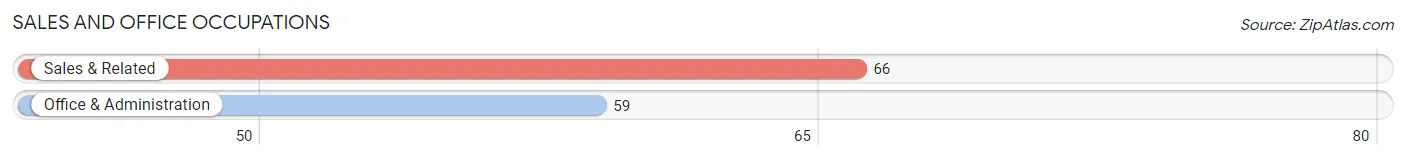
Sales and Office Occupations by Sex
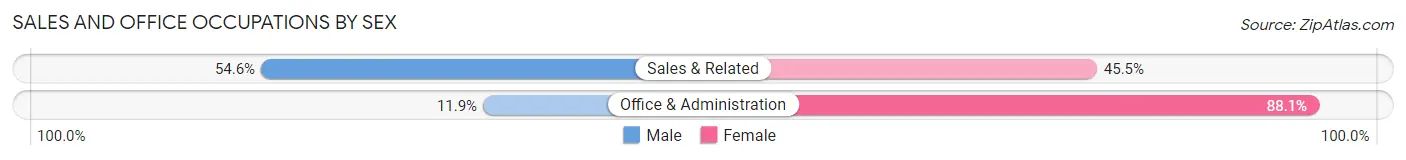
| Occupation | Male | Female |
| Sales & Related | 36 (54.5%) | 30 (45.5%) |
| Office & Administration | 7 (11.9%) | 52 (88.1%) |
| Total (Category) | 43 (34.4%) | 82 (65.6%) |
| Total (Overall) | 328 (49.3%) | 337 (50.7%) |
Natural Resources, Construction and Maintenance Occupations
The most common Natural Resources, Construction and Maintenance occupations in Millville are Construction & Extraction (22 | 3.3%), and Installation, Maintenance & Repair (6 | 0.9%).
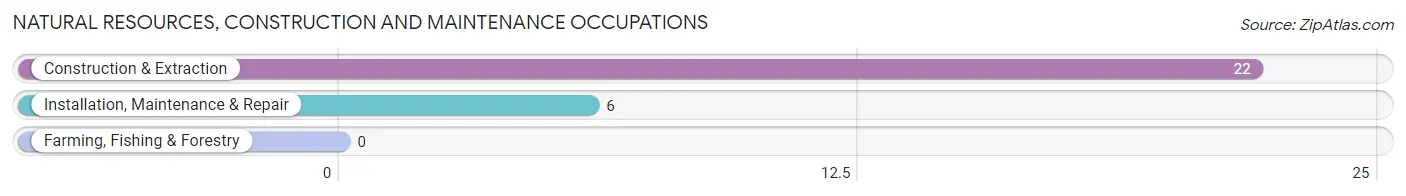
Natural Resources, Construction and Maintenance Occupations by Sex
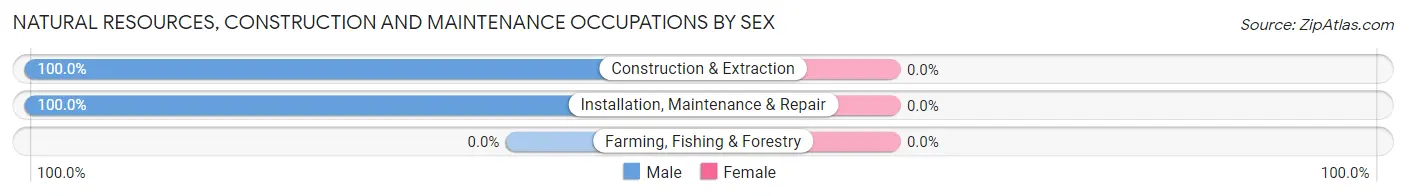
| Occupation | Male | Female |
| Farming, Fishing & Forestry | 0 (0.0%) | 0 (0.0%) |
| Construction & Extraction | 22 (100.0%) | 0 (0.0%) |
| Installation, Maintenance & Repair | 6 (100.0%) | 0 (0.0%) |
| Total (Category) | 28 (100.0%) | 0 (0.0%) |
| Total (Overall) | 328 (49.3%) | 337 (50.7%) |
Production, Transportation and Moving Occupations
The most common Production, Transportation and Moving occupations in Millville are Transportation (19 | 2.9%), Material Moving (11 | 1.7%), and Production (8 | 1.2%).
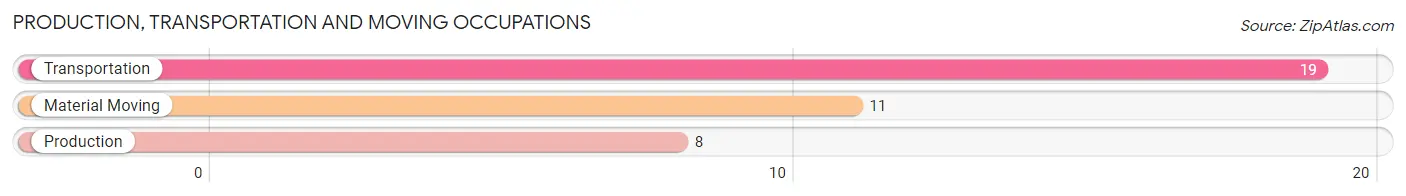
Production, Transportation and Moving Occupations by Sex
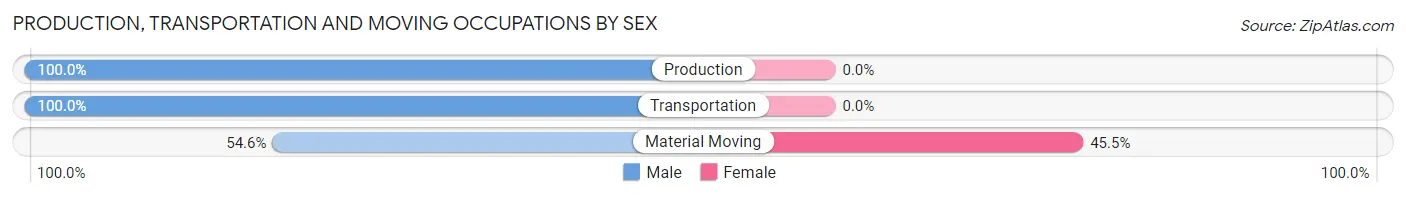
| Occupation | Male | Female |
| Production | 8 (100.0%) | 0 (0.0%) |
| Transportation | 19 (100.0%) | 0 (0.0%) |
| Material Moving | 6 (54.5%) | 5 (45.5%) |
| Total (Category) | 33 (86.8%) | 5 (13.2%) |
| Total (Overall) | 328 (49.3%) | 337 (50.7%) |
Employment Industries by Sex in Millville
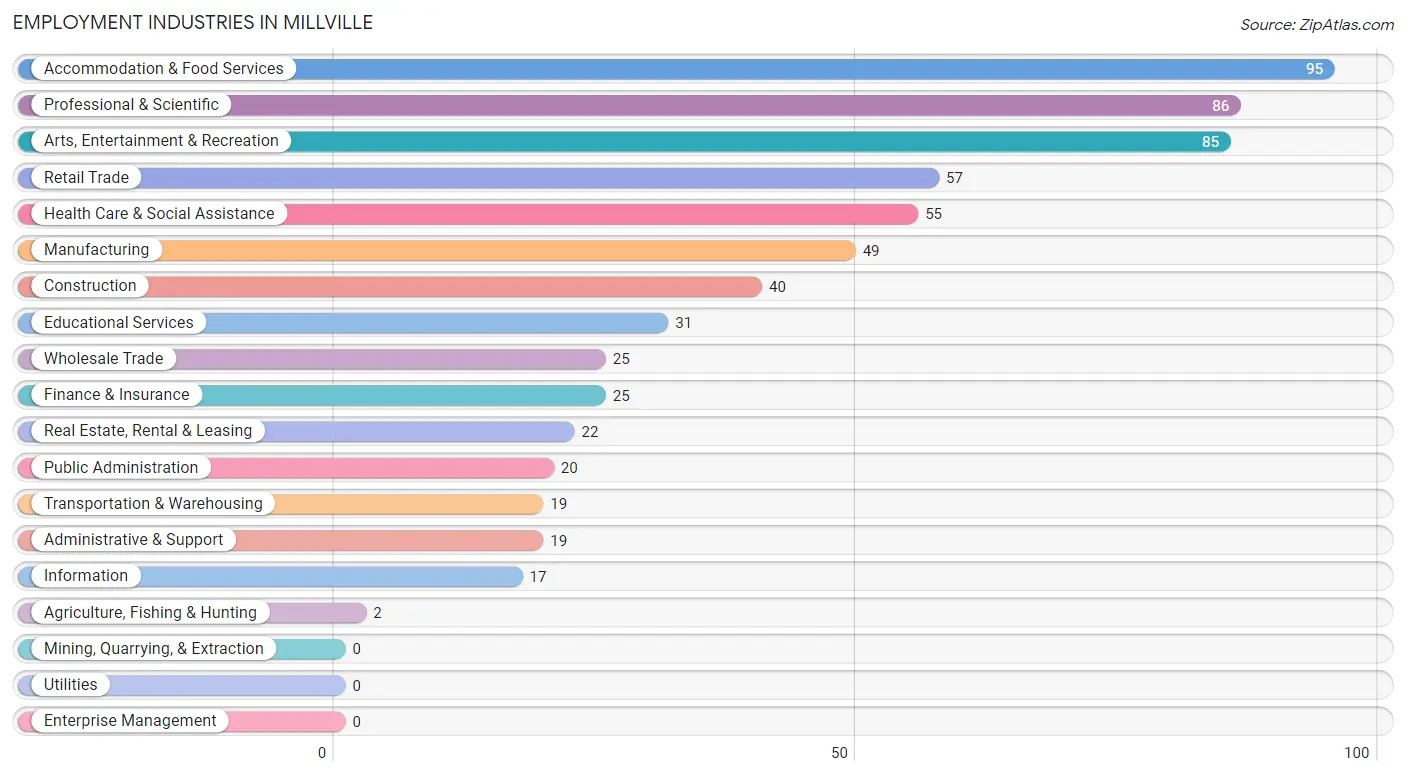
Employment Industries in Millville
The major employment industries in Millville include Accommodation & Food Services (95 | 14.3%), Professional & Scientific (86 | 12.9%), Arts, Entertainment & Recreation (85 | 12.8%), Retail Trade (57 | 8.6%), and Health Care & Social Assistance (55 | 8.3%).
Employment Industries by Sex in Millville
The Millville industries that see more men than women are Agriculture, Fishing & Hunting (100.0%), Transportation & Warehousing (100.0%), and Wholesale Trade (88.0%), whereas the industries that tend to have a higher number of women are Manufacturing (87.8%), Health Care & Social Assistance (85.5%), and Accommodation & Food Services (65.3%).
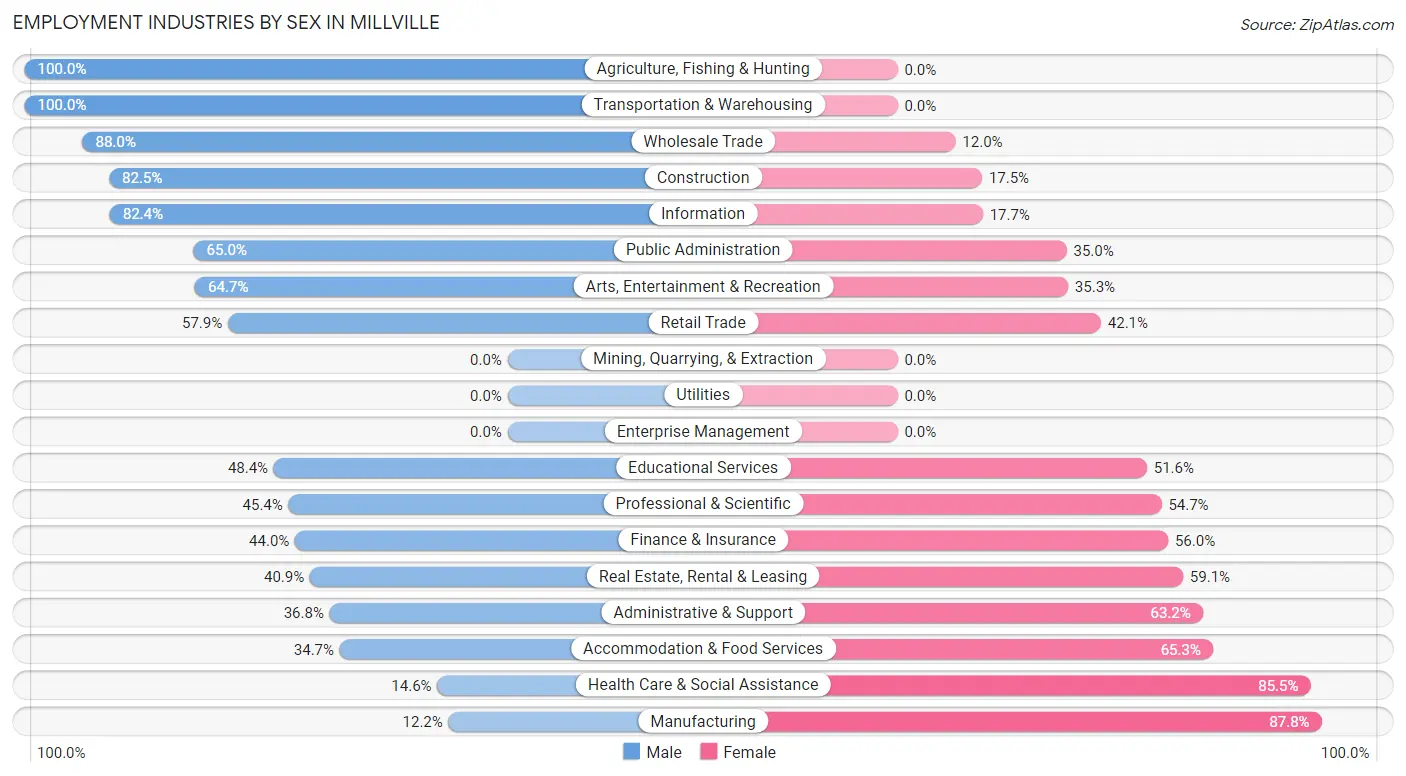
| Industry | Male | Female |
| Agriculture, Fishing & Hunting | 2 (100.0%) | 0 (0.0%) |
| Mining, Quarrying, & Extraction | 0 (0.0%) | 0 (0.0%) |
| Construction | 33 (82.5%) | 7 (17.5%) |
| Manufacturing | 6 (12.2%) | 43 (87.8%) |
| Wholesale Trade | 22 (88.0%) | 3 (12.0%) |
| Retail Trade | 33 (57.9%) | 24 (42.1%) |
| Transportation & Warehousing | 19 (100.0%) | 0 (0.0%) |
| Utilities | 0 (0.0%) | 0 (0.0%) |
| Information | 14 (82.4%) | 3 (17.6%) |
| Finance & Insurance | 11 (44.0%) | 14 (56.0%) |
| Real Estate, Rental & Leasing | 9 (40.9%) | 13 (59.1%) |
| Professional & Scientific | 39 (45.4%) | 47 (54.6%) |
| Enterprise Management | 0 (0.0%) | 0 (0.0%) |
| Administrative & Support | 7 (36.8%) | 12 (63.2%) |
| Educational Services | 15 (48.4%) | 16 (51.6%) |
| Health Care & Social Assistance | 8 (14.5%) | 47 (85.5%) |
| Arts, Entertainment & Recreation | 55 (64.7%) | 30 (35.3%) |
| Accommodation & Food Services | 33 (34.7%) | 62 (65.3%) |
| Public Administration | 13 (65.0%) | 7 (35.0%) |
| Total | 328 (49.3%) | 337 (50.7%) |
Education in Millville
School Enrollment in Millville
The most common levels of schooling among the 130 students in Millville are high school (65 | 50.0%), graduate / professional (20 | 15.4%), and elementary school (17 | 13.1%).
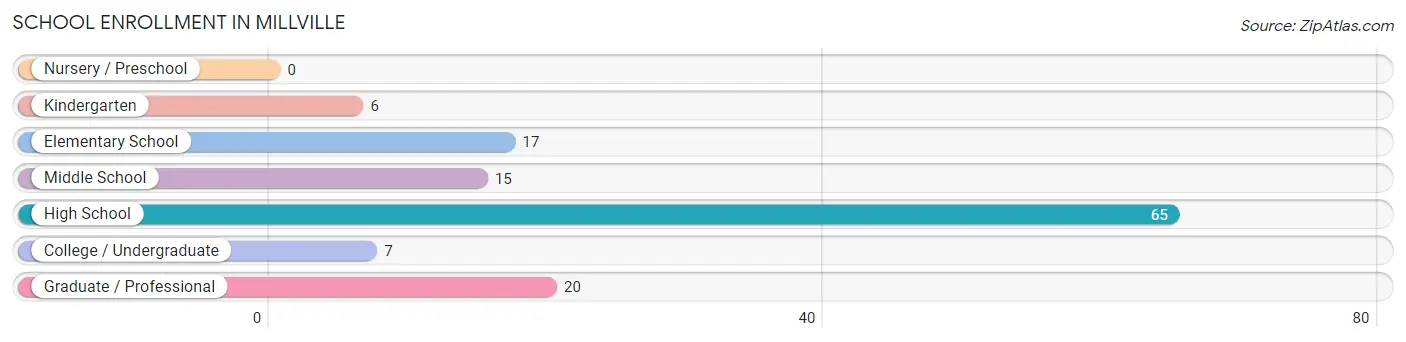
| School Level | # Students | % Students |
| Nursery / Preschool | 0 | 0.0% |
| Kindergarten | 6 | 4.6% |
| Elementary School | 17 | 13.1% |
| Middle School | 15 | 11.5% |
| High School | 65 | 50.0% |
| College / Undergraduate | 7 | 5.4% |
| Graduate / Professional | 20 | 15.4% |
| Total | 130 | 100.0% |
School Enrollment by Age by Funding Source in Millville
Out of a total of 130 students who are enrolled in schools in Millville, 10 (7.7%) attend a private institution, while the remaining 120 (92.3%) are enrolled in public schools. The age group of 35 years and over has the highest likelihood of being enrolled in private schools, with 10 (38.5% in the age bracket) enrolled. Conversely, the age group of 5 to 9 year old has the lowest likelihood of being enrolled in a private school, with 23 (100.0% in the age bracket) attending a public institution.
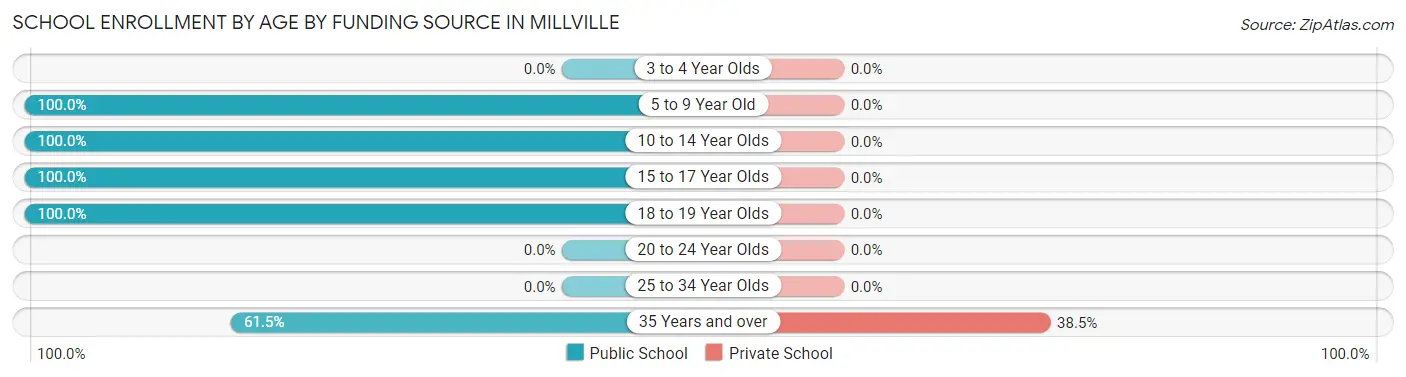
| Age Bracket | Public School | Private School |
| 3 to 4 Year Olds | 0 (0.0%) | 0 (0.0%) |
| 5 to 9 Year Old | 23 (100.0%) | 0 (0.0%) |
| 10 to 14 Year Olds | 15 (100.0%) | 0 (0.0%) |
| 15 to 17 Year Olds | 37 (100.0%) | 0 (0.0%) |
| 18 to 19 Year Olds | 29 (100.0%) | 0 (0.0%) |
| 20 to 24 Year Olds | 0 (0.0%) | 0 (0.0%) |
| 25 to 34 Year Olds | 0 (0.0%) | 0 (0.0%) |
| 35 Years and over | 16 (61.5%) | 10 (38.5%) |
| Total | 120 (92.3%) | 10 (7.7%) |
Educational Attainment by Field of Study in Millville
Business (280 | 26.9%), science & technology (133 | 12.8%), social sciences (104 | 10.0%), psychology (88 | 8.4%), and education (84 | 8.1%) are the most common fields of study among 1,043 individuals in Millville who have obtained a bachelor's degree or higher.
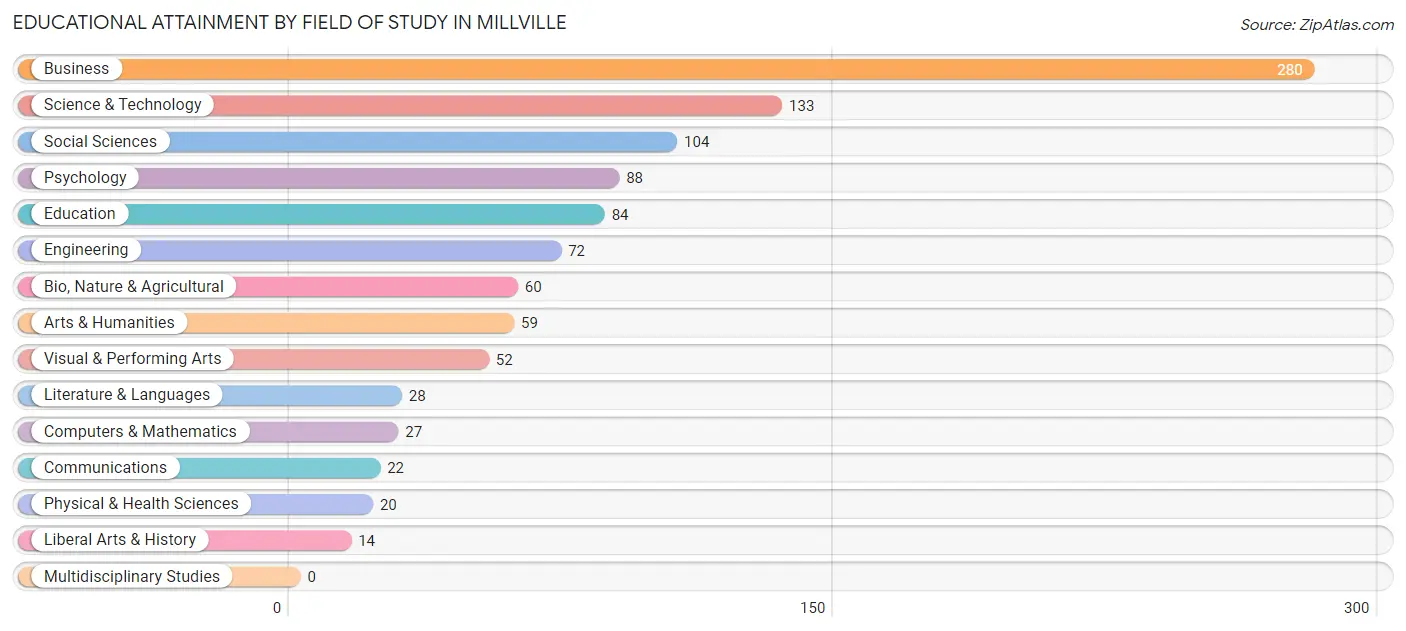
| Field of Study | # Graduates | % Graduates |
| Computers & Mathematics | 27 | 2.6% |
| Bio, Nature & Agricultural | 60 | 5.8% |
| Physical & Health Sciences | 20 | 1.9% |
| Psychology | 88 | 8.4% |
| Social Sciences | 104 | 10.0% |
| Engineering | 72 | 6.9% |
| Multidisciplinary Studies | 0 | 0.0% |
| Science & Technology | 133 | 12.8% |
| Business | 280 | 26.9% |
| Education | 84 | 8.1% |
| Literature & Languages | 28 | 2.7% |
| Liberal Arts & History | 14 | 1.3% |
| Visual & Performing Arts | 52 | 5.0% |
| Communications | 22 | 2.1% |
| Arts & Humanities | 59 | 5.7% |
| Total | 1,043 | 100.0% |
Transportation & Commute in Millville
Vehicle Availability by Sex in Millville
The most prevalent vehicle ownership categories in Millville are males with 2 vehicles (164, accounting for 52.9%) and females with 2 vehicles (192, making up 51.1%).
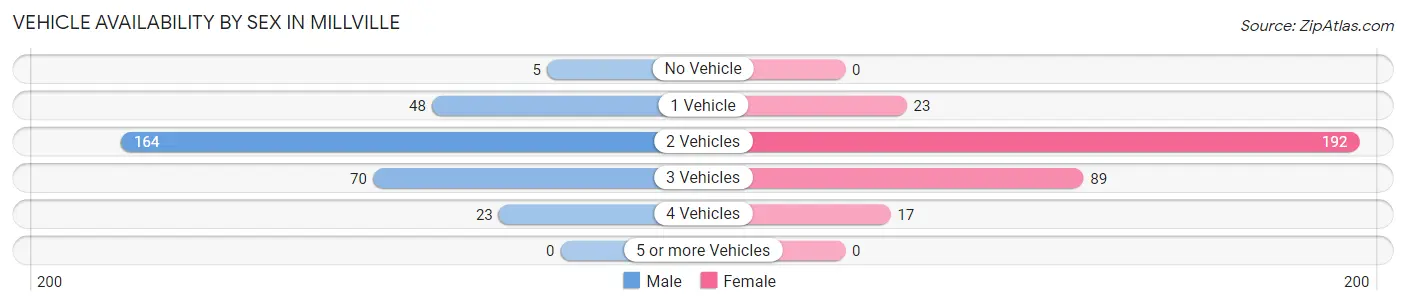
| Vehicles Available | Male | Female |
| No Vehicle | 5 (1.6%) | 0 (0.0%) |
| 1 Vehicle | 48 (15.5%) | 23 (7.2%) |
| 2 Vehicles | 164 (52.9%) | 192 (59.8%) |
| 3 Vehicles | 70 (22.6%) | 89 (27.7%) |
| 4 Vehicles | 23 (7.4%) | 17 (5.3%) |
| 5 or more Vehicles | 0 (0.0%) | 0 (0.0%) |
| Total | 310 (100.0%) | 321 (100.0%) |
Commute Time in Millville
The most frequently occuring commute durations in Millville are 15 to 19 minutes (126 commuters, 25.5%), 40 to 44 minutes (62 commuters, 12.5%), and less than 5 minutes (61 commuters, 12.3%).
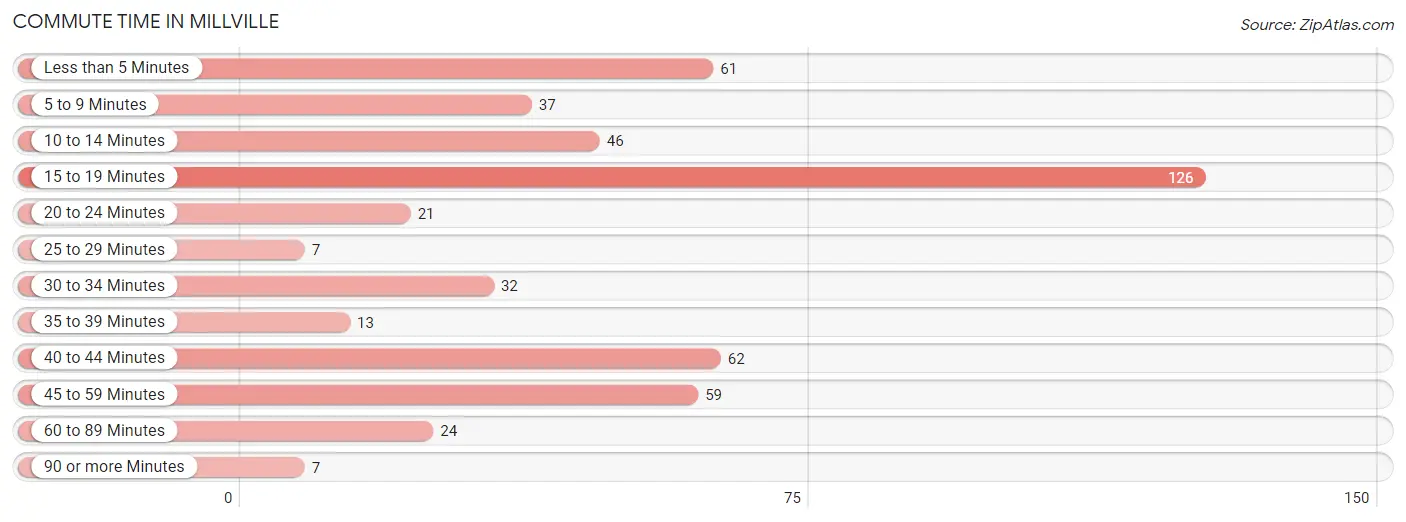
| Commute Time | # Commuters | % Commuters |
| Less than 5 Minutes | 61 | 12.3% |
| 5 to 9 Minutes | 37 | 7.5% |
| 10 to 14 Minutes | 46 | 9.3% |
| 15 to 19 Minutes | 126 | 25.5% |
| 20 to 24 Minutes | 21 | 4.2% |
| 25 to 29 Minutes | 7 | 1.4% |
| 30 to 34 Minutes | 32 | 6.5% |
| 35 to 39 Minutes | 13 | 2.6% |
| 40 to 44 Minutes | 62 | 12.5% |
| 45 to 59 Minutes | 59 | 11.9% |
| 60 to 89 Minutes | 24 | 4.9% |
| 90 or more Minutes | 7 | 1.4% |
Commute Time by Sex in Millville
The most common commute times in Millville are 15 to 19 minutes (78 commuters, 30.6%) for males and 40 to 44 minutes (62 commuters, 25.8%) for females.
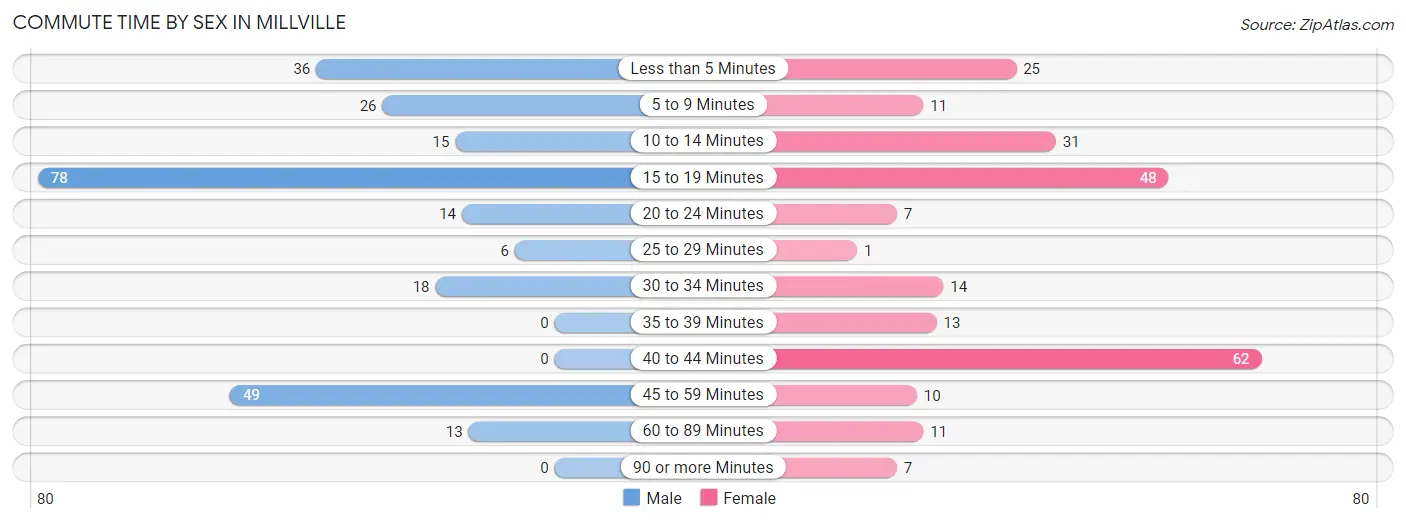
| Commute Time | Male | Female |
| Less than 5 Minutes | 36 (14.1%) | 25 (10.4%) |
| 5 to 9 Minutes | 26 (10.2%) | 11 (4.6%) |
| 10 to 14 Minutes | 15 (5.9%) | 31 (12.9%) |
| 15 to 19 Minutes | 78 (30.6%) | 48 (20.0%) |
| 20 to 24 Minutes | 14 (5.5%) | 7 (2.9%) |
| 25 to 29 Minutes | 6 (2.4%) | 1 (0.4%) |
| 30 to 34 Minutes | 18 (7.1%) | 14 (5.8%) |
| 35 to 39 Minutes | 0 (0.0%) | 13 (5.4%) |
| 40 to 44 Minutes | 0 (0.0%) | 62 (25.8%) |
| 45 to 59 Minutes | 49 (19.2%) | 10 (4.2%) |
| 60 to 89 Minutes | 13 (5.1%) | 11 (4.6%) |
| 90 or more Minutes | 0 (0.0%) | 7 (2.9%) |
Time of Departure to Work by Sex in Millville
The most frequent times of departure to work in Millville are 7:00 AM to 7:29 AM (97, 38.0%) for males and 12:00 PM to 3:59 PM (48, 20.0%) for females.
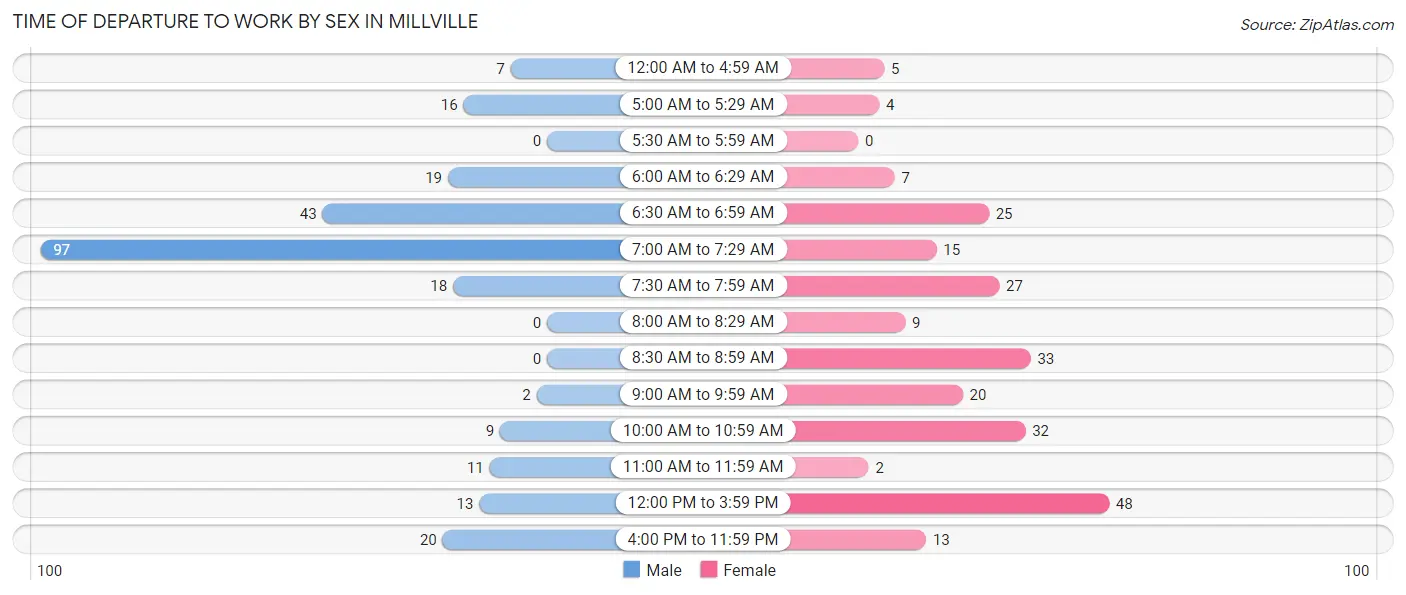
| Time of Departure | Male | Female |
| 12:00 AM to 4:59 AM | 7 (2.8%) | 5 (2.1%) |
| 5:00 AM to 5:29 AM | 16 (6.3%) | 4 (1.7%) |
| 5:30 AM to 5:59 AM | 0 (0.0%) | 0 (0.0%) |
| 6:00 AM to 6:29 AM | 19 (7.4%) | 7 (2.9%) |
| 6:30 AM to 6:59 AM | 43 (16.9%) | 25 (10.4%) |
| 7:00 AM to 7:29 AM | 97 (38.0%) | 15 (6.2%) |
| 7:30 AM to 7:59 AM | 18 (7.1%) | 27 (11.3%) |
| 8:00 AM to 8:29 AM | 0 (0.0%) | 9 (3.7%) |
| 8:30 AM to 8:59 AM | 0 (0.0%) | 33 (13.8%) |
| 9:00 AM to 9:59 AM | 2 (0.8%) | 20 (8.3%) |
| 10:00 AM to 10:59 AM | 9 (3.5%) | 32 (13.3%) |
| 11:00 AM to 11:59 AM | 11 (4.3%) | 2 (0.8%) |
| 12:00 PM to 3:59 PM | 13 (5.1%) | 48 (20.0%) |
| 4:00 PM to 11:59 PM | 20 (7.8%) | 13 (5.4%) |
| Total | 255 (100.0%) | 240 (100.0%) |
Housing Occupancy in Millville
Occupancy by Ownership in Millville
Of the total 1,123 dwellings in Millville, owner-occupied units account for 1,044 (93.0%), while renter-occupied units make up 79 (7.0%).
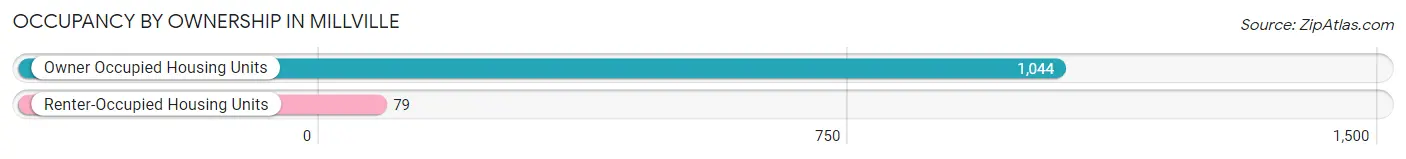
| Occupancy | # Housing Units | % Housing Units |
| Owner Occupied Housing Units | 1,044 | 93.0% |
| Renter-Occupied Housing Units | 79 | 7.0% |
| Total Occupied Housing Units | 1,123 | 100.0% |
Occupancy by Household Size in Millville
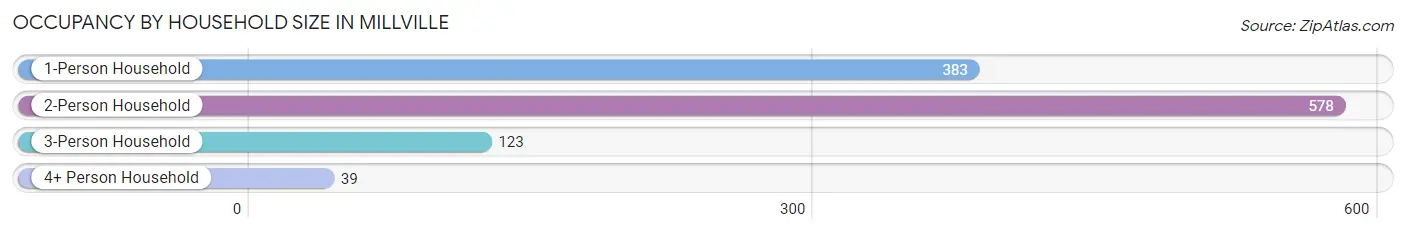
| Household Size | # Housing Units | % Housing Units |
| 1-Person Household | 383 | 34.1% |
| 2-Person Household | 578 | 51.5% |
| 3-Person Household | 123 | 11.0% |
| 4+ Person Household | 39 | 3.5% |
| Total Housing Units | 1,123 | 100.0% |
Occupancy by Ownership by Household Size in Millville
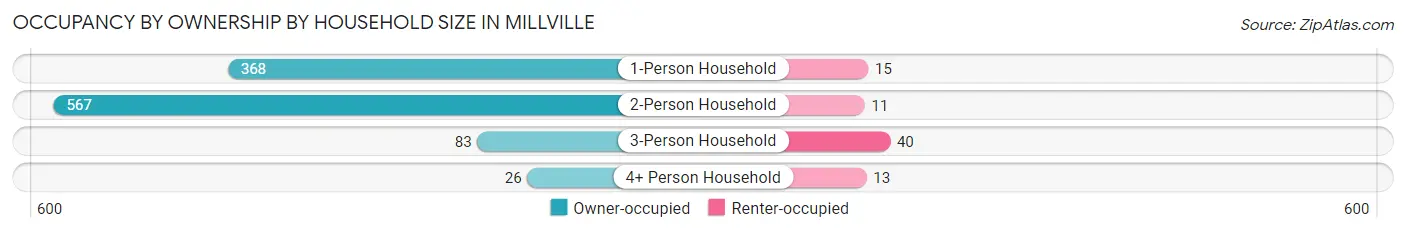
| Household Size | Owner-occupied | Renter-occupied |
| 1-Person Household | 368 (96.1%) | 15 (3.9%) |
| 2-Person Household | 567 (98.1%) | 11 (1.9%) |
| 3-Person Household | 83 (67.5%) | 40 (32.5%) |
| 4+ Person Household | 26 (66.7%) | 13 (33.3%) |
| Total Housing Units | 1,044 (93.0%) | 79 (7.0%) |
Occupancy by Educational Attainment in Millville
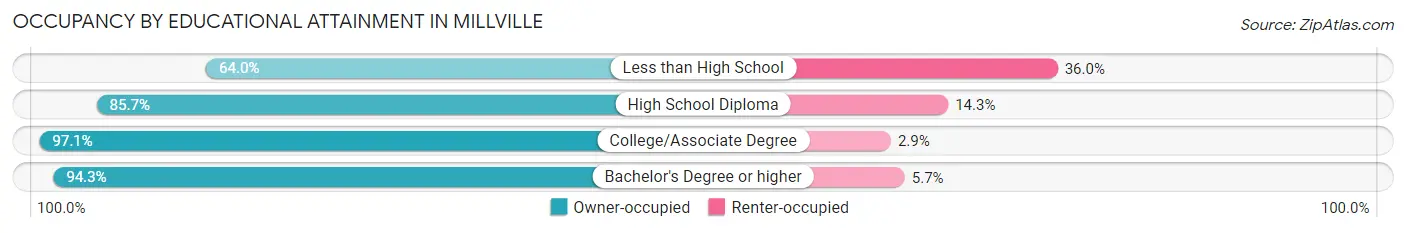
| Household Size | Owner-occupied | Renter-occupied |
| Less than High School | 16 (64.0%) | 9 (36.0%) |
| High School Diploma | 150 (85.7%) | 25 (14.3%) |
| College/Associate Degree | 265 (97.1%) | 8 (2.9%) |
| Bachelor's Degree or higher | 613 (94.3%) | 37 (5.7%) |
Occupancy by Age of Householder in Millville
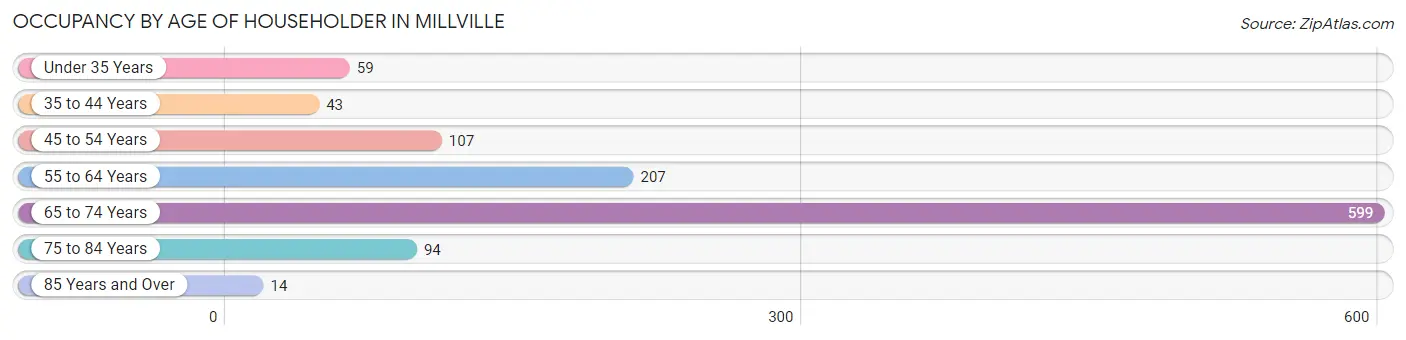
| Age Bracket | # Households | % Households |
| Under 35 Years | 59 | 5.2% |
| 35 to 44 Years | 43 | 3.8% |
| 45 to 54 Years | 107 | 9.5% |
| 55 to 64 Years | 207 | 18.4% |
| 65 to 74 Years | 599 | 53.3% |
| 75 to 84 Years | 94 | 8.4% |
| 85 Years and Over | 14 | 1.3% |
| Total | 1,123 | 100.0% |
Housing Finances in Millville
Median Income by Occupancy in Millville
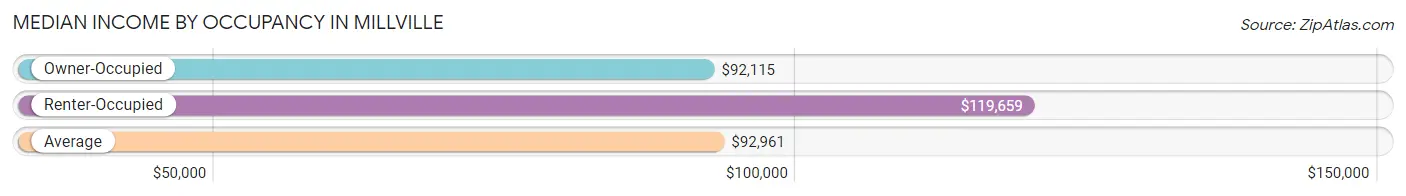
| Occupancy Type | # Households | Median Income |
| Owner-Occupied | 1,044 (93.0%) | $92,115 |
| Renter-Occupied | 79 (7.0%) | $119,659 |
| Average | 1,123 (100.0%) | $92,961 |
Occupancy by Householder Income Bracket in Millville
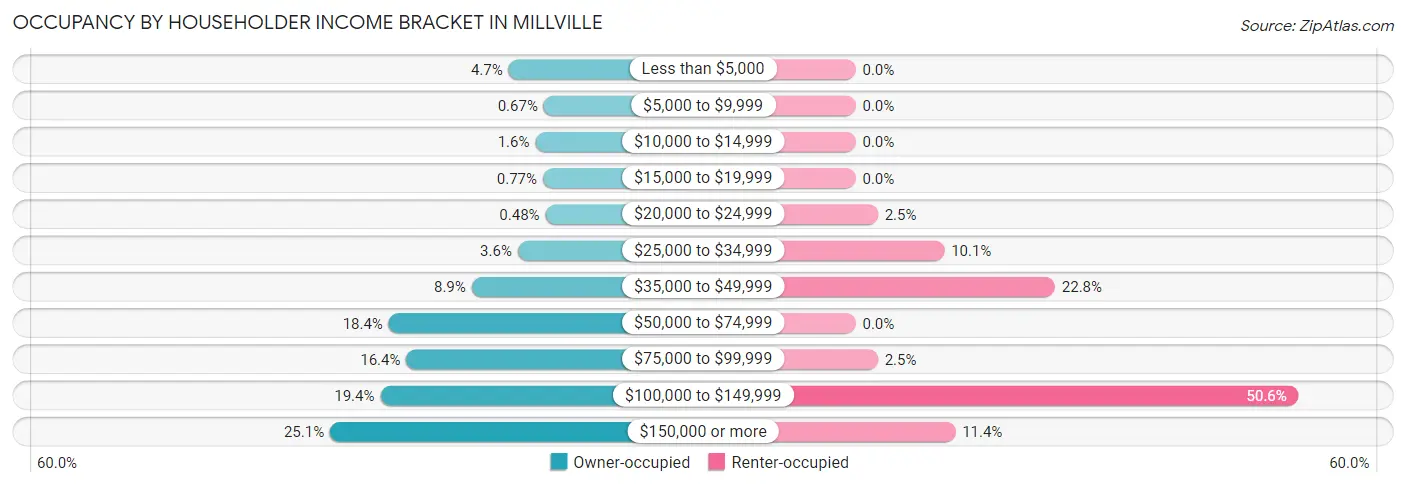
| Income Bracket | Owner-occupied | Renter-occupied |
| Less than $5,000 | 49 (4.7%) | 0 (0.0%) |
| $5,000 to $9,999 | 7 (0.7%) | 0 (0.0%) |
| $10,000 to $14,999 | 17 (1.6%) | 0 (0.0%) |
| $15,000 to $19,999 | 8 (0.8%) | 0 (0.0%) |
| $20,000 to $24,999 | 5 (0.5%) | 2 (2.5%) |
| $25,000 to $34,999 | 38 (3.6%) | 8 (10.1%) |
| $35,000 to $49,999 | 93 (8.9%) | 18 (22.8%) |
| $50,000 to $74,999 | 192 (18.4%) | 0 (0.0%) |
| $75,000 to $99,999 | 171 (16.4%) | 2 (2.5%) |
| $100,000 to $149,999 | 202 (19.4%) | 40 (50.6%) |
| $150,000 or more | 262 (25.1%) | 9 (11.4%) |
| Total | 1,044 (100.0%) | 79 (100.0%) |
Monthly Housing Cost Tiers in Millville
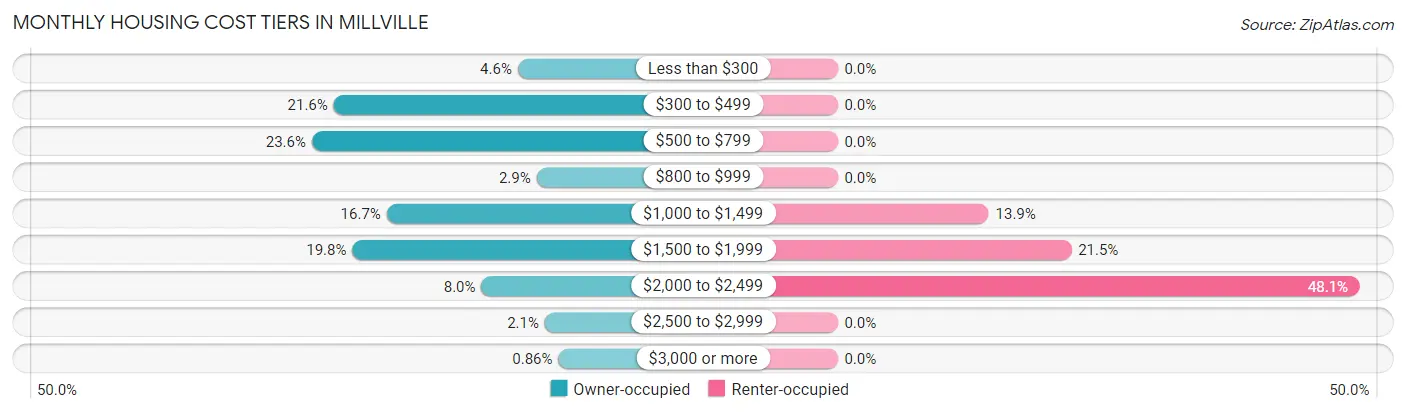
| Monthly Cost | Owner-occupied | Renter-occupied |
| Less than $300 | 48 (4.6%) | 0 (0.0%) |
| $300 to $499 | 225 (21.5%) | 0 (0.0%) |
| $500 to $799 | 246 (23.6%) | 0 (0.0%) |
| $800 to $999 | 30 (2.9%) | 0 (0.0%) |
| $1,000 to $1,499 | 174 (16.7%) | 11 (13.9%) |
| $1,500 to $1,999 | 207 (19.8%) | 17 (21.5%) |
| $2,000 to $2,499 | 83 (8.0%) | 38 (48.1%) |
| $2,500 to $2,999 | 22 (2.1%) | 0 (0.0%) |
| $3,000 or more | 9 (0.9%) | 0 (0.0%) |
| Total | 1,044 (100.0%) | 79 (100.0%) |
Physical Housing Characteristics in Millville
Housing Structures in Millville
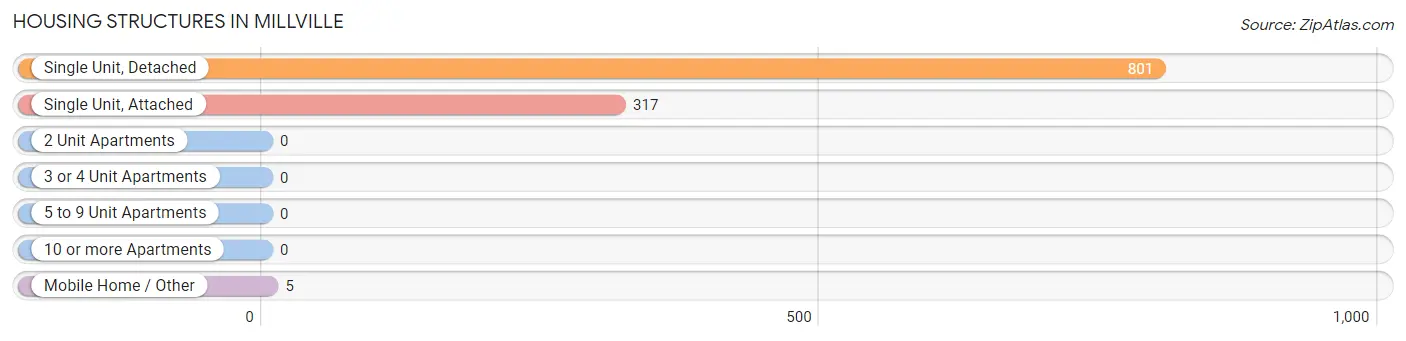
| Structure Type | # Housing Units | % Housing Units |
| Single Unit, Detached | 801 | 71.3% |
| Single Unit, Attached | 317 | 28.2% |
| 2 Unit Apartments | 0 | 0.0% |
| 3 or 4 Unit Apartments | 0 | 0.0% |
| 5 to 9 Unit Apartments | 0 | 0.0% |
| 10 or more Apartments | 0 | 0.0% |
| Mobile Home / Other | 5 | 0.4% |
| Total | 1,123 | 100.0% |
Housing Structures by Occupancy in Millville
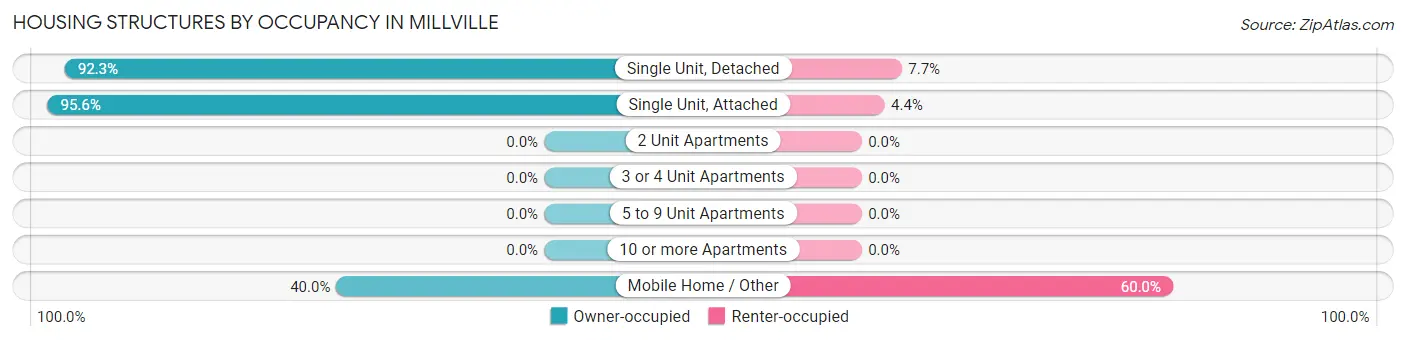
| Structure Type | Owner-occupied | Renter-occupied |
| Single Unit, Detached | 739 (92.3%) | 62 (7.7%) |
| Single Unit, Attached | 303 (95.6%) | 14 (4.4%) |
| 2 Unit Apartments | 0 (0.0%) | 0 (0.0%) |
| 3 or 4 Unit Apartments | 0 (0.0%) | 0 (0.0%) |
| 5 to 9 Unit Apartments | 0 (0.0%) | 0 (0.0%) |
| 10 or more Apartments | 0 (0.0%) | 0 (0.0%) |
| Mobile Home / Other | 2 (40.0%) | 3 (60.0%) |
| Total | 1,044 (93.0%) | 79 (7.0%) |
Housing Structures by Number of Rooms in Millville
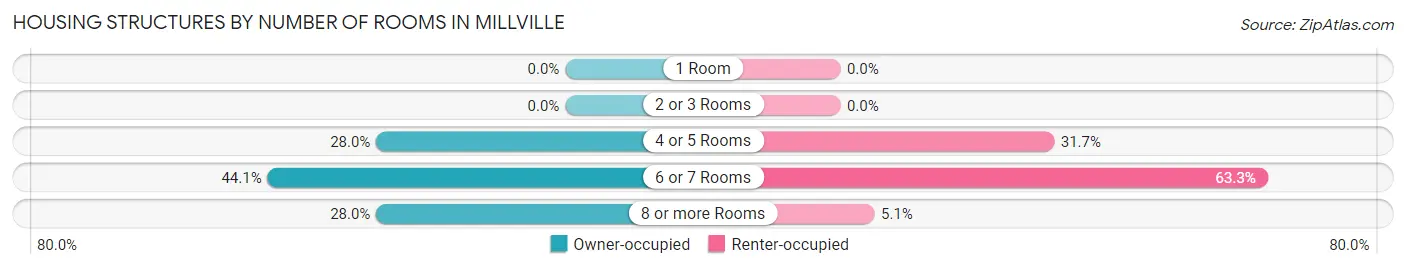
| Number of Rooms | Owner-occupied | Renter-occupied |
| 1 Room | 0 (0.0%) | 0 (0.0%) |
| 2 or 3 Rooms | 0 (0.0%) | 0 (0.0%) |
| 4 or 5 Rooms | 292 (28.0%) | 25 (31.7%) |
| 6 or 7 Rooms | 460 (44.1%) | 50 (63.3%) |
| 8 or more Rooms | 292 (28.0%) | 4 (5.1%) |
| Total | 1,044 (100.0%) | 79 (100.0%) |
Housing Structure by Heating Type in Millville
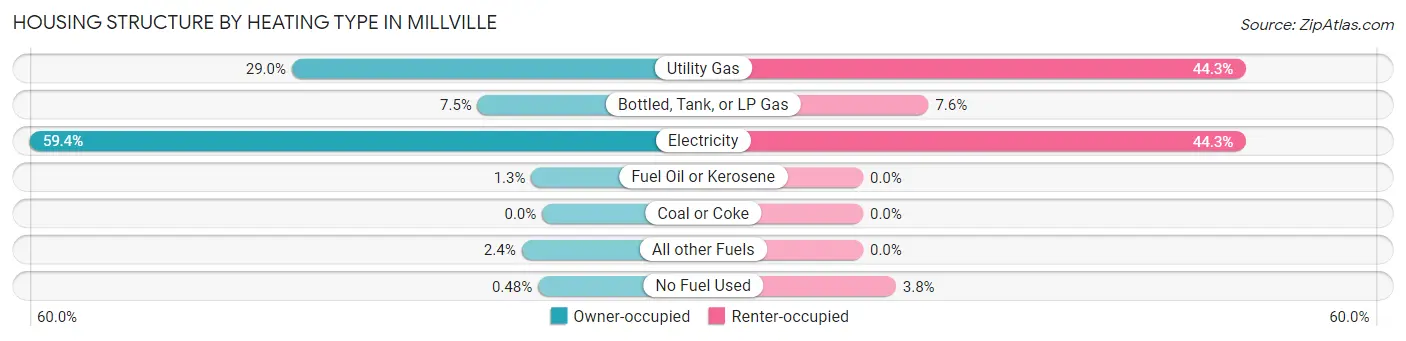
| Heating Type | Owner-occupied | Renter-occupied |
| Utility Gas | 303 (29.0%) | 35 (44.3%) |
| Bottled, Tank, or LP Gas | 78 (7.5%) | 6 (7.6%) |
| Electricity | 620 (59.4%) | 35 (44.3%) |
| Fuel Oil or Kerosene | 13 (1.3%) | 0 (0.0%) |
| Coal or Coke | 0 (0.0%) | 0 (0.0%) |
| All other Fuels | 25 (2.4%) | 0 (0.0%) |
| No Fuel Used | 5 (0.5%) | 3 (3.8%) |
| Total | 1,044 (100.0%) | 79 (100.0%) |
Household Vehicle Usage in Millville
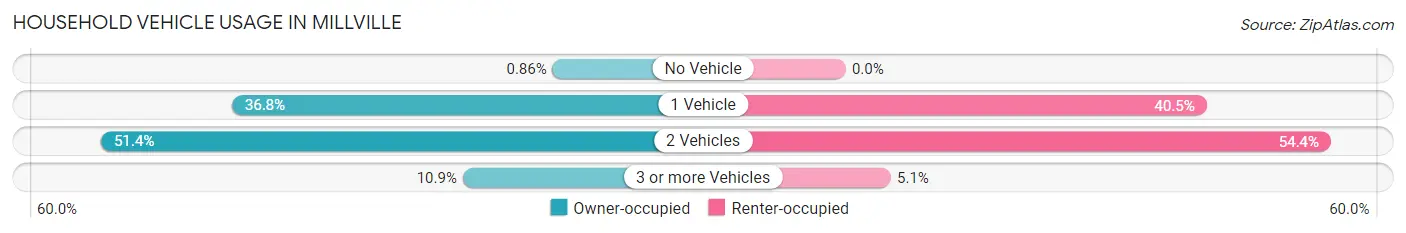
| Vehicles per Household | Owner-occupied | Renter-occupied |
| No Vehicle | 9 (0.9%) | 0 (0.0%) |
| 1 Vehicle | 384 (36.8%) | 32 (40.5%) |
| 2 Vehicles | 537 (51.4%) | 43 (54.4%) |
| 3 or more Vehicles | 114 (10.9%) | 4 (5.1%) |
| Total | 1,044 (100.0%) | 79 (100.0%) |
Real Estate & Mortgages in Millville
Real Estate and Mortgage Overview in Millville
| Characteristic | Without Mortgage | With Mortgage |
| Housing Units | 490 | 554 |
| Median Property Value | $441,600 | $420,900 |
| Median Household Income | $84,167 | $133 |
| Monthly Housing Costs | $505 | $9 |
| Real Estate Taxes | $1,340 | $0 |
Property Value by Mortgage Status in Millville
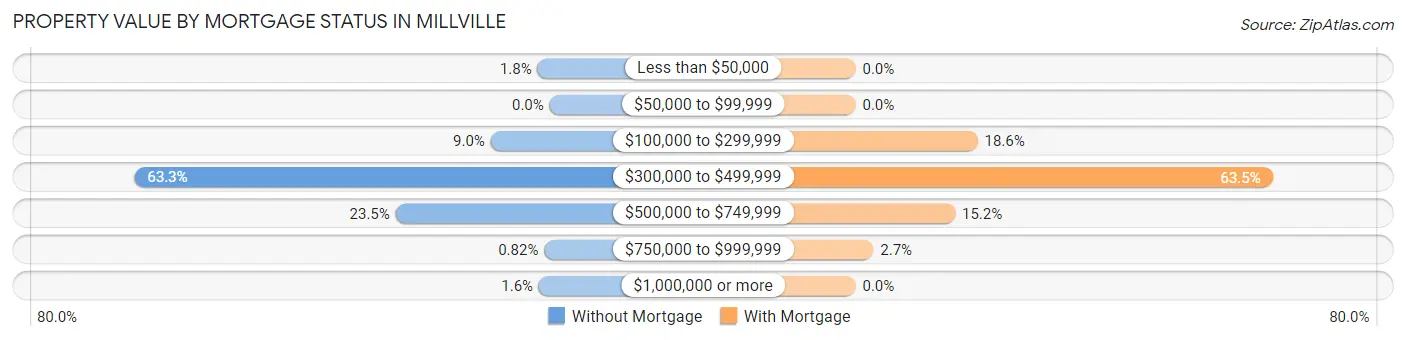
| Property Value | Without Mortgage | With Mortgage |
| Less than $50,000 | 9 (1.8%) | 0 (0.0%) |
| $50,000 to $99,999 | 0 (0.0%) | 0 (0.0%) |
| $100,000 to $299,999 | 44 (9.0%) | 103 (18.6%) |
| $300,000 to $499,999 | 310 (63.3%) | 352 (63.5%) |
| $500,000 to $749,999 | 115 (23.5%) | 84 (15.2%) |
| $750,000 to $999,999 | 4 (0.8%) | 15 (2.7%) |
| $1,000,000 or more | 8 (1.6%) | 0 (0.0%) |
| Total | 490 (100.0%) | 554 (100.0%) |
Household Income by Mortgage Status in Millville
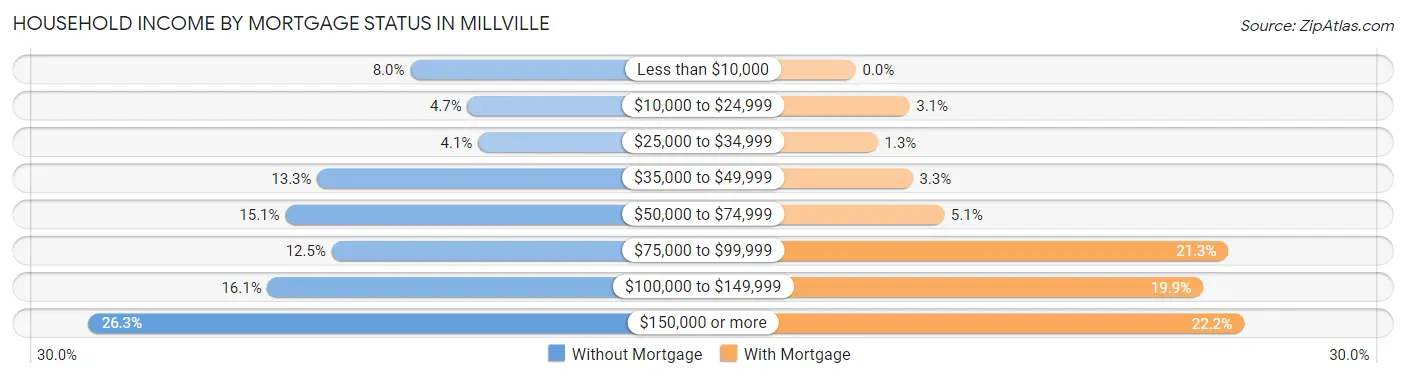
| Household Income | Without Mortgage | With Mortgage |
| Less than $10,000 | 39 (8.0%) | 0 (0.0%) |
| $10,000 to $24,999 | 23 (4.7%) | 17 (3.1%) |
| $25,000 to $34,999 | 20 (4.1%) | 7 (1.3%) |
| $35,000 to $49,999 | 65 (13.3%) | 18 (3.3%) |
| $50,000 to $74,999 | 74 (15.1%) | 28 (5.1%) |
| $75,000 to $99,999 | 61 (12.4%) | 118 (21.3%) |
| $100,000 to $149,999 | 79 (16.1%) | 110 (19.9%) |
| $150,000 or more | 129 (26.3%) | 123 (22.2%) |
| Total | 490 (100.0%) | 554 (100.0%) |
Property Value to Household Income Ratio in Millville
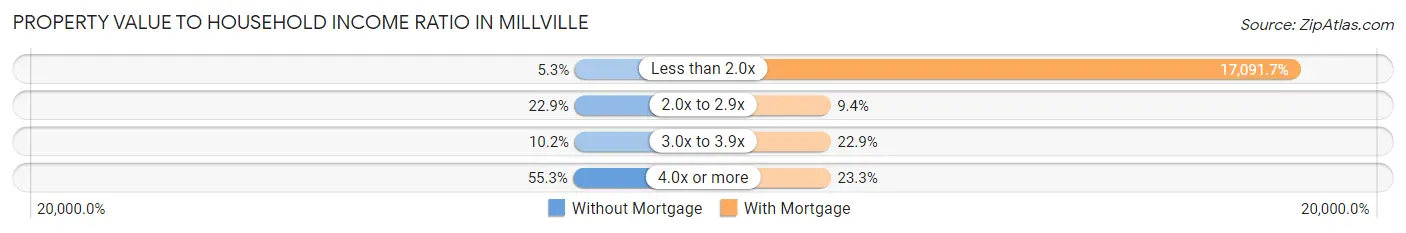
| Value-to-Income Ratio | Without Mortgage | With Mortgage |
| Less than 2.0x | 26 (5.3%) | 94,688 (17,091.7%) |
| 2.0x to 2.9x | 112 (22.9%) | 52 (9.4%) |
| 3.0x to 3.9x | 50 (10.2%) | 127 (22.9%) |
| 4.0x or more | 271 (55.3%) | 129 (23.3%) |
| Total | 490 (100.0%) | 554 (100.0%) |
Real Estate Taxes by Mortgage Status in Millville
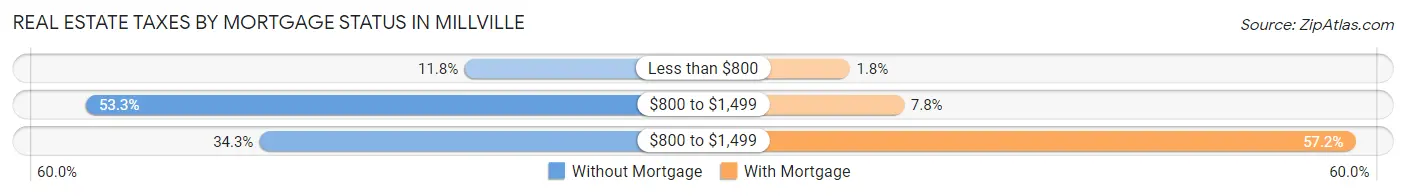
| Property Taxes | Without Mortgage | With Mortgage |
| Less than $800 | 58 (11.8%) | 10 (1.8%) |
| $800 to $1,499 | 261 (53.3%) | 43 (7.8%) |
| $800 to $1,499 | 168 (34.3%) | 317 (57.2%) |
| Total | 490 (100.0%) | 554 (100.0%) |
Health & Disability in Millville
Health Insurance Coverage by Age in Millville
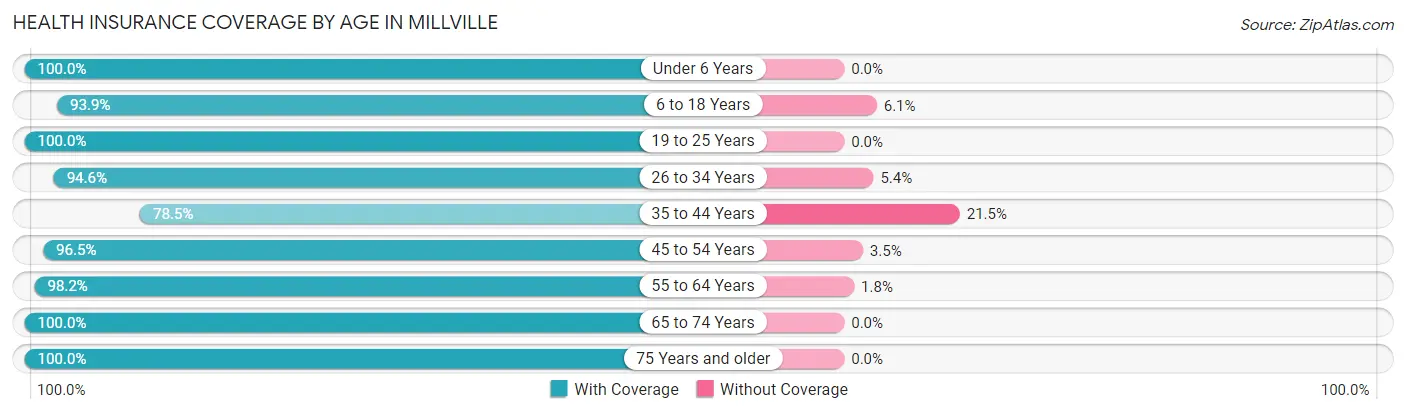
| Age Bracket | With Coverage | Without Coverage |
| Under 6 Years | 70 (100.0%) | 0 (0.0%) |
| 6 to 18 Years | 93 (93.9%) | 6 (6.1%) |
| 19 to 25 Years | 26 (100.0%) | 0 (0.0%) |
| 26 to 34 Years | 139 (94.6%) | 8 (5.4%) |
| 35 to 44 Years | 51 (78.5%) | 14 (21.5%) |
| 45 to 54 Years | 167 (96.5%) | 6 (3.5%) |
| 55 to 64 Years | 374 (98.2%) | 7 (1.8%) |
| 65 to 74 Years | 923 (100.0%) | 0 (0.0%) |
| 75 Years and older | 168 (100.0%) | 0 (0.0%) |
| Total | 2,011 (98.0%) | 41 (2.0%) |
Health Insurance Coverage by Citizenship Status in Millville
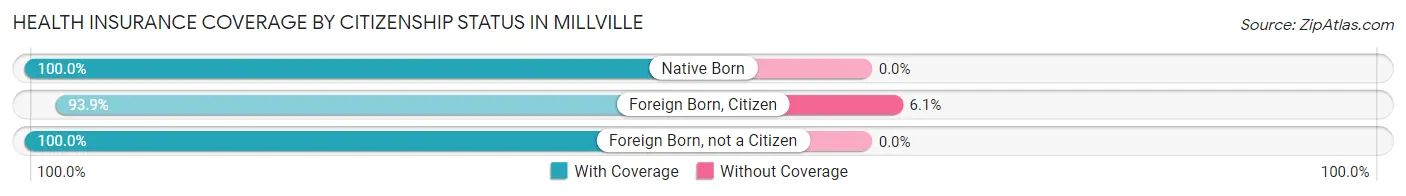
| Citizenship Status | With Coverage | Without Coverage |
| Native Born | 70 (100.0%) | 0 (0.0%) |
| Foreign Born, Citizen | 93 (93.9%) | 6 (6.1%) |
| Foreign Born, not a Citizen | 26 (100.0%) | 0 (0.0%) |
Health Insurance Coverage by Household Income in Millville
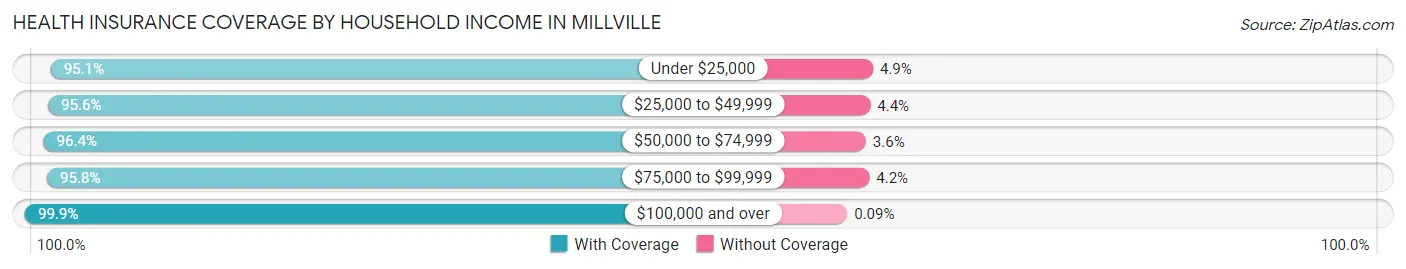
| Household Income | With Coverage | Without Coverage |
| Under $25,000 | 97 (95.1%) | 5 (4.9%) |
| $25,000 to $49,999 | 216 (95.6%) | 10 (4.4%) |
| $50,000 to $74,999 | 296 (96.4%) | 11 (3.6%) |
| $75,000 to $99,999 | 318 (95.8%) | 14 (4.2%) |
| $100,000 and over | 1,084 (99.9%) | 1 (0.1%) |
Public vs Private Health Insurance Coverage by Age in Millville
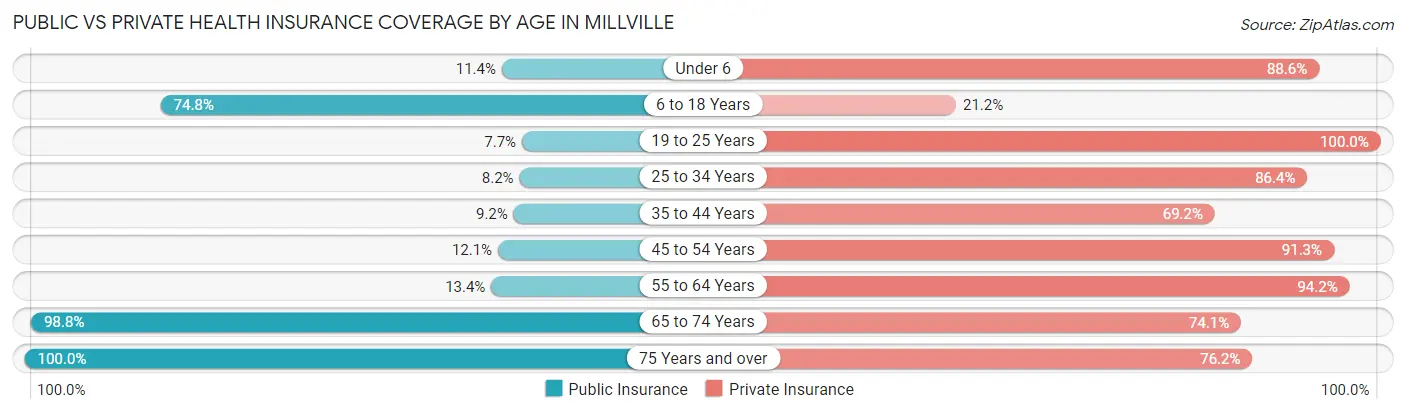
| Age Bracket | Public Insurance | Private Insurance |
| Under 6 | 8 (11.4%) | 62 (88.6%) |
| 6 to 18 Years | 74 (74.8%) | 21 (21.2%) |
| 19 to 25 Years | 2 (7.7%) | 26 (100.0%) |
| 25 to 34 Years | 12 (8.2%) | 127 (86.4%) |
| 35 to 44 Years | 6 (9.2%) | 45 (69.2%) |
| 45 to 54 Years | 21 (12.1%) | 158 (91.3%) |
| 55 to 64 Years | 51 (13.4%) | 359 (94.2%) |
| 65 to 74 Years | 912 (98.8%) | 684 (74.1%) |
| 75 Years and over | 168 (100.0%) | 128 (76.2%) |
| Total | 1,254 (61.1%) | 1,610 (78.5%) |
Disability Status by Sex by Age in Millville
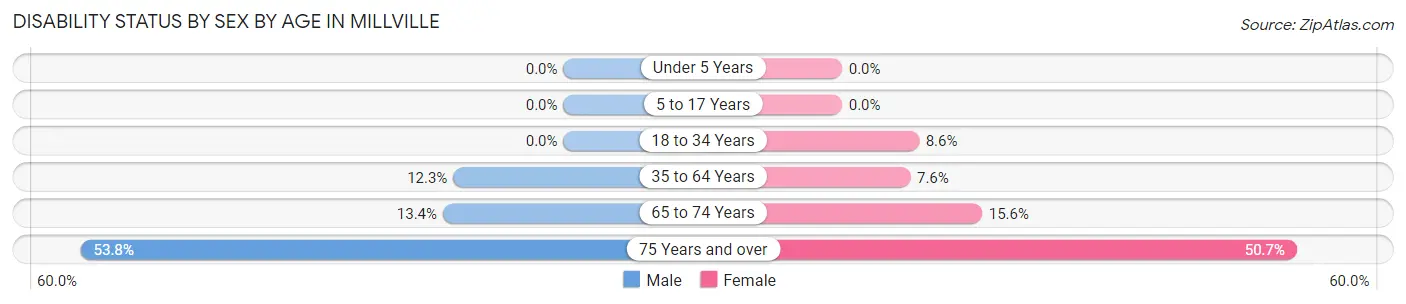
| Age Bracket | Male | Female |
| Under 5 Years | 0 (0.0%) | 0 (0.0%) |
| 5 to 17 Years | 0 (0.0%) | 0 (0.0%) |
| 18 to 34 Years | 0 (0.0%) | 9 (8.6%) |
| 35 to 64 Years | 34 (12.3%) | 26 (7.6%) |
| 65 to 74 Years | 49 (13.4%) | 87 (15.6%) |
| 75 Years and over | 50 (53.8%) | 38 (50.7%) |
Disability Class by Sex by Age in Millville
Disability Class: Hearing Difficulty
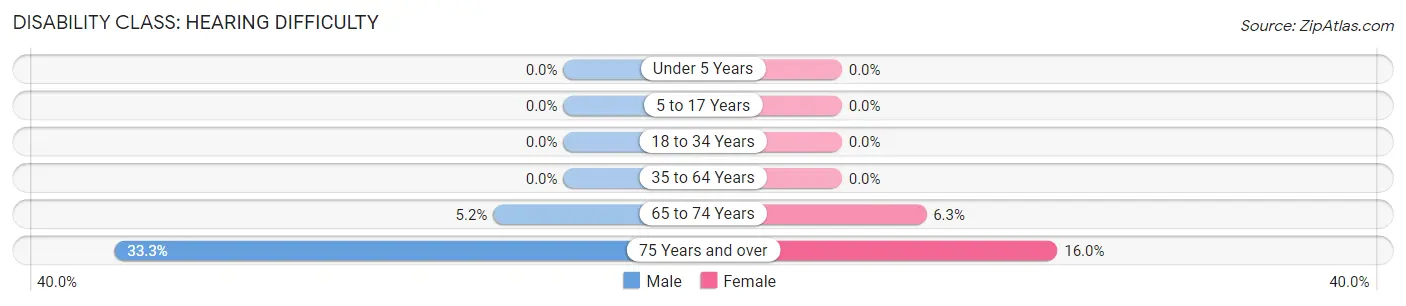
| Age Bracket | Male | Female |
| Under 5 Years | 0 (0.0%) | 0 (0.0%) |
| 5 to 17 Years | 0 (0.0%) | 0 (0.0%) |
| 18 to 34 Years | 0 (0.0%) | 0 (0.0%) |
| 35 to 64 Years | 0 (0.0%) | 0 (0.0%) |
| 65 to 74 Years | 19 (5.2%) | 35 (6.3%) |
| 75 Years and over | 31 (33.3%) | 12 (16.0%) |
Disability Class: Vision Difficulty
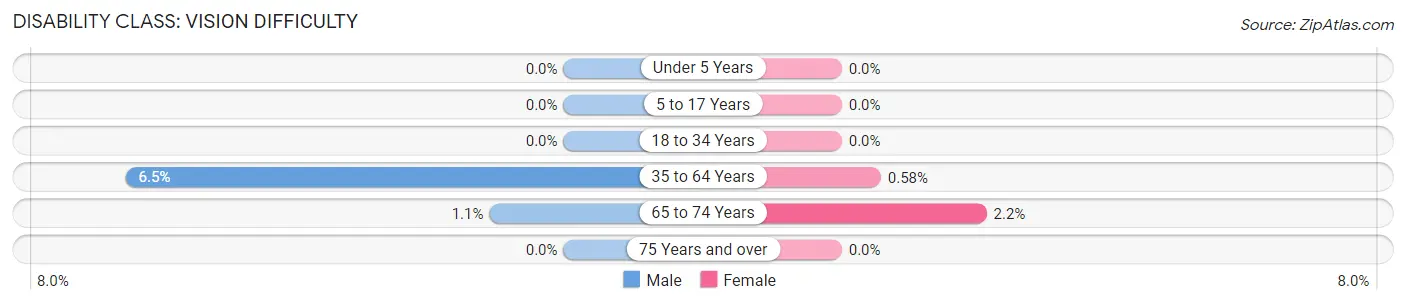
| Age Bracket | Male | Female |
| Under 5 Years | 0 (0.0%) | 0 (0.0%) |
| 5 to 17 Years | 0 (0.0%) | 0 (0.0%) |
| 18 to 34 Years | 0 (0.0%) | 0 (0.0%) |
| 35 to 64 Years | 18 (6.5%) | 2 (0.6%) |
| 65 to 74 Years | 4 (1.1%) | 12 (2.1%) |
| 75 Years and over | 0 (0.0%) | 0 (0.0%) |
Disability Class: Cognitive Difficulty
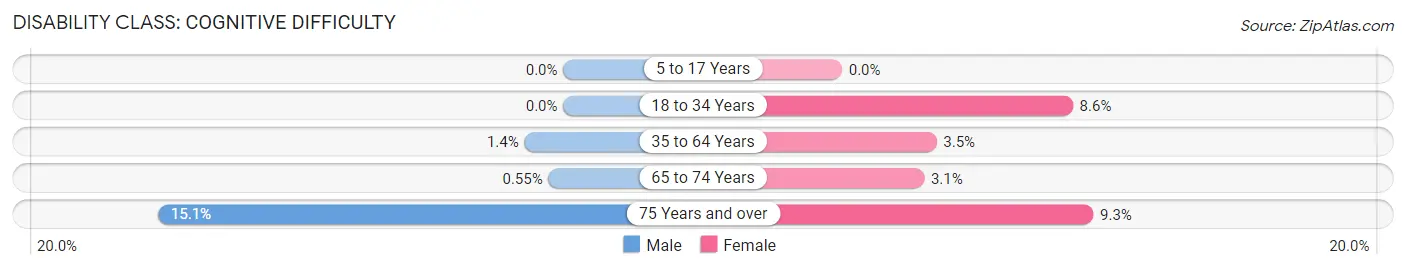
| Age Bracket | Male | Female |
| 5 to 17 Years | 0 (0.0%) | 0 (0.0%) |
| 18 to 34 Years | 0 (0.0%) | 9 (8.6%) |
| 35 to 64 Years | 4 (1.4%) | 12 (3.5%) |
| 65 to 74 Years | 2 (0.5%) | 17 (3.0%) |
| 75 Years and over | 14 (15.0%) | 7 (9.3%) |
Disability Class: Ambulatory Difficulty
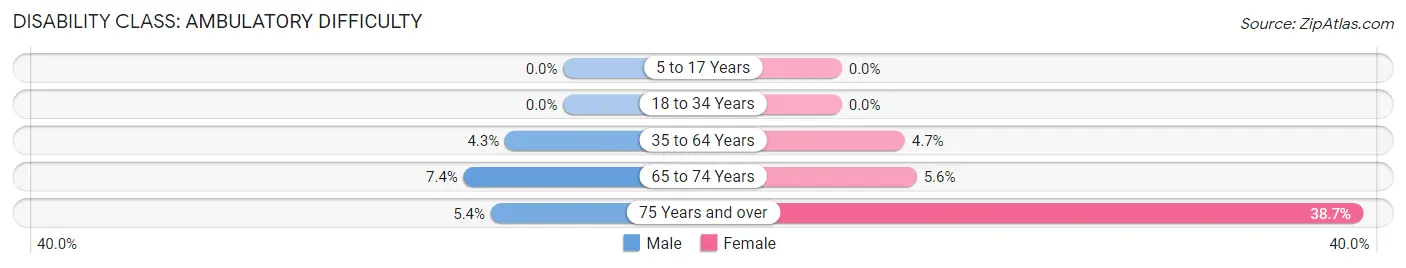
| Age Bracket | Male | Female |
| 5 to 17 Years | 0 (0.0%) | 0 (0.0%) |
| 18 to 34 Years | 0 (0.0%) | 0 (0.0%) |
| 35 to 64 Years | 12 (4.3%) | 16 (4.7%) |
| 65 to 74 Years | 27 (7.4%) | 31 (5.6%) |
| 75 Years and over | 5 (5.4%) | 29 (38.7%) |
Disability Class: Self-Care Difficulty
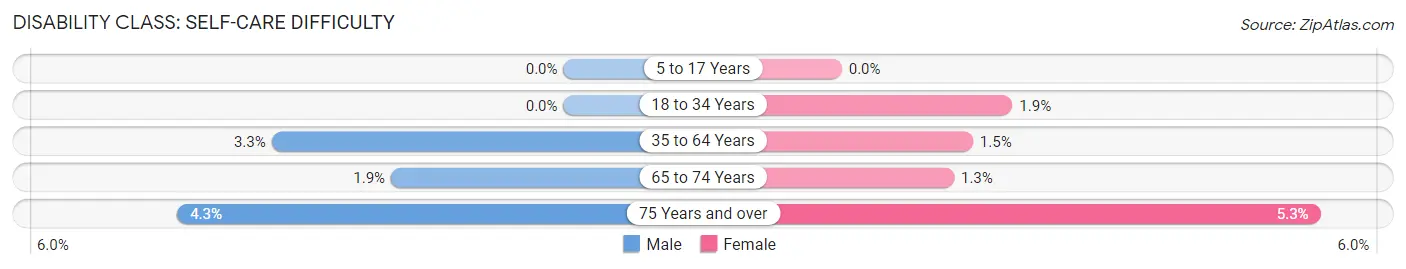
| Age Bracket | Male | Female |
| 5 to 17 Years | 0 (0.0%) | 0 (0.0%) |
| 18 to 34 Years | 0 (0.0%) | 2 (1.9%) |
| 35 to 64 Years | 9 (3.3%) | 5 (1.5%) |
| 65 to 74 Years | 7 (1.9%) | 7 (1.3%) |
| 75 Years and over | 4 (4.3%) | 4 (5.3%) |
Technology Access in Millville
Computing Device Access in Millville
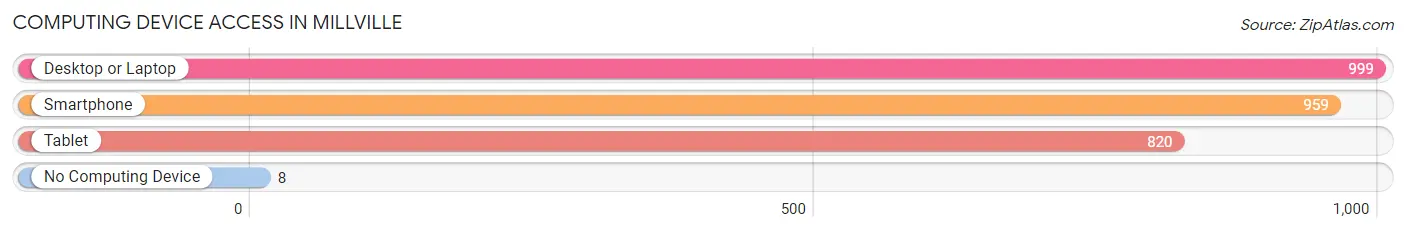
| Device Type | # Households | % Households |
| Desktop or Laptop | 999 | 89.0% |
| Smartphone | 959 | 85.4% |
| Tablet | 820 | 73.0% |
| No Computing Device | 8 | 0.7% |
| Total | 1,123 | 100.0% |
Internet Access in Millville
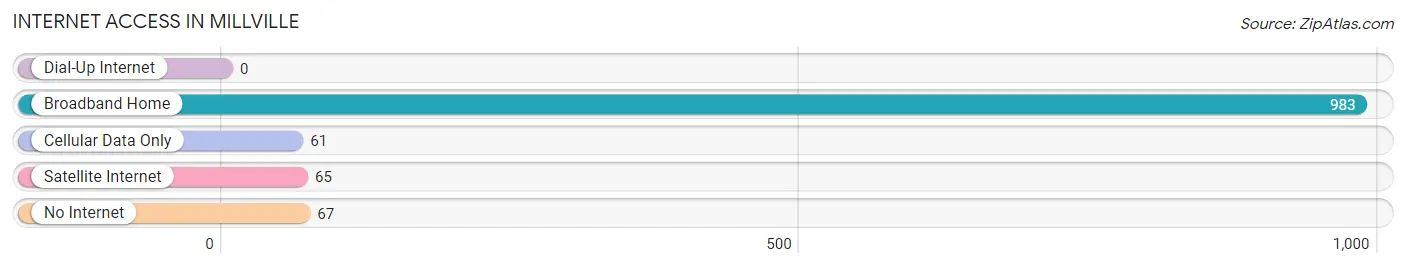
| Internet Type | # Households | % Households |
| Dial-Up Internet | 0 | 0.0% |
| Broadband Home | 983 | 87.5% |
| Cellular Data Only | 61 | 5.4% |
| Satellite Internet | 65 | 5.8% |
| No Internet | 67 | 6.0% |
| Total | 1,123 | 100.0% |
Millville Summary
Millville is a small town located in Sussex County, Delaware. It is situated on the Indian River, about 10 miles south of the state capital, Dover. The town has a population of approximately 1,500 people and is part of the larger Salisbury, Maryland-Delaware Metropolitan Statistical Area.
History
Millville was first settled in the late 1700s by a group of Quakers from Pennsylvania. The town was originally known as “Milltown” and was named after the mill that was built on the Indian River. The mill was used to grind grain and was a major source of income for the town.
In 1845, the town was officially incorporated as Millville. The town grew rapidly in the late 19th century, with the construction of a railroad line and the establishment of a post office. The town also became a popular summer resort destination, with many wealthy families from Philadelphia and Baltimore building large homes in the area.
Geography
Millville is located in the southeastern corner of Sussex County, Delaware. It is situated on the Indian River, about 10 miles south of the state capital, Dover. The town is bordered by the towns of Dagsboro, Frankford, and Selbyville.
The town has a total area of 1.3 square miles, all of which is land. The town is located in a flat, coastal plain region, with the Indian River to the east and the Atlantic Ocean to the south. The town is located in a humid subtropical climate zone, with hot, humid summers and mild winters.
Economy
Millville’s economy is largely based on tourism and agriculture. The town is home to several popular tourist attractions, including the Indian River Marina, the Millville Wildlife Area, and the Millville Boardwalk. The town also has several small businesses, including restaurants, shops, and a few small manufacturing companies.
Agriculture is also an important part of the local economy. The town is home to several large farms, which produce a variety of crops, including corn, soybeans, and wheat.
Demographics
As of the 2010 census, Millville had a population of 1,500 people. The racial makeup of the town was 94.7% White, 2.7% African American, 0.7% Native American, 0.3% Asian, and 1.7% from other races. The median household income was $45,000, and the median family income was $50,000.
Millville is a small, rural town with a close-knit community. The town is home to several churches, a library, and a few small businesses. The town is also home to a number of parks and recreational areas, including the Millville Boardwalk and the Indian River Marina.
Common Questions
What is Per Capita Income in Millville?
Per Capita income in Millville is $59,054.
What is the Median Family Income in Millville?
Median Family Income in Millville is $120,662.
What is the Median Household income in Millville?
Median Household Income in Millville is $92,961.
What is Income or Wage Gap in Millville?
Income or Wage Gap in Millville is 40.2%.
Women in Millville earn 59.8 cents for every dollar earned by a man.
What is Inequality or Gini Index in Millville?
Inequality or Gini Index in Millville is 0.38.
What is the Total Population of Millville?
Total Population of Millville is 2,052.
What is the Total Male Population of Millville?
Total Male Population of Millville is 872.
What is the Total Female Population of Millville?
Total Female Population of Millville is 1,180.
What is the Ratio of Males per 100 Females in Millville?
There are 73.90 Males per 100 Females in Millville.
What is the Ratio of Females per 100 Males in Millville?
There are 135.32 Females per 100 Males in Millville.
What is the Median Population Age in Millville?
Median Population Age in Millville is 65.5 Years.
What is the Average Family Size in Millville
Average Family Size in Millville is 2.2 People.
What is the Average Household Size in Millville
Average Household Size in Millville is 1.8 People.
How Large is the Labor Force in Millville?
There are 681 People in the Labor Forcein in Millville.
What is the Percentage of People in the Labor Force in Millville?
35.1% of People are in the Labor Force in Millville.
What is the Unemployment Rate in Millville?
Unemployment Rate in Millville is 2.3%.