St Georges, DE Map & Demographics
St Georges Map
St Georges Overview
$59,574
PER CAPITA INCOME
$200,797
AVG FAMILY INCOME
$161,346
AVG HOUSEHOLD INCOME
33.0%
WAGE / INCOME GAP [ % ]
67.0¢/ $1
WAGE / INCOME GAP [ $ ]
0.38
INEQUALITY / GINI INDEX
1,304
TOTAL POPULATION
678
MALE POPULATION
626
FEMALE POPULATION
108.31
MALES / 100 FEMALES
92.33
FEMALES / 100 MALES
46.7
MEDIAN AGE
3.2
AVG FAMILY SIZE
2.8
AVG HOUSEHOLD SIZE
940
LABOR FORCE [ PEOPLE ]
83.0%
PERCENT IN LABOR FORCE
3.0%
UNEMPLOYMENT RATE
Income in St Georges
Income Overview in St Georges
Per Capita Income in St Georges is $59,574, while median incomes of families and households are $200,797 and $161,346 respectively.
| Characteristic | Number | Measure |
| Per Capita Income | 1,304 | $59,574 |
| Median Family Income | 381 | $200,797 |
| Mean Family Income | 381 | $192,857 |
| Median Household Income | 460 | $161,346 |
| Mean Household Income | 460 | $167,848 |
| Income Deficit | 381 | $0 |
| Wage / Income Gap (%) | 1,304 | 32.97% |
| Wage / Income Gap ($) | 1,304 | 67.03¢ per $1 |
| Gini / Inequality Index | 1,304 | 0.38 |
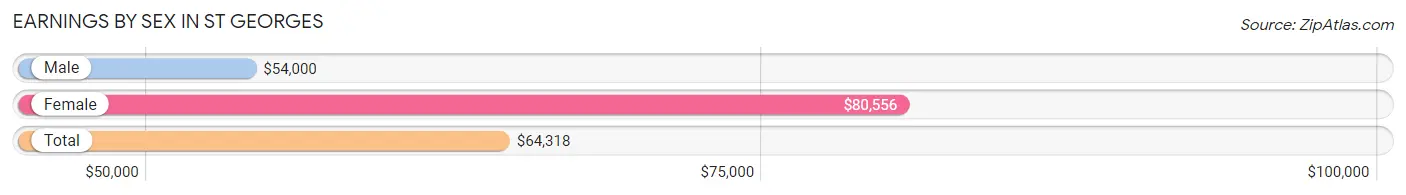
Earnings by Sex in St Georges
Average Earnings in St Georges are $64,318, $54,000 for men and $80,556 for women, a difference of 33.0%.
| Sex | Number | Average Earnings |
| Male | 510 (55.0%) | $54,000 |
| Female | 418 (45.0%) | $80,556 |
| Total | 928 (100.0%) | $64,318 |
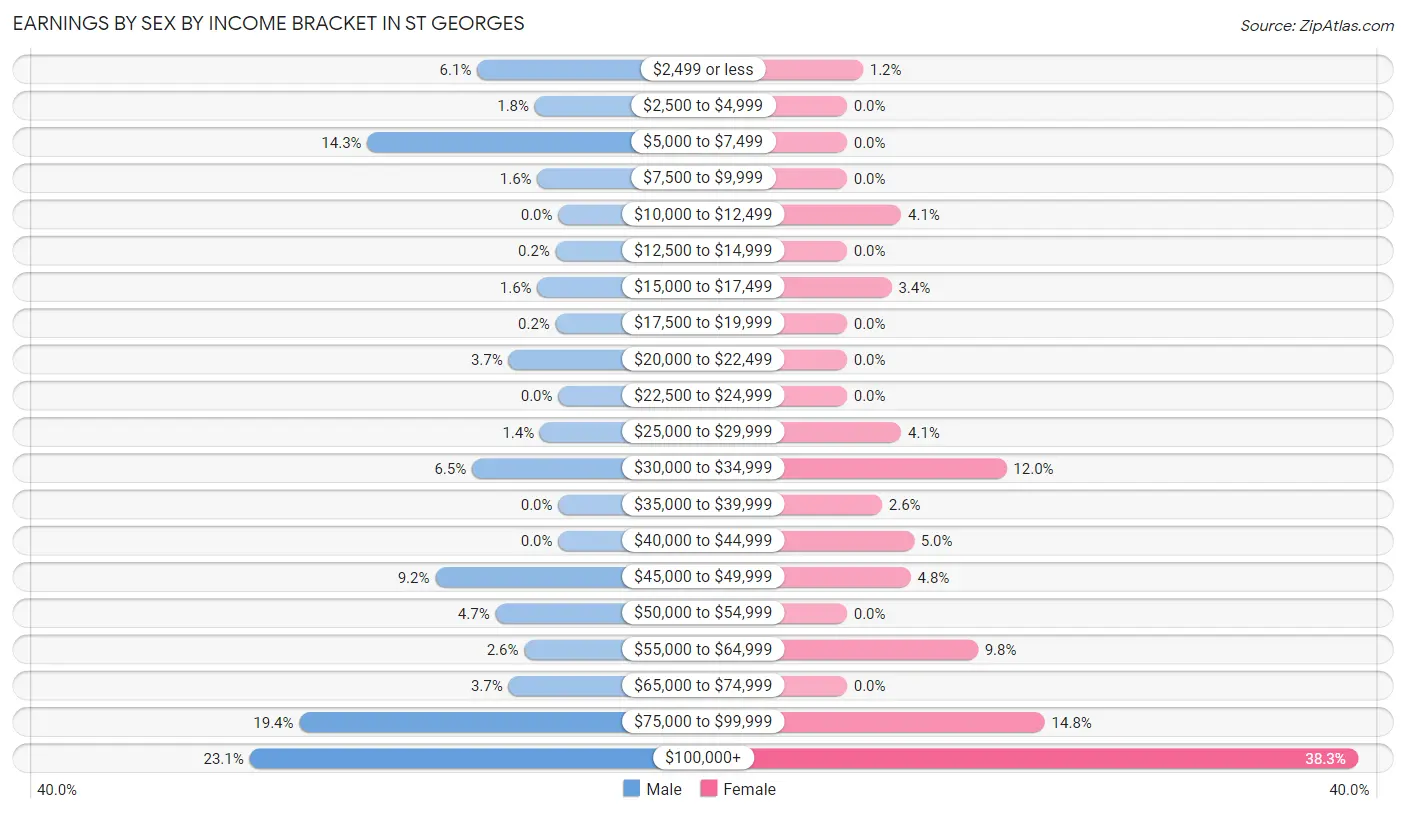
Earnings by Sex by Income Bracket in St Georges
The most common earnings brackets in St Georges are $100,000+ for men (118 | 23.1%) and $100,000+ for women (160 | 38.3%).
| Income | Male | Female |
| $2,499 or less | 31 (6.1%) | 5 (1.2%) |
| $2,500 to $4,999 | 9 (1.8%) | 0 (0.0%) |
| $5,000 to $7,499 | 73 (14.3%) | 0 (0.0%) |
| $7,500 to $9,999 | 8 (1.6%) | 0 (0.0%) |
| $10,000 to $12,499 | 0 (0.0%) | 17 (4.1%) |
| $12,500 to $14,999 | 1 (0.2%) | 0 (0.0%) |
| $15,000 to $17,499 | 8 (1.6%) | 14 (3.4%) |
| $17,500 to $19,999 | 1 (0.2%) | 0 (0.0%) |
| $20,000 to $22,499 | 19 (3.7%) | 0 (0.0%) |
| $22,500 to $24,999 | 0 (0.0%) | 0 (0.0%) |
| $25,000 to $29,999 | 7 (1.4%) | 17 (4.1%) |
| $30,000 to $34,999 | 33 (6.5%) | 50 (12.0%) |
| $35,000 to $39,999 | 0 (0.0%) | 11 (2.6%) |
| $40,000 to $44,999 | 0 (0.0%) | 21 (5.0%) |
| $45,000 to $49,999 | 47 (9.2%) | 20 (4.8%) |
| $50,000 to $54,999 | 24 (4.7%) | 0 (0.0%) |
| $55,000 to $64,999 | 13 (2.5%) | 41 (9.8%) |
| $65,000 to $74,999 | 19 (3.7%) | 0 (0.0%) |
| $75,000 to $99,999 | 99 (19.4%) | 62 (14.8%) |
| $100,000+ | 118 (23.1%) | 160 (38.3%) |
| Total | 510 (100.0%) | 418 (100.0%) |
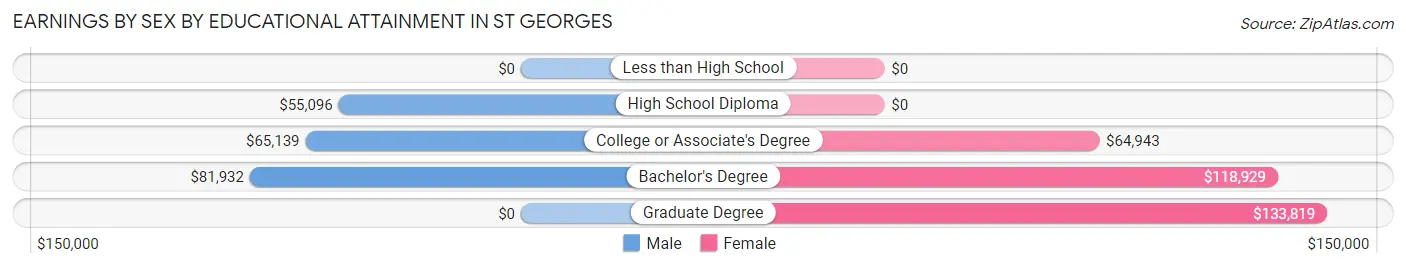
Earnings by Sex by Educational Attainment in St Georges
Average earnings in St Georges are $75,307 for men and $94,000 for women, a difference of 19.9%. Men with an educational attainment of bachelor's degree enjoy the highest average annual earnings of $81,932, while those with high school diploma education earn the least with $55,096. Women with an educational attainment of graduate degree earn the most with the average annual earnings of $133,819, while those with college or associate's degree education have the smallest earnings of $64,943.
| Educational Attainment | Male Income | Female Income |
| Less than High School | - | - |
| High School Diploma | $55,096 | $0 |
| College or Associate's Degree | $65,139 | $64,943 |
| Bachelor's Degree | $81,932 | $118,929 |
| Graduate Degree | - | - |
| Total | $75,307 | $94,000 |
Family Income in St Georges
Family Income Brackets in St Georges
According to the St Georges family income data, there are 209 families falling into the $200,000+ income range, which is the most common income bracket and makes up 54.9% of all families.
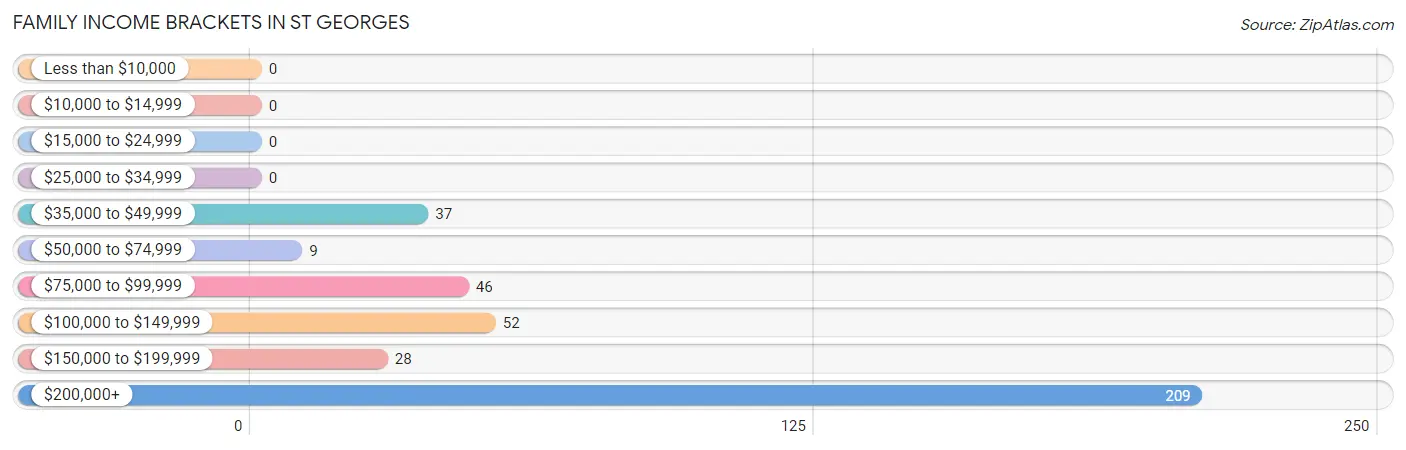
| Income Bracket | # Families | % Families |
| Less than $10,000 | 0 | 0.0% |
| $10,000 to $14,999 | 0 | 0.0% |
| $15,000 to $24,999 | 0 | 0.0% |
| $25,000 to $34,999 | 0 | 0.0% |
| $35,000 to $49,999 | 37 | 9.7% |
| $50,000 to $74,999 | 9 | 2.4% |
| $75,000 to $99,999 | 46 | 12.1% |
| $100,000 to $149,999 | 52 | 13.6% |
| $150,000 to $199,999 | 28 | 7.3% |
| $200,000+ | 209 | 54.9% |
Family Income by Famaliy Size in St Georges
3-person families (99 | 26.0%) account for the highest median family income in St Georges with $222,695 per family, while 3-person families (99 | 26.0%) have the highest median income of $74,232 per family member.
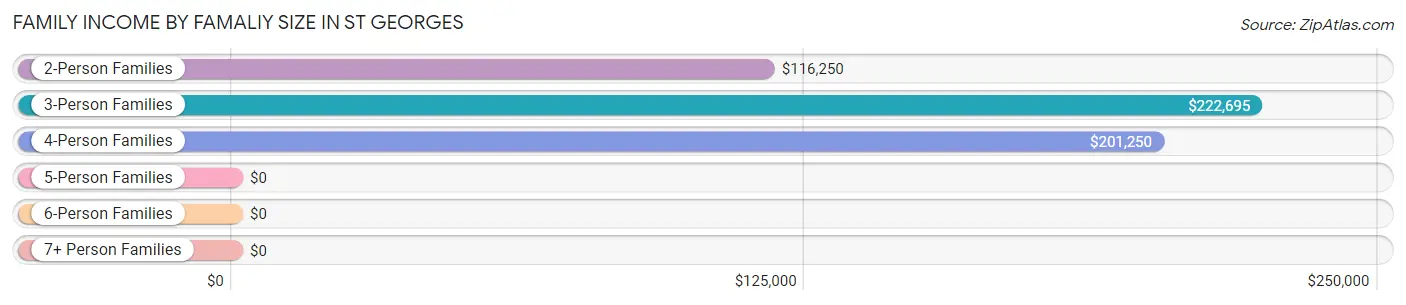
| Income Bracket | # Families | Median Income |
| 2-Person Families | 131 (34.4%) | $116,250 |
| 3-Person Families | 99 (26.0%) | $222,695 |
| 4-Person Families | 134 (35.2%) | $201,250 |
| 5-Person Families | 17 (4.5%) | $0 |
| 6-Person Families | 0 (0.0%) | $0 |
| 7+ Person Families | 0 (0.0%) | $0 |
| Total | 381 (100.0%) | $200,797 |
Family Income by Number of Earners in St Georges
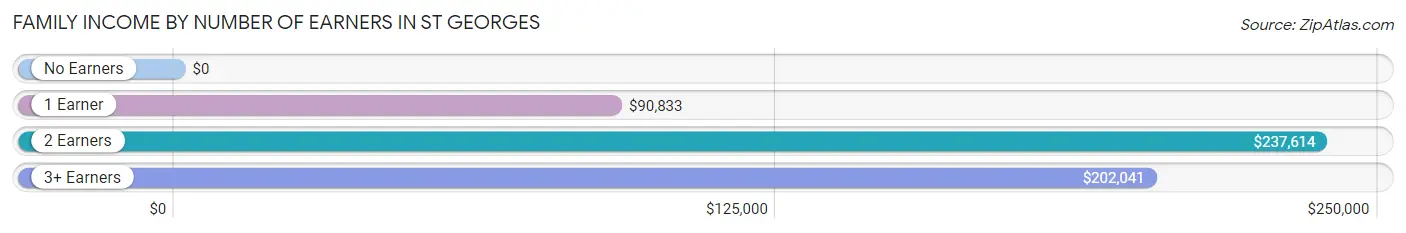
| Number of Earners | # Families | Median Income |
| No Earners | 0 (0.0%) | $0 |
| 1 Earner | 62 (16.3%) | $90,833 |
| 2 Earners | 165 (43.3%) | $237,614 |
| 3+ Earners | 154 (40.4%) | $202,041 |
| Total | 381 (100.0%) | $200,797 |
Household Income in St Georges
Household Income Brackets in St Georges
With 209 households falling in the category, the $200,000+ income range is the most frequent in St Georges, accounting for 45.4% of all households.
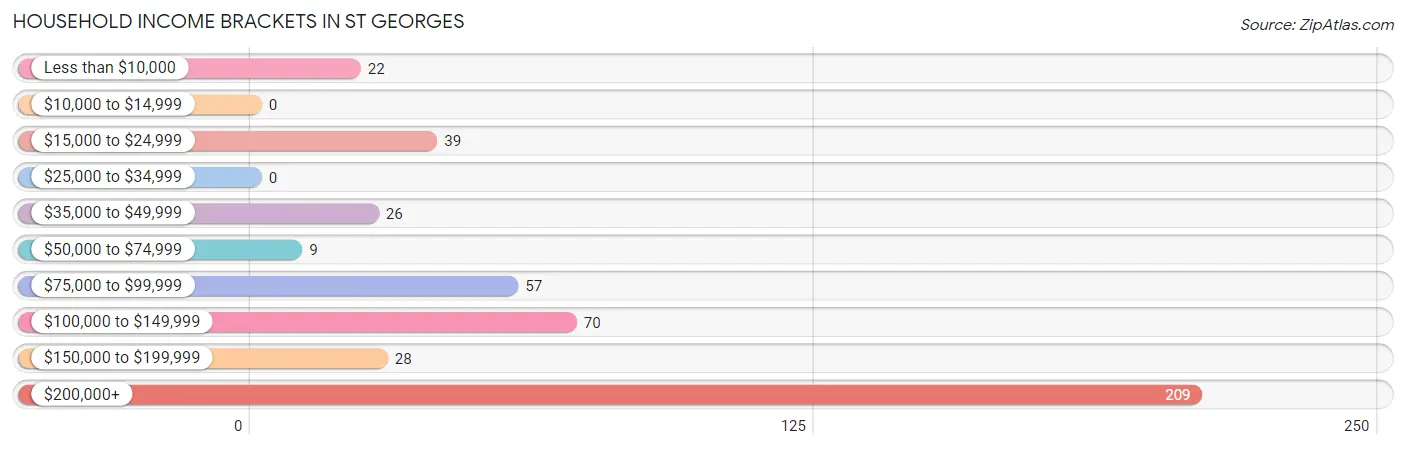
| Income Bracket | # Households | % Households |
| Less than $10,000 | 22 | 4.8% |
| $10,000 to $14,999 | 0 | 0.0% |
| $15,000 to $24,999 | 39 | 8.5% |
| $25,000 to $34,999 | 0 | 0.0% |
| $35,000 to $49,999 | 26 | 5.7% |
| $50,000 to $74,999 | 9 | 2.0% |
| $75,000 to $99,999 | 57 | 12.4% |
| $100,000 to $149,999 | 70 | 15.2% |
| $150,000 to $199,999 | 28 | 6.1% |
| $200,000+ | 209 | 45.4% |
Household Income by Householder Age in St Georges
The median household income in St Georges is $161,346, with the highest median household income of $200,816 found in the 45 to 64 years age bracket for the primary householder. A total of 326 households (70.9%) fall into this category.
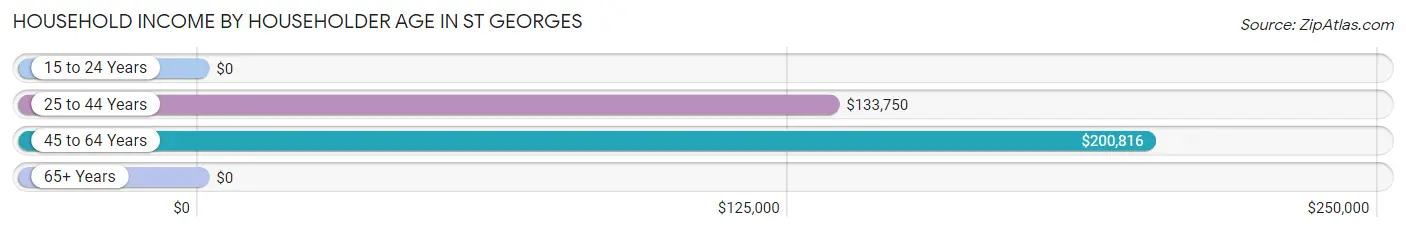
| Income Bracket | # Households | Median Income |
| 15 to 24 Years | 0 (0.0%) | $0 |
| 25 to 44 Years | 78 (17.0%) | $133,750 |
| 45 to 64 Years | 326 (70.9%) | $200,816 |
| 65+ Years | 56 (12.2%) | $0 |
| Total | 460 (100.0%) | $161,346 |
Poverty in St Georges
Income Below Poverty by Sex and Age in St Georges
With 3.8% poverty level for males and 0.3% for females among the residents of St Georges, 55 to 64 year old males and 35 to 44 year old females are the most vulnerable to poverty, with 22 males (11.8%) and 2 females (3.2%) in their respective age groups living below the poverty level.
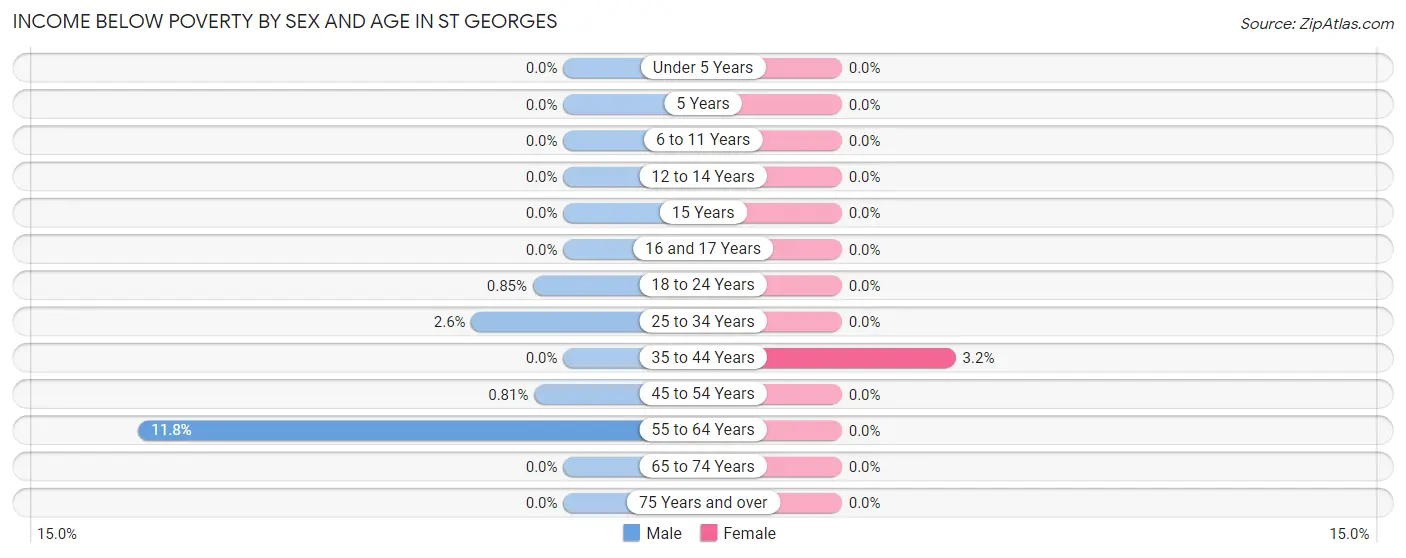
| Age Bracket | Male | Female |
| Under 5 Years | 0 (0.0%) | 0 (0.0%) |
| 5 Years | 0 (0.0%) | 0 (0.0%) |
| 6 to 11 Years | 0 (0.0%) | 0 (0.0%) |
| 12 to 14 Years | 0 (0.0%) | 0 (0.0%) |
| 15 Years | 0 (0.0%) | 0 (0.0%) |
| 16 and 17 Years | 0 (0.0%) | 0 (0.0%) |
| 18 to 24 Years | 1 (0.9%) | 0 (0.0%) |
| 25 to 34 Years | 2 (2.6%) | 0 (0.0%) |
| 35 to 44 Years | 0 (0.0%) | 2 (3.2%) |
| 45 to 54 Years | 1 (0.8%) | 0 (0.0%) |
| 55 to 64 Years | 22 (11.8%) | 0 (0.0%) |
| 65 to 74 Years | 0 (0.0%) | 0 (0.0%) |
| 75 Years and over | 0 (0.0%) | 0 (0.0%) |
| Total | 26 (3.8%) | 2 (0.3%) |
Income Above Poverty by Sex and Age in St Georges
According to the poverty statistics in St Georges, males aged under 5 years and females aged under 5 years are the age groups that are most secure financially, with 100.0% of males and 100.0% of females in these age groups living above the poverty line.
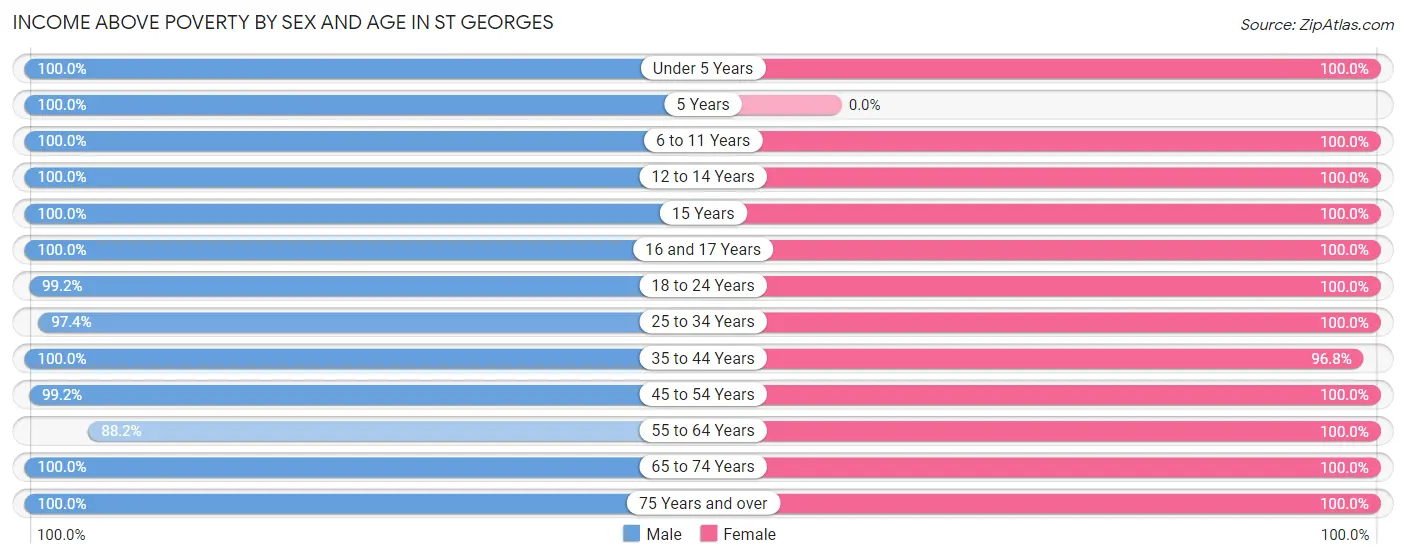
| Age Bracket | Male | Female |
| Under 5 Years | 10 (100.0%) | 22 (100.0%) |
| 5 Years | 13 (100.0%) | 0 (0.0%) |
| 6 to 11 Years | 46 (100.0%) | 11 (100.0%) |
| 12 to 14 Years | 22 (100.0%) | 10 (100.0%) |
| 15 Years | 10 (100.0%) | 28 (100.0%) |
| 16 and 17 Years | 1 (100.0%) | 10 (100.0%) |
| 18 to 24 Years | 117 (99.2%) | 82 (100.0%) |
| 25 to 34 Years | 76 (97.4%) | 48 (100.0%) |
| 35 to 44 Years | 53 (100.0%) | 61 (96.8%) |
| 45 to 54 Years | 123 (99.2%) | 194 (100.0%) |
| 55 to 64 Years | 164 (88.2%) | 85 (100.0%) |
| 65 to 74 Years | 8 (100.0%) | 26 (100.0%) |
| 75 Years and over | 9 (100.0%) | 47 (100.0%) |
| Total | 652 (96.2%) | 624 (99.7%) |
Income Below Poverty Among Married-Couple Families in St Georges
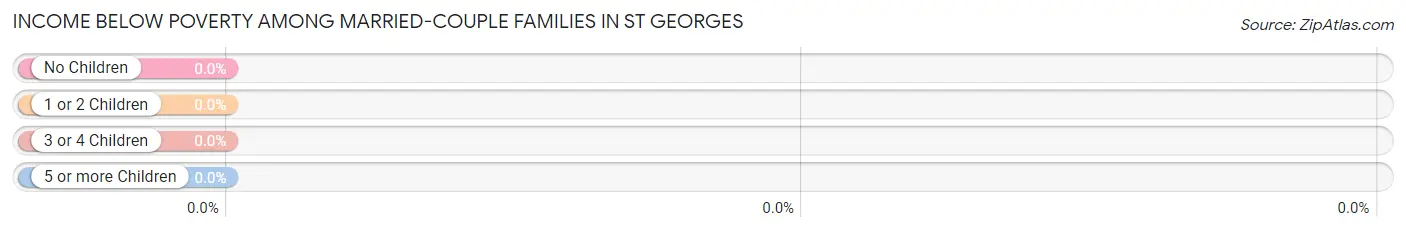
| Children | Above Poverty | Below Poverty |
| No Children | 221 (100.0%) | 0 (0.0%) |
| 1 or 2 Children | 103 (100.0%) | 0 (0.0%) |
| 3 or 4 Children | 10 (100.0%) | 0 (0.0%) |
| 5 or more Children | 0 (0.0%) | 0 (0.0%) |
| Total | 334 (100.0%) | 0 (0.0%) |
Income Below Poverty Among Single-Parent Households in St Georges
| Children | Single Father | Single Mother |
| No Children | 0 (0.0%) | 0 (0.0%) |
| 1 or 2 Children | 0 (0.0%) | 0 (0.0%) |
| 3 or 4 Children | 0 (0.0%) | 0 (0.0%) |
| 5 or more Children | 0 (0.0%) | 0 (0.0%) |
| Total | 0 (0.0%) | 0 (0.0%) |
Income Below Poverty Among Married-Couple vs Single-Parent Households in St Georges
| Children | Married-Couple Families | Single-Parent Households |
| No Children | 0 (0.0%) | 0 (0.0%) |
| 1 or 2 Children | 0 (0.0%) | 0 (0.0%) |
| 3 or 4 Children | 0 (0.0%) | 0 (0.0%) |
| 5 or more Children | 0 (0.0%) | 0 (0.0%) |
| Total | 0 (0.0%) | 0 (0.0%) |
Race in St Georges
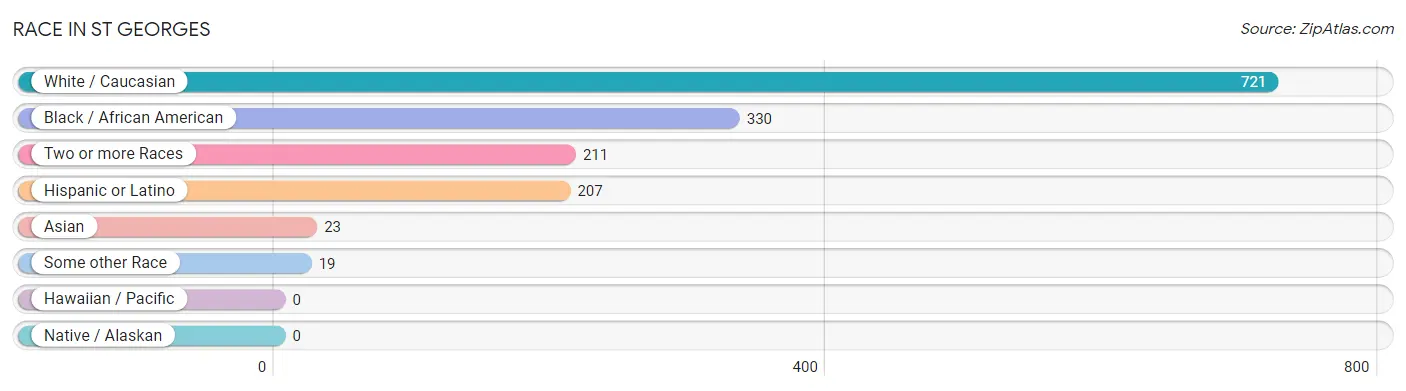
The most populous races in St Georges are White / Caucasian (721 | 55.3%), Black / African American (330 | 25.3%), and Two or more Races (211 | 16.2%).
| Race | # Population | % Population |
| Asian | 23 | 1.8% |
| Black / African American | 330 | 25.3% |
| Hawaiian / Pacific | 0 | 0.0% |
| Hispanic or Latino | 207 | 15.9% |
| Native / Alaskan | 0 | 0.0% |
| White / Caucasian | 721 | 55.3% |
| Two or more Races | 211 | 16.2% |
| Some other Race | 19 | 1.5% |
| Total | 1,304 | 100.0% |
Ancestry in St Georges
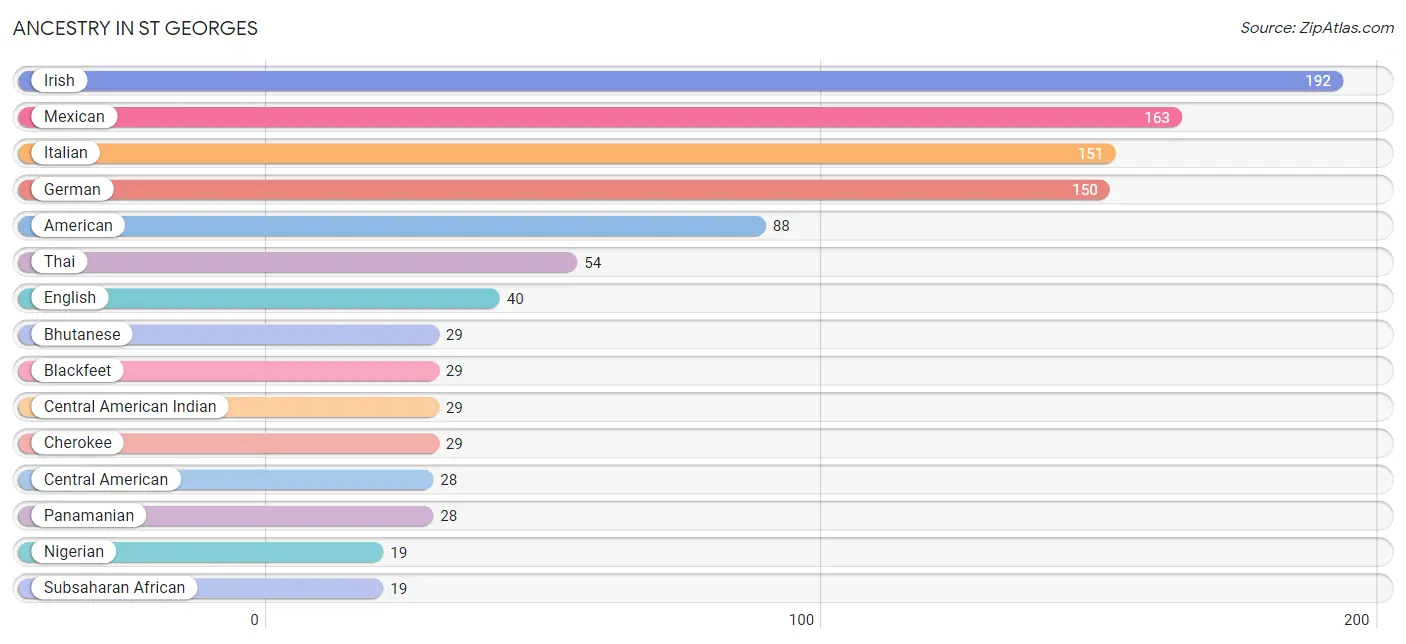
The most populous ancestries reported in St Georges are Irish (192 | 14.7%), Mexican (163 | 12.5%), Italian (151 | 11.6%), German (150 | 11.5%), and American (88 | 6.8%), together accounting for 57.1% of all St Georges residents.
| Ancestry | # Population | % Population |
| American | 88 | 6.8% |
| Austrian | 9 | 0.7% |
| Bhutanese | 29 | 2.2% |
| Blackfeet | 29 | 2.2% |
| Central American | 28 | 2.1% |
| Central American Indian | 29 | 2.2% |
| Cherokee | 29 | 2.2% |
| English | 40 | 3.1% |
| French | 11 | 0.8% |
| French Canadian | 9 | 0.7% |
| German | 150 | 11.5% |
| Hungarian | 18 | 1.4% |
| Irish | 192 | 14.7% |
| Italian | 151 | 11.6% |
| Mexican | 163 | 12.5% |
| Nigerian | 19 | 1.5% |
| Panamanian | 28 | 2.1% |
| Polish | 2 | 0.2% |
| Puerto Rican | 16 | 1.2% |
| Scottish | 15 | 1.1% |
| Subsaharan African | 19 | 1.5% |
| Thai | 54 | 4.1% | View All 22 Rows |
Immigrants in St Georges
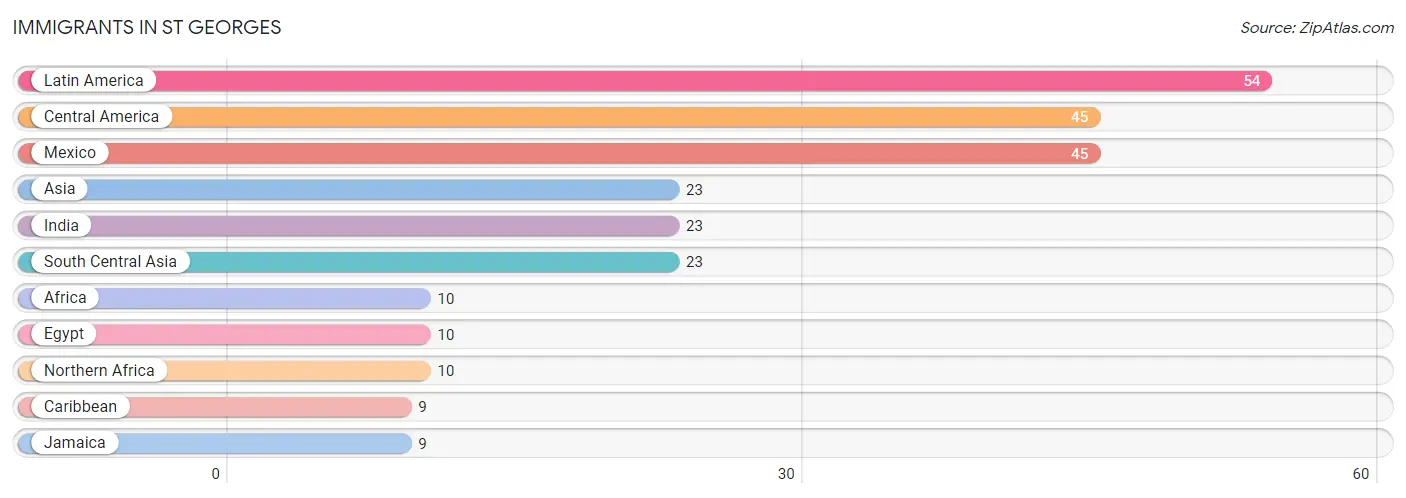
The most numerous immigrant groups reported in St Georges came from Latin America (54 | 4.1%), Central America (45 | 3.5%), Mexico (45 | 3.5%), Asia (23 | 1.8%), and India (23 | 1.8%), together accounting for 14.6% of all St Georges residents.
| Immigration Origin | # Population | % Population |
| Africa | 10 | 0.8% |
| Asia | 23 | 1.8% |
| Caribbean | 9 | 0.7% |
| Central America | 45 | 3.5% |
| Egypt | 10 | 0.8% |
| India | 23 | 1.8% |
| Jamaica | 9 | 0.7% |
| Latin America | 54 | 4.1% |
| Mexico | 45 | 3.5% |
| Northern Africa | 10 | 0.8% |
| South Central Asia | 23 | 1.8% | View All 11 Rows |
Sex and Age in St Georges
Sex and Age in St Georges
The most populous age groups in St Georges are 60 to 64 Years (106 | 15.6%) for men and 50 to 54 Years (175 | 28.0%) for women.
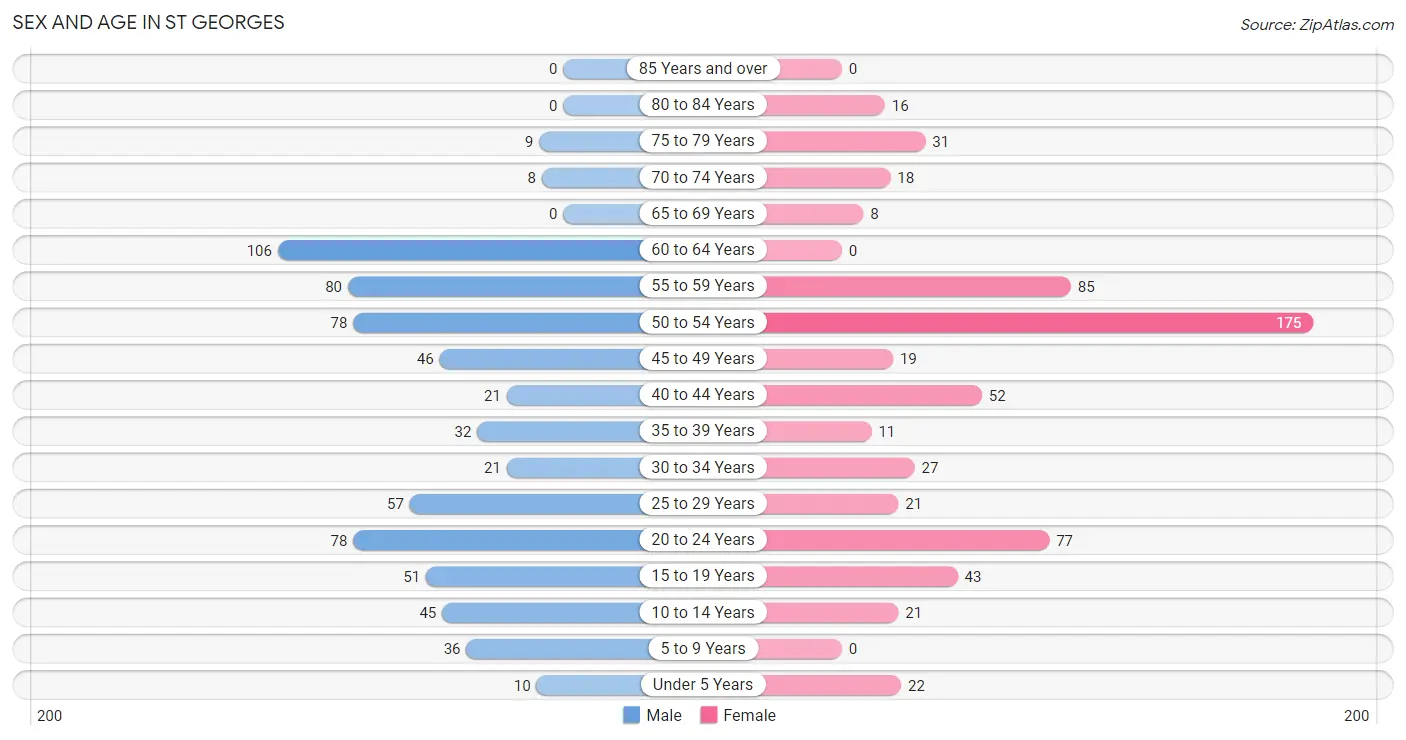
| Age Bracket | Male | Female |
| Under 5 Years | 10 (1.5%) | 22 (3.5%) |
| 5 to 9 Years | 36 (5.3%) | 0 (0.0%) |
| 10 to 14 Years | 45 (6.6%) | 21 (3.4%) |
| 15 to 19 Years | 51 (7.5%) | 43 (6.9%) |
| 20 to 24 Years | 78 (11.5%) | 77 (12.3%) |
| 25 to 29 Years | 57 (8.4%) | 21 (3.4%) |
| 30 to 34 Years | 21 (3.1%) | 27 (4.3%) |
| 35 to 39 Years | 32 (4.7%) | 11 (1.8%) |
| 40 to 44 Years | 21 (3.1%) | 52 (8.3%) |
| 45 to 49 Years | 46 (6.8%) | 19 (3.0%) |
| 50 to 54 Years | 78 (11.5%) | 175 (28.0%) |
| 55 to 59 Years | 80 (11.8%) | 85 (13.6%) |
| 60 to 64 Years | 106 (15.6%) | 0 (0.0%) |
| 65 to 69 Years | 0 (0.0%) | 8 (1.3%) |
| 70 to 74 Years | 8 (1.2%) | 18 (2.9%) |
| 75 to 79 Years | 9 (1.3%) | 31 (5.0%) |
| 80 to 84 Years | 0 (0.0%) | 16 (2.6%) |
| 85 Years and over | 0 (0.0%) | 0 (0.0%) |
| Total | 678 (100.0%) | 626 (100.0%) |
Families and Households in St Georges
Median Family Size in St Georges
The median family size in St Georges is 3.17 persons per family, with married-couple families (334 | 87.7%) accounting for the largest median family size of 3.26 persons per family. On the other hand, single female/mother families (19 | 5.0%) represent the smallest median family size with 2.42 persons per family.
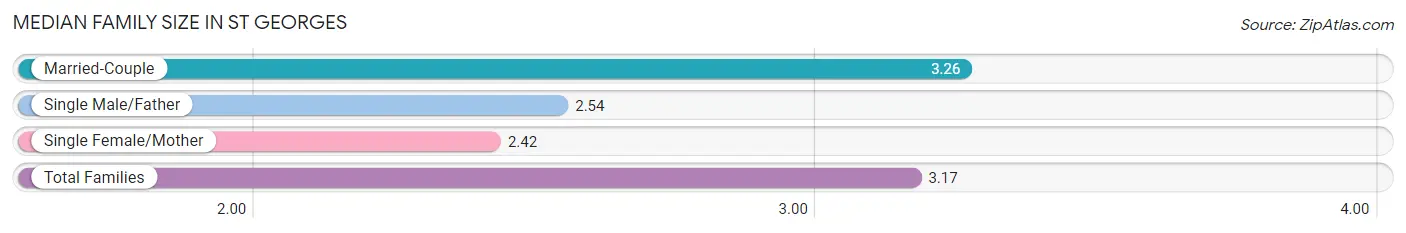
| Family Type | # Families | Family Size |
| Married-Couple | 334 (87.7%) | 3.26 |
| Single Male/Father | 28 (7.3%) | 2.54 |
| Single Female/Mother | 19 (5.0%) | 2.42 |
| Total Families | 381 (100.0%) | 3.17 |
Median Household Size in St Georges
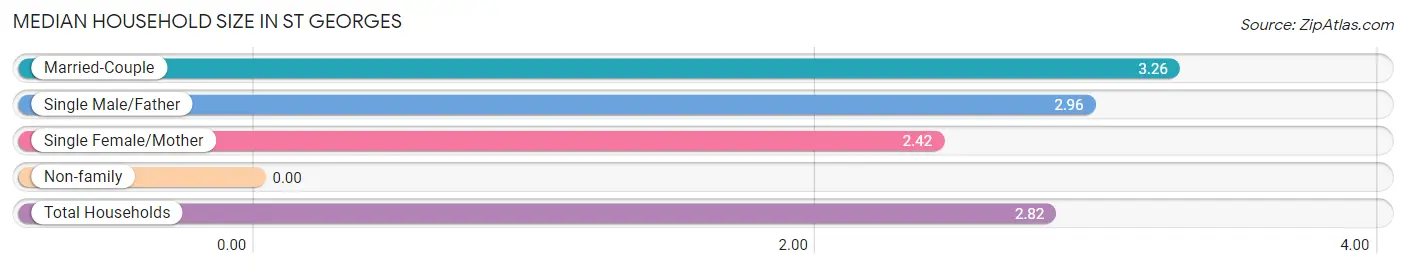
| Household Type | # Households | Household Size |
| Married-Couple | 334 (72.6%) | 3.26 |
| Single Male/Father | 28 (6.1%) | 2.96 |
| Single Female/Mother | 19 (4.1%) | 2.42 |
| Non-family | 79 (17.2%) | - |
| Total Households | 460 (100.0%) | 2.82 |
Household Size by Marriage Status in St Georges
Out of a total of 460 households in St Georges, 381 (82.8%) are family households, while 79 (17.2%) are nonfamily households. The most numerous type of family households are 4-person households, comprising 145, and the most common type of nonfamily households are 1-person households, comprising 79.
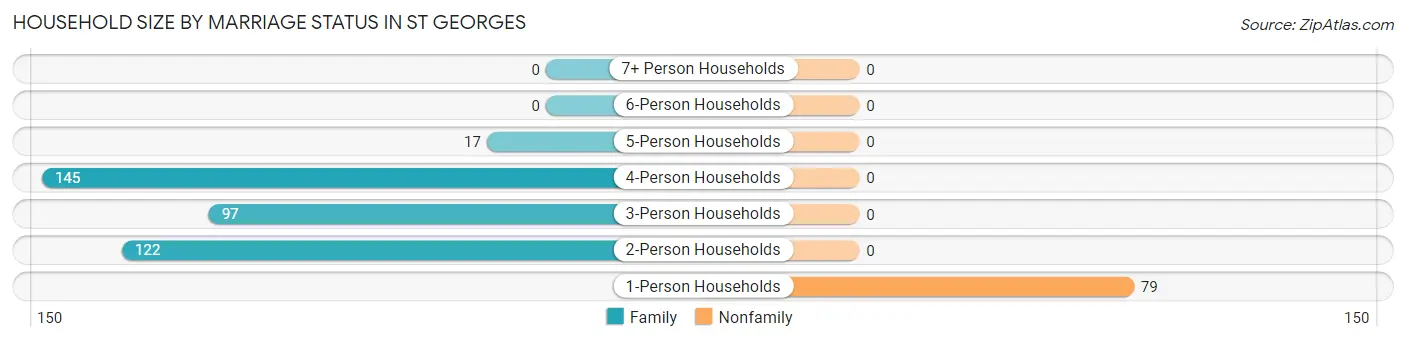
| Household Size | Family Households | Nonfamily Households |
| 1-Person Households | - | 79 (17.2%) |
| 2-Person Households | 122 (26.5%) | 0 (0.0%) |
| 3-Person Households | 97 (21.1%) | 0 (0.0%) |
| 4-Person Households | 145 (31.5%) | 0 (0.0%) |
| 5-Person Households | 17 (3.7%) | 0 (0.0%) |
| 6-Person Households | 0 (0.0%) | 0 (0.0%) |
| 7+ Person Households | 0 (0.0%) | 0 (0.0%) |
| Total | 381 (82.8%) | 79 (17.2%) |
Female Fertility in St Georges
Fertility by Age in St Georges
Average fertility rate in St Georges is 67.0 births per 1,000 women. Women in the age bracket of 20 to 34 years have the highest fertility rate with 168.0 births per 1,000 women. Women in the age bracket of 20 to 34 years acount for 100.0% of all women with births.
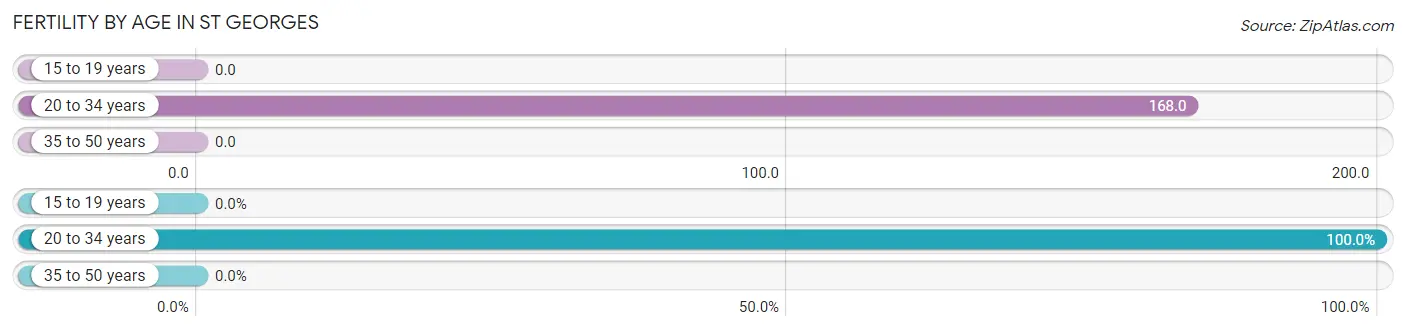
| Age Bracket | Women with Births | Births / 1,000 Women |
| 15 to 19 years | 0 (0.0%) | 0.0 |
| 20 to 34 years | 21 (100.0%) | 168.0 |
| 35 to 50 years | 0 (0.0%) | 0.0 |
| Total | 21 (100.0%) | 67.0 |
Fertility by Age by Marriage Status in St Georges
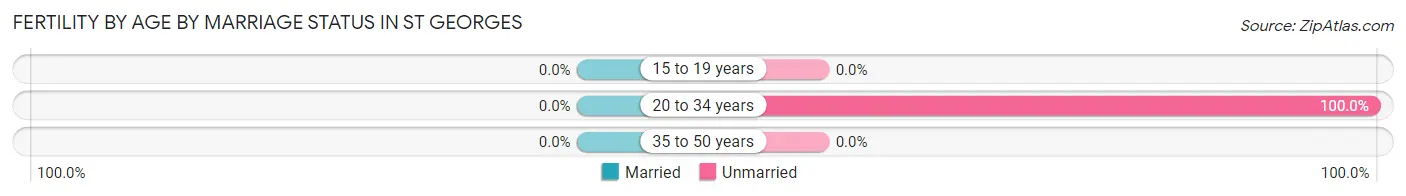
| Age Bracket | Married | Unmarried |
| 15 to 19 years | 0 (0.0%) | 0 (0.0%) |
| 20 to 34 years | 0 (0.0%) | 21 (100.0%) |
| 35 to 50 years | 0 (0.0%) | 0 (0.0%) |
| Total | 0 (0.0%) | 21 (100.0%) |
Fertility by Education in St Georges
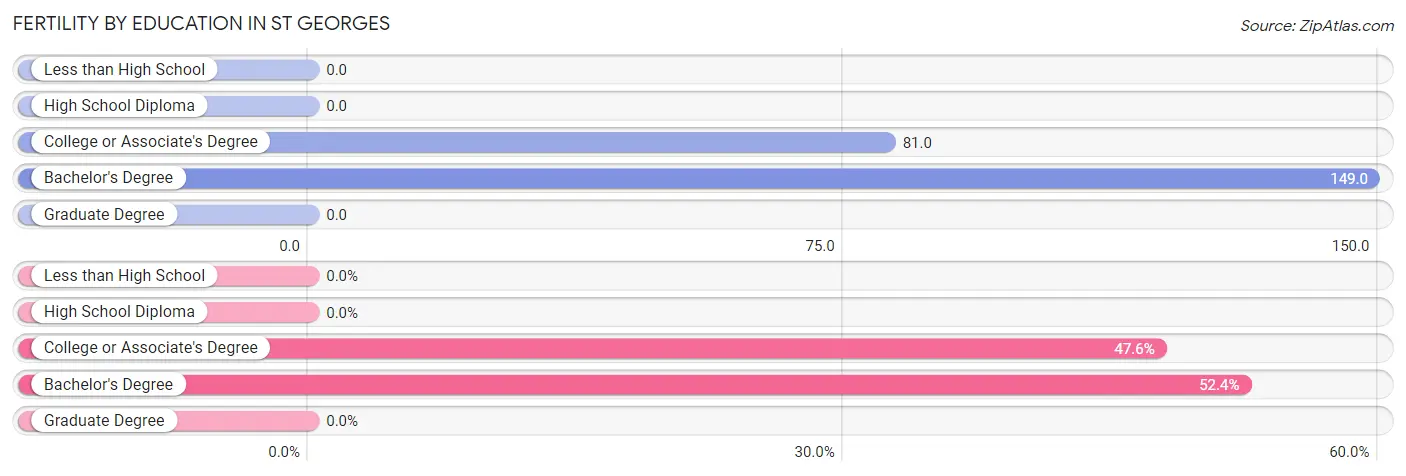
| Educational Attainment | Women with Births | Births / 1,000 Women |
| Less than High School | 0 (0.0%) | 0.0 |
| High School Diploma | 0 (0.0%) | 0.0 |
| College or Associate's Degree | 10 (47.6%) | 81.0 |
| Bachelor's Degree | 11 (52.4%) | 149.0 |
| Graduate Degree | 0 (0.0%) | 0.0 |
| Total | 21 (100.0%) | 67.0 |
Fertility by Education by Marriage Status in St Georges
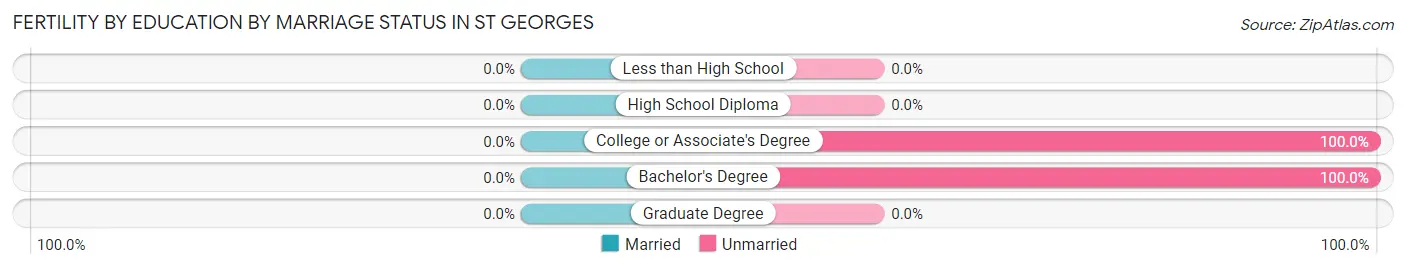
| Educational Attainment | Married | Unmarried |
| Less than High School | 0 (0.0%) | 0 (0.0%) |
| High School Diploma | 0 (0.0%) | 0 (0.0%) |
| College or Associate's Degree | 0 (0.0%) | 10 (100.0%) |
| Bachelor's Degree | 0 (0.0%) | 11 (100.0%) |
| Graduate Degree | 0 (0.0%) | 0 (0.0%) |
| Total | 0 (0.0%) | 21 (100.0%) |
Employment Characteristics in St Georges
Employment by Class of Employer in St Georges
Among the 874 employed individuals in St Georges, private company employees (651 | 74.5%), self-employed (incorporated) (79 | 9.0%), and state government employees (72 | 8.2%) make up the most common classes of employment.
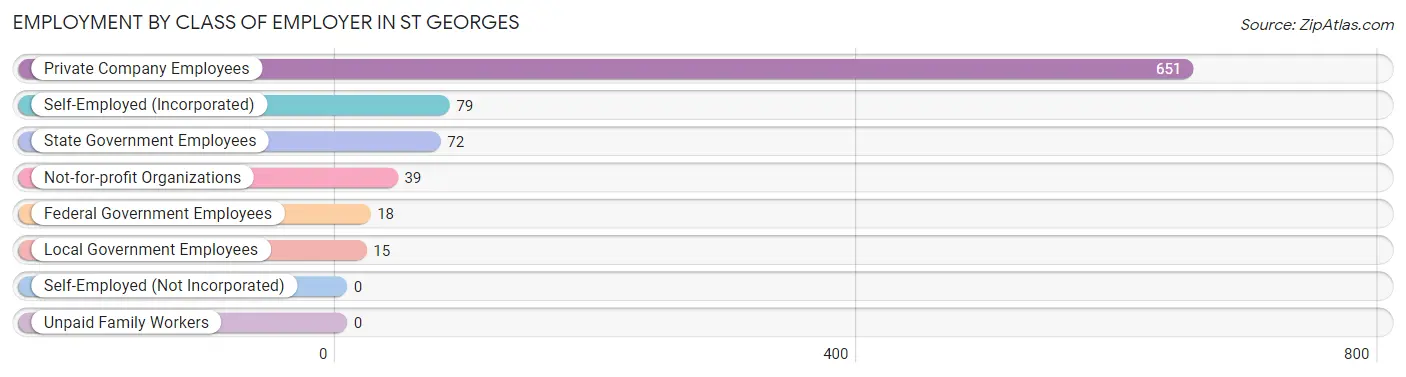
| Employer Class | # Employees | % Employees |
| Private Company Employees | 651 | 74.5% |
| Self-Employed (Incorporated) | 79 | 9.0% |
| Self-Employed (Not Incorporated) | 0 | 0.0% |
| Not-for-profit Organizations | 39 | 4.5% |
| Local Government Employees | 15 | 1.7% |
| State Government Employees | 72 | 8.2% |
| Federal Government Employees | 18 | 2.1% |
| Unpaid Family Workers | 0 | 0.0% |
| Total | 874 | 100.0% |
Employment Status by Age in St Georges
According to the labor force statistics for St Georges, out of the total population over 16 years of age (1,132), 83.0% or 940 individuals are in the labor force, with 3.0% or 28 of them unemployed. The age group with the highest labor force participation rate is 25 to 29 years, with 100.0% or 78 individuals in the labor force. Within the labor force, the 20 to 24 years age range has the highest percentage of unemployed individuals, with 19.2% or 28 of them being unemployed.
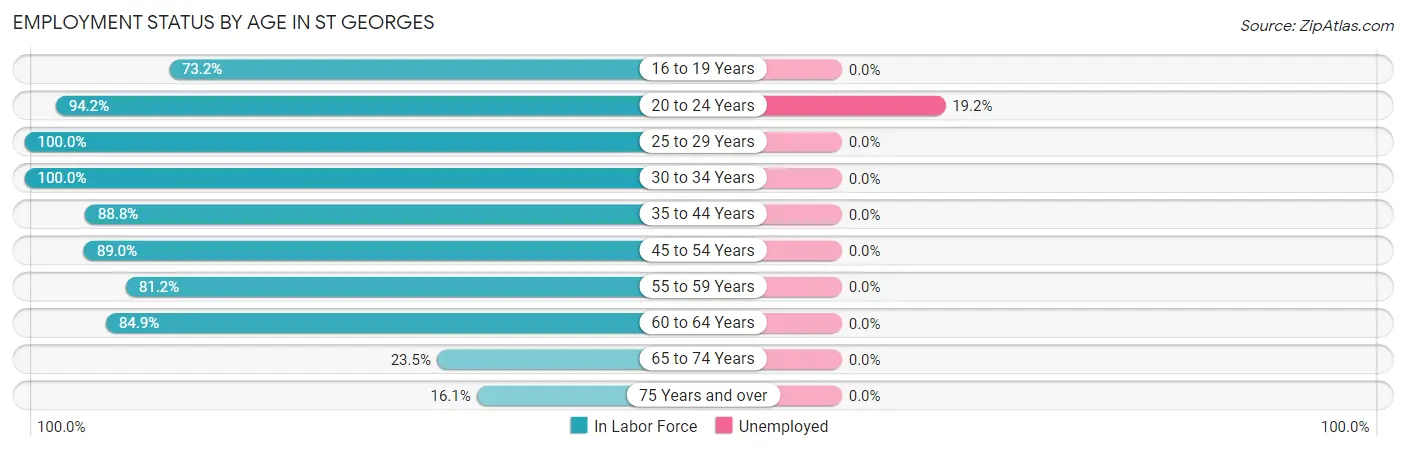
| Age Bracket | In Labor Force | Unemployed |
| 16 to 19 Years | 41 (73.2%) | 0 (0.0%) |
| 20 to 24 Years | 146 (94.2%) | 28 (19.2%) |
| 25 to 29 Years | 78 (100.0%) | 0 (0.0%) |
| 30 to 34 Years | 48 (100.0%) | 0 (0.0%) |
| 35 to 44 Years | 103 (88.8%) | 0 (0.0%) |
| 45 to 54 Years | 283 (89.0%) | 0 (0.0%) |
| 55 to 59 Years | 134 (81.2%) | 0 (0.0%) |
| 60 to 64 Years | 90 (84.9%) | 0 (0.0%) |
| 65 to 74 Years | 8 (23.5%) | 0 (0.0%) |
| 75 Years and over | 9 (16.1%) | 0 (0.0%) |
| Total | 940 (83.0%) | 28 (3.0%) |
Employment Status by Educational Attainment in St Georges
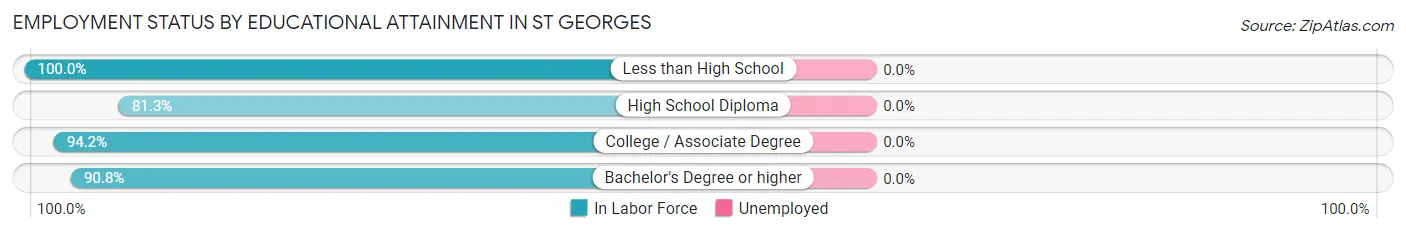
| Educational Attainment | In Labor Force | Unemployed |
| Less than High School | 2 (100.0%) | 0 (0.0%) |
| High School Diploma | 226 (81.3%) | 0 (0.0%) |
| College / Associate Degree | 211 (94.2%) | 0 (0.0%) |
| Bachelor's Degree or higher | 297 (90.8%) | 0 (0.0%) |
| Total | 736 (88.6%) | 0 (0.0%) |
Employment Occupations by Sex in St Georges
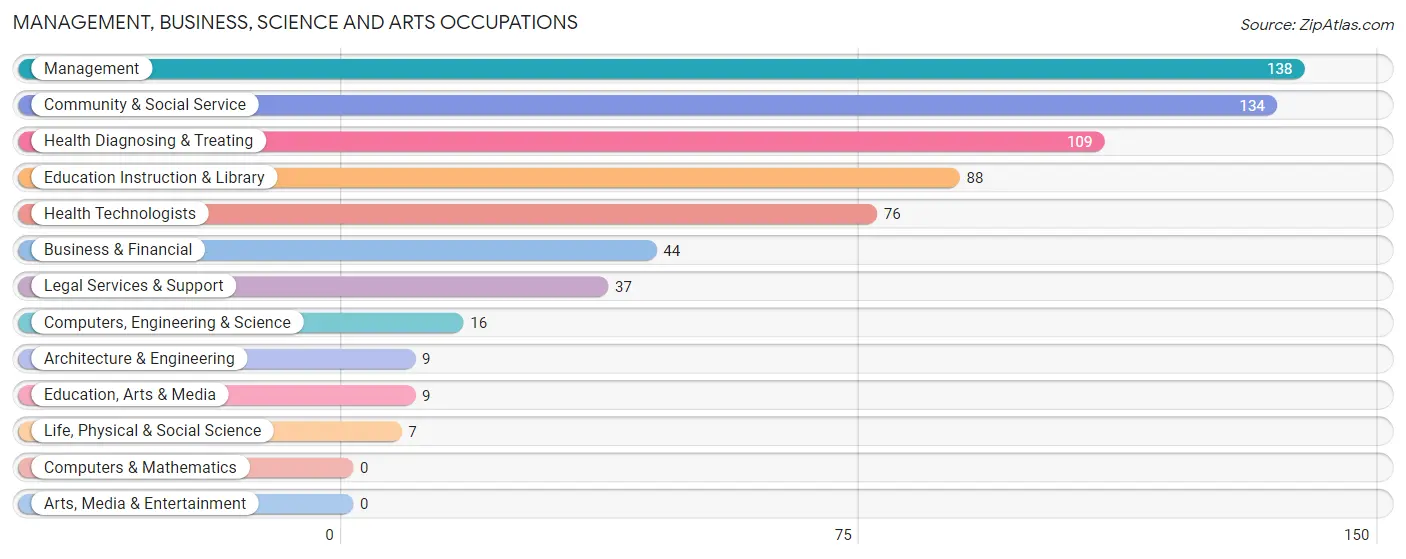
Management, Business, Science and Arts Occupations
The most common Management, Business, Science and Arts occupations in St Georges are Management (138 | 15.3%), Community & Social Service (134 | 14.8%), Health Diagnosing & Treating (109 | 12.1%), Education Instruction & Library (88 | 9.7%), and Health Technologists (76 | 8.4%).
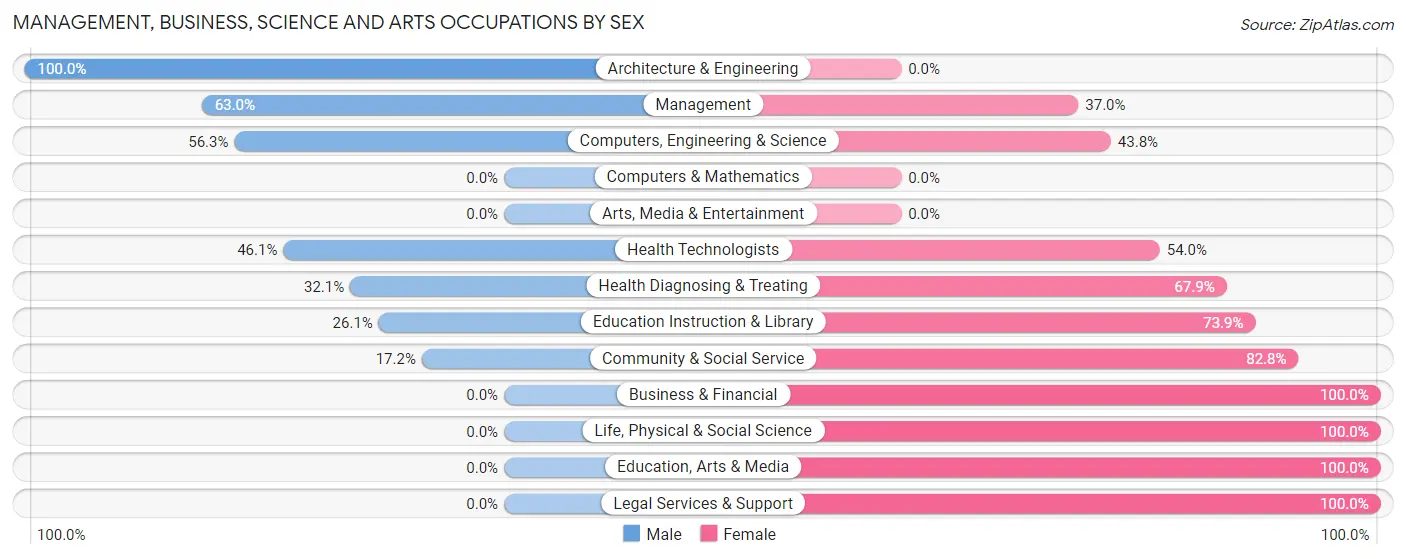
Management, Business, Science and Arts Occupations by Sex
Within the Management, Business, Science and Arts occupations in St Georges, the most male-oriented occupations are Architecture & Engineering (100.0%), Management (63.0%), and Computers, Engineering & Science (56.2%), while the most female-oriented occupations are Business & Financial (100.0%), Life, Physical & Social Science (100.0%), and Education, Arts & Media (100.0%).
| Occupation | Male | Female |
| Management | 87 (63.0%) | 51 (37.0%) |
| Business & Financial | 0 (0.0%) | 44 (100.0%) |
| Computers, Engineering & Science | 9 (56.2%) | 7 (43.8%) |
| Computers & Mathematics | 0 (0.0%) | 0 (0.0%) |
| Architecture & Engineering | 9 (100.0%) | 0 (0.0%) |
| Life, Physical & Social Science | 0 (0.0%) | 7 (100.0%) |
| Community & Social Service | 23 (17.2%) | 111 (82.8%) |
| Education, Arts & Media | 0 (0.0%) | 9 (100.0%) |
| Legal Services & Support | 0 (0.0%) | 37 (100.0%) |
| Education Instruction & Library | 23 (26.1%) | 65 (73.9%) |
| Arts, Media & Entertainment | 0 (0.0%) | 0 (0.0%) |
| Health Diagnosing & Treating | 35 (32.1%) | 74 (67.9%) |
| Health Technologists | 35 (46.1%) | 41 (53.9%) |
| Total (Category) | 154 (34.9%) | 287 (65.1%) |
| Total (Overall) | 491 (54.3%) | 413 (45.7%) |
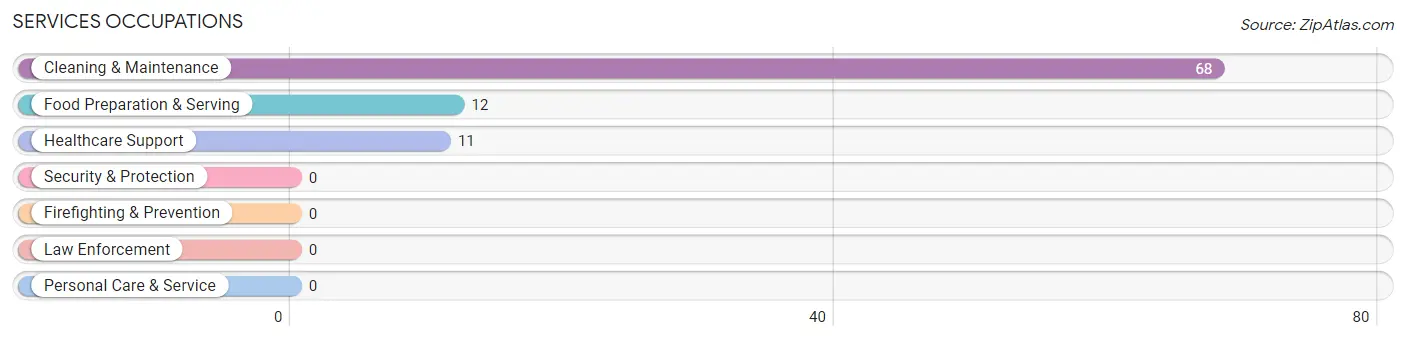
Services Occupations
The most common Services occupations in St Georges are Cleaning & Maintenance (68 | 7.5%), Food Preparation & Serving (12 | 1.3%), and Healthcare Support (11 | 1.2%).
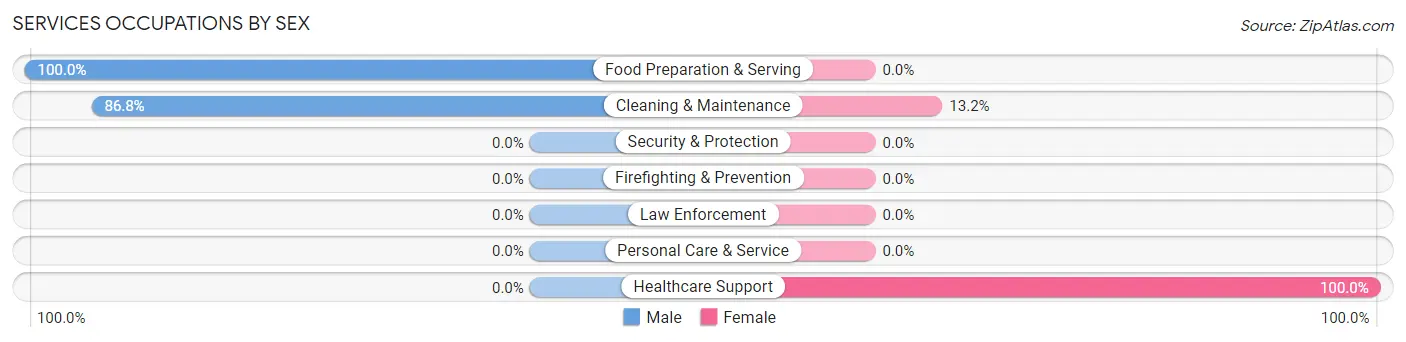
Services Occupations by Sex
Within the Services occupations in St Georges, the most male-oriented occupations are Food Preparation & Serving (100.0%), and Cleaning & Maintenance (86.8%), while the most female-oriented occupations are Healthcare Support (100.0%), and Cleaning & Maintenance (13.2%).
| Occupation | Male | Female |
| Healthcare Support | 0 (0.0%) | 11 (100.0%) |
| Security & Protection | 0 (0.0%) | 0 (0.0%) |
| Firefighting & Prevention | 0 (0.0%) | 0 (0.0%) |
| Law Enforcement | 0 (0.0%) | 0 (0.0%) |
| Food Preparation & Serving | 12 (100.0%) | 0 (0.0%) |
| Cleaning & Maintenance | 59 (86.8%) | 9 (13.2%) |
| Personal Care & Service | 0 (0.0%) | 0 (0.0%) |
| Total (Category) | 71 (78.0%) | 20 (22.0%) |
| Total (Overall) | 491 (54.3%) | 413 (45.7%) |
Sales and Office Occupations
The most common Sales and Office occupations in St Georges are Office & Administration (134 | 14.8%), and Sales & Related (11 | 1.2%).
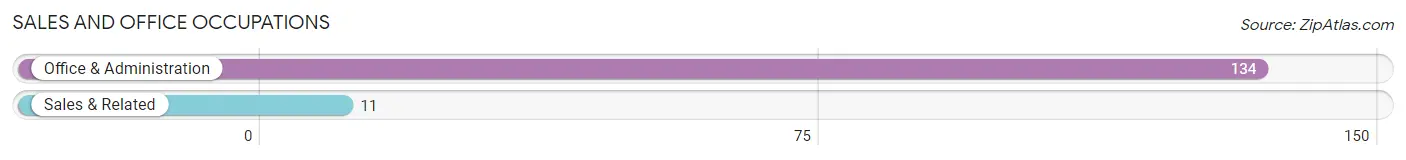
Sales and Office Occupations by Sex

| Occupation | Male | Female |
| Sales & Related | 11 (100.0%) | 0 (0.0%) |
| Office & Administration | 38 (28.4%) | 96 (71.6%) |
| Total (Category) | 49 (33.8%) | 96 (66.2%) |
| Total (Overall) | 491 (54.3%) | 413 (45.7%) |
Natural Resources, Construction and Maintenance Occupations
The most common Natural Resources, Construction and Maintenance occupations in St Georges are Construction & Extraction (51 | 5.6%), and Installation, Maintenance & Repair (32 | 3.5%).

Natural Resources, Construction and Maintenance Occupations by Sex
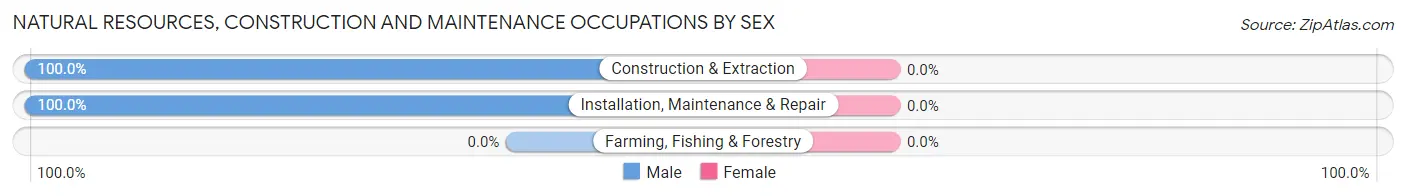
| Occupation | Male | Female |
| Farming, Fishing & Forestry | 0 (0.0%) | 0 (0.0%) |
| Construction & Extraction | 51 (100.0%) | 0 (0.0%) |
| Installation, Maintenance & Repair | 32 (100.0%) | 0 (0.0%) |
| Total (Category) | 83 (100.0%) | 0 (0.0%) |
| Total (Overall) | 491 (54.3%) | 413 (45.7%) |
Production, Transportation and Moving Occupations
The most common Production, Transportation and Moving occupations in St Georges are Transportation (62 | 6.9%), Material Moving (44 | 4.9%), and Production (38 | 4.2%).
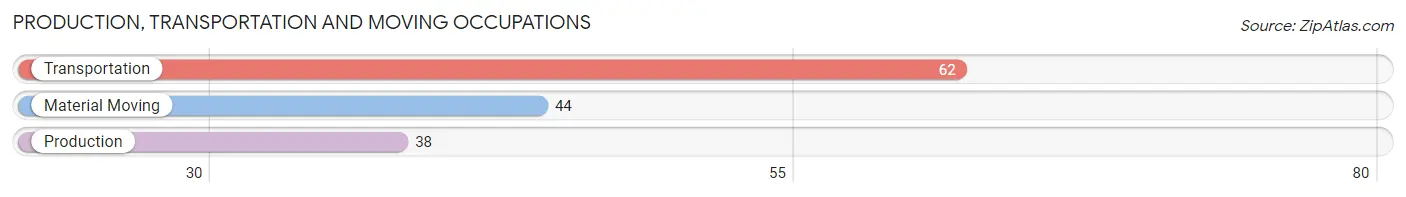
Production, Transportation and Moving Occupations by Sex
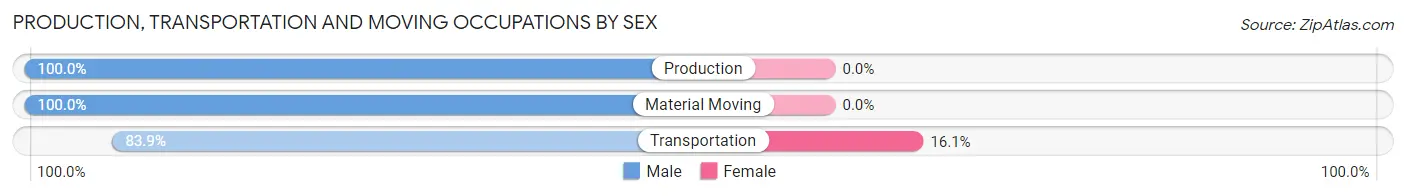
| Occupation | Male | Female |
| Production | 38 (100.0%) | 0 (0.0%) |
| Transportation | 52 (83.9%) | 10 (16.1%) |
| Material Moving | 44 (100.0%) | 0 (0.0%) |
| Total (Category) | 134 (93.1%) | 10 (6.9%) |
| Total (Overall) | 491 (54.3%) | 413 (45.7%) |
Employment Industries by Sex in St Georges
Employment Industries in St Georges
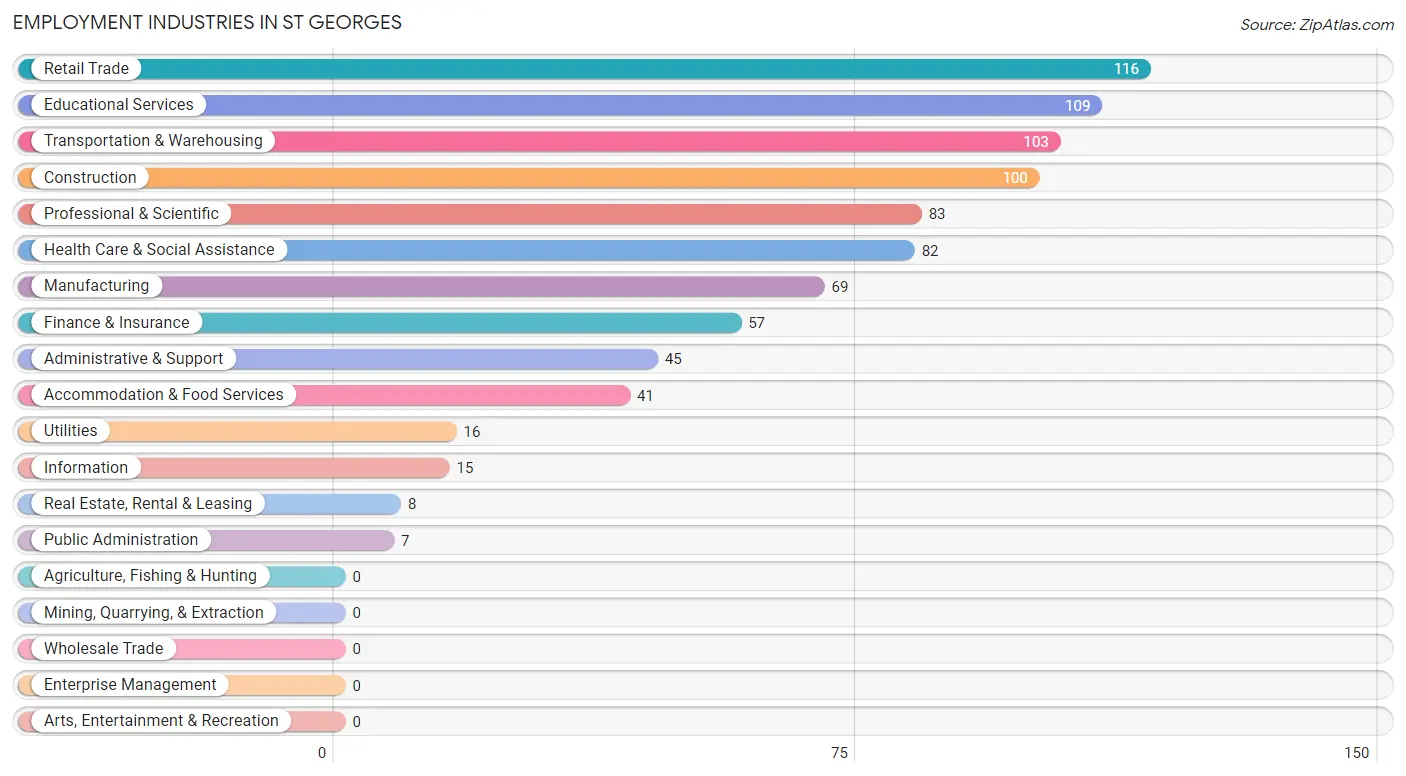
The major employment industries in St Georges include Retail Trade (116 | 12.8%), Educational Services (109 | 12.1%), Transportation & Warehousing (103 | 11.4%), Construction (100 | 11.1%), and Professional & Scientific (83 | 9.2%).
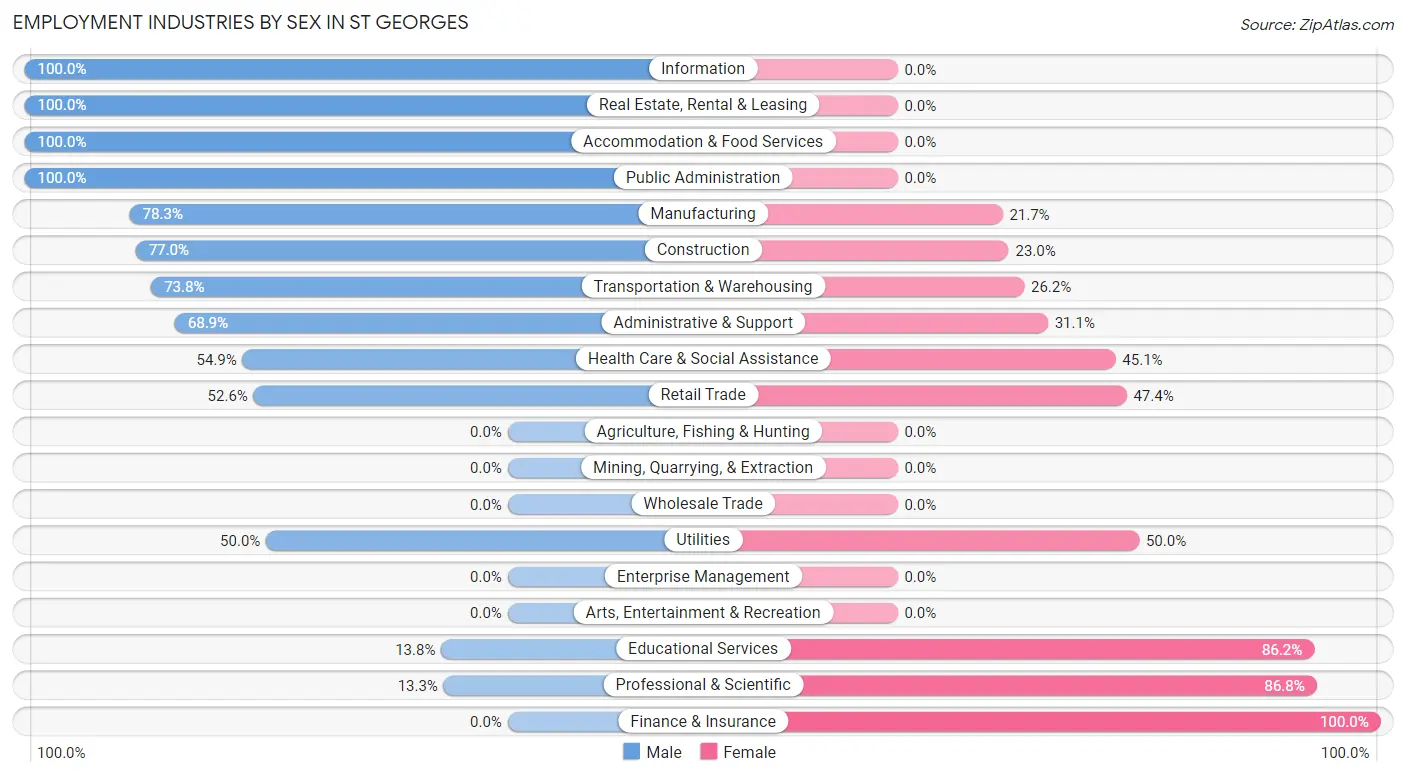
Employment Industries by Sex in St Georges
The St Georges industries that see more men than women are Information (100.0%), Real Estate, Rental & Leasing (100.0%), and Accommodation & Food Services (100.0%), whereas the industries that tend to have a higher number of women are Finance & Insurance (100.0%), Professional & Scientific (86.8%), and Educational Services (86.2%).
| Industry | Male | Female |
| Agriculture, Fishing & Hunting | 0 (0.0%) | 0 (0.0%) |
| Mining, Quarrying, & Extraction | 0 (0.0%) | 0 (0.0%) |
| Construction | 77 (77.0%) | 23 (23.0%) |
| Manufacturing | 54 (78.3%) | 15 (21.7%) |
| Wholesale Trade | 0 (0.0%) | 0 (0.0%) |
| Retail Trade | 61 (52.6%) | 55 (47.4%) |
| Transportation & Warehousing | 76 (73.8%) | 27 (26.2%) |
| Utilities | 8 (50.0%) | 8 (50.0%) |
| Information | 15 (100.0%) | 0 (0.0%) |
| Finance & Insurance | 0 (0.0%) | 57 (100.0%) |
| Real Estate, Rental & Leasing | 8 (100.0%) | 0 (0.0%) |
| Professional & Scientific | 11 (13.3%) | 72 (86.8%) |
| Enterprise Management | 0 (0.0%) | 0 (0.0%) |
| Administrative & Support | 31 (68.9%) | 14 (31.1%) |
| Educational Services | 15 (13.8%) | 94 (86.2%) |
| Health Care & Social Assistance | 45 (54.9%) | 37 (45.1%) |
| Arts, Entertainment & Recreation | 0 (0.0%) | 0 (0.0%) |
| Accommodation & Food Services | 41 (100.0%) | 0 (0.0%) |
| Public Administration | 7 (100.0%) | 0 (0.0%) |
| Total | 491 (54.3%) | 413 (45.7%) |
Education in St Georges
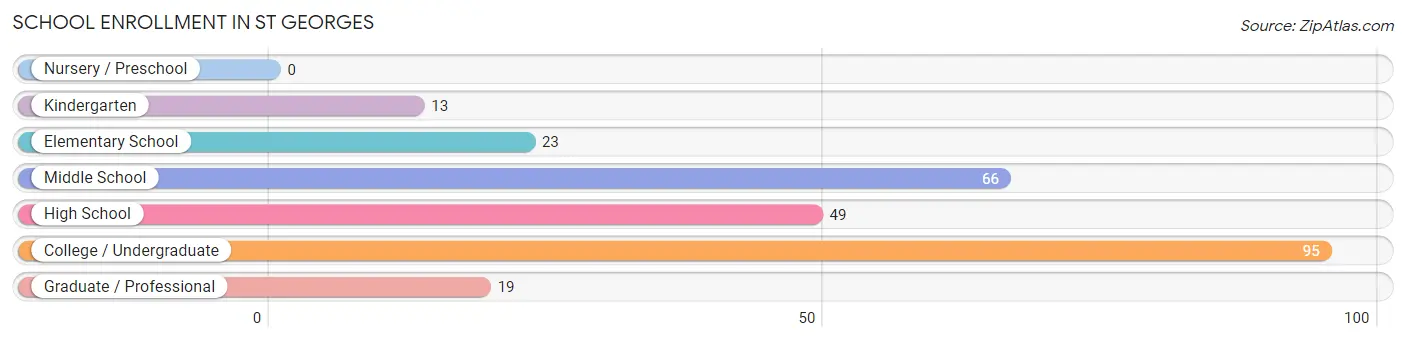
School Enrollment in St Georges
The most common levels of schooling among the 265 students in St Georges are college / undergraduate (95 | 35.8%), middle school (66 | 24.9%), and high school (49 | 18.5%).
| School Level | # Students | % Students |
| Nursery / Preschool | 0 | 0.0% |
| Kindergarten | 13 | 4.9% |
| Elementary School | 23 | 8.7% |
| Middle School | 66 | 24.9% |
| High School | 49 | 18.5% |
| College / Undergraduate | 95 | 35.8% |
| Graduate / Professional | 19 | 7.2% |
| Total | 265 | 100.0% |
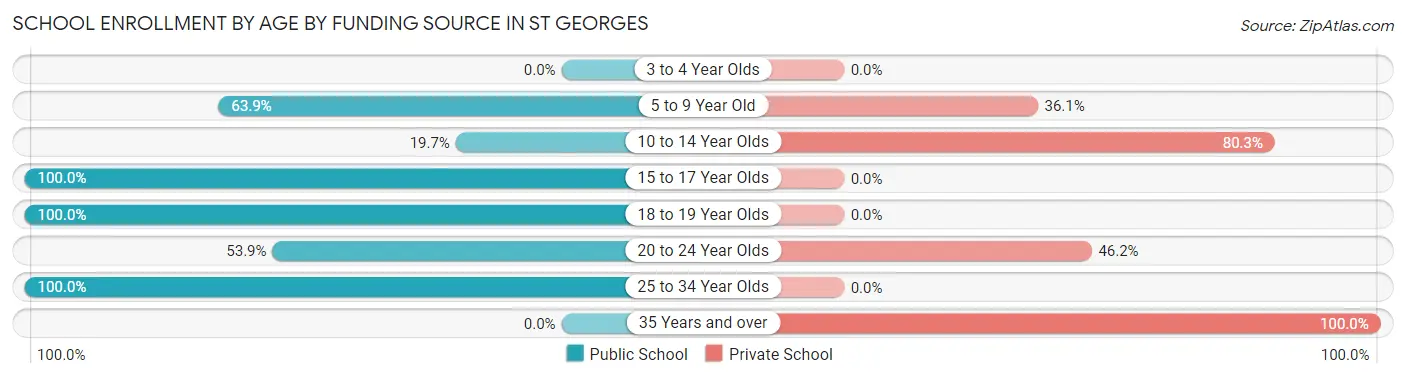
School Enrollment by Age by Funding Source in St Georges
Out of a total of 265 students who are enrolled in schools in St Georges, 113 (42.6%) attend a private institution, while the remaining 152 (57.4%) are enrolled in public schools. The age group of 35 years and over has the highest likelihood of being enrolled in private schools, with 11 (100.0% in the age bracket) enrolled. Conversely, the age group of 15 to 17 year olds has the lowest likelihood of being enrolled in a private school, with 49 (100.0% in the age bracket) attending a public institution.
| Age Bracket | Public School | Private School |
| 3 to 4 Year Olds | 0 (0.0%) | 0 (0.0%) |
| 5 to 9 Year Old | 23 (63.9%) | 13 (36.1%) |
| 10 to 14 Year Olds | 13 (19.7%) | 53 (80.3%) |
| 15 to 17 Year Olds | 49 (100.0%) | 0 (0.0%) |
| 18 to 19 Year Olds | 14 (100.0%) | 0 (0.0%) |
| 20 to 24 Year Olds | 42 (53.8%) | 36 (46.2%) |
| 25 to 34 Year Olds | 11 (100.0%) | 0 (0.0%) |
| 35 Years and over | 0 (0.0%) | 11 (100.0%) |
| Total | 152 (57.4%) | 113 (42.6%) |
Educational Attainment by Field of Study in St Georges
Business (107 | 28.2%), science & technology (98 | 25.8%), computers & mathematics (37 | 9.7%), arts & humanities (32 | 8.4%), and literature & languages (31 | 8.2%) are the most common fields of study among 380 individuals in St Georges who have obtained a bachelor's degree or higher.
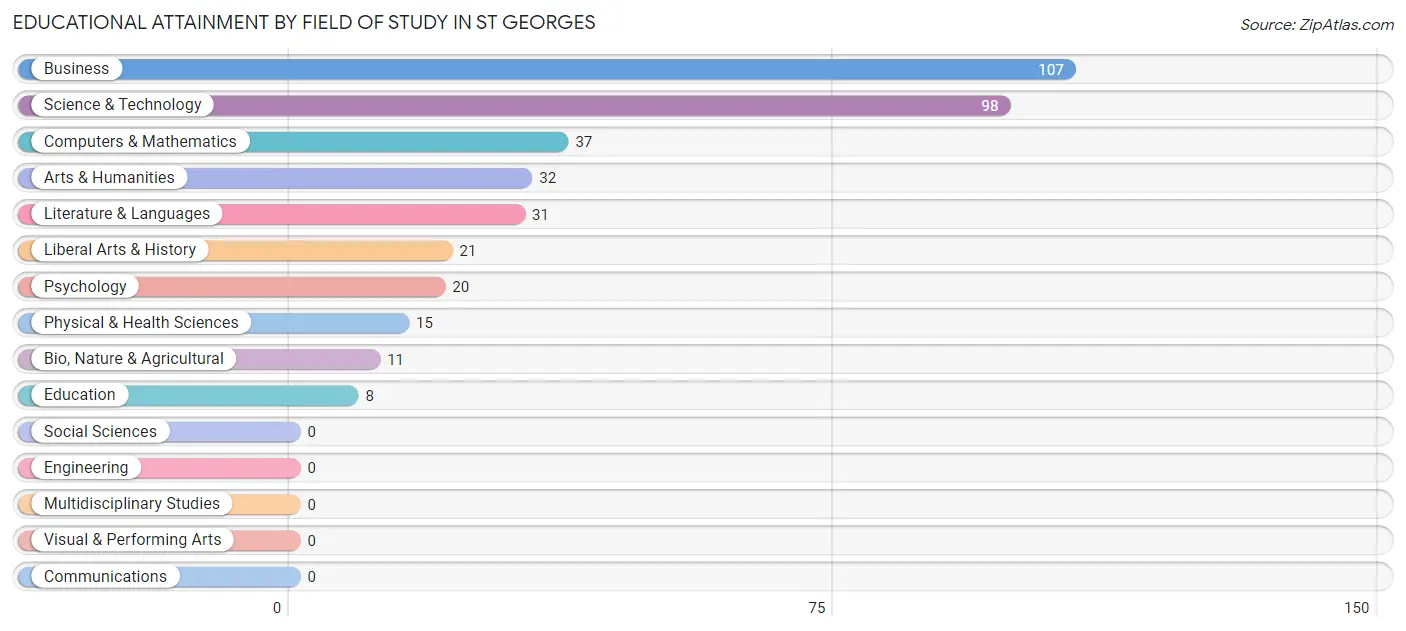
| Field of Study | # Graduates | % Graduates |
| Computers & Mathematics | 37 | 9.7% |
| Bio, Nature & Agricultural | 11 | 2.9% |
| Physical & Health Sciences | 15 | 4.0% |
| Psychology | 20 | 5.3% |
| Social Sciences | 0 | 0.0% |
| Engineering | 0 | 0.0% |
| Multidisciplinary Studies | 0 | 0.0% |
| Science & Technology | 98 | 25.8% |
| Business | 107 | 28.2% |
| Education | 8 | 2.1% |
| Literature & Languages | 31 | 8.2% |
| Liberal Arts & History | 21 | 5.5% |
| Visual & Performing Arts | 0 | 0.0% |
| Communications | 0 | 0.0% |
| Arts & Humanities | 32 | 8.4% |
| Total | 380 | 100.0% |
Transportation & Commute in St Georges
Vehicle Availability by Sex in St Georges
The most prevalent vehicle ownership categories in St Georges are males with 3 vehicles (180, accounting for 38.5%) and females with 3 vehicles (63, making up 44.6%).
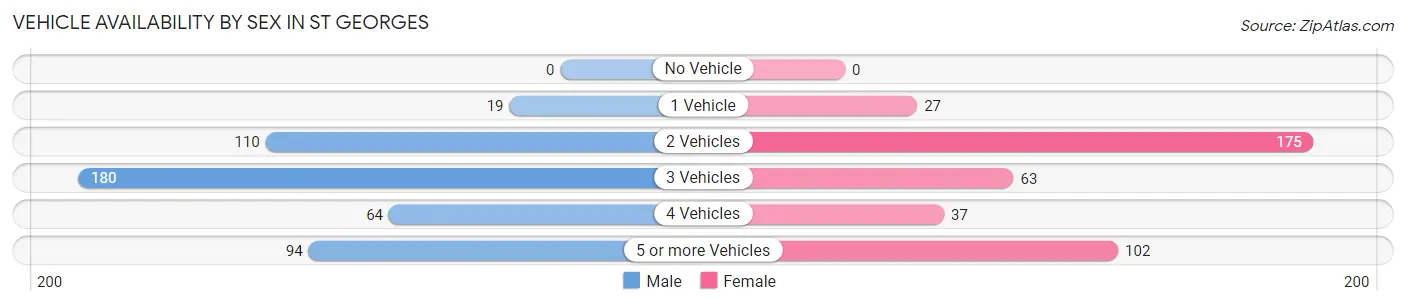
| Vehicles Available | Male | Female |
| No Vehicle | 0 (0.0%) | 0 (0.0%) |
| 1 Vehicle | 19 (4.1%) | 27 (6.7%) |
| 2 Vehicles | 110 (23.5%) | 175 (43.3%) |
| 3 Vehicles | 180 (38.5%) | 63 (15.6%) |
| 4 Vehicles | 64 (13.7%) | 37 (9.2%) |
| 5 or more Vehicles | 94 (20.1%) | 102 (25.3%) |
| Total | 467 (100.0%) | 404 (100.0%) |
Commute Time in St Georges
The most frequently occuring commute durations in St Georges are 20 to 24 minutes (170 commuters, 22.8%), 60 to 89 minutes (95 commuters, 12.7%), and 30 to 34 minutes (88 commuters, 11.8%).
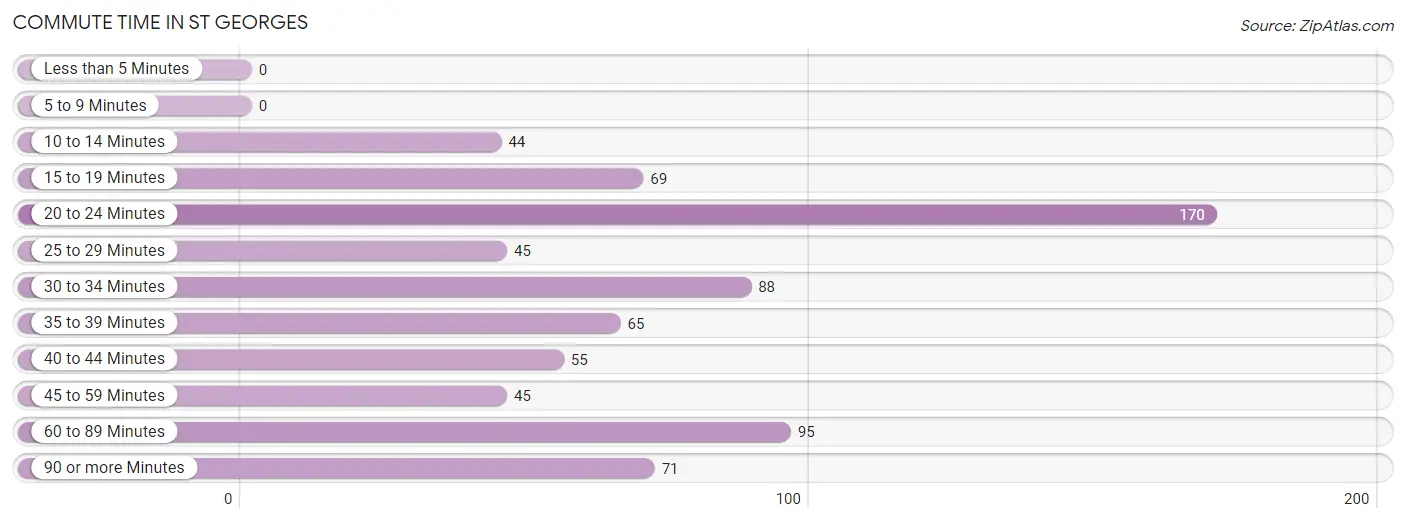
| Commute Time | # Commuters | % Commuters |
| Less than 5 Minutes | 0 | 0.0% |
| 5 to 9 Minutes | 0 | 0.0% |
| 10 to 14 Minutes | 44 | 5.9% |
| 15 to 19 Minutes | 69 | 9.2% |
| 20 to 24 Minutes | 170 | 22.8% |
| 25 to 29 Minutes | 45 | 6.0% |
| 30 to 34 Minutes | 88 | 11.8% |
| 35 to 39 Minutes | 65 | 8.7% |
| 40 to 44 Minutes | 55 | 7.4% |
| 45 to 59 Minutes | 45 | 6.0% |
| 60 to 89 Minutes | 95 | 12.7% |
| 90 or more Minutes | 71 | 9.5% |
Commute Time by Sex in St Georges
The most common commute times in St Georges are 20 to 24 minutes (98 commuters, 23.7%) for males and 20 to 24 minutes (72 commuters, 21.6%) for females.
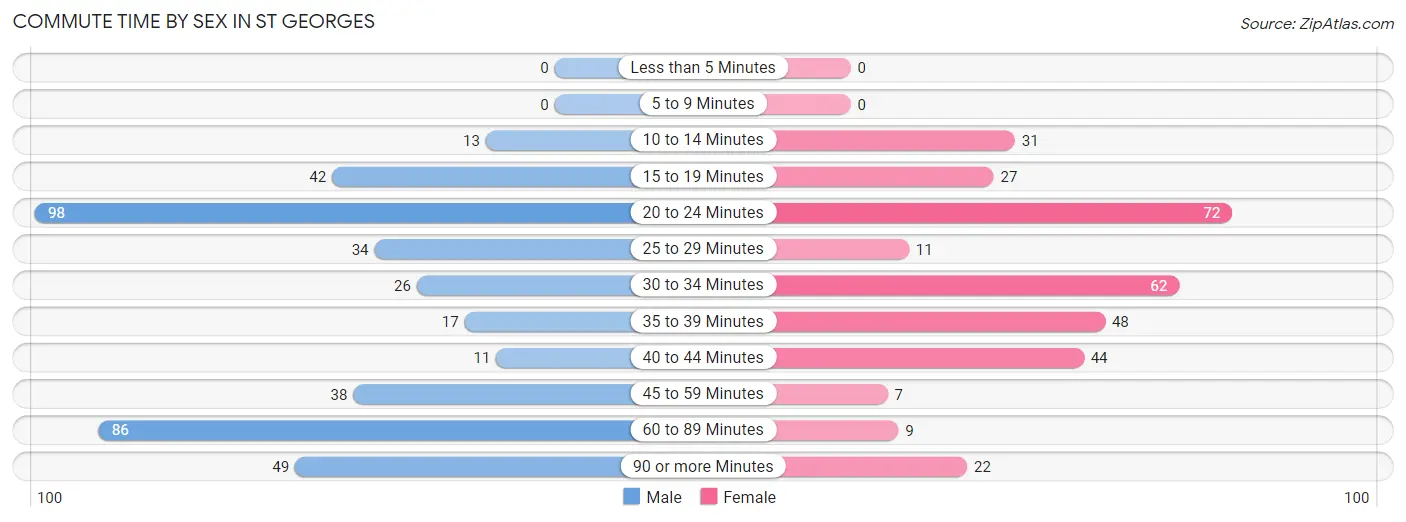
| Commute Time | Male | Female |
| Less than 5 Minutes | 0 (0.0%) | 0 (0.0%) |
| 5 to 9 Minutes | 0 (0.0%) | 0 (0.0%) |
| 10 to 14 Minutes | 13 (3.1%) | 31 (9.3%) |
| 15 to 19 Minutes | 42 (10.1%) | 27 (8.1%) |
| 20 to 24 Minutes | 98 (23.7%) | 72 (21.6%) |
| 25 to 29 Minutes | 34 (8.2%) | 11 (3.3%) |
| 30 to 34 Minutes | 26 (6.3%) | 62 (18.6%) |
| 35 to 39 Minutes | 17 (4.1%) | 48 (14.4%) |
| 40 to 44 Minutes | 11 (2.7%) | 44 (13.2%) |
| 45 to 59 Minutes | 38 (9.2%) | 7 (2.1%) |
| 60 to 89 Minutes | 86 (20.8%) | 9 (2.7%) |
| 90 or more Minutes | 49 (11.8%) | 22 (6.6%) |
Time of Departure to Work by Sex in St Georges
The most frequent times of departure to work in St Georges are 7:30 AM to 7:59 AM (81, 19.6%) for males and 7:00 AM to 7:29 AM (117, 35.1%) for females.
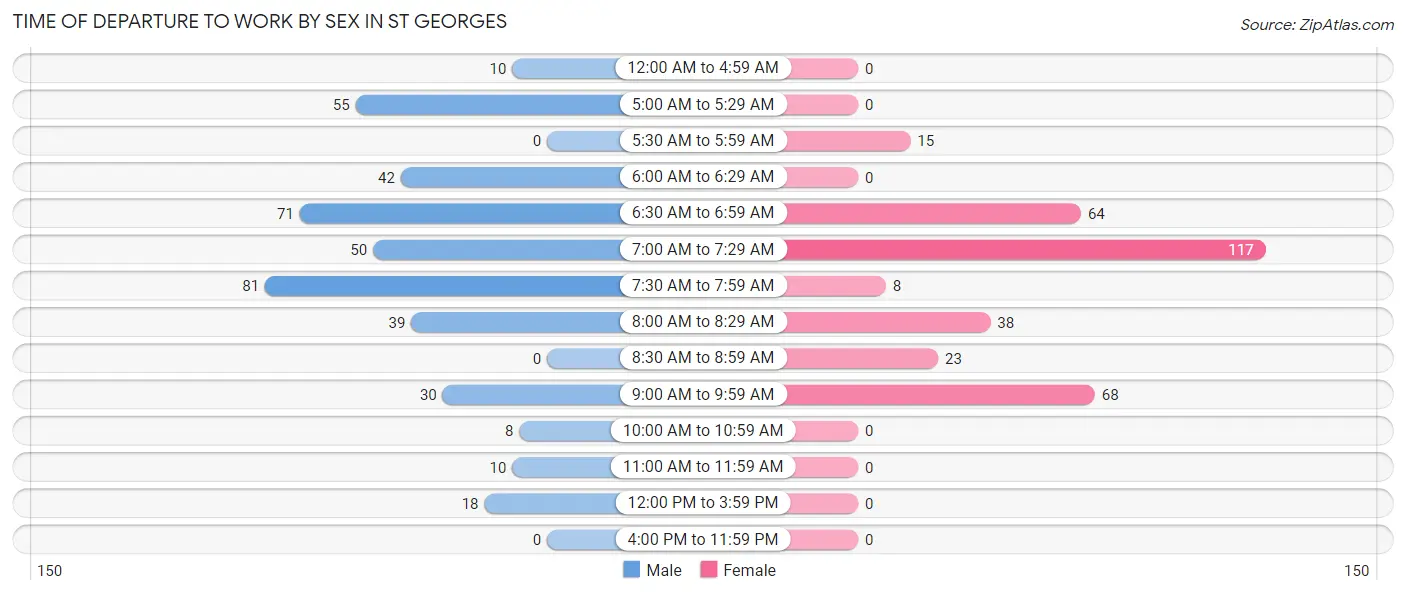
| Time of Departure | Male | Female |
| 12:00 AM to 4:59 AM | 10 (2.4%) | 0 (0.0%) |
| 5:00 AM to 5:29 AM | 55 (13.3%) | 0 (0.0%) |
| 5:30 AM to 5:59 AM | 0 (0.0%) | 15 (4.5%) |
| 6:00 AM to 6:29 AM | 42 (10.1%) | 0 (0.0%) |
| 6:30 AM to 6:59 AM | 71 (17.2%) | 64 (19.2%) |
| 7:00 AM to 7:29 AM | 50 (12.1%) | 117 (35.1%) |
| 7:30 AM to 7:59 AM | 81 (19.6%) | 8 (2.4%) |
| 8:00 AM to 8:29 AM | 39 (9.4%) | 38 (11.4%) |
| 8:30 AM to 8:59 AM | 0 (0.0%) | 23 (6.9%) |
| 9:00 AM to 9:59 AM | 30 (7.2%) | 68 (20.4%) |
| 10:00 AM to 10:59 AM | 8 (1.9%) | 0 (0.0%) |
| 11:00 AM to 11:59 AM | 10 (2.4%) | 0 (0.0%) |
| 12:00 PM to 3:59 PM | 18 (4.3%) | 0 (0.0%) |
| 4:00 PM to 11:59 PM | 0 (0.0%) | 0 (0.0%) |
| Total | 414 (100.0%) | 333 (100.0%) |
Housing Occupancy in St Georges
Occupancy by Ownership in St Georges
Of the total 460 dwellings in St Georges, owner-occupied units account for 412 (89.6%), while renter-occupied units make up 48 (10.4%).
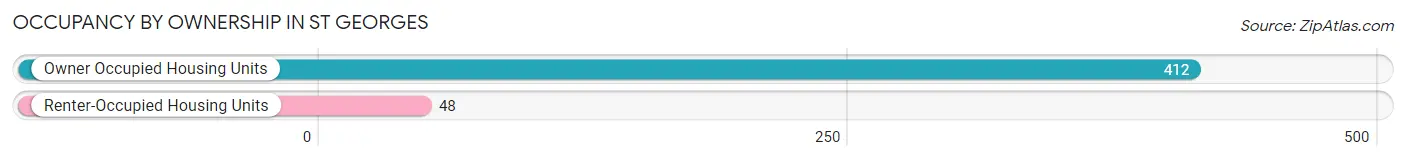
| Occupancy | # Housing Units | % Housing Units |
| Owner Occupied Housing Units | 412 | 89.6% |
| Renter-Occupied Housing Units | 48 | 10.4% |
| Total Occupied Housing Units | 460 | 100.0% |
Occupancy by Household Size in St Georges
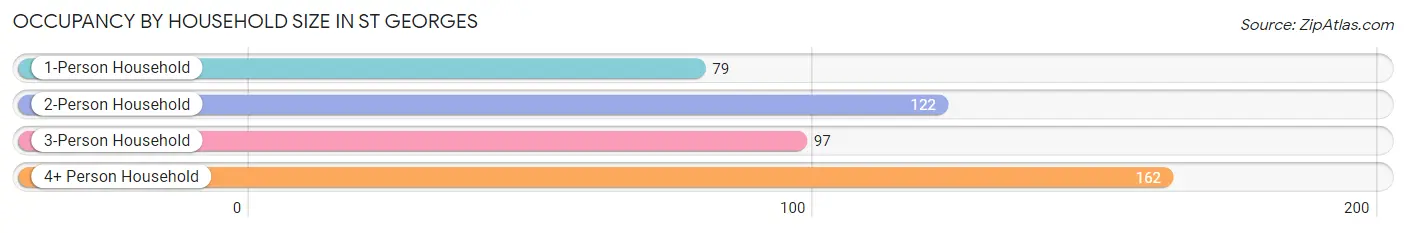
| Household Size | # Housing Units | % Housing Units |
| 1-Person Household | 79 | 17.2% |
| 2-Person Household | 122 | 26.5% |
| 3-Person Household | 97 | 21.1% |
| 4+ Person Household | 162 | 35.2% |
| Total Housing Units | 460 | 100.0% |
Occupancy by Ownership by Household Size in St Georges
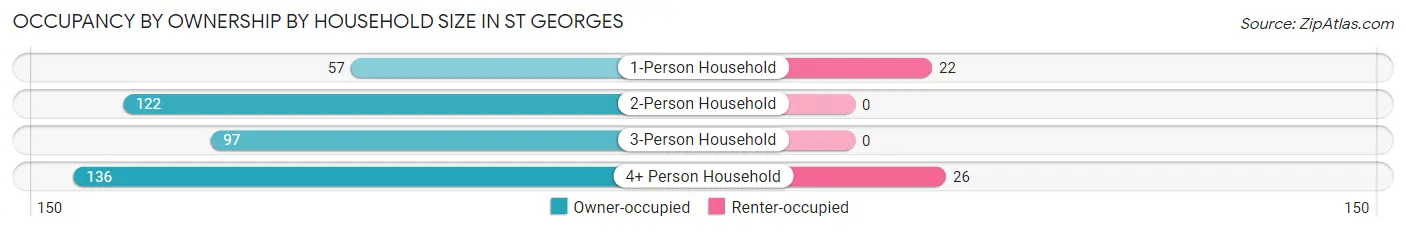
| Household Size | Owner-occupied | Renter-occupied |
| 1-Person Household | 57 (72.2%) | 22 (27.9%) |
| 2-Person Household | 122 (100.0%) | 0 (0.0%) |
| 3-Person Household | 97 (100.0%) | 0 (0.0%) |
| 4+ Person Household | 136 (84.0%) | 26 (16.1%) |
| Total Housing Units | 412 (89.6%) | 48 (10.4%) |
Occupancy by Educational Attainment in St Georges
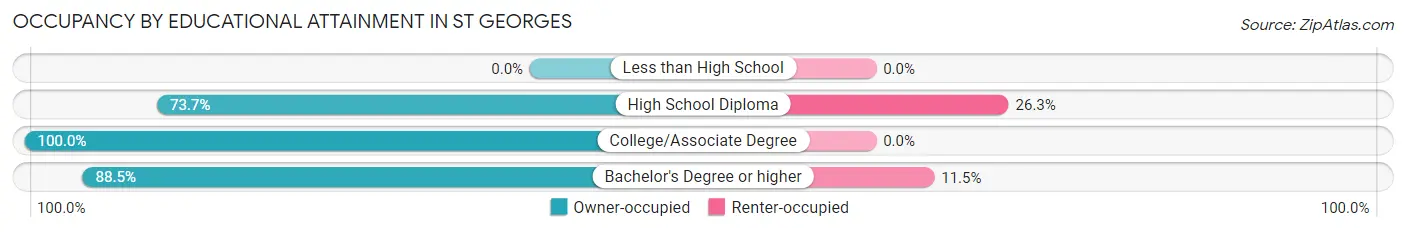
| Household Size | Owner-occupied | Renter-occupied |
| Less than High School | 0 (0.0%) | 0 (0.0%) |
| High School Diploma | 73 (73.7%) | 26 (26.3%) |
| College/Associate Degree | 170 (100.0%) | 0 (0.0%) |
| Bachelor's Degree or higher | 169 (88.5%) | 22 (11.5%) |
Occupancy by Age of Householder in St Georges
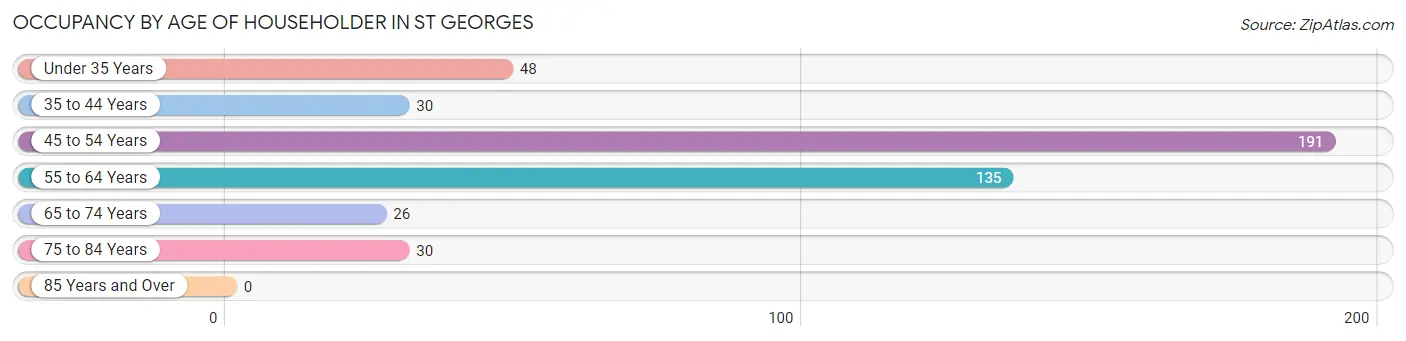
| Age Bracket | # Households | % Households |
| Under 35 Years | 48 | 10.4% |
| 35 to 44 Years | 30 | 6.5% |
| 45 to 54 Years | 191 | 41.5% |
| 55 to 64 Years | 135 | 29.3% |
| 65 to 74 Years | 26 | 5.7% |
| 75 to 84 Years | 30 | 6.5% |
| 85 Years and Over | 0 | 0.0% |
| Total | 460 | 100.0% |
Housing Finances in St Georges
Median Income by Occupancy in St Georges
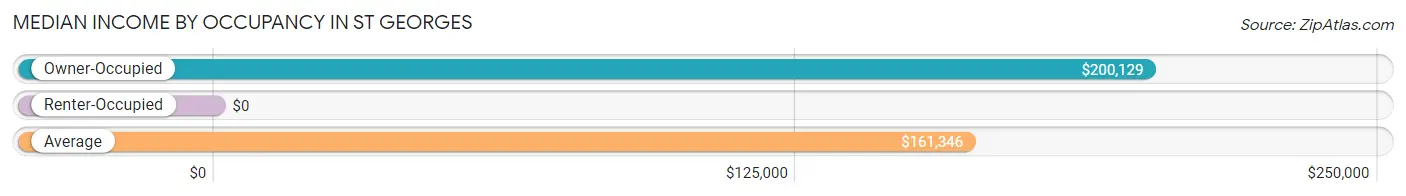
| Occupancy Type | # Households | Median Income |
| Owner-Occupied | 412 (89.6%) | $200,129 |
| Renter-Occupied | 48 (10.4%) | $0 |
| Average | 460 (100.0%) | $161,346 |
Occupancy by Householder Income Bracket in St Georges
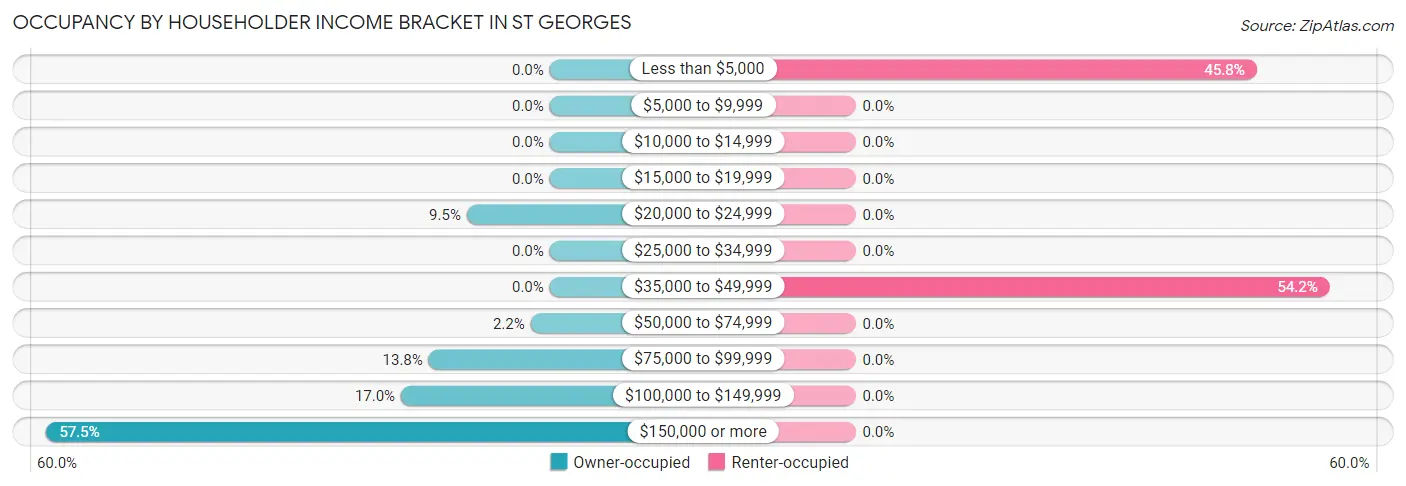
| Income Bracket | Owner-occupied | Renter-occupied |
| Less than $5,000 | 0 (0.0%) | 22 (45.8%) |
| $5,000 to $9,999 | 0 (0.0%) | 0 (0.0%) |
| $10,000 to $14,999 | 0 (0.0%) | 0 (0.0%) |
| $15,000 to $19,999 | 0 (0.0%) | 0 (0.0%) |
| $20,000 to $24,999 | 39 (9.5%) | 0 (0.0%) |
| $25,000 to $34,999 | 0 (0.0%) | 0 (0.0%) |
| $35,000 to $49,999 | 0 (0.0%) | 26 (54.2%) |
| $50,000 to $74,999 | 9 (2.2%) | 0 (0.0%) |
| $75,000 to $99,999 | 57 (13.8%) | 0 (0.0%) |
| $100,000 to $149,999 | 70 (17.0%) | 0 (0.0%) |
| $150,000 or more | 237 (57.5%) | 0 (0.0%) |
| Total | 412 (100.0%) | 48 (100.0%) |
Monthly Housing Cost Tiers in St Georges
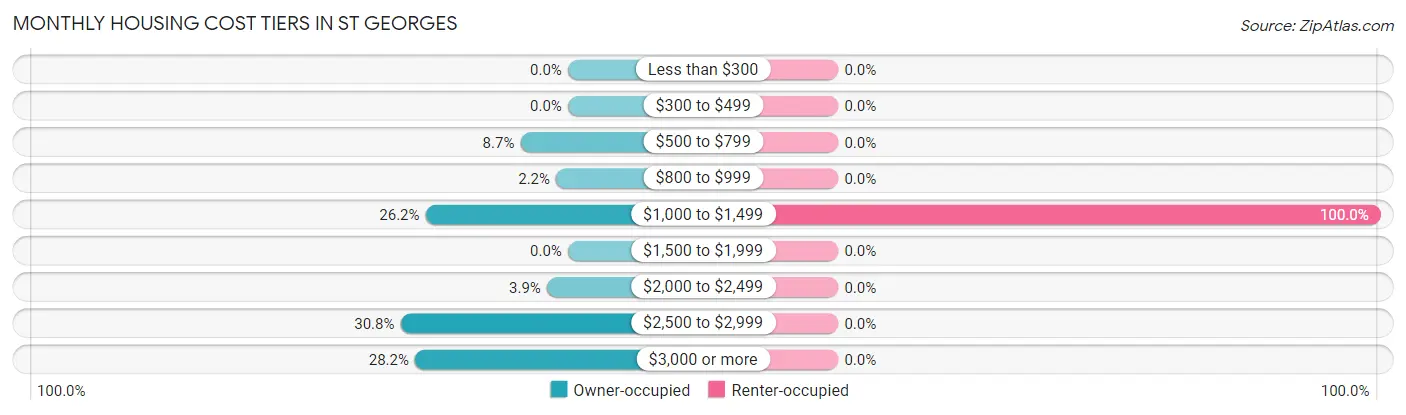
| Monthly Cost | Owner-occupied | Renter-occupied |
| Less than $300 | 0 (0.0%) | 0 (0.0%) |
| $300 to $499 | 0 (0.0%) | 0 (0.0%) |
| $500 to $799 | 36 (8.7%) | 0 (0.0%) |
| $800 to $999 | 9 (2.2%) | 0 (0.0%) |
| $1,000 to $1,499 | 108 (26.2%) | 48 (100.0%) |
| $1,500 to $1,999 | 0 (0.0%) | 0 (0.0%) |
| $2,000 to $2,499 | 16 (3.9%) | 0 (0.0%) |
| $2,500 to $2,999 | 127 (30.8%) | 0 (0.0%) |
| $3,000 or more | 116 (28.2%) | 0 (0.0%) |
| Total | 412 (100.0%) | 48 (100.0%) |
Physical Housing Characteristics in St Georges
Housing Structures in St Georges
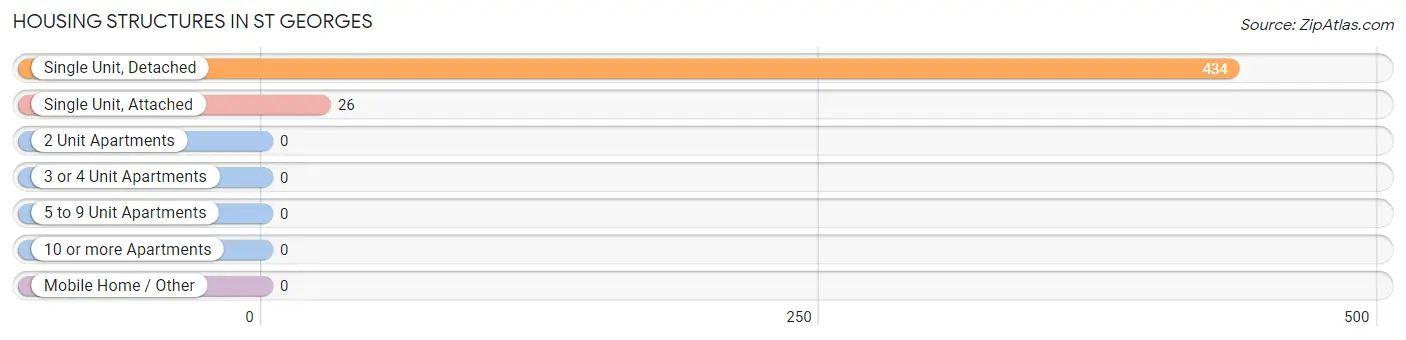
| Structure Type | # Housing Units | % Housing Units |
| Single Unit, Detached | 434 | 94.4% |
| Single Unit, Attached | 26 | 5.7% |
| 2 Unit Apartments | 0 | 0.0% |
| 3 or 4 Unit Apartments | 0 | 0.0% |
| 5 to 9 Unit Apartments | 0 | 0.0% |
| 10 or more Apartments | 0 | 0.0% |
| Mobile Home / Other | 0 | 0.0% |
| Total | 460 | 100.0% |
Housing Structures by Occupancy in St Georges
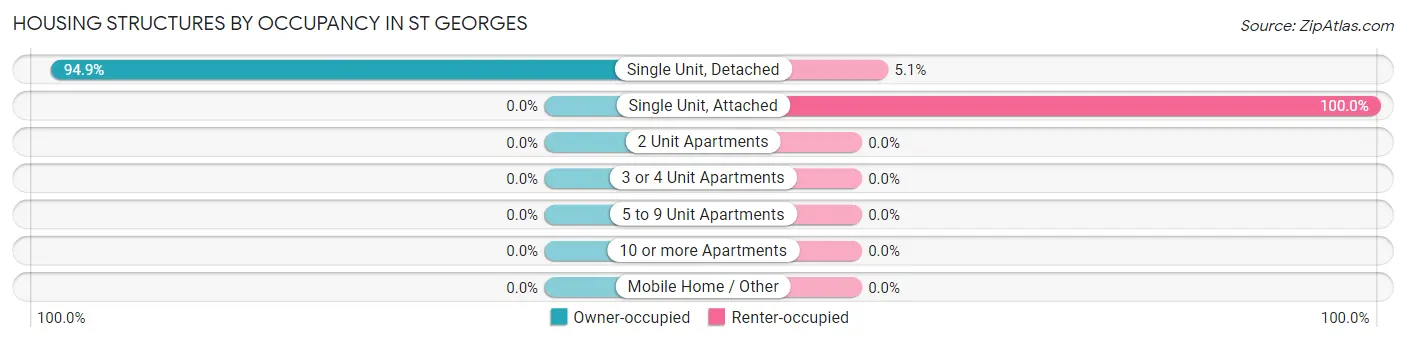
| Structure Type | Owner-occupied | Renter-occupied |
| Single Unit, Detached | 412 (94.9%) | 22 (5.1%) |
| Single Unit, Attached | 0 (0.0%) | 26 (100.0%) |
| 2 Unit Apartments | 0 (0.0%) | 0 (0.0%) |
| 3 or 4 Unit Apartments | 0 (0.0%) | 0 (0.0%) |
| 5 to 9 Unit Apartments | 0 (0.0%) | 0 (0.0%) |
| 10 or more Apartments | 0 (0.0%) | 0 (0.0%) |
| Mobile Home / Other | 0 (0.0%) | 0 (0.0%) |
| Total | 412 (89.6%) | 48 (10.4%) |
Housing Structures by Number of Rooms in St Georges
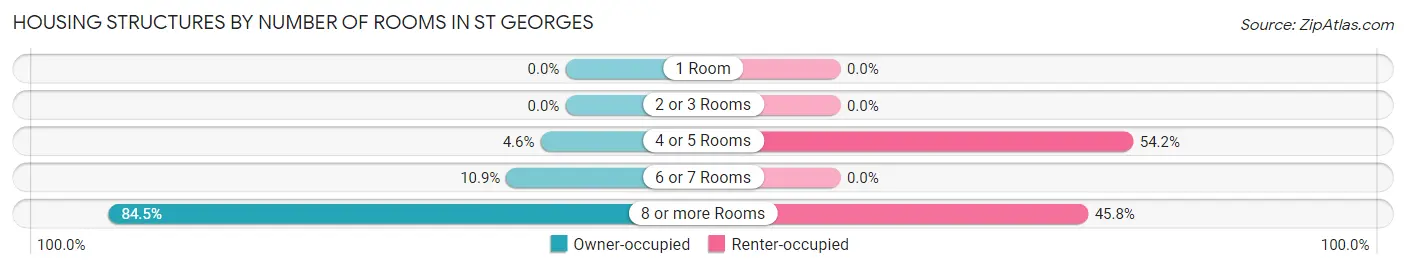
| Number of Rooms | Owner-occupied | Renter-occupied |
| 1 Room | 0 (0.0%) | 0 (0.0%) |
| 2 or 3 Rooms | 0 (0.0%) | 0 (0.0%) |
| 4 or 5 Rooms | 19 (4.6%) | 26 (54.2%) |
| 6 or 7 Rooms | 45 (10.9%) | 0 (0.0%) |
| 8 or more Rooms | 348 (84.5%) | 22 (45.8%) |
| Total | 412 (100.0%) | 48 (100.0%) |
Housing Structure by Heating Type in St Georges
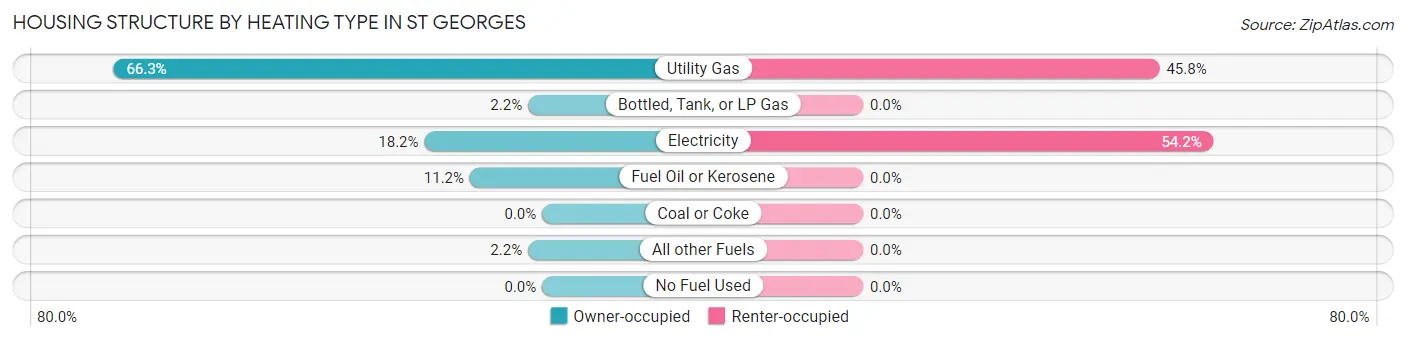
| Heating Type | Owner-occupied | Renter-occupied |
| Utility Gas | 273 (66.3%) | 22 (45.8%) |
| Bottled, Tank, or LP Gas | 9 (2.2%) | 0 (0.0%) |
| Electricity | 75 (18.2%) | 26 (54.2%) |
| Fuel Oil or Kerosene | 46 (11.2%) | 0 (0.0%) |
| Coal or Coke | 0 (0.0%) | 0 (0.0%) |
| All other Fuels | 9 (2.2%) | 0 (0.0%) |
| No Fuel Used | 0 (0.0%) | 0 (0.0%) |
| Total | 412 (100.0%) | 48 (100.0%) |
Household Vehicle Usage in St Georges
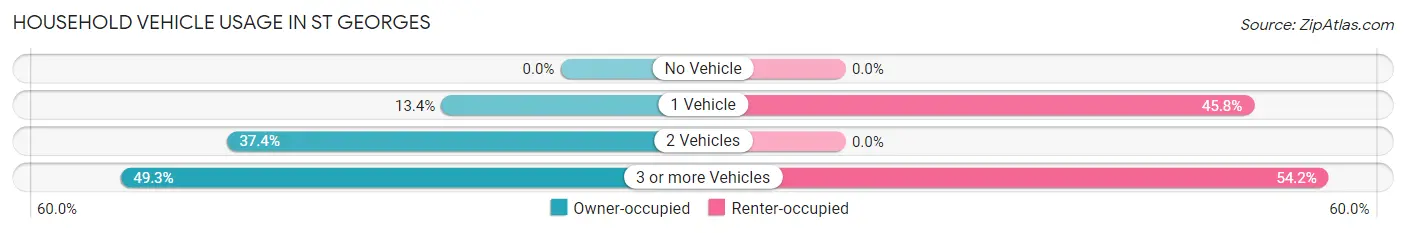
| Vehicles per Household | Owner-occupied | Renter-occupied |
| No Vehicle | 0 (0.0%) | 0 (0.0%) |
| 1 Vehicle | 55 (13.4%) | 22 (45.8%) |
| 2 Vehicles | 154 (37.4%) | 0 (0.0%) |
| 3 or more Vehicles | 203 (49.3%) | 26 (54.2%) |
| Total | 412 (100.0%) | 48 (100.0%) |
Real Estate & Mortgages in St Georges
Real Estate and Mortgage Overview in St Georges
| Characteristic | Without Mortgage | With Mortgage |
| Housing Units | 45 | 367 |
| Median Property Value | $372,200 | $434,300 |
| Median Household Income | $109,609 | $226 |
| Monthly Housing Costs | $690 | $116 |
| Real Estate Taxes | $2,224 | $9 |
Property Value by Mortgage Status in St Georges
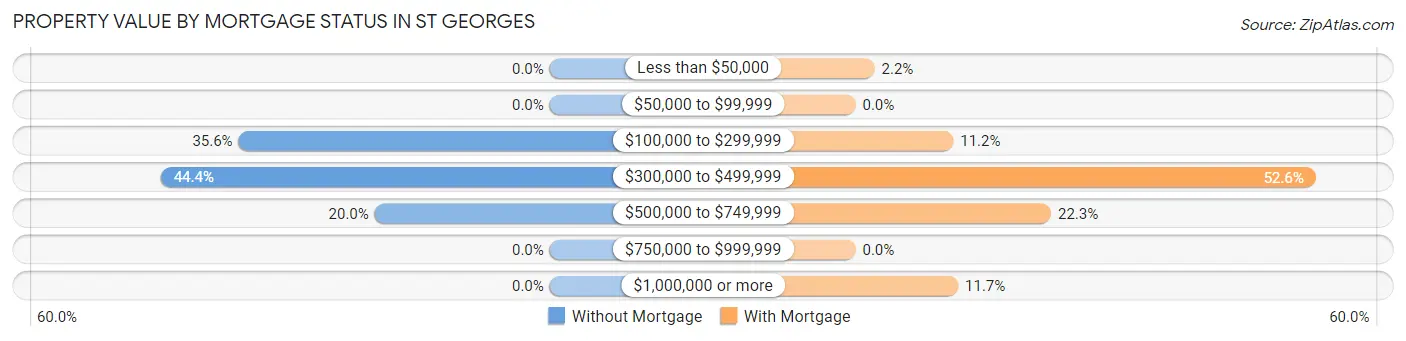
| Property Value | Without Mortgage | With Mortgage |
| Less than $50,000 | 0 (0.0%) | 8 (2.2%) |
| $50,000 to $99,999 | 0 (0.0%) | 0 (0.0%) |
| $100,000 to $299,999 | 16 (35.6%) | 41 (11.2%) |
| $300,000 to $499,999 | 20 (44.4%) | 193 (52.6%) |
| $500,000 to $749,999 | 9 (20.0%) | 82 (22.3%) |
| $750,000 to $999,999 | 0 (0.0%) | 0 (0.0%) |
| $1,000,000 or more | 0 (0.0%) | 43 (11.7%) |
| Total | 45 (100.0%) | 367 (100.0%) |
Household Income by Mortgage Status in St Georges
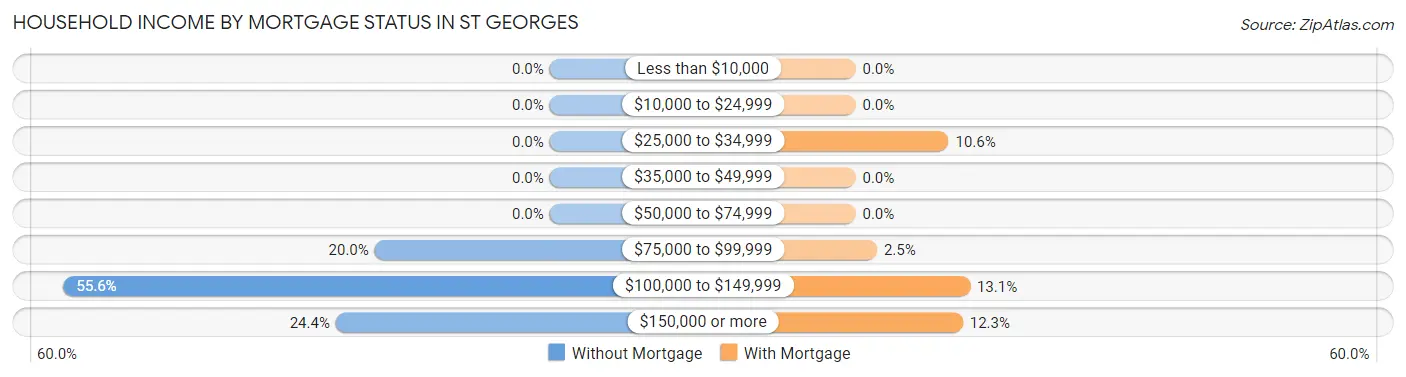
| Household Income | Without Mortgage | With Mortgage |
| Less than $10,000 | 0 (0.0%) | 0 (0.0%) |
| $10,000 to $24,999 | 0 (0.0%) | 0 (0.0%) |
| $25,000 to $34,999 | 0 (0.0%) | 39 (10.6%) |
| $35,000 to $49,999 | 0 (0.0%) | 0 (0.0%) |
| $50,000 to $74,999 | 0 (0.0%) | 0 (0.0%) |
| $75,000 to $99,999 | 9 (20.0%) | 9 (2.5%) |
| $100,000 to $149,999 | 25 (55.6%) | 48 (13.1%) |
| $150,000 or more | 11 (24.4%) | 45 (12.3%) |
| Total | 45 (100.0%) | 367 (100.0%) |
Property Value to Household Income Ratio in St Georges
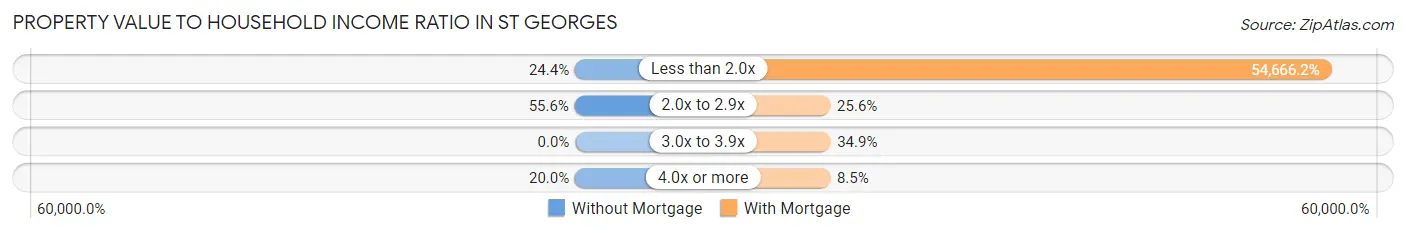
| Value-to-Income Ratio | Without Mortgage | With Mortgage |
| Less than 2.0x | 11 (24.4%) | 200,625 (54,666.2%) |
| 2.0x to 2.9x | 25 (55.6%) | 94 (25.6%) |
| 3.0x to 3.9x | 0 (0.0%) | 128 (34.9%) |
| 4.0x or more | 9 (20.0%) | 31 (8.5%) |
| Total | 45 (100.0%) | 367 (100.0%) |
Real Estate Taxes by Mortgage Status in St Georges
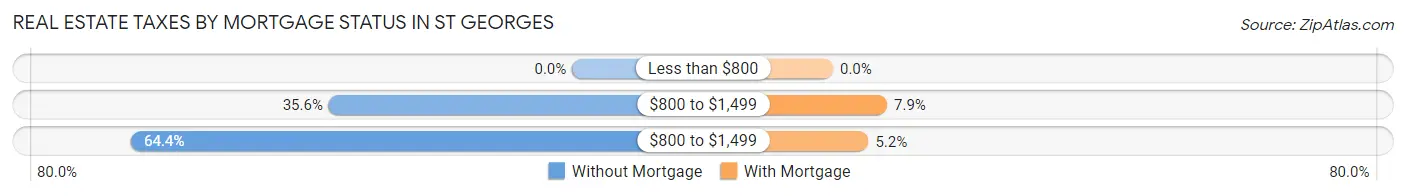
| Property Taxes | Without Mortgage | With Mortgage |
| Less than $800 | 0 (0.0%) | 0 (0.0%) |
| $800 to $1,499 | 16 (35.6%) | 29 (7.9%) |
| $800 to $1,499 | 29 (64.4%) | 19 (5.2%) |
| Total | 45 (100.0%) | 367 (100.0%) |
Health & Disability in St Georges
Health Insurance Coverage by Age in St Georges
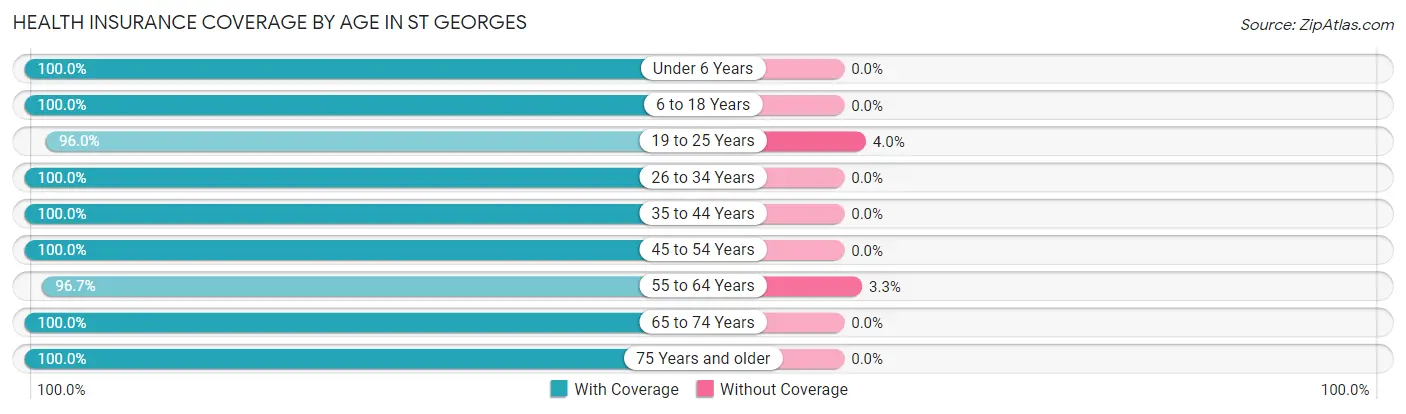
| Age Bracket | With Coverage | Without Coverage |
| Under 6 Years | 45 (100.0%) | 0 (0.0%) |
| 6 to 18 Years | 143 (100.0%) | 0 (0.0%) |
| 19 to 25 Years | 262 (96.0%) | 11 (4.0%) |
| 26 to 34 Years | 48 (100.0%) | 0 (0.0%) |
| 35 to 44 Years | 116 (100.0%) | 0 (0.0%) |
| 45 to 54 Years | 310 (100.0%) | 0 (0.0%) |
| 55 to 64 Years | 262 (96.7%) | 9 (3.3%) |
| 65 to 74 Years | 34 (100.0%) | 0 (0.0%) |
| 75 Years and older | 56 (100.0%) | 0 (0.0%) |
| Total | 1,276 (98.5%) | 20 (1.5%) |
Health Insurance Coverage by Citizenship Status in St Georges

| Citizenship Status | With Coverage | Without Coverage |
| Native Born | 45 (100.0%) | 0 (0.0%) |
| Foreign Born, Citizen | 143 (100.0%) | 0 (0.0%) |
| Foreign Born, not a Citizen | 262 (96.0%) | 11 (4.0%) |
Health Insurance Coverage by Household Income in St Georges
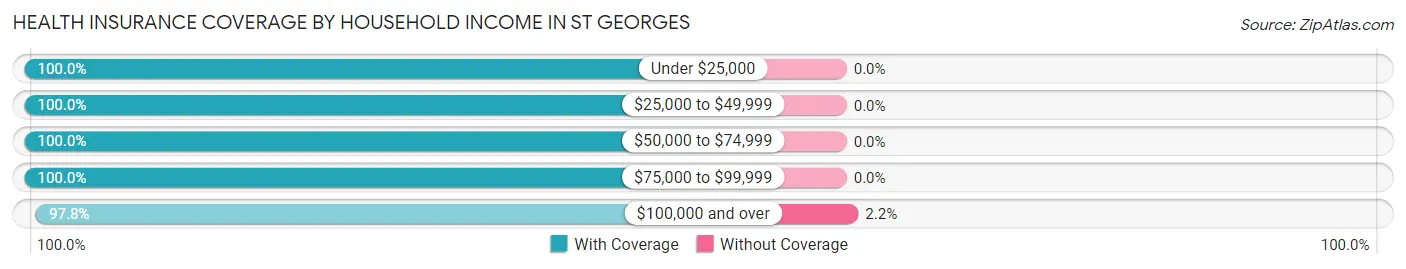
| Household Income | With Coverage | Without Coverage |
| Under $25,000 | 61 (100.0%) | 0 (0.0%) |
| $25,000 to $49,999 | 104 (100.0%) | 0 (0.0%) |
| $50,000 to $74,999 | 22 (100.0%) | 0 (0.0%) |
| $75,000 to $99,999 | 181 (100.0%) | 0 (0.0%) |
| $100,000 and over | 902 (97.8%) | 20 (2.2%) |
Public vs Private Health Insurance Coverage by Age in St Georges
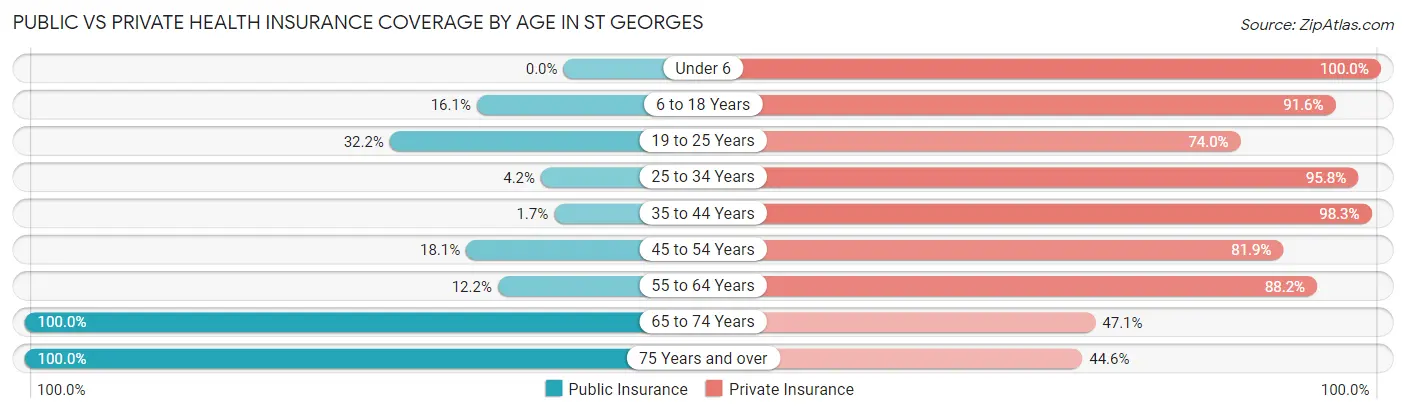
| Age Bracket | Public Insurance | Private Insurance |
| Under 6 | 0 (0.0%) | 45 (100.0%) |
| 6 to 18 Years | 23 (16.1%) | 131 (91.6%) |
| 19 to 25 Years | 88 (32.2%) | 202 (74.0%) |
| 25 to 34 Years | 2 (4.2%) | 46 (95.8%) |
| 35 to 44 Years | 2 (1.7%) | 114 (98.3%) |
| 45 to 54 Years | 56 (18.1%) | 254 (81.9%) |
| 55 to 64 Years | 33 (12.2%) | 239 (88.2%) |
| 65 to 74 Years | 34 (100.0%) | 16 (47.1%) |
| 75 Years and over | 56 (100.0%) | 25 (44.6%) |
| Total | 294 (22.7%) | 1,072 (82.7%) |
Disability Status by Sex by Age in St Georges
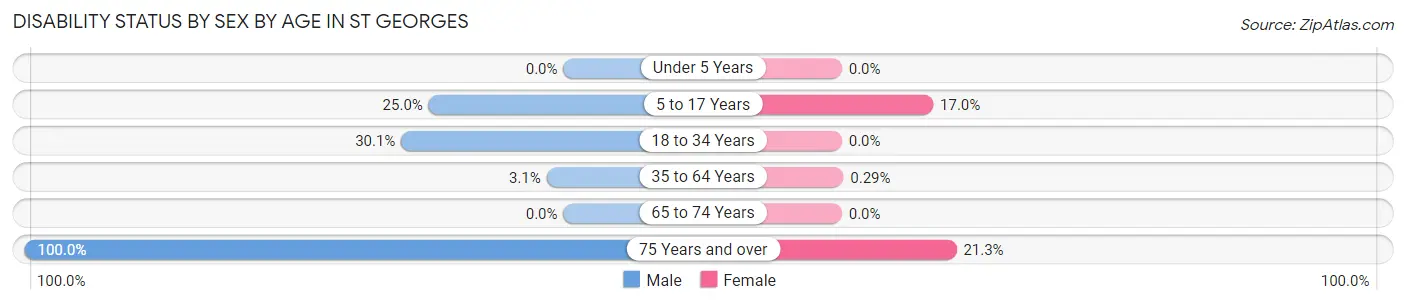
| Age Bracket | Male | Female |
| Under 5 Years | 0 (0.0%) | 0 (0.0%) |
| 5 to 17 Years | 23 (25.0%) | 10 (17.0%) |
| 18 to 34 Years | 59 (30.1%) | 0 (0.0%) |
| 35 to 64 Years | 11 (3.1%) | 1 (0.3%) |
| 65 to 74 Years | 0 (0.0%) | 0 (0.0%) |
| 75 Years and over | 9 (100.0%) | 10 (21.3%) |
Disability Class by Sex by Age in St Georges
Disability Class: Hearing Difficulty
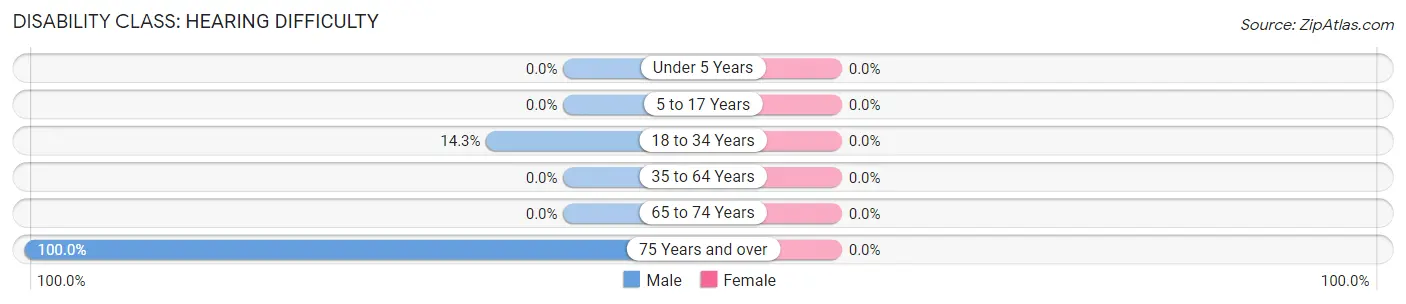
| Age Bracket | Male | Female |
| Under 5 Years | 0 (0.0%) | 0 (0.0%) |
| 5 to 17 Years | 0 (0.0%) | 0 (0.0%) |
| 18 to 34 Years | 28 (14.3%) | 0 (0.0%) |
| 35 to 64 Years | 0 (0.0%) | 0 (0.0%) |
| 65 to 74 Years | 0 (0.0%) | 0 (0.0%) |
| 75 Years and over | 9 (100.0%) | 0 (0.0%) |
Disability Class: Vision Difficulty
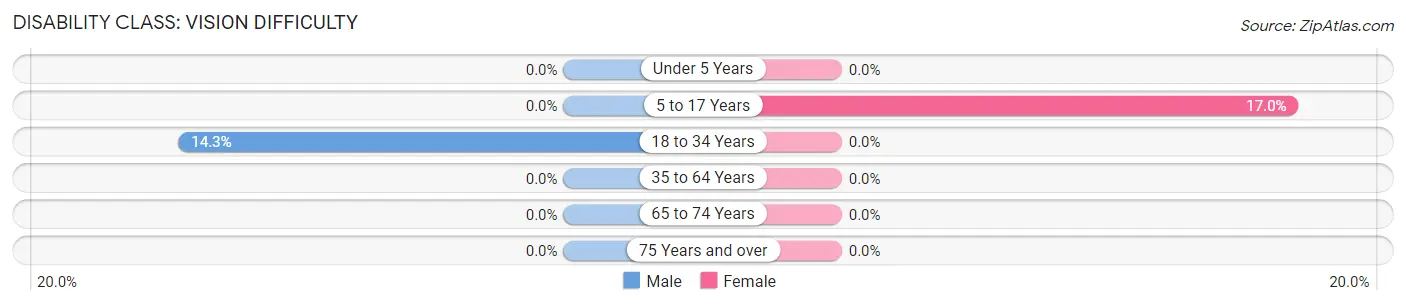
| Age Bracket | Male | Female |
| Under 5 Years | 0 (0.0%) | 0 (0.0%) |
| 5 to 17 Years | 0 (0.0%) | 10 (17.0%) |
| 18 to 34 Years | 28 (14.3%) | 0 (0.0%) |
| 35 to 64 Years | 0 (0.0%) | 0 (0.0%) |
| 65 to 74 Years | 0 (0.0%) | 0 (0.0%) |
| 75 Years and over | 0 (0.0%) | 0 (0.0%) |
Disability Class: Cognitive Difficulty
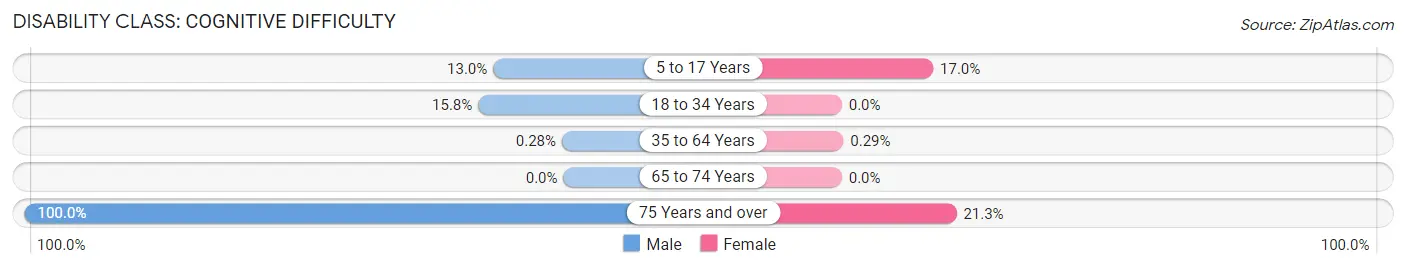
| Age Bracket | Male | Female |
| 5 to 17 Years | 12 (13.0%) | 10 (17.0%) |
| 18 to 34 Years | 31 (15.8%) | 0 (0.0%) |
| 35 to 64 Years | 1 (0.3%) | 1 (0.3%) |
| 65 to 74 Years | 0 (0.0%) | 0 (0.0%) |
| 75 Years and over | 9 (100.0%) | 10 (21.3%) |
Disability Class: Ambulatory Difficulty

| Age Bracket | Male | Female |
| 5 to 17 Years | 0 (0.0%) | 0 (0.0%) |
| 18 to 34 Years | 0 (0.0%) | 0 (0.0%) |
| 35 to 64 Years | 0 (0.0%) | 0 (0.0%) |
| 65 to 74 Years | 0 (0.0%) | 0 (0.0%) |
| 75 Years and over | 9 (100.0%) | 10 (21.3%) |
Disability Class: Self-Care Difficulty

| Age Bracket | Male | Female |
| 5 to 17 Years | 11 (12.0%) | 0 (0.0%) |
| 18 to 34 Years | 0 (0.0%) | 0 (0.0%) |
| 35 to 64 Years | 0 (0.0%) | 0 (0.0%) |
| 65 to 74 Years | 0 (0.0%) | 0 (0.0%) |
| 75 Years and over | 9 (100.0%) | 10 (21.3%) |
Technology Access in St Georges
Computing Device Access in St Georges
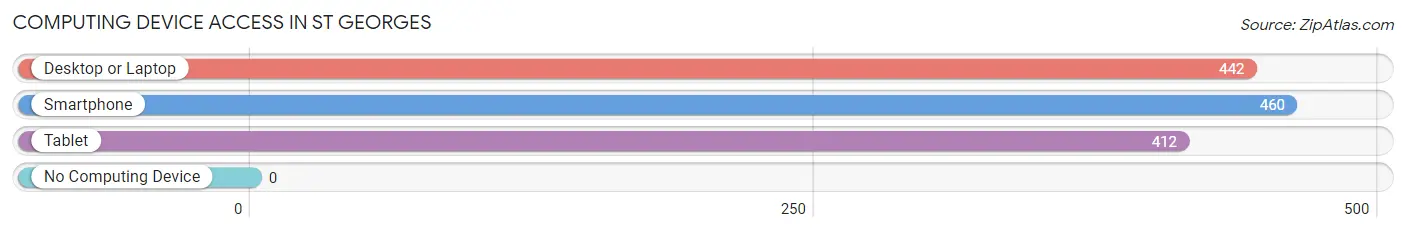
| Device Type | # Households | % Households |
| Desktop or Laptop | 442 | 96.1% |
| Smartphone | 460 | 100.0% |
| Tablet | 412 | 89.6% |
| No Computing Device | 0 | 0.0% |
| Total | 460 | 100.0% |
Internet Access in St Georges
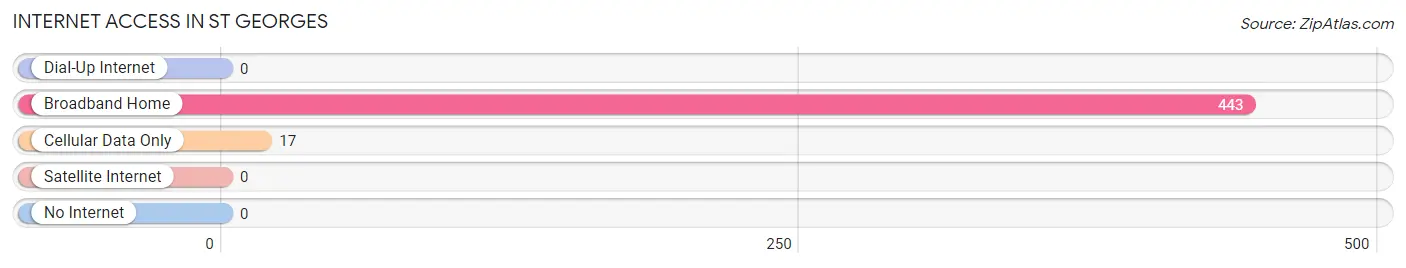
| Internet Type | # Households | % Households |
| Dial-Up Internet | 0 | 0.0% |
| Broadband Home | 443 | 96.3% |
| Cellular Data Only | 17 | 3.7% |
| Satellite Internet | 0 | 0.0% |
| No Internet | 0 | 0.0% |
| Total | 460 | 100.0% |
St Georges Summary
St. Georges is a town located in New Castle County, Delaware, United States. It is located on the Delaware River, about 8 miles south of Wilmington. The population was 4,717 at the 2010 census.
History
St. Georges was first settled in 1638 by Swedish settlers. The town was named after St. George, the patron saint of England. The town was originally part of New Sweden, a Swedish colony that was established in the Delaware Valley. In 1655, the Dutch took control of the colony and renamed it New Netherland. The town was then part of the Dutch colony until 1664, when it was taken over by the English.
The town was incorporated in 1704 and was named after St. George, the patron saint of England. The town was an important port during the colonial period and was a major center for shipbuilding. During the Revolutionary War, St. Georges was a major supply center for the Continental Army.
In the 19th century, St. Georges was an important center for the iron and steel industry. The town was also home to several large shipyards. In the late 19th century, the town was a major center for the production of paper products.
Geography
St. Georges is located at 39°41'14" North, 75°37'17" West (39.6873, -75.6214). The town is located on the Delaware River, about 8 miles south of Wilmington. The town has a total area of 2.2 square miles, all of which is land.
The town is located in the humid subtropical climate zone, with hot, humid summers and mild winters. The average temperature in the summer is around 80°F, and the average temperature in the winter is around 40°F.
Economy
St. Georges is a small town with a population of just over 4,700 people. The town is home to several small businesses, including restaurants, retail stores, and professional services. The town is also home to several manufacturing companies, including a paper mill and a steel mill.
The town is also home to several large employers, including the DuPont Company, which has a large chemical plant in the town. The town is also home to several government agencies, including the Delaware Department of Transportation and the Delaware State Police.
Demographics
As of the 2010 census, the population of St. Georges was 4,717. The racial makeup of the town was 79.3% White, 15.2% African American, 0.5% Native American, 0.7% Asian, 0.1% Pacific Islander, and 4.2% from other races. Hispanic or Latino of any race were 3.2% of the population.
The median household income in St. Georges was $45,938, and the median family income was $54,938. The per capita income for the town was $21,945. About 11.2% of families and 14.2% of the population were below the poverty line, including 19.2% of those under age 18 and 8.2% of those age 65 or over.
Common Questions
What is Per Capita Income in St Georges?
Per Capita income in St Georges is $59,574.
What is the Median Family Income in St Georges?
Median Family Income in St Georges is $200,797.
What is the Median Household income in St Georges?
Median Household Income in St Georges is $161,346.
What is Income or Wage Gap in St Georges?
Income or Wage Gap in St Georges is 33.0%.
Women in St Georges earn 67.0 cents for every dollar earned by a man.
What is Inequality or Gini Index in St Georges?
Inequality or Gini Index in St Georges is 0.38.
What is the Total Population of St Georges?
Total Population of St Georges is 1,304.
What is the Total Male Population of St Georges?
Total Male Population of St Georges is 678.
What is the Total Female Population of St Georges?
Total Female Population of St Georges is 626.
What is the Ratio of Males per 100 Females in St Georges?
There are 108.31 Males per 100 Females in St Georges.
What is the Ratio of Females per 100 Males in St Georges?
There are 92.33 Females per 100 Males in St Georges.
What is the Median Population Age in St Georges?
Median Population Age in St Georges is 46.7 Years.
What is the Average Family Size in St Georges
Average Family Size in St Georges is 3.2 People.
What is the Average Household Size in St Georges
Average Household Size in St Georges is 2.8 People.
How Large is the Labor Force in St Georges?
There are 940 People in the Labor Forcein in St Georges.
What is the Percentage of People in the Labor Force in St Georges?
83.0% of People are in the Labor Force in St Georges.
What is the Unemployment Rate in St Georges?
Unemployment Rate in St Georges is 3.0%.