Greenville, DE Map & Demographics
Greenville Map
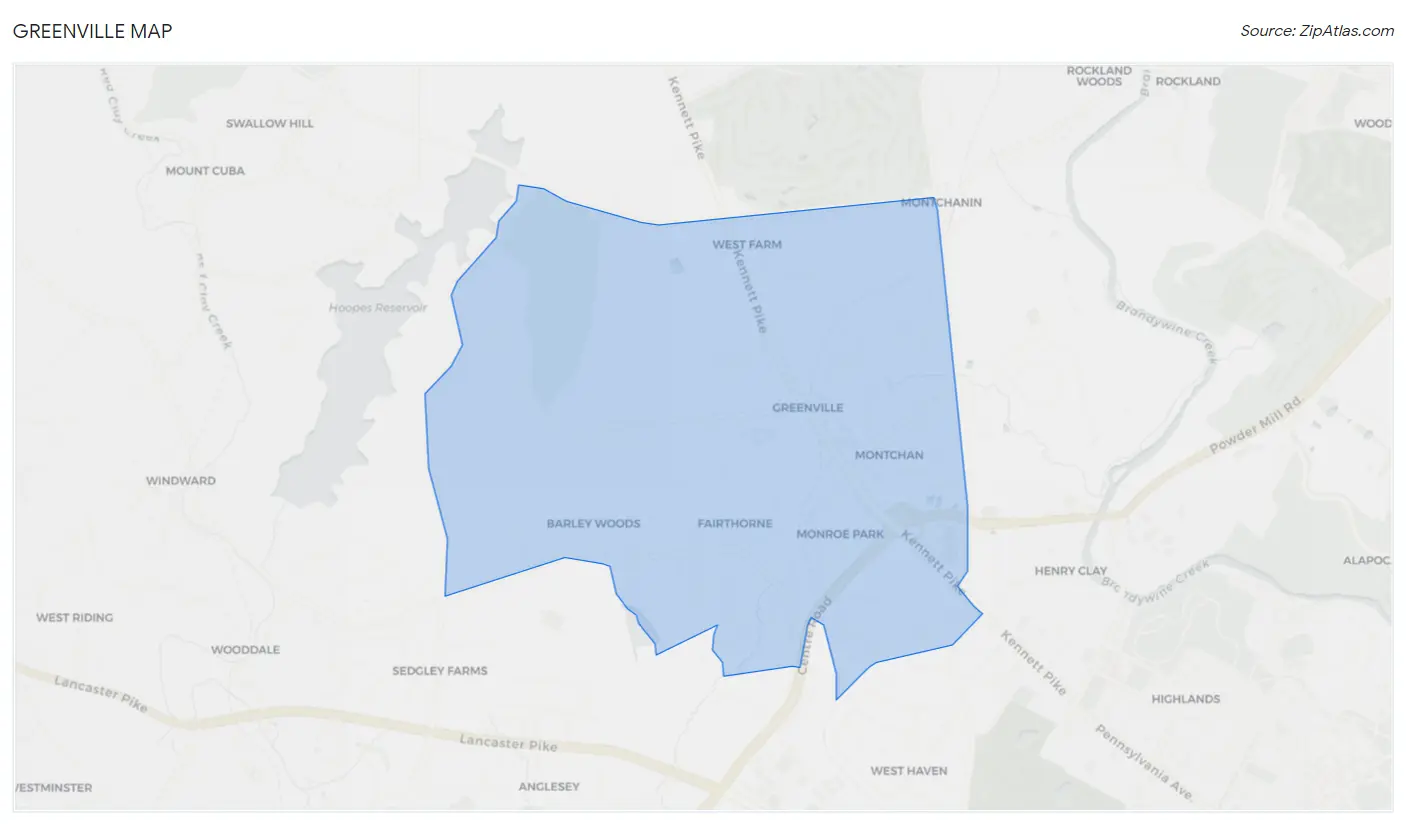
Greenville Overview
$102,638
PER CAPITA INCOME
$229,444
AVG FAMILY INCOME
$133,614
AVG HOUSEHOLD INCOME
47.5%
WAGE / INCOME GAP [ % ]
52.5¢/ $1
WAGE / INCOME GAP [ $ ]
0.49
INEQUALITY / GINI INDEX
2,824
TOTAL POPULATION
1,355
MALE POPULATION
1,469
FEMALE POPULATION
92.24
MALES / 100 FEMALES
108.41
FEMALES / 100 MALES
41.8
MEDIAN AGE
2.9
AVG FAMILY SIZE
2.1
AVG HOUSEHOLD SIZE
1,418
LABOR FORCE [ PEOPLE ]
60.8%
PERCENT IN LABOR FORCE
3.5%
UNEMPLOYMENT RATE
Greenville Area Codes
Income in Greenville
Income Overview in Greenville
Per Capita Income in Greenville is $102,638, while median incomes of families and households are $229,444 and $133,614 respectively.
| Characteristic | Number | Measure |
| Per Capita Income | 2,824 | $102,638 |
| Median Family Income | 738 | $229,444 |
| Mean Family Income | 738 | $314,540 |
| Median Household Income | 1,326 | $133,614 |
| Mean Household Income | 1,326 | $225,997 |
| Income Deficit | 738 | $0 |
| Wage / Income Gap (%) | 2,824 | 47.53% |
| Wage / Income Gap ($) | 2,824 | 52.47¢ per $1 |
| Gini / Inequality Index | 2,824 | 0.49 |
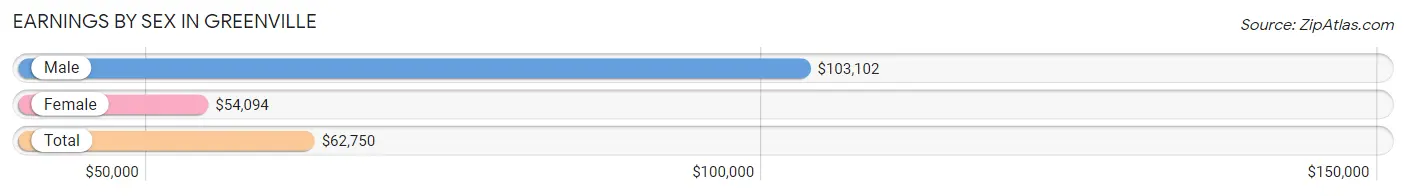
Earnings by Sex in Greenville
Average Earnings in Greenville are $62,750, $103,102 for men and $54,094 for women, a difference of 47.5%.
| Sex | Number | Average Earnings |
| Male | 741 (50.6%) | $103,102 |
| Female | 723 (49.4%) | $54,094 |
| Total | 1,464 (100.0%) | $62,750 |
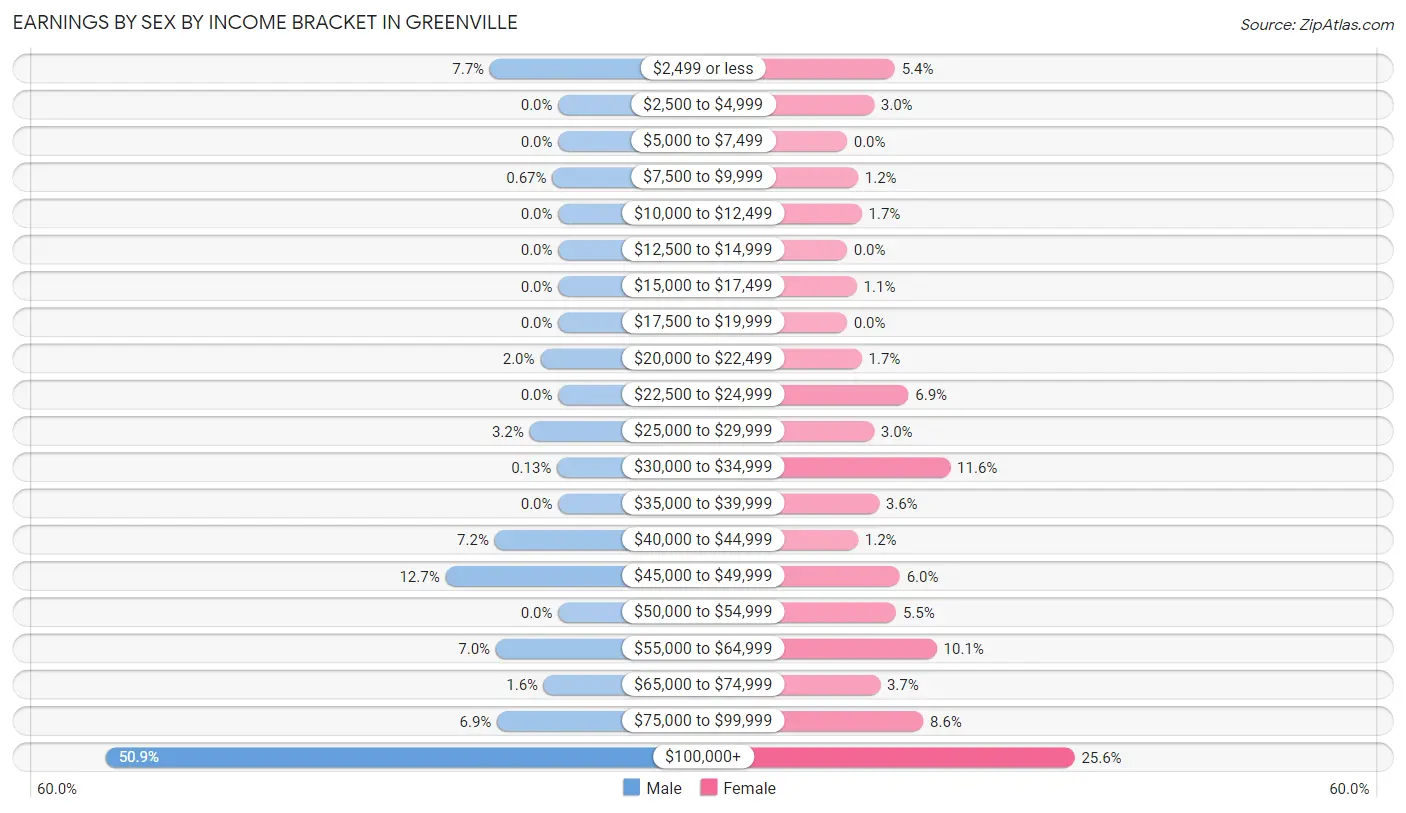
Earnings by Sex by Income Bracket in Greenville
The most common earnings brackets in Greenville are $100,000+ for men (377 | 50.9%) and $100,000+ for women (185 | 25.6%).
| Income | Male | Female |
| $2,499 or less | 57 (7.7%) | 39 (5.4%) |
| $2,500 to $4,999 | 0 (0.0%) | 22 (3.0%) |
| $5,000 to $7,499 | 0 (0.0%) | 0 (0.0%) |
| $7,500 to $9,999 | 5 (0.7%) | 9 (1.2%) |
| $10,000 to $12,499 | 0 (0.0%) | 12 (1.7%) |
| $12,500 to $14,999 | 0 (0.0%) | 0 (0.0%) |
| $15,000 to $17,499 | 0 (0.0%) | 8 (1.1%) |
| $17,500 to $19,999 | 0 (0.0%) | 0 (0.0%) |
| $20,000 to $22,499 | 15 (2.0%) | 12 (1.7%) |
| $22,500 to $24,999 | 0 (0.0%) | 50 (6.9%) |
| $25,000 to $29,999 | 24 (3.2%) | 22 (3.0%) |
| $30,000 to $34,999 | 1 (0.1%) | 84 (11.6%) |
| $35,000 to $39,999 | 0 (0.0%) | 26 (3.6%) |
| $40,000 to $44,999 | 53 (7.1%) | 9 (1.2%) |
| $45,000 to $49,999 | 94 (12.7%) | 43 (5.9%) |
| $50,000 to $54,999 | 0 (0.0%) | 40 (5.5%) |
| $55,000 to $64,999 | 52 (7.0%) | 73 (10.1%) |
| $65,000 to $74,999 | 12 (1.6%) | 27 (3.7%) |
| $75,000 to $99,999 | 51 (6.9%) | 62 (8.6%) |
| $100,000+ | 377 (50.9%) | 185 (25.6%) |
| Total | 741 (100.0%) | 723 (100.0%) |
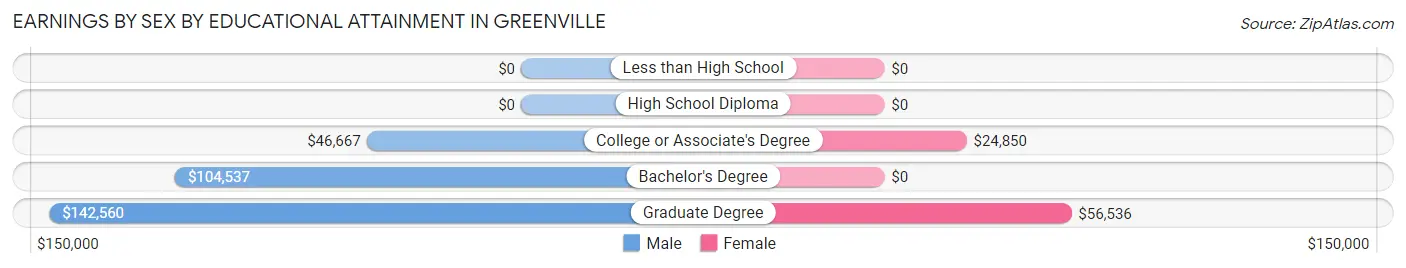
Earnings by Sex by Educational Attainment in Greenville
Average earnings in Greenville are $115,833 for men and $54,875 for women, a difference of 52.6%. Men with an educational attainment of graduate degree enjoy the highest average annual earnings of $142,560, while those with college or associate's degree education earn the least with $46,667. Women with an educational attainment of graduate degree earn the most with the average annual earnings of $56,536, while those with college or associate's degree education have the smallest earnings of $24,850.
| Educational Attainment | Male Income | Female Income |
| Less than High School | - | - |
| High School Diploma | - | - |
| College or Associate's Degree | $46,667 | $24,850 |
| Bachelor's Degree | $104,537 | $0 |
| Graduate Degree | $142,560 | $56,536 |
| Total | $115,833 | $54,875 |
Family Income in Greenville
Family Income Brackets in Greenville
According to the Greenville family income data, there are 386 families falling into the $200,000+ income range, which is the most common income bracket and makes up 52.3% of all families.
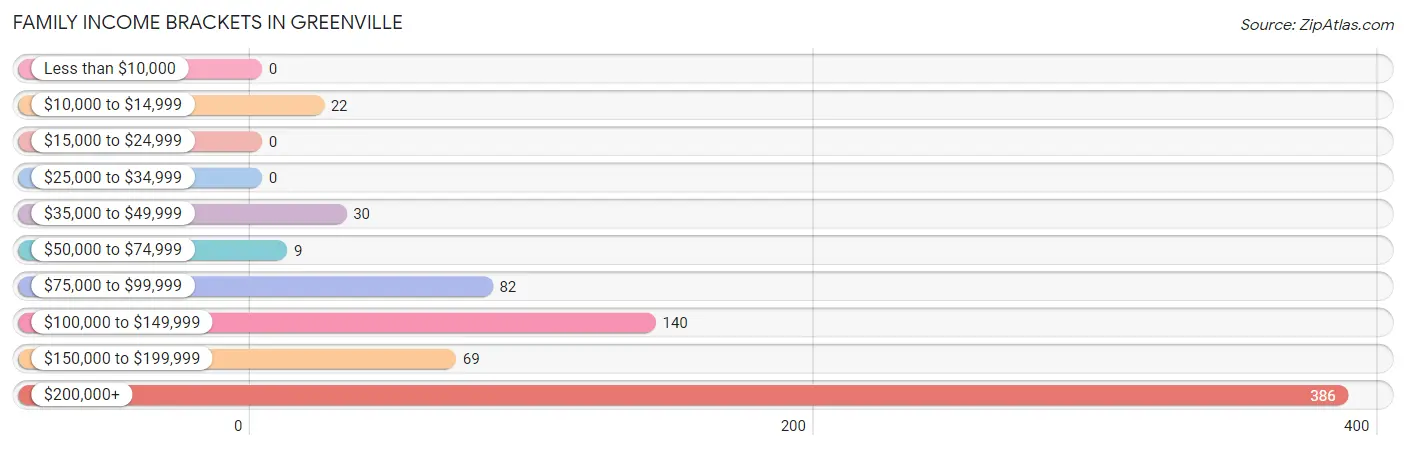
| Income Bracket | # Families | % Families |
| Less than $10,000 | 0 | 0.0% |
| $10,000 to $14,999 | 22 | 3.0% |
| $15,000 to $24,999 | 0 | 0.0% |
| $25,000 to $34,999 | 0 | 0.0% |
| $35,000 to $49,999 | 30 | 4.1% |
| $50,000 to $74,999 | 9 | 1.2% |
| $75,000 to $99,999 | 82 | 11.1% |
| $100,000 to $149,999 | 140 | 19.0% |
| $150,000 to $199,999 | 69 | 9.3% |
| $200,000+ | 386 | 52.3% |
Family Income by Famaliy Size in Greenville
3-person families (192 | 26.0%) account for the highest median family income in Greenville with $244,808 per family, while 2-person families (383 | 51.9%) have the highest median income of $115,352 per family member.
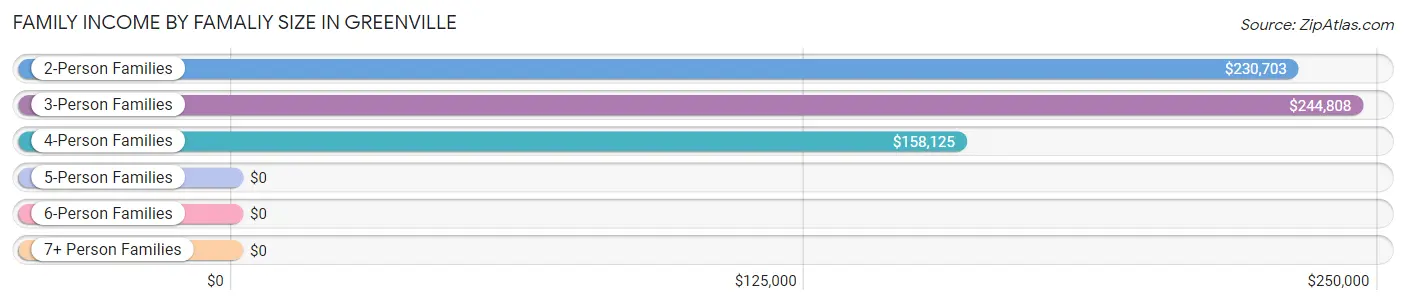
| Income Bracket | # Families | Median Income |
| 2-Person Families | 383 (51.9%) | $230,703 |
| 3-Person Families | 192 (26.0%) | $244,808 |
| 4-Person Families | 128 (17.3%) | $158,125 |
| 5-Person Families | 25 (3.4%) | $0 |
| 6-Person Families | 10 (1.4%) | $0 |
| 7+ Person Families | 0 (0.0%) | $0 |
| Total | 738 (100.0%) | $229,444 |
Family Income by Number of Earners in Greenville
The median family income in Greenville is $229,444, with families comprising no earners (123) having the highest median family income of $250,001, while families with 1 earner (388) have the lowest median family income of $142,632, accounting for 16.7% and 52.6% of families, respectively.
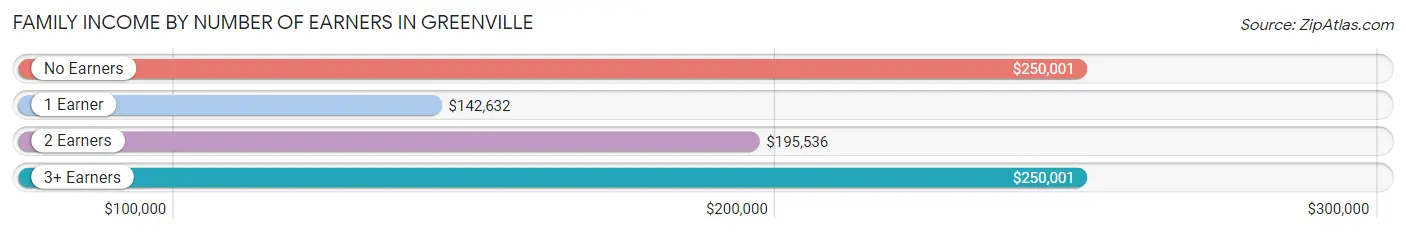
| Number of Earners | # Families | Median Income |
| No Earners | 123 (16.7%) | $250,001 |
| 1 Earner | 388 (52.6%) | $142,632 |
| 2 Earners | 169 (22.9%) | $195,536 |
| 3+ Earners | 58 (7.9%) | $250,001 |
| Total | 738 (100.0%) | $229,444 |
Household Income in Greenville
Household Income Brackets in Greenville
With 489 households falling in the category, the $200,000+ income range is the most frequent in Greenville, accounting for 36.9% of all households. In contrast, only 12 households (0.9%) fall into the $15,000 to $24,999 income bracket, making it the least populous group.
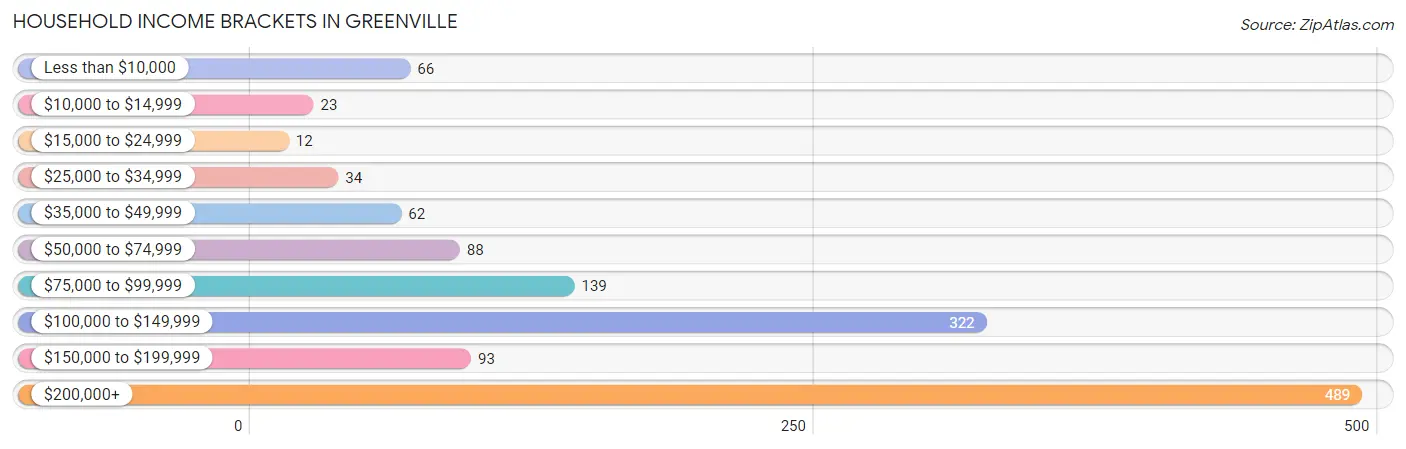
| Income Bracket | # Households | % Households |
| Less than $10,000 | 66 | 5.0% |
| $10,000 to $14,999 | 23 | 1.7% |
| $15,000 to $24,999 | 12 | 0.9% |
| $25,000 to $34,999 | 34 | 2.6% |
| $35,000 to $49,999 | 62 | 4.7% |
| $50,000 to $74,999 | 88 | 6.6% |
| $75,000 to $99,999 | 139 | 10.5% |
| $100,000 to $149,999 | 322 | 24.3% |
| $150,000 to $199,999 | 93 | 7.0% |
| $200,000+ | 489 | 36.9% |
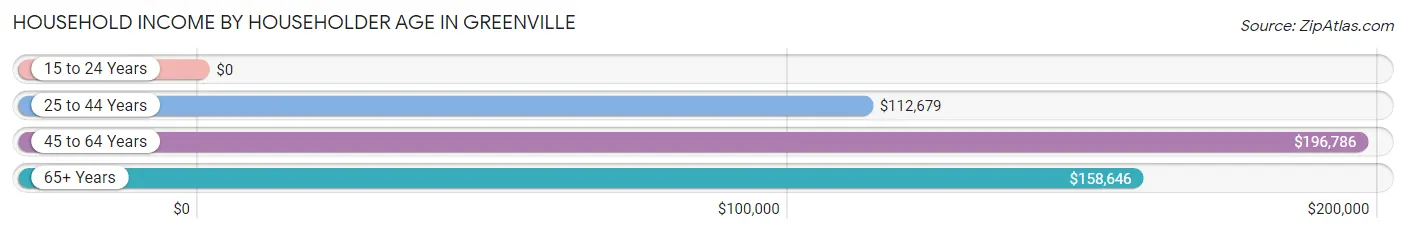
Household Income by Householder Age in Greenville
The median household income in Greenville is $133,614, with the highest median household income of $196,786 found in the 45 to 64 years age bracket for the primary householder. A total of 398 households (30.0%) fall into this category. Meanwhile, the 15 to 24 years age bracket for the primary householder has the lowest median household income of $0, with 49 households (3.7%) in this group.
| Income Bracket | # Households | Median Income |
| 15 to 24 Years | 49 (3.7%) | $0 |
| 25 to 44 Years | 446 (33.6%) | $112,679 |
| 45 to 64 Years | 398 (30.0%) | $196,786 |
| 65+ Years | 433 (32.7%) | $158,646 |
| Total | 1,326 (100.0%) | $133,614 |
Poverty in Greenville
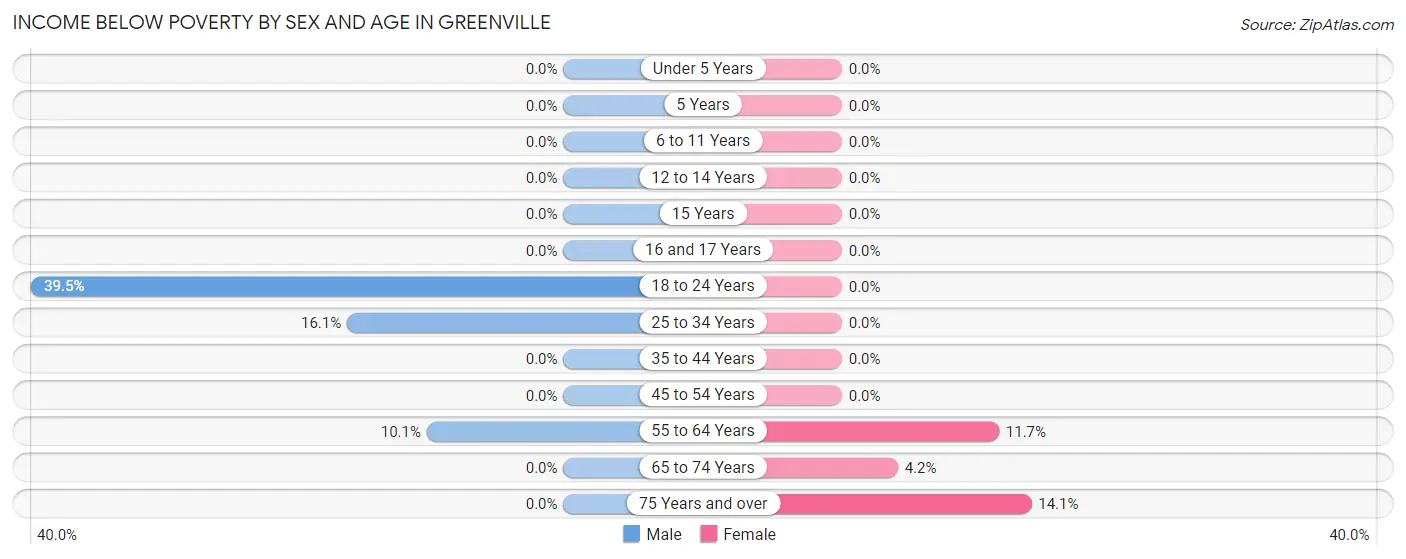
Income Below Poverty by Sex and Age in Greenville
With 6.3% poverty level for males and 3.7% for females among the residents of Greenville, 18 to 24 year old males and 75 year old and over females are the most vulnerable to poverty, with 32 males (39.5%) and 28 females (14.1%) in their respective age groups living below the poverty level.
| Age Bracket | Male | Female |
| Under 5 Years | 0 (0.0%) | 0 (0.0%) |
| 5 Years | 0 (0.0%) | 0 (0.0%) |
| 6 to 11 Years | 0 (0.0%) | 0 (0.0%) |
| 12 to 14 Years | 0 (0.0%) | 0 (0.0%) |
| 15 Years | 0 (0.0%) | 0 (0.0%) |
| 16 and 17 Years | 0 (0.0%) | 0 (0.0%) |
| 18 to 24 Years | 32 (39.5%) | 0 (0.0%) |
| 25 to 34 Years | 31 (16.1%) | 0 (0.0%) |
| 35 to 44 Years | 0 (0.0%) | 0 (0.0%) |
| 45 to 54 Years | 0 (0.0%) | 0 (0.0%) |
| 55 to 64 Years | 22 (10.1%) | 19 (11.7%) |
| 65 to 74 Years | 0 (0.0%) | 8 (4.2%) |
| 75 Years and over | 0 (0.0%) | 28 (14.1%) |
| Total | 85 (6.3%) | 55 (3.7%) |
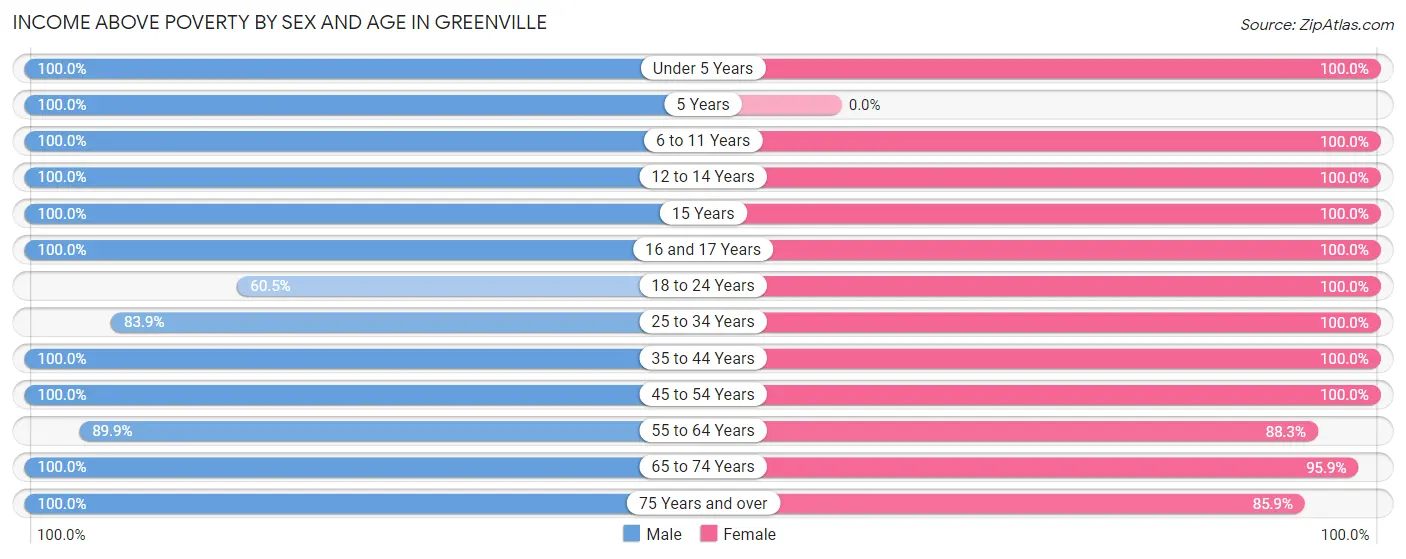
Income Above Poverty by Sex and Age in Greenville
According to the poverty statistics in Greenville, males aged under 5 years and females aged under 5 years are the age groups that are most secure financially, with 100.0% of males and 100.0% of females in these age groups living above the poverty line.
| Age Bracket | Male | Female |
| Under 5 Years | 102 (100.0%) | 63 (100.0%) |
| 5 Years | 41 (100.0%) | 0 (0.0%) |
| 6 to 11 Years | 70 (100.0%) | 109 (100.0%) |
| 12 to 14 Years | 55 (100.0%) | 34 (100.0%) |
| 15 Years | 8 (100.0%) | 8 (100.0%) |
| 16 and 17 Years | 36 (100.0%) | 47 (100.0%) |
| 18 to 24 Years | 49 (60.5%) | 19 (100.0%) |
| 25 to 34 Years | 162 (83.9%) | 284 (100.0%) |
| 35 to 44 Years | 111 (100.0%) | 175 (100.0%) |
| 45 to 54 Years | 177 (100.0%) | 174 (100.0%) |
| 55 to 64 Years | 195 (89.9%) | 144 (88.3%) |
| 65 to 74 Years | 136 (100.0%) | 185 (95.9%) |
| 75 Years and over | 128 (100.0%) | 171 (85.9%) |
| Total | 1,270 (93.7%) | 1,413 (96.3%) |
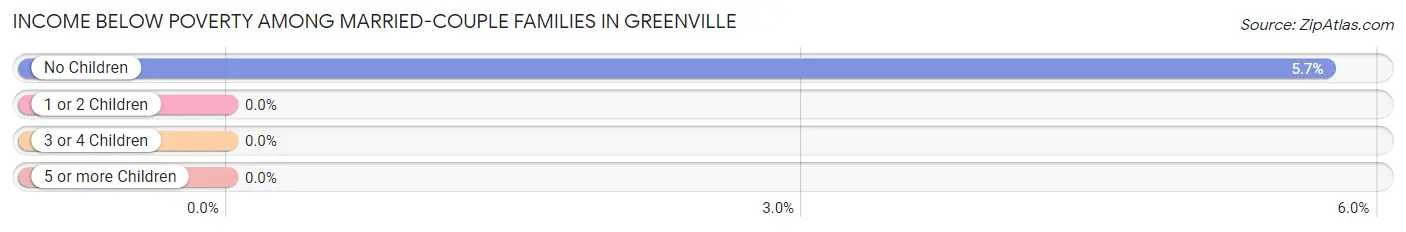
Income Below Poverty Among Married-Couple Families in Greenville
The poverty statistics for married-couple families in Greenville show that 3.4% or 22 of the total 657 families live below the poverty line. Families with no children have the highest poverty rate of 5.7%, comprising of 22 families. On the other hand, families with 1 or 2 children have the lowest poverty rate of 0.0%, which includes 0 families.
| Children | Above Poverty | Below Poverty |
| No Children | 362 (94.3%) | 22 (5.7%) |
| 1 or 2 Children | 238 (100.0%) | 0 (0.0%) |
| 3 or 4 Children | 35 (100.0%) | 0 (0.0%) |
| 5 or more Children | 0 (0.0%) | 0 (0.0%) |
| Total | 635 (96.7%) | 22 (3.4%) |
Income Below Poverty Among Single-Parent Households in Greenville
| Children | Single Father | Single Mother |
| No Children | 0 (0.0%) | 0 (0.0%) |
| 1 or 2 Children | 0 (0.0%) | 0 (0.0%) |
| 3 or 4 Children | 0 (0.0%) | 0 (0.0%) |
| 5 or more Children | 0 (0.0%) | 0 (0.0%) |
| Total | 0 (0.0%) | 0 (0.0%) |
Income Below Poverty Among Married-Couple vs Single-Parent Households in Greenville
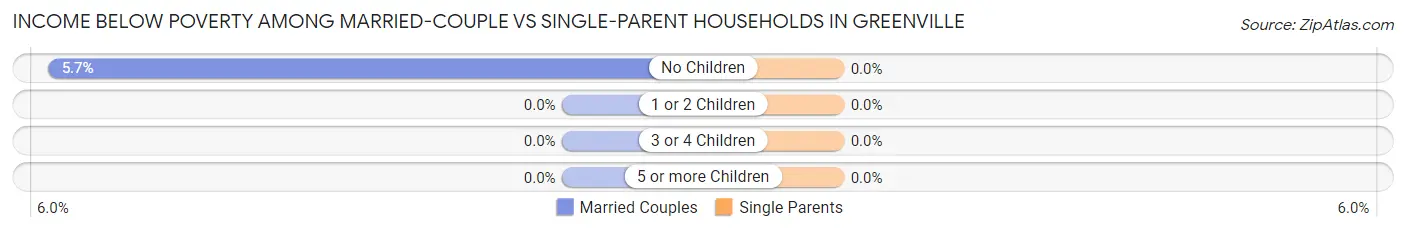
| Children | Married-Couple Families | Single-Parent Households |
| No Children | 22 (5.7%) | 0 (0.0%) |
| 1 or 2 Children | 0 (0.0%) | 0 (0.0%) |
| 3 or 4 Children | 0 (0.0%) | 0 (0.0%) |
| 5 or more Children | 0 (0.0%) | 0 (0.0%) |
| Total | 22 (3.4%) | 0 (0.0%) |
Race in Greenville
The most populous races in Greenville are White / Caucasian (2,146 | 76.0%), Asian (445 | 15.8%), and Black / African American (115 | 4.1%).
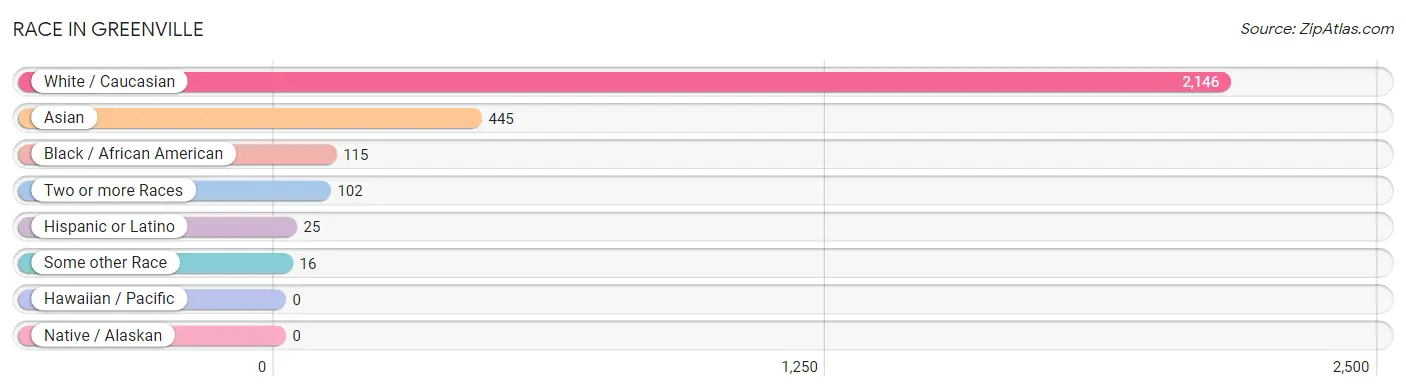
| Race | # Population | % Population |
| Asian | 445 | 15.8% |
| Black / African American | 115 | 4.1% |
| Hawaiian / Pacific | 0 | 0.0% |
| Hispanic or Latino | 25 | 0.9% |
| Native / Alaskan | 0 | 0.0% |
| White / Caucasian | 2,146 | 76.0% |
| Two or more Races | 102 | 3.6% |
| Some other Race | 16 | 0.6% |
| Total | 2,824 | 100.0% |
Ancestry in Greenville
The most populous ancestries reported in Greenville are Irish (436 | 15.4%), English (387 | 13.7%), Thai (353 | 12.5%), German (315 | 11.2%), and Italian (177 | 6.3%), together accounting for 59.1% of all Greenville residents.
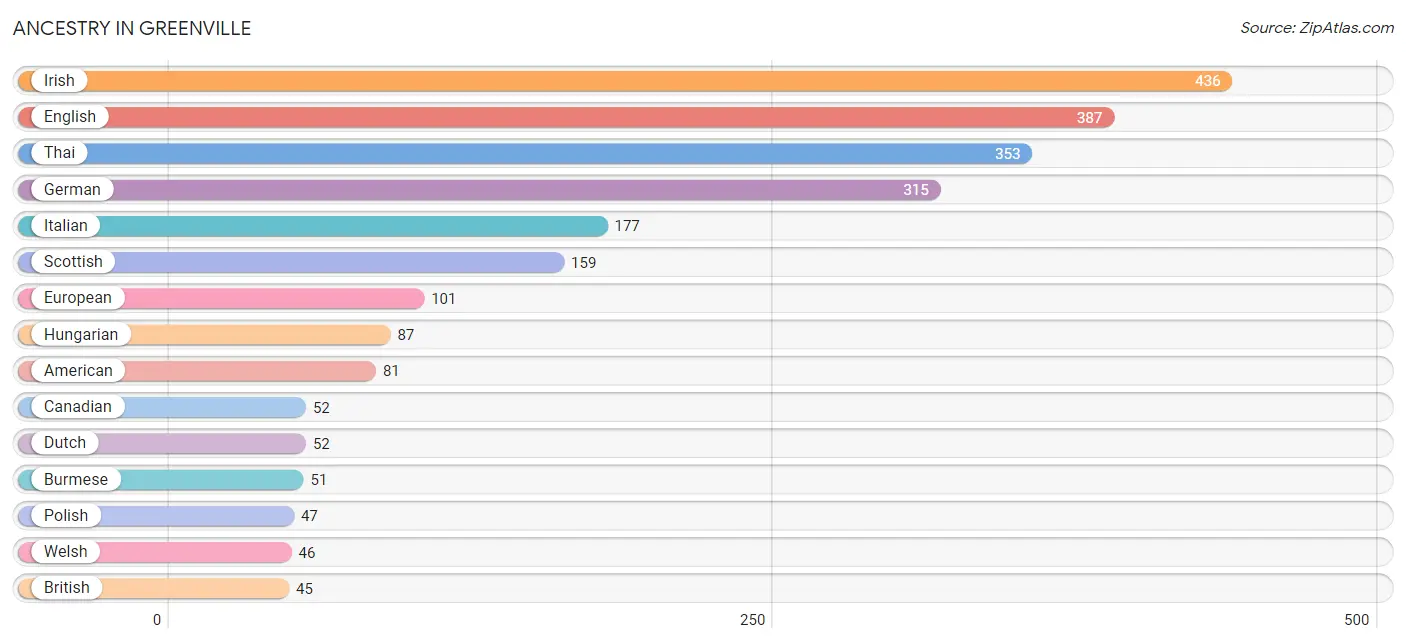
| Ancestry | # Population | % Population |
| American | 81 | 2.9% |
| Austrian | 10 | 0.4% |
| British | 45 | 1.6% |
| Burmese | 51 | 1.8% |
| Canadian | 52 | 1.8% |
| Danish | 22 | 0.8% |
| Dutch | 52 | 1.8% |
| Eastern European | 18 | 0.6% |
| English | 387 | 13.7% |
| European | 101 | 3.6% |
| Filipino | 28 | 1.0% |
| French | 17 | 0.6% |
| French Canadian | 24 | 0.9% |
| German | 315 | 11.2% |
| Greek | 39 | 1.4% |
| Hungarian | 87 | 3.1% |
| Indian (Asian) | 42 | 1.5% |
| Iranian | 9 | 0.3% |
| Irish | 436 | 15.4% |
| Italian | 177 | 6.3% |
| Korean | 10 | 0.4% |
| Northern European | 9 | 0.3% |
| Norwegian | 5 | 0.2% |
| Polish | 47 | 1.7% |
| Puerto Rican | 13 | 0.5% |
| Romanian | 25 | 0.9% |
| Russian | 21 | 0.7% |
| Scottish | 159 | 5.6% |
| Swedish | 17 | 0.6% |
| Thai | 353 | 12.5% |
| Turkish | 10 | 0.4% |
| Ukrainian | 34 | 1.2% |
| Welsh | 46 | 1.6% | View All 33 Rows |
Immigrants in Greenville
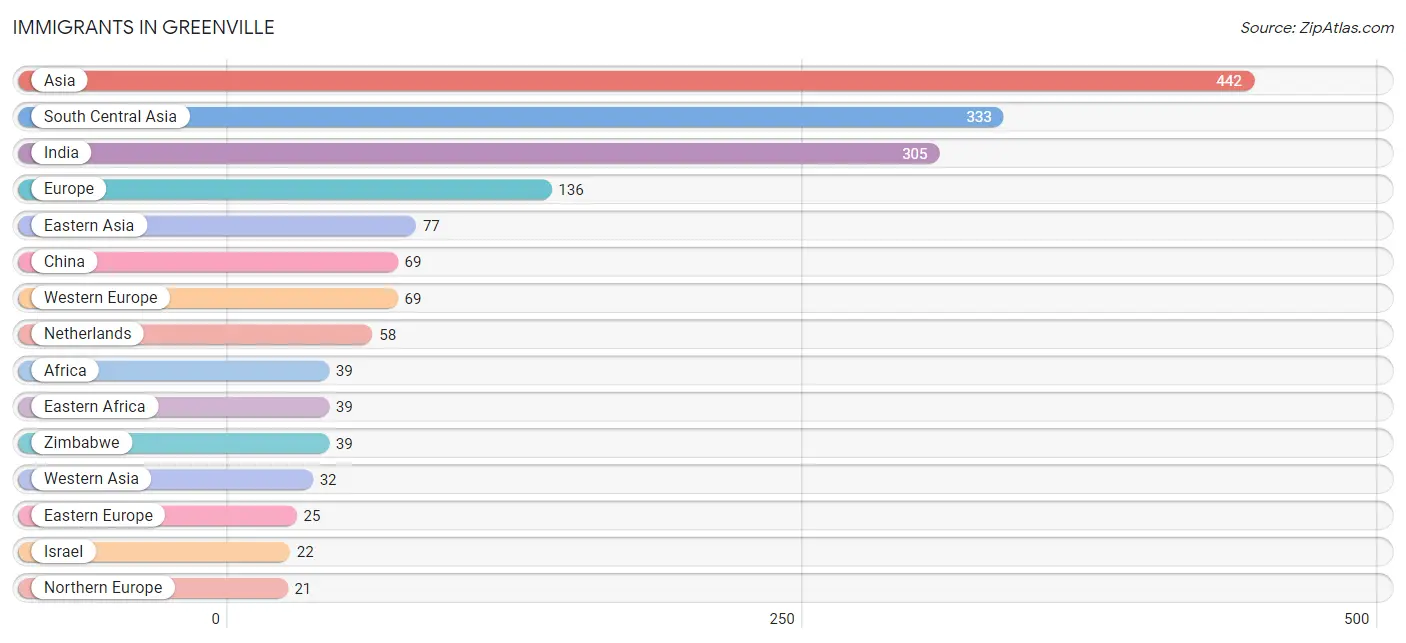
The most numerous immigrant groups reported in Greenville came from Asia (442 | 15.7%), South Central Asia (333 | 11.8%), India (305 | 10.8%), Europe (136 | 4.8%), and Eastern Asia (77 | 2.7%), together accounting for 45.8% of all Greenville residents.
| Immigration Origin | # Population | % Population |
| Africa | 39 | 1.4% |
| Asia | 442 | 15.7% |
| Canada | 13 | 0.5% |
| China | 69 | 2.4% |
| Eastern Africa | 39 | 1.4% |
| Eastern Asia | 77 | 2.7% |
| Eastern Europe | 25 | 0.9% |
| England | 13 | 0.5% |
| Europe | 136 | 4.8% |
| Germany | 11 | 0.4% |
| Greece | 10 | 0.4% |
| India | 305 | 10.8% |
| Iran | 9 | 0.3% |
| Ireland | 8 | 0.3% |
| Israel | 22 | 0.8% |
| Japan | 8 | 0.3% |
| Netherlands | 58 | 2.1% |
| Northern Europe | 21 | 0.7% |
| Romania | 13 | 0.5% |
| South Central Asia | 333 | 11.8% |
| Southern Europe | 21 | 0.7% |
| Spain | 11 | 0.4% |
| Taiwan | 12 | 0.4% |
| Turkey | 10 | 0.4% |
| Ukraine | 12 | 0.4% |
| Uzbekistan | 19 | 0.7% |
| Western Asia | 32 | 1.1% |
| Western Europe | 69 | 2.4% |
| Zimbabwe | 39 | 1.4% | View All 29 Rows |
Sex and Age in Greenville
Sex and Age in Greenville
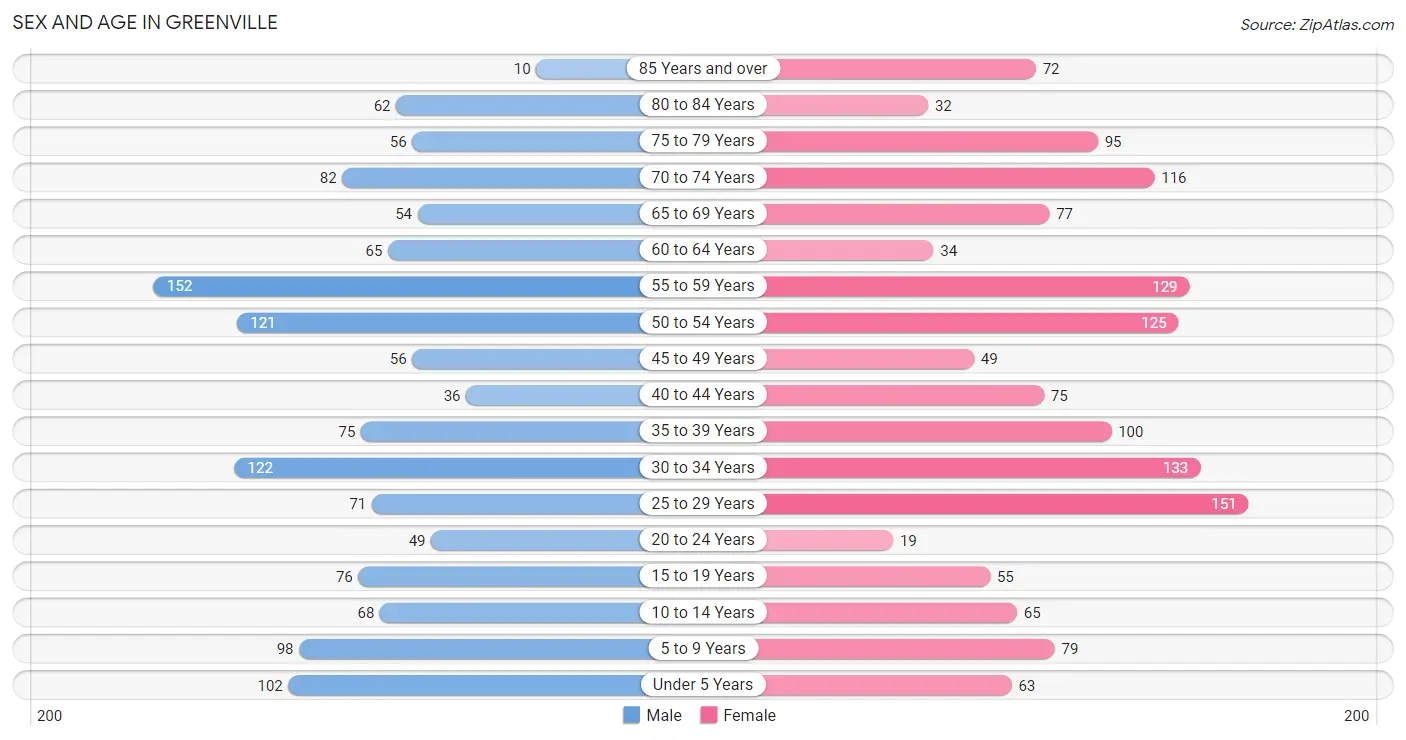
The most populous age groups in Greenville are 55 to 59 Years (152 | 11.2%) for men and 25 to 29 Years (151 | 10.3%) for women.
| Age Bracket | Male | Female |
| Under 5 Years | 102 (7.5%) | 63 (4.3%) |
| 5 to 9 Years | 98 (7.2%) | 79 (5.4%) |
| 10 to 14 Years | 68 (5.0%) | 65 (4.4%) |
| 15 to 19 Years | 76 (5.6%) | 55 (3.7%) |
| 20 to 24 Years | 49 (3.6%) | 19 (1.3%) |
| 25 to 29 Years | 71 (5.2%) | 151 (10.3%) |
| 30 to 34 Years | 122 (9.0%) | 133 (9.0%) |
| 35 to 39 Years | 75 (5.5%) | 100 (6.8%) |
| 40 to 44 Years | 36 (2.7%) | 75 (5.1%) |
| 45 to 49 Years | 56 (4.1%) | 49 (3.3%) |
| 50 to 54 Years | 121 (8.9%) | 125 (8.5%) |
| 55 to 59 Years | 152 (11.2%) | 129 (8.8%) |
| 60 to 64 Years | 65 (4.8%) | 34 (2.3%) |
| 65 to 69 Years | 54 (4.0%) | 77 (5.2%) |
| 70 to 74 Years | 82 (6.0%) | 116 (7.9%) |
| 75 to 79 Years | 56 (4.1%) | 95 (6.5%) |
| 80 to 84 Years | 62 (4.6%) | 32 (2.2%) |
| 85 Years and over | 10 (0.7%) | 72 (4.9%) |
| Total | 1,355 (100.0%) | 1,469 (100.0%) |
Families and Households in Greenville
Median Family Size in Greenville
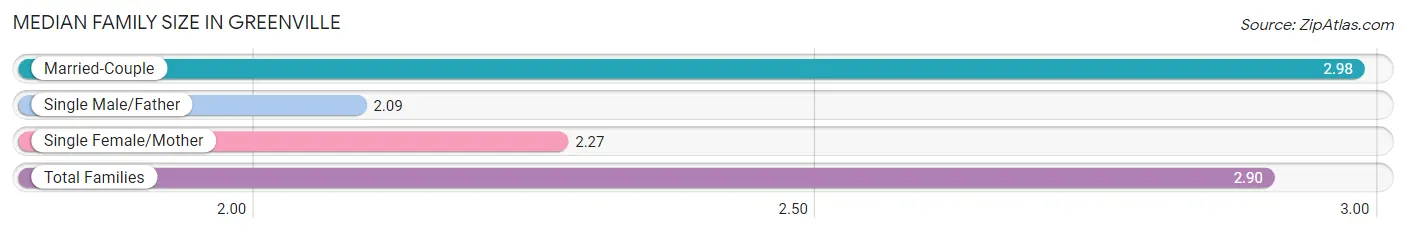
The median family size in Greenville is 2.90 persons per family, with married-couple families (657 | 89.0%) accounting for the largest median family size of 2.98 persons per family. On the other hand, single male/father families (11 | 1.5%) represent the smallest median family size with 2.09 persons per family.
| Family Type | # Families | Family Size |
| Married-Couple | 657 (89.0%) | 2.98 |
| Single Male/Father | 11 (1.5%) | 2.09 |
| Single Female/Mother | 70 (9.5%) | 2.27 |
| Total Families | 738 (100.0%) | 2.90 |
Median Household Size in Greenville
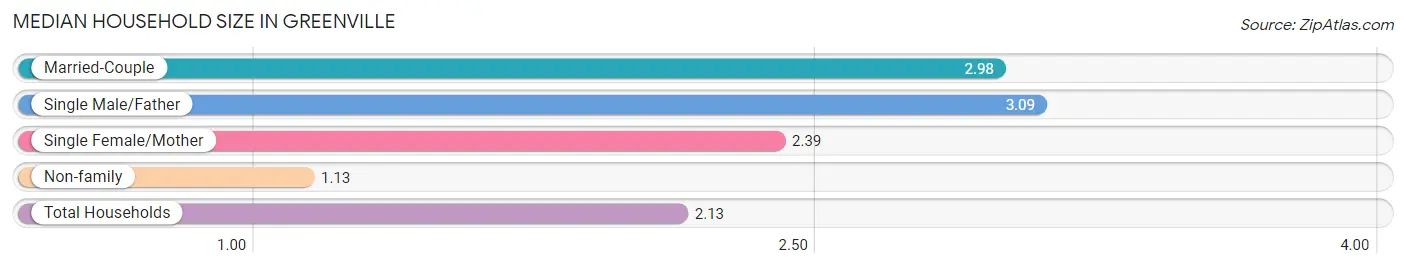
The median household size in Greenville is 2.13 persons per household, with single male/father households (11 | 0.8%) accounting for the largest median household size of 3.09 persons per household. non-family households (588 | 44.3%) represent the smallest median household size with 1.13 persons per household.
| Household Type | # Households | Household Size |
| Married-Couple | 657 (49.5%) | 2.98 |
| Single Male/Father | 11 (0.8%) | 3.09 |
| Single Female/Mother | 70 (5.3%) | 2.39 |
| Non-family | 588 (44.3%) | 1.13 |
| Total Households | 1,326 (100.0%) | 2.13 |
Household Size by Marriage Status in Greenville
Out of a total of 1,326 households in Greenville, 738 (55.7%) are family households, while 588 (44.3%) are nonfamily households. The most numerous type of family households are 2-person households, comprising 364, and the most common type of nonfamily households are 1-person households, comprising 526.
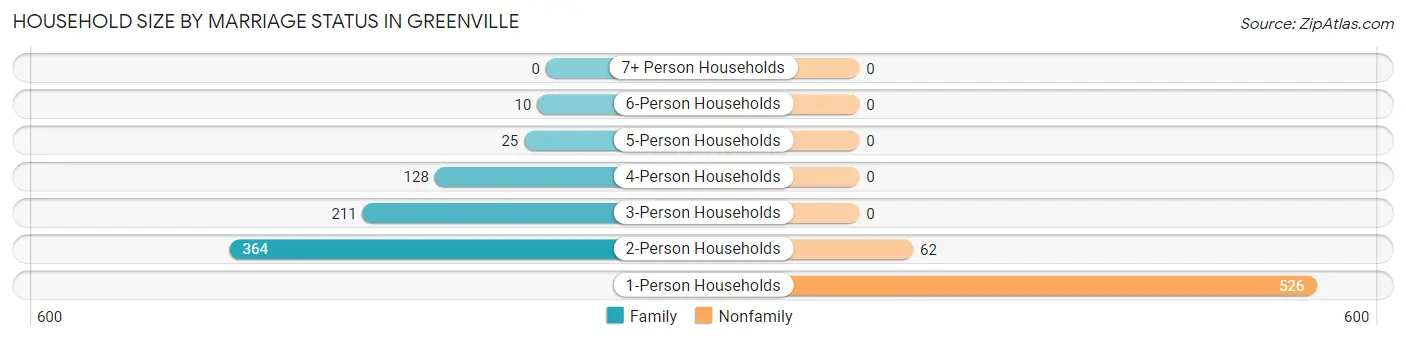
| Household Size | Family Households | Nonfamily Households |
| 1-Person Households | - | 526 (39.7%) |
| 2-Person Households | 364 (27.5%) | 62 (4.7%) |
| 3-Person Households | 211 (15.9%) | 0 (0.0%) |
| 4-Person Households | 128 (9.7%) | 0 (0.0%) |
| 5-Person Households | 25 (1.9%) | 0 (0.0%) |
| 6-Person Households | 10 (0.7%) | 0 (0.0%) |
| 7+ Person Households | 0 (0.0%) | 0 (0.0%) |
| Total | 738 (55.7%) | 588 (44.3%) |
Female Fertility in Greenville
Fertility by Age in Greenville
Average fertility rate in Greenville is 77.0 births per 1,000 women. Women in the age bracket of 20 to 34 years have the highest fertility rate with 86.0 births per 1,000 women. Women in the age bracket of 20 to 34 years acount for 55.3% of all women with births.
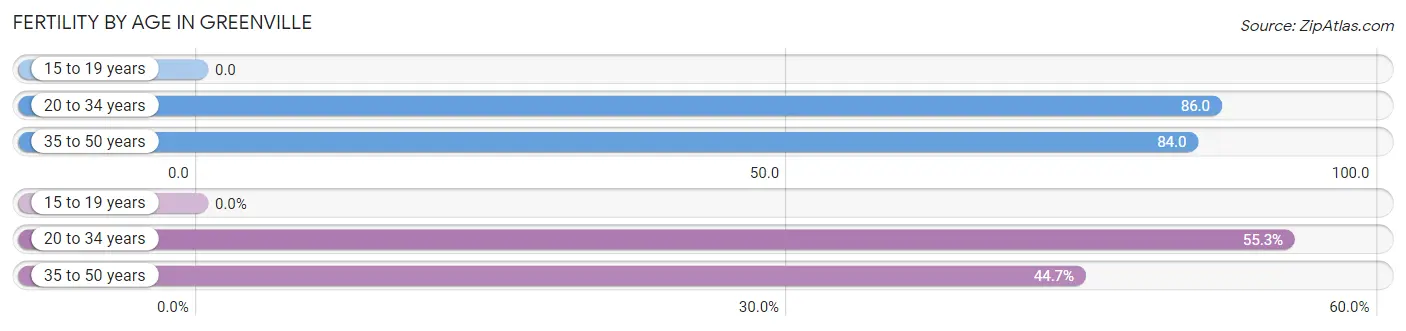
| Age Bracket | Women with Births | Births / 1,000 Women |
| 15 to 19 years | 0 (0.0%) | 0.0 |
| 20 to 34 years | 26 (55.3%) | 86.0 |
| 35 to 50 years | 21 (44.7%) | 84.0 |
| Total | 47 (100.0%) | 77.0 |
Fertility by Age by Marriage Status in Greenville
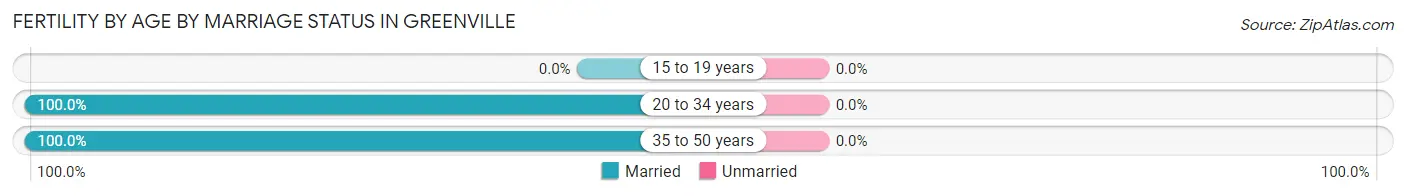
| Age Bracket | Married | Unmarried |
| 15 to 19 years | 0 (0.0%) | 0 (0.0%) |
| 20 to 34 years | 26 (100.0%) | 0 (0.0%) |
| 35 to 50 years | 21 (100.0%) | 0 (0.0%) |
| Total | 47 (100.0%) | 0 (0.0%) |
Fertility by Education in Greenville
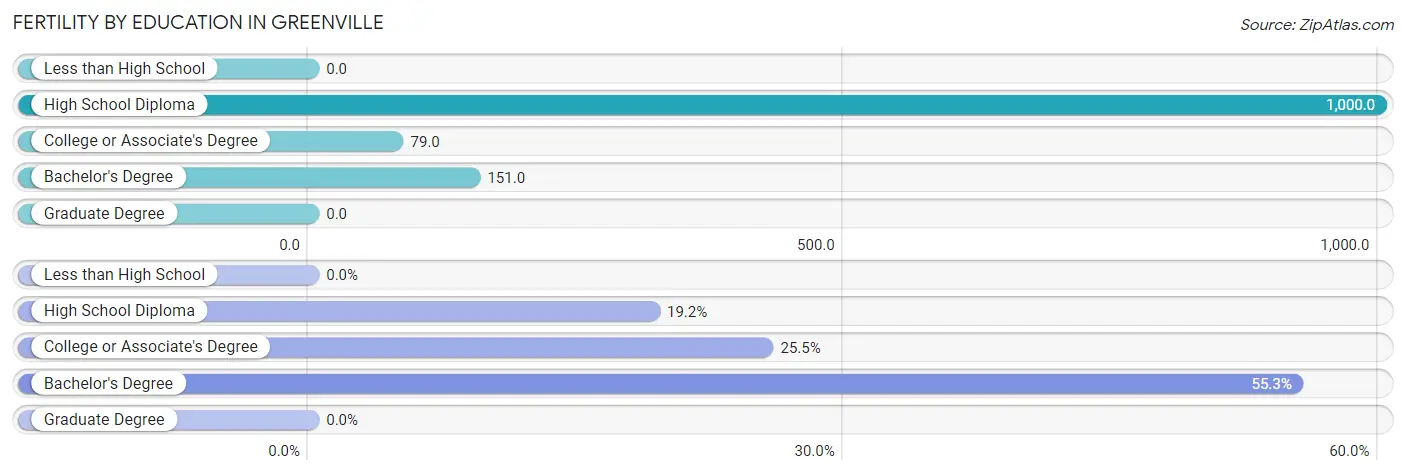
| Educational Attainment | Women with Births | Births / 1,000 Women |
| Less than High School | 0 (0.0%) | 0.0 |
| High School Diploma | 9 (19.2%) | 1,000.0 |
| College or Associate's Degree | 12 (25.5%) | 79.0 |
| Bachelor's Degree | 26 (55.3%) | 151.0 |
| Graduate Degree | 0 (0.0%) | 0.0 |
| Total | 47 (100.0%) | 77.0 |
Fertility by Education by Marriage Status in Greenville
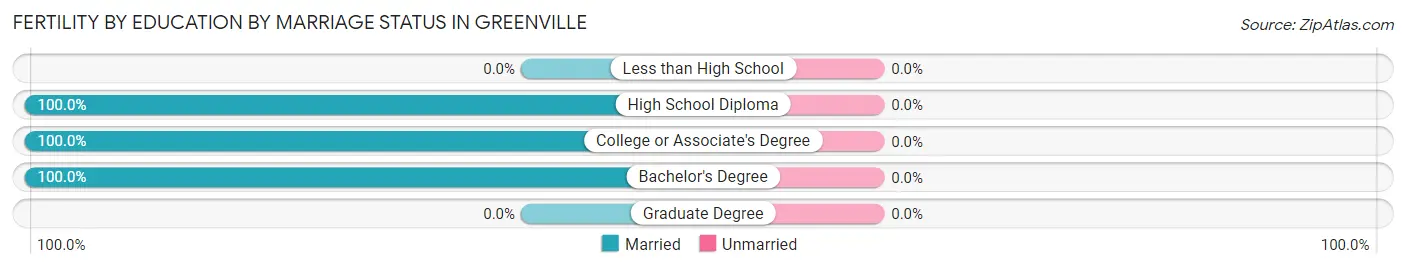
| Educational Attainment | Married | Unmarried |
| Less than High School | 0 (0.0%) | 0 (0.0%) |
| High School Diploma | 9 (100.0%) | 0 (0.0%) |
| College or Associate's Degree | 12 (100.0%) | 0 (0.0%) |
| Bachelor's Degree | 26 (100.0%) | 0 (0.0%) |
| Graduate Degree | 0 (0.0%) | 0 (0.0%) |
| Total | 47 (100.0%) | 0 (0.0%) |
Employment Characteristics in Greenville
Employment by Class of Employer in Greenville
Among the 1,351 employed individuals in Greenville, private company employees (858 | 63.5%), self-employed (incorporated) (143 | 10.6%), and not-for-profit organizations (123 | 9.1%) make up the most common classes of employment.
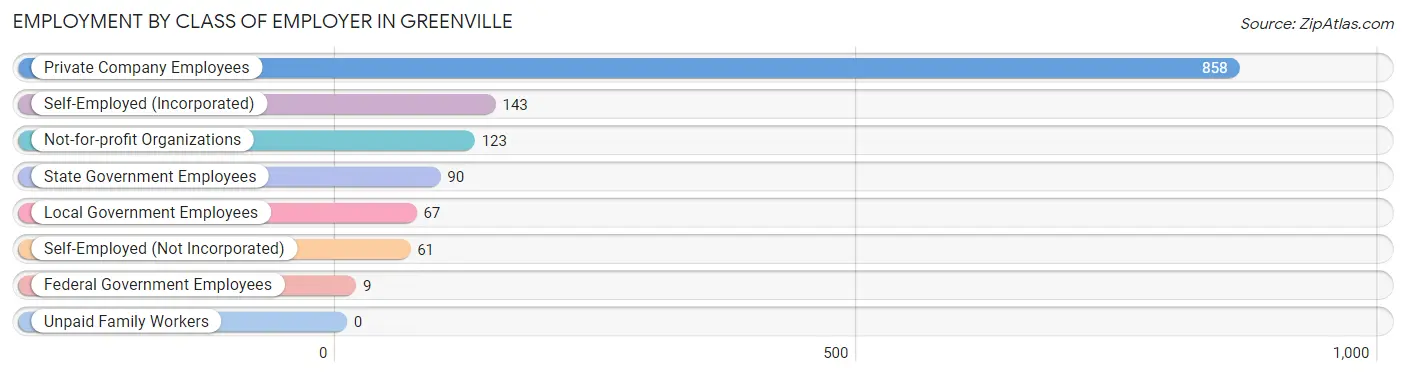
| Employer Class | # Employees | % Employees |
| Private Company Employees | 858 | 63.5% |
| Self-Employed (Incorporated) | 143 | 10.6% |
| Self-Employed (Not Incorporated) | 61 | 4.5% |
| Not-for-profit Organizations | 123 | 9.1% |
| Local Government Employees | 67 | 5.0% |
| State Government Employees | 90 | 6.7% |
| Federal Government Employees | 9 | 0.7% |
| Unpaid Family Workers | 0 | 0.0% |
| Total | 1,351 | 100.0% |
Employment Status by Age in Greenville
According to the labor force statistics for Greenville, out of the total population over 16 years of age (2,333), 60.8% or 1,418 individuals are in the labor force, with 3.5% or 50 of them unemployed. The age group with the highest labor force participation rate is 20 to 24 years, with 100.0% or 68 individuals in the labor force. Within the labor force, the 75 years and over age range has the highest percentage of unemployed individuals, with 42.1% or 8 of them being unemployed.
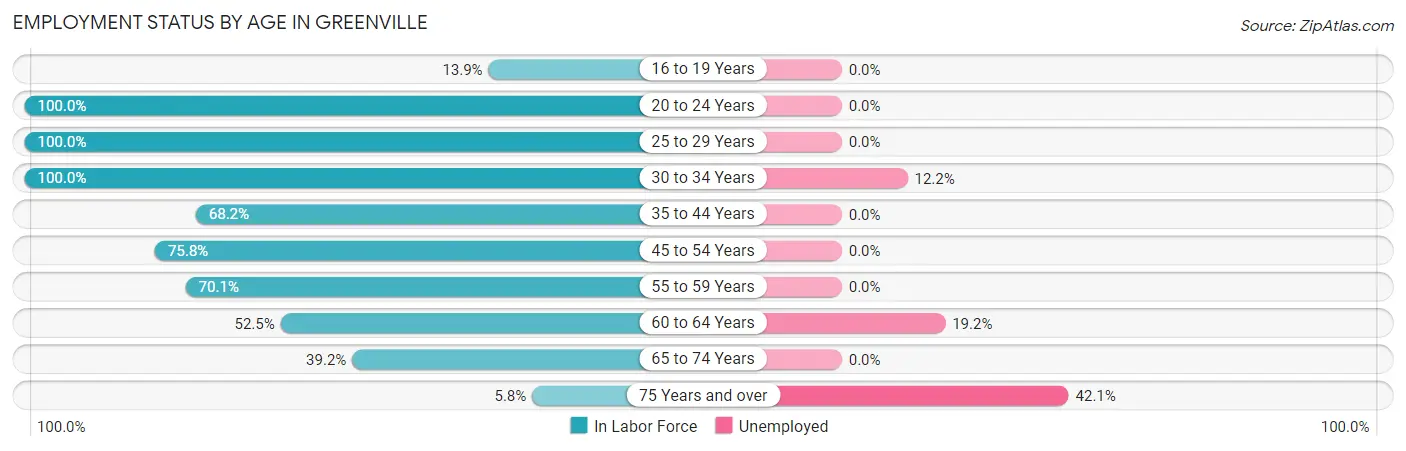
| Age Bracket | In Labor Force | Unemployed |
| 16 to 19 Years | 16 (13.9%) | 0 (0.0%) |
| 20 to 24 Years | 68 (100.0%) | 0 (0.0%) |
| 25 to 29 Years | 222 (100.0%) | 0 (0.0%) |
| 30 to 34 Years | 255 (100.0%) | 31 (12.2%) |
| 35 to 44 Years | 195 (68.2%) | 0 (0.0%) |
| 45 to 54 Years | 266 (75.8%) | 0 (0.0%) |
| 55 to 59 Years | 197 (70.1%) | 0 (0.0%) |
| 60 to 64 Years | 52 (52.5%) | 10 (19.2%) |
| 65 to 74 Years | 129 (39.2%) | 0 (0.0%) |
| 75 Years and over | 19 (5.8%) | 8 (42.1%) |
| Total | 1,418 (60.8%) | 50 (3.5%) |
Employment Status by Educational Attainment in Greenville
According to labor force statistics for Greenville, 79.5% of individuals (1,188) out of the total population between 25 and 64 years of age (1,494) are in the labor force, with 3.5% or 42 of them being unemployed. The group with the highest labor force participation rate are those with the educational attainment of college / associate degree, with 100.0% or 232 individuals in the labor force. Within the labor force, individuals with bachelor's degree or higher education have the highest percentage of unemployment, with 4.4% or 41 of them being unemployed.
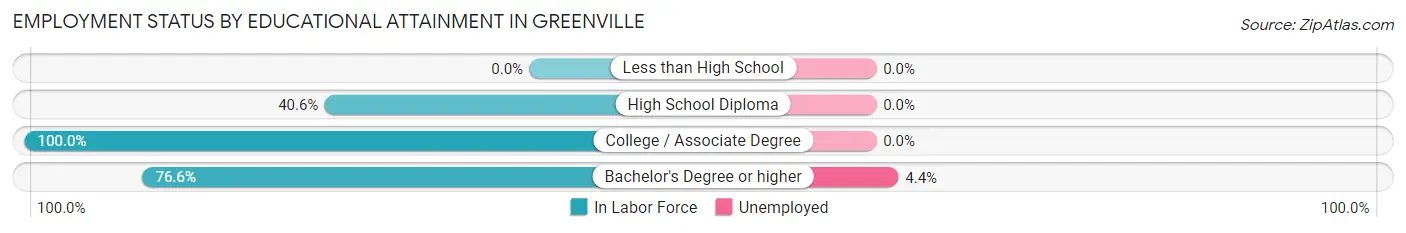
| Educational Attainment | In Labor Force | Unemployed |
| Less than High School | 0 (0.0%) | 0 (0.0%) |
| High School Diploma | 13 (40.6%) | 0 (0.0%) |
| College / Associate Degree | 232 (100.0%) | 0 (0.0%) |
| Bachelor's Degree or higher | 942 (76.6%) | 54 (4.4%) |
| Total | 1,188 (79.5%) | 52 (3.5%) |
Employment Occupations by Sex in Greenville
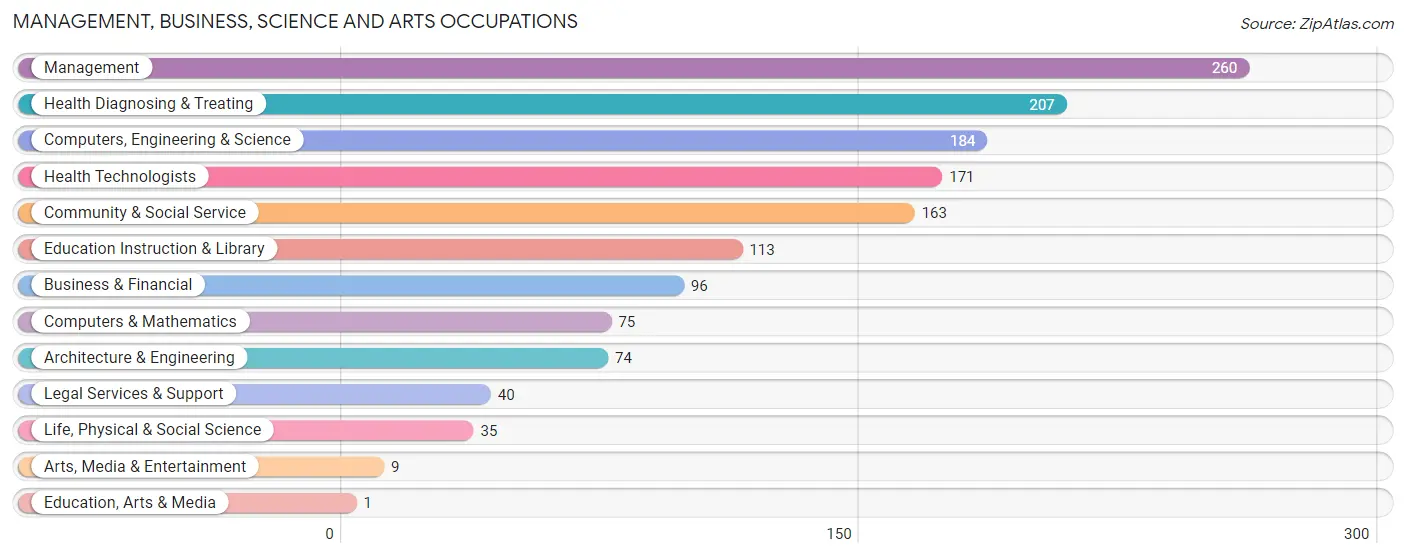
Management, Business, Science and Arts Occupations
The most common Management, Business, Science and Arts occupations in Greenville are Management (260 | 19.0%), Health Diagnosing & Treating (207 | 15.1%), Computers, Engineering & Science (184 | 13.4%), Health Technologists (171 | 12.5%), and Community & Social Service (163 | 11.9%).
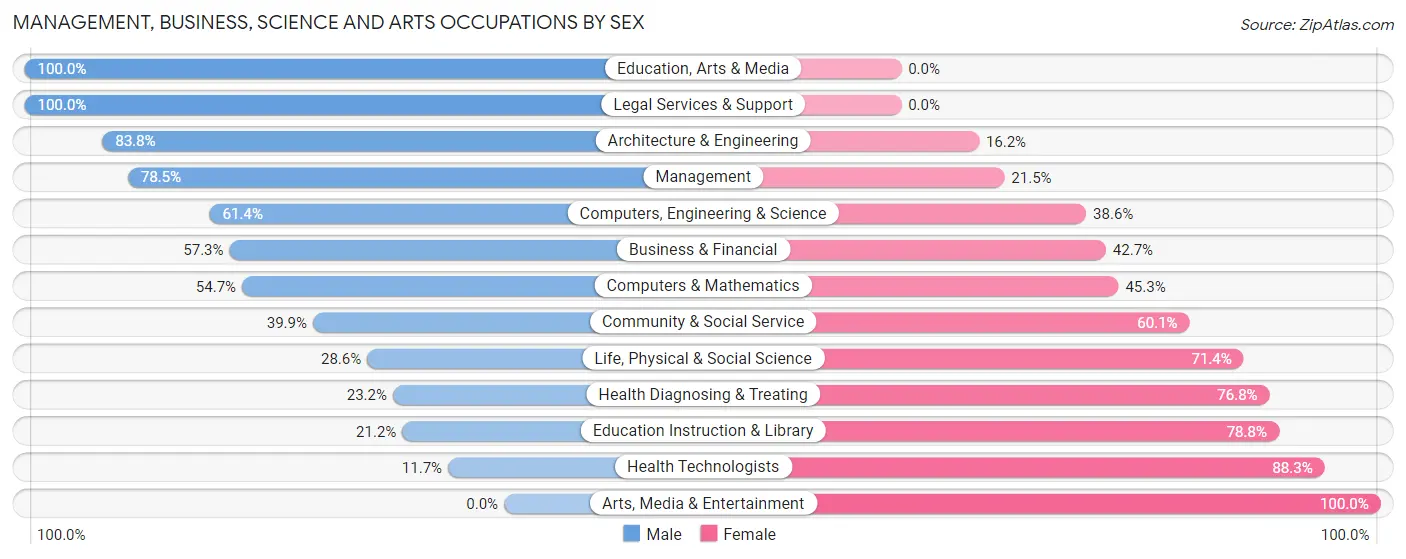
Management, Business, Science and Arts Occupations by Sex
Within the Management, Business, Science and Arts occupations in Greenville, the most male-oriented occupations are Education, Arts & Media (100.0%), Legal Services & Support (100.0%), and Architecture & Engineering (83.8%), while the most female-oriented occupations are Arts, Media & Entertainment (100.0%), Health Technologists (88.3%), and Education Instruction & Library (78.8%).
| Occupation | Male | Female |
| Management | 204 (78.5%) | 56 (21.5%) |
| Business & Financial | 55 (57.3%) | 41 (42.7%) |
| Computers, Engineering & Science | 113 (61.4%) | 71 (38.6%) |
| Computers & Mathematics | 41 (54.7%) | 34 (45.3%) |
| Architecture & Engineering | 62 (83.8%) | 12 (16.2%) |
| Life, Physical & Social Science | 10 (28.6%) | 25 (71.4%) |
| Community & Social Service | 65 (39.9%) | 98 (60.1%) |
| Education, Arts & Media | 1 (100.0%) | 0 (0.0%) |
| Legal Services & Support | 40 (100.0%) | 0 (0.0%) |
| Education Instruction & Library | 24 (21.2%) | 89 (78.8%) |
| Arts, Media & Entertainment | 0 (0.0%) | 9 (100.0%) |
| Health Diagnosing & Treating | 48 (23.2%) | 159 (76.8%) |
| Health Technologists | 20 (11.7%) | 151 (88.3%) |
| Total (Category) | 485 (53.3%) | 425 (46.7%) |
| Total (Overall) | 700 (51.1%) | 670 (48.9%) |
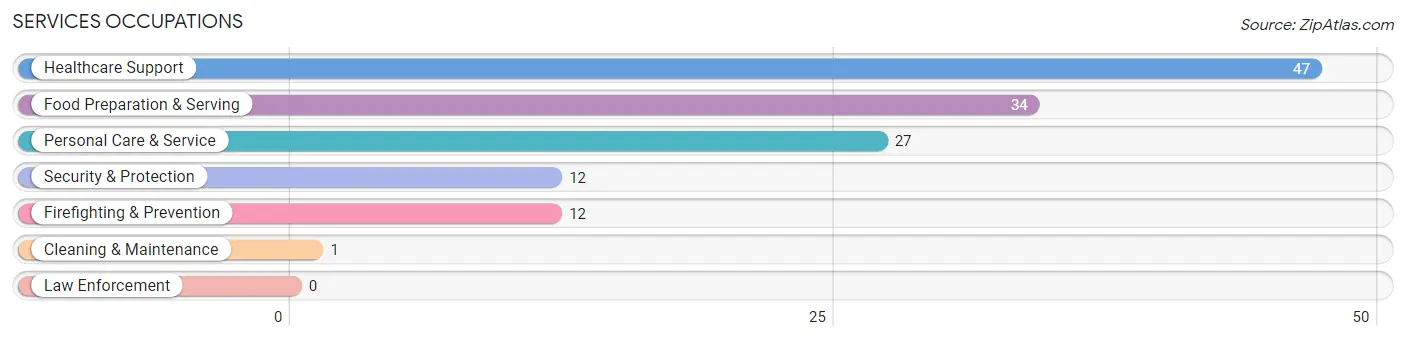
Services Occupations
The most common Services occupations in Greenville are Healthcare Support (47 | 3.4%), Food Preparation & Serving (34 | 2.5%), Personal Care & Service (27 | 2.0%), Security & Protection (12 | 0.9%), and Firefighting & Prevention (12 | 0.9%).
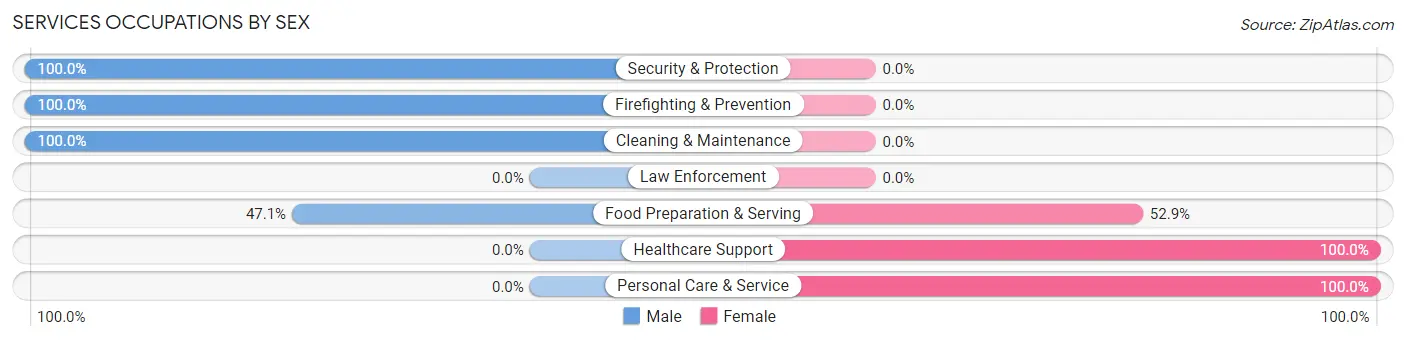
Services Occupations by Sex
Within the Services occupations in Greenville, the most male-oriented occupations are Security & Protection (100.0%), Firefighting & Prevention (100.0%), and Cleaning & Maintenance (100.0%), while the most female-oriented occupations are Healthcare Support (100.0%), Personal Care & Service (100.0%), and Food Preparation & Serving (52.9%).
| Occupation | Male | Female |
| Healthcare Support | 0 (0.0%) | 47 (100.0%) |
| Security & Protection | 12 (100.0%) | 0 (0.0%) |
| Firefighting & Prevention | 12 (100.0%) | 0 (0.0%) |
| Law Enforcement | 0 (0.0%) | 0 (0.0%) |
| Food Preparation & Serving | 16 (47.1%) | 18 (52.9%) |
| Cleaning & Maintenance | 1 (100.0%) | 0 (0.0%) |
| Personal Care & Service | 0 (0.0%) | 27 (100.0%) |
| Total (Category) | 29 (24.0%) | 92 (76.0%) |
| Total (Overall) | 700 (51.1%) | 670 (48.9%) |
Sales and Office Occupations
The most common Sales and Office occupations in Greenville are Sales & Related (135 | 9.9%), and Office & Administration (134 | 9.8%).

Sales and Office Occupations by Sex
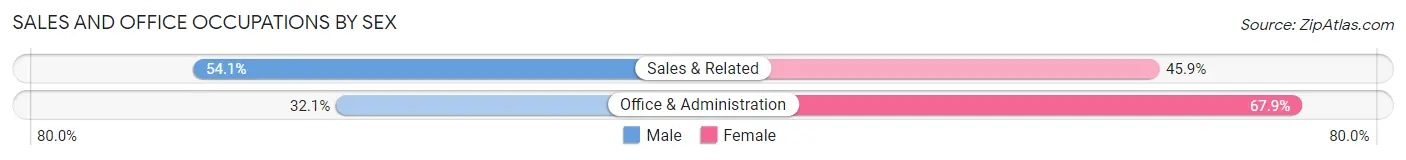
| Occupation | Male | Female |
| Sales & Related | 73 (54.1%) | 62 (45.9%) |
| Office & Administration | 43 (32.1%) | 91 (67.9%) |
| Total (Category) | 116 (43.1%) | 153 (56.9%) |
| Total (Overall) | 700 (51.1%) | 670 (48.9%) |
Natural Resources, Construction and Maintenance Occupations
The most common Natural Resources, Construction and Maintenance occupations in Greenville are , and Construction & Extraction (8 | 0.6%).

Natural Resources, Construction and Maintenance Occupations by Sex
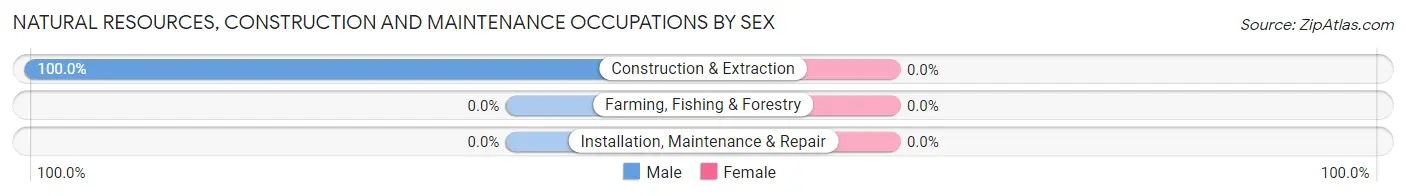
| Occupation | Male | Female |
| Farming, Fishing & Forestry | 0 (0.0%) | 0 (0.0%) |
| Construction & Extraction | 8 (100.0%) | 0 (0.0%) |
| Installation, Maintenance & Repair | 0 (0.0%) | 0 (0.0%) |
| Total (Category) | 8 (100.0%) | 0 (0.0%) |
| Total (Overall) | 700 (51.1%) | 670 (48.9%) |
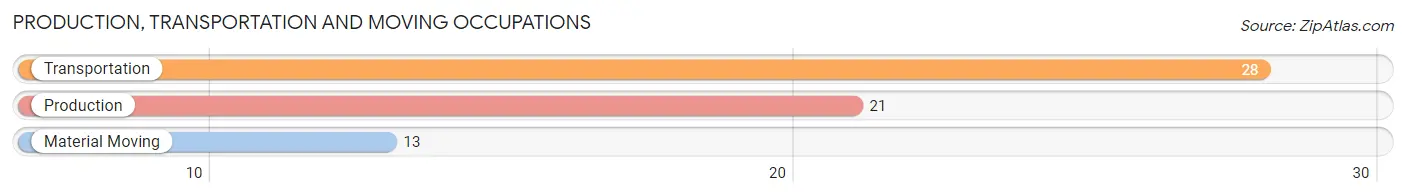
Production, Transportation and Moving Occupations
The most common Production, Transportation and Moving occupations in Greenville are Transportation (28 | 2.0%), Production (21 | 1.5%), and Material Moving (13 | 0.9%).
Production, Transportation and Moving Occupations by Sex
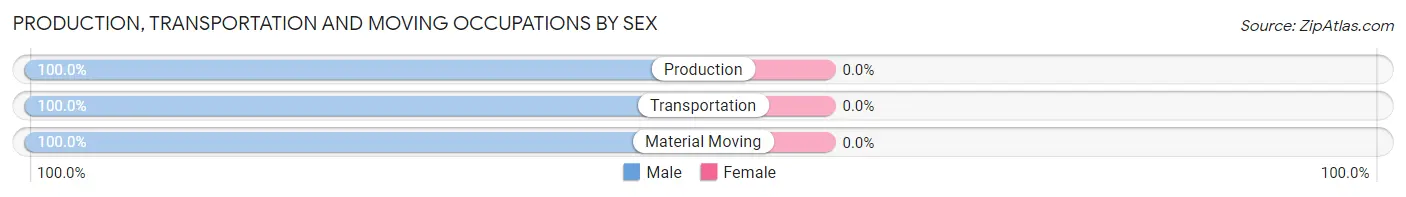
| Occupation | Male | Female |
| Production | 21 (100.0%) | 0 (0.0%) |
| Transportation | 28 (100.0%) | 0 (0.0%) |
| Material Moving | 13 (100.0%) | 0 (0.0%) |
| Total (Category) | 62 (100.0%) | 0 (0.0%) |
| Total (Overall) | 700 (51.1%) | 670 (48.9%) |
Employment Industries by Sex in Greenville
Employment Industries in Greenville
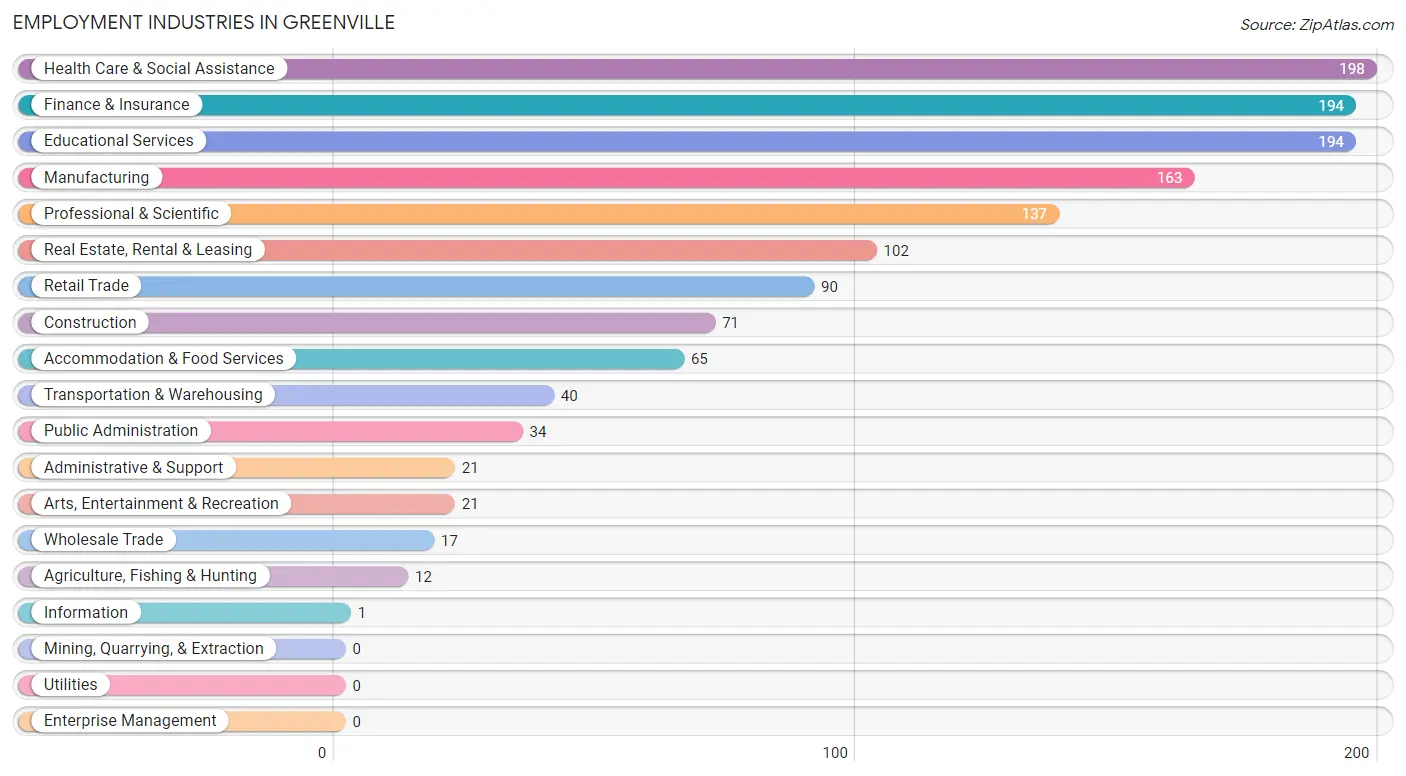
The major employment industries in Greenville include Health Care & Social Assistance (198 | 14.4%), Finance & Insurance (194 | 14.2%), Educational Services (194 | 14.2%), Manufacturing (163 | 11.9%), and Professional & Scientific (137 | 10.0%).
Employment Industries by Sex in Greenville
The Greenville industries that see more men than women are Agriculture, Fishing & Hunting (100.0%), Construction (100.0%), and Transportation & Warehousing (100.0%), whereas the industries that tend to have a higher number of women are Information (100.0%), Arts, Entertainment & Recreation (100.0%), and Administrative & Support (95.2%).
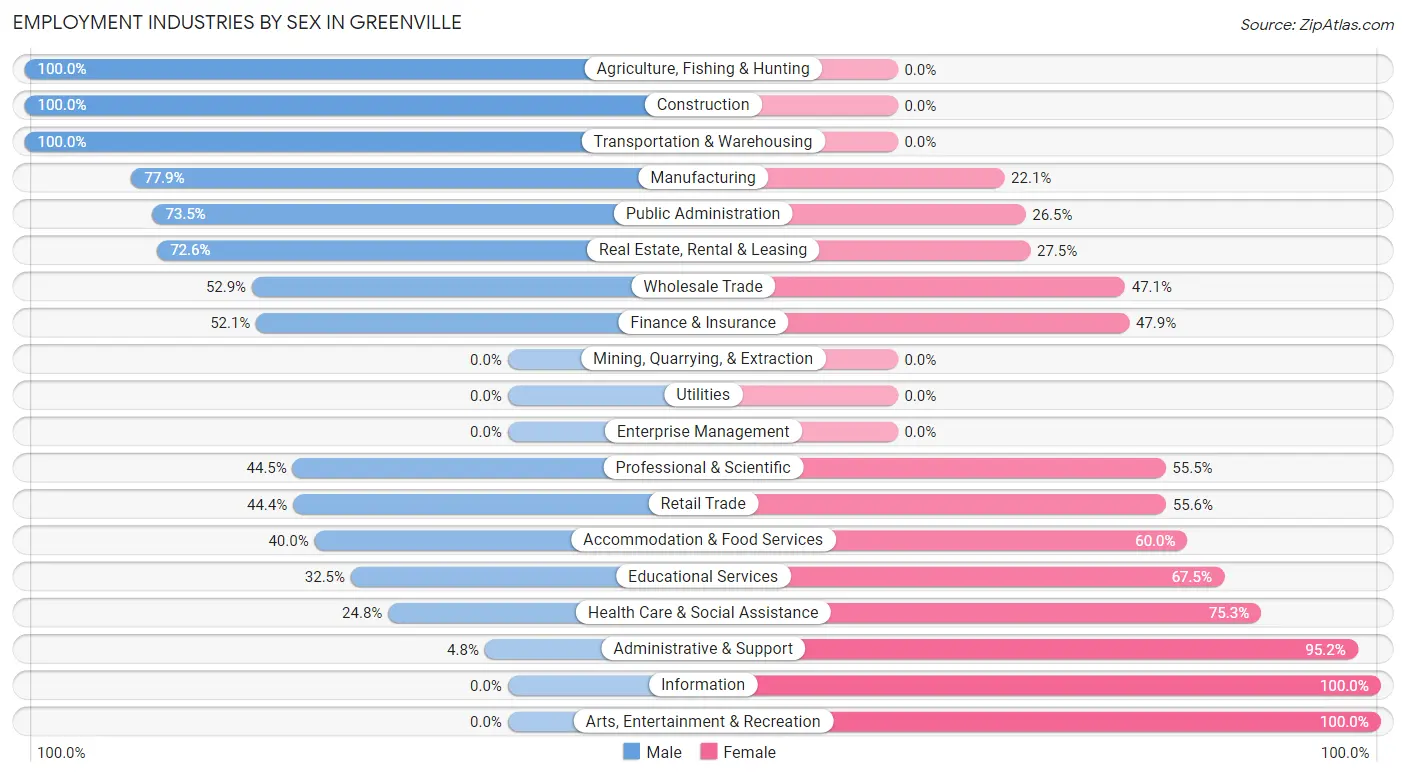
| Industry | Male | Female |
| Agriculture, Fishing & Hunting | 12 (100.0%) | 0 (0.0%) |
| Mining, Quarrying, & Extraction | 0 (0.0%) | 0 (0.0%) |
| Construction | 71 (100.0%) | 0 (0.0%) |
| Manufacturing | 127 (77.9%) | 36 (22.1%) |
| Wholesale Trade | 9 (52.9%) | 8 (47.1%) |
| Retail Trade | 40 (44.4%) | 50 (55.6%) |
| Transportation & Warehousing | 40 (100.0%) | 0 (0.0%) |
| Utilities | 0 (0.0%) | 0 (0.0%) |
| Information | 0 (0.0%) | 1 (100.0%) |
| Finance & Insurance | 101 (52.1%) | 93 (47.9%) |
| Real Estate, Rental & Leasing | 74 (72.6%) | 28 (27.5%) |
| Professional & Scientific | 61 (44.5%) | 76 (55.5%) |
| Enterprise Management | 0 (0.0%) | 0 (0.0%) |
| Administrative & Support | 1 (4.8%) | 20 (95.2%) |
| Educational Services | 63 (32.5%) | 131 (67.5%) |
| Health Care & Social Assistance | 49 (24.7%) | 149 (75.2%) |
| Arts, Entertainment & Recreation | 0 (0.0%) | 21 (100.0%) |
| Accommodation & Food Services | 26 (40.0%) | 39 (60.0%) |
| Public Administration | 25 (73.5%) | 9 (26.5%) |
| Total | 700 (51.1%) | 670 (48.9%) |
Education in Greenville
School Enrollment in Greenville
The most common levels of schooling among the 521 students in Greenville are high school (131 | 25.1%), middle school (106 | 20.3%), and elementary school (100 | 19.2%).
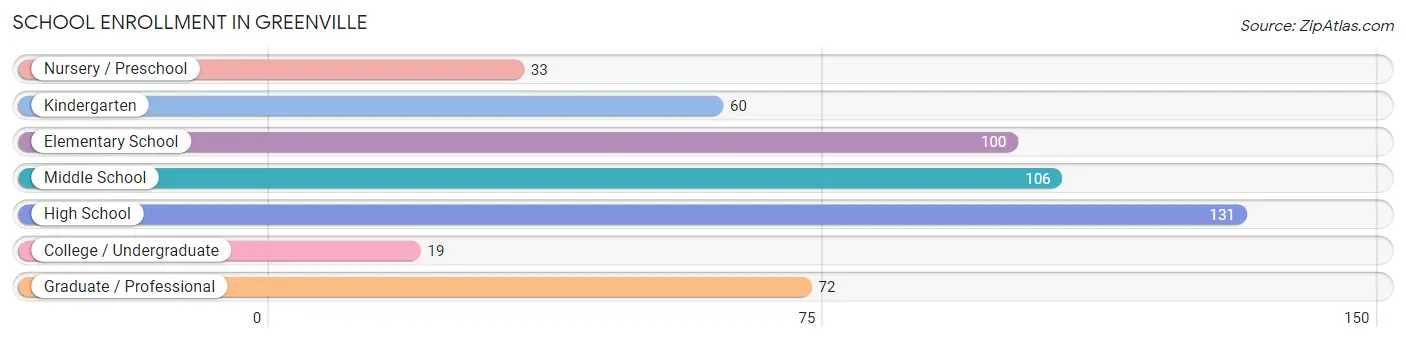
| School Level | # Students | % Students |
| Nursery / Preschool | 33 | 6.3% |
| Kindergarten | 60 | 11.5% |
| Elementary School | 100 | 19.2% |
| Middle School | 106 | 20.3% |
| High School | 131 | 25.1% |
| College / Undergraduate | 19 | 3.6% |
| Graduate / Professional | 72 | 13.8% |
| Total | 521 | 100.0% |
School Enrollment by Age by Funding Source in Greenville
Out of a total of 521 students who are enrolled in schools in Greenville, 286 (54.9%) attend a private institution, while the remaining 235 (45.1%) are enrolled in public schools. The age group of 3 to 4 year olds has the highest likelihood of being enrolled in private schools, with 21 (100.0% in the age bracket) enrolled. Conversely, the age group of 5 to 9 year old has the lowest likelihood of being enrolled in a private school, with 106 (73.1% in the age bracket) attending a public institution.
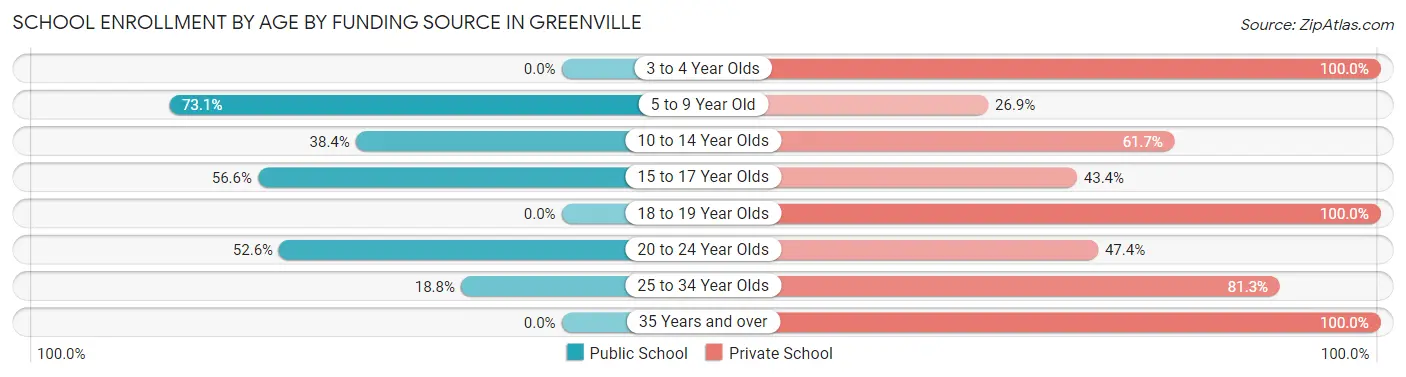
| Age Bracket | Public School | Private School |
| 3 to 4 Year Olds | 0 (0.0%) | 21 (100.0%) |
| 5 to 9 Year Old | 106 (73.1%) | 39 (26.9%) |
| 10 to 14 Year Olds | 51 (38.4%) | 82 (61.7%) |
| 15 to 17 Year Olds | 56 (56.6%) | 43 (43.4%) |
| 18 to 19 Year Olds | 0 (0.0%) | 32 (100.0%) |
| 20 to 24 Year Olds | 10 (52.6%) | 9 (47.4%) |
| 25 to 34 Year Olds | 12 (18.8%) | 52 (81.2%) |
| 35 Years and over | 0 (0.0%) | 8 (100.0%) |
| Total | 235 (45.1%) | 286 (54.9%) |
Educational Attainment by Field of Study in Greenville
Business (399 | 20.1%), engineering (262 | 13.2%), social sciences (206 | 10.4%), science & technology (191 | 9.6%), and literature & languages (145 | 7.3%) are the most common fields of study among 1,981 individuals in Greenville who have obtained a bachelor's degree or higher.
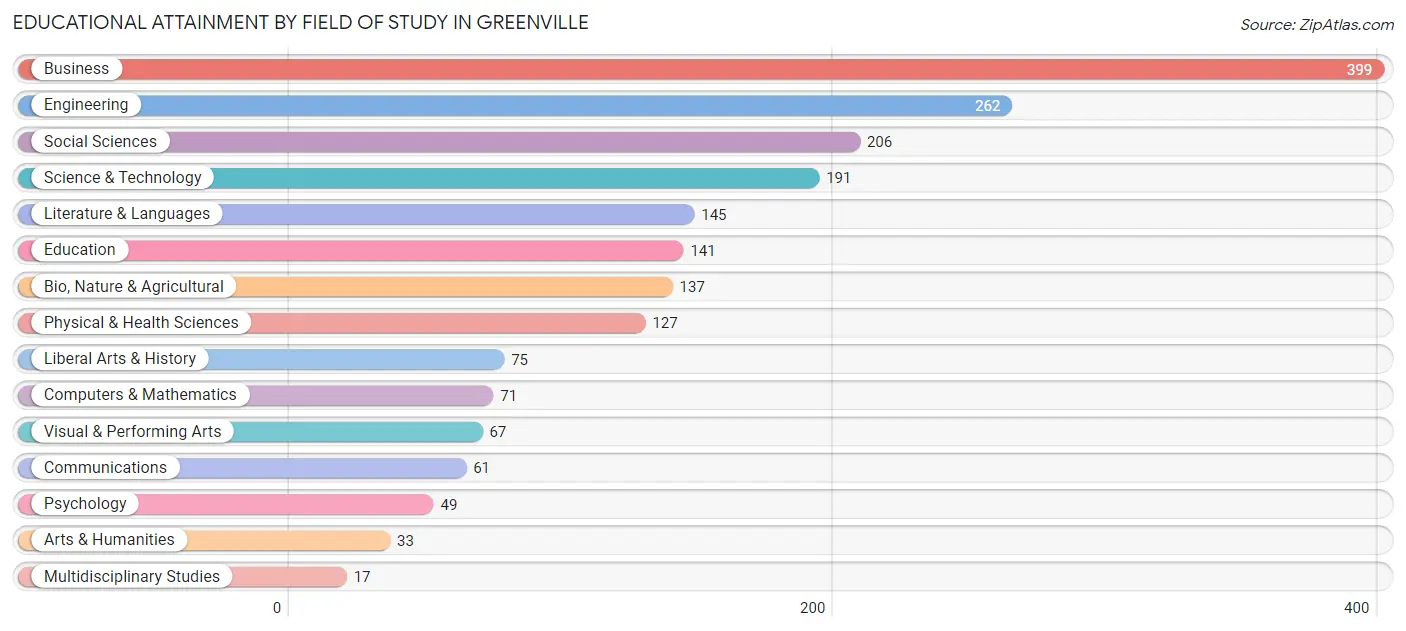
| Field of Study | # Graduates | % Graduates |
| Computers & Mathematics | 71 | 3.6% |
| Bio, Nature & Agricultural | 137 | 6.9% |
| Physical & Health Sciences | 127 | 6.4% |
| Psychology | 49 | 2.5% |
| Social Sciences | 206 | 10.4% |
| Engineering | 262 | 13.2% |
| Multidisciplinary Studies | 17 | 0.9% |
| Science & Technology | 191 | 9.6% |
| Business | 399 | 20.1% |
| Education | 141 | 7.1% |
| Literature & Languages | 145 | 7.3% |
| Liberal Arts & History | 75 | 3.8% |
| Visual & Performing Arts | 67 | 3.4% |
| Communications | 61 | 3.1% |
| Arts & Humanities | 33 | 1.7% |
| Total | 1,981 | 100.0% |
Transportation & Commute in Greenville
Vehicle Availability by Sex in Greenville
The most prevalent vehicle ownership categories in Greenville are males with 2 vehicles (295, accounting for 43.1%) and females with 2 vehicles (256, making up 44.5%).
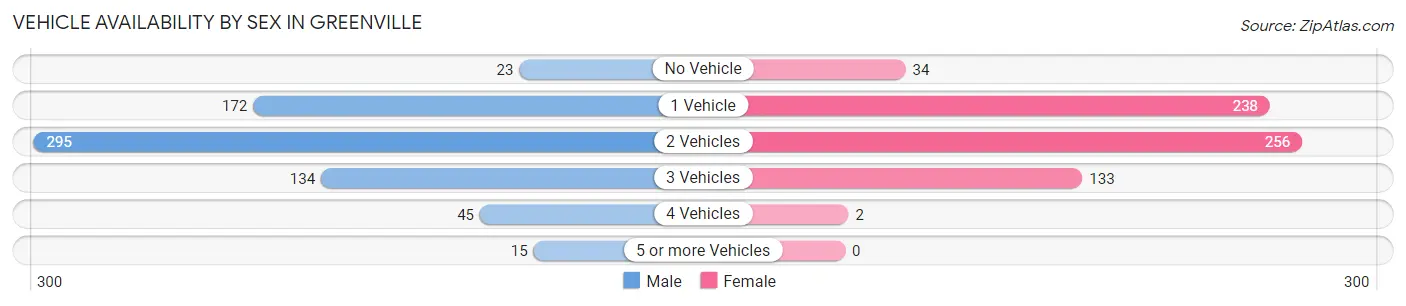
| Vehicles Available | Male | Female |
| No Vehicle | 23 (3.4%) | 34 (5.1%) |
| 1 Vehicle | 172 (25.2%) | 238 (35.9%) |
| 2 Vehicles | 295 (43.1%) | 256 (38.6%) |
| 3 Vehicles | 134 (19.6%) | 133 (20.1%) |
| 4 Vehicles | 45 (6.6%) | 2 (0.3%) |
| 5 or more Vehicles | 15 (2.2%) | 0 (0.0%) |
| Total | 684 (100.0%) | 663 (100.0%) |
Commute Time in Greenville
The most frequently occuring commute durations in Greenville are 20 to 24 minutes (217 commuters, 18.7%), 15 to 19 minutes (211 commuters, 18.1%), and 10 to 14 minutes (200 commuters, 17.2%).
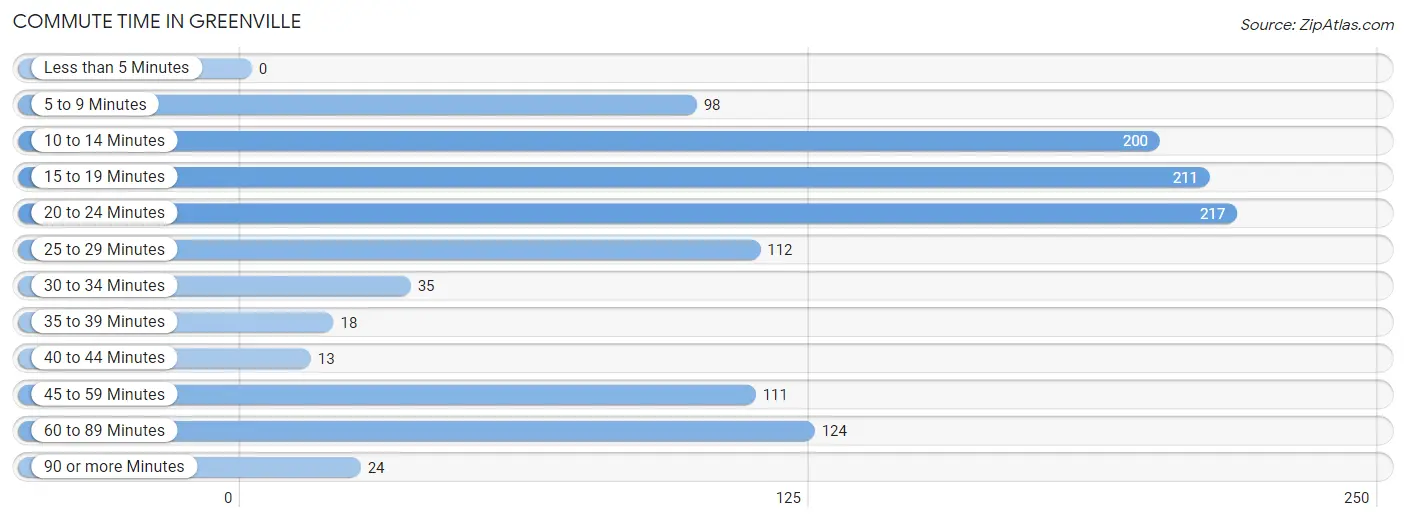
| Commute Time | # Commuters | % Commuters |
| Less than 5 Minutes | 0 | 0.0% |
| 5 to 9 Minutes | 98 | 8.4% |
| 10 to 14 Minutes | 200 | 17.2% |
| 15 to 19 Minutes | 211 | 18.1% |
| 20 to 24 Minutes | 217 | 18.7% |
| 25 to 29 Minutes | 112 | 9.6% |
| 30 to 34 Minutes | 35 | 3.0% |
| 35 to 39 Minutes | 18 | 1.5% |
| 40 to 44 Minutes | 13 | 1.1% |
| 45 to 59 Minutes | 111 | 9.5% |
| 60 to 89 Minutes | 124 | 10.7% |
| 90 or more Minutes | 24 | 2.1% |
Commute Time by Sex in Greenville
The most common commute times in Greenville are 20 to 24 minutes (156 commuters, 23.7%) for males and 10 to 14 minutes (108 commuters, 21.3%) for females.
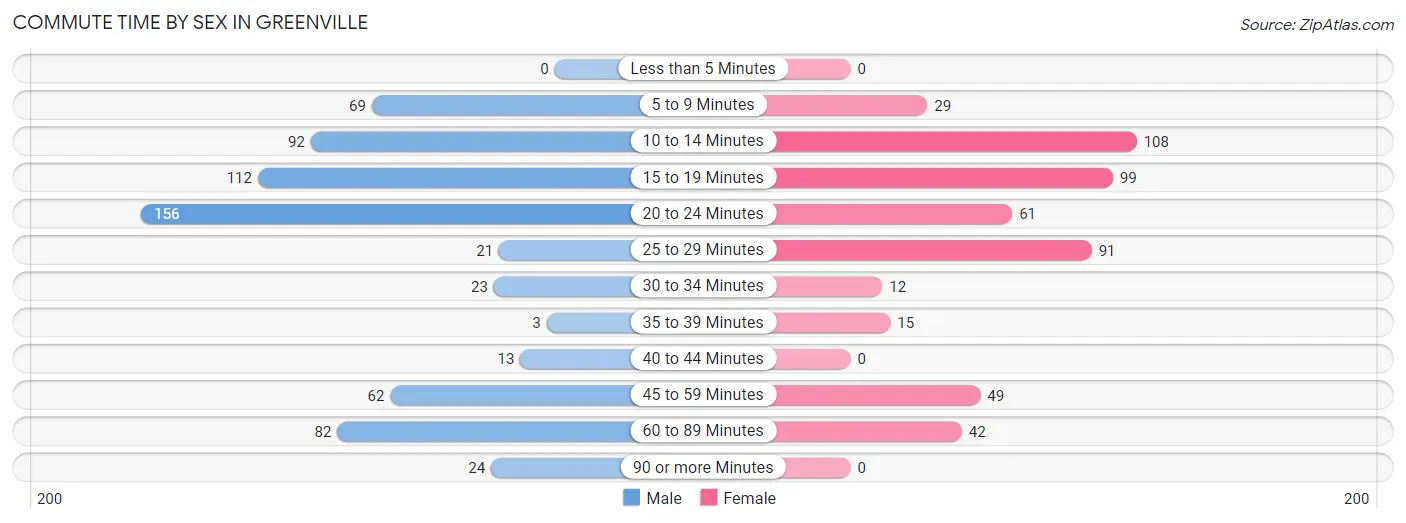
| Commute Time | Male | Female |
| Less than 5 Minutes | 0 (0.0%) | 0 (0.0%) |
| 5 to 9 Minutes | 69 (10.5%) | 29 (5.7%) |
| 10 to 14 Minutes | 92 (14.0%) | 108 (21.3%) |
| 15 to 19 Minutes | 112 (17.1%) | 99 (19.6%) |
| 20 to 24 Minutes | 156 (23.7%) | 61 (12.1%) |
| 25 to 29 Minutes | 21 (3.2%) | 91 (18.0%) |
| 30 to 34 Minutes | 23 (3.5%) | 12 (2.4%) |
| 35 to 39 Minutes | 3 (0.5%) | 15 (3.0%) |
| 40 to 44 Minutes | 13 (2.0%) | 0 (0.0%) |
| 45 to 59 Minutes | 62 (9.4%) | 49 (9.7%) |
| 60 to 89 Minutes | 82 (12.5%) | 42 (8.3%) |
| 90 or more Minutes | 24 (3.6%) | 0 (0.0%) |
Time of Departure to Work by Sex in Greenville
The most frequent times of departure to work in Greenville are 7:30 AM to 7:59 AM (207, 31.5%) for males and 7:30 AM to 7:59 AM (155, 30.6%) for females.
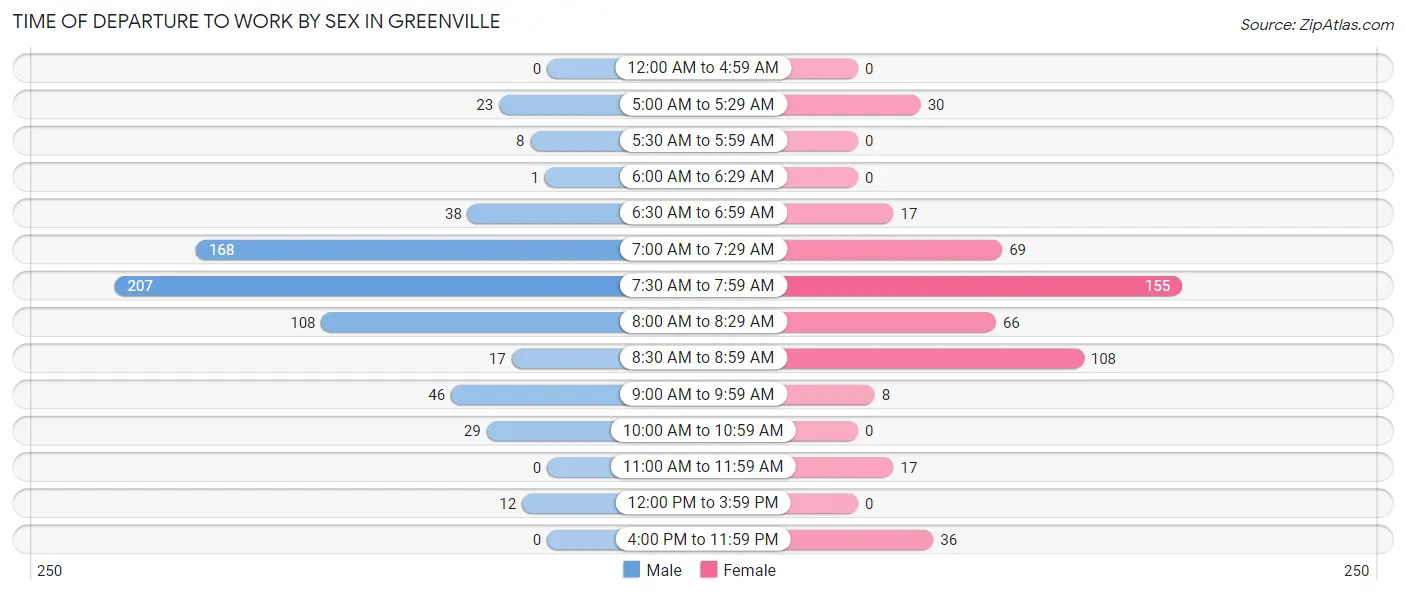
| Time of Departure | Male | Female |
| 12:00 AM to 4:59 AM | 0 (0.0%) | 0 (0.0%) |
| 5:00 AM to 5:29 AM | 23 (3.5%) | 30 (5.9%) |
| 5:30 AM to 5:59 AM | 8 (1.2%) | 0 (0.0%) |
| 6:00 AM to 6:29 AM | 1 (0.2%) | 0 (0.0%) |
| 6:30 AM to 6:59 AM | 38 (5.8%) | 17 (3.4%) |
| 7:00 AM to 7:29 AM | 168 (25.6%) | 69 (13.6%) |
| 7:30 AM to 7:59 AM | 207 (31.5%) | 155 (30.6%) |
| 8:00 AM to 8:29 AM | 108 (16.4%) | 66 (13.0%) |
| 8:30 AM to 8:59 AM | 17 (2.6%) | 108 (21.3%) |
| 9:00 AM to 9:59 AM | 46 (7.0%) | 8 (1.6%) |
| 10:00 AM to 10:59 AM | 29 (4.4%) | 0 (0.0%) |
| 11:00 AM to 11:59 AM | 0 (0.0%) | 17 (3.4%) |
| 12:00 PM to 3:59 PM | 12 (1.8%) | 0 (0.0%) |
| 4:00 PM to 11:59 PM | 0 (0.0%) | 36 (7.1%) |
| Total | 657 (100.0%) | 506 (100.0%) |
Housing Occupancy in Greenville
Occupancy by Ownership in Greenville
Of the total 1,326 dwellings in Greenville, owner-occupied units account for 658 (49.6%), while renter-occupied units make up 668 (50.4%).
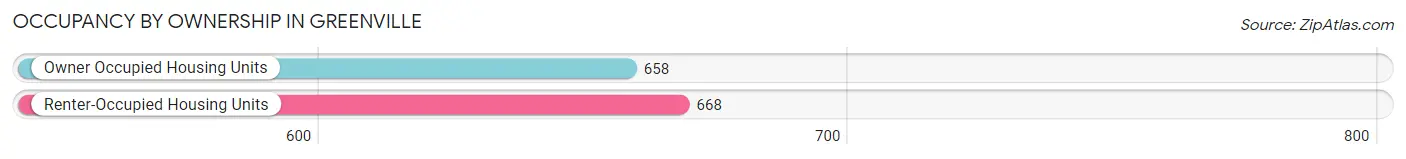
| Occupancy | # Housing Units | % Housing Units |
| Owner Occupied Housing Units | 658 | 49.6% |
| Renter-Occupied Housing Units | 668 | 50.4% |
| Total Occupied Housing Units | 1,326 | 100.0% |
Occupancy by Household Size in Greenville
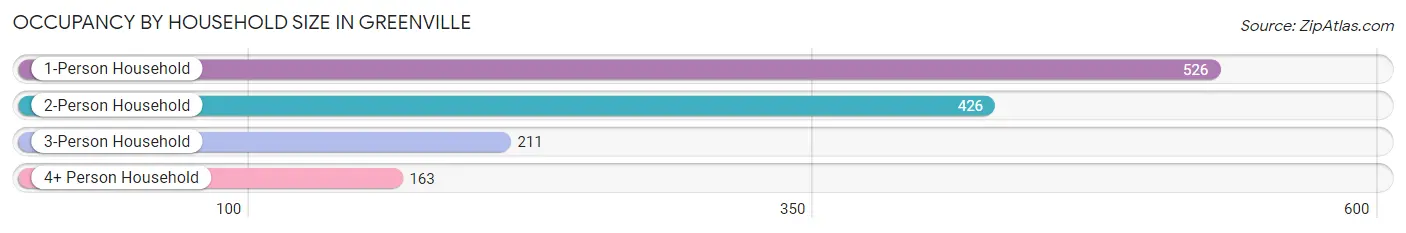
| Household Size | # Housing Units | % Housing Units |
| 1-Person Household | 526 | 39.7% |
| 2-Person Household | 426 | 32.1% |
| 3-Person Household | 211 | 15.9% |
| 4+ Person Household | 163 | 12.3% |
| Total Housing Units | 1,326 | 100.0% |
Occupancy by Ownership by Household Size in Greenville
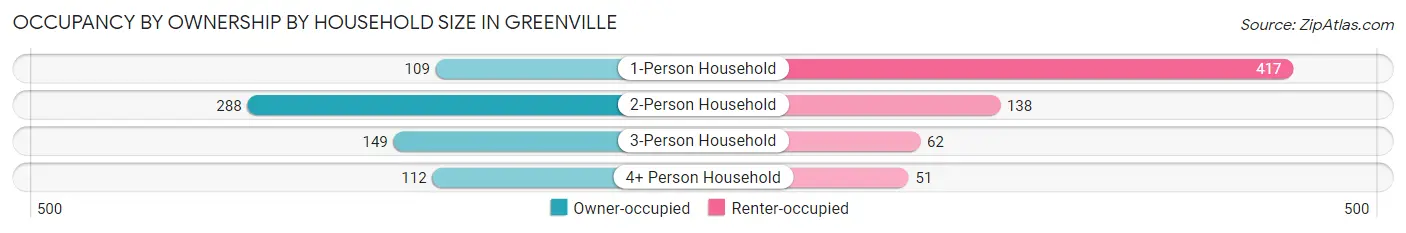
| Household Size | Owner-occupied | Renter-occupied |
| 1-Person Household | 109 (20.7%) | 417 (79.3%) |
| 2-Person Household | 288 (67.6%) | 138 (32.4%) |
| 3-Person Household | 149 (70.6%) | 62 (29.4%) |
| 4+ Person Household | 112 (68.7%) | 51 (31.3%) |
| Total Housing Units | 658 (49.6%) | 668 (50.4%) |
Occupancy by Educational Attainment in Greenville
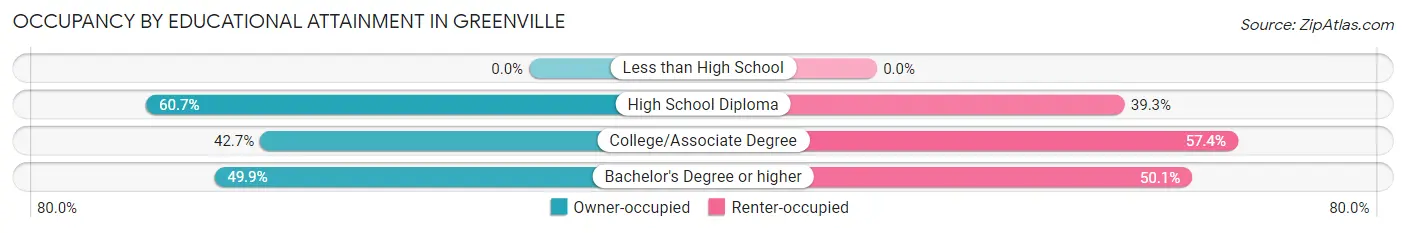
| Household Size | Owner-occupied | Renter-occupied |
| Less than High School | 0 (0.0%) | 0 (0.0%) |
| High School Diploma | 34 (60.7%) | 22 (39.3%) |
| College/Associate Degree | 58 (42.6%) | 78 (57.4%) |
| Bachelor's Degree or higher | 566 (49.9%) | 568 (50.1%) |
Occupancy by Age of Householder in Greenville
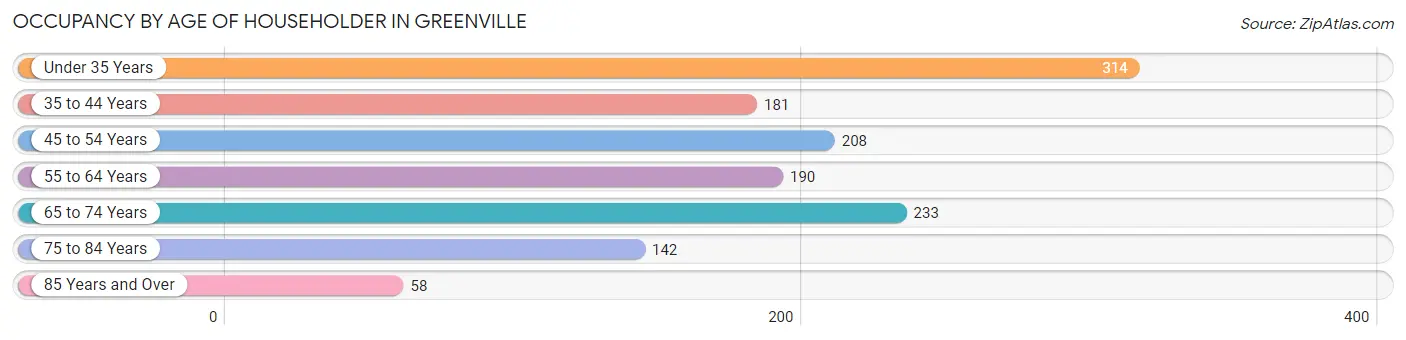
| Age Bracket | # Households | % Households |
| Under 35 Years | 314 | 23.7% |
| 35 to 44 Years | 181 | 13.7% |
| 45 to 54 Years | 208 | 15.7% |
| 55 to 64 Years | 190 | 14.3% |
| 65 to 74 Years | 233 | 17.6% |
| 75 to 84 Years | 142 | 10.7% |
| 85 Years and Over | 58 | 4.4% |
| Total | 1,326 | 100.0% |
Housing Finances in Greenville
Median Income by Occupancy in Greenville
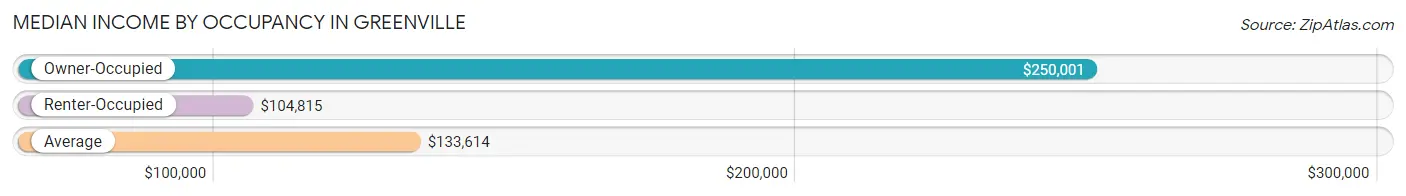
| Occupancy Type | # Households | Median Income |
| Owner-Occupied | 658 (49.6%) | $250,001 |
| Renter-Occupied | 668 (50.4%) | $104,815 |
| Average | 1,326 (100.0%) | $133,614 |
Occupancy by Householder Income Bracket in Greenville
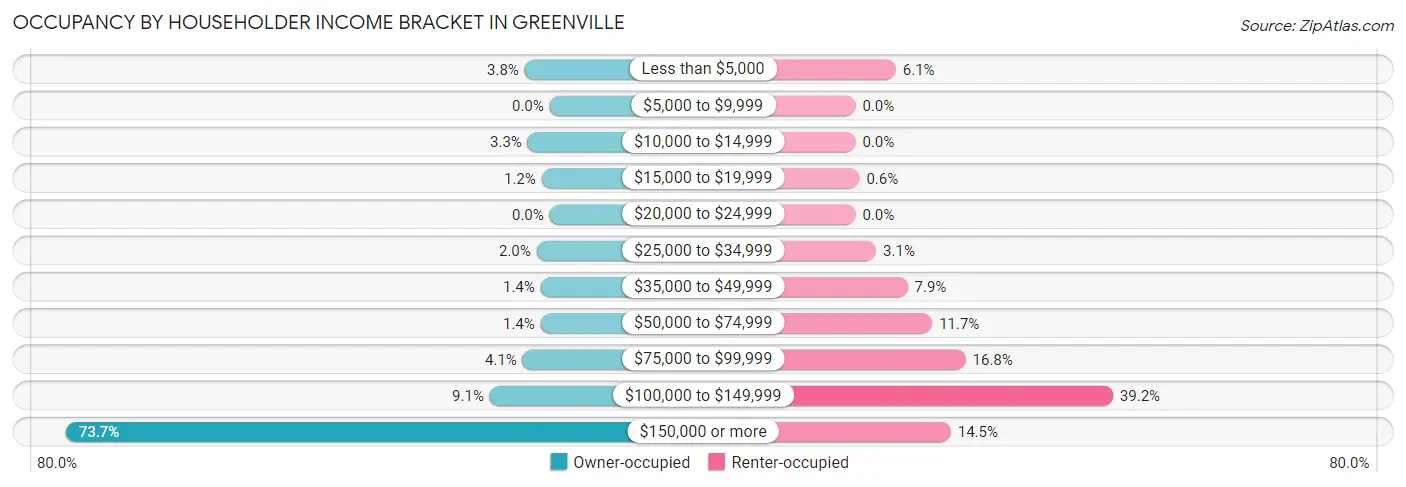
| Income Bracket | Owner-occupied | Renter-occupied |
| Less than $5,000 | 25 (3.8%) | 41 (6.1%) |
| $5,000 to $9,999 | 0 (0.0%) | 0 (0.0%) |
| $10,000 to $14,999 | 22 (3.3%) | 0 (0.0%) |
| $15,000 to $19,999 | 8 (1.2%) | 4 (0.6%) |
| $20,000 to $24,999 | 0 (0.0%) | 0 (0.0%) |
| $25,000 to $34,999 | 13 (2.0%) | 21 (3.1%) |
| $35,000 to $49,999 | 9 (1.4%) | 53 (7.9%) |
| $50,000 to $74,999 | 9 (1.4%) | 78 (11.7%) |
| $75,000 to $99,999 | 27 (4.1%) | 112 (16.8%) |
| $100,000 to $149,999 | 60 (9.1%) | 262 (39.2%) |
| $150,000 or more | 485 (73.7%) | 97 (14.5%) |
| Total | 658 (100.0%) | 668 (100.0%) |
Monthly Housing Cost Tiers in Greenville
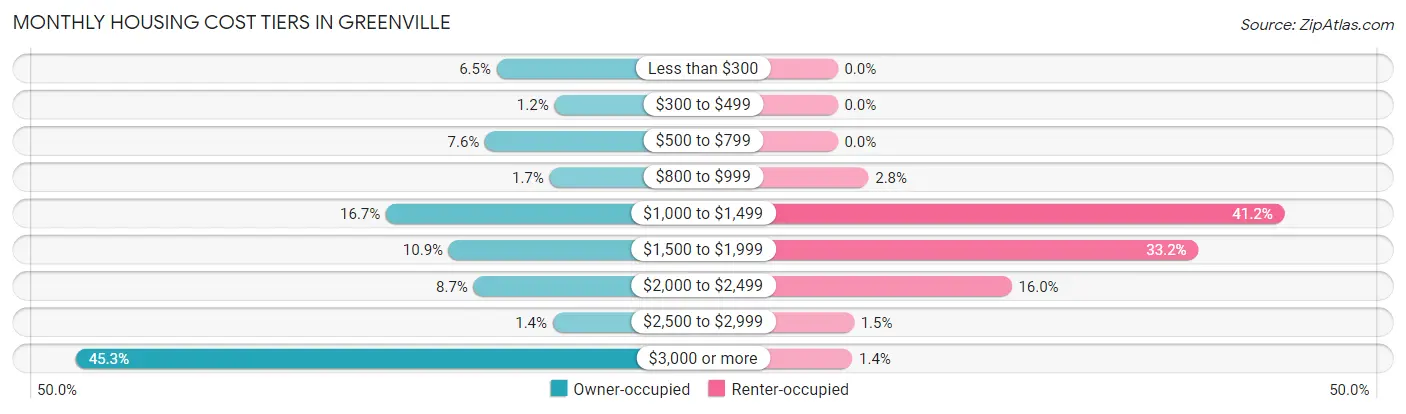
| Monthly Cost | Owner-occupied | Renter-occupied |
| Less than $300 | 43 (6.5%) | 0 (0.0%) |
| $300 to $499 | 8 (1.2%) | 0 (0.0%) |
| $500 to $799 | 50 (7.6%) | 0 (0.0%) |
| $800 to $999 | 11 (1.7%) | 19 (2.8%) |
| $1,000 to $1,499 | 110 (16.7%) | 275 (41.2%) |
| $1,500 to $1,999 | 72 (10.9%) | 222 (33.2%) |
| $2,000 to $2,499 | 57 (8.7%) | 107 (16.0%) |
| $2,500 to $2,999 | 9 (1.4%) | 10 (1.5%) |
| $3,000 or more | 298 (45.3%) | 9 (1.3%) |
| Total | 658 (100.0%) | 668 (100.0%) |
Physical Housing Characteristics in Greenville
Housing Structures in Greenville
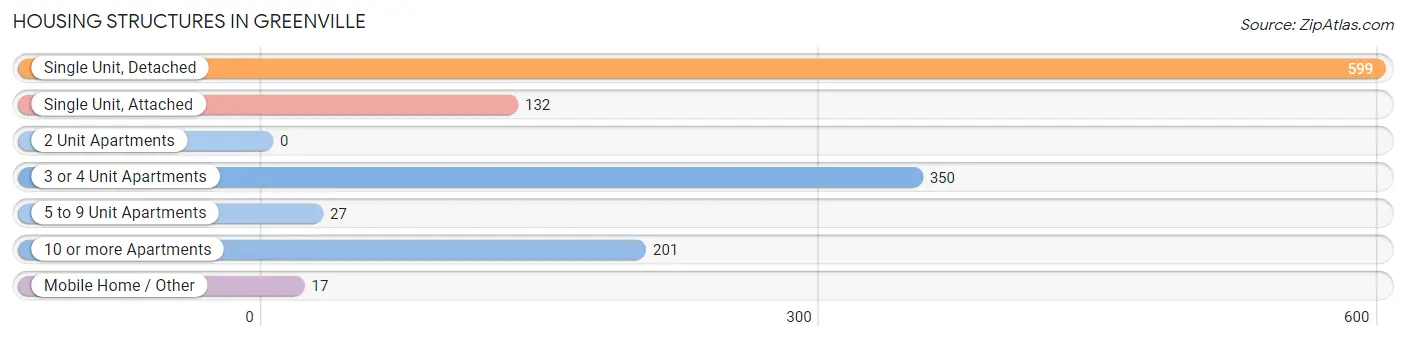
| Structure Type | # Housing Units | % Housing Units |
| Single Unit, Detached | 599 | 45.2% |
| Single Unit, Attached | 132 | 10.0% |
| 2 Unit Apartments | 0 | 0.0% |
| 3 or 4 Unit Apartments | 350 | 26.4% |
| 5 to 9 Unit Apartments | 27 | 2.0% |
| 10 or more Apartments | 201 | 15.2% |
| Mobile Home / Other | 17 | 1.3% |
| Total | 1,326 | 100.0% |
Housing Structures by Occupancy in Greenville
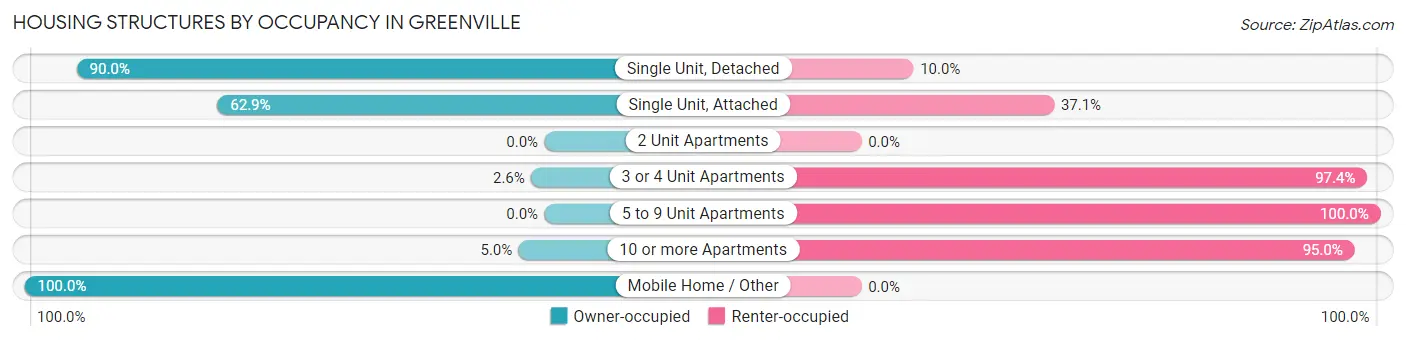
| Structure Type | Owner-occupied | Renter-occupied |
| Single Unit, Detached | 539 (90.0%) | 60 (10.0%) |
| Single Unit, Attached | 83 (62.9%) | 49 (37.1%) |
| 2 Unit Apartments | 0 (0.0%) | 0 (0.0%) |
| 3 or 4 Unit Apartments | 9 (2.6%) | 341 (97.4%) |
| 5 to 9 Unit Apartments | 0 (0.0%) | 27 (100.0%) |
| 10 or more Apartments | 10 (5.0%) | 191 (95.0%) |
| Mobile Home / Other | 17 (100.0%) | 0 (0.0%) |
| Total | 658 (49.6%) | 668 (50.4%) |
Housing Structures by Number of Rooms in Greenville
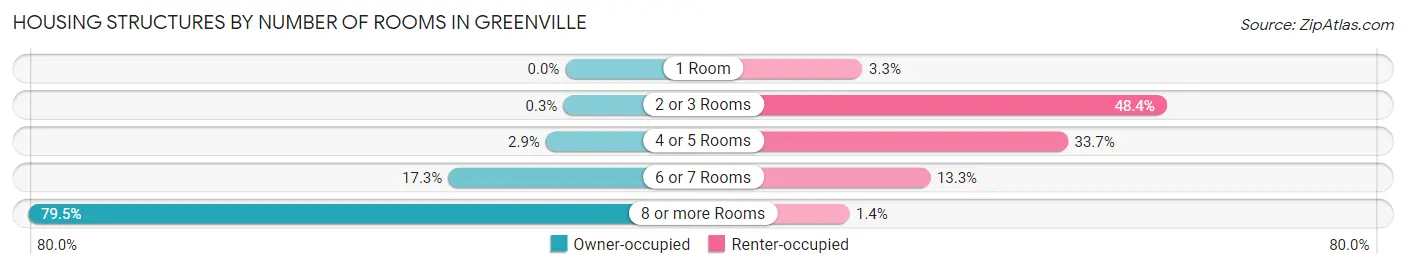
| Number of Rooms | Owner-occupied | Renter-occupied |
| 1 Room | 0 (0.0%) | 22 (3.3%) |
| 2 or 3 Rooms | 2 (0.3%) | 323 (48.3%) |
| 4 or 5 Rooms | 19 (2.9%) | 225 (33.7%) |
| 6 or 7 Rooms | 114 (17.3%) | 89 (13.3%) |
| 8 or more Rooms | 523 (79.5%) | 9 (1.3%) |
| Total | 658 (100.0%) | 668 (100.0%) |
Housing Structure by Heating Type in Greenville
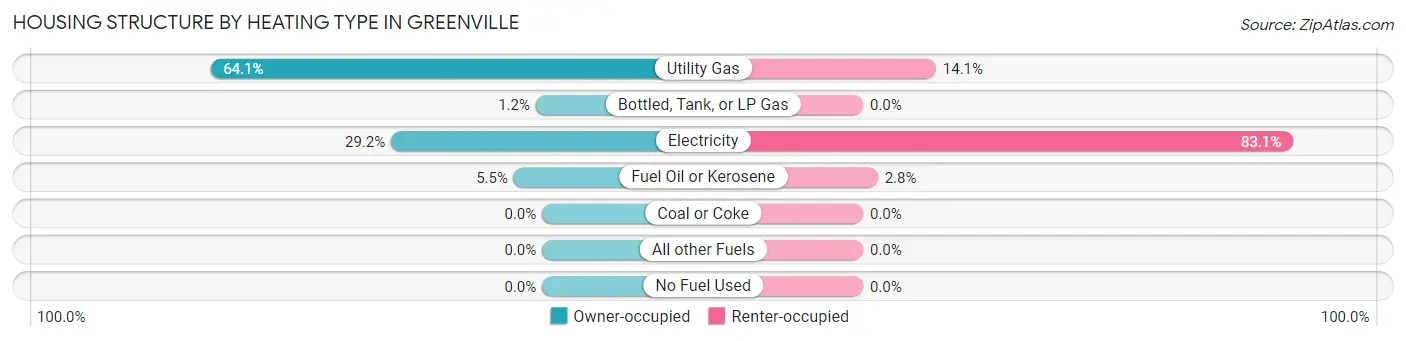
| Heating Type | Owner-occupied | Renter-occupied |
| Utility Gas | 422 (64.1%) | 94 (14.1%) |
| Bottled, Tank, or LP Gas | 8 (1.2%) | 0 (0.0%) |
| Electricity | 192 (29.2%) | 555 (83.1%) |
| Fuel Oil or Kerosene | 36 (5.5%) | 19 (2.8%) |
| Coal or Coke | 0 (0.0%) | 0 (0.0%) |
| All other Fuels | 0 (0.0%) | 0 (0.0%) |
| No Fuel Used | 0 (0.0%) | 0 (0.0%) |
| Total | 658 (100.0%) | 668 (100.0%) |
Household Vehicle Usage in Greenville
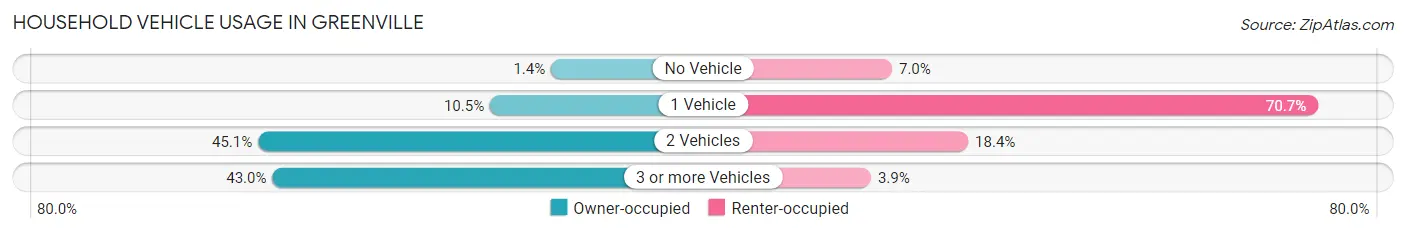
| Vehicles per Household | Owner-occupied | Renter-occupied |
| No Vehicle | 9 (1.4%) | 47 (7.0%) |
| 1 Vehicle | 69 (10.5%) | 472 (70.7%) |
| 2 Vehicles | 297 (45.1%) | 123 (18.4%) |
| 3 or more Vehicles | 283 (43.0%) | 26 (3.9%) |
| Total | 658 (100.0%) | 668 (100.0%) |
Real Estate & Mortgages in Greenville
Real Estate and Mortgage Overview in Greenville
| Characteristic | Without Mortgage | With Mortgage |
| Housing Units | 322 | 336 |
| Median Property Value | $770,600 | $1,189,800 |
| Median Household Income | $250,001 | $281 |
| Monthly Housing Costs | $1,125 | $298 |
| Real Estate Taxes | $7,002 | $0 |
Property Value by Mortgage Status in Greenville
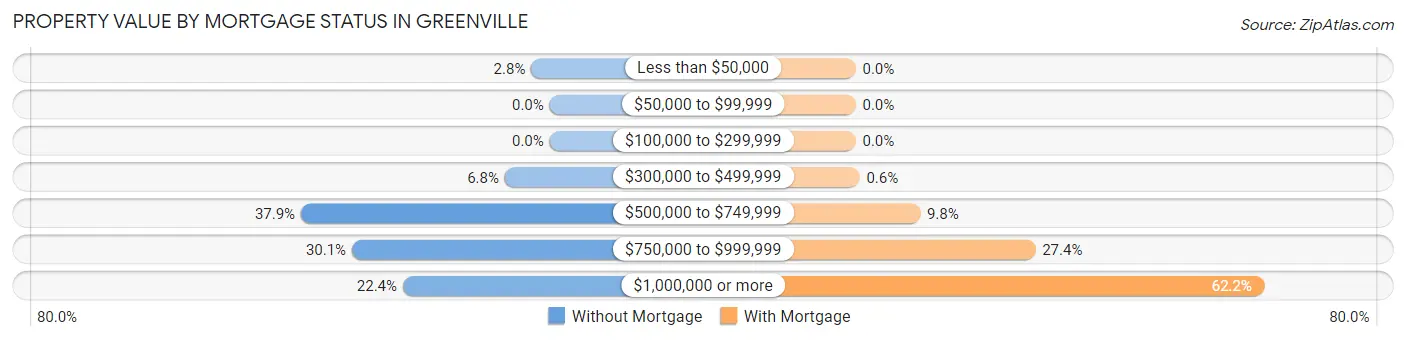
| Property Value | Without Mortgage | With Mortgage |
| Less than $50,000 | 9 (2.8%) | 0 (0.0%) |
| $50,000 to $99,999 | 0 (0.0%) | 0 (0.0%) |
| $100,000 to $299,999 | 0 (0.0%) | 0 (0.0%) |
| $300,000 to $499,999 | 22 (6.8%) | 2 (0.6%) |
| $500,000 to $749,999 | 122 (37.9%) | 33 (9.8%) |
| $750,000 to $999,999 | 97 (30.1%) | 92 (27.4%) |
| $1,000,000 or more | 72 (22.4%) | 209 (62.2%) |
| Total | 322 (100.0%) | 336 (100.0%) |
Household Income by Mortgage Status in Greenville
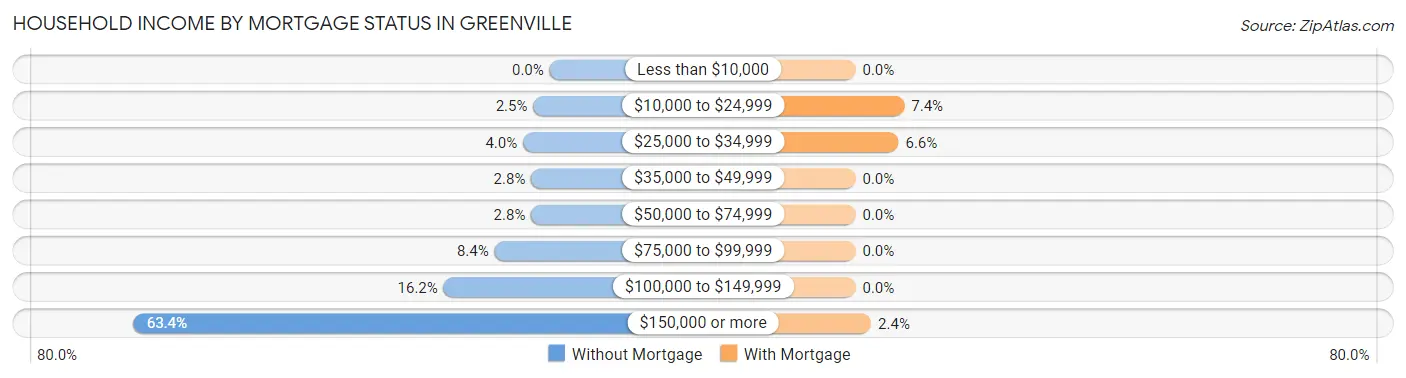
| Household Income | Without Mortgage | With Mortgage |
| Less than $10,000 | 0 (0.0%) | 0 (0.0%) |
| $10,000 to $24,999 | 8 (2.5%) | 25 (7.4%) |
| $25,000 to $34,999 | 13 (4.0%) | 22 (6.6%) |
| $35,000 to $49,999 | 9 (2.8%) | 0 (0.0%) |
| $50,000 to $74,999 | 9 (2.8%) | 0 (0.0%) |
| $75,000 to $99,999 | 27 (8.4%) | 0 (0.0%) |
| $100,000 to $149,999 | 52 (16.2%) | 0 (0.0%) |
| $150,000 or more | 204 (63.3%) | 8 (2.4%) |
| Total | 322 (100.0%) | 336 (100.0%) |
Property Value to Household Income Ratio in Greenville
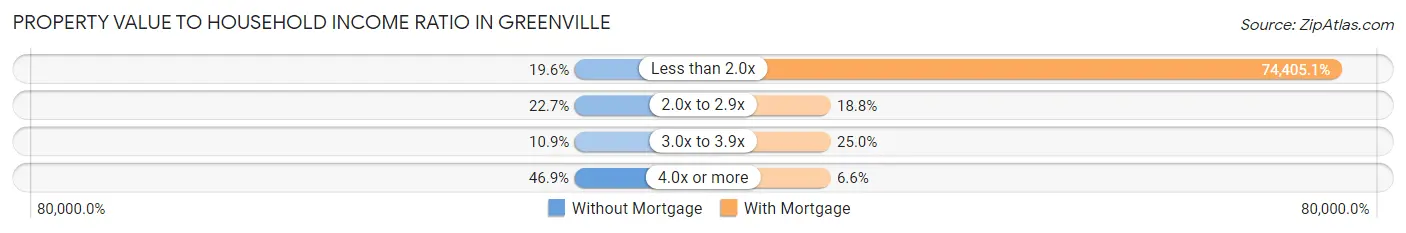
| Value-to-Income Ratio | Without Mortgage | With Mortgage |
| Less than 2.0x | 63 (19.6%) | 250,001 (74,405.1%) |
| 2.0x to 2.9x | 73 (22.7%) | 63 (18.8%) |
| 3.0x to 3.9x | 35 (10.9%) | 84 (25.0%) |
| 4.0x or more | 151 (46.9%) | 22 (6.6%) |
| Total | 322 (100.0%) | 336 (100.0%) |
Real Estate Taxes by Mortgage Status in Greenville
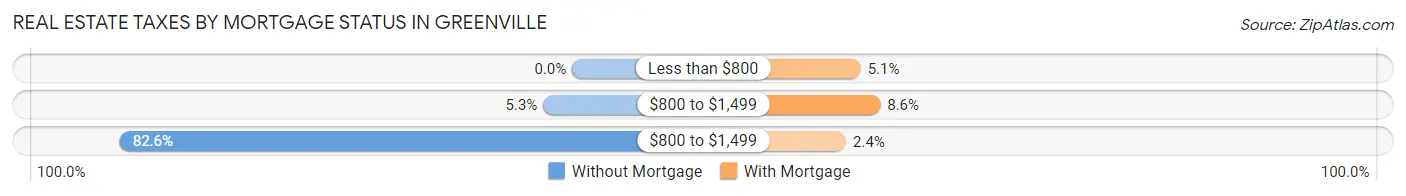
| Property Taxes | Without Mortgage | With Mortgage |
| Less than $800 | 0 (0.0%) | 17 (5.1%) |
| $800 to $1,499 | 17 (5.3%) | 29 (8.6%) |
| $800 to $1,499 | 266 (82.6%) | 8 (2.4%) |
| Total | 322 (100.0%) | 336 (100.0%) |
Health & Disability in Greenville
Health Insurance Coverage by Age in Greenville
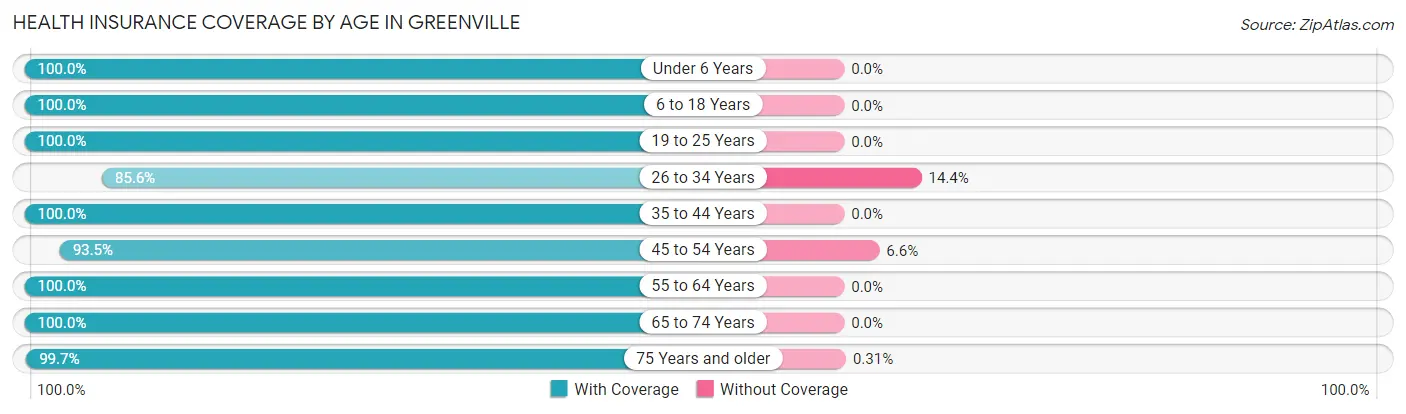
| Age Bracket | With Coverage | Without Coverage |
| Under 6 Years | 206 (100.0%) | 0 (0.0%) |
| 6 to 18 Years | 400 (100.0%) | 0 (0.0%) |
| 19 to 25 Years | 108 (100.0%) | 0 (0.0%) |
| 26 to 34 Years | 374 (85.6%) | 63 (14.4%) |
| 35 to 44 Years | 286 (100.0%) | 0 (0.0%) |
| 45 to 54 Years | 328 (93.4%) | 23 (6.6%) |
| 55 to 64 Years | 380 (100.0%) | 0 (0.0%) |
| 65 to 74 Years | 329 (100.0%) | 0 (0.0%) |
| 75 Years and older | 326 (99.7%) | 1 (0.3%) |
| Total | 2,737 (96.9%) | 87 (3.1%) |
Health Insurance Coverage by Citizenship Status in Greenville
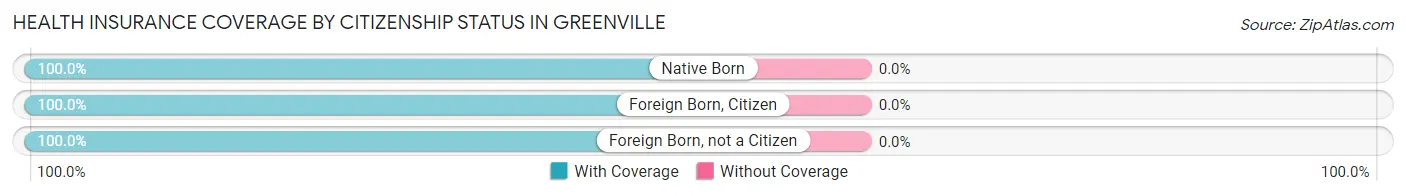
| Citizenship Status | With Coverage | Without Coverage |
| Native Born | 206 (100.0%) | 0 (0.0%) |
| Foreign Born, Citizen | 400 (100.0%) | 0 (0.0%) |
| Foreign Born, not a Citizen | 108 (100.0%) | 0 (0.0%) |
Health Insurance Coverage by Household Income in Greenville
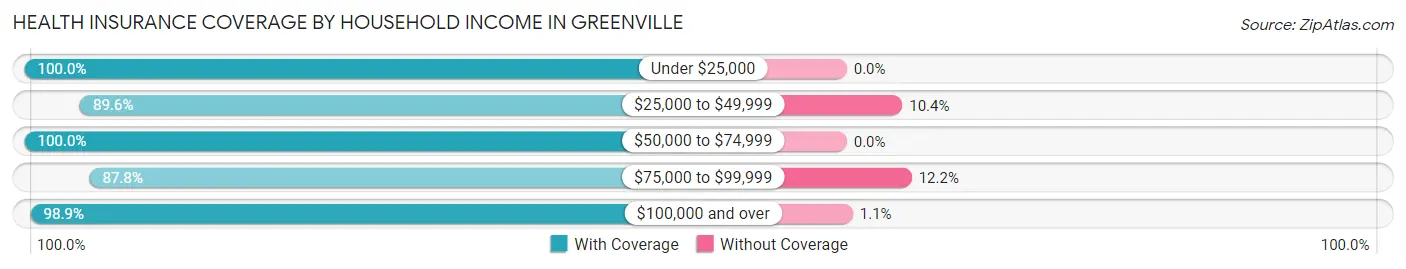
| Household Income | With Coverage | Without Coverage |
| Under $25,000 | 151 (100.0%) | 0 (0.0%) |
| $25,000 to $49,999 | 112 (89.6%) | 13 (10.4%) |
| $50,000 to $74,999 | 98 (100.0%) | 0 (0.0%) |
| $75,000 to $99,999 | 361 (87.8%) | 50 (12.2%) |
| $100,000 and over | 2,010 (98.9%) | 23 (1.1%) |
Public vs Private Health Insurance Coverage by Age in Greenville
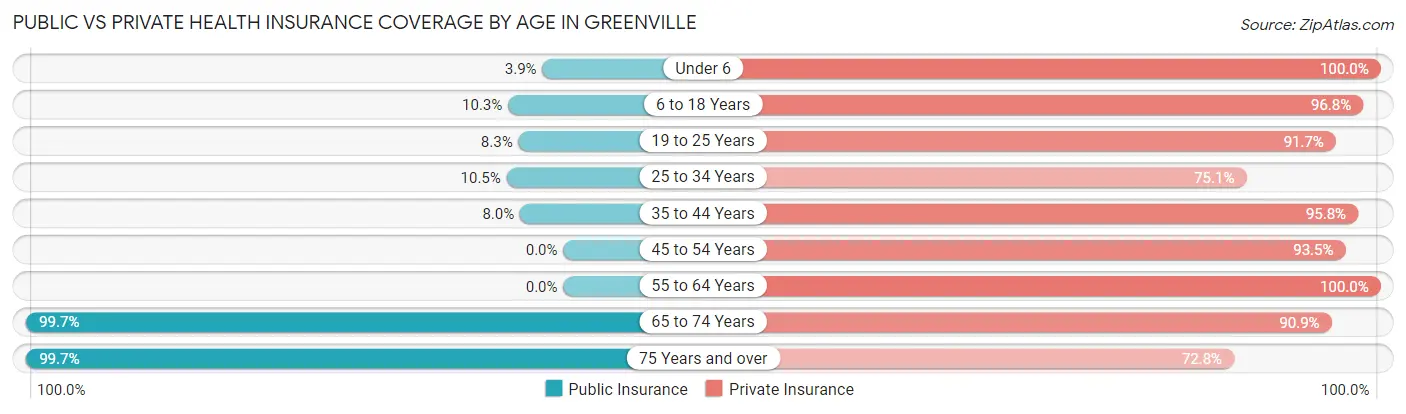
| Age Bracket | Public Insurance | Private Insurance |
| Under 6 | 8 (3.9%) | 206 (100.0%) |
| 6 to 18 Years | 41 (10.2%) | 387 (96.8%) |
| 19 to 25 Years | 9 (8.3%) | 99 (91.7%) |
| 25 to 34 Years | 46 (10.5%) | 328 (75.1%) |
| 35 to 44 Years | 23 (8.0%) | 274 (95.8%) |
| 45 to 54 Years | 0 (0.0%) | 328 (93.4%) |
| 55 to 64 Years | 0 (0.0%) | 380 (100.0%) |
| 65 to 74 Years | 328 (99.7%) | 299 (90.9%) |
| 75 Years and over | 326 (99.7%) | 238 (72.8%) |
| Total | 781 (27.7%) | 2,539 (89.9%) |
Disability Status by Sex by Age in Greenville
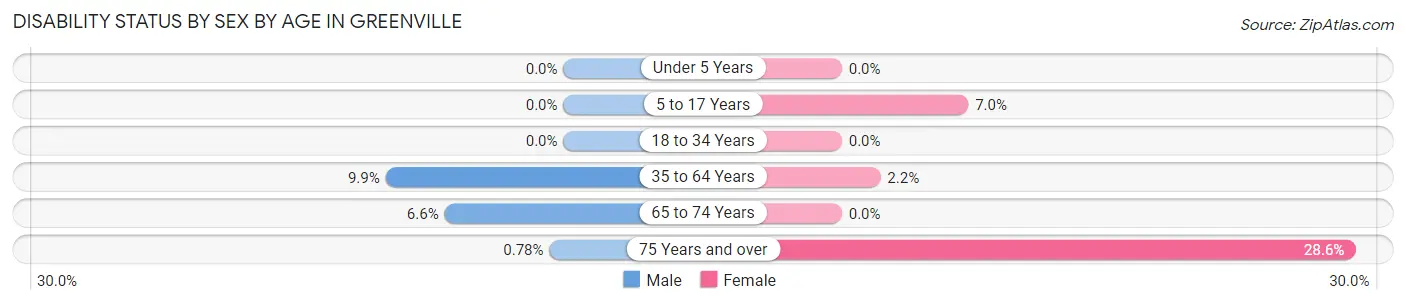
| Age Bracket | Male | Female |
| Under 5 Years | 0 (0.0%) | 0 (0.0%) |
| 5 to 17 Years | 0 (0.0%) | 14 (7.0%) |
| 18 to 34 Years | 0 (0.0%) | 0 (0.0%) |
| 35 to 64 Years | 50 (9.9%) | 11 (2.1%) |
| 65 to 74 Years | 9 (6.6%) | 0 (0.0%) |
| 75 Years and over | 1 (0.8%) | 57 (28.6%) |
Disability Class by Sex by Age in Greenville
Disability Class: Hearing Difficulty
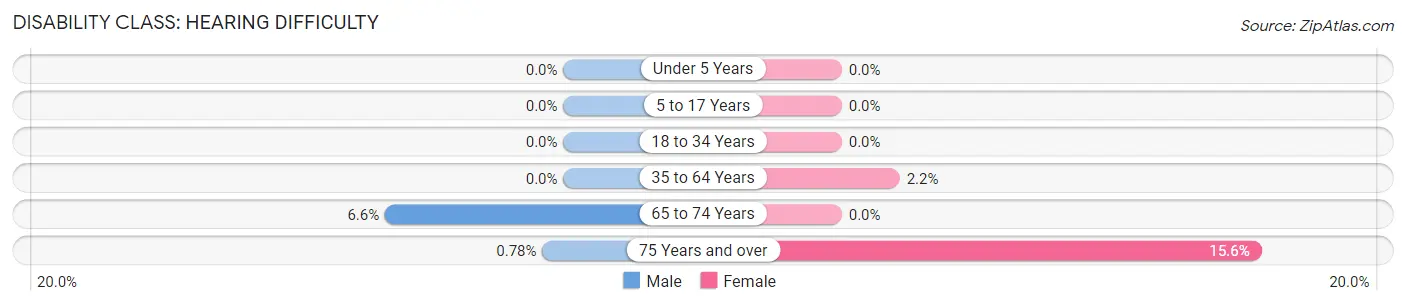
| Age Bracket | Male | Female |
| Under 5 Years | 0 (0.0%) | 0 (0.0%) |
| 5 to 17 Years | 0 (0.0%) | 0 (0.0%) |
| 18 to 34 Years | 0 (0.0%) | 0 (0.0%) |
| 35 to 64 Years | 0 (0.0%) | 11 (2.1%) |
| 65 to 74 Years | 9 (6.6%) | 0 (0.0%) |
| 75 Years and over | 1 (0.8%) | 31 (15.6%) |
Disability Class: Vision Difficulty
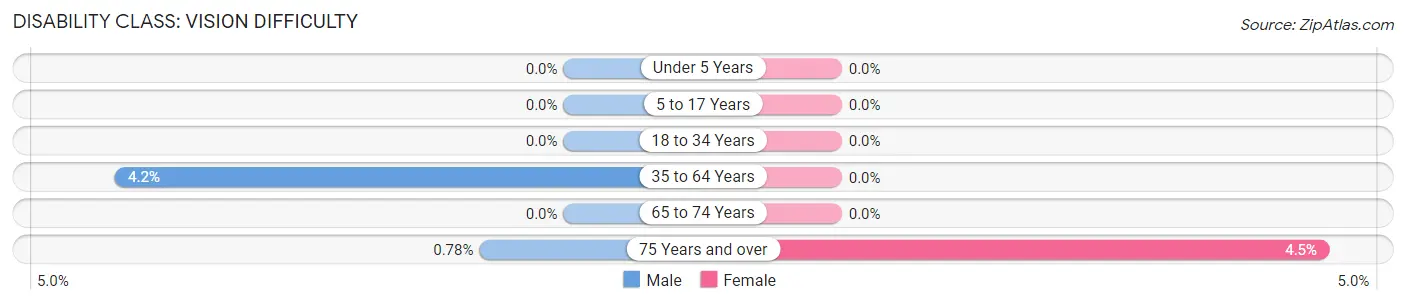
| Age Bracket | Male | Female |
| Under 5 Years | 0 (0.0%) | 0 (0.0%) |
| 5 to 17 Years | 0 (0.0%) | 0 (0.0%) |
| 18 to 34 Years | 0 (0.0%) | 0 (0.0%) |
| 35 to 64 Years | 21 (4.2%) | 0 (0.0%) |
| 65 to 74 Years | 0 (0.0%) | 0 (0.0%) |
| 75 Years and over | 1 (0.8%) | 9 (4.5%) |
Disability Class: Cognitive Difficulty
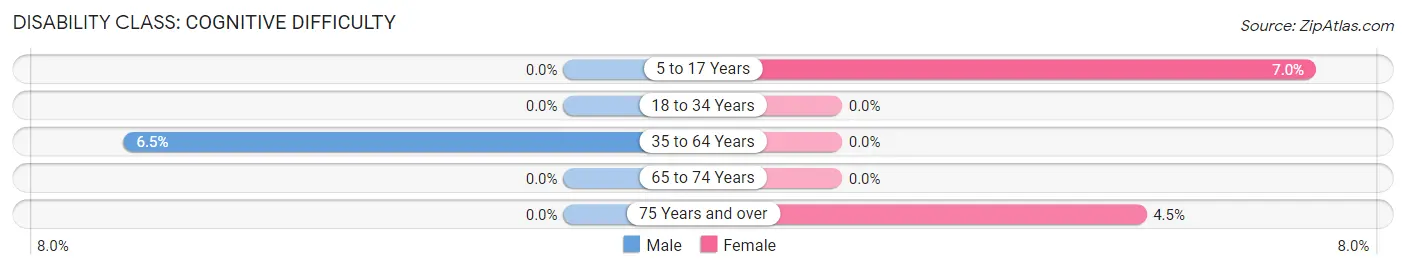
| Age Bracket | Male | Female |
| 5 to 17 Years | 0 (0.0%) | 14 (7.0%) |
| 18 to 34 Years | 0 (0.0%) | 0 (0.0%) |
| 35 to 64 Years | 33 (6.5%) | 0 (0.0%) |
| 65 to 74 Years | 0 (0.0%) | 0 (0.0%) |
| 75 Years and over | 0 (0.0%) | 9 (4.5%) |
Disability Class: Ambulatory Difficulty
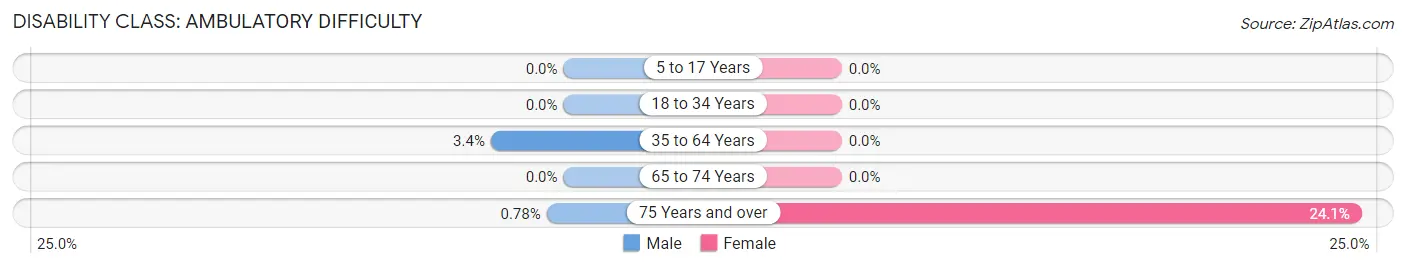
| Age Bracket | Male | Female |
| 5 to 17 Years | 0 (0.0%) | 0 (0.0%) |
| 18 to 34 Years | 0 (0.0%) | 0 (0.0%) |
| 35 to 64 Years | 17 (3.4%) | 0 (0.0%) |
| 65 to 74 Years | 0 (0.0%) | 0 (0.0%) |
| 75 Years and over | 1 (0.8%) | 48 (24.1%) |
Disability Class: Self-Care Difficulty
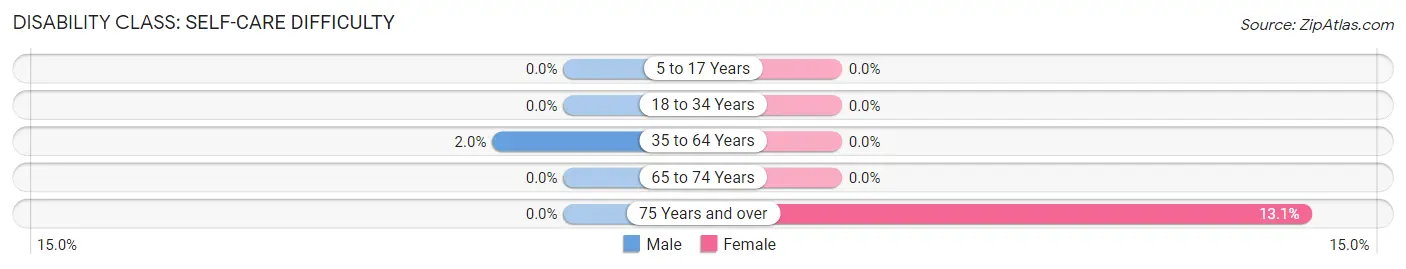
| Age Bracket | Male | Female |
| 5 to 17 Years | 0 (0.0%) | 0 (0.0%) |
| 18 to 34 Years | 0 (0.0%) | 0 (0.0%) |
| 35 to 64 Years | 10 (2.0%) | 0 (0.0%) |
| 65 to 74 Years | 0 (0.0%) | 0 (0.0%) |
| 75 Years and over | 0 (0.0%) | 26 (13.1%) |
Technology Access in Greenville
Computing Device Access in Greenville
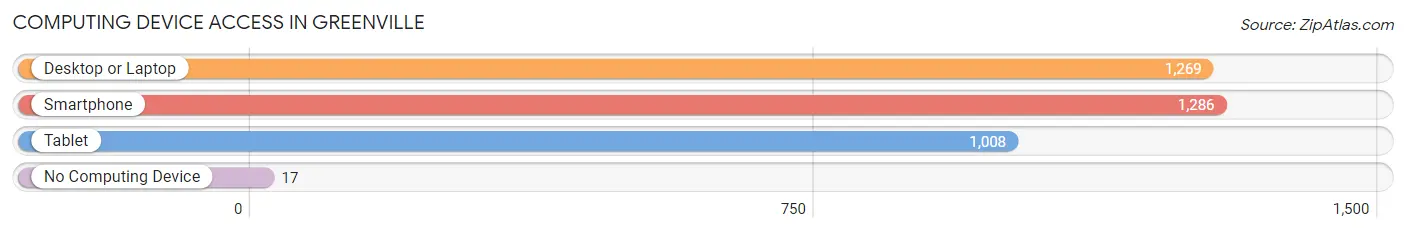
| Device Type | # Households | % Households |
| Desktop or Laptop | 1,269 | 95.7% |
| Smartphone | 1,286 | 97.0% |
| Tablet | 1,008 | 76.0% |
| No Computing Device | 17 | 1.3% |
| Total | 1,326 | 100.0% |
Internet Access in Greenville
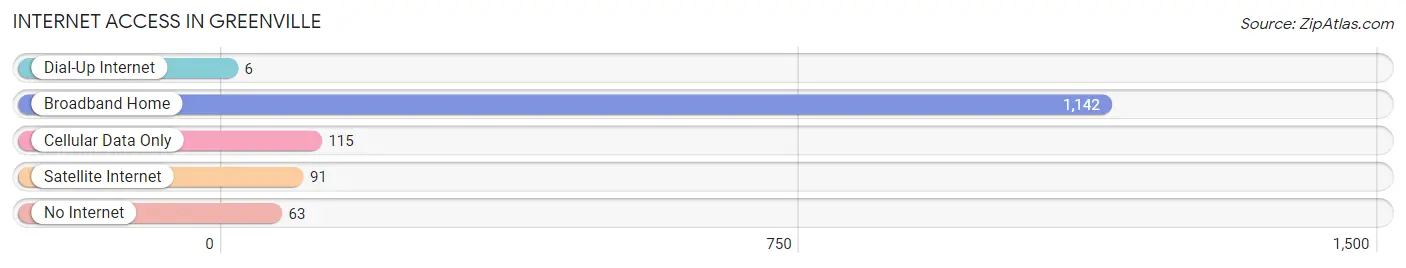
| Internet Type | # Households | % Households |
| Dial-Up Internet | 6 | 0.4% |
| Broadband Home | 1,142 | 86.1% |
| Cellular Data Only | 115 | 8.7% |
| Satellite Internet | 91 | 6.9% |
| No Internet | 63 | 4.8% |
| Total | 1,326 | 100.0% |
Greenville Summary
Greenville is a small town located in New Castle County, Delaware, United States. It is situated on the banks of the Brandywine Creek, about 8 miles (13 km) southwest of Wilmington. The population was 2,326 at the 2010 census.
History
Greenville was first settled in the late 17th century by Swedish and Dutch immigrants. The town was originally known as "Greenfield" and was part of the nearby town of Brandywine Hundred. In 1739, the town was officially incorporated as "Greenville".
The town was an important stop on the Underground Railroad, with many of its residents helping to hide and transport escaped slaves. During the American Civil War, Greenville was the site of a major battle between Union and Confederate forces.
Geography
Greenville is located at 39°45'17" North, 75°37'17" West (39.754722, -75.621389). According to the United States Census Bureau, the town has a total area of 1.2 square miles (3.1 km2), all of it land.
Economy
Greenville is a small town with a limited economy. The town is home to several small businesses, including a few restaurants, a grocery store, and a few retail stores. The town is also home to a few light industrial businesses.
Demographics
As of the census of 2010, there were 2,326 people, 890 households, and 602 families residing in the town. The population density was 1,945.8 people per square mile (750.3/km2). There were 945 housing units at an average density of 787.5 per square mile (303.7/km2). The racial makeup of the town was 79.2% White, 14.2% African American, 0.2% Native American, 1.2% Asian, 0.1% Pacific Islander, 2.3% from other races, and 2.9% from two or more races. Hispanic or Latino of any race were 5.2% of the population.
There were 890 households, out of which 33.2% had children under the age of 18 living with them, 46.2% were married couples living together, 15.2% had a female householder with no husband present, and 33.2% were non-families. 27.2% of all households were made up of individuals, and 10.3% had someone living alone who was 65 years of age or older. The average household size was 2.60 and the average family size was 3.17.
In the town, the population was spread out, with 25.7% under the age of 18, 8.2% from 18 to 24, 28.7% from 25 to 44, 24.2% from 45 to 64, and 13.2% who were 65 years of age or older. The median age was 37 years. For every 100 females, there were 91.2 males. For every 100 females age 18 and over, there were 87.2 males.
The median income for a household in the town was $50,938, and the median income for a family was $60,000. Males had a median income of $41,250 versus $30,000 for females. The per capita income for the town was $24,945. About 4.2% of families and 6.2% of the population were below the poverty line, including 8.2% of those under age 18 and 5.2% of those age 65 or over.
Common Questions
What is Per Capita Income in Greenville?
Per Capita income in Greenville is $102,638.
What is the Median Family Income in Greenville?
Median Family Income in Greenville is $229,444.
What is the Median Household income in Greenville?
Median Household Income in Greenville is $133,614.
What is Income or Wage Gap in Greenville?
Income or Wage Gap in Greenville is 47.5%.
Women in Greenville earn 52.5 cents for every dollar earned by a man.
What is Inequality or Gini Index in Greenville?
Inequality or Gini Index in Greenville is 0.49.
What is the Total Population of Greenville?
Total Population of Greenville is 2,824.
What is the Total Male Population of Greenville?
Total Male Population of Greenville is 1,355.
What is the Total Female Population of Greenville?
Total Female Population of Greenville is 1,469.
What is the Ratio of Males per 100 Females in Greenville?
There are 92.24 Males per 100 Females in Greenville.
What is the Ratio of Females per 100 Males in Greenville?
There are 108.41 Females per 100 Males in Greenville.
What is the Median Population Age in Greenville?
Median Population Age in Greenville is 41.8 Years.
What is the Average Family Size in Greenville
Average Family Size in Greenville is 2.9 People.
What is the Average Household Size in Greenville
Average Household Size in Greenville is 2.1 People.
How Large is the Labor Force in Greenville?
There are 1,418 People in the Labor Forcein in Greenville.
What is the Percentage of People in the Labor Force in Greenville?
60.8% of People are in the Labor Force in Greenville.
What is the Unemployment Rate in Greenville?
Unemployment Rate in Greenville is 3.5%.