Blades, DE Map & Demographics
Blades Map
Blades Overview
$26,045
PER CAPITA INCOME
$70,265
AVG FAMILY INCOME
$61,625
AVG HOUSEHOLD INCOME
18.4%
WAGE / INCOME GAP [ % ]
81.6¢/ $1
WAGE / INCOME GAP [ $ ]
0.30
INEQUALITY / GINI INDEX
960
TOTAL POPULATION
450
MALE POPULATION
510
FEMALE POPULATION
88.24
MALES / 100 FEMALES
113.33
FEMALES / 100 MALES
43.7
MEDIAN AGE
3.0
AVG FAMILY SIZE
2.6
AVG HOUSEHOLD SIZE
480
LABOR FORCE [ PEOPLE ]
59.1%
PERCENT IN LABOR FORCE
5.0%
UNEMPLOYMENT RATE
Blades Area Codes
Income in Blades
Income Overview in Blades
Per Capita Income in Blades is $26,045, while median incomes of families and households are $70,265 and $61,625 respectively.
| Characteristic | Number | Measure |
| Per Capita Income | 960 | $26,045 |
| Median Family Income | 277 | $70,265 |
| Mean Family Income | 277 | $72,849 |
| Median Household Income | 364 | $61,625 |
| Mean Household Income | 364 | $65,693 |
| Income Deficit | 277 | $0 |
| Wage / Income Gap (%) | 960 | 18.43% |
| Wage / Income Gap ($) | 960 | 81.57¢ per $1 |
| Gini / Inequality Index | 960 | 0.30 |
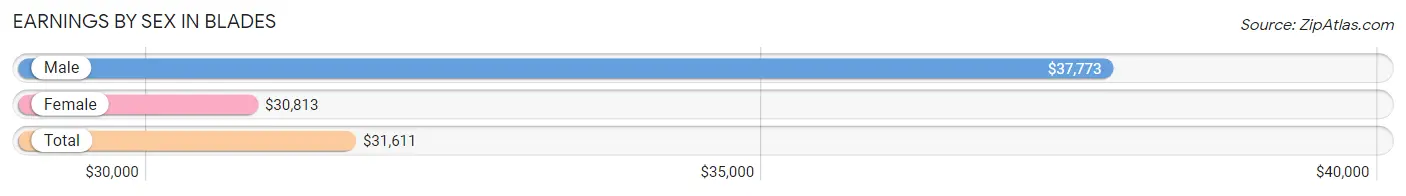
Earnings by Sex in Blades
Average Earnings in Blades are $31,611, $37,773 for men and $30,813 for women, a difference of 18.4%.
| Sex | Number | Average Earnings |
| Male | 243 (50.3%) | $37,773 |
| Female | 240 (49.7%) | $30,813 |
| Total | 483 (100.0%) | $31,611 |
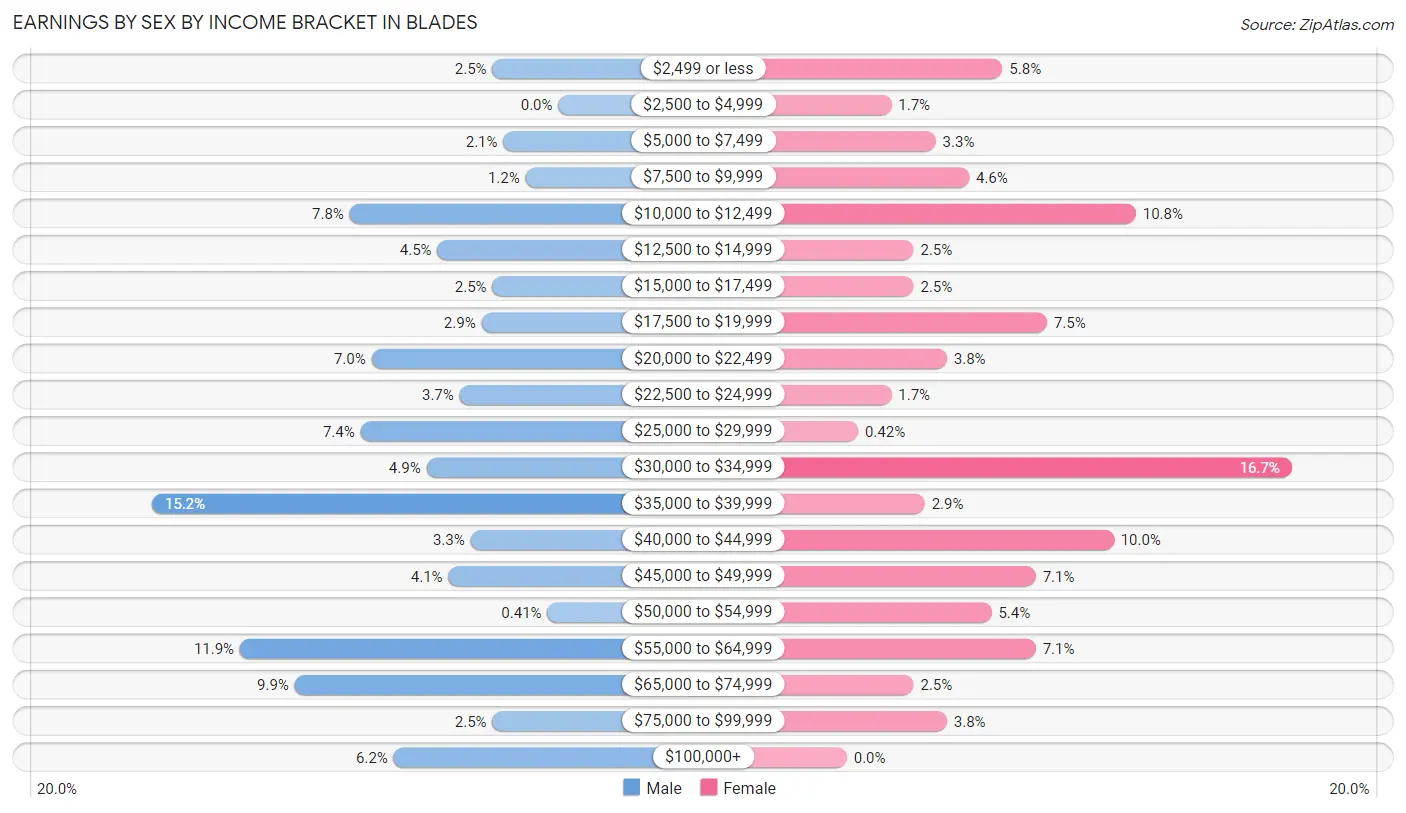
Earnings by Sex by Income Bracket in Blades
The most common earnings brackets in Blades are $35,000 to $39,999 for men (37 | 15.2%) and $30,000 to $34,999 for women (40 | 16.7%).
| Income | Male | Female |
| $2,499 or less | 6 (2.5%) | 14 (5.8%) |
| $2,500 to $4,999 | 0 (0.0%) | 4 (1.7%) |
| $5,000 to $7,499 | 5 (2.1%) | 8 (3.3%) |
| $7,500 to $9,999 | 3 (1.2%) | 11 (4.6%) |
| $10,000 to $12,499 | 19 (7.8%) | 26 (10.8%) |
| $12,500 to $14,999 | 11 (4.5%) | 6 (2.5%) |
| $15,000 to $17,499 | 6 (2.5%) | 6 (2.5%) |
| $17,500 to $19,999 | 7 (2.9%) | 18 (7.5%) |
| $20,000 to $22,499 | 17 (7.0%) | 9 (3.7%) |
| $22,500 to $24,999 | 9 (3.7%) | 4 (1.7%) |
| $25,000 to $29,999 | 18 (7.4%) | 1 (0.4%) |
| $30,000 to $34,999 | 12 (4.9%) | 40 (16.7%) |
| $35,000 to $39,999 | 37 (15.2%) | 7 (2.9%) |
| $40,000 to $44,999 | 8 (3.3%) | 24 (10.0%) |
| $45,000 to $49,999 | 10 (4.1%) | 17 (7.1%) |
| $50,000 to $54,999 | 1 (0.4%) | 13 (5.4%) |
| $55,000 to $64,999 | 29 (11.9%) | 17 (7.1%) |
| $65,000 to $74,999 | 24 (9.9%) | 6 (2.5%) |
| $75,000 to $99,999 | 6 (2.5%) | 9 (3.7%) |
| $100,000+ | 15 (6.2%) | 0 (0.0%) |
| Total | 243 (100.0%) | 240 (100.0%) |
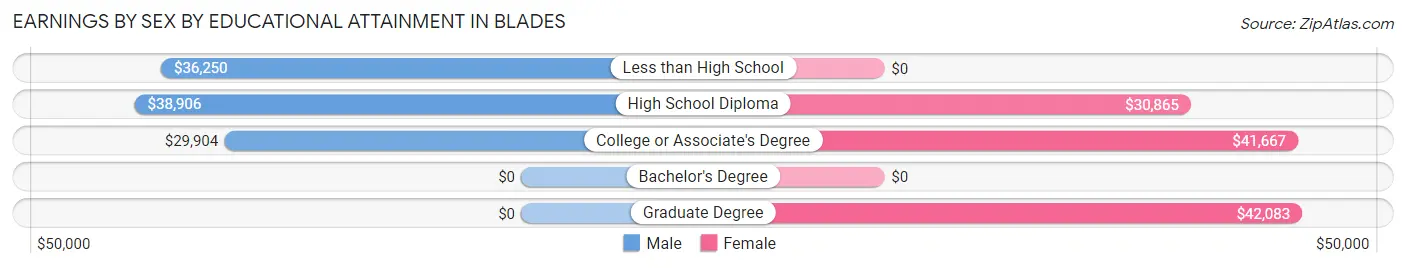
Earnings by Sex by Educational Attainment in Blades
Average earnings in Blades are $38,672 for men and $31,992 for women, a difference of 17.3%. Men with an educational attainment of high school diploma enjoy the highest average annual earnings of $38,906, while those with college or associate's degree education earn the least with $29,904. Women with an educational attainment of graduate degree earn the most with the average annual earnings of $42,083, while those with high school diploma education have the smallest earnings of $30,865.
| Educational Attainment | Male Income | Female Income |
| Less than High School | $36,250 | $0 |
| High School Diploma | $38,906 | $30,865 |
| College or Associate's Degree | $29,904 | $41,667 |
| Bachelor's Degree | - | - |
| Graduate Degree | - | - |
| Total | $38,672 | $31,992 |
Family Income in Blades
Family Income Brackets in Blades
According to the Blades family income data, there are 86 families falling into the $50,000 to $74,999 income range, which is the most common income bracket and makes up 31.0% of all families.
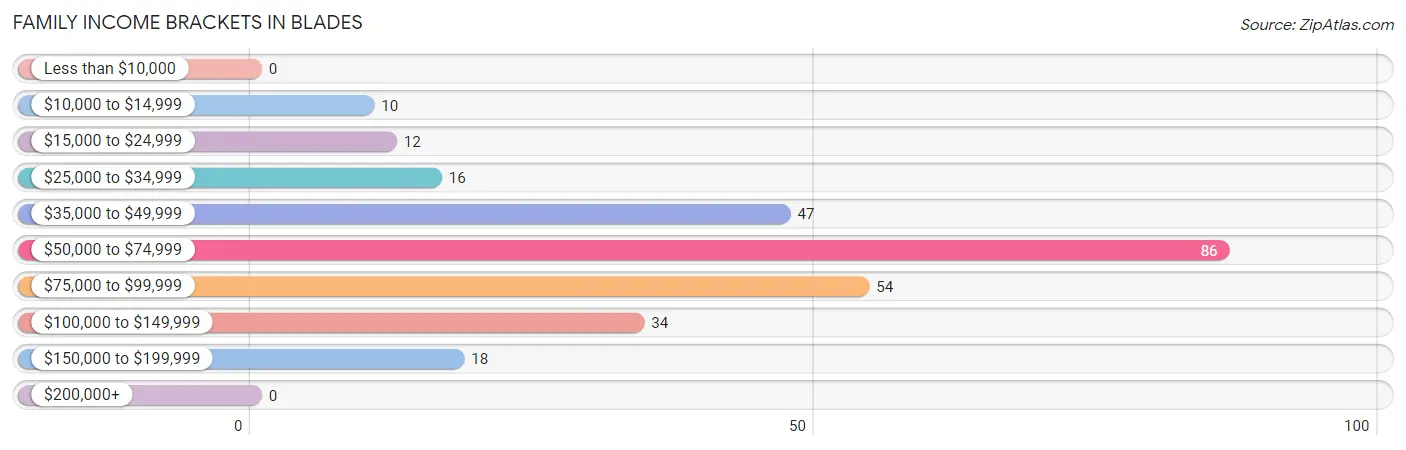
| Income Bracket | # Families | % Families |
| Less than $10,000 | 0 | 0.0% |
| $10,000 to $14,999 | 10 | 3.6% |
| $15,000 to $24,999 | 12 | 4.3% |
| $25,000 to $34,999 | 16 | 5.8% |
| $35,000 to $49,999 | 47 | 17.0% |
| $50,000 to $74,999 | 86 | 31.0% |
| $75,000 to $99,999 | 54 | 19.5% |
| $100,000 to $149,999 | 34 | 12.3% |
| $150,000 to $199,999 | 18 | 6.5% |
| $200,000+ | 0 | 0.0% |
Family Income by Famaliy Size in Blades
4-person families (39 | 14.1%) account for the highest median family income in Blades with $92,083 per family, while 2-person families (160 | 57.8%) have the highest median income of $29,166 per family member.
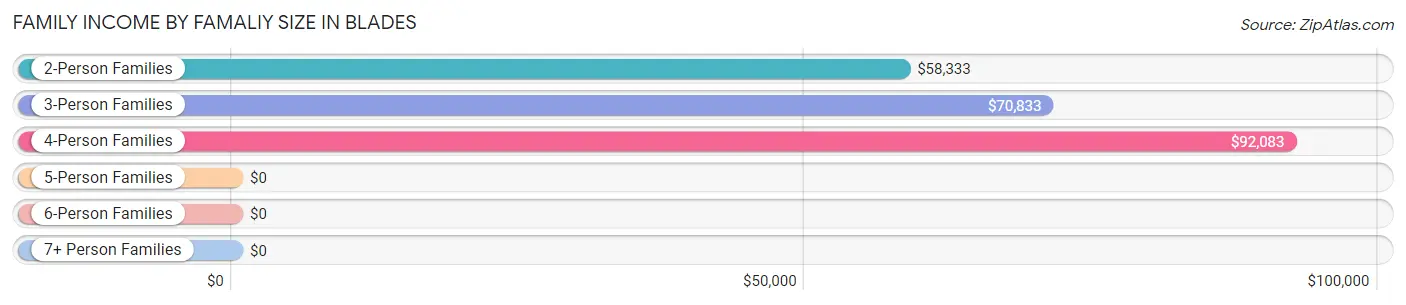
| Income Bracket | # Families | Median Income |
| 2-Person Families | 160 (57.8%) | $58,333 |
| 3-Person Families | 64 (23.1%) | $70,833 |
| 4-Person Families | 39 (14.1%) | $92,083 |
| 5-Person Families | 6 (2.2%) | $0 |
| 6-Person Families | 4 (1.4%) | $0 |
| 7+ Person Families | 4 (1.4%) | $0 |
| Total | 277 (100.0%) | $70,265 |
Family Income by Number of Earners in Blades
The median family income in Blades is $70,265, with families comprising 3+ earners (25) having the highest median family income of $116,042, while families with no earners (44) have the lowest median family income of $51,250, accounting for 9.0% and 15.9% of families, respectively.
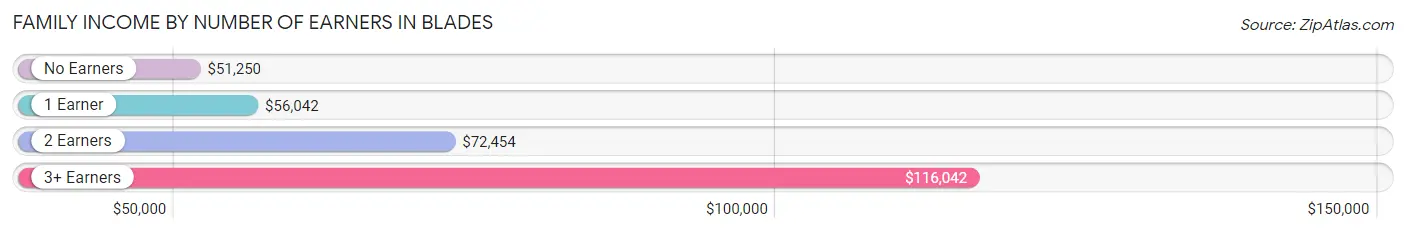
| Number of Earners | # Families | Median Income |
| No Earners | 44 (15.9%) | $51,250 |
| 1 Earner | 105 (37.9%) | $56,042 |
| 2 Earners | 103 (37.2%) | $72,454 |
| 3+ Earners | 25 (9.0%) | $116,042 |
| Total | 277 (100.0%) | $70,265 |
Household Income in Blades
Household Income Brackets in Blades
With 105 households falling in the category, the $50,000 to $74,999 income range is the most frequent in Blades, accounting for 28.8% of all households.
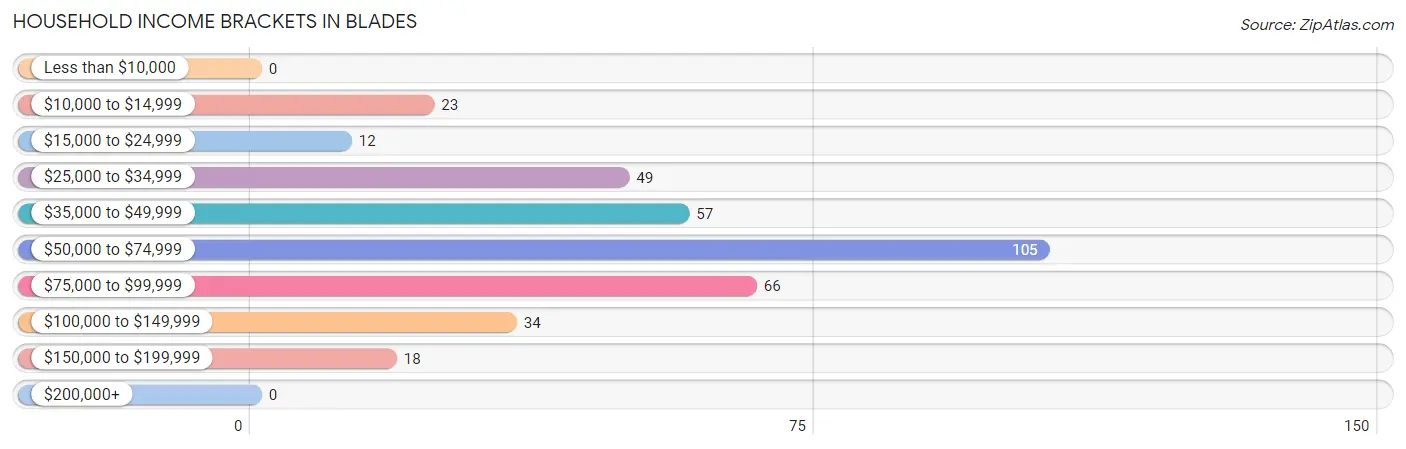
| Income Bracket | # Households | % Households |
| Less than $10,000 | 0 | 0.0% |
| $10,000 to $14,999 | 23 | 6.3% |
| $15,000 to $24,999 | 12 | 3.3% |
| $25,000 to $34,999 | 49 | 13.5% |
| $35,000 to $49,999 | 57 | 15.7% |
| $50,000 to $74,999 | 105 | 28.8% |
| $75,000 to $99,999 | 66 | 18.1% |
| $100,000 to $149,999 | 34 | 9.3% |
| $150,000 to $199,999 | 18 | 4.9% |
| $200,000+ | 0 | 0.0% |
Household Income by Householder Age in Blades
The median household income in Blades is $61,625, with the highest median household income of $71,705 found in the 25 to 44 years age bracket for the primary householder. A total of 79 households (21.7%) fall into this category. Meanwhile, the 15 to 24 years age bracket for the primary householder has the lowest median household income of $0, with 4 households (1.1%) in this group.
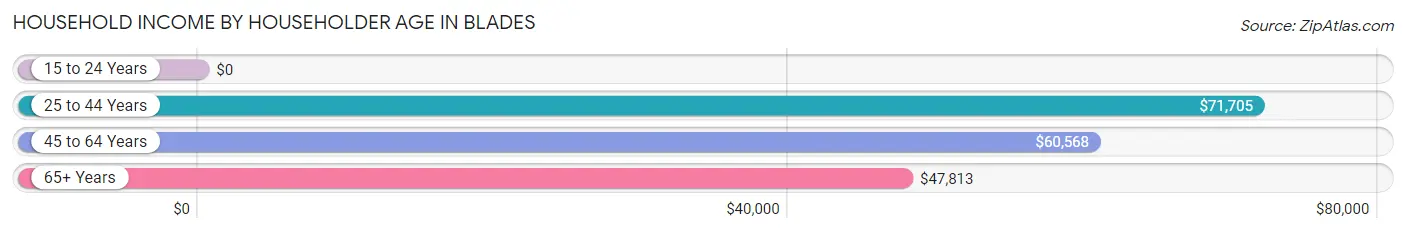
| Income Bracket | # Households | Median Income |
| 15 to 24 Years | 4 (1.1%) | $0 |
| 25 to 44 Years | 79 (21.7%) | $71,705 |
| 45 to 64 Years | 153 (42.0%) | $60,568 |
| 65+ Years | 128 (35.2%) | $47,813 |
| Total | 364 (100.0%) | $61,625 |
Poverty in Blades
Income Below Poverty by Sex and Age in Blades
With 11.8% poverty level for males and 13.9% for females among the residents of Blades, 18 to 24 year old males and 15 year old females are the most vulnerable to poverty, with 15 males (53.6%) and 6 females (100.0%) in their respective age groups living below the poverty level.
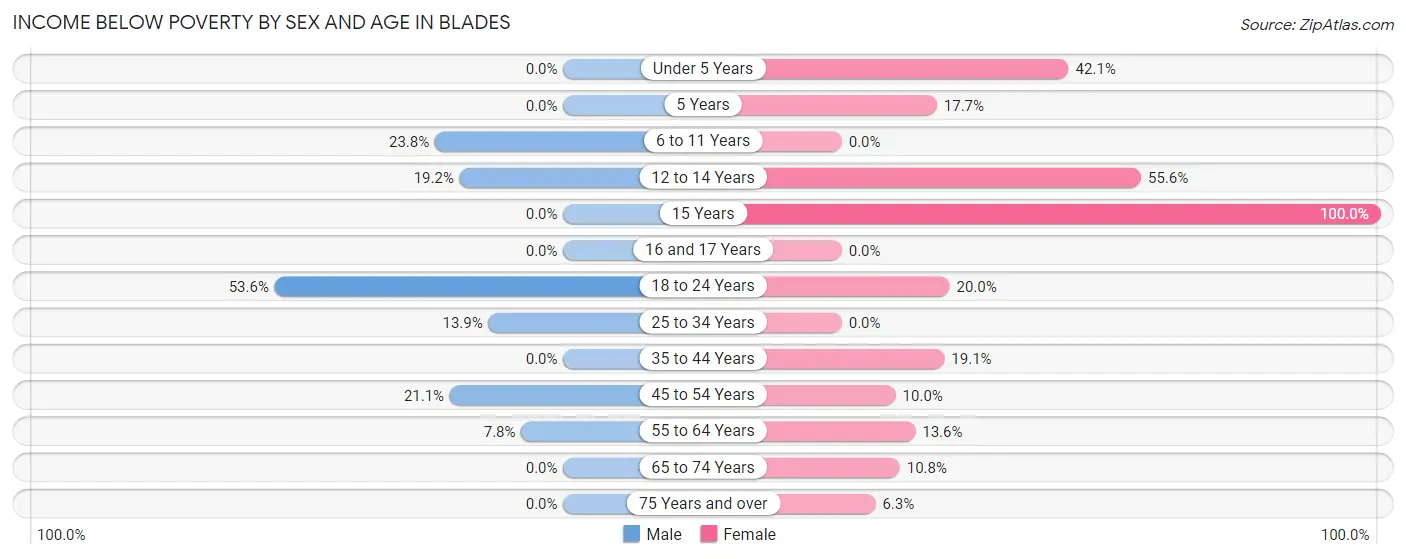
| Age Bracket | Male | Female |
| Under 5 Years | 0 (0.0%) | 8 (42.1%) |
| 5 Years | 0 (0.0%) | 6 (17.6%) |
| 6 to 11 Years | 5 (23.8%) | 0 (0.0%) |
| 12 to 14 Years | 5 (19.2%) | 5 (55.6%) |
| 15 Years | 0 (0.0%) | 6 (100.0%) |
| 16 and 17 Years | 0 (0.0%) | 0 (0.0%) |
| 18 to 24 Years | 15 (53.6%) | 14 (20.0%) |
| 25 to 34 Years | 10 (13.9%) | 0 (0.0%) |
| 35 to 44 Years | 0 (0.0%) | 8 (19.1%) |
| 45 to 54 Years | 12 (21.0%) | 8 (10.0%) |
| 55 to 64 Years | 6 (7.8%) | 6 (13.6%) |
| 65 to 74 Years | 0 (0.0%) | 7 (10.8%) |
| 75 Years and over | 0 (0.0%) | 3 (6.2%) |
| Total | 53 (11.8%) | 71 (13.9%) |
Income Above Poverty by Sex and Age in Blades
According to the poverty statistics in Blades, males aged under 5 years and females aged 6 to 11 years are the age groups that are most secure financially, with 100.0% of males and 100.0% of females in these age groups living above the poverty line.
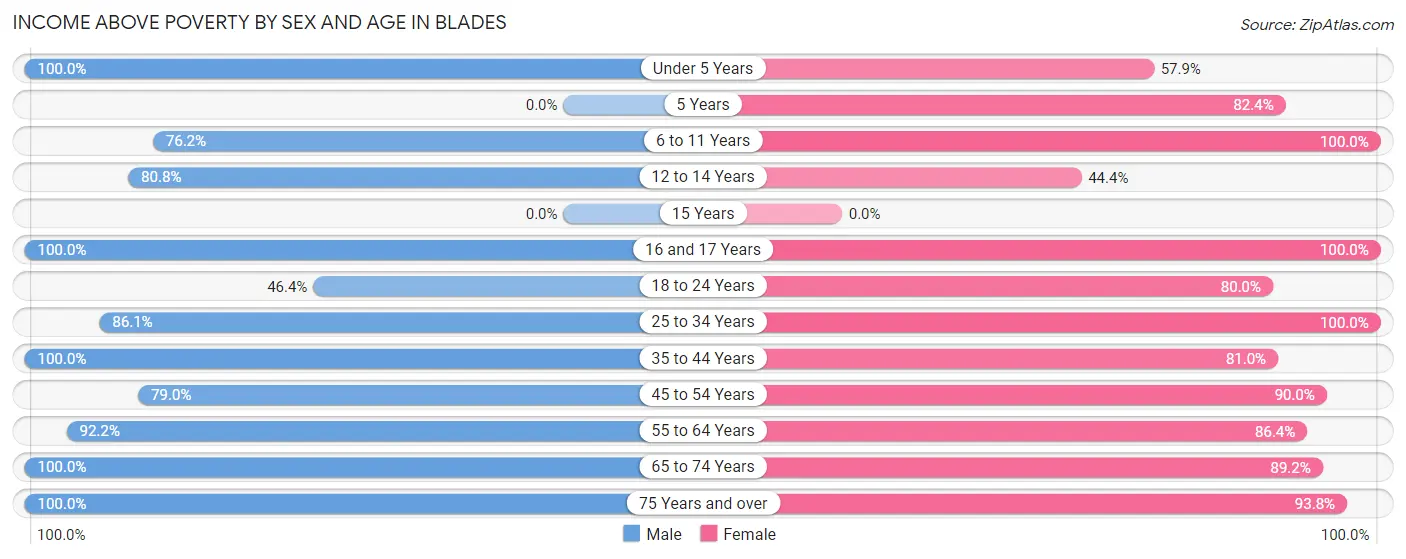
| Age Bracket | Male | Female |
| Under 5 Years | 8 (100.0%) | 11 (57.9%) |
| 5 Years | 0 (0.0%) | 28 (82.4%) |
| 6 to 11 Years | 16 (76.2%) | 25 (100.0%) |
| 12 to 14 Years | 21 (80.8%) | 4 (44.4%) |
| 15 Years | 0 (0.0%) | 0 (0.0%) |
| 16 and 17 Years | 4 (100.0%) | 3 (100.0%) |
| 18 to 24 Years | 13 (46.4%) | 56 (80.0%) |
| 25 to 34 Years | 62 (86.1%) | 65 (100.0%) |
| 35 to 44 Years | 76 (100.0%) | 34 (80.9%) |
| 45 to 54 Years | 45 (78.9%) | 72 (90.0%) |
| 55 to 64 Years | 71 (92.2%) | 38 (86.4%) |
| 65 to 74 Years | 57 (100.0%) | 58 (89.2%) |
| 75 Years and over | 24 (100.0%) | 45 (93.8%) |
| Total | 397 (88.2%) | 439 (86.1%) |
Income Below Poverty Among Married-Couple Families in Blades
The poverty statistics for married-couple families in Blades show that 5.5% or 10 of the total 183 families live below the poverty line. Families with 5 or more children have the highest poverty rate of 100.0%, comprising of 4 families. On the other hand, families with 1 or 2 children have the lowest poverty rate of 0.0%, which includes 0 families.
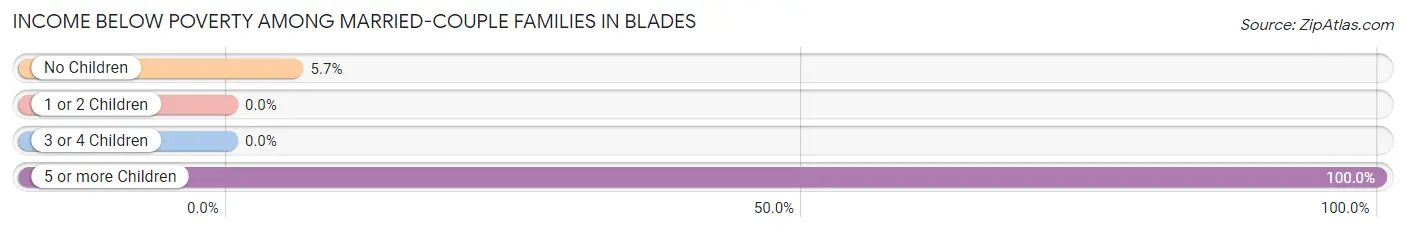
| Children | Above Poverty | Below Poverty |
| No Children | 99 (94.3%) | 6 (5.7%) |
| 1 or 2 Children | 70 (100.0%) | 0 (0.0%) |
| 3 or 4 Children | 4 (100.0%) | 0 (0.0%) |
| 5 or more Children | 0 (0.0%) | 4 (100.0%) |
| Total | 173 (94.5%) | 10 (5.5%) |
Income Below Poverty Among Single-Parent Households in Blades
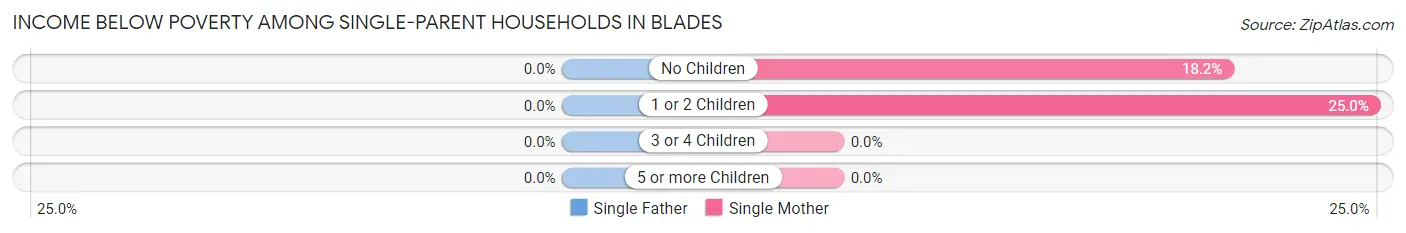
| Children | Single Father | Single Mother |
| No Children | 0 (0.0%) | 8 (18.2%) |
| 1 or 2 Children | 0 (0.0%) | 4 (25.0%) |
| 3 or 4 Children | 0 (0.0%) | 0 (0.0%) |
| 5 or more Children | 0 (0.0%) | 0 (0.0%) |
| Total | 0 (0.0%) | 12 (20.0%) |
Income Below Poverty Among Married-Couple vs Single-Parent Households in Blades
The poverty data for Blades shows that 10 of the married-couple family households (5.5%) and 12 of the single-parent households (12.8%) are living below the poverty level. Within the married-couple family households, those with 5 or more children have the highest poverty rate, with 4 households (100.0%) falling below the poverty line. Among the single-parent households, those with 1 or 2 children have the highest poverty rate, with 4 household (20.0%) living below poverty.
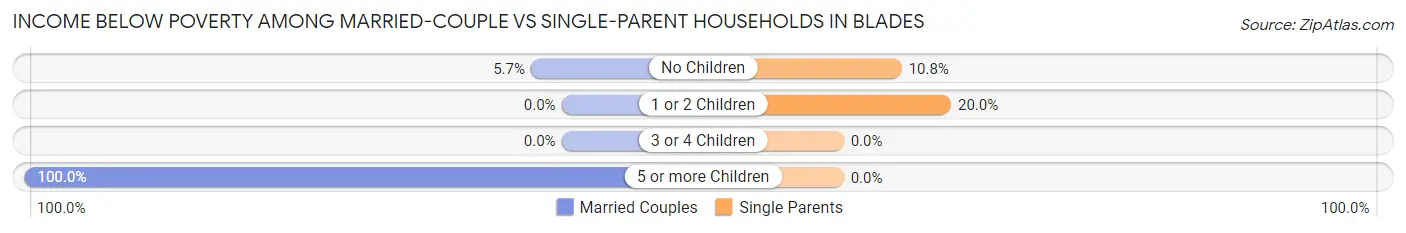
| Children | Married-Couple Families | Single-Parent Households |
| No Children | 6 (5.7%) | 8 (10.8%) |
| 1 or 2 Children | 0 (0.0%) | 4 (20.0%) |
| 3 or 4 Children | 0 (0.0%) | 0 (0.0%) |
| 5 or more Children | 4 (100.0%) | 0 (0.0%) |
| Total | 10 (5.5%) | 12 (12.8%) |
Race in Blades
The most populous races in Blades are White / Caucasian (724 | 75.4%), Black / African American (134 | 14.0%), and Hispanic or Latino (83 | 8.6%).
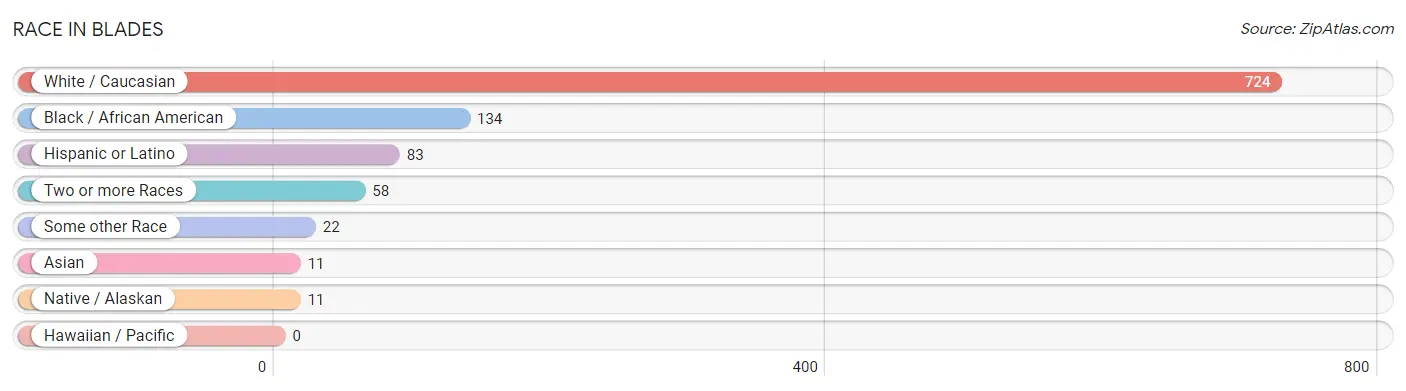
| Race | # Population | % Population |
| Asian | 11 | 1.1% |
| Black / African American | 134 | 14.0% |
| Hawaiian / Pacific | 0 | 0.0% |
| Hispanic or Latino | 83 | 8.6% |
| Native / Alaskan | 11 | 1.1% |
| White / Caucasian | 724 | 75.4% |
| Two or more Races | 58 | 6.0% |
| Some other Race | 22 | 2.3% |
| Total | 960 | 100.0% |
Ancestry in Blades
The most populous ancestries reported in Blades are Irish (176 | 18.3%), German (142 | 14.8%), American (118 | 12.3%), English (77 | 8.0%), and Haitian (55 | 5.7%), together accounting for 59.2% of all Blades residents.
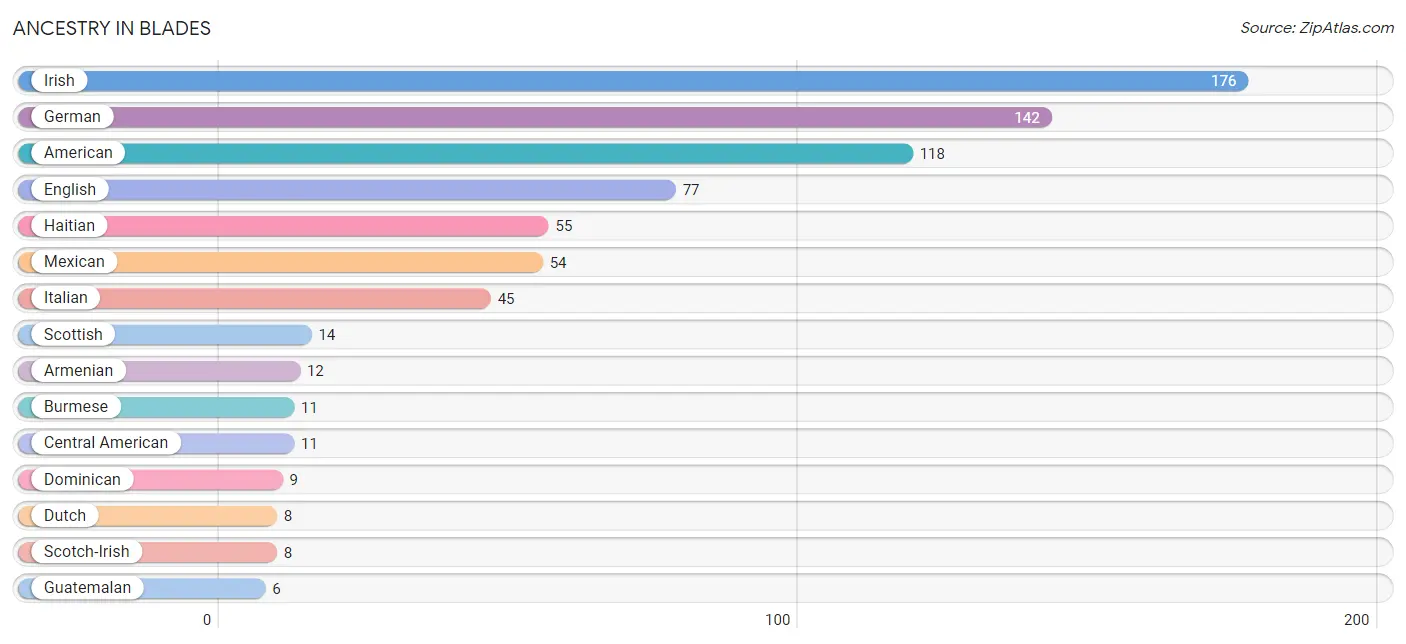
| Ancestry | # Population | % Population |
| American | 118 | 12.3% |
| Armenian | 12 | 1.3% |
| Burmese | 11 | 1.1% |
| Central American | 11 | 1.1% |
| Dominican | 9 | 0.9% |
| Dutch | 8 | 0.8% |
| English | 77 | 8.0% |
| German | 142 | 14.8% |
| Guatemalan | 6 | 0.6% |
| Haitian | 55 | 5.7% |
| Irish | 176 | 18.3% |
| Italian | 45 | 4.7% |
| Mexican | 54 | 5.6% |
| Nicaraguan | 5 | 0.5% |
| Polish | 3 | 0.3% |
| Puerto Rican | 5 | 0.5% |
| Scandinavian | 6 | 0.6% |
| Scotch-Irish | 8 | 0.8% |
| Scottish | 14 | 1.5% |
| Slovak | 4 | 0.4% |
| Swiss | 2 | 0.2% |
| Ukrainian | 3 | 0.3% |
| West Indian | 2 | 0.2% | View All 23 Rows |
Immigrants in Blades
The most numerous immigrant groups reported in Blades came from Latin America (92 | 9.6%), Caribbean (57 | 5.9%), Haiti (48 | 5.0%), Central America (33 | 3.4%), and Mexico (25 | 2.6%), together accounting for 26.6% of all Blades residents.
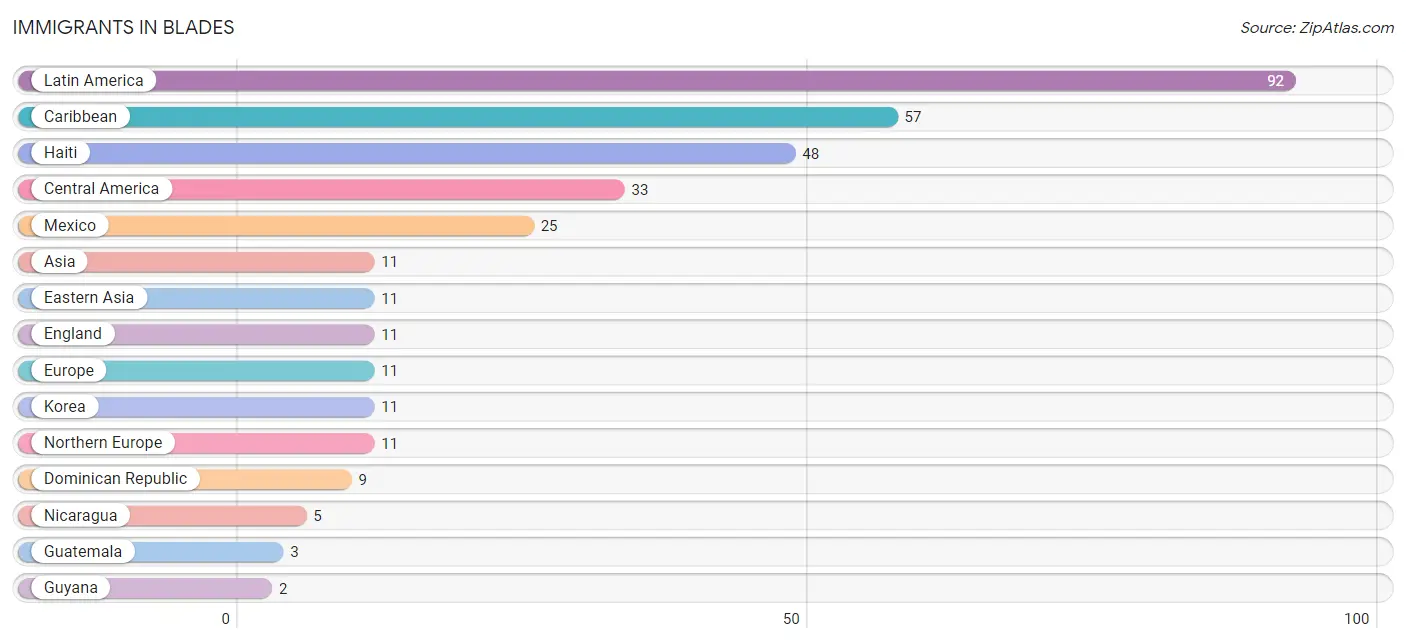
| Immigration Origin | # Population | % Population |
| Asia | 11 | 1.1% |
| Caribbean | 57 | 5.9% |
| Central America | 33 | 3.4% |
| Dominican Republic | 9 | 0.9% |
| Eastern Asia | 11 | 1.1% |
| England | 11 | 1.1% |
| Europe | 11 | 1.1% |
| Guatemala | 3 | 0.3% |
| Guyana | 2 | 0.2% |
| Haiti | 48 | 5.0% |
| Korea | 11 | 1.1% |
| Latin America | 92 | 9.6% |
| Mexico | 25 | 2.6% |
| Nicaragua | 5 | 0.5% |
| Northern Europe | 11 | 1.1% |
| South America | 2 | 0.2% | View All 16 Rows |
Sex and Age in Blades
Sex and Age in Blades
The most populous age groups in Blades are 40 to 44 Years (71 | 15.8%) for men and 20 to 24 Years (70 | 13.7%) for women.
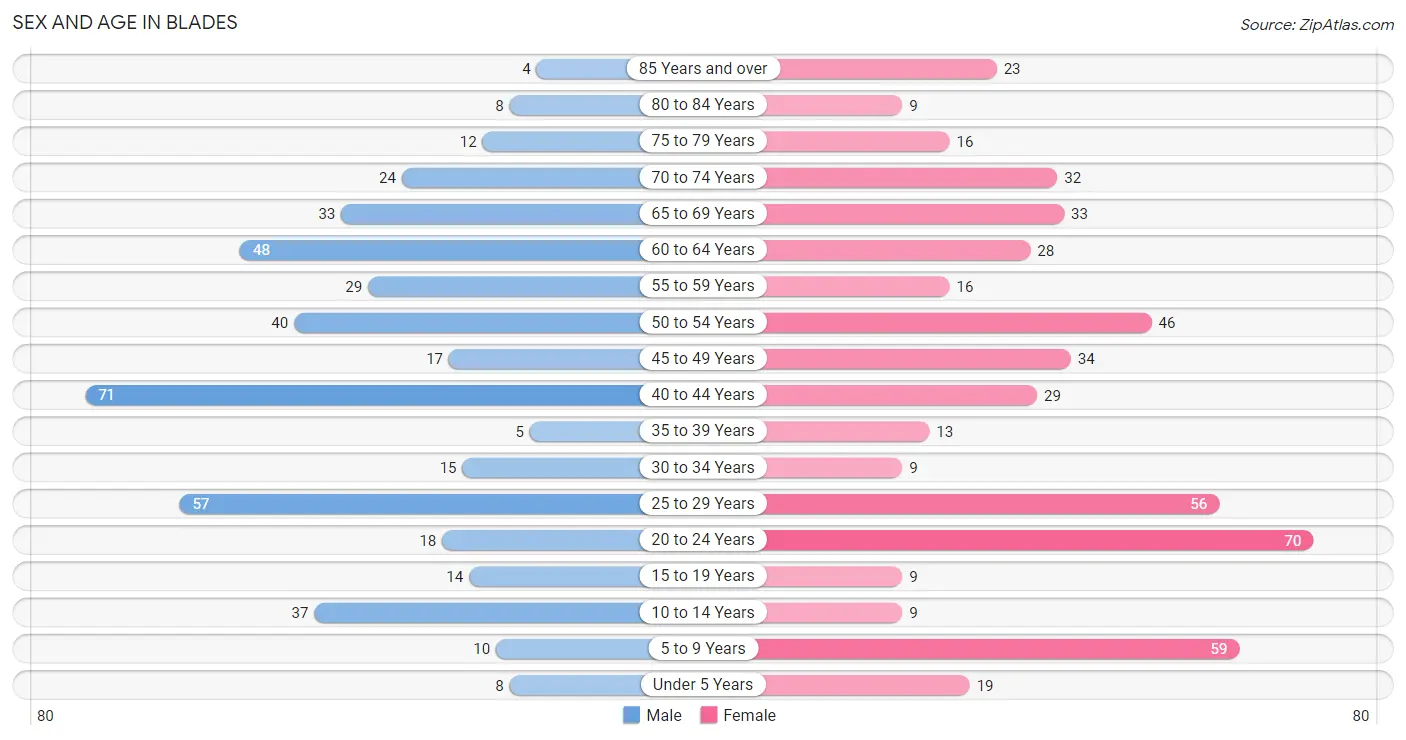
| Age Bracket | Male | Female |
| Under 5 Years | 8 (1.8%) | 19 (3.7%) |
| 5 to 9 Years | 10 (2.2%) | 59 (11.6%) |
| 10 to 14 Years | 37 (8.2%) | 9 (1.8%) |
| 15 to 19 Years | 14 (3.1%) | 9 (1.8%) |
| 20 to 24 Years | 18 (4.0%) | 70 (13.7%) |
| 25 to 29 Years | 57 (12.7%) | 56 (11.0%) |
| 30 to 34 Years | 15 (3.3%) | 9 (1.8%) |
| 35 to 39 Years | 5 (1.1%) | 13 (2.5%) |
| 40 to 44 Years | 71 (15.8%) | 29 (5.7%) |
| 45 to 49 Years | 17 (3.8%) | 34 (6.7%) |
| 50 to 54 Years | 40 (8.9%) | 46 (9.0%) |
| 55 to 59 Years | 29 (6.4%) | 16 (3.1%) |
| 60 to 64 Years | 48 (10.7%) | 28 (5.5%) |
| 65 to 69 Years | 33 (7.3%) | 33 (6.5%) |
| 70 to 74 Years | 24 (5.3%) | 32 (6.3%) |
| 75 to 79 Years | 12 (2.7%) | 16 (3.1%) |
| 80 to 84 Years | 8 (1.8%) | 9 (1.8%) |
| 85 Years and over | 4 (0.9%) | 23 (4.5%) |
| Total | 450 (100.0%) | 510 (100.0%) |
Families and Households in Blades
Median Family Size in Blades
The median family size in Blades is 2.99 persons per family, with married-couple families (183 | 66.1%) accounting for the largest median family size of 3.24 persons per family. On the other hand, single male/father families (34 | 12.3%) represent the smallest median family size with 2.21 persons per family.
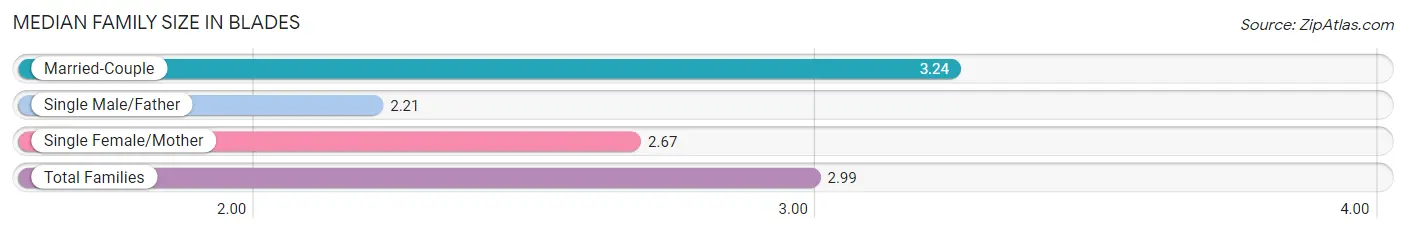
| Family Type | # Families | Family Size |
| Married-Couple | 183 (66.1%) | 3.24 |
| Single Male/Father | 34 (12.3%) | 2.21 |
| Single Female/Mother | 60 (21.7%) | 2.67 |
| Total Families | 277 (100.0%) | 2.99 |
Median Household Size in Blades
The median household size in Blades is 2.64 persons per household, with married-couple households (183 | 50.3%) accounting for the largest median household size of 3.28 persons per household. non-family households (87 | 23.9%) represent the smallest median household size with 1.17 persons per household.
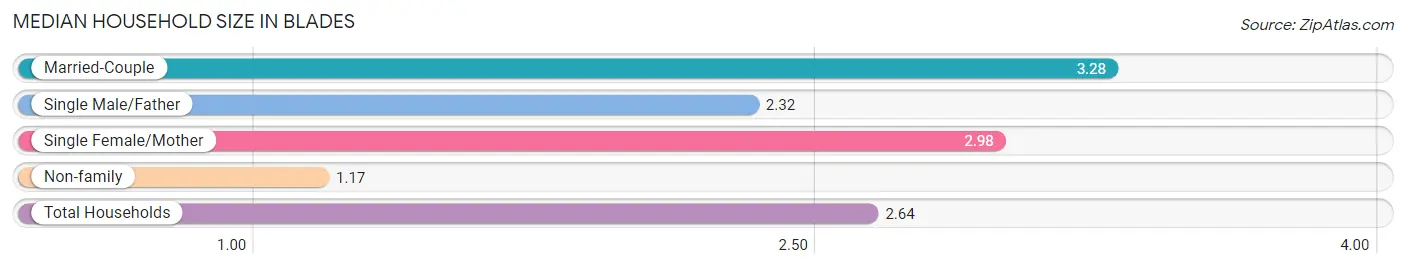
| Household Type | # Households | Household Size |
| Married-Couple | 183 (50.3%) | 3.28 |
| Single Male/Father | 34 (9.3%) | 2.32 |
| Single Female/Mother | 60 (16.5%) | 2.98 |
| Non-family | 87 (23.9%) | 1.17 |
| Total Households | 364 (100.0%) | 2.64 |
Household Size by Marriage Status in Blades
Out of a total of 364 households in Blades, 277 (76.1%) are family households, while 87 (23.9%) are nonfamily households. The most numerous type of family households are 2-person households, comprising 148, and the most common type of nonfamily households are 1-person households, comprising 72.
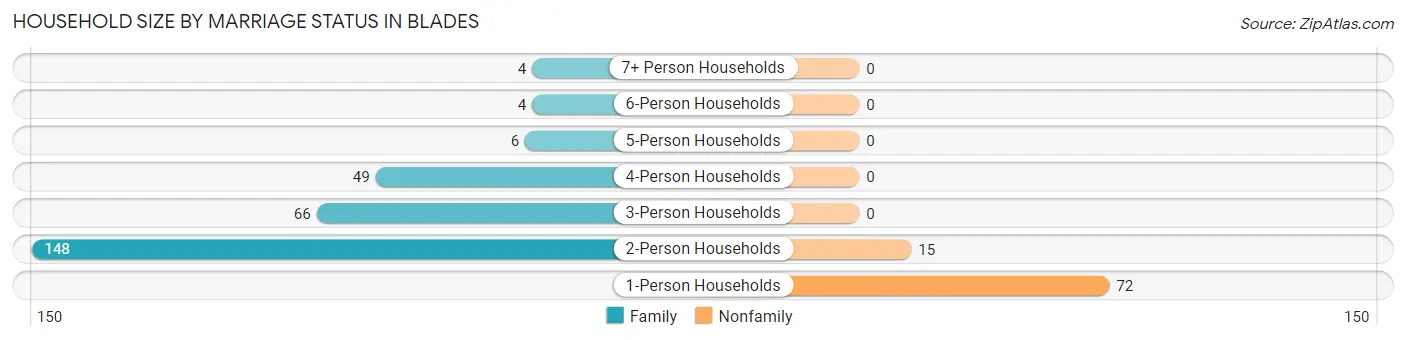
| Household Size | Family Households | Nonfamily Households |
| 1-Person Households | - | 72 (19.8%) |
| 2-Person Households | 148 (40.7%) | 15 (4.1%) |
| 3-Person Households | 66 (18.1%) | 0 (0.0%) |
| 4-Person Households | 49 (13.5%) | 0 (0.0%) |
| 5-Person Households | 6 (1.7%) | 0 (0.0%) |
| 6-Person Households | 4 (1.1%) | 0 (0.0%) |
| 7+ Person Households | 4 (1.1%) | 0 (0.0%) |
| Total | 277 (76.1%) | 87 (23.9%) |
Female Fertility in Blades
Fertility by Age in Blades
| Age Bracket | Women with Births | Births / 1,000 Women |
| 15 to 19 years | 0 (0.0%) | 0.0 |
| 20 to 34 years | 0 (0.0%) | 0.0 |
| 35 to 50 years | 0 (0.0%) | 0.0 |
| Total | 0 (0.0%) | 0.0 |
Fertility by Age by Marriage Status in Blades
| Age Bracket | Married | Unmarried |
| 15 to 19 years | 0 (0.0%) | 0 (0.0%) |
| 20 to 34 years | 0 (0.0%) | 0 (0.0%) |
| 35 to 50 years | 0 (0.0%) | 0 (0.0%) |
| Total | 0 (0.0%) | 0 (0.0%) |
Fertility by Education in Blades
| Educational Attainment | Women with Births | Births / 1,000 Women |
| Less than High School | 0 (0.0%) | 0.0 |
| High School Diploma | 0 (0.0%) | 0.0 |
| College or Associate's Degree | 0 (0.0%) | 0.0 |
| Bachelor's Degree | 0 (0.0%) | 0.0 |
| Graduate Degree | 0 (0.0%) | 0.0 |
| Total | 0 (0.0%) | 0.0 |
Fertility by Education by Marriage Status in Blades
| Educational Attainment | Married | Unmarried |
| Less than High School | 0 (0.0%) | 0 (0.0%) |
| High School Diploma | 0 (0.0%) | 0 (0.0%) |
| College or Associate's Degree | 0 (0.0%) | 0 (0.0%) |
| Bachelor's Degree | 0 (0.0%) | 0 (0.0%) |
| Graduate Degree | 0 (0.0%) | 0 (0.0%) |
| Total | 0 (0.0%) | 0 (0.0%) |
Employment Characteristics in Blades
Employment by Class of Employer in Blades
Among the 456 employed individuals in Blades, private company employees (359 | 78.7%), state government employees (34 | 7.5%), and self-employed (not incorporated) (22 | 4.8%) make up the most common classes of employment.
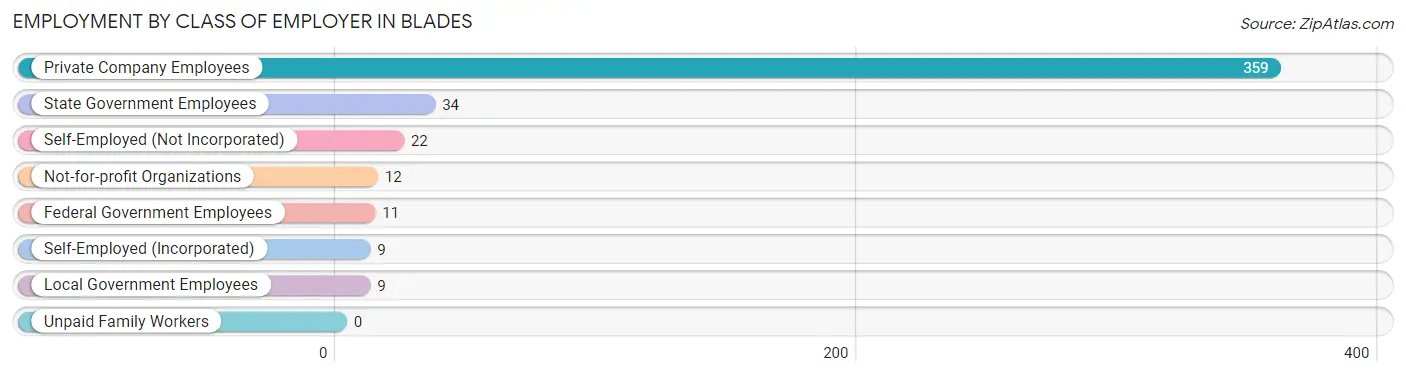
| Employer Class | # Employees | % Employees |
| Private Company Employees | 359 | 78.7% |
| Self-Employed (Incorporated) | 9 | 2.0% |
| Self-Employed (Not Incorporated) | 22 | 4.8% |
| Not-for-profit Organizations | 12 | 2.6% |
| Local Government Employees | 9 | 2.0% |
| State Government Employees | 34 | 7.5% |
| Federal Government Employees | 11 | 2.4% |
| Unpaid Family Workers | 0 | 0.0% |
| Total | 456 | 100.0% |
Employment Status by Age in Blades
According to the labor force statistics for Blades, out of the total population over 16 years of age (812), 59.1% or 480 individuals are in the labor force, with 5.0% or 24 of them unemployed. The age group with the highest labor force participation rate is 30 to 34 years, with 95.8% or 23 individuals in the labor force. Within the labor force, the 30 to 34 years age range has the highest percentage of unemployed individuals, with 43.5% or 10 of them being unemployed.
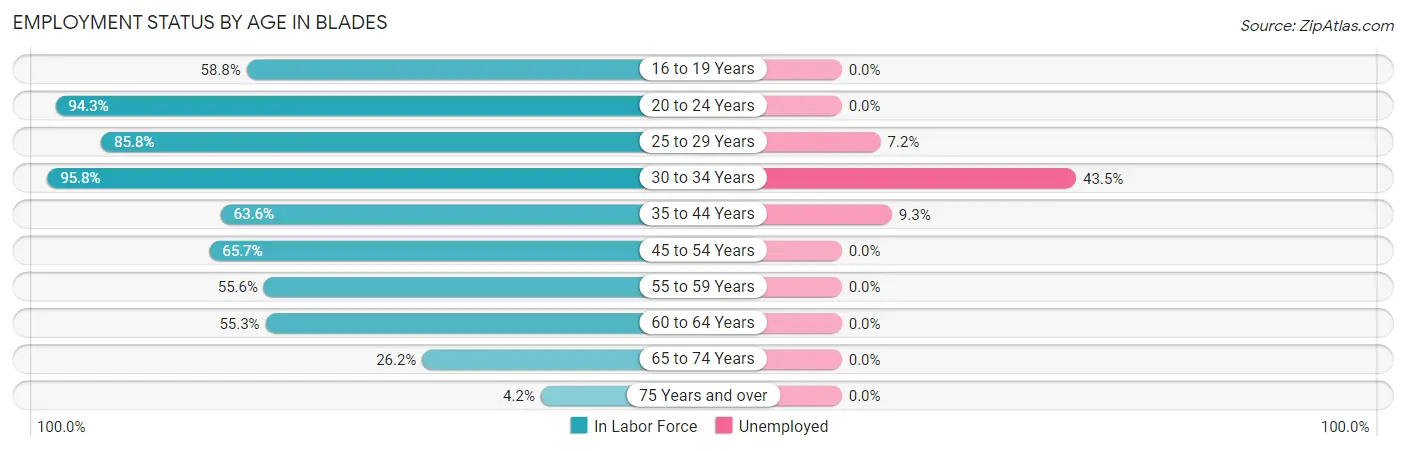
| Age Bracket | In Labor Force | Unemployed |
| 16 to 19 Years | 10 (58.8%) | 0 (0.0%) |
| 20 to 24 Years | 83 (94.3%) | 0 (0.0%) |
| 25 to 29 Years | 97 (85.8%) | 7 (7.2%) |
| 30 to 34 Years | 23 (95.8%) | 10 (43.5%) |
| 35 to 44 Years | 75 (63.6%) | 7 (9.3%) |
| 45 to 54 Years | 90 (65.7%) | 0 (0.0%) |
| 55 to 59 Years | 25 (55.6%) | 0 (0.0%) |
| 60 to 64 Years | 42 (55.3%) | 0 (0.0%) |
| 65 to 74 Years | 32 (26.2%) | 0 (0.0%) |
| 75 Years and over | 3 (4.2%) | 0 (0.0%) |
| Total | 480 (59.1%) | 24 (5.0%) |
Employment Status by Educational Attainment in Blades
According to labor force statistics for Blades, 68.6% of individuals (352) out of the total population between 25 and 64 years of age (513) are in the labor force, with 6.8% or 24 of them being unemployed. The group with the highest labor force participation rate are those with the educational attainment of bachelor's degree or higher, with 100.0% or 36 individuals in the labor force. Within the labor force, individuals with college / associate degree education have the highest percentage of unemployment, with 8.4% or 7 of them being unemployed.
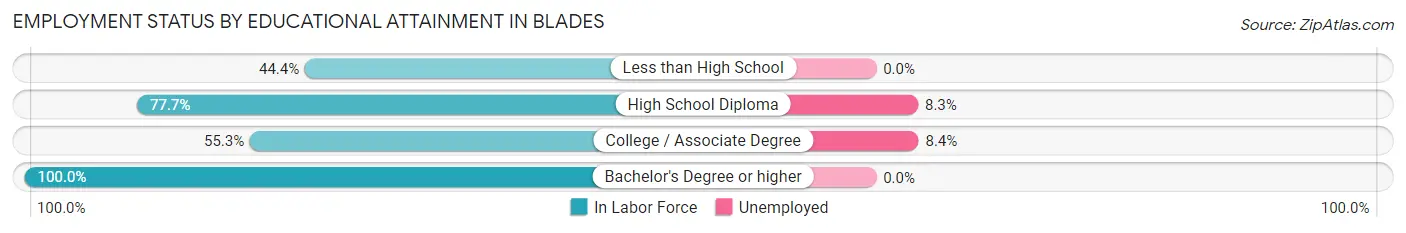
| Educational Attainment | In Labor Force | Unemployed |
| Less than High School | 28 (44.4%) | 0 (0.0%) |
| High School Diploma | 205 (77.7%) | 22 (8.3%) |
| College / Associate Degree | 83 (55.3%) | 13 (8.4%) |
| Bachelor's Degree or higher | 36 (100.0%) | 0 (0.0%) |
| Total | 352 (68.6%) | 35 (6.8%) |
Employment Occupations by Sex in Blades
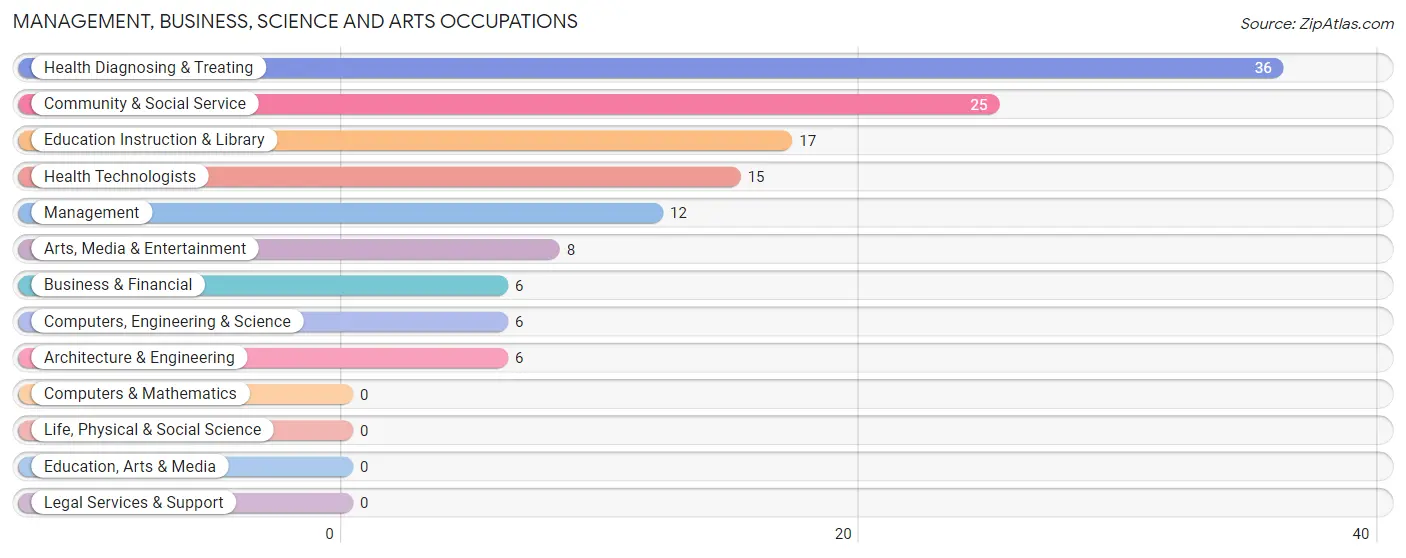
Management, Business, Science and Arts Occupations
The most common Management, Business, Science and Arts occupations in Blades are Health Diagnosing & Treating (36 | 7.9%), Community & Social Service (25 | 5.5%), Education Instruction & Library (17 | 3.7%), Health Technologists (15 | 3.3%), and Management (12 | 2.6%).
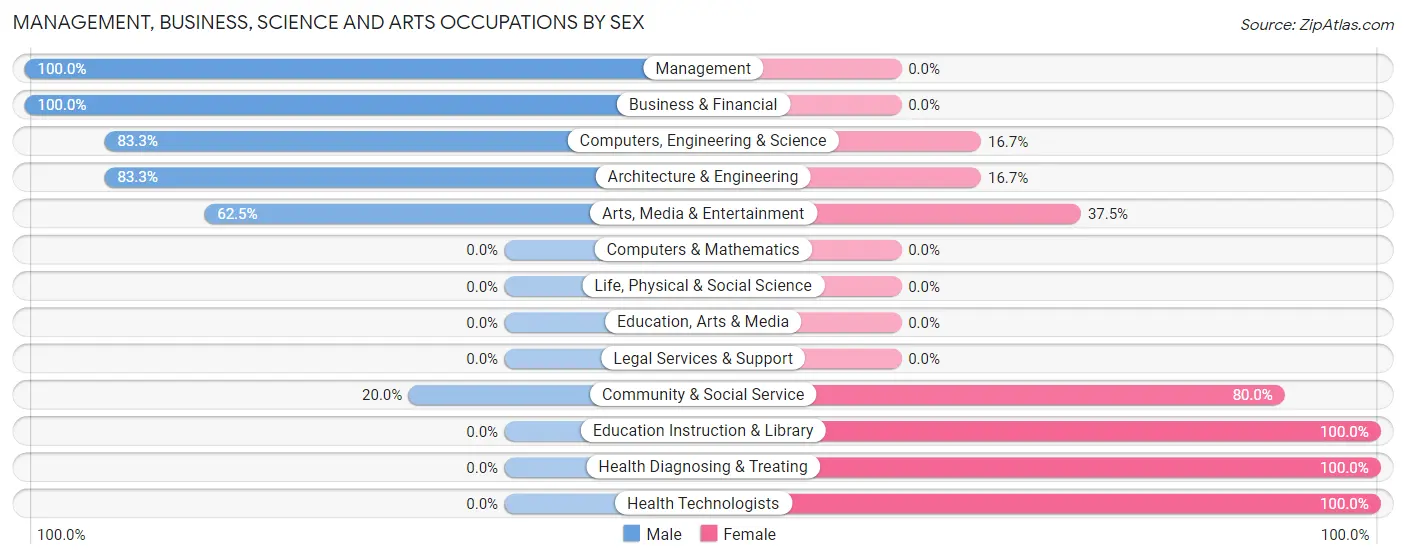
Management, Business, Science and Arts Occupations by Sex
Within the Management, Business, Science and Arts occupations in Blades, the most male-oriented occupations are Management (100.0%), Business & Financial (100.0%), and Computers, Engineering & Science (83.3%), while the most female-oriented occupations are Education Instruction & Library (100.0%), Health Diagnosing & Treating (100.0%), and Health Technologists (100.0%).
| Occupation | Male | Female |
| Management | 12 (100.0%) | 0 (0.0%) |
| Business & Financial | 6 (100.0%) | 0 (0.0%) |
| Computers, Engineering & Science | 5 (83.3%) | 1 (16.7%) |
| Computers & Mathematics | 0 (0.0%) | 0 (0.0%) |
| Architecture & Engineering | 5 (83.3%) | 1 (16.7%) |
| Life, Physical & Social Science | 0 (0.0%) | 0 (0.0%) |
| Community & Social Service | 5 (20.0%) | 20 (80.0%) |
| Education, Arts & Media | 0 (0.0%) | 0 (0.0%) |
| Legal Services & Support | 0 (0.0%) | 0 (0.0%) |
| Education Instruction & Library | 0 (0.0%) | 17 (100.0%) |
| Arts, Media & Entertainment | 5 (62.5%) | 3 (37.5%) |
| Health Diagnosing & Treating | 0 (0.0%) | 36 (100.0%) |
| Health Technologists | 0 (0.0%) | 15 (100.0%) |
| Total (Category) | 28 (32.9%) | 57 (67.1%) |
| Total (Overall) | 228 (50.0%) | 228 (50.0%) |
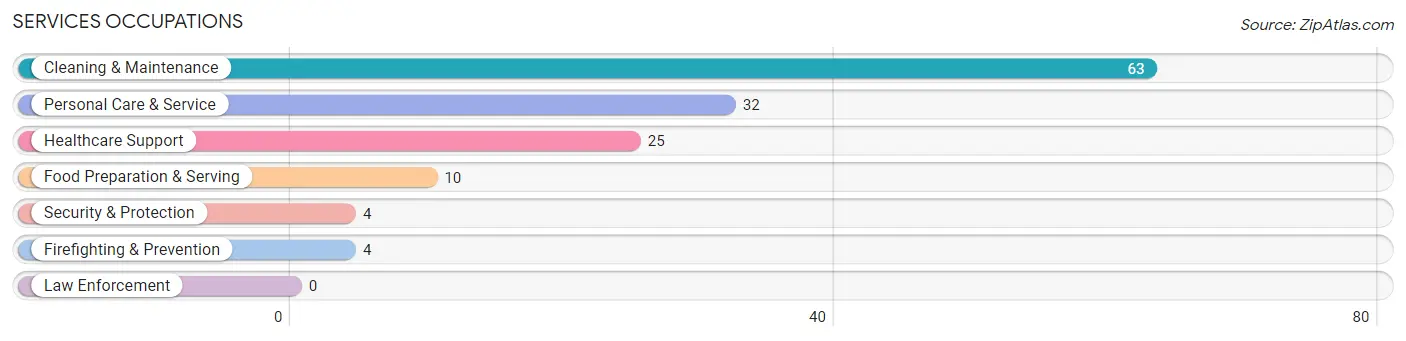
Services Occupations
The most common Services occupations in Blades are Cleaning & Maintenance (63 | 13.8%), Personal Care & Service (32 | 7.0%), Healthcare Support (25 | 5.5%), Food Preparation & Serving (10 | 2.2%), and Security & Protection (4 | 0.9%).
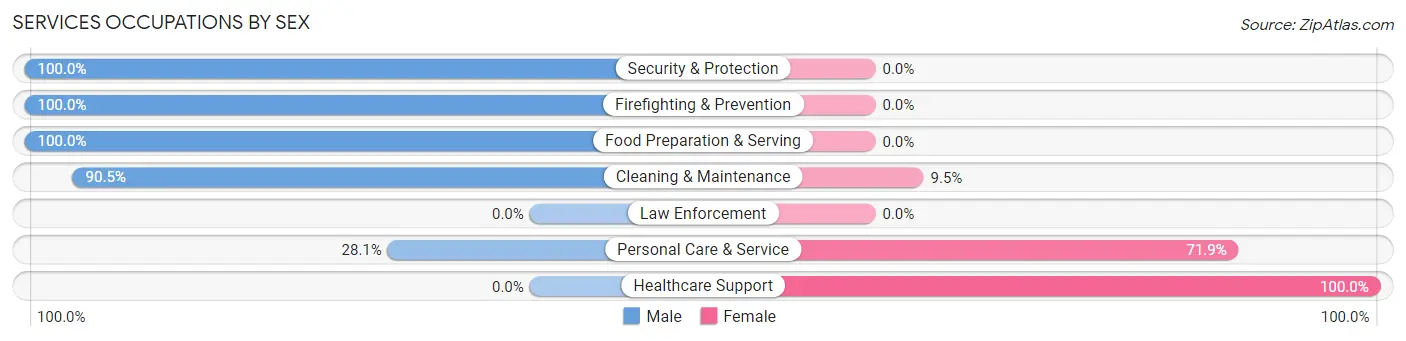
Services Occupations by Sex
Within the Services occupations in Blades, the most male-oriented occupations are Security & Protection (100.0%), Firefighting & Prevention (100.0%), and Food Preparation & Serving (100.0%), while the most female-oriented occupations are Healthcare Support (100.0%), Personal Care & Service (71.9%), and Cleaning & Maintenance (9.5%).
| Occupation | Male | Female |
| Healthcare Support | 0 (0.0%) | 25 (100.0%) |
| Security & Protection | 4 (100.0%) | 0 (0.0%) |
| Firefighting & Prevention | 4 (100.0%) | 0 (0.0%) |
| Law Enforcement | 0 (0.0%) | 0 (0.0%) |
| Food Preparation & Serving | 10 (100.0%) | 0 (0.0%) |
| Cleaning & Maintenance | 57 (90.5%) | 6 (9.5%) |
| Personal Care & Service | 9 (28.1%) | 23 (71.9%) |
| Total (Category) | 80 (59.7%) | 54 (40.3%) |
| Total (Overall) | 228 (50.0%) | 228 (50.0%) |
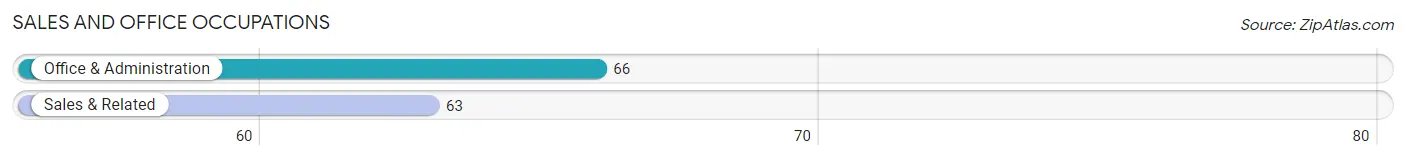
Sales and Office Occupations
The most common Sales and Office occupations in Blades are Office & Administration (66 | 14.5%), and Sales & Related (63 | 13.8%).
Sales and Office Occupations by Sex
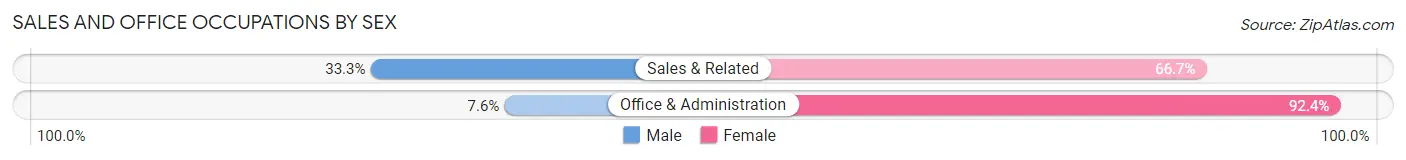
| Occupation | Male | Female |
| Sales & Related | 21 (33.3%) | 42 (66.7%) |
| Office & Administration | 5 (7.6%) | 61 (92.4%) |
| Total (Category) | 26 (20.2%) | 103 (79.8%) |
| Total (Overall) | 228 (50.0%) | 228 (50.0%) |
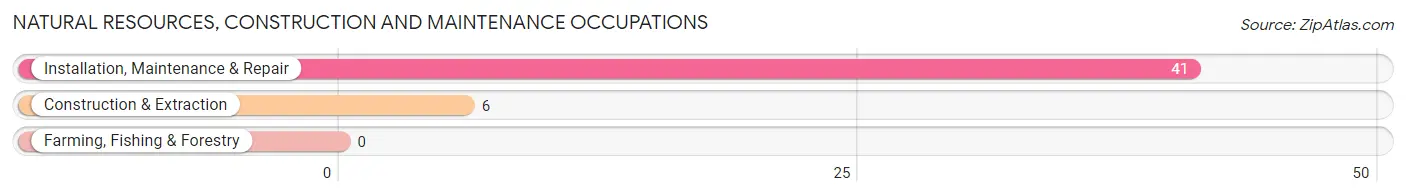
Natural Resources, Construction and Maintenance Occupations
The most common Natural Resources, Construction and Maintenance occupations in Blades are Installation, Maintenance & Repair (41 | 9.0%), and Construction & Extraction (6 | 1.3%).
Natural Resources, Construction and Maintenance Occupations by Sex
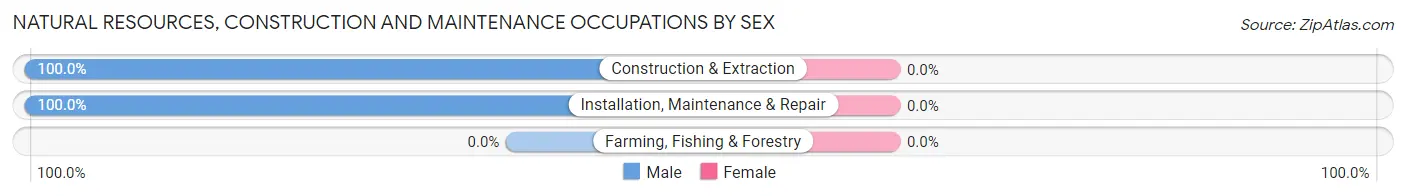
| Occupation | Male | Female |
| Farming, Fishing & Forestry | 0 (0.0%) | 0 (0.0%) |
| Construction & Extraction | 6 (100.0%) | 0 (0.0%) |
| Installation, Maintenance & Repair | 41 (100.0%) | 0 (0.0%) |
| Total (Category) | 47 (100.0%) | 0 (0.0%) |
| Total (Overall) | 228 (50.0%) | 228 (50.0%) |
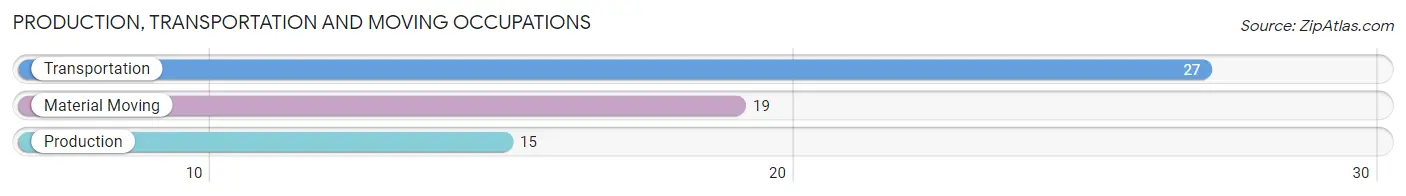
Production, Transportation and Moving Occupations
The most common Production, Transportation and Moving occupations in Blades are Transportation (27 | 5.9%), Material Moving (19 | 4.2%), and Production (15 | 3.3%).
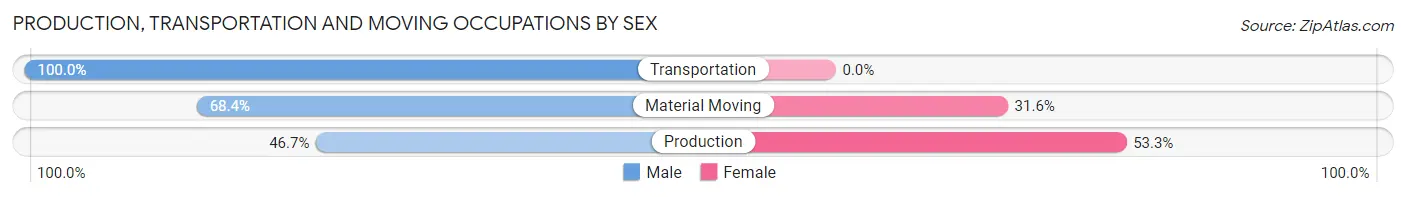
Production, Transportation and Moving Occupations by Sex
| Occupation | Male | Female |
| Production | 7 (46.7%) | 8 (53.3%) |
| Transportation | 27 (100.0%) | 0 (0.0%) |
| Material Moving | 13 (68.4%) | 6 (31.6%) |
| Total (Category) | 47 (77.0%) | 14 (23.0%) |
| Total (Overall) | 228 (50.0%) | 228 (50.0%) |
Employment Industries by Sex in Blades
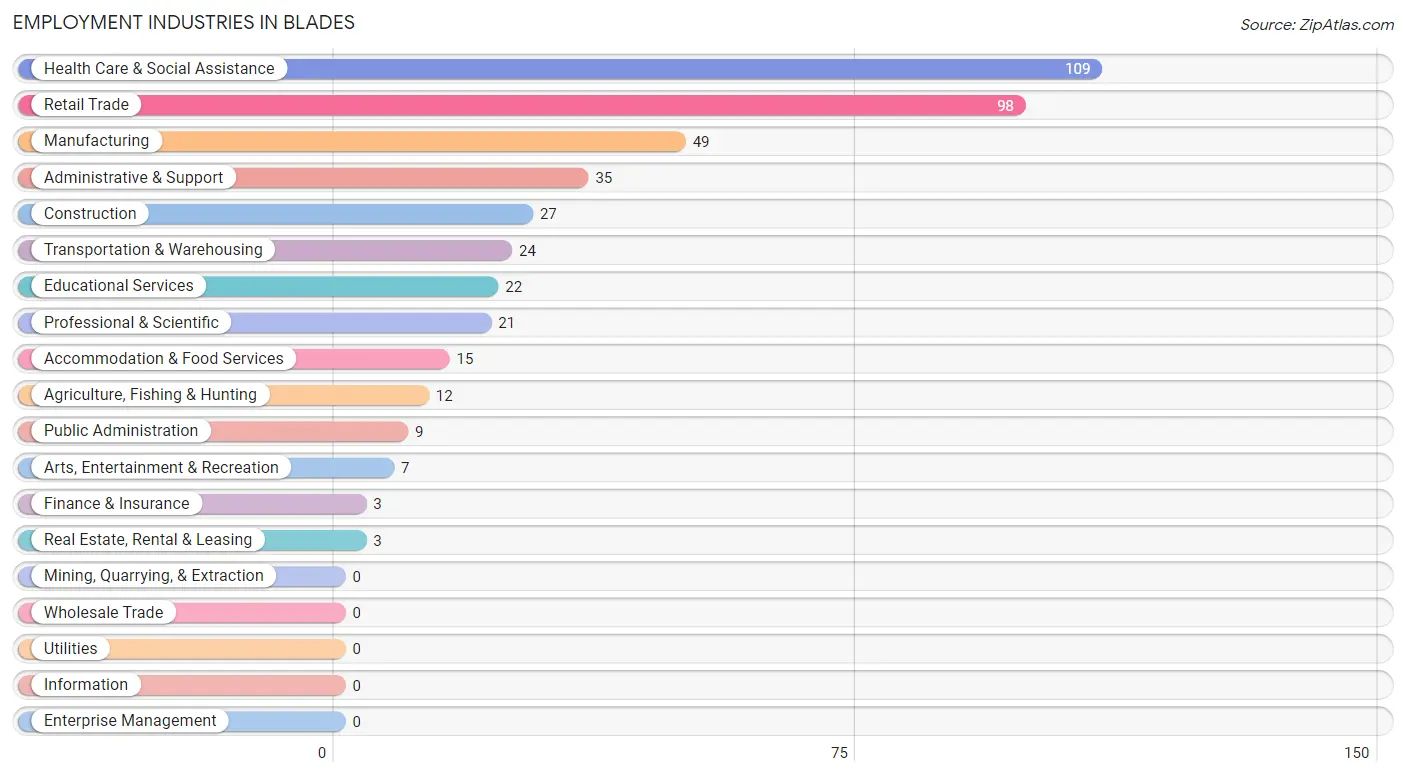
Employment Industries in Blades
The major employment industries in Blades include Health Care & Social Assistance (109 | 23.9%), Retail Trade (98 | 21.5%), Manufacturing (49 | 10.7%), Administrative & Support (35 | 7.7%), and Construction (27 | 5.9%).
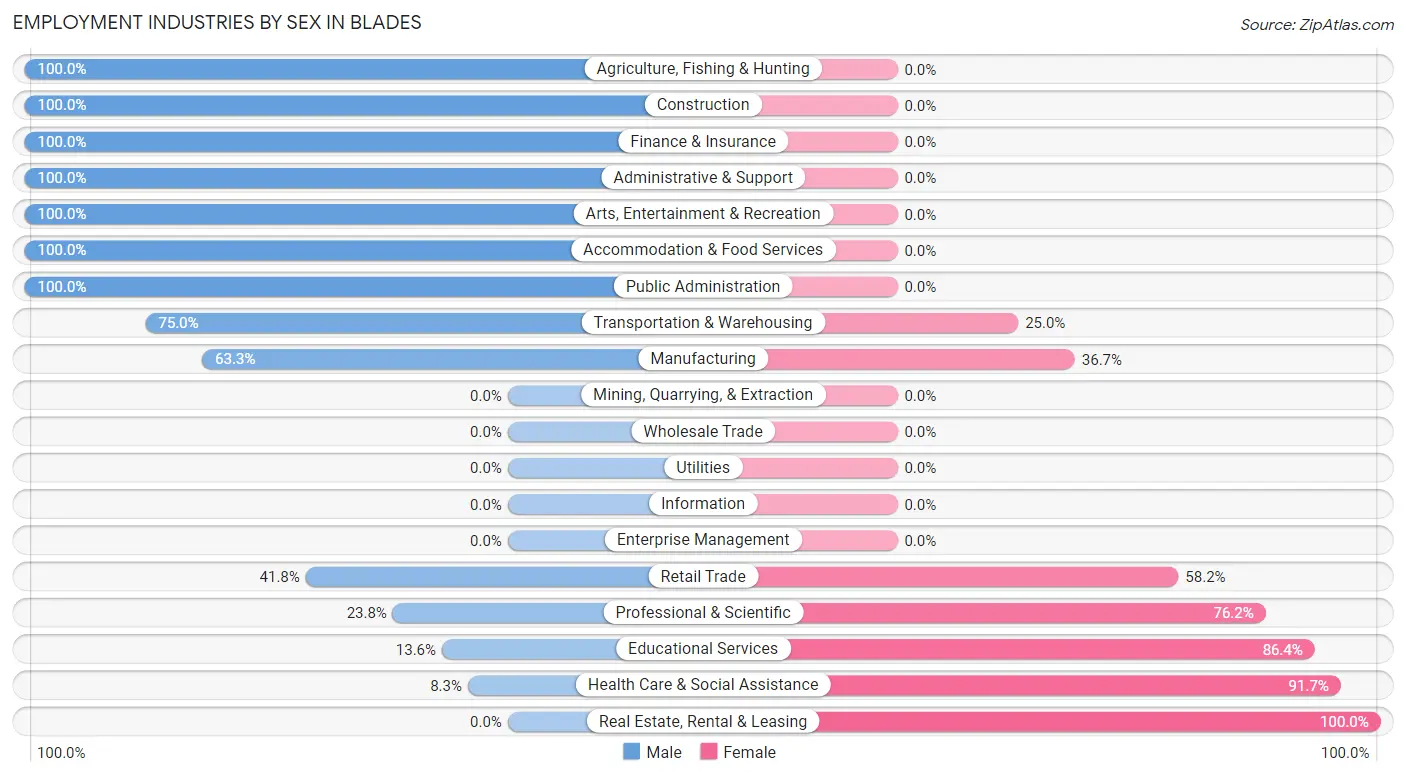
Employment Industries by Sex in Blades
The Blades industries that see more men than women are Agriculture, Fishing & Hunting (100.0%), Construction (100.0%), and Finance & Insurance (100.0%), whereas the industries that tend to have a higher number of women are Real Estate, Rental & Leasing (100.0%), Health Care & Social Assistance (91.7%), and Educational Services (86.4%).
| Industry | Male | Female |
| Agriculture, Fishing & Hunting | 12 (100.0%) | 0 (0.0%) |
| Mining, Quarrying, & Extraction | 0 (0.0%) | 0 (0.0%) |
| Construction | 27 (100.0%) | 0 (0.0%) |
| Manufacturing | 31 (63.3%) | 18 (36.7%) |
| Wholesale Trade | 0 (0.0%) | 0 (0.0%) |
| Retail Trade | 41 (41.8%) | 57 (58.2%) |
| Transportation & Warehousing | 18 (75.0%) | 6 (25.0%) |
| Utilities | 0 (0.0%) | 0 (0.0%) |
| Information | 0 (0.0%) | 0 (0.0%) |
| Finance & Insurance | 3 (100.0%) | 0 (0.0%) |
| Real Estate, Rental & Leasing | 0 (0.0%) | 3 (100.0%) |
| Professional & Scientific | 5 (23.8%) | 16 (76.2%) |
| Enterprise Management | 0 (0.0%) | 0 (0.0%) |
| Administrative & Support | 35 (100.0%) | 0 (0.0%) |
| Educational Services | 3 (13.6%) | 19 (86.4%) |
| Health Care & Social Assistance | 9 (8.3%) | 100 (91.7%) |
| Arts, Entertainment & Recreation | 7 (100.0%) | 0 (0.0%) |
| Accommodation & Food Services | 15 (100.0%) | 0 (0.0%) |
| Public Administration | 9 (100.0%) | 0 (0.0%) |
| Total | 228 (50.0%) | 228 (50.0%) |
Education in Blades
School Enrollment in Blades
The most common levels of schooling among the 136 students in Blades are college / undergraduate (40 | 29.4%), elementary school (35 | 25.7%), and middle school (32 | 23.5%).
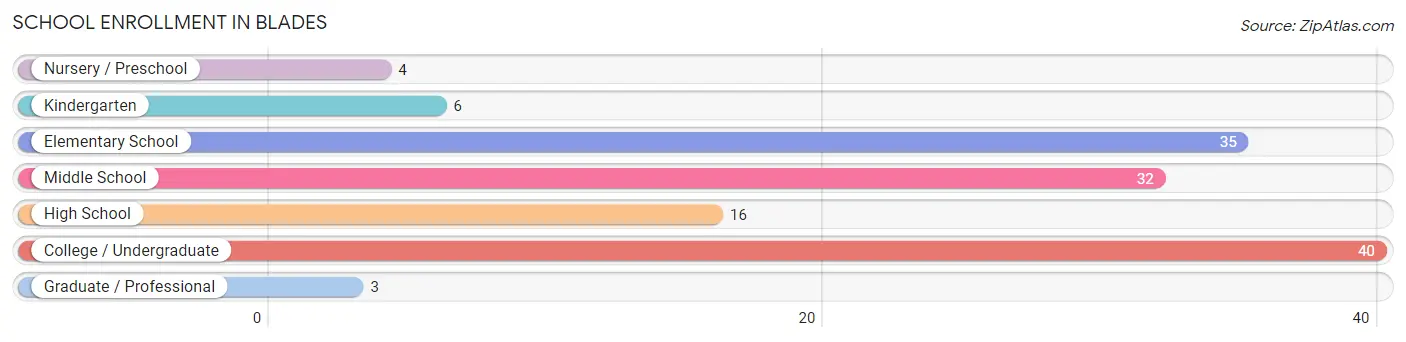
| School Level | # Students | % Students |
| Nursery / Preschool | 4 | 2.9% |
| Kindergarten | 6 | 4.4% |
| Elementary School | 35 | 25.7% |
| Middle School | 32 | 23.5% |
| High School | 16 | 11.8% |
| College / Undergraduate | 40 | 29.4% |
| Graduate / Professional | 3 | 2.2% |
| Total | 136 | 100.0% |
School Enrollment by Age by Funding Source in Blades
Out of a total of 136 students who are enrolled in schools in Blades, 15 (11.0%) attend a private institution, while the remaining 121 (89.0%) are enrolled in public schools. The age group of 35 years and over has the highest likelihood of being enrolled in private schools, with 6 (100.0% in the age bracket) enrolled. Conversely, the age group of 3 to 4 year olds has the lowest likelihood of being enrolled in a private school, with 4 (100.0% in the age bracket) attending a public institution.
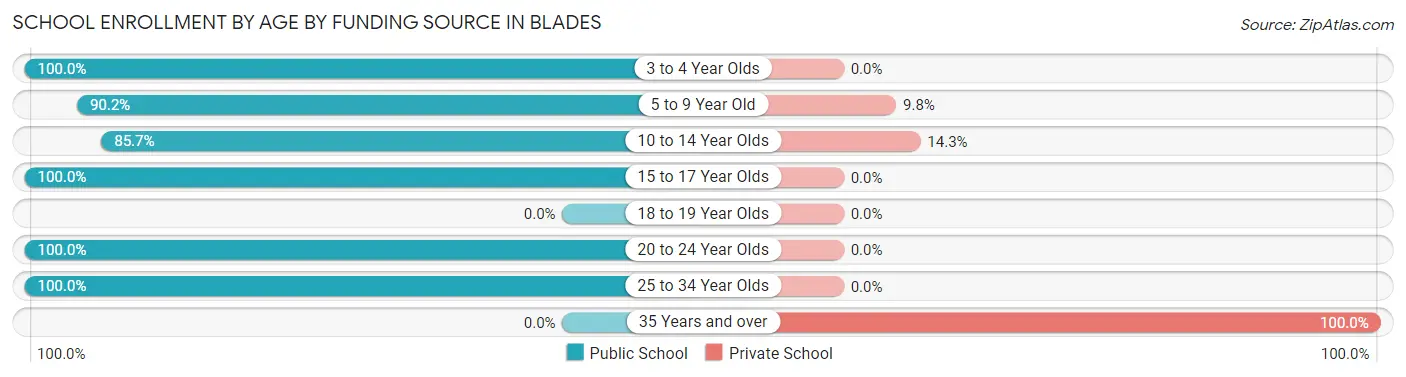
| Age Bracket | Public School | Private School |
| 3 to 4 Year Olds | 4 (100.0%) | 0 (0.0%) |
| 5 to 9 Year Old | 37 (90.2%) | 4 (9.8%) |
| 10 to 14 Year Olds | 30 (85.7%) | 5 (14.3%) |
| 15 to 17 Year Olds | 13 (100.0%) | 0 (0.0%) |
| 18 to 19 Year Olds | 0 (0.0%) | 0 (0.0%) |
| 20 to 24 Year Olds | 33 (100.0%) | 0 (0.0%) |
| 25 to 34 Year Olds | 4 (100.0%) | 0 (0.0%) |
| 35 Years and over | 0 (0.0%) | 6 (100.0%) |
| Total | 121 (89.0%) | 15 (11.0%) |
Educational Attainment by Field of Study in Blades
Education (16 | 29.1%), business (14 | 25.5%), physical & health sciences (6 | 10.9%), science & technology (6 | 10.9%), and visual & performing arts (4 | 7.3%) are the most common fields of study among 55 individuals in Blades who have obtained a bachelor's degree or higher.
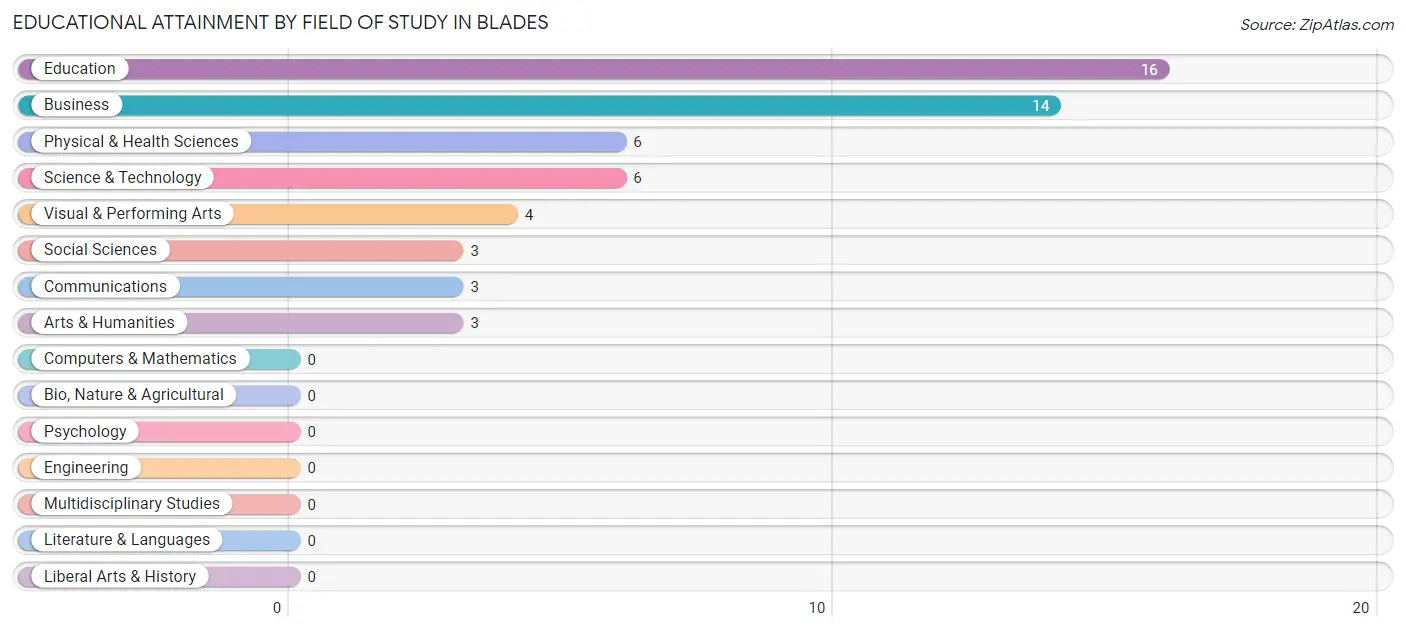
| Field of Study | # Graduates | % Graduates |
| Computers & Mathematics | 0 | 0.0% |
| Bio, Nature & Agricultural | 0 | 0.0% |
| Physical & Health Sciences | 6 | 10.9% |
| Psychology | 0 | 0.0% |
| Social Sciences | 3 | 5.4% |
| Engineering | 0 | 0.0% |
| Multidisciplinary Studies | 0 | 0.0% |
| Science & Technology | 6 | 10.9% |
| Business | 14 | 25.5% |
| Education | 16 | 29.1% |
| Literature & Languages | 0 | 0.0% |
| Liberal Arts & History | 0 | 0.0% |
| Visual & Performing Arts | 4 | 7.3% |
| Communications | 3 | 5.4% |
| Arts & Humanities | 3 | 5.4% |
| Total | 55 | 100.0% |
Transportation & Commute in Blades
Vehicle Availability by Sex in Blades
The most prevalent vehicle ownership categories in Blades are males with 2 vehicles (139, accounting for 61.0%) and females with 2 vehicles (83, making up 61.0%).
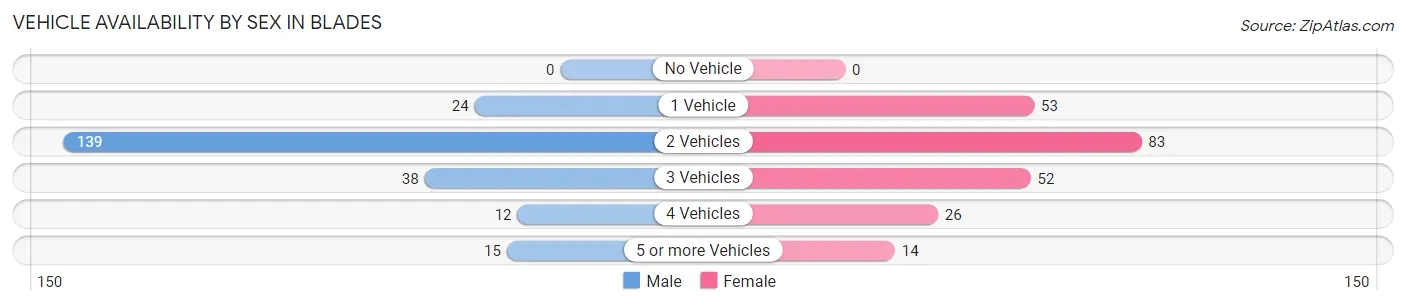
| Vehicles Available | Male | Female |
| No Vehicle | 0 (0.0%) | 0 (0.0%) |
| 1 Vehicle | 24 (10.5%) | 53 (23.3%) |
| 2 Vehicles | 139 (61.0%) | 83 (36.4%) |
| 3 Vehicles | 38 (16.7%) | 52 (22.8%) |
| 4 Vehicles | 12 (5.3%) | 26 (11.4%) |
| 5 or more Vehicles | 15 (6.6%) | 14 (6.1%) |
| Total | 228 (100.0%) | 228 (100.0%) |
Commute Time in Blades
The most frequently occuring commute durations in Blades are 45 to 59 minutes (95 commuters, 20.8%), 10 to 14 minutes (85 commuters, 18.6%), and 20 to 24 minutes (78 commuters, 17.1%).
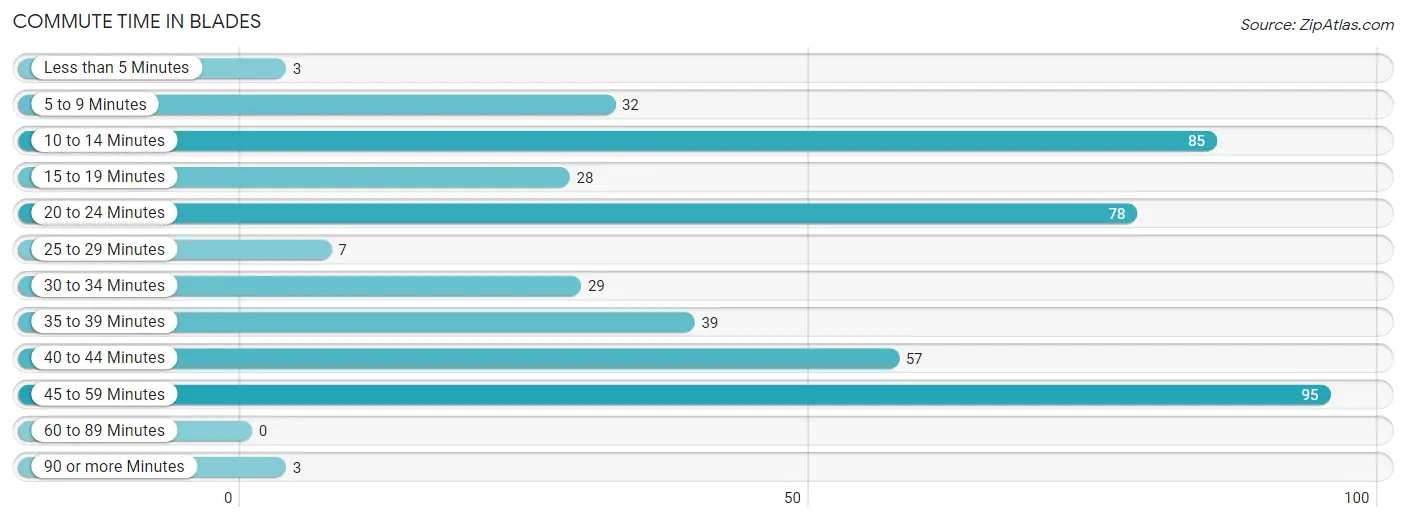
| Commute Time | # Commuters | % Commuters |
| Less than 5 Minutes | 3 | 0.7% |
| 5 to 9 Minutes | 32 | 7.0% |
| 10 to 14 Minutes | 85 | 18.6% |
| 15 to 19 Minutes | 28 | 6.1% |
| 20 to 24 Minutes | 78 | 17.1% |
| 25 to 29 Minutes | 7 | 1.5% |
| 30 to 34 Minutes | 29 | 6.4% |
| 35 to 39 Minutes | 39 | 8.6% |
| 40 to 44 Minutes | 57 | 12.5% |
| 45 to 59 Minutes | 95 | 20.8% |
| 60 to 89 Minutes | 0 | 0.0% |
| 90 or more Minutes | 3 | 0.7% |
Commute Time by Sex in Blades
The most common commute times in Blades are 10 to 14 minutes (63 commuters, 27.6%) for males and 40 to 44 minutes (46 commuters, 20.2%) for females.
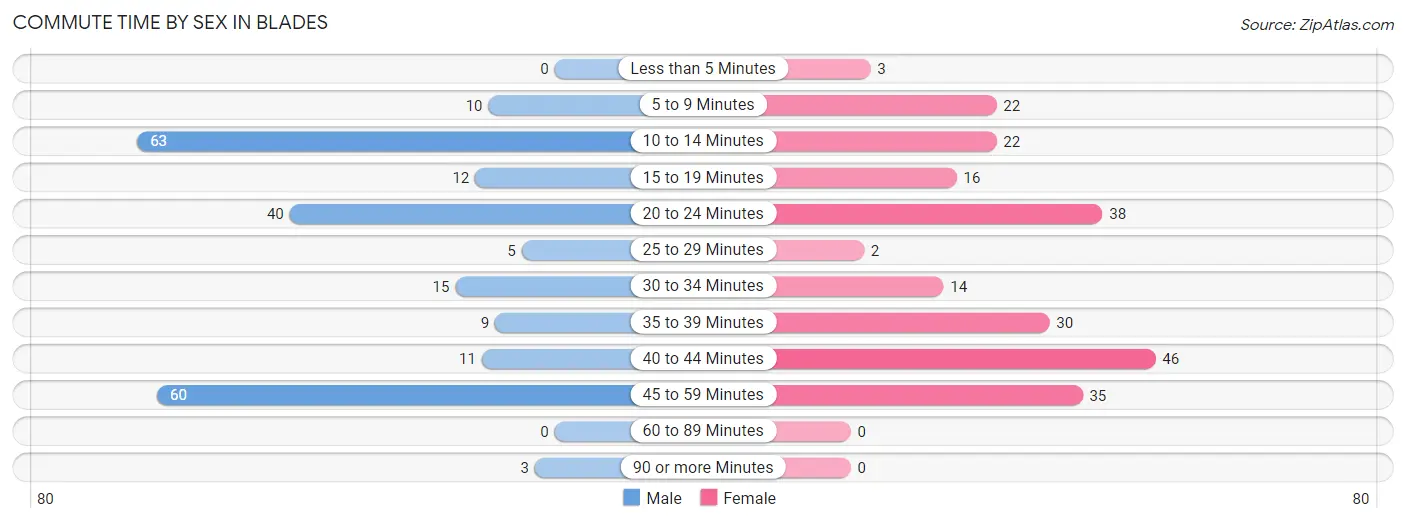
| Commute Time | Male | Female |
| Less than 5 Minutes | 0 (0.0%) | 3 (1.3%) |
| 5 to 9 Minutes | 10 (4.4%) | 22 (9.7%) |
| 10 to 14 Minutes | 63 (27.6%) | 22 (9.7%) |
| 15 to 19 Minutes | 12 (5.3%) | 16 (7.0%) |
| 20 to 24 Minutes | 40 (17.5%) | 38 (16.7%) |
| 25 to 29 Minutes | 5 (2.2%) | 2 (0.9%) |
| 30 to 34 Minutes | 15 (6.6%) | 14 (6.1%) |
| 35 to 39 Minutes | 9 (4.0%) | 30 (13.2%) |
| 40 to 44 Minutes | 11 (4.8%) | 46 (20.2%) |
| 45 to 59 Minutes | 60 (26.3%) | 35 (15.3%) |
| 60 to 89 Minutes | 0 (0.0%) | 0 (0.0%) |
| 90 or more Minutes | 3 (1.3%) | 0 (0.0%) |
Time of Departure to Work by Sex in Blades
The most frequent times of departure to work in Blades are 6:00 AM to 6:29 AM (46, 20.2%) for males and 12:00 PM to 3:59 PM (38, 16.7%) for females.
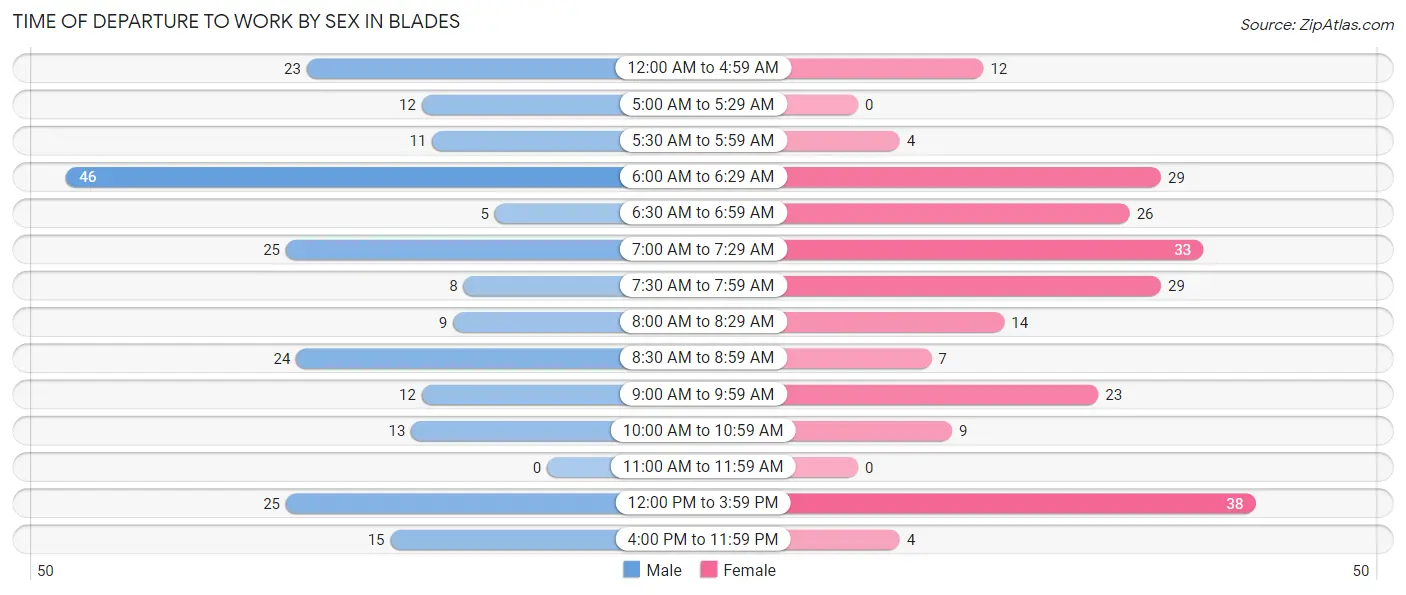
| Time of Departure | Male | Female |
| 12:00 AM to 4:59 AM | 23 (10.1%) | 12 (5.3%) |
| 5:00 AM to 5:29 AM | 12 (5.3%) | 0 (0.0%) |
| 5:30 AM to 5:59 AM | 11 (4.8%) | 4 (1.8%) |
| 6:00 AM to 6:29 AM | 46 (20.2%) | 29 (12.7%) |
| 6:30 AM to 6:59 AM | 5 (2.2%) | 26 (11.4%) |
| 7:00 AM to 7:29 AM | 25 (11.0%) | 33 (14.5%) |
| 7:30 AM to 7:59 AM | 8 (3.5%) | 29 (12.7%) |
| 8:00 AM to 8:29 AM | 9 (4.0%) | 14 (6.1%) |
| 8:30 AM to 8:59 AM | 24 (10.5%) | 7 (3.1%) |
| 9:00 AM to 9:59 AM | 12 (5.3%) | 23 (10.1%) |
| 10:00 AM to 10:59 AM | 13 (5.7%) | 9 (4.0%) |
| 11:00 AM to 11:59 AM | 0 (0.0%) | 0 (0.0%) |
| 12:00 PM to 3:59 PM | 25 (11.0%) | 38 (16.7%) |
| 4:00 PM to 11:59 PM | 15 (6.6%) | 4 (1.8%) |
| Total | 228 (100.0%) | 228 (100.0%) |
Housing Occupancy in Blades
Occupancy by Ownership in Blades
Of the total 364 dwellings in Blades, owner-occupied units account for 306 (84.1%), while renter-occupied units make up 58 (15.9%).
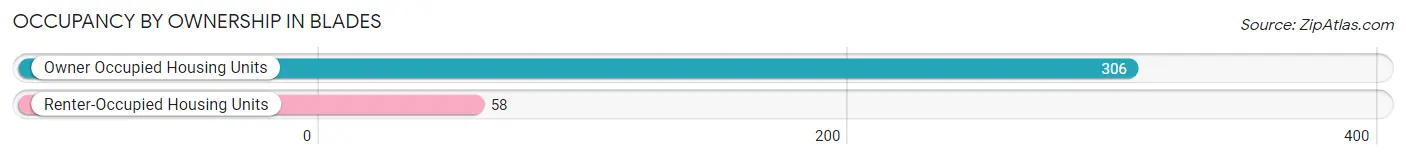
| Occupancy | # Housing Units | % Housing Units |
| Owner Occupied Housing Units | 306 | 84.1% |
| Renter-Occupied Housing Units | 58 | 15.9% |
| Total Occupied Housing Units | 364 | 100.0% |
Occupancy by Household Size in Blades
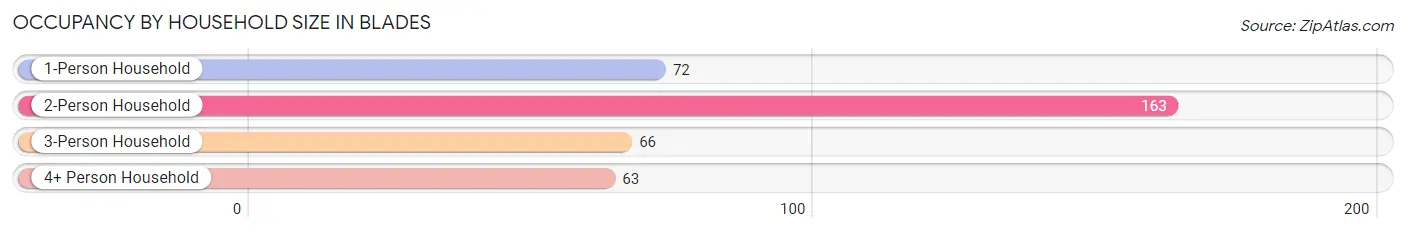
| Household Size | # Housing Units | % Housing Units |
| 1-Person Household | 72 | 19.8% |
| 2-Person Household | 163 | 44.8% |
| 3-Person Household | 66 | 18.1% |
| 4+ Person Household | 63 | 17.3% |
| Total Housing Units | 364 | 100.0% |
Occupancy by Ownership by Household Size in Blades
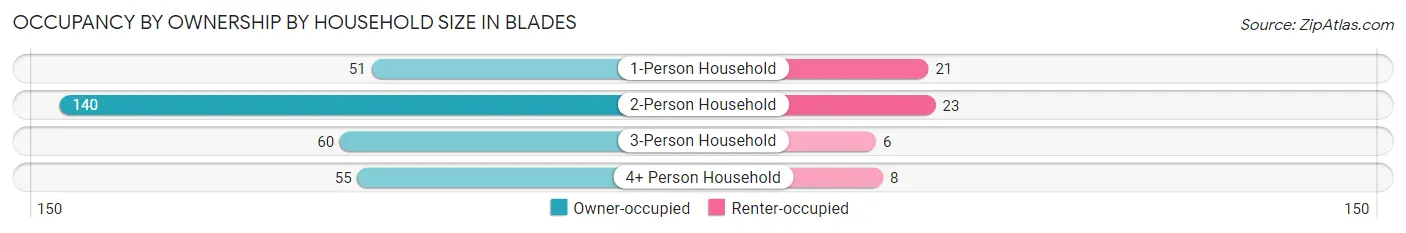
| Household Size | Owner-occupied | Renter-occupied |
| 1-Person Household | 51 (70.8%) | 21 (29.2%) |
| 2-Person Household | 140 (85.9%) | 23 (14.1%) |
| 3-Person Household | 60 (90.9%) | 6 (9.1%) |
| 4+ Person Household | 55 (87.3%) | 8 (12.7%) |
| Total Housing Units | 306 (84.1%) | 58 (15.9%) |
Occupancy by Educational Attainment in Blades
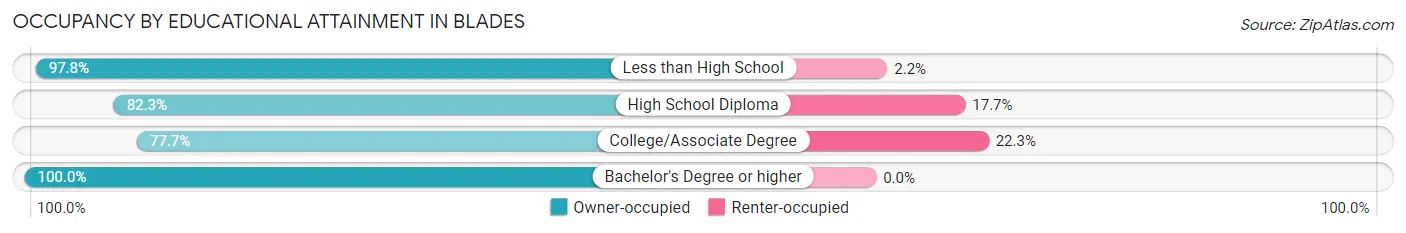
| Household Size | Owner-occupied | Renter-occupied |
| Less than High School | 44 (97.8%) | 1 (2.2%) |
| High School Diploma | 149 (82.3%) | 32 (17.7%) |
| College/Associate Degree | 87 (77.7%) | 25 (22.3%) |
| Bachelor's Degree or higher | 26 (100.0%) | 0 (0.0%) |
Occupancy by Age of Householder in Blades
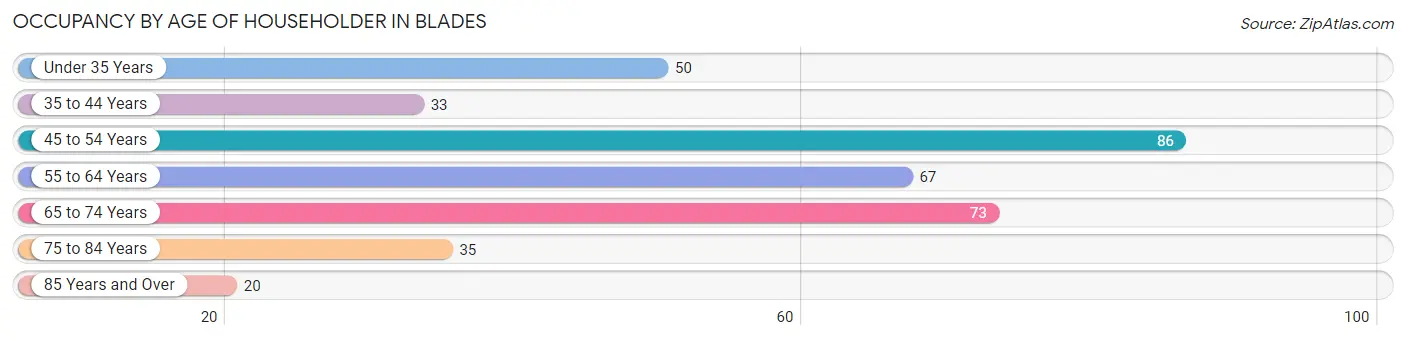
| Age Bracket | # Households | % Households |
| Under 35 Years | 50 | 13.7% |
| 35 to 44 Years | 33 | 9.1% |
| 45 to 54 Years | 86 | 23.6% |
| 55 to 64 Years | 67 | 18.4% |
| 65 to 74 Years | 73 | 20.1% |
| 75 to 84 Years | 35 | 9.6% |
| 85 Years and Over | 20 | 5.5% |
| Total | 364 | 100.0% |
Housing Finances in Blades
Median Income by Occupancy in Blades
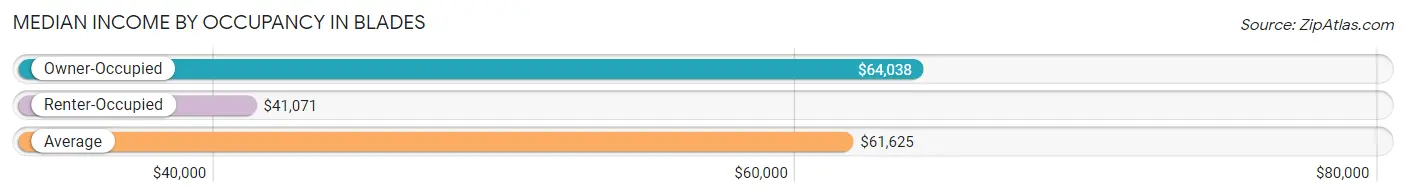
| Occupancy Type | # Households | Median Income |
| Owner-Occupied | 306 (84.1%) | $64,038 |
| Renter-Occupied | 58 (15.9%) | $41,071 |
| Average | 364 (100.0%) | $61,625 |
Occupancy by Householder Income Bracket in Blades
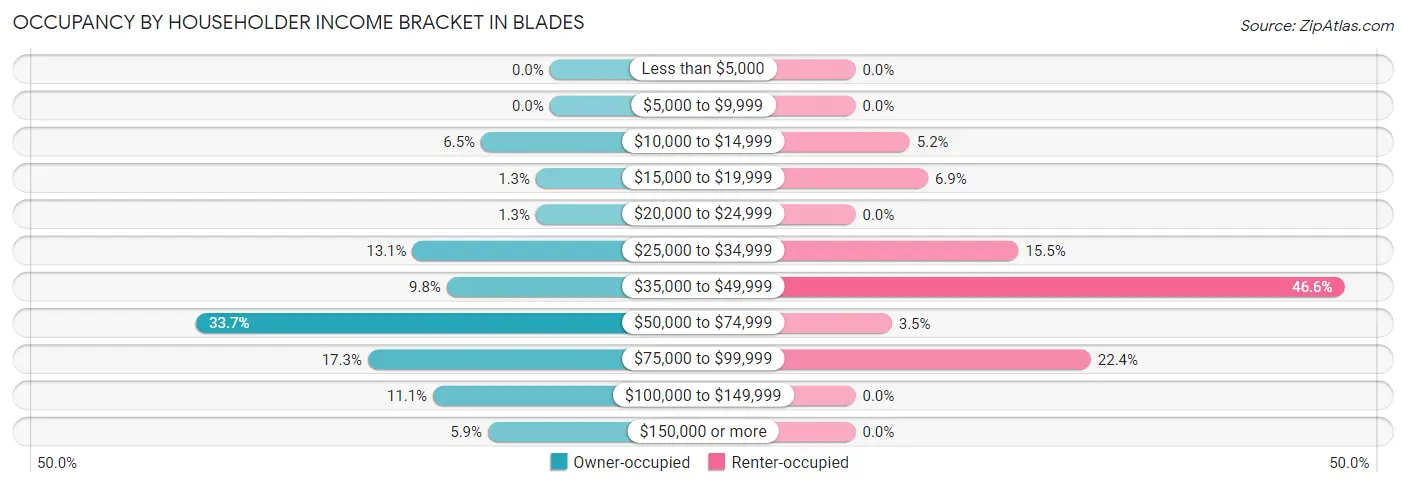
| Income Bracket | Owner-occupied | Renter-occupied |
| Less than $5,000 | 0 (0.0%) | 0 (0.0%) |
| $5,000 to $9,999 | 0 (0.0%) | 0 (0.0%) |
| $10,000 to $14,999 | 20 (6.5%) | 3 (5.2%) |
| $15,000 to $19,999 | 4 (1.3%) | 4 (6.9%) |
| $20,000 to $24,999 | 4 (1.3%) | 0 (0.0%) |
| $25,000 to $34,999 | 40 (13.1%) | 9 (15.5%) |
| $35,000 to $49,999 | 30 (9.8%) | 27 (46.6%) |
| $50,000 to $74,999 | 103 (33.7%) | 2 (3.5%) |
| $75,000 to $99,999 | 53 (17.3%) | 13 (22.4%) |
| $100,000 to $149,999 | 34 (11.1%) | 0 (0.0%) |
| $150,000 or more | 18 (5.9%) | 0 (0.0%) |
| Total | 306 (100.0%) | 58 (100.0%) |
Monthly Housing Cost Tiers in Blades
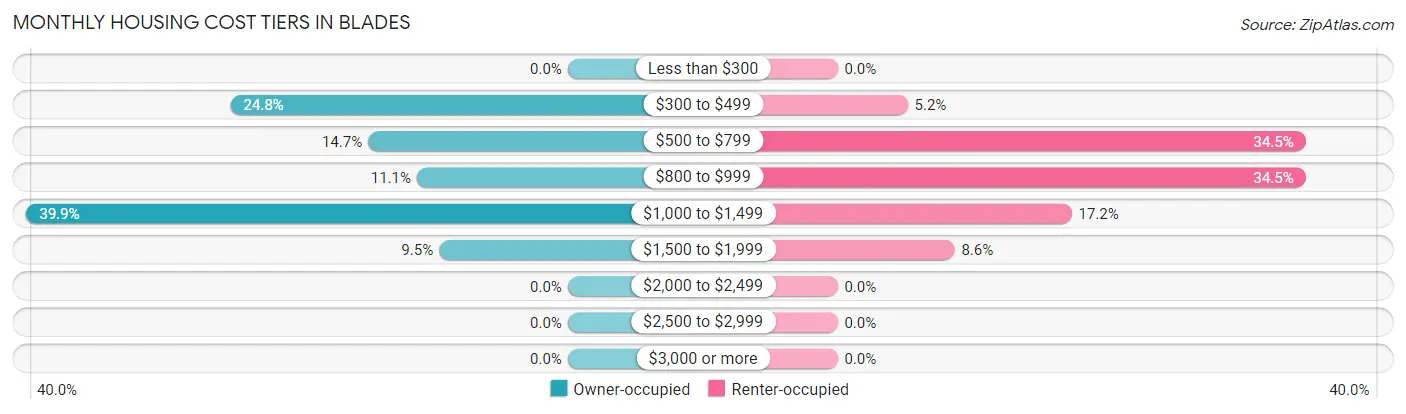
| Monthly Cost | Owner-occupied | Renter-occupied |
| Less than $300 | 0 (0.0%) | 0 (0.0%) |
| $300 to $499 | 76 (24.8%) | 3 (5.2%) |
| $500 to $799 | 45 (14.7%) | 20 (34.5%) |
| $800 to $999 | 34 (11.1%) | 20 (34.5%) |
| $1,000 to $1,499 | 122 (39.9%) | 10 (17.2%) |
| $1,500 to $1,999 | 29 (9.5%) | 5 (8.6%) |
| $2,000 to $2,499 | 0 (0.0%) | 0 (0.0%) |
| $2,500 to $2,999 | 0 (0.0%) | 0 (0.0%) |
| $3,000 or more | 0 (0.0%) | 0 (0.0%) |
| Total | 306 (100.0%) | 58 (100.0%) |
Physical Housing Characteristics in Blades
Housing Structures in Blades
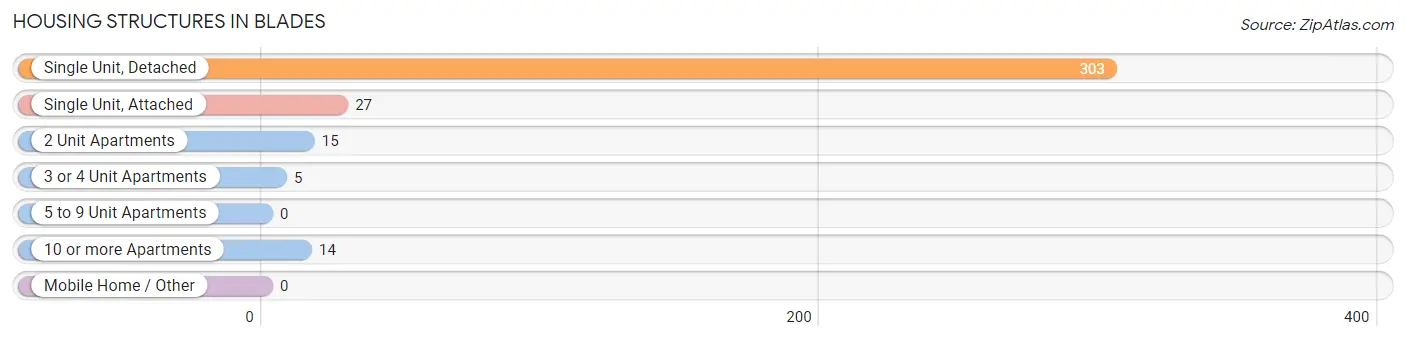
| Structure Type | # Housing Units | % Housing Units |
| Single Unit, Detached | 303 | 83.2% |
| Single Unit, Attached | 27 | 7.4% |
| 2 Unit Apartments | 15 | 4.1% |
| 3 or 4 Unit Apartments | 5 | 1.4% |
| 5 to 9 Unit Apartments | 0 | 0.0% |
| 10 or more Apartments | 14 | 3.8% |
| Mobile Home / Other | 0 | 0.0% |
| Total | 364 | 100.0% |
Housing Structures by Occupancy in Blades
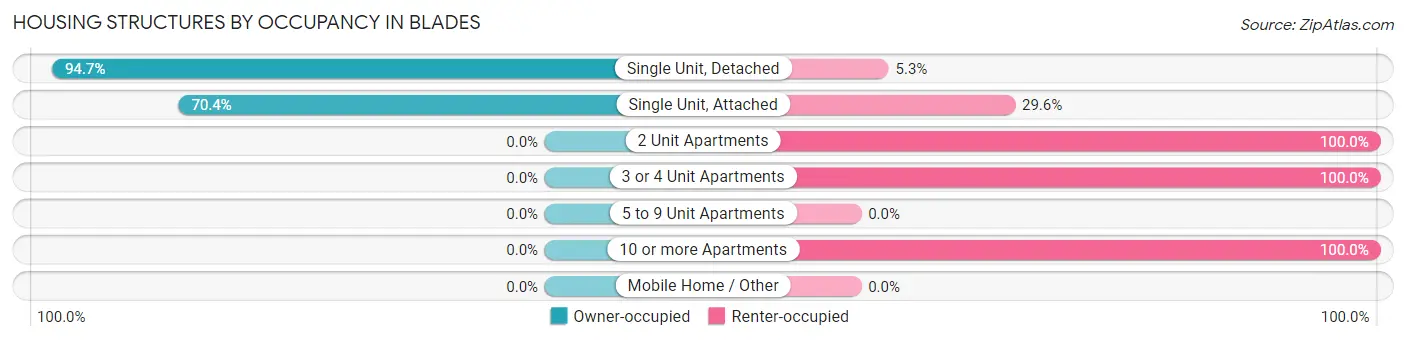
| Structure Type | Owner-occupied | Renter-occupied |
| Single Unit, Detached | 287 (94.7%) | 16 (5.3%) |
| Single Unit, Attached | 19 (70.4%) | 8 (29.6%) |
| 2 Unit Apartments | 0 (0.0%) | 15 (100.0%) |
| 3 or 4 Unit Apartments | 0 (0.0%) | 5 (100.0%) |
| 5 to 9 Unit Apartments | 0 (0.0%) | 0 (0.0%) |
| 10 or more Apartments | 0 (0.0%) | 14 (100.0%) |
| Mobile Home / Other | 0 (0.0%) | 0 (0.0%) |
| Total | 306 (84.1%) | 58 (15.9%) |
Housing Structures by Number of Rooms in Blades
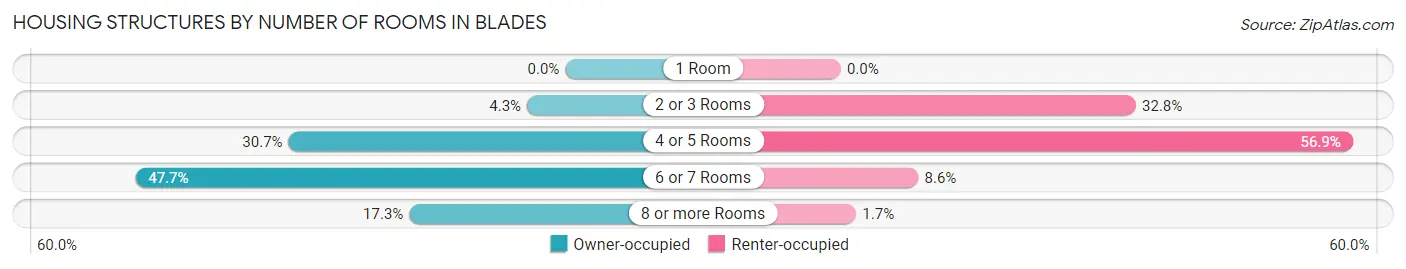
| Number of Rooms | Owner-occupied | Renter-occupied |
| 1 Room | 0 (0.0%) | 0 (0.0%) |
| 2 or 3 Rooms | 13 (4.3%) | 19 (32.8%) |
| 4 or 5 Rooms | 94 (30.7%) | 33 (56.9%) |
| 6 or 7 Rooms | 146 (47.7%) | 5 (8.6%) |
| 8 or more Rooms | 53 (17.3%) | 1 (1.7%) |
| Total | 306 (100.0%) | 58 (100.0%) |
Housing Structure by Heating Type in Blades
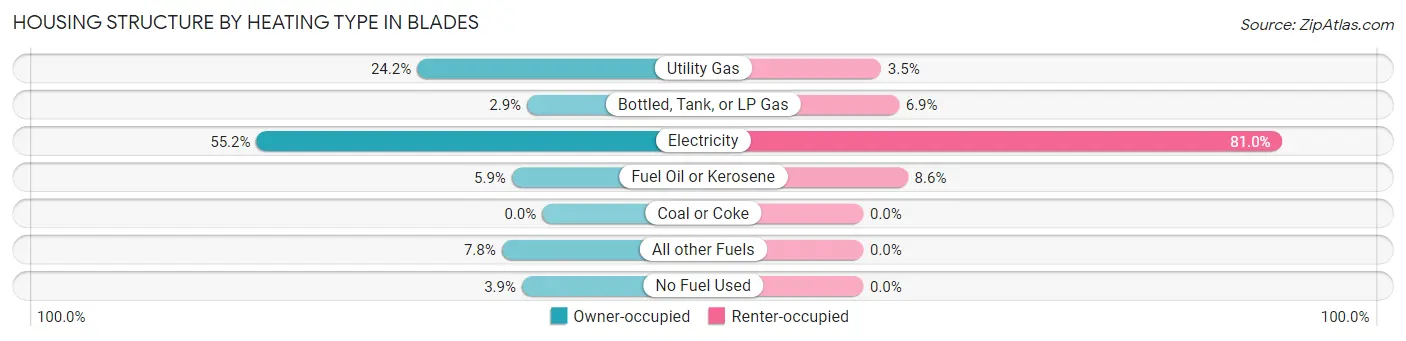
| Heating Type | Owner-occupied | Renter-occupied |
| Utility Gas | 74 (24.2%) | 2 (3.5%) |
| Bottled, Tank, or LP Gas | 9 (2.9%) | 4 (6.9%) |
| Electricity | 169 (55.2%) | 47 (81.0%) |
| Fuel Oil or Kerosene | 18 (5.9%) | 5 (8.6%) |
| Coal or Coke | 0 (0.0%) | 0 (0.0%) |
| All other Fuels | 24 (7.8%) | 0 (0.0%) |
| No Fuel Used | 12 (3.9%) | 0 (0.0%) |
| Total | 306 (100.0%) | 58 (100.0%) |
Household Vehicle Usage in Blades
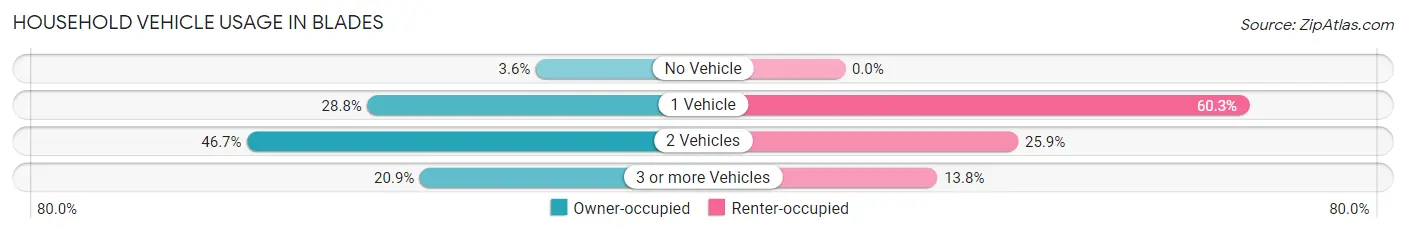
| Vehicles per Household | Owner-occupied | Renter-occupied |
| No Vehicle | 11 (3.6%) | 0 (0.0%) |
| 1 Vehicle | 88 (28.8%) | 35 (60.3%) |
| 2 Vehicles | 143 (46.7%) | 15 (25.9%) |
| 3 or more Vehicles | 64 (20.9%) | 8 (13.8%) |
| Total | 306 (100.0%) | 58 (100.0%) |
Real Estate & Mortgages in Blades
Real Estate and Mortgage Overview in Blades
| Characteristic | Without Mortgage | With Mortgage |
| Housing Units | 92 | 214 |
| Median Property Value | $226,900 | $182,300 |
| Median Household Income | $61,944 | $6 |
| Monthly Housing Costs | $449 | $0 |
| Real Estate Taxes | $1,179 | $5 |
Property Value by Mortgage Status in Blades
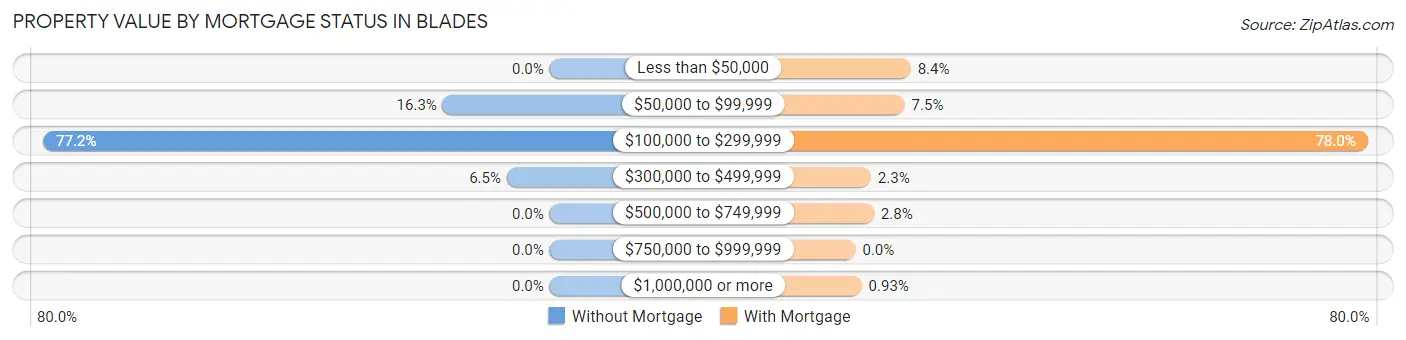
| Property Value | Without Mortgage | With Mortgage |
| Less than $50,000 | 0 (0.0%) | 18 (8.4%) |
| $50,000 to $99,999 | 15 (16.3%) | 16 (7.5%) |
| $100,000 to $299,999 | 71 (77.2%) | 167 (78.0%) |
| $300,000 to $499,999 | 6 (6.5%) | 5 (2.3%) |
| $500,000 to $749,999 | 0 (0.0%) | 6 (2.8%) |
| $750,000 to $999,999 | 0 (0.0%) | 0 (0.0%) |
| $1,000,000 or more | 0 (0.0%) | 2 (0.9%) |
| Total | 92 (100.0%) | 214 (100.0%) |
Household Income by Mortgage Status in Blades
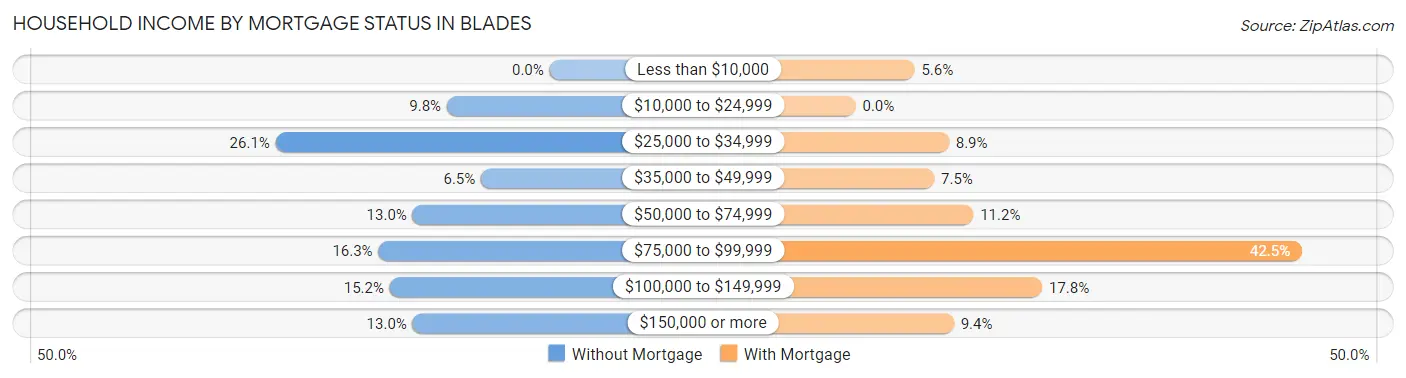
| Household Income | Without Mortgage | With Mortgage |
| Less than $10,000 | 0 (0.0%) | 12 (5.6%) |
| $10,000 to $24,999 | 9 (9.8%) | 0 (0.0%) |
| $25,000 to $34,999 | 24 (26.1%) | 19 (8.9%) |
| $35,000 to $49,999 | 6 (6.5%) | 16 (7.5%) |
| $50,000 to $74,999 | 12 (13.0%) | 24 (11.2%) |
| $75,000 to $99,999 | 15 (16.3%) | 91 (42.5%) |
| $100,000 to $149,999 | 14 (15.2%) | 38 (17.8%) |
| $150,000 or more | 12 (13.0%) | 20 (9.3%) |
| Total | 92 (100.0%) | 214 (100.0%) |
Property Value to Household Income Ratio in Blades
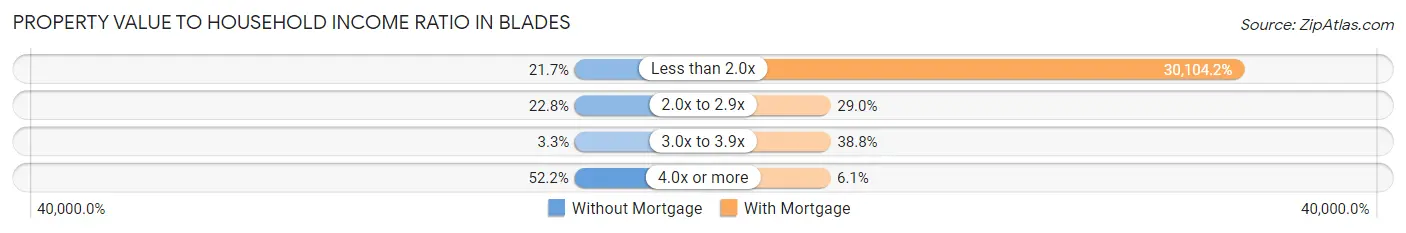
| Value-to-Income Ratio | Without Mortgage | With Mortgage |
| Less than 2.0x | 20 (21.7%) | 64,423 (30,104.2%) |
| 2.0x to 2.9x | 21 (22.8%) | 62 (29.0%) |
| 3.0x to 3.9x | 3 (3.3%) | 83 (38.8%) |
| 4.0x or more | 48 (52.2%) | 13 (6.1%) |
| Total | 92 (100.0%) | 214 (100.0%) |
Real Estate Taxes by Mortgage Status in Blades
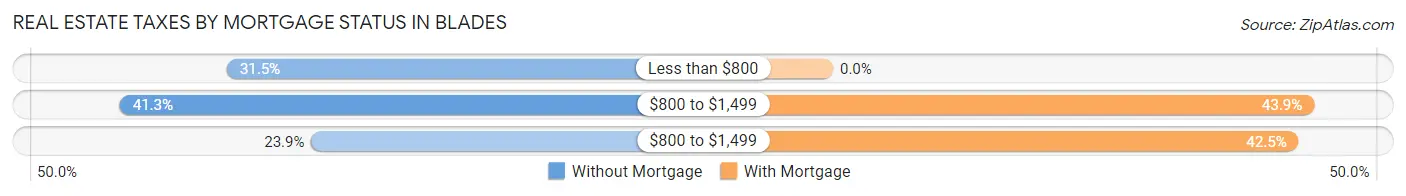
| Property Taxes | Without Mortgage | With Mortgage |
| Less than $800 | 29 (31.5%) | 0 (0.0%) |
| $800 to $1,499 | 38 (41.3%) | 94 (43.9%) |
| $800 to $1,499 | 22 (23.9%) | 91 (42.5%) |
| Total | 92 (100.0%) | 214 (100.0%) |
Health & Disability in Blades
Health Insurance Coverage by Age in Blades
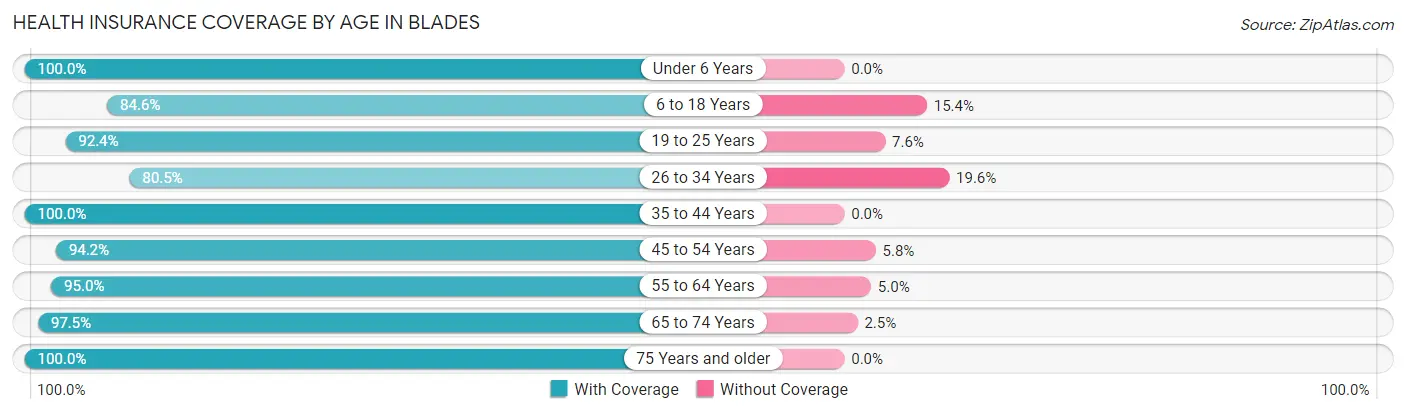
| Age Bracket | With Coverage | Without Coverage |
| Under 6 Years | 61 (100.0%) | 0 (0.0%) |
| 6 to 18 Years | 88 (84.6%) | 16 (15.4%) |
| 19 to 25 Years | 85 (92.4%) | 7 (7.6%) |
| 26 to 34 Years | 107 (80.4%) | 26 (19.6%) |
| 35 to 44 Years | 118 (100.0%) | 0 (0.0%) |
| 45 to 54 Years | 129 (94.2%) | 8 (5.8%) |
| 55 to 64 Years | 115 (95.0%) | 6 (5.0%) |
| 65 to 74 Years | 119 (97.5%) | 3 (2.5%) |
| 75 Years and older | 72 (100.0%) | 0 (0.0%) |
| Total | 894 (93.1%) | 66 (6.9%) |
Health Insurance Coverage by Citizenship Status in Blades
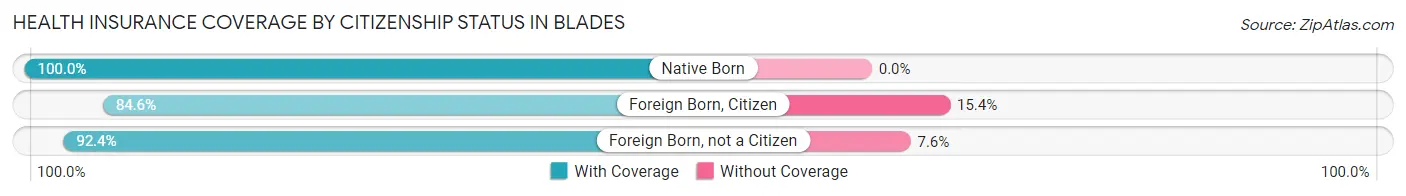
| Citizenship Status | With Coverage | Without Coverage |
| Native Born | 61 (100.0%) | 0 (0.0%) |
| Foreign Born, Citizen | 88 (84.6%) | 16 (15.4%) |
| Foreign Born, not a Citizen | 85 (92.4%) | 7 (7.6%) |
Health Insurance Coverage by Household Income in Blades
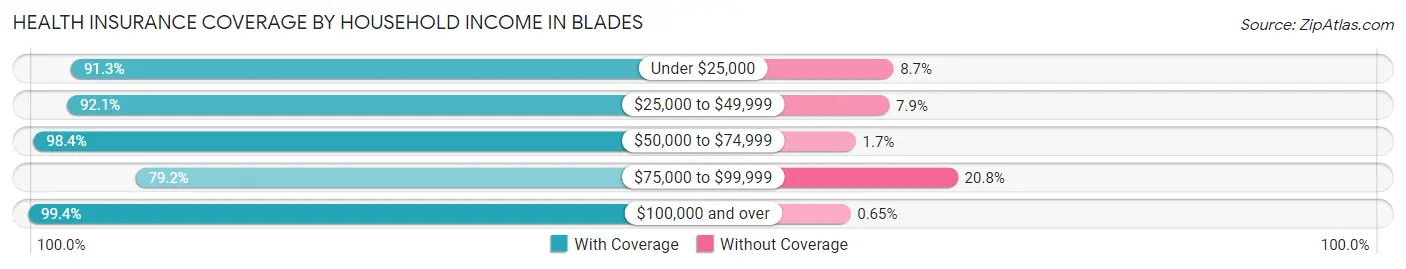
| Household Income | With Coverage | Without Coverage |
| Under $25,000 | 63 (91.3%) | 6 (8.7%) |
| $25,000 to $49,999 | 174 (92.1%) | 15 (7.9%) |
| $50,000 to $74,999 | 358 (98.4%) | 6 (1.7%) |
| $75,000 to $99,999 | 145 (79.2%) | 38 (20.8%) |
| $100,000 and over | 154 (99.4%) | 1 (0.6%) |
Public vs Private Health Insurance Coverage by Age in Blades
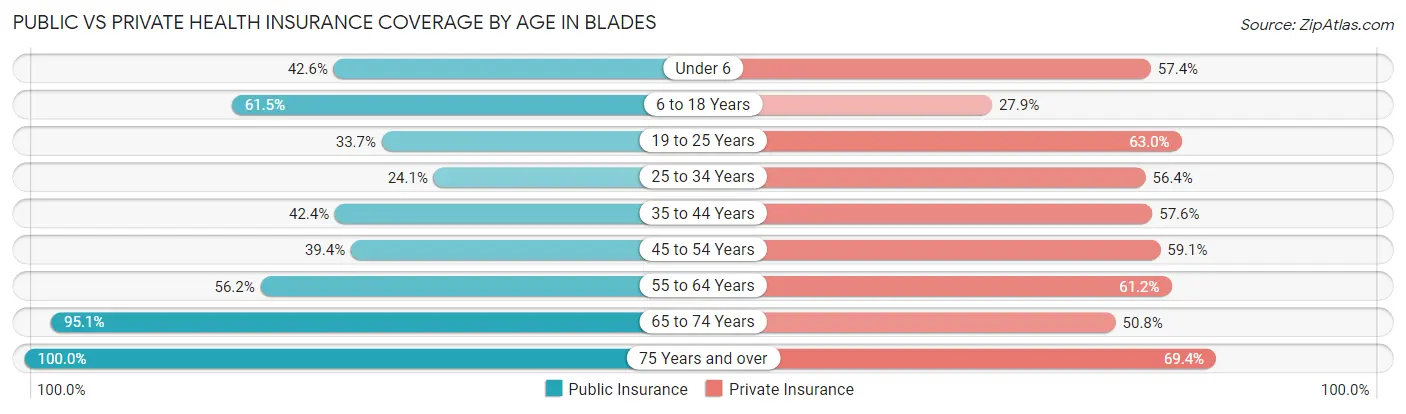
| Age Bracket | Public Insurance | Private Insurance |
| Under 6 | 26 (42.6%) | 35 (57.4%) |
| 6 to 18 Years | 64 (61.5%) | 29 (27.9%) |
| 19 to 25 Years | 31 (33.7%) | 58 (63.0%) |
| 25 to 34 Years | 32 (24.1%) | 75 (56.4%) |
| 35 to 44 Years | 50 (42.4%) | 68 (57.6%) |
| 45 to 54 Years | 54 (39.4%) | 81 (59.1%) |
| 55 to 64 Years | 68 (56.2%) | 74 (61.2%) |
| 65 to 74 Years | 116 (95.1%) | 62 (50.8%) |
| 75 Years and over | 72 (100.0%) | 50 (69.4%) |
| Total | 513 (53.4%) | 532 (55.4%) |
Disability Status by Sex by Age in Blades
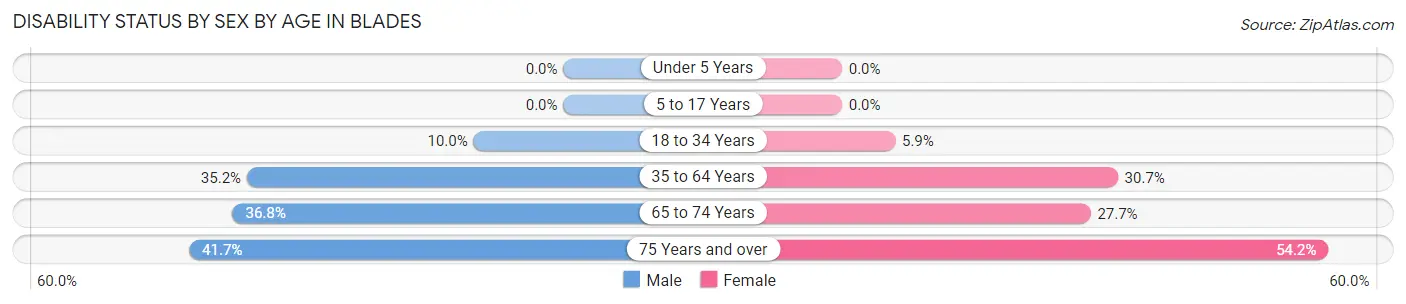
| Age Bracket | Male | Female |
| Under 5 Years | 0 (0.0%) | 0 (0.0%) |
| 5 to 17 Years | 0 (0.0%) | 0 (0.0%) |
| 18 to 34 Years | 10 (10.0%) | 8 (5.9%) |
| 35 to 64 Years | 74 (35.2%) | 51 (30.7%) |
| 65 to 74 Years | 21 (36.8%) | 18 (27.7%) |
| 75 Years and over | 10 (41.7%) | 26 (54.2%) |
Disability Class by Sex by Age in Blades
Disability Class: Hearing Difficulty
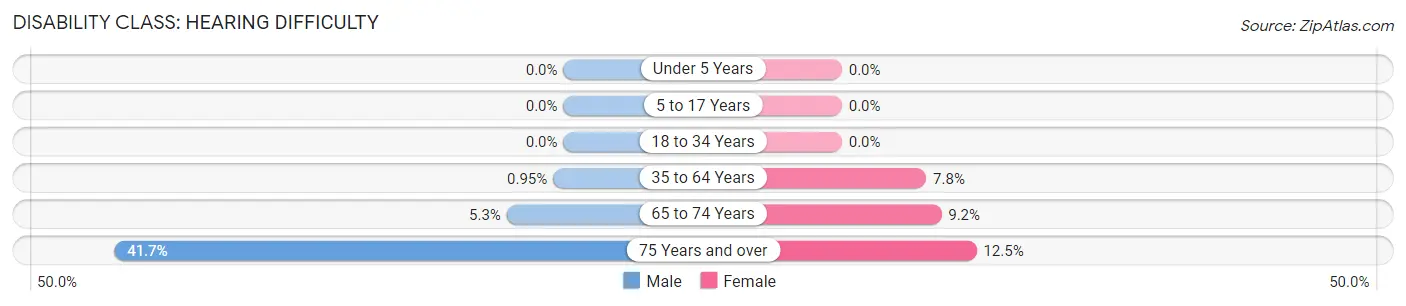
| Age Bracket | Male | Female |
| Under 5 Years | 0 (0.0%) | 0 (0.0%) |
| 5 to 17 Years | 0 (0.0%) | 0 (0.0%) |
| 18 to 34 Years | 0 (0.0%) | 0 (0.0%) |
| 35 to 64 Years | 2 (0.9%) | 13 (7.8%) |
| 65 to 74 Years | 3 (5.3%) | 6 (9.2%) |
| 75 Years and over | 10 (41.7%) | 6 (12.5%) |
Disability Class: Vision Difficulty
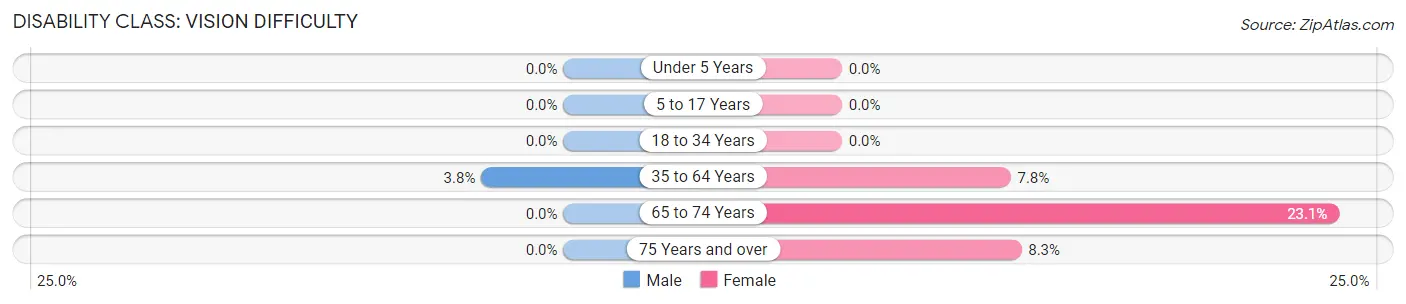
| Age Bracket | Male | Female |
| Under 5 Years | 0 (0.0%) | 0 (0.0%) |
| 5 to 17 Years | 0 (0.0%) | 0 (0.0%) |
| 18 to 34 Years | 0 (0.0%) | 0 (0.0%) |
| 35 to 64 Years | 8 (3.8%) | 13 (7.8%) |
| 65 to 74 Years | 0 (0.0%) | 15 (23.1%) |
| 75 Years and over | 0 (0.0%) | 4 (8.3%) |
Disability Class: Cognitive Difficulty
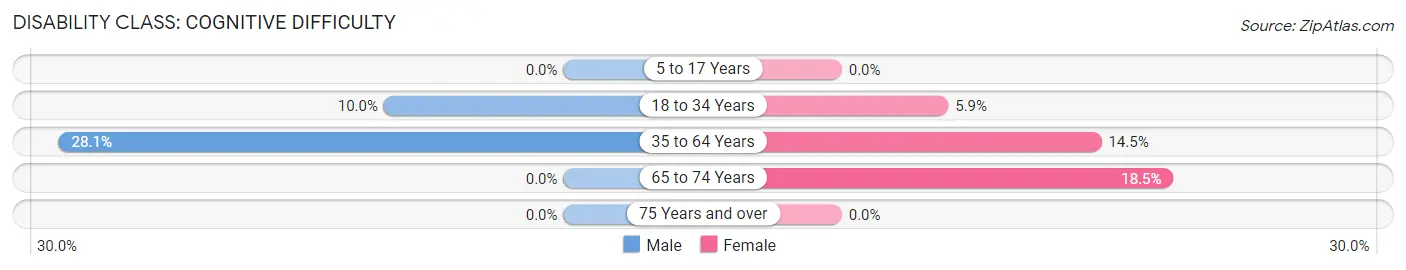
| Age Bracket | Male | Female |
| 5 to 17 Years | 0 (0.0%) | 0 (0.0%) |
| 18 to 34 Years | 10 (10.0%) | 8 (5.9%) |
| 35 to 64 Years | 59 (28.1%) | 24 (14.5%) |
| 65 to 74 Years | 0 (0.0%) | 12 (18.5%) |
| 75 Years and over | 0 (0.0%) | 0 (0.0%) |
Disability Class: Ambulatory Difficulty
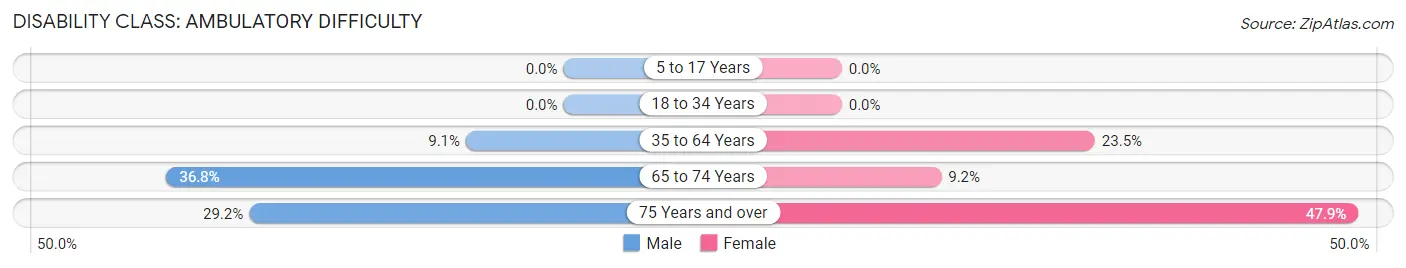
| Age Bracket | Male | Female |
| 5 to 17 Years | 0 (0.0%) | 0 (0.0%) |
| 18 to 34 Years | 0 (0.0%) | 0 (0.0%) |
| 35 to 64 Years | 19 (9.0%) | 39 (23.5%) |
| 65 to 74 Years | 21 (36.8%) | 6 (9.2%) |
| 75 Years and over | 7 (29.2%) | 23 (47.9%) |
Disability Class: Self-Care Difficulty
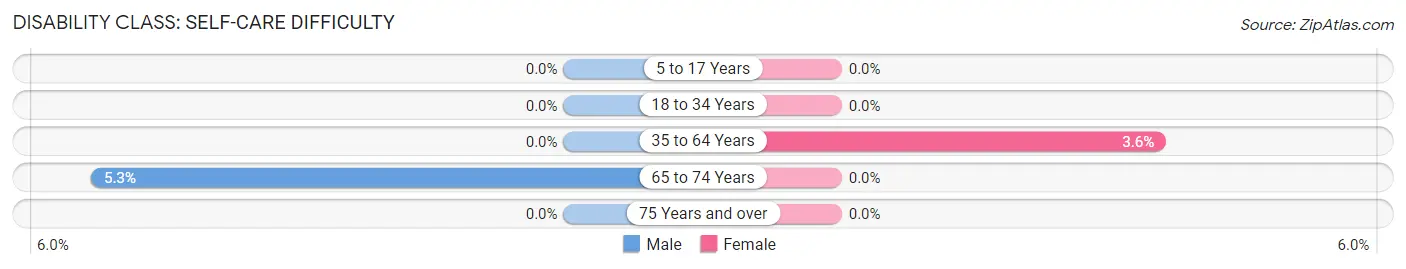
| Age Bracket | Male | Female |
| 5 to 17 Years | 0 (0.0%) | 0 (0.0%) |
| 18 to 34 Years | 0 (0.0%) | 0 (0.0%) |
| 35 to 64 Years | 0 (0.0%) | 6 (3.6%) |
| 65 to 74 Years | 3 (5.3%) | 0 (0.0%) |
| 75 Years and over | 0 (0.0%) | 0 (0.0%) |
Technology Access in Blades
Computing Device Access in Blades
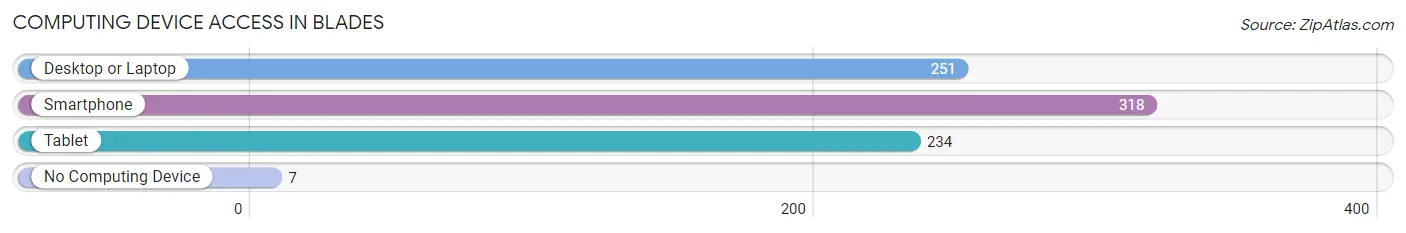
| Device Type | # Households | % Households |
| Desktop or Laptop | 251 | 69.0% |
| Smartphone | 318 | 87.4% |
| Tablet | 234 | 64.3% |
| No Computing Device | 7 | 1.9% |
| Total | 364 | 100.0% |
Internet Access in Blades
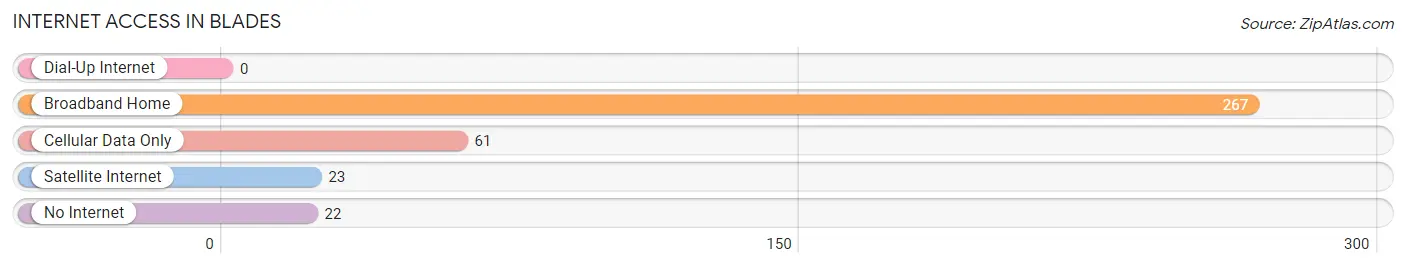
| Internet Type | # Households | % Households |
| Dial-Up Internet | 0 | 0.0% |
| Broadband Home | 267 | 73.4% |
| Cellular Data Only | 61 | 16.8% |
| Satellite Internet | 23 | 6.3% |
| No Internet | 22 | 6.0% |
| Total | 364 | 100.0% |
Blades Summary
The state of Delaware is located in the Mid-Atlantic region of the United States, and is the second smallest state in the country. It is bordered by Pennsylvania to the north, Maryland to the south and west, and the Atlantic Ocean to the east. Delaware is divided into three counties: New Castle, Kent, and Sussex. The state capital is Dover, and the largest city is Wilmington.
History
Delaware was first inhabited by Native American tribes, including the Lenape, Nanticoke, and Susquehannock. The first European settlers arrived in the early 1600s, and the area was claimed by the Dutch, Swedish, and English. In 1638, the Dutch founded the colony of New Netherland, which included parts of present-day Delaware. In 1664, the English took control of the area and renamed it the Delaware Colony.
In 1776, Delaware became the first state to ratify the United States Constitution, and was the first state to join the Union. During the American Civil War, Delaware remained in the Union, but was a border state and was the site of several battles. After the war, Delaware experienced a period of industrialization and economic growth.
Geography
Delaware is located in the Mid-Atlantic region of the United States, and is the second smallest state in the country. It is bordered by Pennsylvania to the north, Maryland to the south and west, and the Atlantic Ocean to the east. Delaware is divided into three counties: New Castle, Kent, and Sussex. The state capital is Dover, and the largest city is Wilmington.
Delaware is mostly flat, with rolling hills in the north and coastal plains in the south. The highest point in the state is Ebright Azimuth, at 447 feet above sea level. The state is home to several rivers, including the Delaware River, which forms the border with Pennsylvania and New Jersey.
Economy
Delaware has a diverse economy, with a mix of manufacturing, services, and agriculture. The state is home to several major corporations, including DuPont, AstraZeneca, and Bank of America. The state is also a major center for the chemical industry, and is home to several pharmaceutical companies.
Agriculture is an important part of the state’s economy, with poultry, dairy, and soybeans being the main products. Tourism is also a major industry, with visitors coming to the state to enjoy its beaches, parks, and historic sites.
Demographics
As of 2020, Delaware had an estimated population of 973,764. The state is racially diverse, with the largest racial group being White (62.3%), followed by Black or African American (22.2%), Hispanic or Latino (9.2%), and Asian (4.2%). The median household income in the state is $63,837, and the poverty rate is 11.2%.
Delaware is home to several major universities, including the University of Delaware, Delaware State University, and Wilmington University. The state is also home to several professional sports teams, including the Philadelphia Phillies, Philadelphia Eagles, and Wilmington Blue Rocks.
Common Questions
What is Per Capita Income in Blades?
Per Capita income in Blades is $26,045.
What is the Median Family Income in Blades?
Median Family Income in Blades is $70,265.
What is the Median Household income in Blades?
Median Household Income in Blades is $61,625.
What is Income or Wage Gap in Blades?
Income or Wage Gap in Blades is 18.4%.
Women in Blades earn 81.6 cents for every dollar earned by a man.
What is Inequality or Gini Index in Blades?
Inequality or Gini Index in Blades is 0.30.
What is the Total Population of Blades?
Total Population of Blades is 960.
What is the Total Male Population of Blades?
Total Male Population of Blades is 450.
What is the Total Female Population of Blades?
Total Female Population of Blades is 510.
What is the Ratio of Males per 100 Females in Blades?
There are 88.24 Males per 100 Females in Blades.
What is the Ratio of Females per 100 Males in Blades?
There are 113.33 Females per 100 Males in Blades.
What is the Median Population Age in Blades?
Median Population Age in Blades is 43.7 Years.
What is the Average Family Size in Blades
Average Family Size in Blades is 3.0 People.
What is the Average Household Size in Blades
Average Household Size in Blades is 2.6 People.
How Large is the Labor Force in Blades?
There are 480 People in the Labor Forcein in Blades.
What is the Percentage of People in the Labor Force in Blades?
59.1% of People are in the Labor Force in Blades.
What is the Unemployment Rate in Blades?
Unemployment Rate in Blades is 5.0%.