Bethany Beach, DE Map & Demographics
Bethany Beach Map
Bethany Beach Overview
$80,028
PER CAPITA INCOME
$135,417
AVG FAMILY INCOME
$104,167
AVG HOUSEHOLD INCOME
43.5%
WAGE / INCOME GAP [ % ]
56.5¢/ $1
WAGE / INCOME GAP [ $ ]
0.46
INEQUALITY / GINI INDEX
1,064
TOTAL POPULATION
480
MALE POPULATION
584
FEMALE POPULATION
82.19
MALES / 100 FEMALES
121.67
FEMALES / 100 MALES
66.8
MEDIAN AGE
2.4
AVG FAMILY SIZE
2.0
AVG HOUSEHOLD SIZE
400
LABOR FORCE [ PEOPLE ]
38.6%
PERCENT IN LABOR FORCE
2.3%
UNEMPLOYMENT RATE
Bethany Beach Zip Codes
Bethany Beach Area Codes
Income in Bethany Beach
Income Overview in Bethany Beach
Per Capita Income in Bethany Beach is $80,028, while median incomes of families and households are $135,417 and $104,167 respectively.
| Characteristic | Number | Measure |
| Per Capita Income | 1,064 | $80,028 |
| Median Family Income | 335 | $135,417 |
| Mean Family Income | 335 | $189,687 |
| Median Household Income | 522 | $104,167 |
| Mean Household Income | 522 | $157,568 |
| Income Deficit | 335 | $0 |
| Wage / Income Gap (%) | 1,064 | 43.45% |
| Wage / Income Gap ($) | 1,064 | 56.55¢ per $1 |
| Gini / Inequality Index | 1,064 | 0.46 |
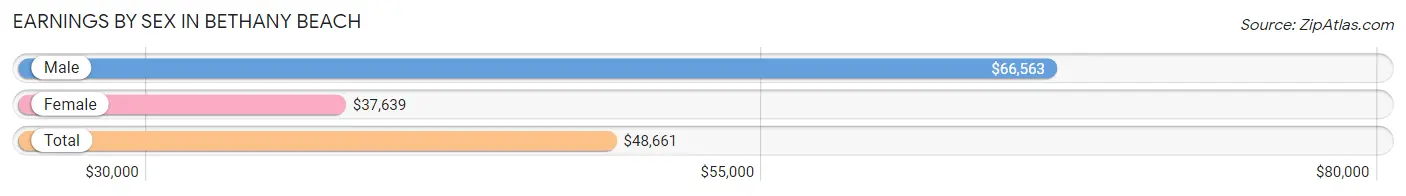
Earnings by Sex in Bethany Beach
Average Earnings in Bethany Beach are $48,661, $66,563 for men and $37,639 for women, a difference of 43.4%.
| Sex | Number | Average Earnings |
| Male | 246 (57.9%) | $66,563 |
| Female | 179 (42.1%) | $37,639 |
| Total | 425 (100.0%) | $48,661 |
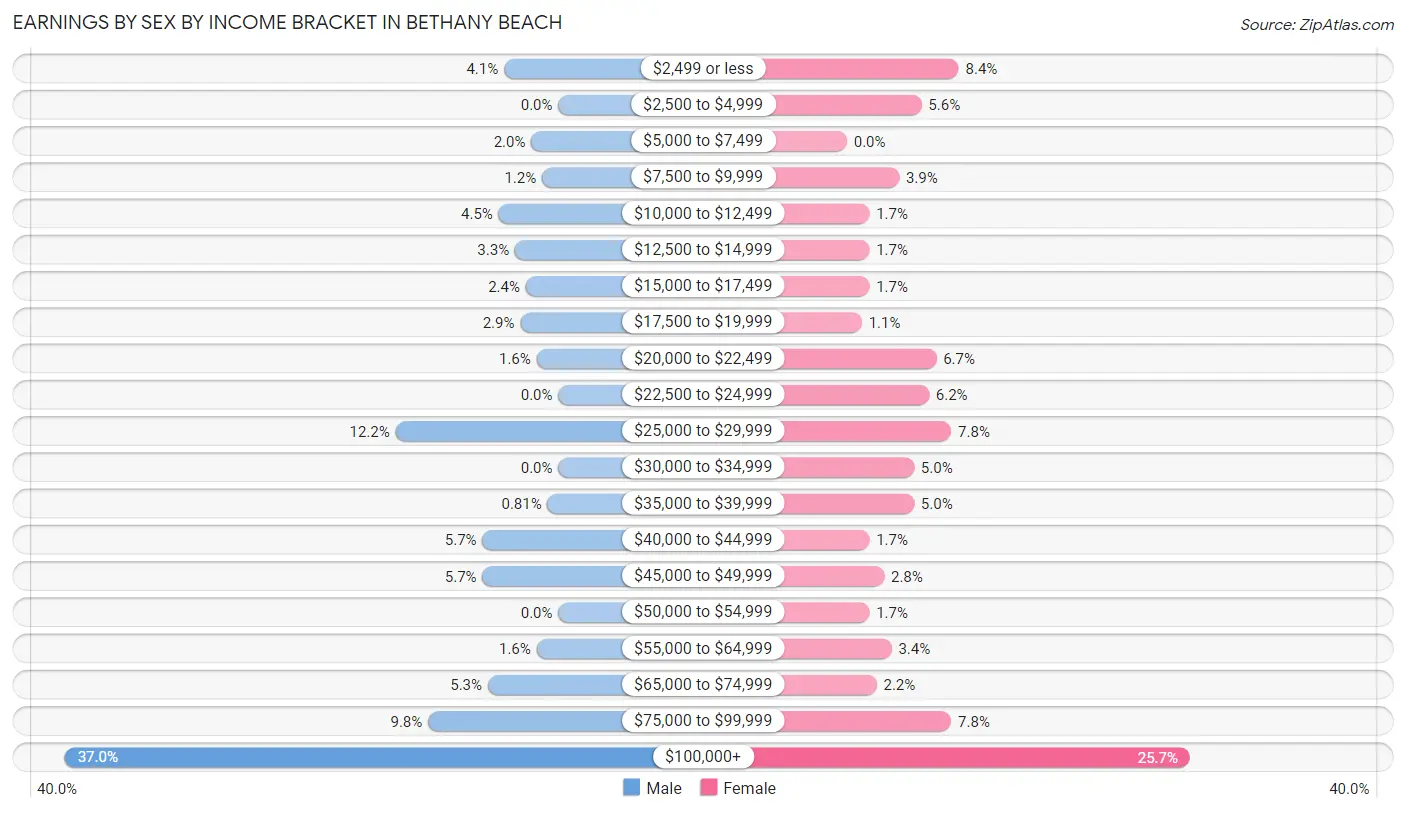
Earnings by Sex by Income Bracket in Bethany Beach
The most common earnings brackets in Bethany Beach are $100,000+ for men (91 | 37.0%) and $100,000+ for women (46 | 25.7%).
| Income | Male | Female |
| $2,499 or less | 10 (4.1%) | 15 (8.4%) |
| $2,500 to $4,999 | 0 (0.0%) | 10 (5.6%) |
| $5,000 to $7,499 | 5 (2.0%) | 0 (0.0%) |
| $7,500 to $9,999 | 3 (1.2%) | 7 (3.9%) |
| $10,000 to $12,499 | 11 (4.5%) | 3 (1.7%) |
| $12,500 to $14,999 | 8 (3.3%) | 3 (1.7%) |
| $15,000 to $17,499 | 6 (2.4%) | 3 (1.7%) |
| $17,500 to $19,999 | 7 (2.9%) | 2 (1.1%) |
| $20,000 to $22,499 | 4 (1.6%) | 12 (6.7%) |
| $22,500 to $24,999 | 0 (0.0%) | 11 (6.1%) |
| $25,000 to $29,999 | 30 (12.2%) | 14 (7.8%) |
| $30,000 to $34,999 | 0 (0.0%) | 9 (5.0%) |
| $35,000 to $39,999 | 2 (0.8%) | 9 (5.0%) |
| $40,000 to $44,999 | 14 (5.7%) | 3 (1.7%) |
| $45,000 to $49,999 | 14 (5.7%) | 5 (2.8%) |
| $50,000 to $54,999 | 0 (0.0%) | 3 (1.7%) |
| $55,000 to $64,999 | 4 (1.6%) | 6 (3.4%) |
| $65,000 to $74,999 | 13 (5.3%) | 4 (2.2%) |
| $75,000 to $99,999 | 24 (9.8%) | 14 (7.8%) |
| $100,000+ | 91 (37.0%) | 46 (25.7%) |
| Total | 246 (100.0%) | 179 (100.0%) |
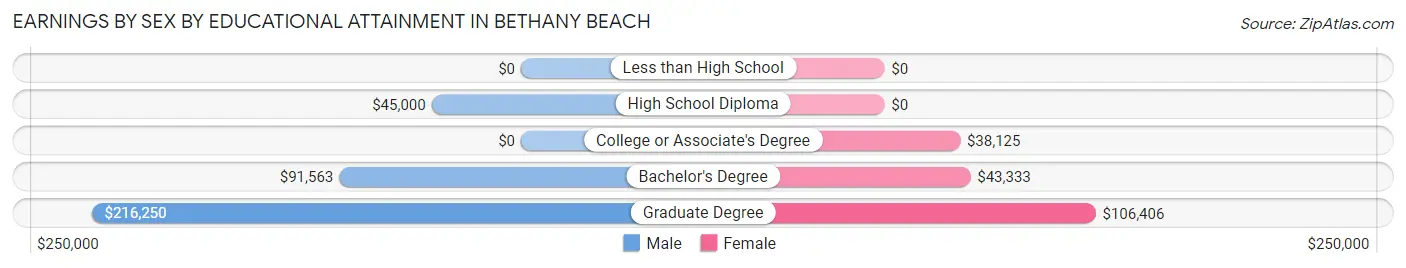
Earnings by Sex by Educational Attainment in Bethany Beach
Average earnings in Bethany Beach are $91,563 for men and $55,000 for women, a difference of 39.9%. Men with an educational attainment of graduate degree enjoy the highest average annual earnings of $216,250, while those with high school diploma education earn the least with $45,000. Women with an educational attainment of graduate degree earn the most with the average annual earnings of $106,406, while those with college or associate's degree education have the smallest earnings of $38,125.
| Educational Attainment | Male Income | Female Income |
| Less than High School | - | - |
| High School Diploma | $45,000 | $0 |
| College or Associate's Degree | - | - |
| Bachelor's Degree | $91,563 | $43,333 |
| Graduate Degree | $216,250 | $106,406 |
| Total | $91,563 | $55,000 |
Family Income in Bethany Beach
Family Income Brackets in Bethany Beach
According to the Bethany Beach family income data, there are 93 families falling into the $200,000+ income range, which is the most common income bracket and makes up 27.8% of all families.
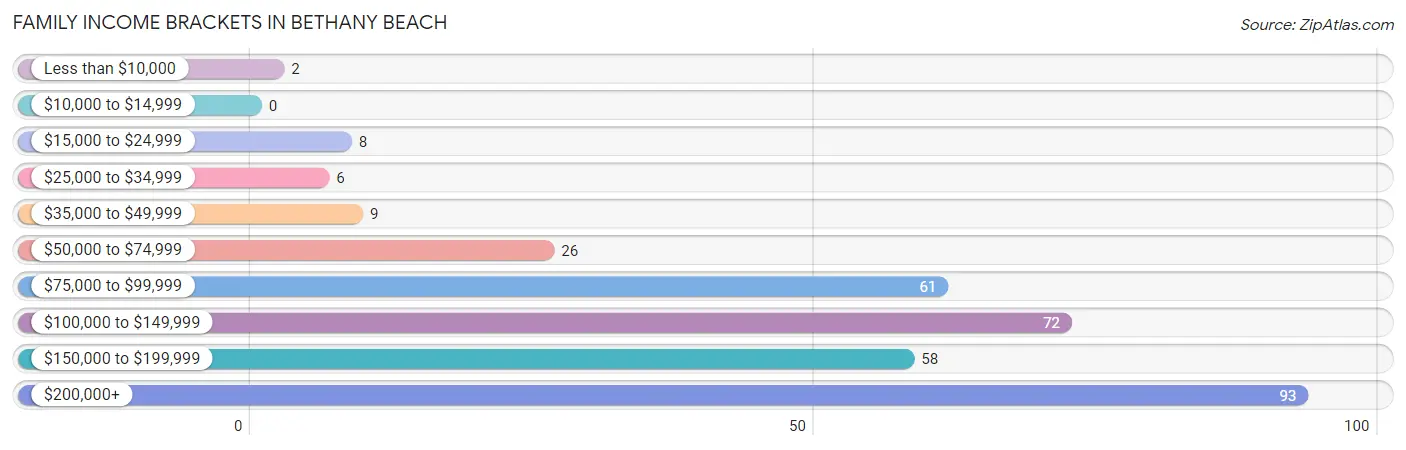
| Income Bracket | # Families | % Families |
| Less than $10,000 | 2 | 0.6% |
| $10,000 to $14,999 | 0 | 0.0% |
| $15,000 to $24,999 | 8 | 2.4% |
| $25,000 to $34,999 | 6 | 1.8% |
| $35,000 to $49,999 | 9 | 2.7% |
| $50,000 to $74,999 | 26 | 7.8% |
| $75,000 to $99,999 | 61 | 18.2% |
| $100,000 to $149,999 | 72 | 21.5% |
| $150,000 to $199,999 | 58 | 17.3% |
| $200,000+ | 93 | 27.8% |
Family Income by Famaliy Size in Bethany Beach
3-person families (56 | 16.7%) account for the highest median family income in Bethany Beach with $213,750 per family, while 3-person families (56 | 16.7%) have the highest median income of $71,250 per family member.
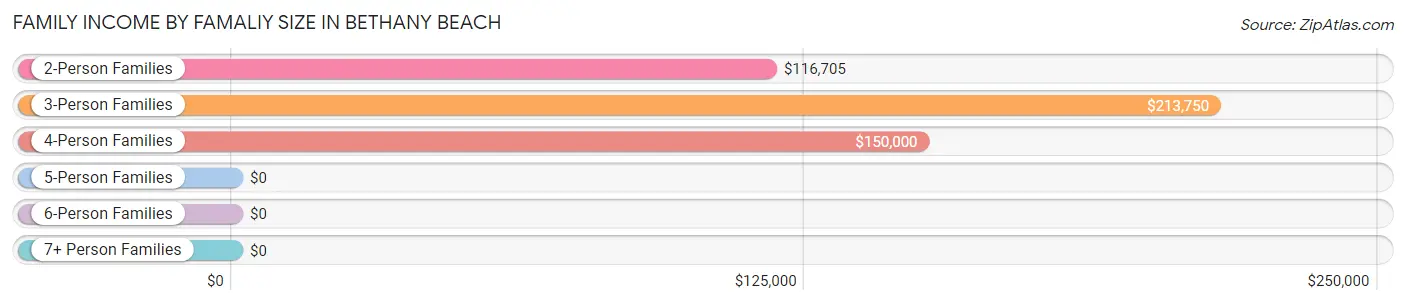
| Income Bracket | # Families | Median Income |
| 2-Person Families | 251 (74.9%) | $116,705 |
| 3-Person Families | 56 (16.7%) | $213,750 |
| 4-Person Families | 28 (8.4%) | $150,000 |
| 5-Person Families | 0 (0.0%) | $0 |
| 6-Person Families | 0 (0.0%) | $0 |
| 7+ Person Families | 0 (0.0%) | $0 |
| Total | 335 (100.0%) | $135,417 |
Family Income by Number of Earners in Bethany Beach
The median family income in Bethany Beach is $135,417, with families comprising 3+ earners (9) having the highest median family income of $250,001, while families with no earners (153) have the lowest median family income of $100,417, accounting for 2.7% and 45.7% of families, respectively.
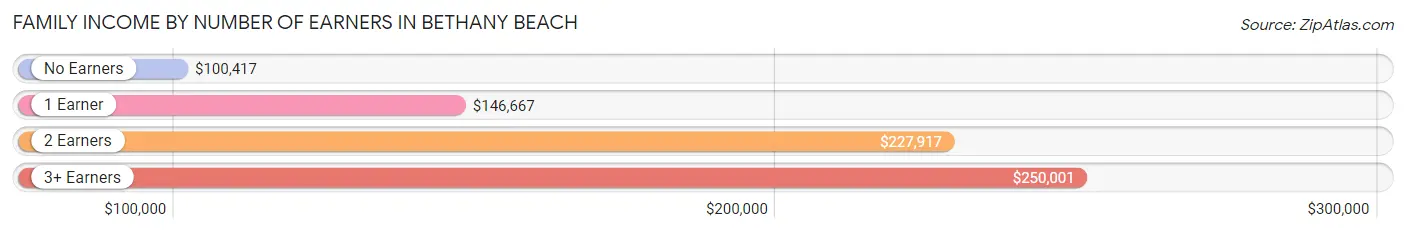
| Number of Earners | # Families | Median Income |
| No Earners | 153 (45.7%) | $100,417 |
| 1 Earner | 100 (29.8%) | $146,667 |
| 2 Earners | 73 (21.8%) | $227,917 |
| 3+ Earners | 9 (2.7%) | $250,001 |
| Total | 335 (100.0%) | $135,417 |
Household Income in Bethany Beach
Household Income Brackets in Bethany Beach
With 110 households falling in the category, the $200,000+ income range is the most frequent in Bethany Beach, accounting for 21.1% of all households. In contrast, only 3 households (0.6%) fall into the $10,000 to $14,999 income bracket, making it the least populous group.
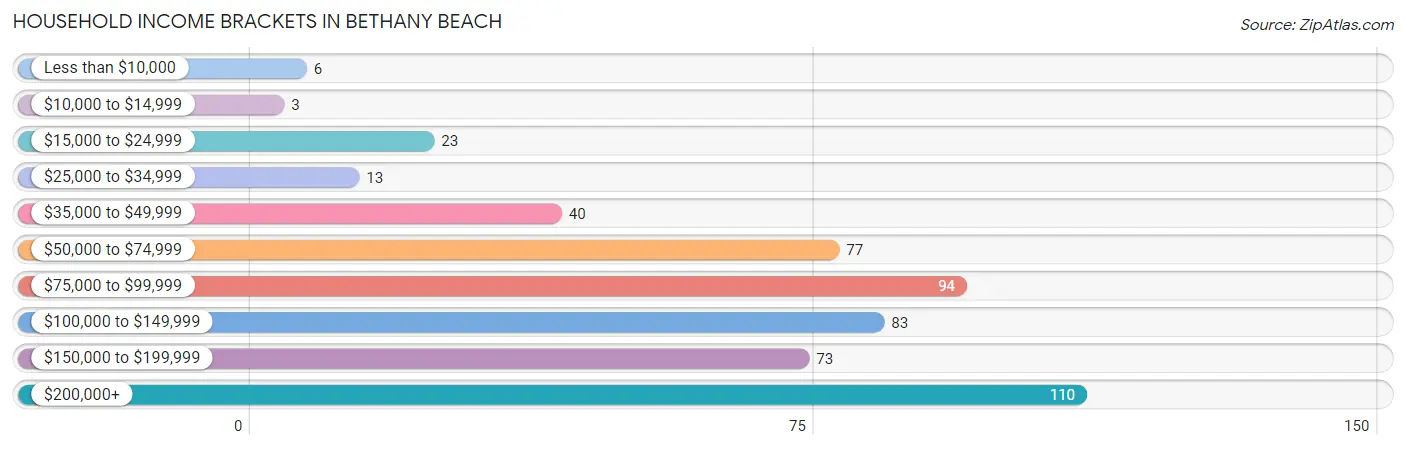
| Income Bracket | # Households | % Households |
| Less than $10,000 | 6 | 1.1% |
| $10,000 to $14,999 | 3 | 0.6% |
| $15,000 to $24,999 | 23 | 4.4% |
| $25,000 to $34,999 | 13 | 2.5% |
| $35,000 to $49,999 | 40 | 7.7% |
| $50,000 to $74,999 | 77 | 14.8% |
| $75,000 to $99,999 | 94 | 18.0% |
| $100,000 to $149,999 | 83 | 15.9% |
| $150,000 to $199,999 | 73 | 14.0% |
| $200,000+ | 110 | 21.1% |
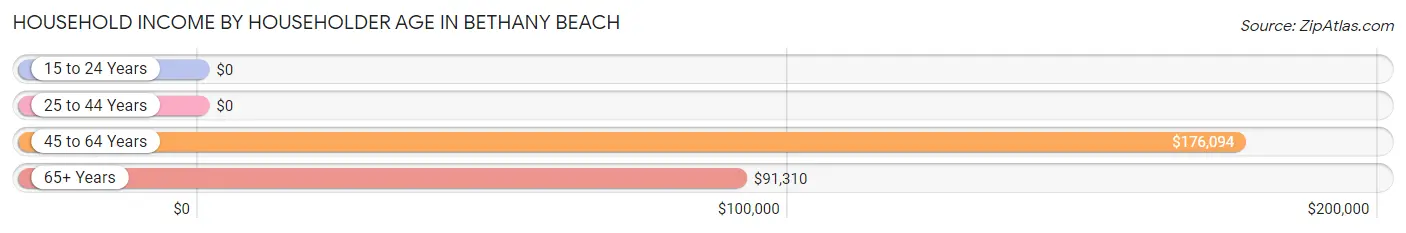
Household Income by Householder Age in Bethany Beach
The median household income in Bethany Beach is $104,167, with the highest median household income of $176,094 found in the 45 to 64 years age bracket for the primary householder. A total of 149 households (28.5%) fall into this category. Meanwhile, the 15 to 24 years age bracket for the primary householder has the lowest median household income of $0, with 2 households (0.4%) in this group.
| Income Bracket | # Households | Median Income |
| 15 to 24 Years | 2 (0.4%) | $0 |
| 25 to 44 Years | 15 (2.9%) | $0 |
| 45 to 64 Years | 149 (28.5%) | $176,094 |
| 65+ Years | 356 (68.2%) | $91,310 |
| Total | 522 (100.0%) | $104,167 |
Poverty in Bethany Beach
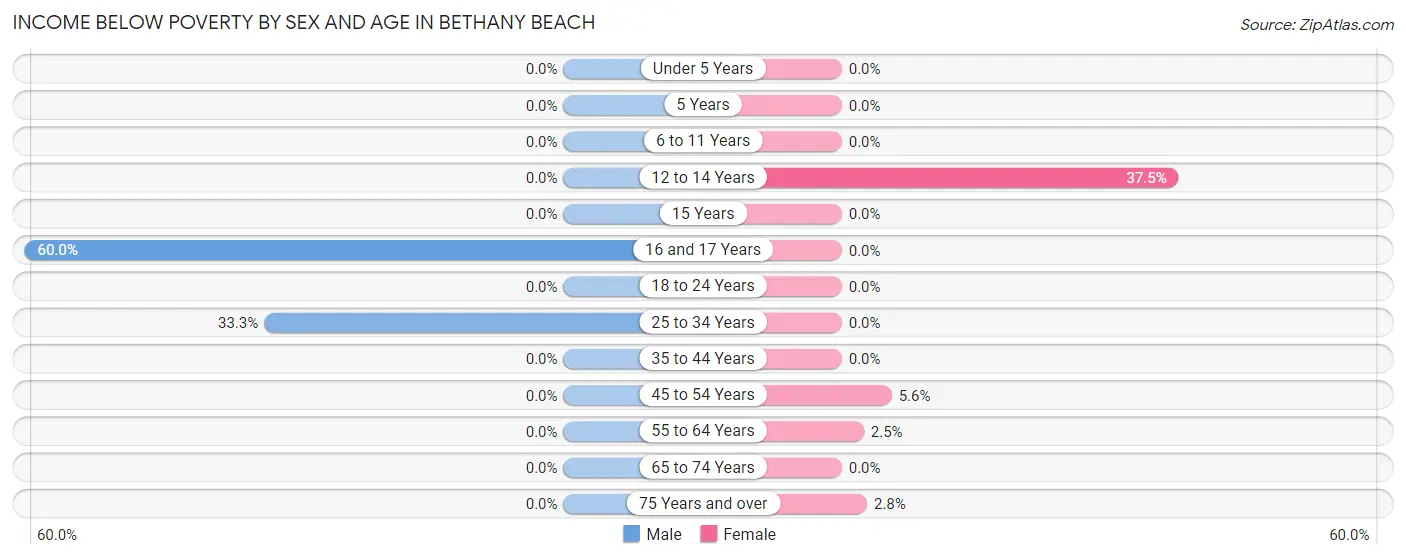
Income Below Poverty by Sex and Age in Bethany Beach
With 3.3% poverty level for males and 2.1% for females among the residents of Bethany Beach, 16 and 17 year old males and 12 to 14 year old females are the most vulnerable to poverty, with 3 males (60.0%) and 3 females (37.5%) in their respective age groups living below the poverty level.
| Age Bracket | Male | Female |
| Under 5 Years | 0 (0.0%) | 0 (0.0%) |
| 5 Years | 0 (0.0%) | 0 (0.0%) |
| 6 to 11 Years | 0 (0.0%) | 0 (0.0%) |
| 12 to 14 Years | 0 (0.0%) | 3 (37.5%) |
| 15 Years | 0 (0.0%) | 0 (0.0%) |
| 16 and 17 Years | 3 (60.0%) | 0 (0.0%) |
| 18 to 24 Years | 0 (0.0%) | 0 (0.0%) |
| 25 to 34 Years | 13 (33.3%) | 0 (0.0%) |
| 35 to 44 Years | 0 (0.0%) | 0 (0.0%) |
| 45 to 54 Years | 0 (0.0%) | 2 (5.6%) |
| 55 to 64 Years | 0 (0.0%) | 3 (2.5%) |
| 65 to 74 Years | 0 (0.0%) | 0 (0.0%) |
| 75 Years and over | 0 (0.0%) | 4 (2.8%) |
| Total | 16 (3.3%) | 12 (2.1%) |
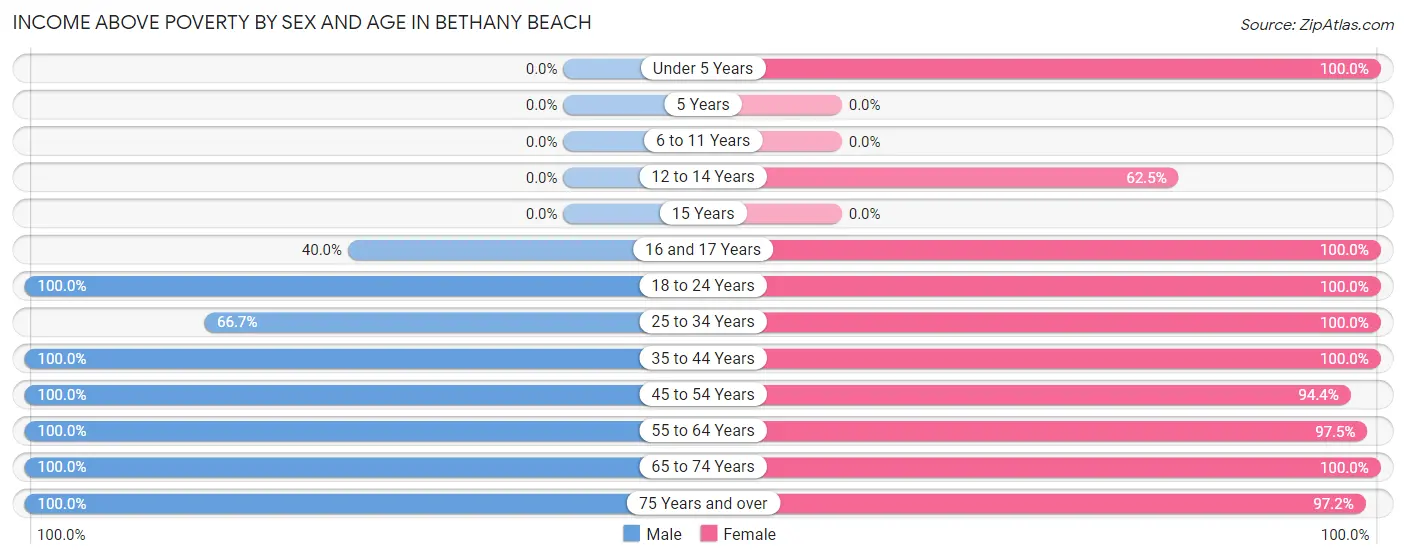
Income Above Poverty by Sex and Age in Bethany Beach
According to the poverty statistics in Bethany Beach, males aged 18 to 24 years and females aged under 5 years are the age groups that are most secure financially, with 100.0% of males and 100.0% of females in these age groups living above the poverty line.
| Age Bracket | Male | Female |
| Under 5 Years | 0 (0.0%) | 19 (100.0%) |
| 5 Years | 0 (0.0%) | 0 (0.0%) |
| 6 to 11 Years | 0 (0.0%) | 0 (0.0%) |
| 12 to 14 Years | 0 (0.0%) | 5 (62.5%) |
| 15 Years | 0 (0.0%) | 0 (0.0%) |
| 16 and 17 Years | 2 (40.0%) | 8 (100.0%) |
| 18 to 24 Years | 38 (100.0%) | 56 (100.0%) |
| 25 to 34 Years | 26 (66.7%) | 22 (100.0%) |
| 35 to 44 Years | 10 (100.0%) | 8 (100.0%) |
| 45 to 54 Years | 29 (100.0%) | 34 (94.4%) |
| 55 to 64 Years | 72 (100.0%) | 119 (97.5%) |
| 65 to 74 Years | 186 (100.0%) | 162 (100.0%) |
| 75 Years and over | 101 (100.0%) | 139 (97.2%) |
| Total | 464 (96.7%) | 572 (98.0%) |
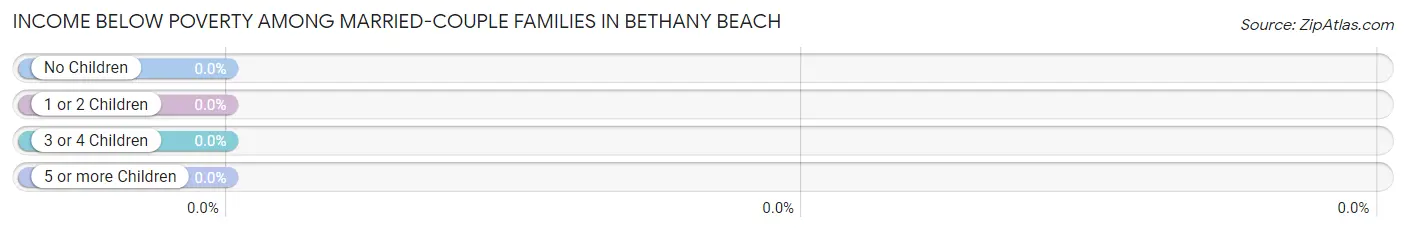
Income Below Poverty Among Married-Couple Families in Bethany Beach
| Children | Above Poverty | Below Poverty |
| No Children | 286 (100.0%) | 0 (0.0%) |
| 1 or 2 Children | 30 (100.0%) | 0 (0.0%) |
| 3 or 4 Children | 0 (0.0%) | 0 (0.0%) |
| 5 or more Children | 0 (0.0%) | 0 (0.0%) |
| Total | 316 (100.0%) | 0 (0.0%) |
Income Below Poverty Among Single-Parent Households in Bethany Beach
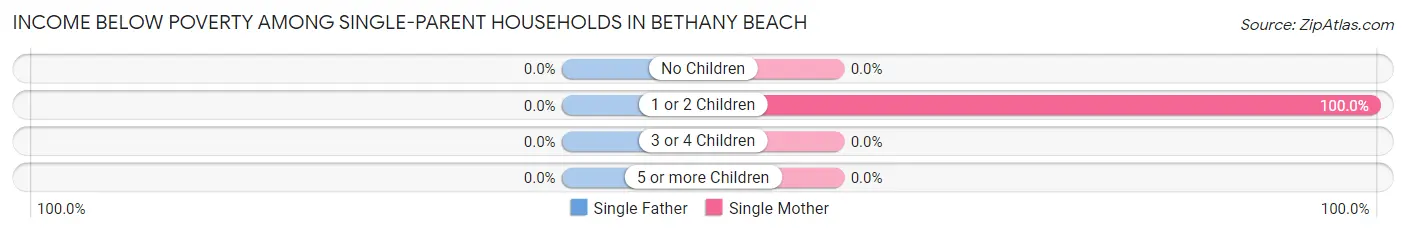
| Children | Single Father | Single Mother |
| No Children | 0 (0.0%) | 0 (0.0%) |
| 1 or 2 Children | 0 (0.0%) | 2 (100.0%) |
| 3 or 4 Children | 0 (0.0%) | 0 (0.0%) |
| 5 or more Children | 0 (0.0%) | 0 (0.0%) |
| Total | 0 (0.0%) | 2 (11.8%) |
Income Below Poverty Among Married-Couple vs Single-Parent Households in Bethany Beach
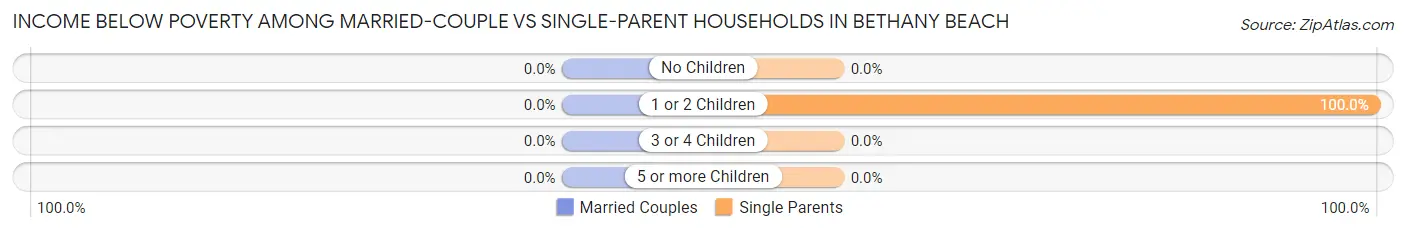
| Children | Married-Couple Families | Single-Parent Households |
| No Children | 0 (0.0%) | 0 (0.0%) |
| 1 or 2 Children | 0 (0.0%) | 2 (100.0%) |
| 3 or 4 Children | 0 (0.0%) | 0 (0.0%) |
| 5 or more Children | 0 (0.0%) | 0 (0.0%) |
| Total | 0 (0.0%) | 2 (10.5%) |
Race in Bethany Beach
The most populous races in Bethany Beach are White / Caucasian (991 | 93.1%), Asian (62 | 5.8%), and Hispanic or Latino (19 | 1.8%).
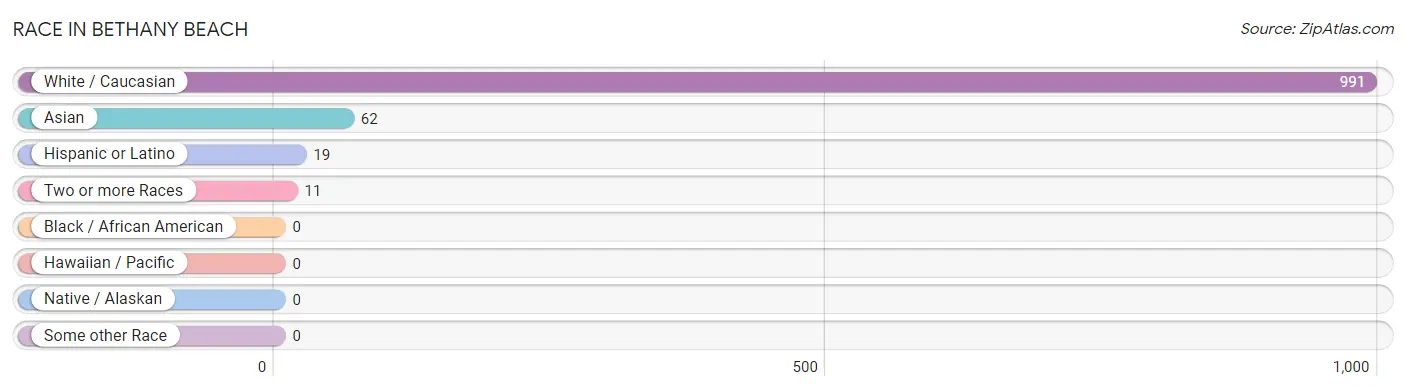
| Race | # Population | % Population |
| Asian | 62 | 5.8% |
| Black / African American | 0 | 0.0% |
| Hawaiian / Pacific | 0 | 0.0% |
| Hispanic or Latino | 19 | 1.8% |
| Native / Alaskan | 0 | 0.0% |
| White / Caucasian | 991 | 93.1% |
| Two or more Races | 11 | 1.0% |
| Some other Race | 0 | 0.0% |
| Total | 1,064 | 100.0% |
Ancestry in Bethany Beach
The most populous ancestries reported in Bethany Beach are Irish (309 | 29.0%), German (212 | 19.9%), English (158 | 14.8%), Italian (88 | 8.3%), and Polish (55 | 5.2%), together accounting for 77.2% of all Bethany Beach residents.
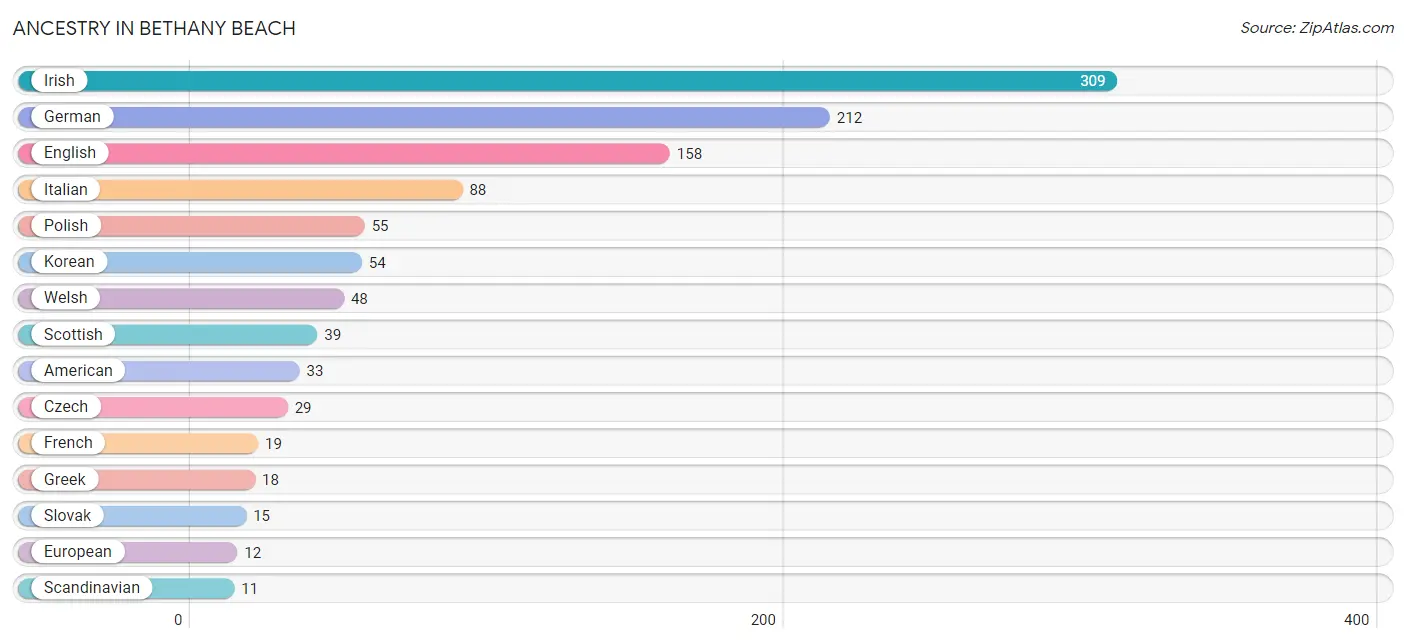
| Ancestry | # Population | % Population |
| American | 33 | 3.1% |
| Arab | 2 | 0.2% |
| Belgian | 3 | 0.3% |
| Bhutanese | 8 | 0.7% |
| British | 3 | 0.3% |
| Cuban | 7 | 0.7% |
| Czech | 29 | 2.7% |
| Dutch | 6 | 0.6% |
| Eastern European | 3 | 0.3% |
| English | 158 | 14.8% |
| European | 12 | 1.1% |
| French | 19 | 1.8% |
| French Canadian | 3 | 0.3% |
| German | 212 | 19.9% |
| Greek | 18 | 1.7% |
| Hungarian | 3 | 0.3% |
| Indian (Asian) | 3 | 0.3% |
| Iranian | 3 | 0.3% |
| Irish | 309 | 29.0% |
| Italian | 88 | 8.3% |
| Korean | 54 | 5.1% |
| Lebanese | 2 | 0.2% |
| Mexican | 10 | 0.9% |
| Northern European | 2 | 0.2% |
| Polish | 55 | 5.2% |
| Puerto Rican | 2 | 0.2% |
| Russian | 6 | 0.6% |
| Scandinavian | 11 | 1.0% |
| Scotch-Irish | 6 | 0.6% |
| Scottish | 39 | 3.7% |
| Slavic | 4 | 0.4% |
| Slovak | 15 | 1.4% |
| Swedish | 5 | 0.5% |
| Thai | 3 | 0.3% |
| Welsh | 48 | 4.5% | View All 35 Rows |
Immigrants in Bethany Beach
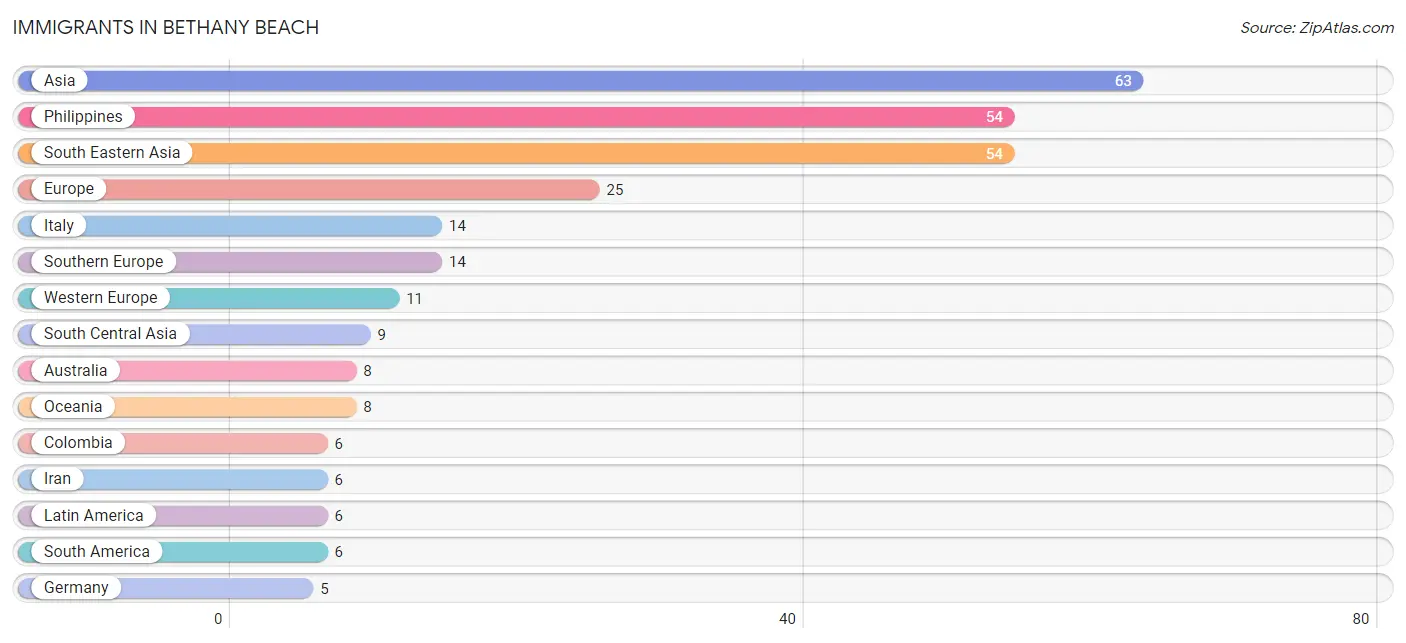
The most numerous immigrant groups reported in Bethany Beach came from Asia (63 | 5.9%), Philippines (54 | 5.1%), South Eastern Asia (54 | 5.1%), Europe (25 | 2.4%), and Italy (14 | 1.3%), together accounting for 19.7% of all Bethany Beach residents.
| Immigration Origin | # Population | % Population |
| Asia | 63 | 5.9% |
| Australia | 8 | 0.7% |
| Belgium | 3 | 0.3% |
| Canada | 3 | 0.3% |
| Colombia | 6 | 0.6% |
| Europe | 25 | 2.4% |
| France | 3 | 0.3% |
| Germany | 5 | 0.5% |
| India | 3 | 0.3% |
| Iran | 6 | 0.6% |
| Italy | 14 | 1.3% |
| Latin America | 6 | 0.6% |
| Oceania | 8 | 0.7% |
| Philippines | 54 | 5.1% |
| South America | 6 | 0.6% |
| South Central Asia | 9 | 0.9% |
| South Eastern Asia | 54 | 5.1% |
| Southern Europe | 14 | 1.3% |
| Western Europe | 11 | 1.0% | View All 19 Rows |
Sex and Age in Bethany Beach
Sex and Age in Bethany Beach
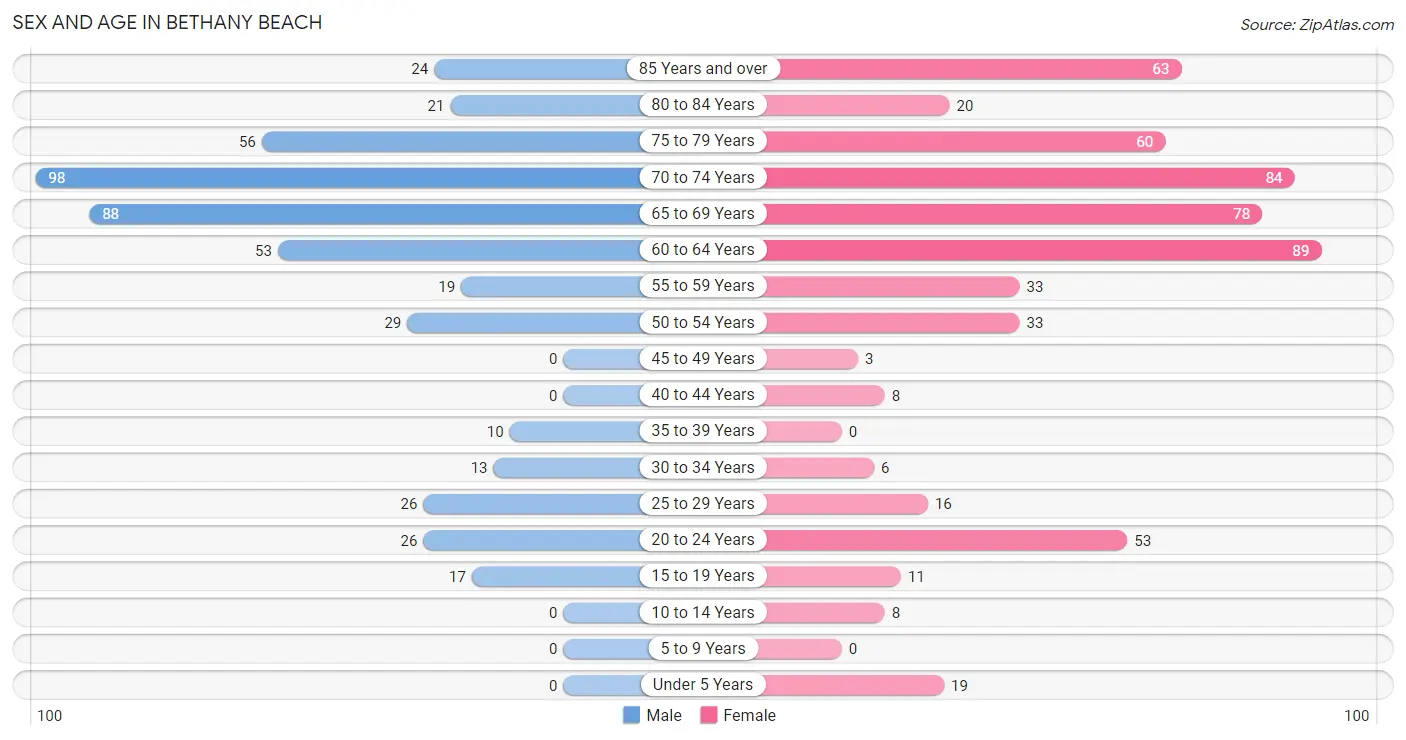
The most populous age groups in Bethany Beach are 70 to 74 Years (98 | 20.4%) for men and 60 to 64 Years (89 | 15.2%) for women.
| Age Bracket | Male | Female |
| Under 5 Years | 0 (0.0%) | 19 (3.3%) |
| 5 to 9 Years | 0 (0.0%) | 0 (0.0%) |
| 10 to 14 Years | 0 (0.0%) | 8 (1.4%) |
| 15 to 19 Years | 17 (3.5%) | 11 (1.9%) |
| 20 to 24 Years | 26 (5.4%) | 53 (9.1%) |
| 25 to 29 Years | 26 (5.4%) | 16 (2.7%) |
| 30 to 34 Years | 13 (2.7%) | 6 (1.0%) |
| 35 to 39 Years | 10 (2.1%) | 0 (0.0%) |
| 40 to 44 Years | 0 (0.0%) | 8 (1.4%) |
| 45 to 49 Years | 0 (0.0%) | 3 (0.5%) |
| 50 to 54 Years | 29 (6.0%) | 33 (5.7%) |
| 55 to 59 Years | 19 (4.0%) | 33 (5.7%) |
| 60 to 64 Years | 53 (11.0%) | 89 (15.2%) |
| 65 to 69 Years | 88 (18.3%) | 78 (13.4%) |
| 70 to 74 Years | 98 (20.4%) | 84 (14.4%) |
| 75 to 79 Years | 56 (11.7%) | 60 (10.3%) |
| 80 to 84 Years | 21 (4.4%) | 20 (3.4%) |
| 85 Years and over | 24 (5.0%) | 63 (10.8%) |
| Total | 480 (100.0%) | 584 (100.0%) |
Families and Households in Bethany Beach
Median Family Size in Bethany Beach
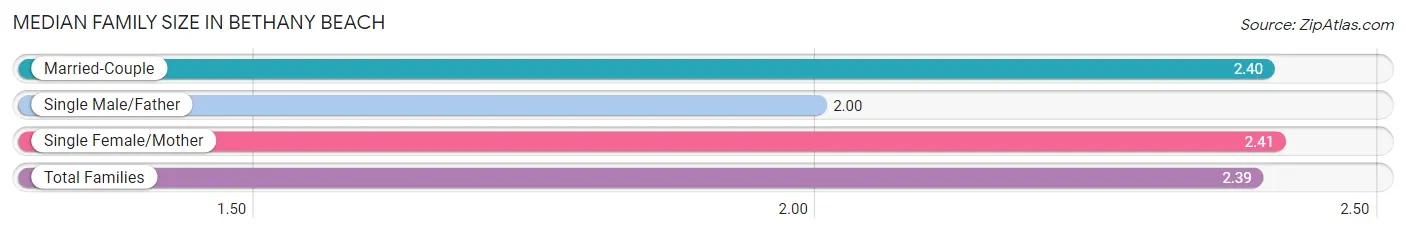
The median family size in Bethany Beach is 2.39 persons per family, with single female/mother families (17 | 5.1%) accounting for the largest median family size of 2.41 persons per family. On the other hand, single male/father families (2 | 0.6%) represent the smallest median family size with 2.00 persons per family.
| Family Type | # Families | Family Size |
| Married-Couple | 316 (94.3%) | 2.40 |
| Single Male/Father | 2 (0.6%) | 2.00 |
| Single Female/Mother | 17 (5.1%) | 2.41 |
| Total Families | 335 (100.0%) | 2.39 |
Median Household Size in Bethany Beach
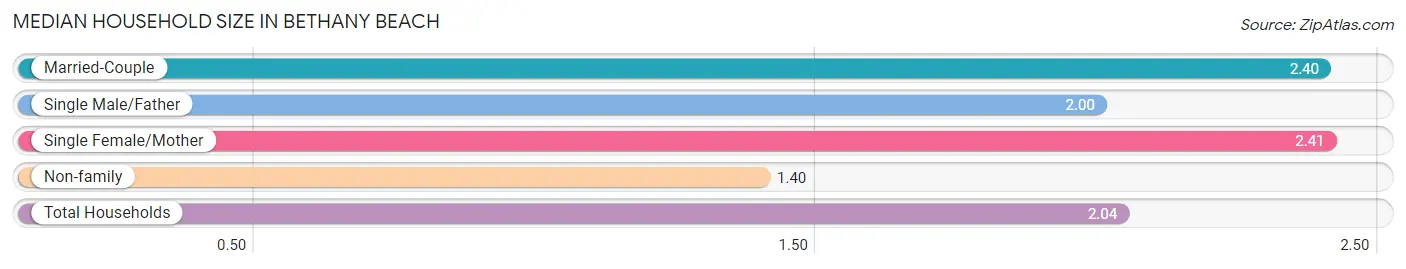
The median household size in Bethany Beach is 2.04 persons per household, with single female/mother households (17 | 3.3%) accounting for the largest median household size of 2.41 persons per household. non-family households (187 | 35.8%) represent the smallest median household size with 1.40 persons per household.
| Household Type | # Households | Household Size |
| Married-Couple | 316 (60.5%) | 2.40 |
| Single Male/Father | 2 (0.4%) | 2.00 |
| Single Female/Mother | 17 (3.3%) | 2.41 |
| Non-family | 187 (35.8%) | 1.40 |
| Total Households | 522 (100.0%) | 2.04 |
Household Size by Marriage Status in Bethany Beach
Out of a total of 522 households in Bethany Beach, 335 (64.2%) are family households, while 187 (35.8%) are nonfamily households. The most numerous type of family households are 2-person households, comprising 251, and the most common type of nonfamily households are 1-person households, comprising 165.
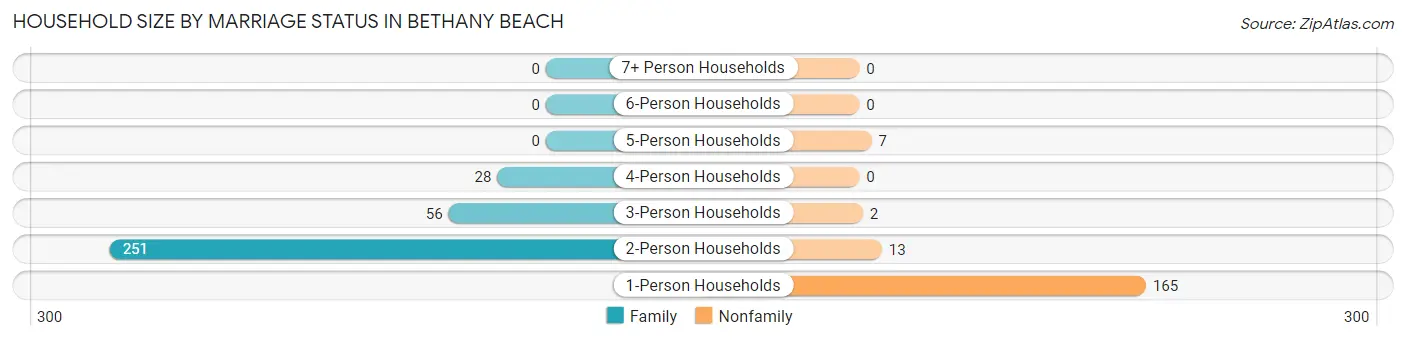
| Household Size | Family Households | Nonfamily Households |
| 1-Person Households | - | 165 (31.6%) |
| 2-Person Households | 251 (48.1%) | 13 (2.5%) |
| 3-Person Households | 56 (10.7%) | 2 (0.4%) |
| 4-Person Households | 28 (5.4%) | 0 (0.0%) |
| 5-Person Households | 0 (0.0%) | 7 (1.3%) |
| 6-Person Households | 0 (0.0%) | 0 (0.0%) |
| 7+ Person Households | 0 (0.0%) | 0 (0.0%) |
| Total | 335 (64.2%) | 187 (35.8%) |
Female Fertility in Bethany Beach
Fertility by Age in Bethany Beach
| Age Bracket | Women with Births | Births / 1,000 Women |
| 15 to 19 years | 0 (0.0%) | 0.0 |
| 20 to 34 years | 0 (0.0%) | 0.0 |
| 35 to 50 years | 0 (0.0%) | 0.0 |
| Total | 0 (0.0%) | 0.0 |
Fertility by Age by Marriage Status in Bethany Beach
| Age Bracket | Married | Unmarried |
| 15 to 19 years | 0 (0.0%) | 0 (0.0%) |
| 20 to 34 years | 0 (0.0%) | 0 (0.0%) |
| 35 to 50 years | 0 (0.0%) | 0 (0.0%) |
| Total | 0 (0.0%) | 0 (0.0%) |
Fertility by Education in Bethany Beach
| Educational Attainment | Women with Births | Births / 1,000 Women |
| Less than High School | 0 (0.0%) | 0.0 |
| High School Diploma | 0 (0.0%) | 0.0 |
| College or Associate's Degree | 0 (0.0%) | 0.0 |
| Bachelor's Degree | 0 (0.0%) | 0.0 |
| Graduate Degree | 0 (0.0%) | 0.0 |
| Total | 0 (0.0%) | 0.0 |
Fertility by Education by Marriage Status in Bethany Beach
| Educational Attainment | Married | Unmarried |
| Less than High School | 0 (0.0%) | 0 (0.0%) |
| High School Diploma | 0 (0.0%) | 0 (0.0%) |
| College or Associate's Degree | 0 (0.0%) | 0 (0.0%) |
| Bachelor's Degree | 0 (0.0%) | 0 (0.0%) |
| Graduate Degree | 0 (0.0%) | 0 (0.0%) |
| Total | 0 (0.0%) | 0 (0.0%) |
Employment Characteristics in Bethany Beach
Employment by Class of Employer in Bethany Beach
Among the 388 employed individuals in Bethany Beach, private company employees (269 | 69.3%), self-employed (not incorporated) (38 | 9.8%), and self-employed (incorporated) (25 | 6.4%) make up the most common classes of employment.
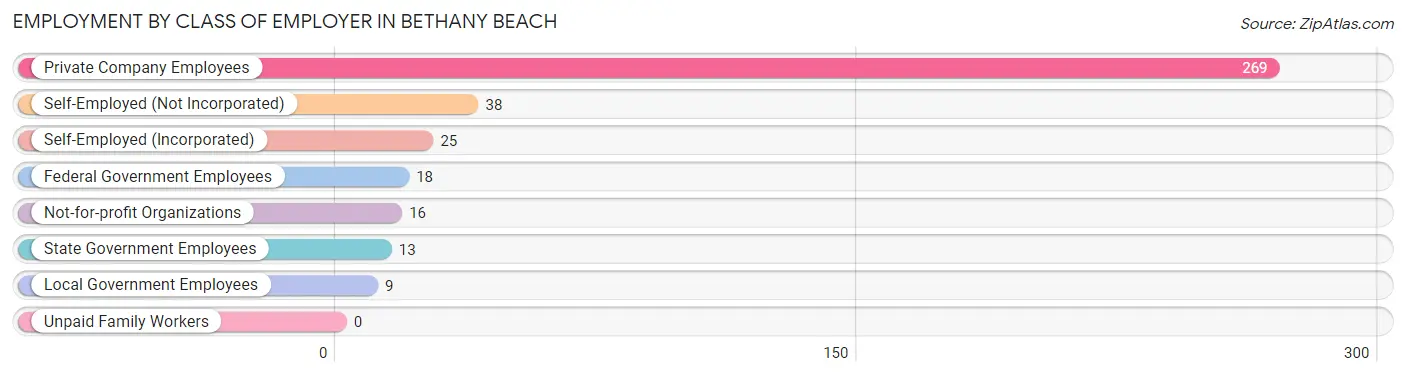
| Employer Class | # Employees | % Employees |
| Private Company Employees | 269 | 69.3% |
| Self-Employed (Incorporated) | 25 | 6.4% |
| Self-Employed (Not Incorporated) | 38 | 9.8% |
| Not-for-profit Organizations | 16 | 4.1% |
| Local Government Employees | 9 | 2.3% |
| State Government Employees | 13 | 3.4% |
| Federal Government Employees | 18 | 4.6% |
| Unpaid Family Workers | 0 | 0.0% |
| Total | 388 | 100.0% |
Employment Status by Age in Bethany Beach
According to the labor force statistics for Bethany Beach, out of the total population over 16 years of age (1,037), 38.6% or 400 individuals are in the labor force, with 2.3% or 9 of them unemployed. The age group with the highest labor force participation rate is 25 to 29 years, with 100.0% or 42 individuals in the labor force. Within the labor force, the 30 to 34 years age range has the highest percentage of unemployed individuals, with 31.6% or 6 of them being unemployed.
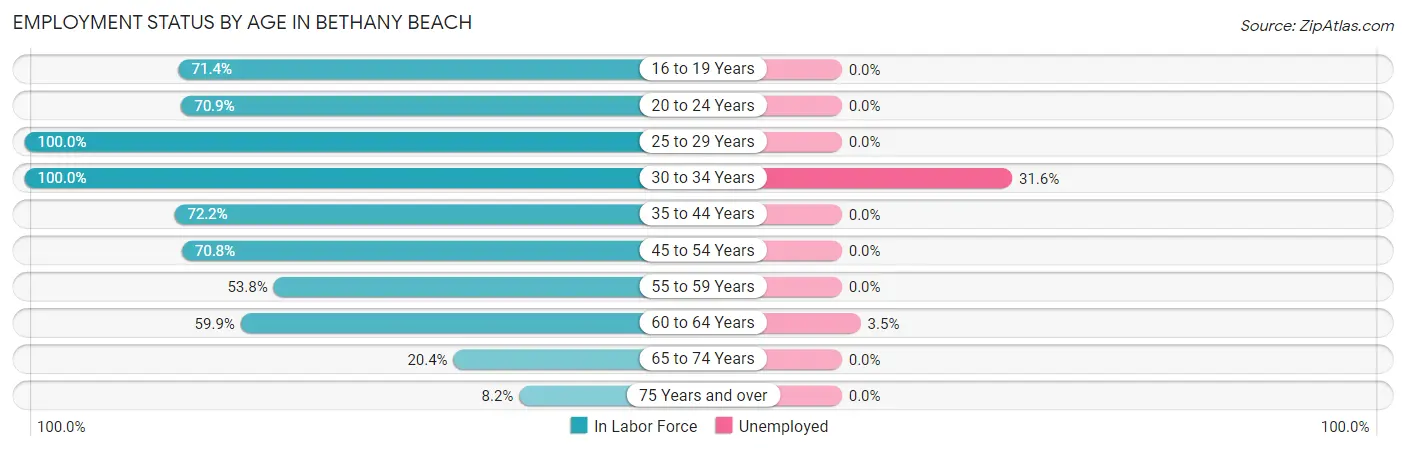
| Age Bracket | In Labor Force | Unemployed |
| 16 to 19 Years | 20 (71.4%) | 0 (0.0%) |
| 20 to 24 Years | 56 (70.9%) | 0 (0.0%) |
| 25 to 29 Years | 42 (100.0%) | 0 (0.0%) |
| 30 to 34 Years | 19 (100.0%) | 6 (31.6%) |
| 35 to 44 Years | 13 (72.2%) | 0 (0.0%) |
| 45 to 54 Years | 46 (70.8%) | 0 (0.0%) |
| 55 to 59 Years | 28 (53.8%) | 0 (0.0%) |
| 60 to 64 Years | 85 (59.9%) | 3 (3.5%) |
| 65 to 74 Years | 71 (20.4%) | 0 (0.0%) |
| 75 Years and over | 20 (8.2%) | 0 (0.0%) |
| Total | 400 (38.6%) | 9 (2.3%) |
Employment Status by Educational Attainment in Bethany Beach
According to labor force statistics for Bethany Beach, 68.9% of individuals (233) out of the total population between 25 and 64 years of age (338) are in the labor force, with 3.9% or 9 of them being unemployed. The group with the highest labor force participation rate are those with the educational attainment of college / associate degree, with 75.0% or 42 individuals in the labor force. Within the labor force, individuals with less than high school education have the highest percentage of unemployment, with 75.0% or 6 of them being unemployed.
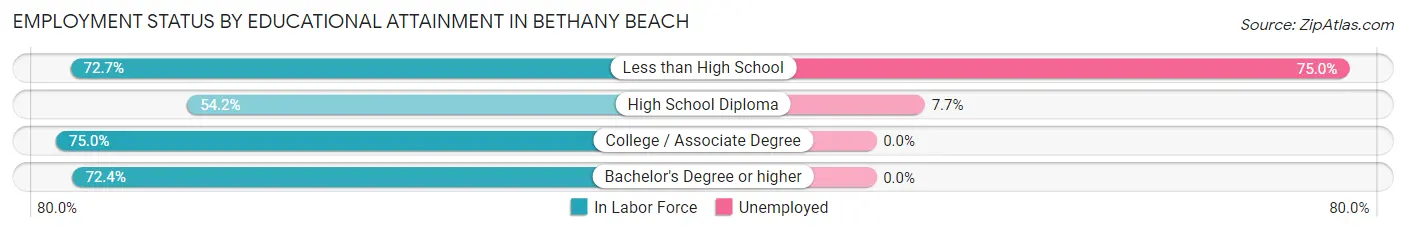
| Educational Attainment | In Labor Force | Unemployed |
| Less than High School | 8 (72.7%) | 8 (75.0%) |
| High School Diploma | 39 (54.2%) | 6 (7.7%) |
| College / Associate Degree | 42 (75.0%) | 0 (0.0%) |
| Bachelor's Degree or higher | 144 (72.4%) | 0 (0.0%) |
| Total | 233 (68.9%) | 13 (3.9%) |
Employment Occupations by Sex in Bethany Beach
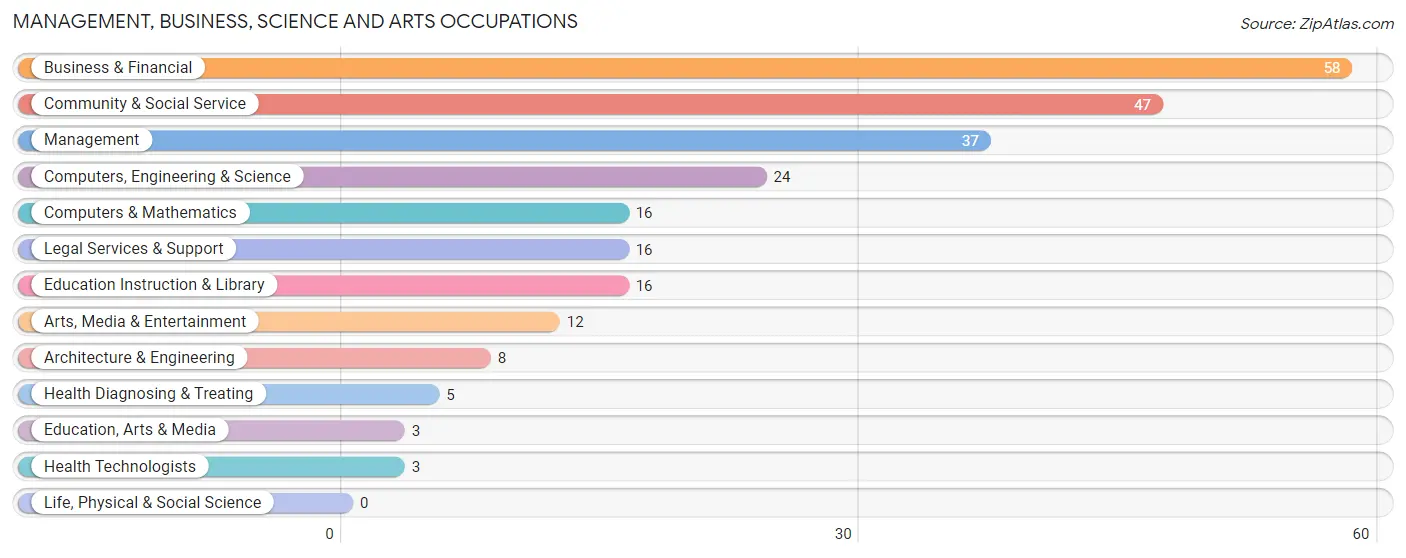
Management, Business, Science and Arts Occupations
The most common Management, Business, Science and Arts occupations in Bethany Beach are Business & Financial (58 | 14.8%), Community & Social Service (47 | 12.0%), Management (37 | 9.5%), Computers, Engineering & Science (24 | 6.1%), and Computers & Mathematics (16 | 4.1%).
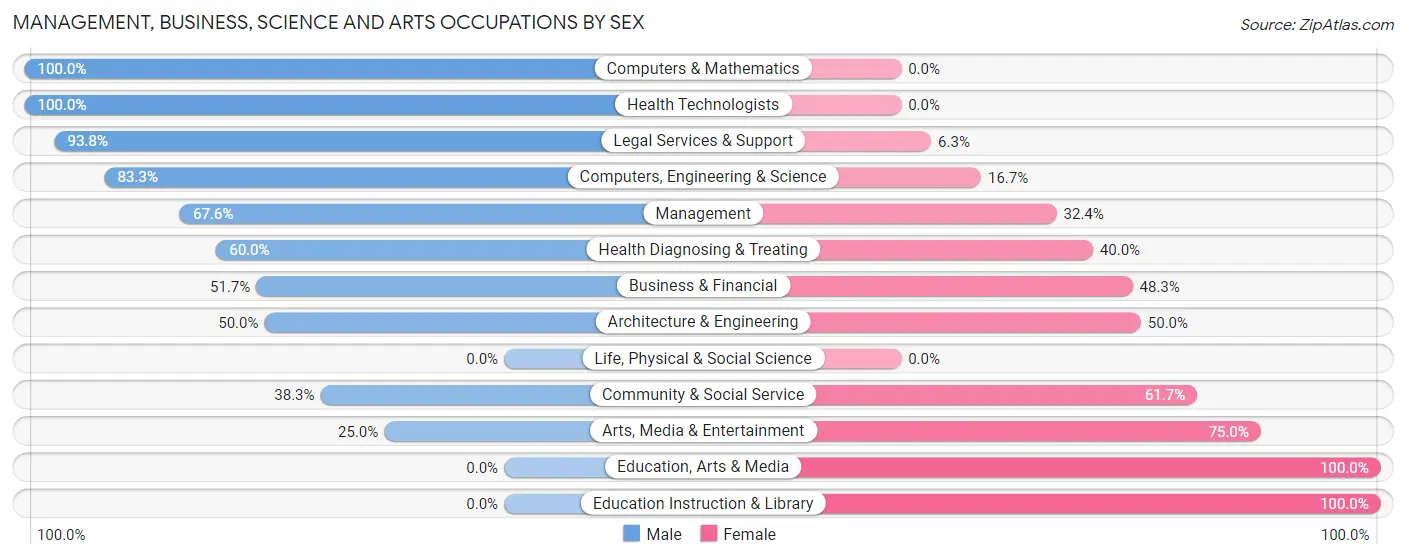
Management, Business, Science and Arts Occupations by Sex
Within the Management, Business, Science and Arts occupations in Bethany Beach, the most male-oriented occupations are Computers & Mathematics (100.0%), Health Technologists (100.0%), and Legal Services & Support (93.8%), while the most female-oriented occupations are Education, Arts & Media (100.0%), Education Instruction & Library (100.0%), and Arts, Media & Entertainment (75.0%).
| Occupation | Male | Female |
| Management | 25 (67.6%) | 12 (32.4%) |
| Business & Financial | 30 (51.7%) | 28 (48.3%) |
| Computers, Engineering & Science | 20 (83.3%) | 4 (16.7%) |
| Computers & Mathematics | 16 (100.0%) | 0 (0.0%) |
| Architecture & Engineering | 4 (50.0%) | 4 (50.0%) |
| Life, Physical & Social Science | 0 (0.0%) | 0 (0.0%) |
| Community & Social Service | 18 (38.3%) | 29 (61.7%) |
| Education, Arts & Media | 0 (0.0%) | 3 (100.0%) |
| Legal Services & Support | 15 (93.8%) | 1 (6.2%) |
| Education Instruction & Library | 0 (0.0%) | 16 (100.0%) |
| Arts, Media & Entertainment | 3 (25.0%) | 9 (75.0%) |
| Health Diagnosing & Treating | 3 (60.0%) | 2 (40.0%) |
| Health Technologists | 3 (100.0%) | 0 (0.0%) |
| Total (Category) | 96 (56.1%) | 75 (43.9%) |
| Total (Overall) | 225 (57.5%) | 166 (42.5%) |
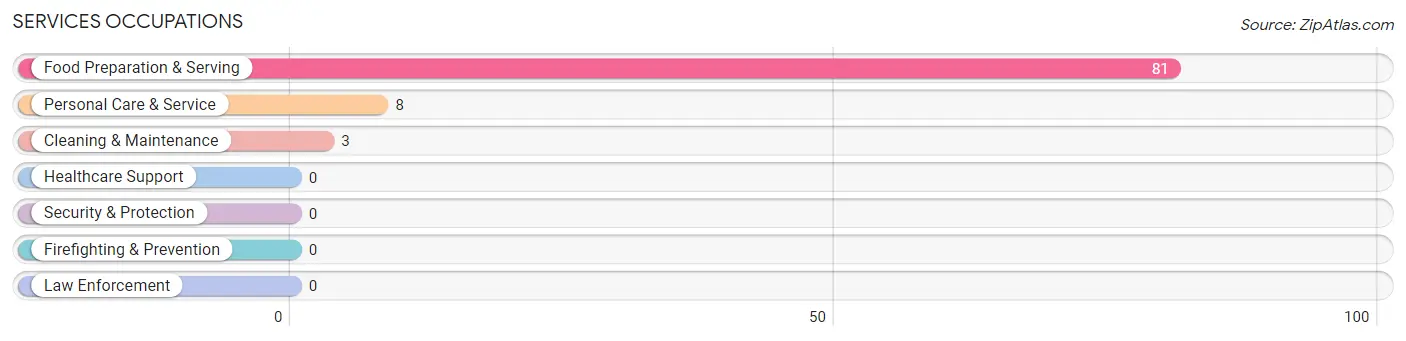
Services Occupations
The most common Services occupations in Bethany Beach are Food Preparation & Serving (81 | 20.7%), Personal Care & Service (8 | 2.1%), and Cleaning & Maintenance (3 | 0.8%).
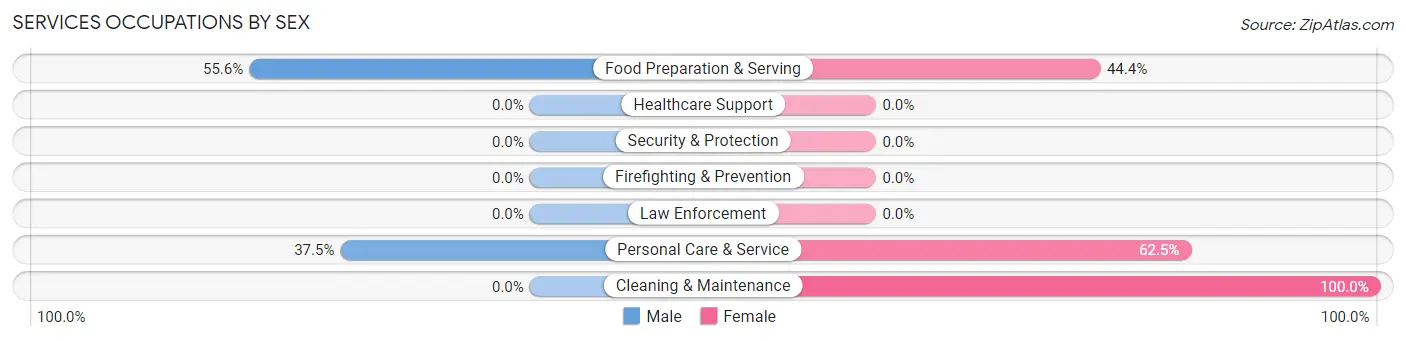
Services Occupations by Sex
Within the Services occupations in Bethany Beach, the most male-oriented occupations are Food Preparation & Serving (55.6%), and Personal Care & Service (37.5%), while the most female-oriented occupations are Cleaning & Maintenance (100.0%), Personal Care & Service (62.5%), and Food Preparation & Serving (44.4%).
| Occupation | Male | Female |
| Healthcare Support | 0 (0.0%) | 0 (0.0%) |
| Security & Protection | 0 (0.0%) | 0 (0.0%) |
| Firefighting & Prevention | 0 (0.0%) | 0 (0.0%) |
| Law Enforcement | 0 (0.0%) | 0 (0.0%) |
| Food Preparation & Serving | 45 (55.6%) | 36 (44.4%) |
| Cleaning & Maintenance | 0 (0.0%) | 3 (100.0%) |
| Personal Care & Service | 3 (37.5%) | 5 (62.5%) |
| Total (Category) | 48 (52.2%) | 44 (47.8%) |
| Total (Overall) | 225 (57.5%) | 166 (42.5%) |
Sales and Office Occupations
The most common Sales and Office occupations in Bethany Beach are Sales & Related (85 | 21.7%), and Office & Administration (24 | 6.1%).

Sales and Office Occupations by Sex
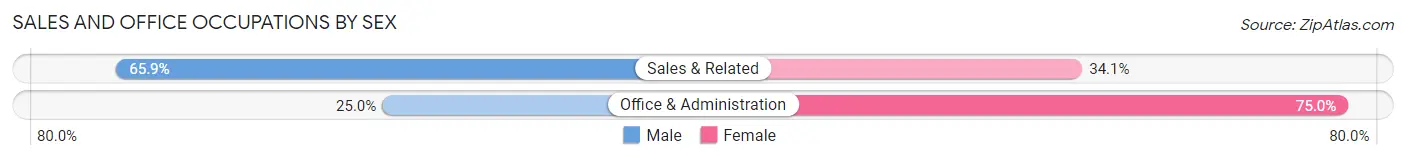
| Occupation | Male | Female |
| Sales & Related | 56 (65.9%) | 29 (34.1%) |
| Office & Administration | 6 (25.0%) | 18 (75.0%) |
| Total (Category) | 62 (56.9%) | 47 (43.1%) |
| Total (Overall) | 225 (57.5%) | 166 (42.5%) |
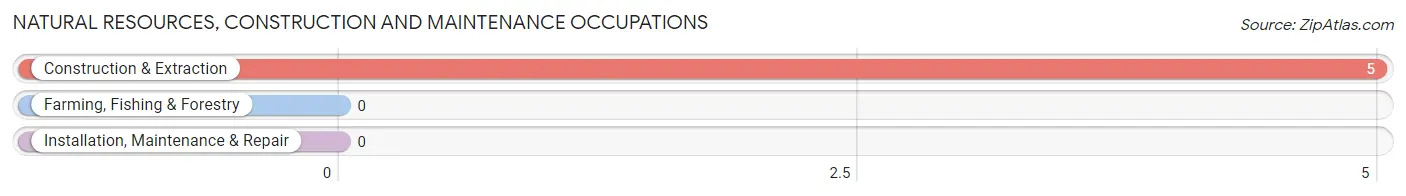
Natural Resources, Construction and Maintenance Occupations
The most common Natural Resources, Construction and Maintenance occupations in Bethany Beach are , and Construction & Extraction (5 | 1.3%).
Natural Resources, Construction and Maintenance Occupations by Sex
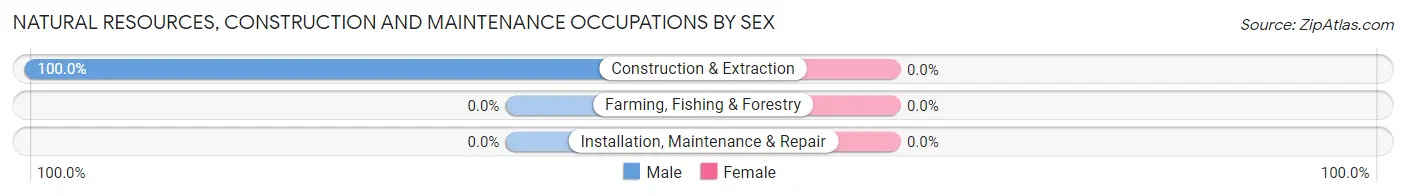
| Occupation | Male | Female |
| Farming, Fishing & Forestry | 0 (0.0%) | 0 (0.0%) |
| Construction & Extraction | 5 (100.0%) | 0 (0.0%) |
| Installation, Maintenance & Repair | 0 (0.0%) | 0 (0.0%) |
| Total (Category) | 5 (100.0%) | 0 (0.0%) |
| Total (Overall) | 225 (57.5%) | 166 (42.5%) |
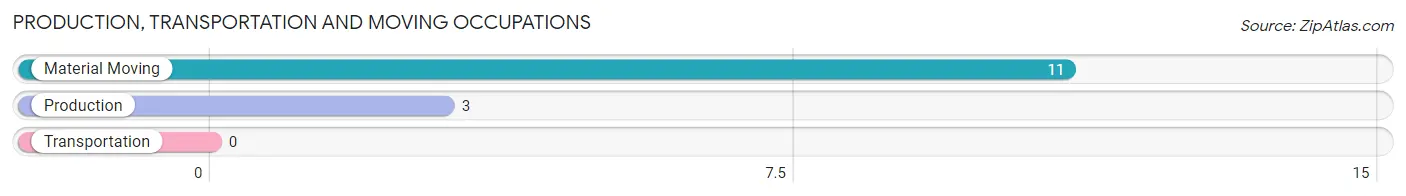
Production, Transportation and Moving Occupations
The most common Production, Transportation and Moving occupations in Bethany Beach are Material Moving (11 | 2.8%), and Production (3 | 0.8%).
Production, Transportation and Moving Occupations by Sex
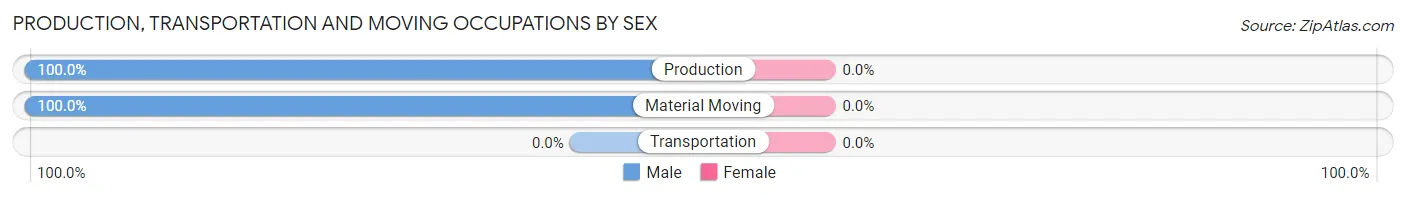
| Occupation | Male | Female |
| Production | 3 (100.0%) | 0 (0.0%) |
| Transportation | 0 (0.0%) | 0 (0.0%) |
| Material Moving | 11 (100.0%) | 0 (0.0%) |
| Total (Category) | 14 (100.0%) | 0 (0.0%) |
| Total (Overall) | 225 (57.5%) | 166 (42.5%) |
Employment Industries by Sex in Bethany Beach
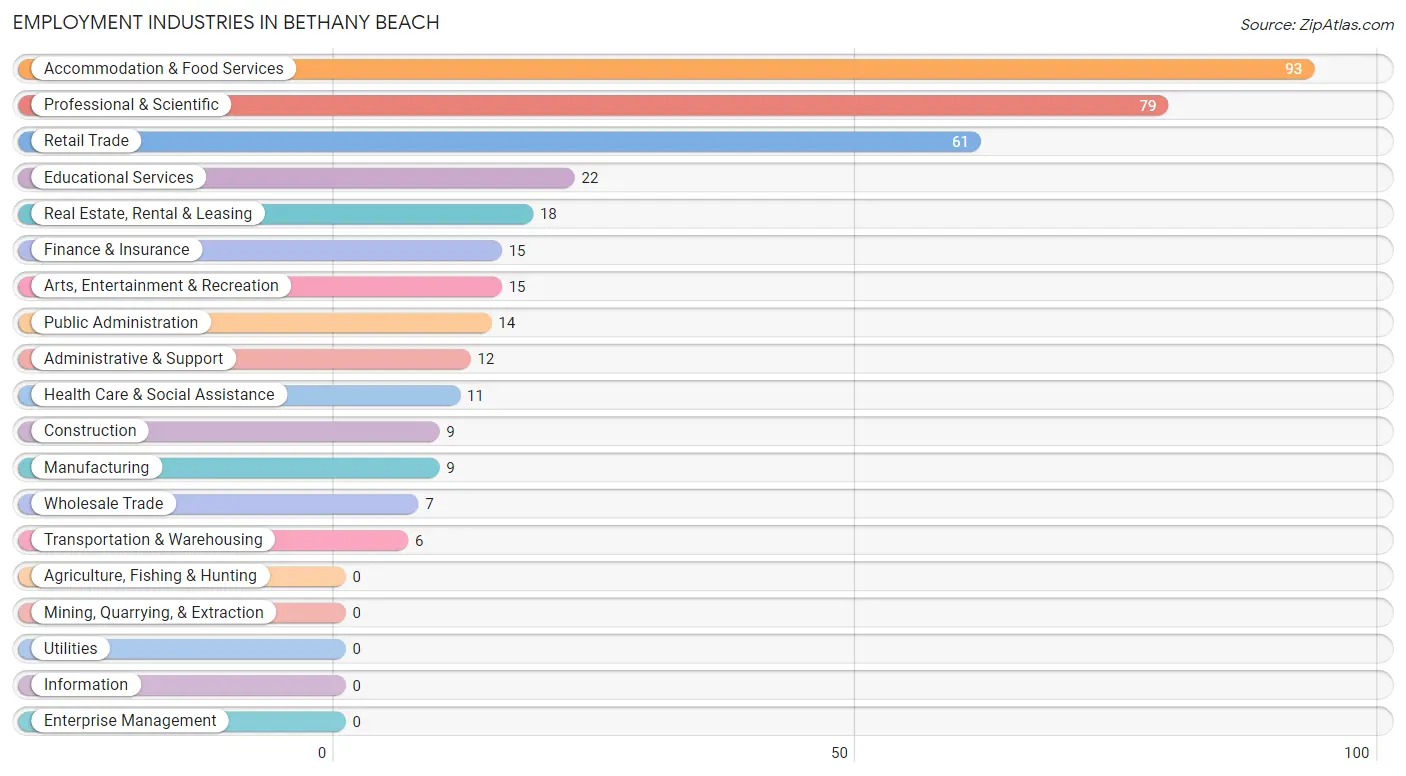
Employment Industries in Bethany Beach
The major employment industries in Bethany Beach include Accommodation & Food Services (93 | 23.8%), Professional & Scientific (79 | 20.2%), Retail Trade (61 | 15.6%), Educational Services (22 | 5.6%), and Real Estate, Rental & Leasing (18 | 4.6%).
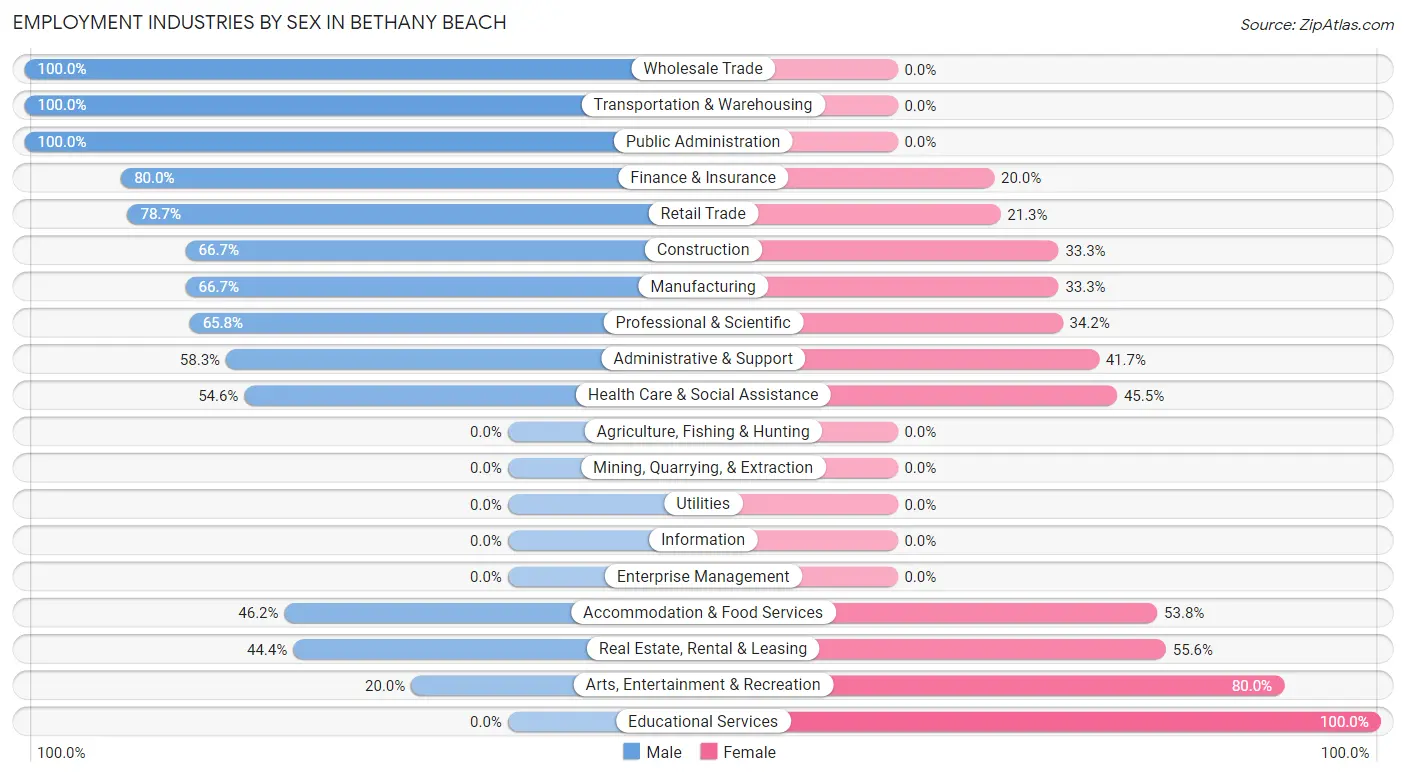
Employment Industries by Sex in Bethany Beach
The Bethany Beach industries that see more men than women are Wholesale Trade (100.0%), Transportation & Warehousing (100.0%), and Public Administration (100.0%), whereas the industries that tend to have a higher number of women are Educational Services (100.0%), Arts, Entertainment & Recreation (80.0%), and Real Estate, Rental & Leasing (55.6%).
| Industry | Male | Female |
| Agriculture, Fishing & Hunting | 0 (0.0%) | 0 (0.0%) |
| Mining, Quarrying, & Extraction | 0 (0.0%) | 0 (0.0%) |
| Construction | 6 (66.7%) | 3 (33.3%) |
| Manufacturing | 6 (66.7%) | 3 (33.3%) |
| Wholesale Trade | 7 (100.0%) | 0 (0.0%) |
| Retail Trade | 48 (78.7%) | 13 (21.3%) |
| Transportation & Warehousing | 6 (100.0%) | 0 (0.0%) |
| Utilities | 0 (0.0%) | 0 (0.0%) |
| Information | 0 (0.0%) | 0 (0.0%) |
| Finance & Insurance | 12 (80.0%) | 3 (20.0%) |
| Real Estate, Rental & Leasing | 8 (44.4%) | 10 (55.6%) |
| Professional & Scientific | 52 (65.8%) | 27 (34.2%) |
| Enterprise Management | 0 (0.0%) | 0 (0.0%) |
| Administrative & Support | 7 (58.3%) | 5 (41.7%) |
| Educational Services | 0 (0.0%) | 22 (100.0%) |
| Health Care & Social Assistance | 6 (54.5%) | 5 (45.5%) |
| Arts, Entertainment & Recreation | 3 (20.0%) | 12 (80.0%) |
| Accommodation & Food Services | 43 (46.2%) | 50 (53.8%) |
| Public Administration | 14 (100.0%) | 0 (0.0%) |
| Total | 225 (57.5%) | 166 (42.5%) |
Education in Bethany Beach
School Enrollment in Bethany Beach
The most common levels of schooling among the 48 students in Bethany Beach are college / undergraduate (22 | 45.8%), high school (13 | 27.1%), and middle school (8 | 16.7%).
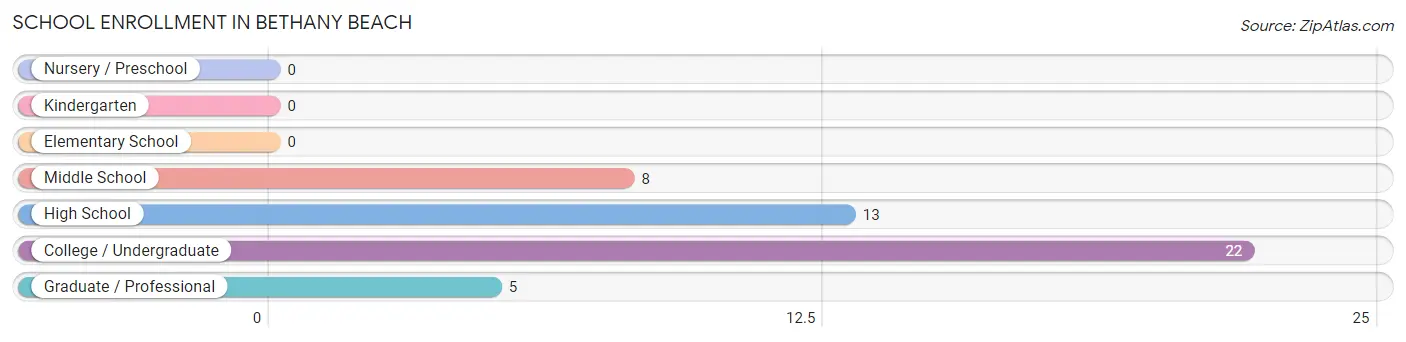
| School Level | # Students | % Students |
| Nursery / Preschool | 0 | 0.0% |
| Kindergarten | 0 | 0.0% |
| Elementary School | 0 | 0.0% |
| Middle School | 8 | 16.7% |
| High School | 13 | 27.1% |
| College / Undergraduate | 22 | 45.8% |
| Graduate / Professional | 5 | 10.4% |
| Total | 48 | 100.0% |
School Enrollment by Age by Funding Source in Bethany Beach
Out of a total of 48 students who are enrolled in schools in Bethany Beach, 7 (14.6%) attend a private institution, while the remaining 41 (85.4%) are enrolled in public schools. The age group of 20 to 24 year olds has the highest likelihood of being enrolled in private schools, with 7 (100.0% in the age bracket) enrolled. Conversely, the age group of 10 to 14 year olds has the lowest likelihood of being enrolled in a private school, with 8 (100.0% in the age bracket) attending a public institution.
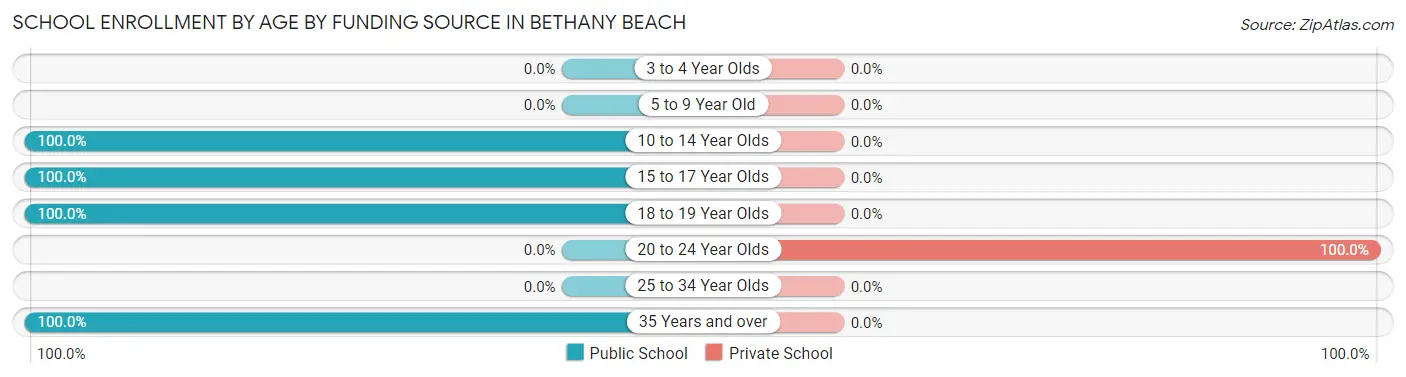
| Age Bracket | Public School | Private School |
| 3 to 4 Year Olds | 0 (0.0%) | 0 (0.0%) |
| 5 to 9 Year Old | 0 (0.0%) | 0 (0.0%) |
| 10 to 14 Year Olds | 8 (100.0%) | 0 (0.0%) |
| 15 to 17 Year Olds | 13 (100.0%) | 0 (0.0%) |
| 18 to 19 Year Olds | 15 (100.0%) | 0 (0.0%) |
| 20 to 24 Year Olds | 0 (0.0%) | 7 (100.0%) |
| 25 to 34 Year Olds | 0 (0.0%) | 0 (0.0%) |
| 35 Years and over | 5 (100.0%) | 0 (0.0%) |
| Total | 41 (85.4%) | 7 (14.6%) |
Educational Attainment by Field of Study in Bethany Beach
Business (129 | 21.4%), education (93 | 15.4%), science & technology (66 | 11.0%), engineering (58 | 9.6%), and social sciences (51 | 8.5%) are the most common fields of study among 602 individuals in Bethany Beach who have obtained a bachelor's degree or higher.
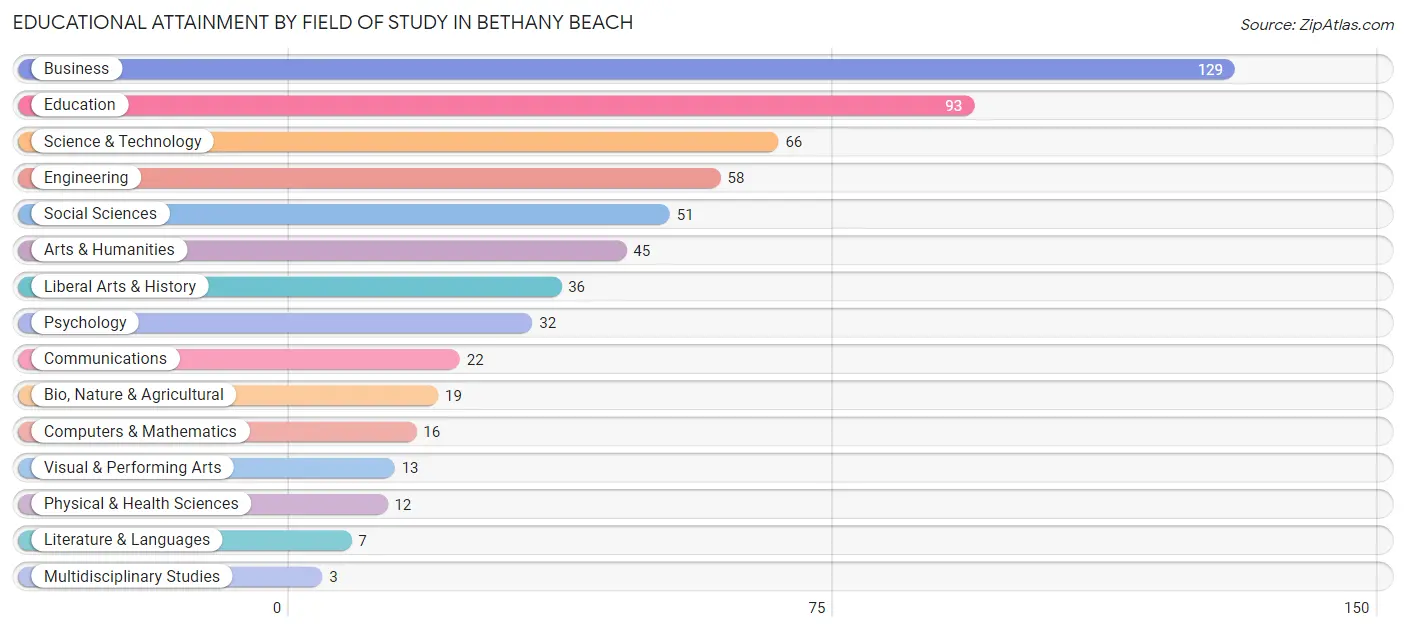
| Field of Study | # Graduates | % Graduates |
| Computers & Mathematics | 16 | 2.7% |
| Bio, Nature & Agricultural | 19 | 3.2% |
| Physical & Health Sciences | 12 | 2.0% |
| Psychology | 32 | 5.3% |
| Social Sciences | 51 | 8.5% |
| Engineering | 58 | 9.6% |
| Multidisciplinary Studies | 3 | 0.5% |
| Science & Technology | 66 | 11.0% |
| Business | 129 | 21.4% |
| Education | 93 | 15.4% |
| Literature & Languages | 7 | 1.2% |
| Liberal Arts & History | 36 | 6.0% |
| Visual & Performing Arts | 13 | 2.2% |
| Communications | 22 | 3.6% |
| Arts & Humanities | 45 | 7.5% |
| Total | 602 | 100.0% |
Transportation & Commute in Bethany Beach
Vehicle Availability by Sex in Bethany Beach
The most prevalent vehicle ownership categories in Bethany Beach are males with 2 vehicles (88, accounting for 39.1%) and females with 2 vehicles (68, making up 54.0%).
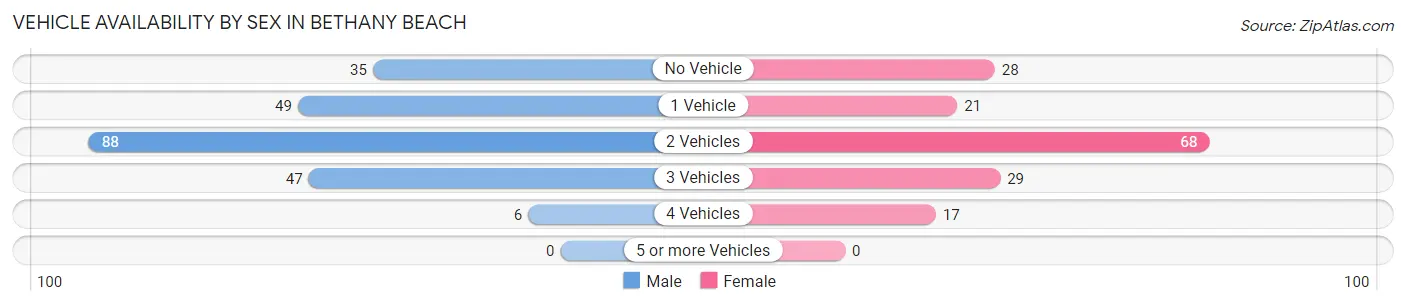
| Vehicles Available | Male | Female |
| No Vehicle | 35 (15.6%) | 28 (17.2%) |
| 1 Vehicle | 49 (21.8%) | 21 (12.9%) |
| 2 Vehicles | 88 (39.1%) | 68 (41.7%) |
| 3 Vehicles | 47 (20.9%) | 29 (17.8%) |
| 4 Vehicles | 6 (2.7%) | 17 (10.4%) |
| 5 or more Vehicles | 0 (0.0%) | 0 (0.0%) |
| Total | 225 (100.0%) | 163 (100.0%) |
Commute Time in Bethany Beach
The most frequently occuring commute durations in Bethany Beach are 10 to 14 minutes (79 commuters, 26.4%), 15 to 19 minutes (55 commuters, 18.4%), and 20 to 24 minutes (45 commuters, 15.0%).
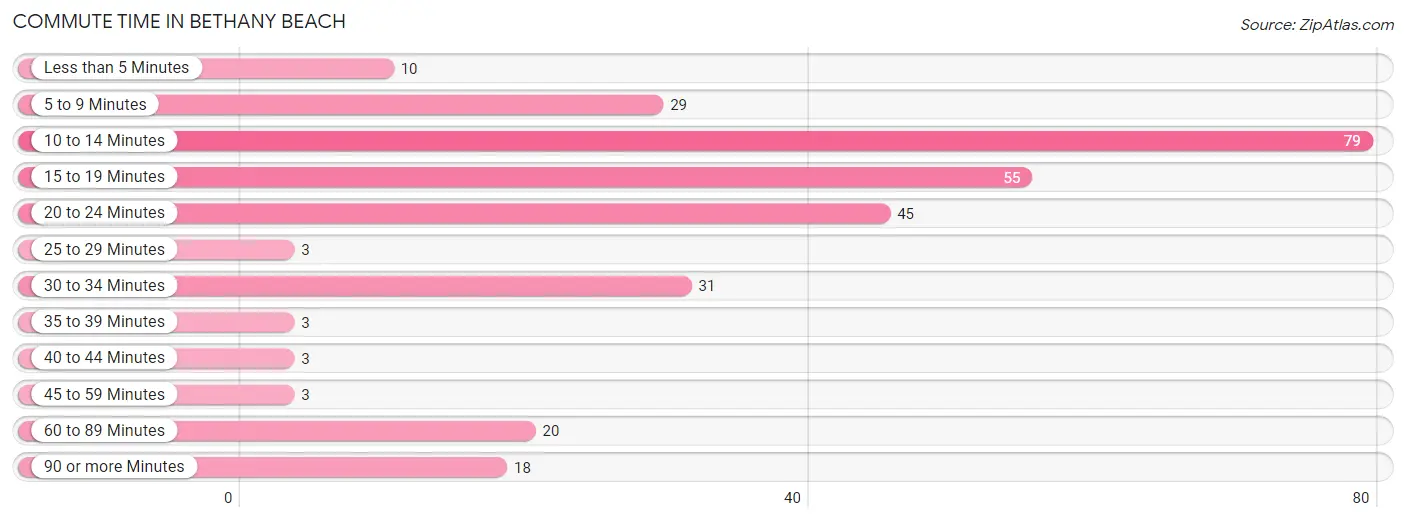
| Commute Time | # Commuters | % Commuters |
| Less than 5 Minutes | 10 | 3.3% |
| 5 to 9 Minutes | 29 | 9.7% |
| 10 to 14 Minutes | 79 | 26.4% |
| 15 to 19 Minutes | 55 | 18.4% |
| 20 to 24 Minutes | 45 | 15.0% |
| 25 to 29 Minutes | 3 | 1.0% |
| 30 to 34 Minutes | 31 | 10.4% |
| 35 to 39 Minutes | 3 | 1.0% |
| 40 to 44 Minutes | 3 | 1.0% |
| 45 to 59 Minutes | 3 | 1.0% |
| 60 to 89 Minutes | 20 | 6.7% |
| 90 or more Minutes | 18 | 6.0% |
Commute Time by Sex in Bethany Beach
The most common commute times in Bethany Beach are 10 to 14 minutes (49 commuters, 28.5%) for males and 15 to 19 minutes (31 commuters, 24.4%) for females.
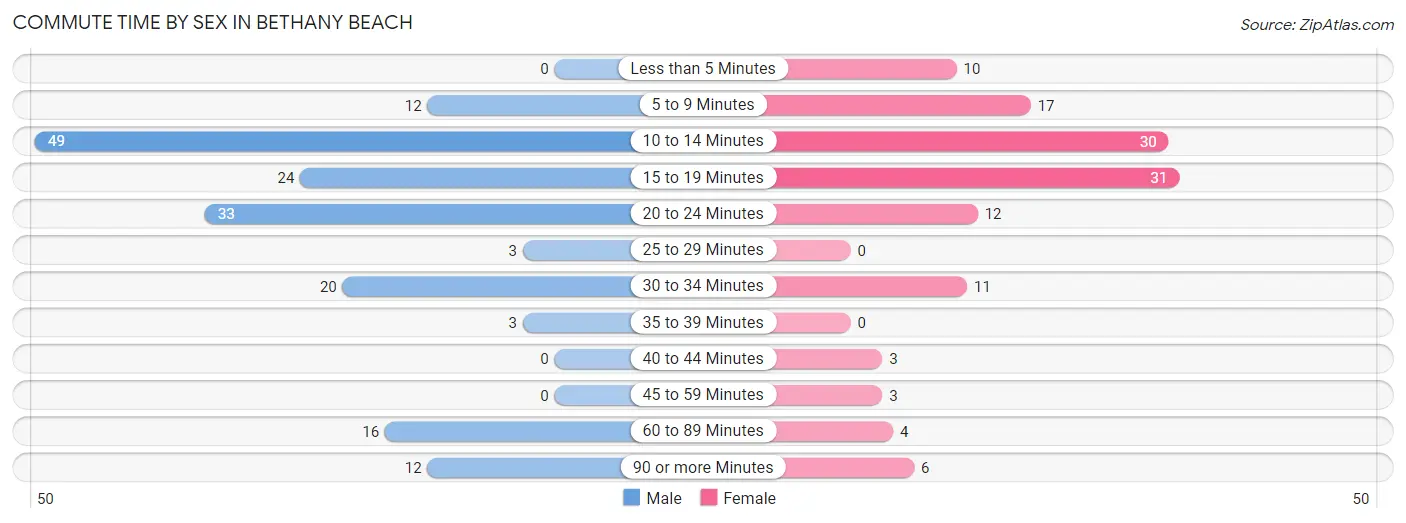
| Commute Time | Male | Female |
| Less than 5 Minutes | 0 (0.0%) | 10 (7.9%) |
| 5 to 9 Minutes | 12 (7.0%) | 17 (13.4%) |
| 10 to 14 Minutes | 49 (28.5%) | 30 (23.6%) |
| 15 to 19 Minutes | 24 (14.0%) | 31 (24.4%) |
| 20 to 24 Minutes | 33 (19.2%) | 12 (9.5%) |
| 25 to 29 Minutes | 3 (1.7%) | 0 (0.0%) |
| 30 to 34 Minutes | 20 (11.6%) | 11 (8.7%) |
| 35 to 39 Minutes | 3 (1.7%) | 0 (0.0%) |
| 40 to 44 Minutes | 0 (0.0%) | 3 (2.4%) |
| 45 to 59 Minutes | 0 (0.0%) | 3 (2.4%) |
| 60 to 89 Minutes | 16 (9.3%) | 4 (3.2%) |
| 90 or more Minutes | 12 (7.0%) | 6 (4.7%) |
Time of Departure to Work by Sex in Bethany Beach
The most frequent times of departure to work in Bethany Beach are 9:00 AM to 9:59 AM (49, 28.5%) for males and 9:00 AM to 9:59 AM (20, 15.8%) for females.
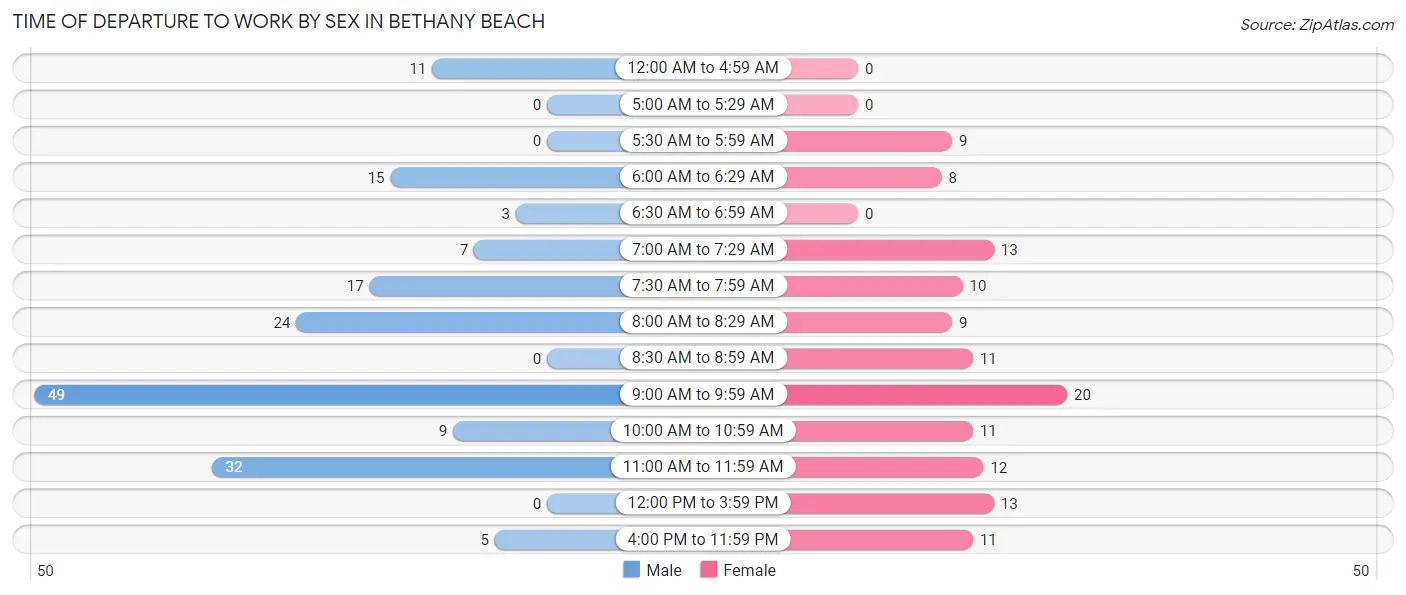
| Time of Departure | Male | Female |
| 12:00 AM to 4:59 AM | 11 (6.4%) | 0 (0.0%) |
| 5:00 AM to 5:29 AM | 0 (0.0%) | 0 (0.0%) |
| 5:30 AM to 5:59 AM | 0 (0.0%) | 9 (7.1%) |
| 6:00 AM to 6:29 AM | 15 (8.7%) | 8 (6.3%) |
| 6:30 AM to 6:59 AM | 3 (1.7%) | 0 (0.0%) |
| 7:00 AM to 7:29 AM | 7 (4.1%) | 13 (10.2%) |
| 7:30 AM to 7:59 AM | 17 (9.9%) | 10 (7.9%) |
| 8:00 AM to 8:29 AM | 24 (14.0%) | 9 (7.1%) |
| 8:30 AM to 8:59 AM | 0 (0.0%) | 11 (8.7%) |
| 9:00 AM to 9:59 AM | 49 (28.5%) | 20 (15.8%) |
| 10:00 AM to 10:59 AM | 9 (5.2%) | 11 (8.7%) |
| 11:00 AM to 11:59 AM | 32 (18.6%) | 12 (9.5%) |
| 12:00 PM to 3:59 PM | 0 (0.0%) | 13 (10.2%) |
| 4:00 PM to 11:59 PM | 5 (2.9%) | 11 (8.7%) |
| Total | 172 (100.0%) | 127 (100.0%) |
Housing Occupancy in Bethany Beach
Occupancy by Ownership in Bethany Beach
Of the total 522 dwellings in Bethany Beach, owner-occupied units account for 497 (95.2%), while renter-occupied units make up 25 (4.8%).
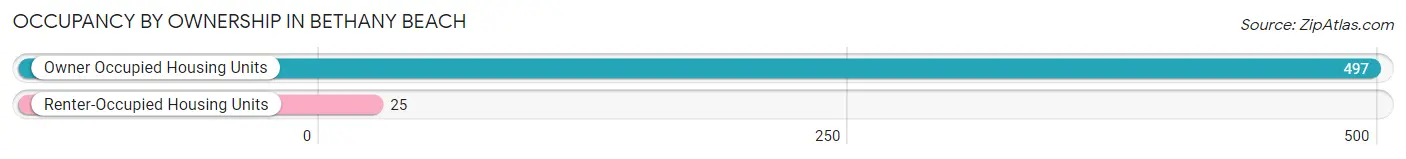
| Occupancy | # Housing Units | % Housing Units |
| Owner Occupied Housing Units | 497 | 95.2% |
| Renter-Occupied Housing Units | 25 | 4.8% |
| Total Occupied Housing Units | 522 | 100.0% |
Occupancy by Household Size in Bethany Beach
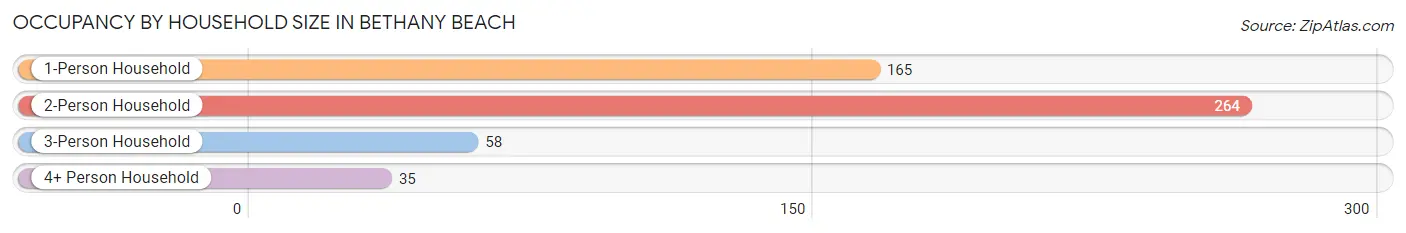
| Household Size | # Housing Units | % Housing Units |
| 1-Person Household | 165 | 31.6% |
| 2-Person Household | 264 | 50.6% |
| 3-Person Household | 58 | 11.1% |
| 4+ Person Household | 35 | 6.7% |
| Total Housing Units | 522 | 100.0% |
Occupancy by Ownership by Household Size in Bethany Beach
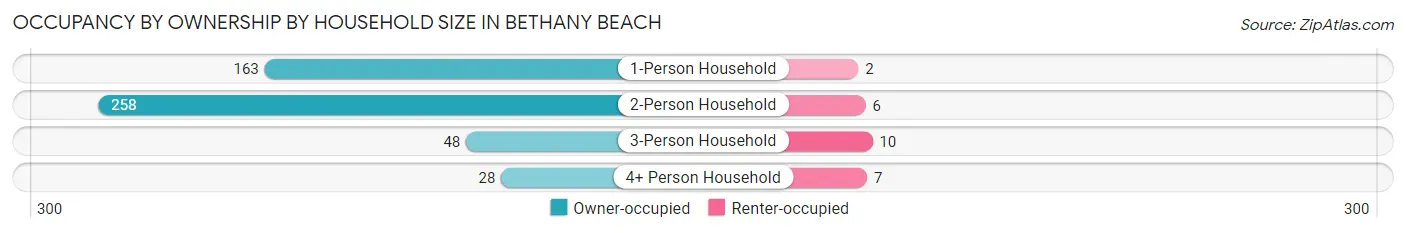
| Household Size | Owner-occupied | Renter-occupied |
| 1-Person Household | 163 (98.8%) | 2 (1.2%) |
| 2-Person Household | 258 (97.7%) | 6 (2.3%) |
| 3-Person Household | 48 (82.8%) | 10 (17.2%) |
| 4+ Person Household | 28 (80.0%) | 7 (20.0%) |
| Total Housing Units | 497 (95.2%) | 25 (4.8%) |
Occupancy by Educational Attainment in Bethany Beach
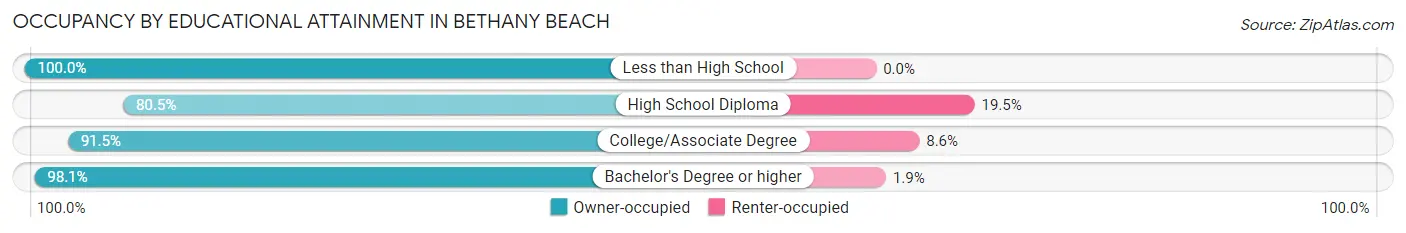
| Household Size | Owner-occupied | Renter-occupied |
| Less than High School | 3 (100.0%) | 0 (0.0%) |
| High School Diploma | 33 (80.5%) | 8 (19.5%) |
| College/Associate Degree | 107 (91.4%) | 10 (8.6%) |
| Bachelor's Degree or higher | 354 (98.1%) | 7 (1.9%) |
Occupancy by Age of Householder in Bethany Beach
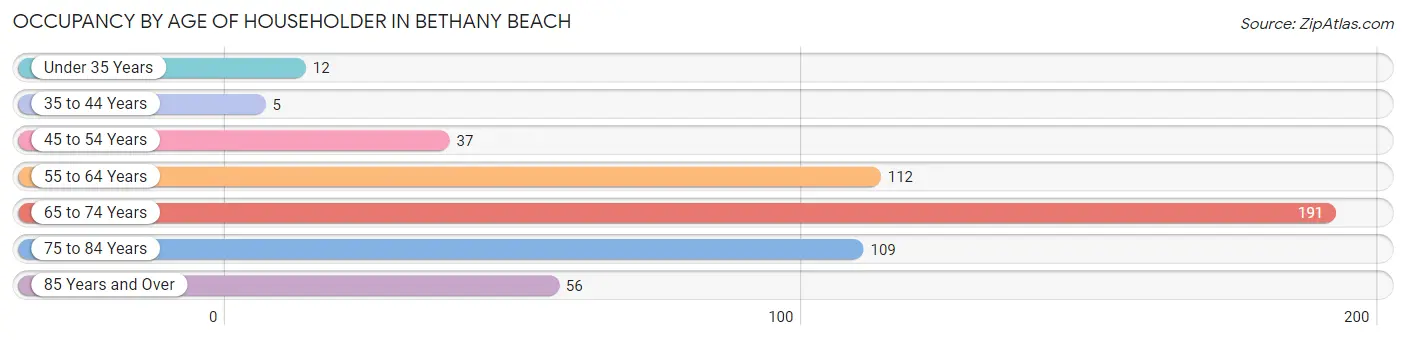
| Age Bracket | # Households | % Households |
| Under 35 Years | 12 | 2.3% |
| 35 to 44 Years | 5 | 1.0% |
| 45 to 54 Years | 37 | 7.1% |
| 55 to 64 Years | 112 | 21.5% |
| 65 to 74 Years | 191 | 36.6% |
| 75 to 84 Years | 109 | 20.9% |
| 85 Years and Over | 56 | 10.7% |
| Total | 522 | 100.0% |
Housing Finances in Bethany Beach
Median Income by Occupancy in Bethany Beach
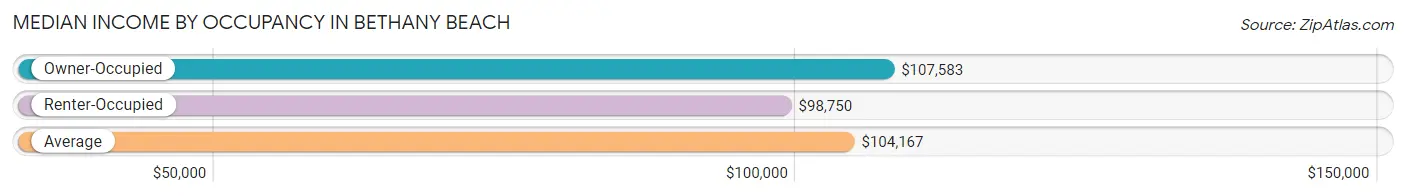
| Occupancy Type | # Households | Median Income |
| Owner-Occupied | 497 (95.2%) | $107,583 |
| Renter-Occupied | 25 (4.8%) | $98,750 |
| Average | 522 (100.0%) | $104,167 |
Occupancy by Householder Income Bracket in Bethany Beach
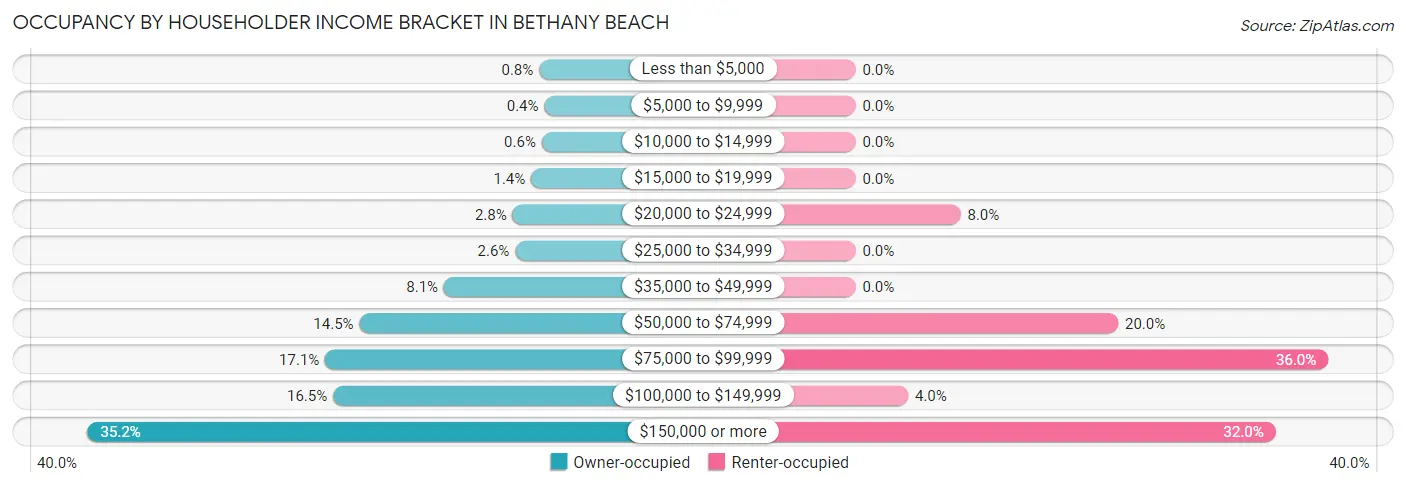
| Income Bracket | Owner-occupied | Renter-occupied |
| Less than $5,000 | 4 (0.8%) | 0 (0.0%) |
| $5,000 to $9,999 | 2 (0.4%) | 0 (0.0%) |
| $10,000 to $14,999 | 3 (0.6%) | 0 (0.0%) |
| $15,000 to $19,999 | 7 (1.4%) | 0 (0.0%) |
| $20,000 to $24,999 | 14 (2.8%) | 2 (8.0%) |
| $25,000 to $34,999 | 13 (2.6%) | 0 (0.0%) |
| $35,000 to $49,999 | 40 (8.1%) | 0 (0.0%) |
| $50,000 to $74,999 | 72 (14.5%) | 5 (20.0%) |
| $75,000 to $99,999 | 85 (17.1%) | 9 (36.0%) |
| $100,000 to $149,999 | 82 (16.5%) | 1 (4.0%) |
| $150,000 or more | 175 (35.2%) | 8 (32.0%) |
| Total | 497 (100.0%) | 25 (100.0%) |
Monthly Housing Cost Tiers in Bethany Beach
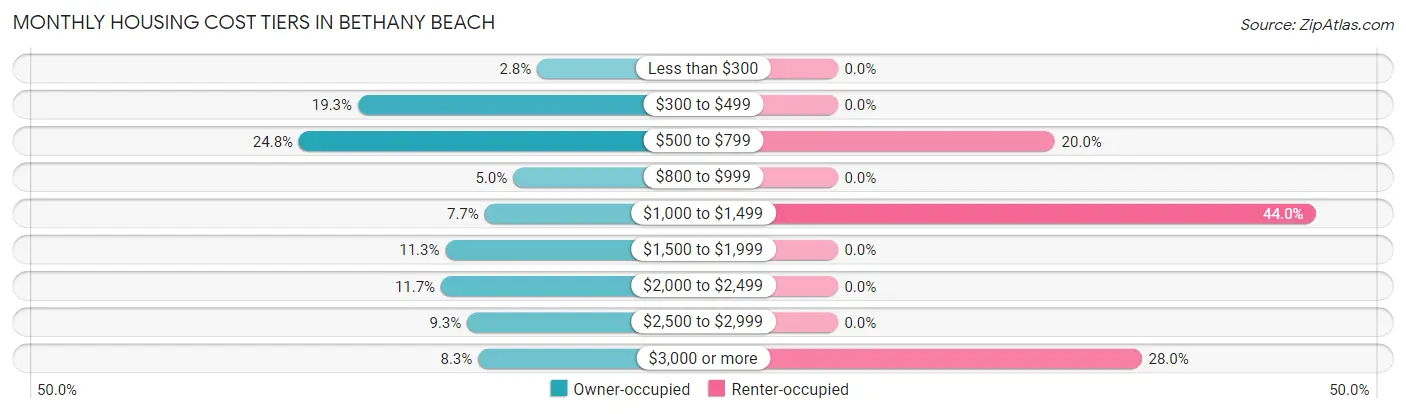
| Monthly Cost | Owner-occupied | Renter-occupied |
| Less than $300 | 14 (2.8%) | 0 (0.0%) |
| $300 to $499 | 96 (19.3%) | 0 (0.0%) |
| $500 to $799 | 123 (24.7%) | 5 (20.0%) |
| $800 to $999 | 25 (5.0%) | 0 (0.0%) |
| $1,000 to $1,499 | 38 (7.6%) | 11 (44.0%) |
| $1,500 to $1,999 | 56 (11.3%) | 0 (0.0%) |
| $2,000 to $2,499 | 58 (11.7%) | 0 (0.0%) |
| $2,500 to $2,999 | 46 (9.3%) | 0 (0.0%) |
| $3,000 or more | 41 (8.3%) | 7 (28.0%) |
| Total | 497 (100.0%) | 25 (100.0%) |
Physical Housing Characteristics in Bethany Beach
Housing Structures in Bethany Beach
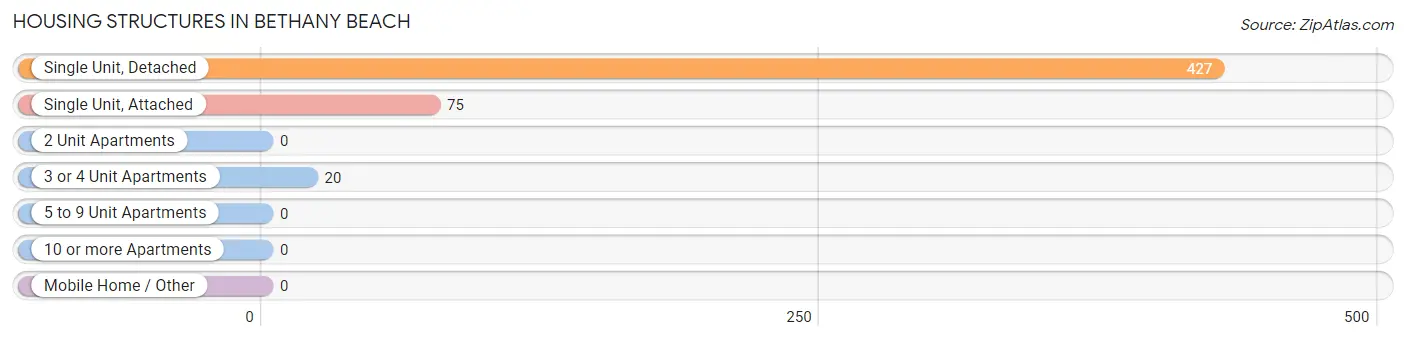
| Structure Type | # Housing Units | % Housing Units |
| Single Unit, Detached | 427 | 81.8% |
| Single Unit, Attached | 75 | 14.4% |
| 2 Unit Apartments | 0 | 0.0% |
| 3 or 4 Unit Apartments | 20 | 3.8% |
| 5 to 9 Unit Apartments | 0 | 0.0% |
| 10 or more Apartments | 0 | 0.0% |
| Mobile Home / Other | 0 | 0.0% |
| Total | 522 | 100.0% |
Housing Structures by Occupancy in Bethany Beach
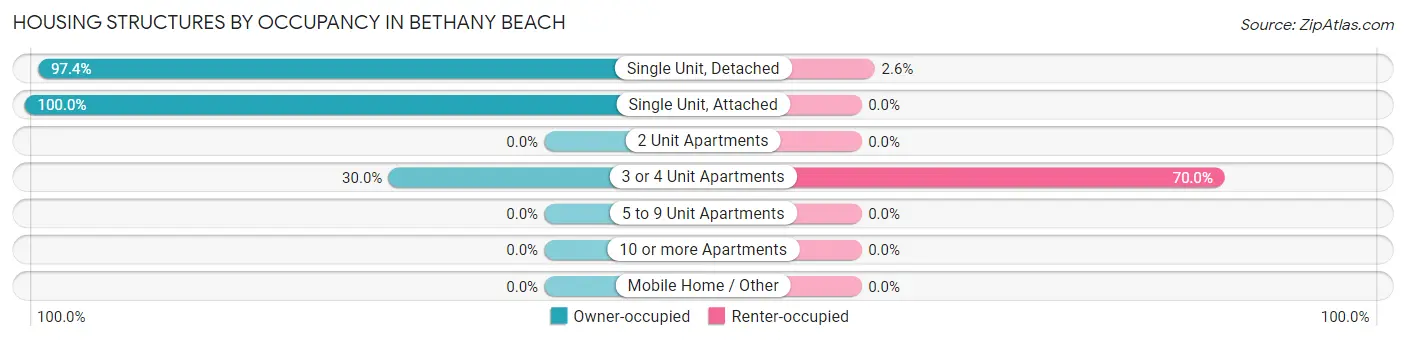
| Structure Type | Owner-occupied | Renter-occupied |
| Single Unit, Detached | 416 (97.4%) | 11 (2.6%) |
| Single Unit, Attached | 75 (100.0%) | 0 (0.0%) |
| 2 Unit Apartments | 0 (0.0%) | 0 (0.0%) |
| 3 or 4 Unit Apartments | 6 (30.0%) | 14 (70.0%) |
| 5 to 9 Unit Apartments | 0 (0.0%) | 0 (0.0%) |
| 10 or more Apartments | 0 (0.0%) | 0 (0.0%) |
| Mobile Home / Other | 0 (0.0%) | 0 (0.0%) |
| Total | 497 (95.2%) | 25 (4.8%) |
Housing Structures by Number of Rooms in Bethany Beach
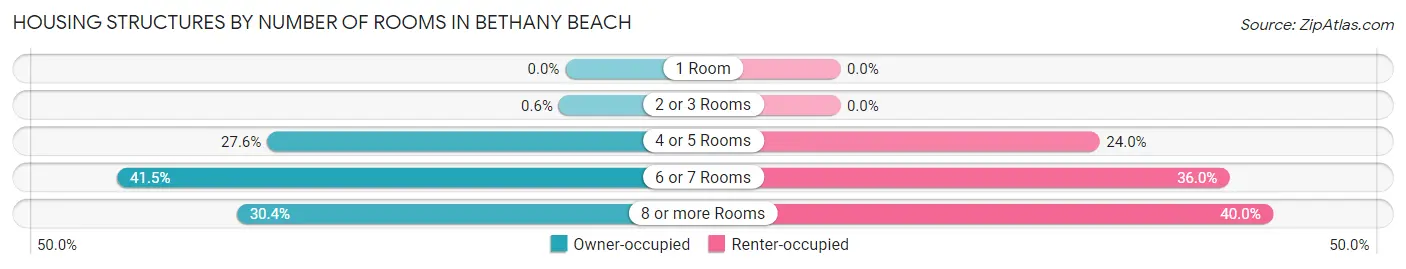
| Number of Rooms | Owner-occupied | Renter-occupied |
| 1 Room | 0 (0.0%) | 0 (0.0%) |
| 2 or 3 Rooms | 3 (0.6%) | 0 (0.0%) |
| 4 or 5 Rooms | 137 (27.6%) | 6 (24.0%) |
| 6 or 7 Rooms | 206 (41.4%) | 9 (36.0%) |
| 8 or more Rooms | 151 (30.4%) | 10 (40.0%) |
| Total | 497 (100.0%) | 25 (100.0%) |
Housing Structure by Heating Type in Bethany Beach
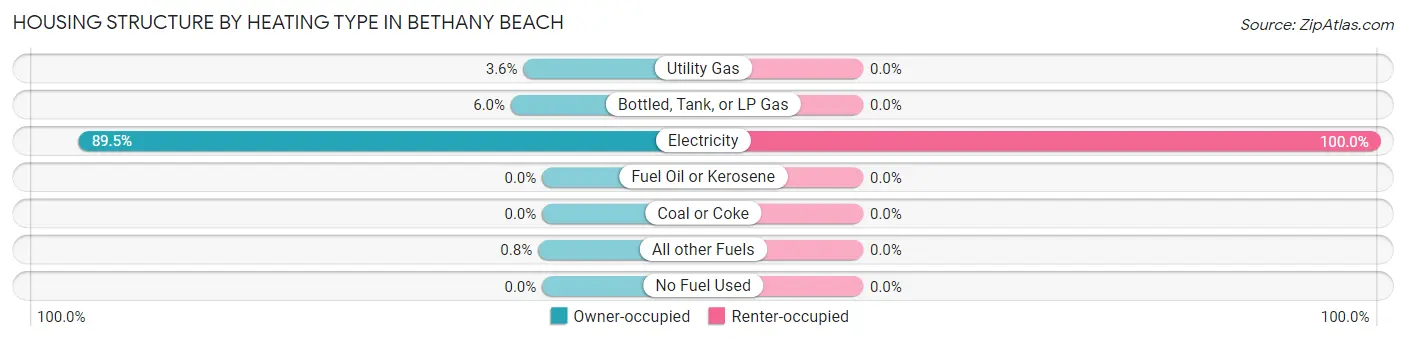
| Heating Type | Owner-occupied | Renter-occupied |
| Utility Gas | 18 (3.6%) | 0 (0.0%) |
| Bottled, Tank, or LP Gas | 30 (6.0%) | 0 (0.0%) |
| Electricity | 445 (89.5%) | 25 (100.0%) |
| Fuel Oil or Kerosene | 0 (0.0%) | 0 (0.0%) |
| Coal or Coke | 0 (0.0%) | 0 (0.0%) |
| All other Fuels | 4 (0.8%) | 0 (0.0%) |
| No Fuel Used | 0 (0.0%) | 0 (0.0%) |
| Total | 497 (100.0%) | 25 (100.0%) |
Household Vehicle Usage in Bethany Beach
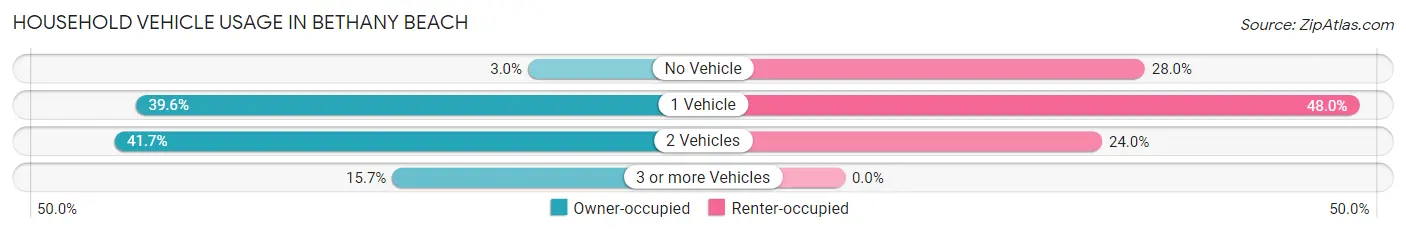
| Vehicles per Household | Owner-occupied | Renter-occupied |
| No Vehicle | 15 (3.0%) | 7 (28.0%) |
| 1 Vehicle | 197 (39.6%) | 12 (48.0%) |
| 2 Vehicles | 207 (41.6%) | 6 (24.0%) |
| 3 or more Vehicles | 78 (15.7%) | 0 (0.0%) |
| Total | 497 (100.0%) | 25 (100.0%) |
Real Estate & Mortgages in Bethany Beach
Real Estate and Mortgage Overview in Bethany Beach
| Characteristic | Without Mortgage | With Mortgage |
| Housing Units | 259 | 238 |
| Median Property Value | $597,100 | $625,000 |
| Median Household Income | $88,750 | $116 |
| Monthly Housing Costs | $541 | $41 |
| Real Estate Taxes | $1,567 | $0 |
Property Value by Mortgage Status in Bethany Beach
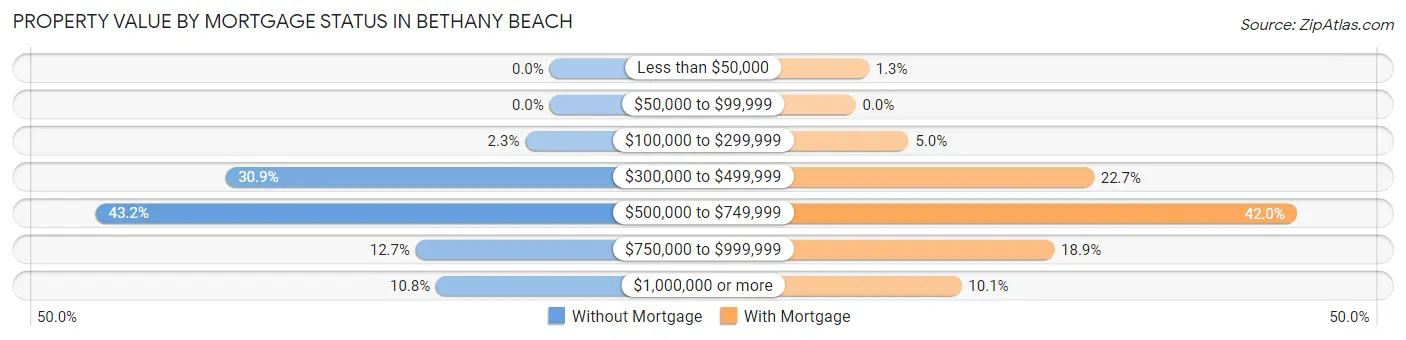
| Property Value | Without Mortgage | With Mortgage |
| Less than $50,000 | 0 (0.0%) | 3 (1.3%) |
| $50,000 to $99,999 | 0 (0.0%) | 0 (0.0%) |
| $100,000 to $299,999 | 6 (2.3%) | 12 (5.0%) |
| $300,000 to $499,999 | 80 (30.9%) | 54 (22.7%) |
| $500,000 to $749,999 | 112 (43.2%) | 100 (42.0%) |
| $750,000 to $999,999 | 33 (12.7%) | 45 (18.9%) |
| $1,000,000 or more | 28 (10.8%) | 24 (10.1%) |
| Total | 259 (100.0%) | 238 (100.0%) |
Household Income by Mortgage Status in Bethany Beach
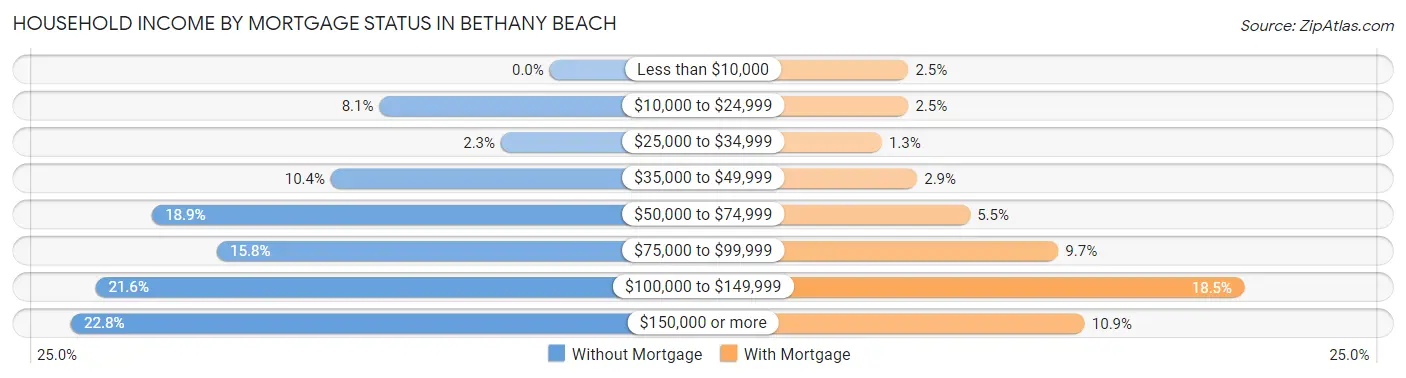
| Household Income | Without Mortgage | With Mortgage |
| Less than $10,000 | 0 (0.0%) | 6 (2.5%) |
| $10,000 to $24,999 | 21 (8.1%) | 6 (2.5%) |
| $25,000 to $34,999 | 6 (2.3%) | 3 (1.3%) |
| $35,000 to $49,999 | 27 (10.4%) | 7 (2.9%) |
| $50,000 to $74,999 | 49 (18.9%) | 13 (5.5%) |
| $75,000 to $99,999 | 41 (15.8%) | 23 (9.7%) |
| $100,000 to $149,999 | 56 (21.6%) | 44 (18.5%) |
| $150,000 or more | 59 (22.8%) | 26 (10.9%) |
| Total | 259 (100.0%) | 238 (100.0%) |
Property Value to Household Income Ratio in Bethany Beach
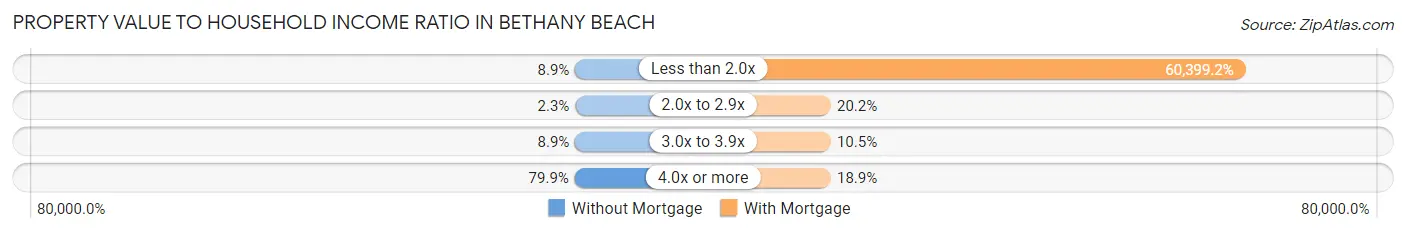
| Value-to-Income Ratio | Without Mortgage | With Mortgage |
| Less than 2.0x | 23 (8.9%) | 143,750 (60,399.2%) |
| 2.0x to 2.9x | 6 (2.3%) | 48 (20.2%) |
| 3.0x to 3.9x | 23 (8.9%) | 25 (10.5%) |
| 4.0x or more | 207 (79.9%) | 45 (18.9%) |
| Total | 259 (100.0%) | 238 (100.0%) |
Real Estate Taxes by Mortgage Status in Bethany Beach
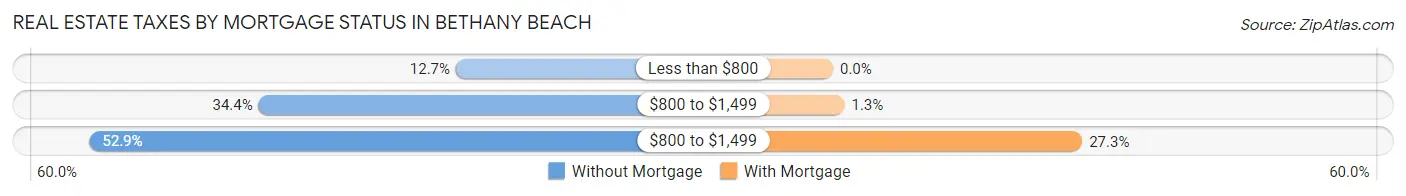
| Property Taxes | Without Mortgage | With Mortgage |
| Less than $800 | 33 (12.7%) | 0 (0.0%) |
| $800 to $1,499 | 89 (34.4%) | 3 (1.3%) |
| $800 to $1,499 | 137 (52.9%) | 65 (27.3%) |
| Total | 259 (100.0%) | 238 (100.0%) |
Health & Disability in Bethany Beach
Health Insurance Coverage by Age in Bethany Beach
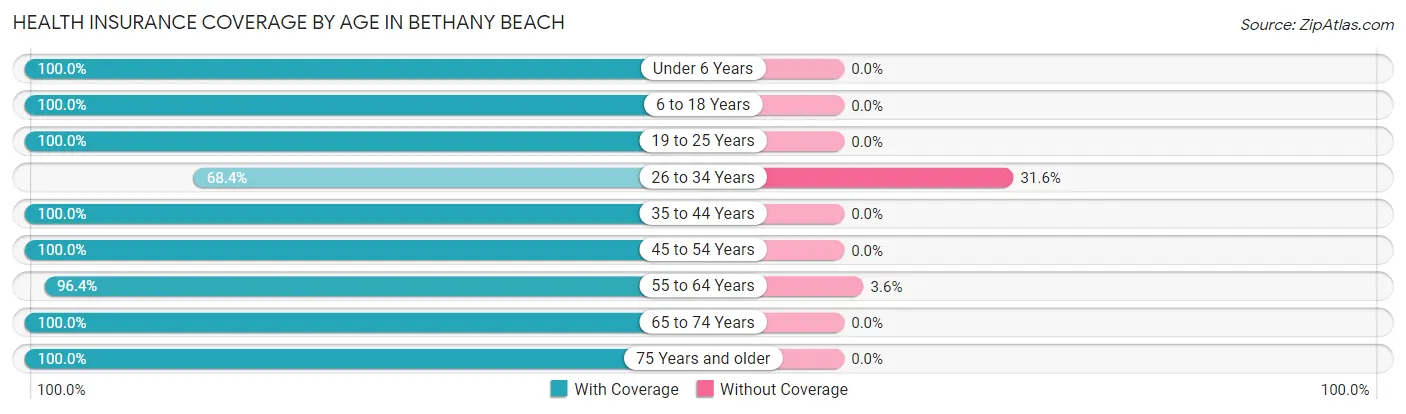
| Age Bracket | With Coverage | Without Coverage |
| Under 6 Years | 19 (100.0%) | 0 (0.0%) |
| 6 to 18 Years | 24 (100.0%) | 0 (0.0%) |
| 19 to 25 Years | 95 (100.0%) | 0 (0.0%) |
| 26 to 34 Years | 39 (68.4%) | 18 (31.6%) |
| 35 to 44 Years | 18 (100.0%) | 0 (0.0%) |
| 45 to 54 Years | 65 (100.0%) | 0 (0.0%) |
| 55 to 64 Years | 187 (96.4%) | 7 (3.6%) |
| 65 to 74 Years | 348 (100.0%) | 0 (0.0%) |
| 75 Years and older | 244 (100.0%) | 0 (0.0%) |
| Total | 1,039 (97.7%) | 25 (2.4%) |
Health Insurance Coverage by Citizenship Status in Bethany Beach
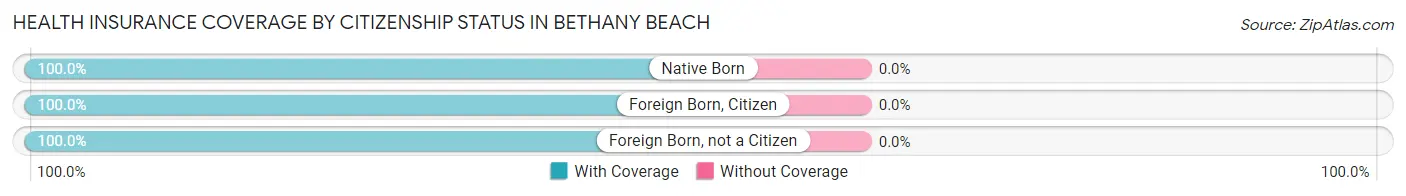
| Citizenship Status | With Coverage | Without Coverage |
| Native Born | 19 (100.0%) | 0 (0.0%) |
| Foreign Born, Citizen | 24 (100.0%) | 0 (0.0%) |
| Foreign Born, not a Citizen | 95 (100.0%) | 0 (0.0%) |
Health Insurance Coverage by Household Income in Bethany Beach
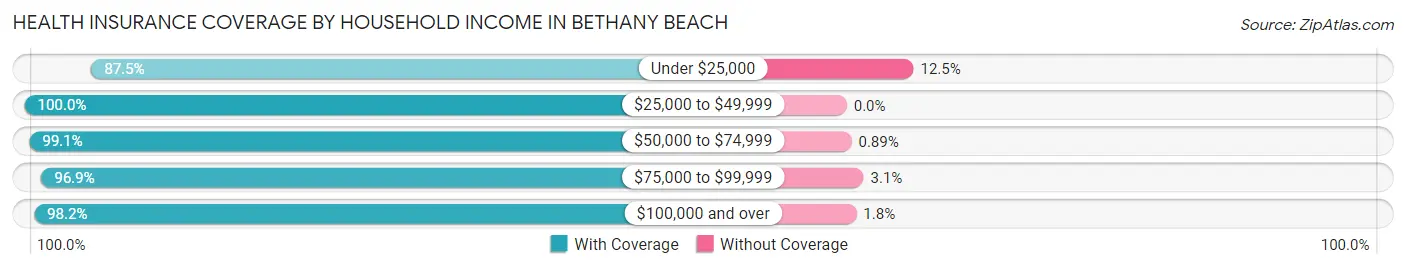
| Household Income | With Coverage | Without Coverage |
| Under $25,000 | 42 (87.5%) | 6 (12.5%) |
| $25,000 to $49,999 | 69 (100.0%) | 0 (0.0%) |
| $50,000 to $74,999 | 111 (99.1%) | 1 (0.9%) |
| $75,000 to $99,999 | 216 (96.9%) | 7 (3.1%) |
| $100,000 and over | 601 (98.2%) | 11 (1.8%) |
Public vs Private Health Insurance Coverage by Age in Bethany Beach
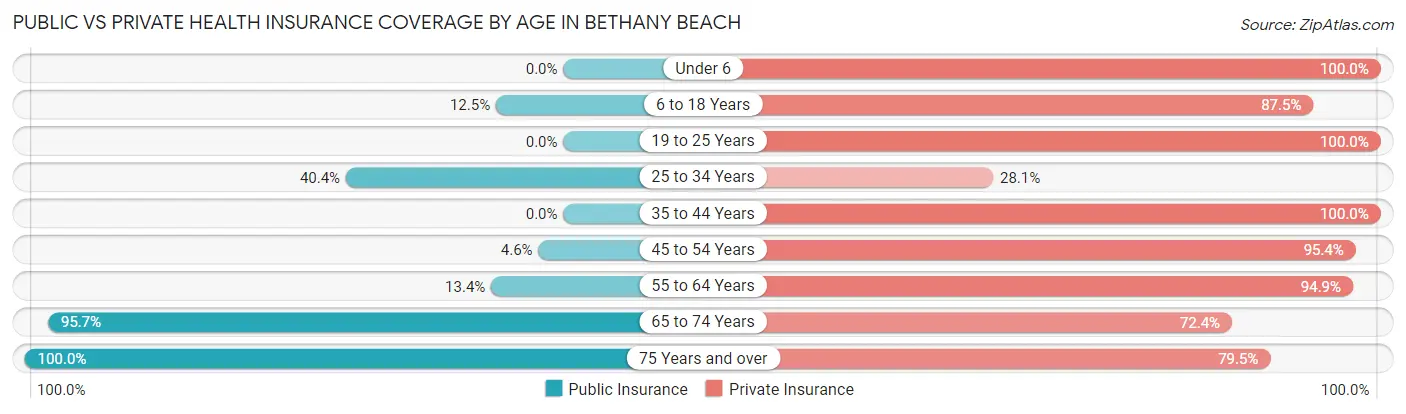
| Age Bracket | Public Insurance | Private Insurance |
| Under 6 | 0 (0.0%) | 19 (100.0%) |
| 6 to 18 Years | 3 (12.5%) | 21 (87.5%) |
| 19 to 25 Years | 0 (0.0%) | 95 (100.0%) |
| 25 to 34 Years | 23 (40.4%) | 16 (28.1%) |
| 35 to 44 Years | 0 (0.0%) | 18 (100.0%) |
| 45 to 54 Years | 3 (4.6%) | 62 (95.4%) |
| 55 to 64 Years | 26 (13.4%) | 184 (94.9%) |
| 65 to 74 Years | 333 (95.7%) | 252 (72.4%) |
| 75 Years and over | 244 (100.0%) | 194 (79.5%) |
| Total | 632 (59.4%) | 861 (80.9%) |
Disability Status by Sex by Age in Bethany Beach

| Age Bracket | Male | Female |
| Under 5 Years | 0 (0.0%) | 0 (0.0%) |
| 5 to 17 Years | 0 (0.0%) | 0 (0.0%) |
| 18 to 34 Years | 0 (0.0%) | 0 (0.0%) |
| 35 to 64 Years | 6 (5.4%) | 23 (13.9%) |
| 65 to 74 Years | 23 (12.4%) | 12 (7.4%) |
| 75 Years and over | 29 (28.7%) | 68 (47.5%) |
Disability Class by Sex by Age in Bethany Beach
Disability Class: Hearing Difficulty
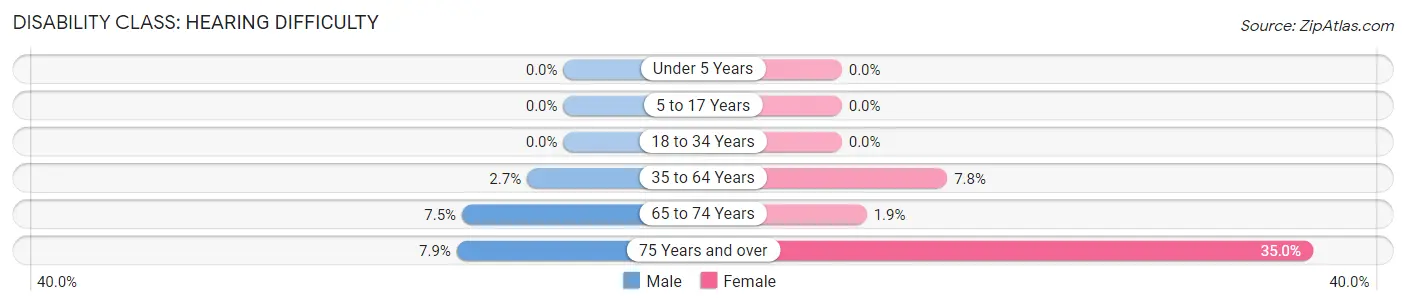
| Age Bracket | Male | Female |
| Under 5 Years | 0 (0.0%) | 0 (0.0%) |
| 5 to 17 Years | 0 (0.0%) | 0 (0.0%) |
| 18 to 34 Years | 0 (0.0%) | 0 (0.0%) |
| 35 to 64 Years | 3 (2.7%) | 13 (7.8%) |
| 65 to 74 Years | 14 (7.5%) | 3 (1.8%) |
| 75 Years and over | 8 (7.9%) | 50 (35.0%) |
Disability Class: Vision Difficulty
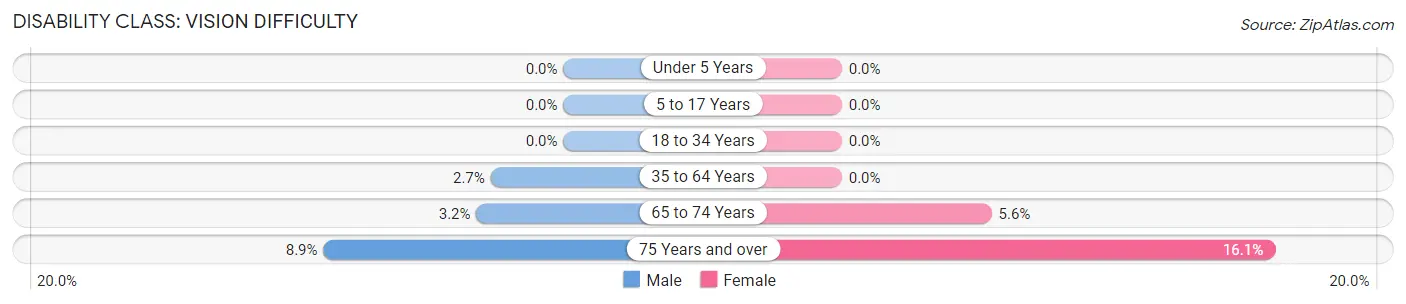
| Age Bracket | Male | Female |
| Under 5 Years | 0 (0.0%) | 0 (0.0%) |
| 5 to 17 Years | 0 (0.0%) | 0 (0.0%) |
| 18 to 34 Years | 0 (0.0%) | 0 (0.0%) |
| 35 to 64 Years | 3 (2.7%) | 0 (0.0%) |
| 65 to 74 Years | 6 (3.2%) | 9 (5.6%) |
| 75 Years and over | 9 (8.9%) | 23 (16.1%) |
Disability Class: Cognitive Difficulty
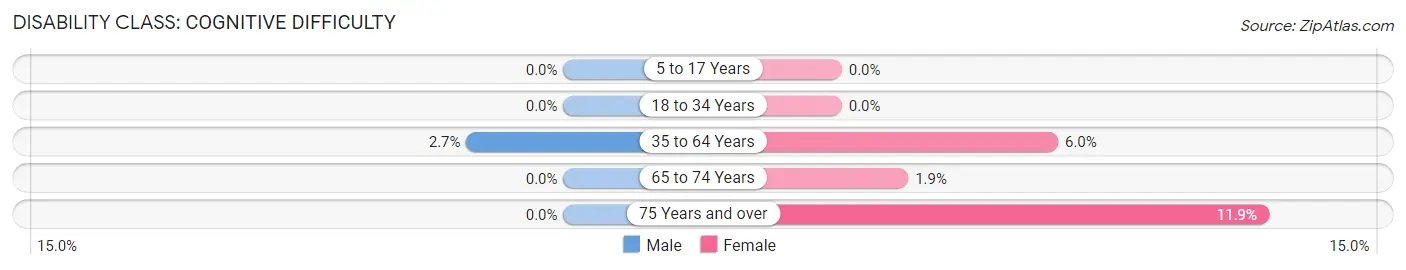
| Age Bracket | Male | Female |
| 5 to 17 Years | 0 (0.0%) | 0 (0.0%) |
| 18 to 34 Years | 0 (0.0%) | 0 (0.0%) |
| 35 to 64 Years | 3 (2.7%) | 10 (6.0%) |
| 65 to 74 Years | 0 (0.0%) | 3 (1.8%) |
| 75 Years and over | 0 (0.0%) | 17 (11.9%) |
Disability Class: Ambulatory Difficulty
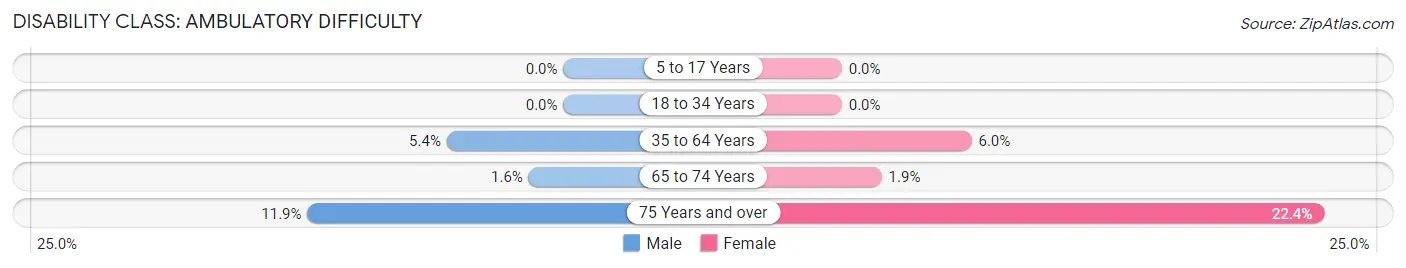
| Age Bracket | Male | Female |
| 5 to 17 Years | 0 (0.0%) | 0 (0.0%) |
| 18 to 34 Years | 0 (0.0%) | 0 (0.0%) |
| 35 to 64 Years | 6 (5.4%) | 10 (6.0%) |
| 65 to 74 Years | 3 (1.6%) | 3 (1.8%) |
| 75 Years and over | 12 (11.9%) | 32 (22.4%) |
Disability Class: Self-Care Difficulty
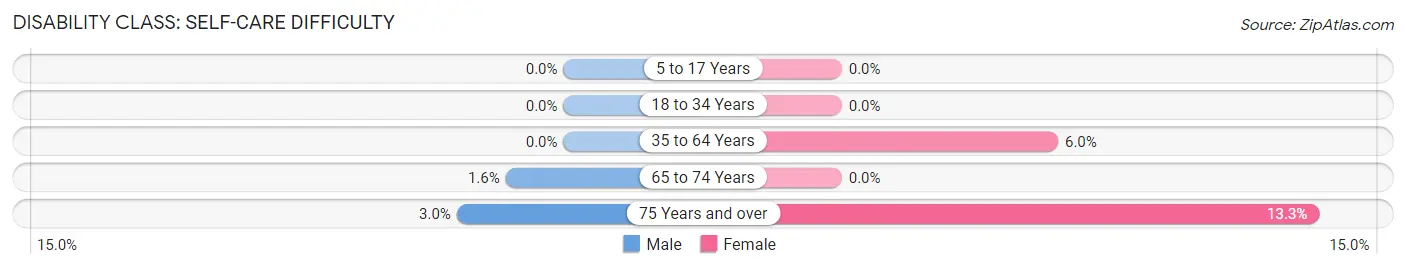
| Age Bracket | Male | Female |
| 5 to 17 Years | 0 (0.0%) | 0 (0.0%) |
| 18 to 34 Years | 0 (0.0%) | 0 (0.0%) |
| 35 to 64 Years | 0 (0.0%) | 10 (6.0%) |
| 65 to 74 Years | 3 (1.6%) | 0 (0.0%) |
| 75 Years and over | 3 (3.0%) | 19 (13.3%) |
Technology Access in Bethany Beach
Computing Device Access in Bethany Beach
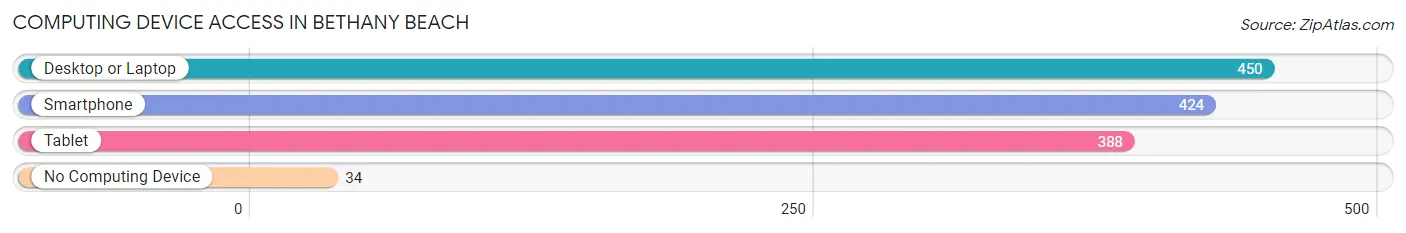
| Device Type | # Households | % Households |
| Desktop or Laptop | 450 | 86.2% |
| Smartphone | 424 | 81.2% |
| Tablet | 388 | 74.3% |
| No Computing Device | 34 | 6.5% |
| Total | 522 | 100.0% |
Internet Access in Bethany Beach
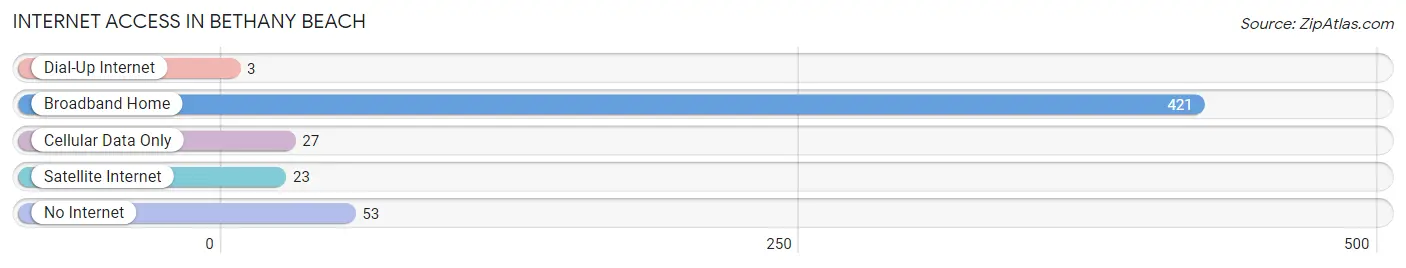
| Internet Type | # Households | % Households |
| Dial-Up Internet | 3 | 0.6% |
| Broadband Home | 421 | 80.6% |
| Cellular Data Only | 27 | 5.2% |
| Satellite Internet | 23 | 4.4% |
| No Internet | 53 | 10.2% |
| Total | 522 | 100.0% |
Bethany Beach Summary
Bethany Beach is a small town located in Sussex County, Delaware, United States. It is situated along the Atlantic Ocean, just south of Rehoboth Beach and north of Fenwick Island. The town was founded in 1906 and incorporated in 1981. It is a popular summer destination for tourists and vacationers, and is known for its quiet, family-friendly atmosphere.
History
Bethany Beach was founded in 1906 by the Reverend John P. Emory, a Methodist minister from Pennsylvania. He purchased a tract of land along the Atlantic Ocean and named it Bethany Beach, after the biblical town of Bethany. The town was originally a Methodist camp meeting ground, and the first cottages were built in the early 1900s.
In the 1920s, the town began to attract more visitors, and the first boardwalk was built in 1925. The boardwalk was destroyed by a hurricane in 1933, but was rebuilt in 1934. The town continued to grow in popularity, and in the 1950s, the first condominiums were built.
In the 1970s, the town began to experience rapid growth, and in 1981, it was incorporated as a town. Since then, the town has continued to grow, and today, it is a popular summer destination for tourists and vacationers.
Geography
Bethany Beach is located in Sussex County, Delaware, United States. It is situated along the Atlantic Ocean, just south of Rehoboth Beach and north of Fenwick Island. The town covers an area of 1.3 square miles, and has a population of 1,060 (as of the 2010 census).
The town is bordered to the north by the Atlantic Ocean, to the east by the Assawoman Bay, to the south by the Indian River Bay, and to the west by the town of South Bethany. The town is located within the Coastal Plain physiographic province, and is characterized by flat, sandy terrain.
Economy
The economy of Bethany Beach is largely based on tourism. The town is a popular summer destination for tourists and vacationers, and is known for its quiet, family-friendly atmosphere. The town is home to a variety of restaurants, shops, and other businesses catering to tourists.
The town is also home to several large employers, including the Bethany Beach Resort, the Sea Colony Resort, and the Bethany Beach Ocean Suites. These employers provide jobs for many of the town's residents.
Demographics
As of the 2010 census, the population of Bethany Beach was 1,060. The racial makeup of the town was 94.3% White, 1.7% African American, 0.3% Native American, 1.2% Asian, 0.7% from other races, and 1.9% from two or more races. Hispanic or Latino of any race were 2.2% of the population.
The median household income in Bethany Beach was $68,750, and the median family income was $77,500. The per capita income for the town was $41,945. About 4.3% of families and 6.2% of the population were below the poverty line, including 8.3% of those under age 18 and 4.2% of those age 65 or over.
Common Questions
What is Per Capita Income in Bethany Beach?
Per Capita income in Bethany Beach is $80,028.
What is the Median Family Income in Bethany Beach?
Median Family Income in Bethany Beach is $135,417.
What is the Median Household income in Bethany Beach?
Median Household Income in Bethany Beach is $104,167.
What is Income or Wage Gap in Bethany Beach?
Income or Wage Gap in Bethany Beach is 43.5%.
Women in Bethany Beach earn 56.5 cents for every dollar earned by a man.
What is Inequality or Gini Index in Bethany Beach?
Inequality or Gini Index in Bethany Beach is 0.46.
What is the Total Population of Bethany Beach?
Total Population of Bethany Beach is 1,064.
What is the Total Male Population of Bethany Beach?
Total Male Population of Bethany Beach is 480.
What is the Total Female Population of Bethany Beach?
Total Female Population of Bethany Beach is 584.
What is the Ratio of Males per 100 Females in Bethany Beach?
There are 82.19 Males per 100 Females in Bethany Beach.
What is the Ratio of Females per 100 Males in Bethany Beach?
There are 121.67 Females per 100 Males in Bethany Beach.
What is the Median Population Age in Bethany Beach?
Median Population Age in Bethany Beach is 66.8 Years.
What is the Average Family Size in Bethany Beach
Average Family Size in Bethany Beach is 2.4 People.
What is the Average Household Size in Bethany Beach
Average Household Size in Bethany Beach is 2.0 People.
How Large is the Labor Force in Bethany Beach?
There are 400 People in the Labor Forcein in Bethany Beach.
What is the Percentage of People in the Labor Force in Bethany Beach?
38.6% of People are in the Labor Force in Bethany Beach.
What is the Unemployment Rate in Bethany Beach?
Unemployment Rate in Bethany Beach is 2.3%.