Delmar, DE Map & Demographics
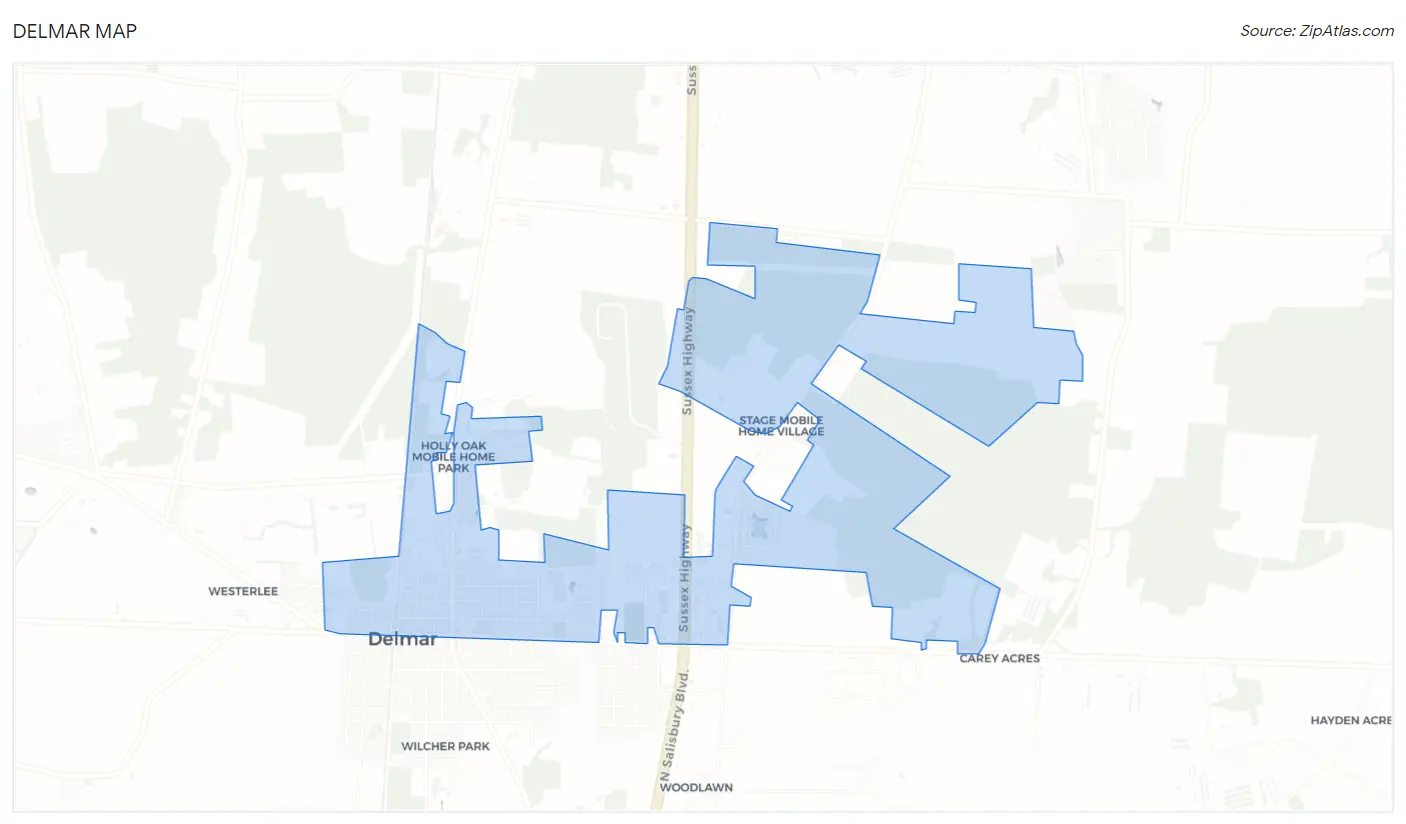
Delmar Map
Delmar Overview
$25,221
PER CAPITA INCOME
$65,948
AVG FAMILY INCOME
$55,625
AVG HOUSEHOLD INCOME
32.1%
WAGE / INCOME GAP [ % ]
67.9¢/ $1
WAGE / INCOME GAP [ $ ]
$8,338
FAMILY INCOME DEFICIT
0.37
INEQUALITY / GINI INDEX
2,398
TOTAL POPULATION
1,107
MALE POPULATION
1,291
FEMALE POPULATION
85.75
MALES / 100 FEMALES
116.62
FEMALES / 100 MALES
36.5
MEDIAN AGE
3.4
AVG FAMILY SIZE
2.6
AVG HOUSEHOLD SIZE
1,044
LABOR FORCE [ PEOPLE ]
57.9%
PERCENT IN LABOR FORCE
5.2%
UNEMPLOYMENT RATE
Delmar Zip Codes
Delmar Area Codes
Income in Delmar
Income Overview in Delmar
Per Capita Income in Delmar is $25,221, while median incomes of families and households are $65,948 and $55,625 respectively.
| Characteristic | Number | Measure |
| Per Capita Income | 2,398 | $25,221 |
| Median Family Income | 550 | $65,948 |
| Mean Family Income | 550 | $72,335 |
| Median Household Income | 886 | $55,625 |
| Mean Household Income | 886 | $61,997 |
| Income Deficit | 550 | $8,338 |
| Wage / Income Gap (%) | 2,398 | 32.10% |
| Wage / Income Gap ($) | 2,398 | 67.90¢ per $1 |
| Gini / Inequality Index | 2,398 | 0.37 |
Earnings by Sex in Delmar
Average Earnings in Delmar are $33,615, $40,278 for men and $27,349 for women, a difference of 32.1%.
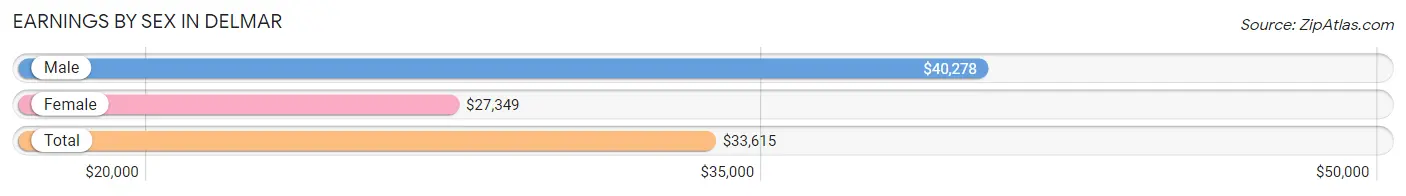
| Sex | Number | Average Earnings |
| Male | 506 (47.0%) | $40,278 |
| Female | 571 (53.0%) | $27,349 |
| Total | 1,077 (100.0%) | $33,615 |
Earnings by Sex by Income Bracket in Delmar
The most common earnings brackets in Delmar are $75,000 to $99,999 for men (80 | 15.8%) and $25,000 to $29,999 for women (88 | 15.4%).
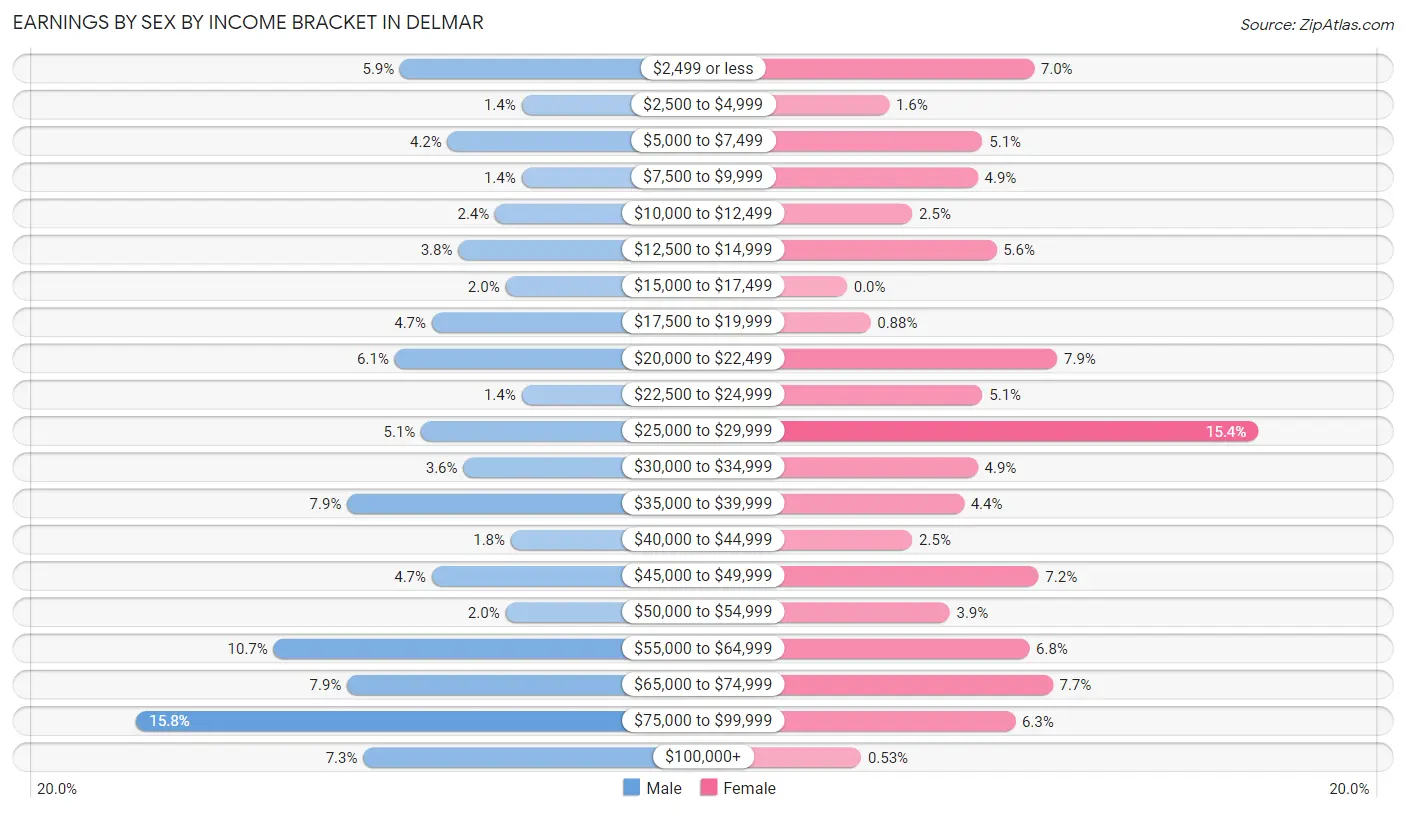
| Income | Male | Female |
| $2,499 or less | 30 (5.9%) | 40 (7.0%) |
| $2,500 to $4,999 | 7 (1.4%) | 9 (1.6%) |
| $5,000 to $7,499 | 21 (4.2%) | 29 (5.1%) |
| $7,500 to $9,999 | 7 (1.4%) | 28 (4.9%) |
| $10,000 to $12,499 | 12 (2.4%) | 14 (2.5%) |
| $12,500 to $14,999 | 19 (3.7%) | 32 (5.6%) |
| $15,000 to $17,499 | 10 (2.0%) | 0 (0.0%) |
| $17,500 to $19,999 | 24 (4.7%) | 5 (0.9%) |
| $20,000 to $22,499 | 31 (6.1%) | 45 (7.9%) |
| $22,500 to $24,999 | 7 (1.4%) | 29 (5.1%) |
| $25,000 to $29,999 | 26 (5.1%) | 88 (15.4%) |
| $30,000 to $34,999 | 18 (3.6%) | 28 (4.9%) |
| $35,000 to $39,999 | 40 (7.9%) | 25 (4.4%) |
| $40,000 to $44,999 | 9 (1.8%) | 14 (2.5%) |
| $45,000 to $49,999 | 24 (4.7%) | 41 (7.2%) |
| $50,000 to $54,999 | 10 (2.0%) | 22 (3.8%) |
| $55,000 to $64,999 | 54 (10.7%) | 39 (6.8%) |
| $65,000 to $74,999 | 40 (7.9%) | 44 (7.7%) |
| $75,000 to $99,999 | 80 (15.8%) | 36 (6.3%) |
| $100,000+ | 37 (7.3%) | 3 (0.5%) |
| Total | 506 (100.0%) | 571 (100.0%) |
Earnings by Sex by Educational Attainment in Delmar
Average earnings in Delmar are $48,750 for men and $34,803 for women, a difference of 28.6%. Men with an educational attainment of bachelor's degree enjoy the highest average annual earnings of $77,308, while those with college or associate's degree education earn the least with $39,464. Women with an educational attainment of graduate degree earn the most with the average annual earnings of $65,216, while those with high school diploma education have the smallest earnings of $24,643.
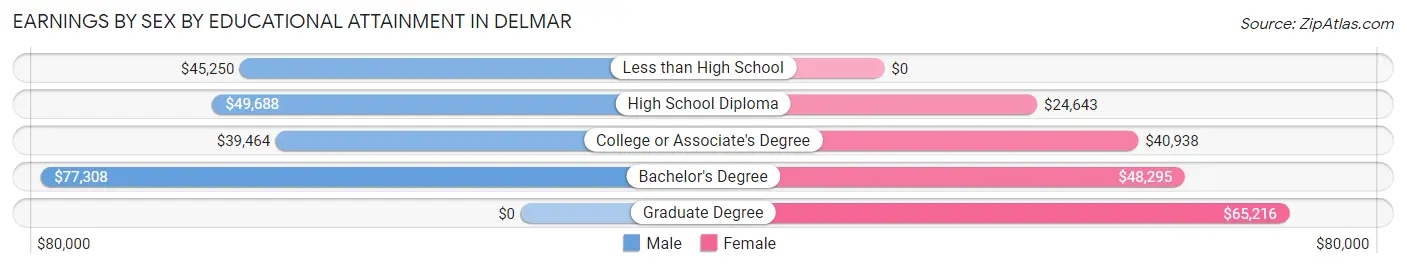
| Educational Attainment | Male Income | Female Income |
| Less than High School | $45,250 | $0 |
| High School Diploma | $49,688 | $24,643 |
| College or Associate's Degree | $39,464 | $40,938 |
| Bachelor's Degree | $77,308 | $48,295 |
| Graduate Degree | - | - |
| Total | $48,750 | $34,803 |
Family Income in Delmar
Family Income Brackets in Delmar
According to the Delmar family income data, there are 137 families falling into the $50,000 to $74,999 income range, which is the most common income bracket and makes up 24.9% of all families. Conversely, the less than $10,000 income bracket is the least frequent group with only 3 families (0.5%) belonging to this category.
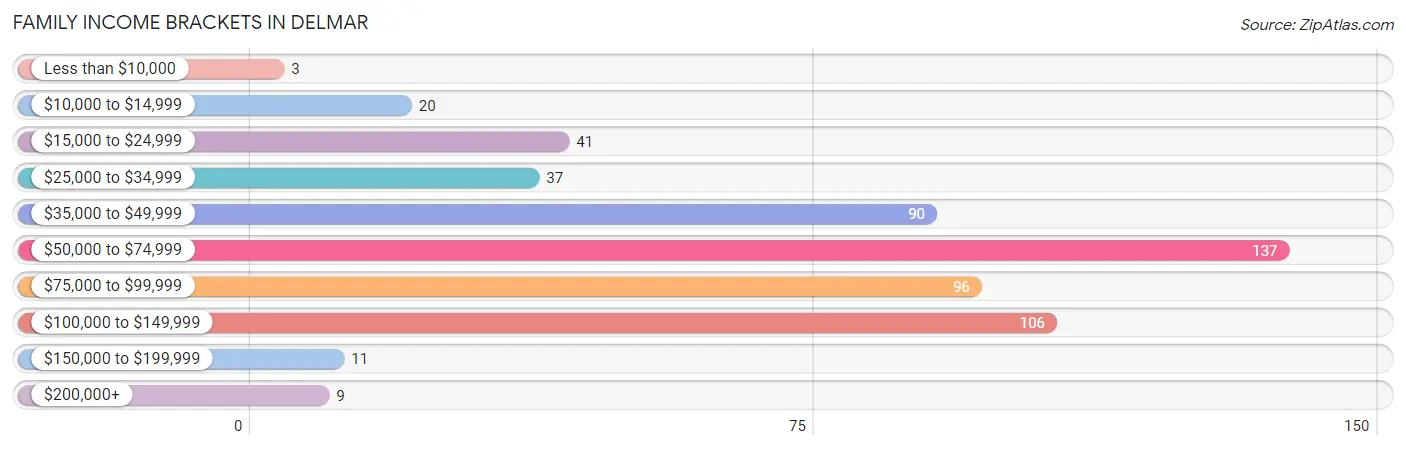
| Income Bracket | # Families | % Families |
| Less than $10,000 | 3 | 0.5% |
| $10,000 to $14,999 | 20 | 3.6% |
| $15,000 to $24,999 | 41 | 7.5% |
| $25,000 to $34,999 | 37 | 6.7% |
| $35,000 to $49,999 | 90 | 16.4% |
| $50,000 to $74,999 | 137 | 24.9% |
| $75,000 to $99,999 | 96 | 17.5% |
| $100,000 to $149,999 | 106 | 19.3% |
| $150,000 to $199,999 | 11 | 2.0% |
| $200,000+ | 9 | 1.6% |
Family Income by Famaliy Size in Delmar
7+ person families (19 | 3.5%) account for the highest median family income in Delmar with $85,982 per family, while 2-person families (242 | 44.0%) have the highest median income of $33,190 per family member.
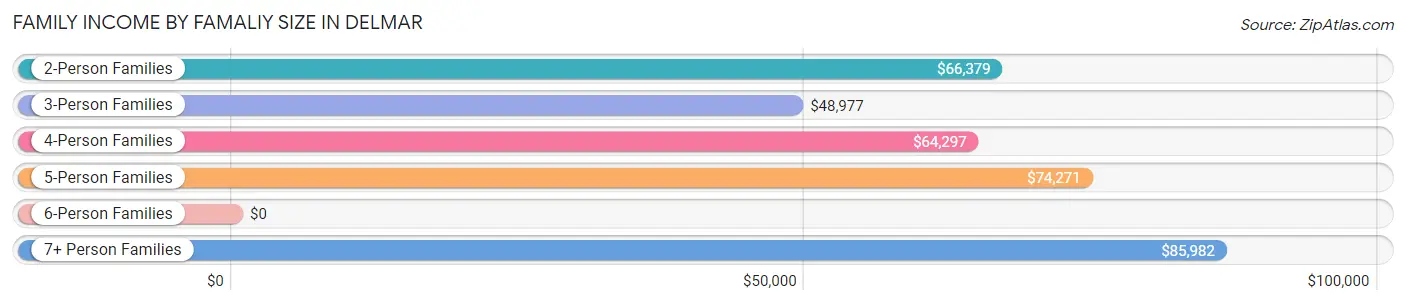
| Income Bracket | # Families | Median Income |
| 2-Person Families | 242 (44.0%) | $66,379 |
| 3-Person Families | 99 (18.0%) | $48,977 |
| 4-Person Families | 115 (20.9%) | $64,297 |
| 5-Person Families | 71 (12.9%) | $74,271 |
| 6-Person Families | 4 (0.7%) | $0 |
| 7+ Person Families | 19 (3.5%) | $85,982 |
| Total | 550 (100.0%) | $65,948 |
Family Income by Number of Earners in Delmar
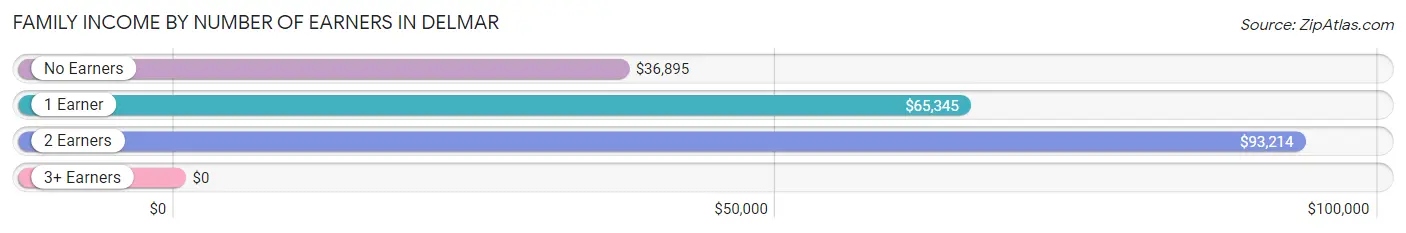
| Number of Earners | # Families | Median Income |
| No Earners | 67 (12.2%) | $36,895 |
| 1 Earner | 268 (48.7%) | $65,345 |
| 2 Earners | 146 (26.6%) | $93,214 |
| 3+ Earners | 69 (12.6%) | $0 |
| Total | 550 (100.0%) | $65,948 |
Household Income in Delmar
Household Income Brackets in Delmar
With 210 households falling in the category, the $50,000 to $74,999 income range is the most frequent in Delmar, accounting for 23.7% of all households. In contrast, only 9 households (1.0%) fall into the less than $10,000 income bracket, making it the least populous group.
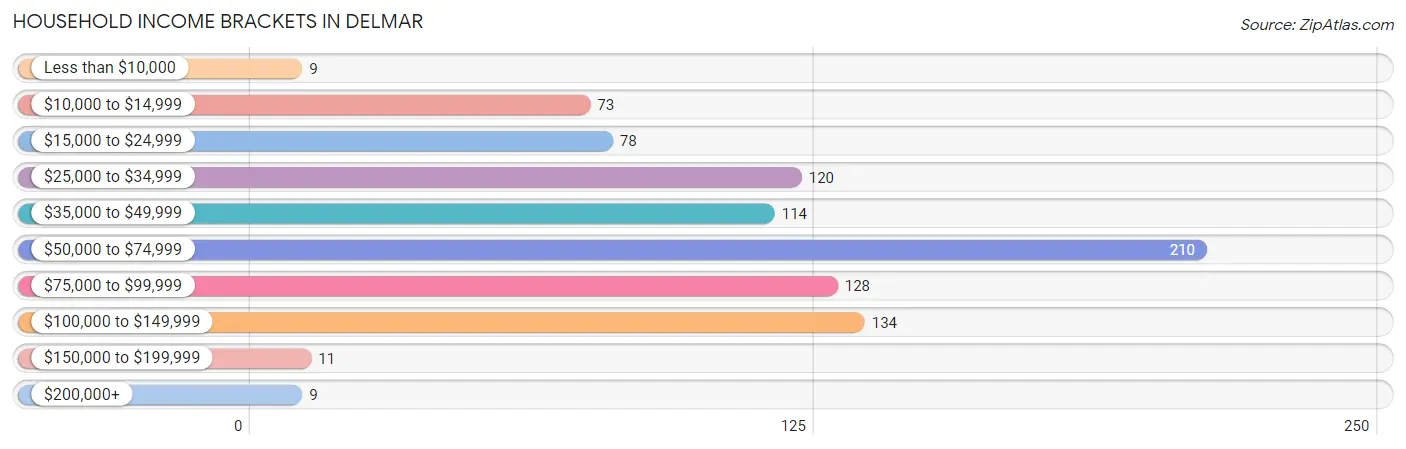
| Income Bracket | # Households | % Households |
| Less than $10,000 | 9 | 1.0% |
| $10,000 to $14,999 | 73 | 8.2% |
| $15,000 to $24,999 | 78 | 8.8% |
| $25,000 to $34,999 | 120 | 13.5% |
| $35,000 to $49,999 | 114 | 12.9% |
| $50,000 to $74,999 | 210 | 23.7% |
| $75,000 to $99,999 | 128 | 14.4% |
| $100,000 to $149,999 | 134 | 15.1% |
| $150,000 to $199,999 | 11 | 1.2% |
| $200,000+ | 9 | 1.0% |
Household Income by Householder Age in Delmar
The median household income in Delmar is $55,625, with the highest median household income of $62,083 found in the 25 to 44 years age bracket for the primary householder. A total of 312 households (35.2%) fall into this category. Meanwhile, the 15 to 24 years age bracket for the primary householder has the lowest median household income of $0, with 9 households (1.0%) in this group.
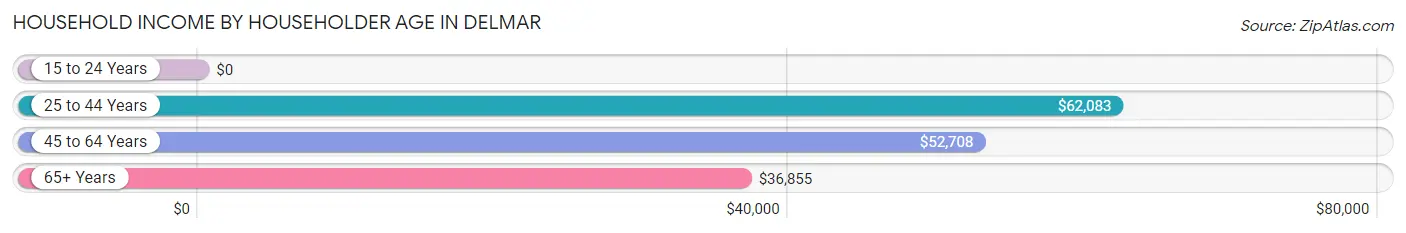
| Income Bracket | # Households | Median Income |
| 15 to 24 Years | 9 (1.0%) | $0 |
| 25 to 44 Years | 312 (35.2%) | $62,083 |
| 45 to 64 Years | 307 (34.6%) | $52,708 |
| 65+ Years | 258 (29.1%) | $36,855 |
| Total | 886 (100.0%) | $55,625 |
Poverty in Delmar
Income Below Poverty by Sex and Age in Delmar
With 14.8% poverty level for males and 14.1% for females among the residents of Delmar, 18 to 24 year old males and 5 year old females are the most vulnerable to poverty, with 24 males (42.1%) and 3 females (100.0%) in their respective age groups living below the poverty level.
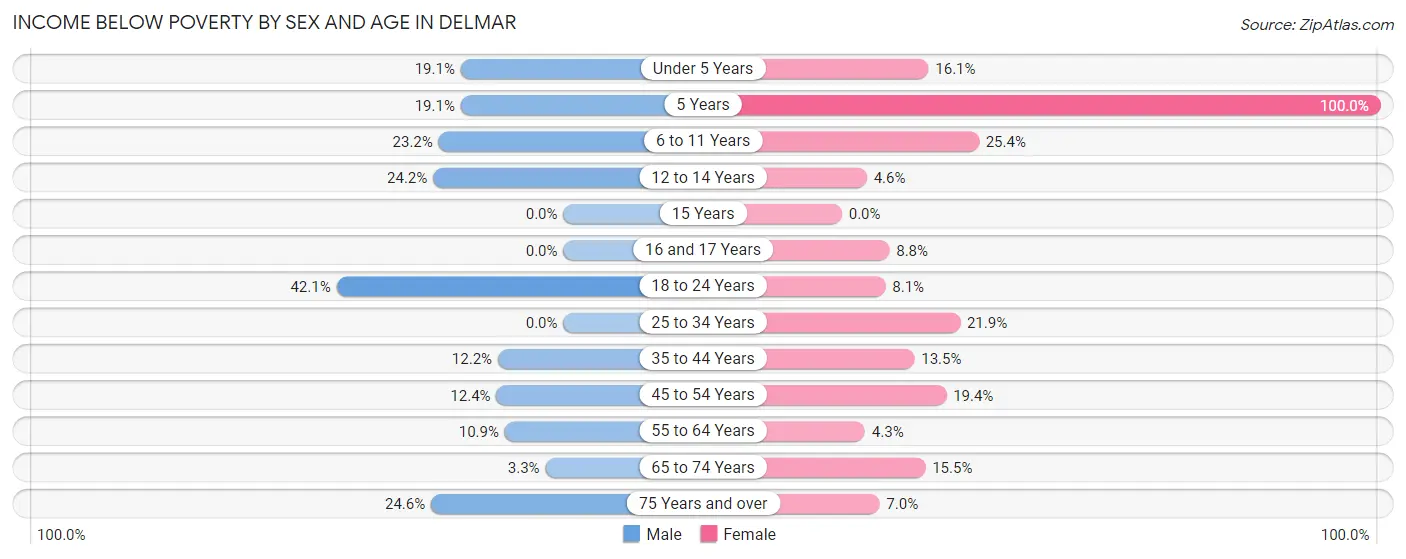
| Age Bracket | Male | Female |
| Under 5 Years | 24 (19.1%) | 9 (16.1%) |
| 5 Years | 4 (19.1%) | 3 (100.0%) |
| 6 to 11 Years | 25 (23.2%) | 30 (25.4%) |
| 12 to 14 Years | 22 (24.2%) | 3 (4.6%) |
| 15 Years | 0 (0.0%) | 0 (0.0%) |
| 16 and 17 Years | 0 (0.0%) | 3 (8.8%) |
| 18 to 24 Years | 24 (42.1%) | 11 (8.1%) |
| 25 to 34 Years | 0 (0.0%) | 34 (21.9%) |
| 35 to 44 Years | 13 (12.1%) | 23 (13.5%) |
| 45 to 54 Years | 23 (12.4%) | 25 (19.4%) |
| 55 to 64 Years | 5 (10.9%) | 6 (4.3%) |
| 65 to 74 Years | 3 (3.3%) | 22 (15.5%) |
| 75 Years and over | 14 (24.6%) | 6 (7.0%) |
| Total | 157 (14.8%) | 175 (14.1%) |
Income Above Poverty by Sex and Age in Delmar
According to the poverty statistics in Delmar, males aged 16 and 17 years and females aged 15 years are the age groups that are most secure financially, with 100.0% of males and 100.0% of females in these age groups living above the poverty line.
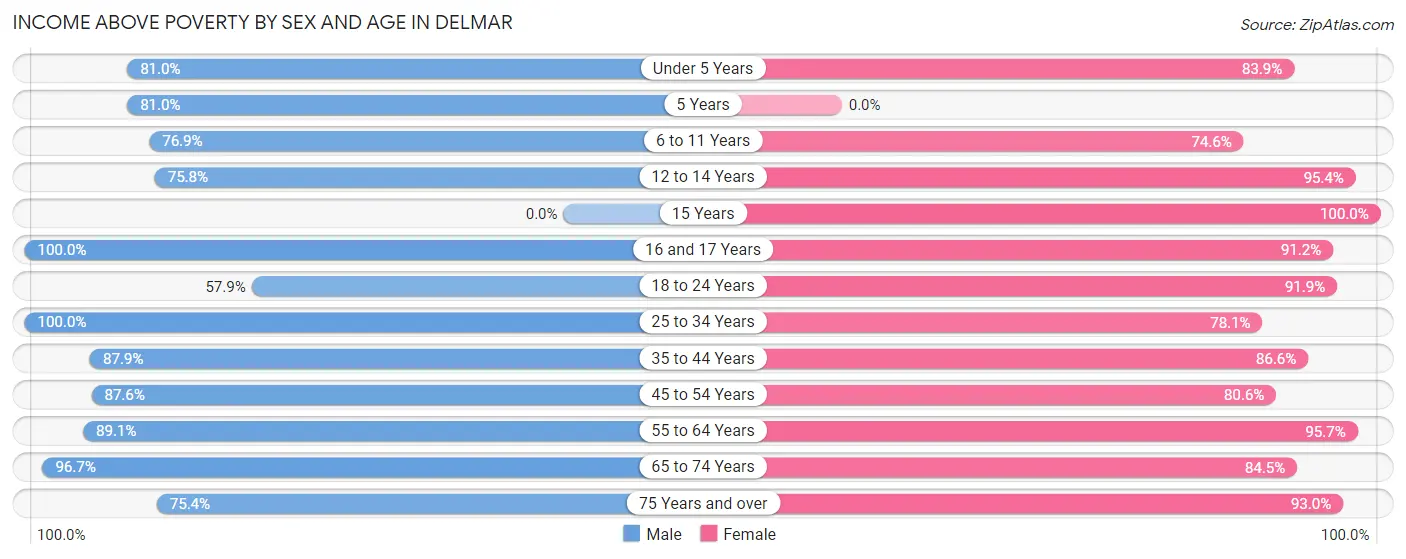
| Age Bracket | Male | Female |
| Under 5 Years | 102 (80.9%) | 47 (83.9%) |
| 5 Years | 17 (80.9%) | 0 (0.0%) |
| 6 to 11 Years | 83 (76.8%) | 88 (74.6%) |
| 12 to 14 Years | 69 (75.8%) | 62 (95.4%) |
| 15 Years | 0 (0.0%) | 7 (100.0%) |
| 16 and 17 Years | 9 (100.0%) | 31 (91.2%) |
| 18 to 24 Years | 33 (57.9%) | 125 (91.9%) |
| 25 to 34 Years | 167 (100.0%) | 121 (78.1%) |
| 35 to 44 Years | 94 (87.8%) | 148 (86.6%) |
| 45 to 54 Years | 162 (87.6%) | 104 (80.6%) |
| 55 to 64 Years | 41 (89.1%) | 134 (95.7%) |
| 65 to 74 Years | 87 (96.7%) | 120 (84.5%) |
| 75 Years and over | 43 (75.4%) | 80 (93.0%) |
| Total | 907 (85.2%) | 1,067 (85.9%) |
Income Below Poverty Among Married-Couple Families in Delmar
The poverty statistics for married-couple families in Delmar show that 10.8% or 36 of the total 332 families live below the poverty line. Families with 3 or 4 children have the highest poverty rate of 31.2%, comprising of 20 families. On the other hand, families with 1 or 2 children have the lowest poverty rate of 0.0%, which includes 0 families.
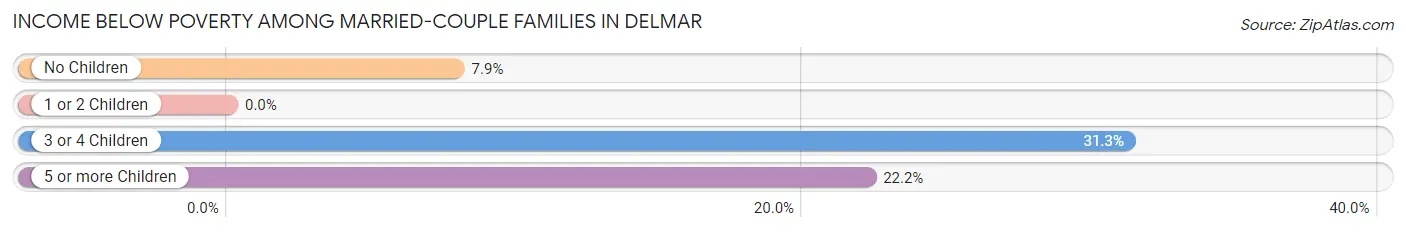
| Children | Above Poverty | Below Poverty |
| No Children | 140 (92.1%) | 12 (7.9%) |
| 1 or 2 Children | 98 (100.0%) | 0 (0.0%) |
| 3 or 4 Children | 44 (68.8%) | 20 (31.2%) |
| 5 or more Children | 14 (77.8%) | 4 (22.2%) |
| Total | 296 (89.2%) | 36 (10.8%) |
Income Below Poverty Among Single-Parent Households in Delmar
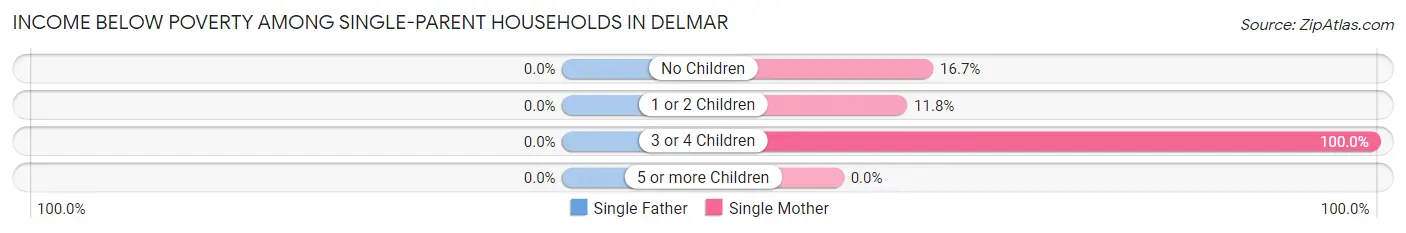
| Children | Single Father | Single Mother |
| No Children | 0 (0.0%) | 11 (16.7%) |
| 1 or 2 Children | 0 (0.0%) | 11 (11.8%) |
| 3 or 4 Children | 0 (0.0%) | 8 (100.0%) |
| 5 or more Children | 0 (0.0%) | 0 (0.0%) |
| Total | 0 (0.0%) | 30 (18.0%) |
Income Below Poverty Among Married-Couple vs Single-Parent Households in Delmar
The poverty data for Delmar shows that 36 of the married-couple family households (10.8%) and 30 of the single-parent households (13.8%) are living below the poverty level. Within the married-couple family households, those with 3 or 4 children have the highest poverty rate, with 20 households (31.2%) falling below the poverty line. Among the single-parent households, those with 3 or 4 children have the highest poverty rate, with 8 household (100.0%) living below poverty.
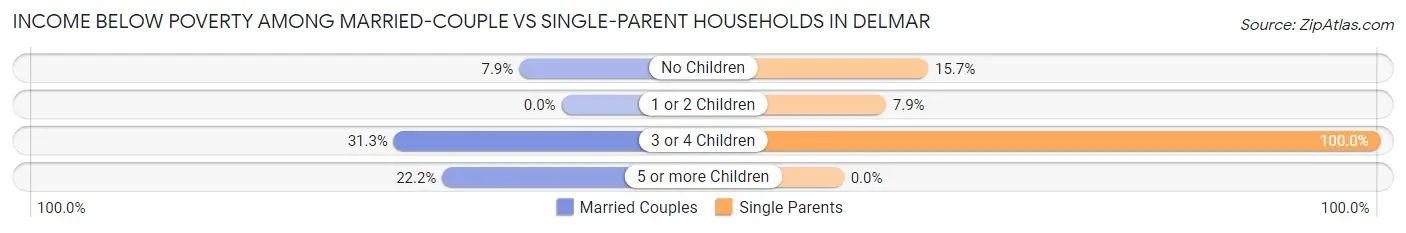
| Children | Married-Couple Families | Single-Parent Households |
| No Children | 12 (7.9%) | 11 (15.7%) |
| 1 or 2 Children | 0 (0.0%) | 11 (7.9%) |
| 3 or 4 Children | 20 (31.2%) | 8 (100.0%) |
| 5 or more Children | 4 (22.2%) | 0 (0.0%) |
| Total | 36 (10.8%) | 30 (13.8%) |
Race in Delmar
The most populous races in Delmar are White / Caucasian (1,554 | 64.8%), Black / African American (626 | 26.1%), and Two or more Races (184 | 7.7%).
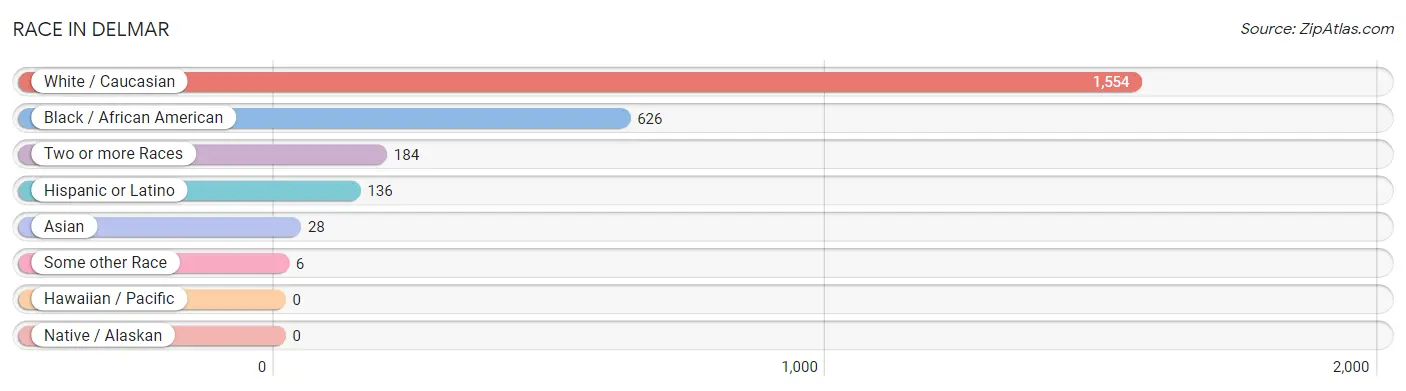
| Race | # Population | % Population |
| Asian | 28 | 1.2% |
| Black / African American | 626 | 26.1% |
| Hawaiian / Pacific | 0 | 0.0% |
| Hispanic or Latino | 136 | 5.7% |
| Native / Alaskan | 0 | 0.0% |
| White / Caucasian | 1,554 | 64.8% |
| Two or more Races | 184 | 7.7% |
| Some other Race | 6 | 0.3% |
| Total | 2,398 | 100.0% |
Ancestry in Delmar
The most populous ancestries reported in Delmar are English (357 | 14.9%), Irish (316 | 13.2%), German (181 | 7.5%), Italian (170 | 7.1%), and American (151 | 6.3%), together accounting for 49.0% of all Delmar residents.
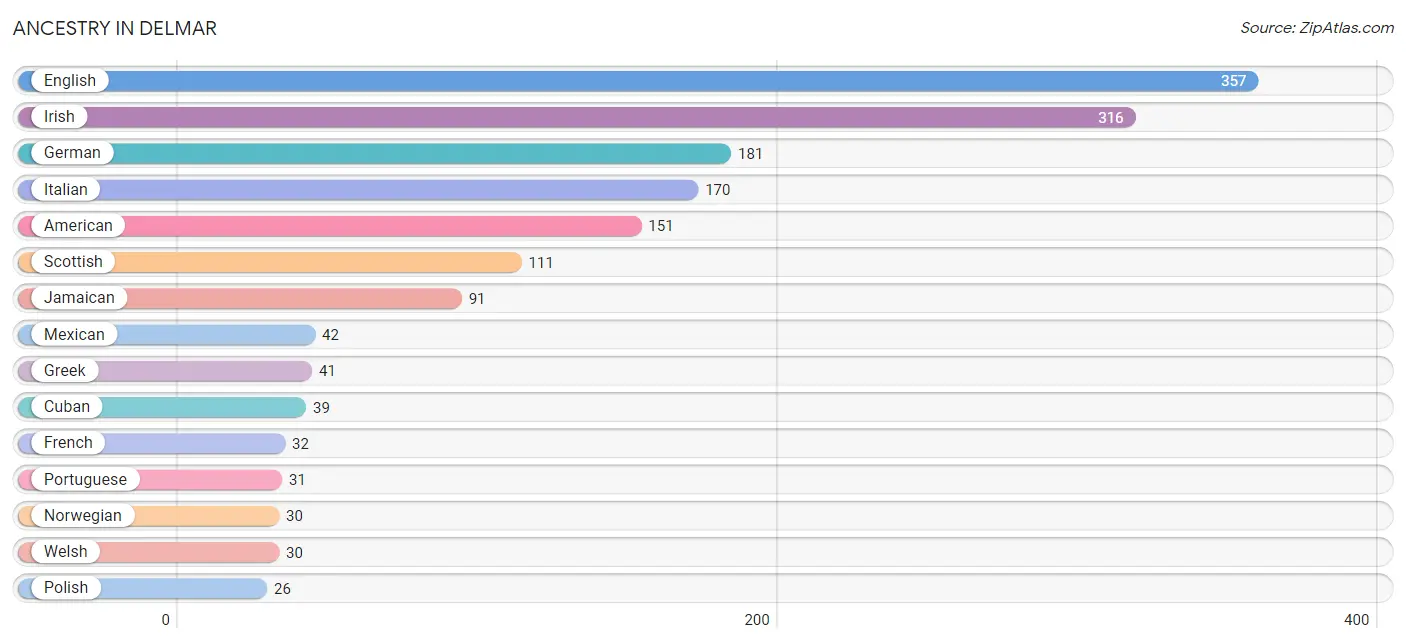
| Ancestry | # Population | % Population |
| American | 151 | 6.3% |
| Brazilian | 5 | 0.2% |
| British | 4 | 0.2% |
| Cuban | 39 | 1.6% |
| Czech | 3 | 0.1% |
| Dominican | 12 | 0.5% |
| Dutch | 5 | 0.2% |
| English | 357 | 14.9% |
| European | 13 | 0.5% |
| French | 32 | 1.3% |
| German | 181 | 7.5% |
| Greek | 41 | 1.7% |
| Haitian | 21 | 0.9% |
| Hungarian | 5 | 0.2% |
| Irish | 316 | 13.2% |
| Italian | 170 | 7.1% |
| Jamaican | 91 | 3.8% |
| Korean | 22 | 0.9% |
| Mexican | 42 | 1.8% |
| New Zealander | 4 | 0.2% |
| Norwegian | 30 | 1.3% |
| Pakistani | 8 | 0.3% |
| Pennsylvania German | 5 | 0.2% |
| Peruvian | 2 | 0.1% |
| Polish | 26 | 1.1% |
| Portuguese | 31 | 1.3% |
| Puerto Rican | 19 | 0.8% |
| Russian | 4 | 0.2% |
| Scotch-Irish | 16 | 0.7% |
| Scottish | 111 | 4.6% |
| Sioux | 6 | 0.3% |
| South American | 2 | 0.1% |
| Spaniard | 22 | 0.9% |
| Sri Lankan | 11 | 0.5% |
| Swedish | 14 | 0.6% |
| Thai | 9 | 0.4% |
| Turkish | 8 | 0.3% |
| Welsh | 30 | 1.3% | View All 38 Rows |
Immigrants in Delmar
The most numerous immigrant groups reported in Delmar came from Latin America (80 | 3.3%), Caribbean (62 | 2.6%), Jamaica (52 | 2.2%), Asia (35 | 1.5%), and South Eastern Asia (23 | 1.0%), together accounting for 10.5% of all Delmar residents.
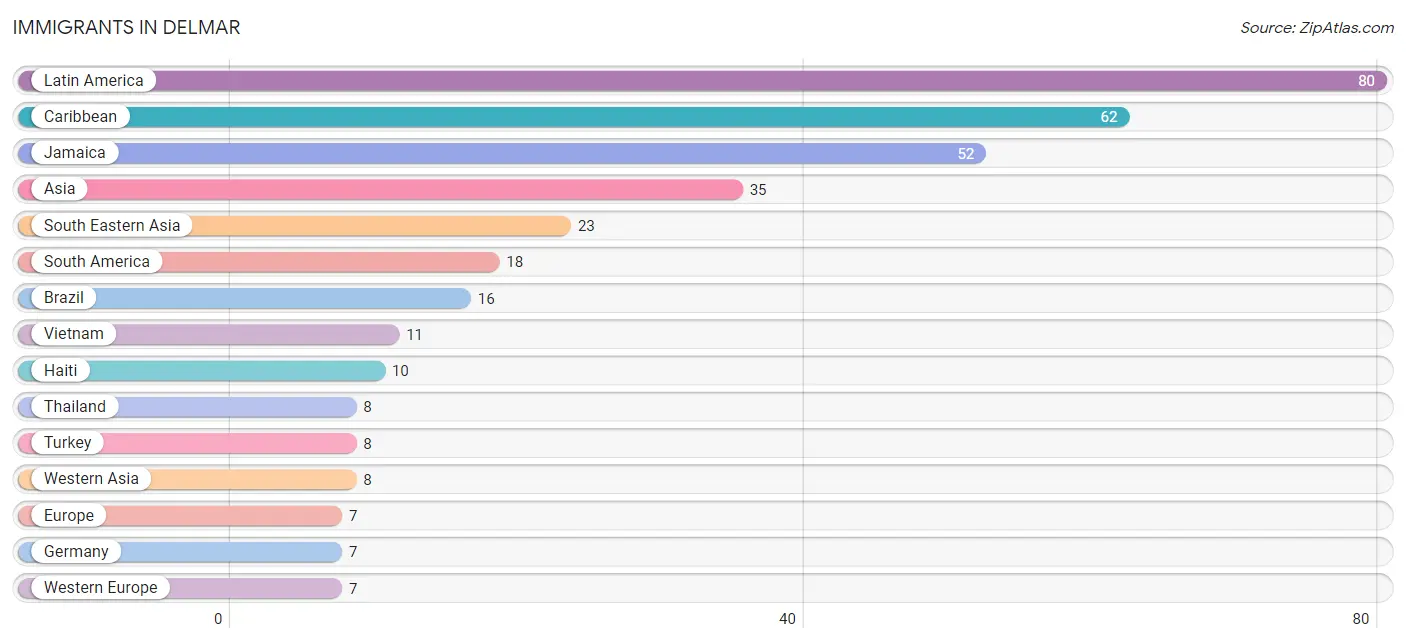
| Immigration Origin | # Population | % Population |
| Asia | 35 | 1.5% |
| Brazil | 16 | 0.7% |
| Caribbean | 62 | 2.6% |
| Europe | 7 | 0.3% |
| Germany | 7 | 0.3% |
| Haiti | 10 | 0.4% |
| India | 4 | 0.2% |
| Jamaica | 52 | 2.2% |
| Latin America | 80 | 3.3% |
| Peru | 2 | 0.1% |
| Philippines | 4 | 0.2% |
| South America | 18 | 0.7% |
| South Central Asia | 4 | 0.2% |
| South Eastern Asia | 23 | 1.0% |
| Thailand | 8 | 0.3% |
| Turkey | 8 | 0.3% |
| Vietnam | 11 | 0.5% |
| Western Asia | 8 | 0.3% |
| Western Europe | 7 | 0.3% | View All 19 Rows |
Sex and Age in Delmar
Sex and Age in Delmar
The most populous age groups in Delmar are Under 5 Years (126 | 11.4%) for men and 20 to 24 Years (124 | 9.6%) for women.
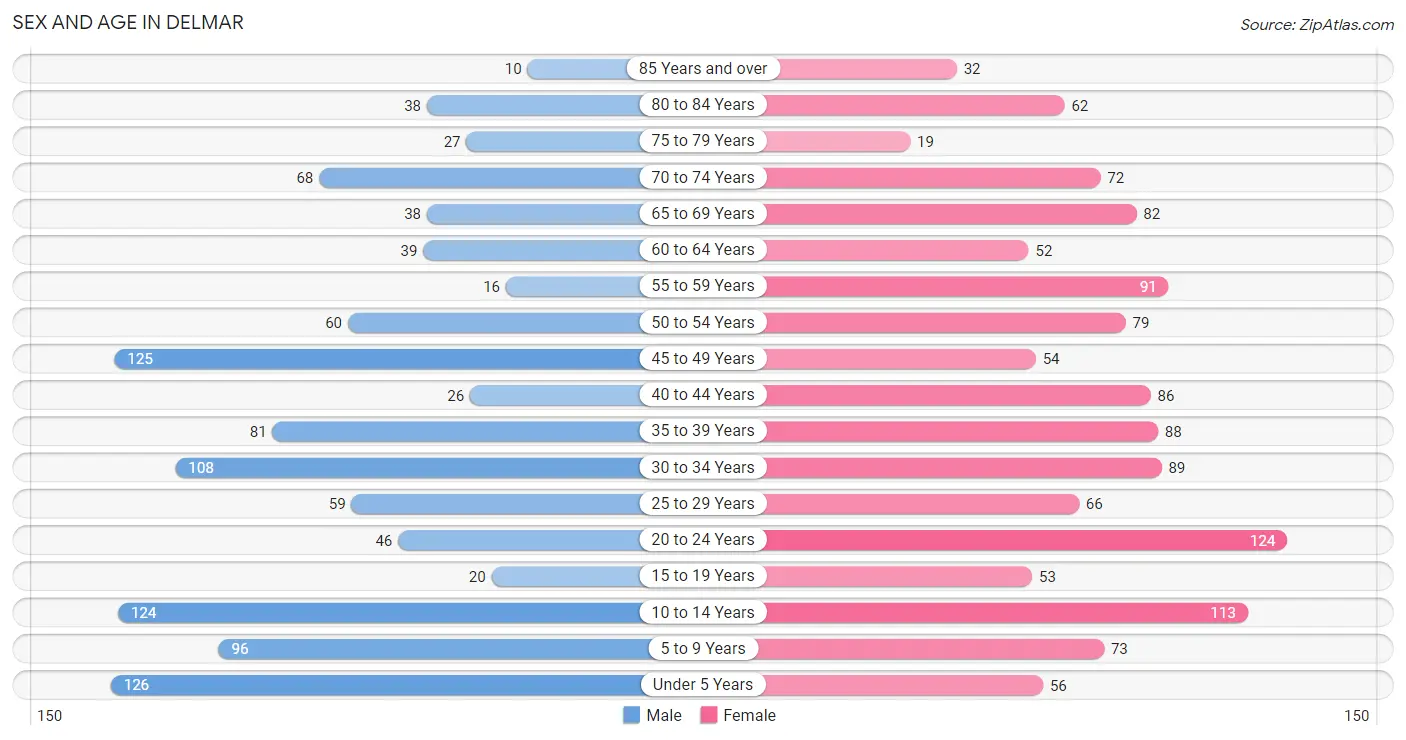
| Age Bracket | Male | Female |
| Under 5 Years | 126 (11.4%) | 56 (4.3%) |
| 5 to 9 Years | 96 (8.7%) | 73 (5.7%) |
| 10 to 14 Years | 124 (11.2%) | 113 (8.7%) |
| 15 to 19 Years | 20 (1.8%) | 53 (4.1%) |
| 20 to 24 Years | 46 (4.2%) | 124 (9.6%) |
| 25 to 29 Years | 59 (5.3%) | 66 (5.1%) |
| 30 to 34 Years | 108 (9.8%) | 89 (6.9%) |
| 35 to 39 Years | 81 (7.3%) | 88 (6.8%) |
| 40 to 44 Years | 26 (2.4%) | 86 (6.7%) |
| 45 to 49 Years | 125 (11.3%) | 54 (4.2%) |
| 50 to 54 Years | 60 (5.4%) | 79 (6.1%) |
| 55 to 59 Years | 16 (1.5%) | 91 (7.0%) |
| 60 to 64 Years | 39 (3.5%) | 52 (4.0%) |
| 65 to 69 Years | 38 (3.4%) | 82 (6.4%) |
| 70 to 74 Years | 68 (6.1%) | 72 (5.6%) |
| 75 to 79 Years | 27 (2.4%) | 19 (1.5%) |
| 80 to 84 Years | 38 (3.4%) | 62 (4.8%) |
| 85 Years and over | 10 (0.9%) | 32 (2.5%) |
| Total | 1,107 (100.0%) | 1,291 (100.0%) |
Families and Households in Delmar
Median Family Size in Delmar
The median family size in Delmar is 3.38 persons per family, with single male/father families (51 | 9.3%) accounting for the largest median family size of 3.63 persons per family. On the other hand, single female/mother families (167 | 30.4%) represent the smallest median family size with 2.93 persons per family.
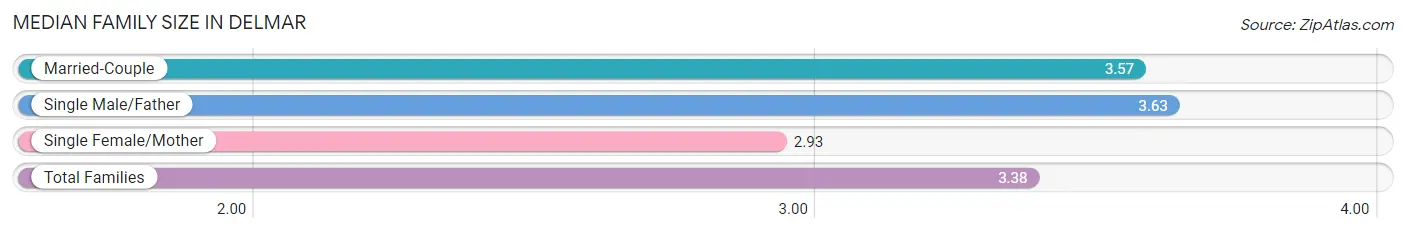
| Family Type | # Families | Family Size |
| Married-Couple | 332 (60.4%) | 3.57 |
| Single Male/Father | 51 (9.3%) | 3.63 |
| Single Female/Mother | 167 (30.4%) | 2.93 |
| Total Families | 550 (100.0%) | 3.38 |
Median Household Size in Delmar
The median household size in Delmar is 2.60 persons per household, with single male/father households (51 | 5.8%) accounting for the largest median household size of 3.75 persons per household. non-family households (336 | 37.9%) represent the smallest median household size with 1.05 persons per household.
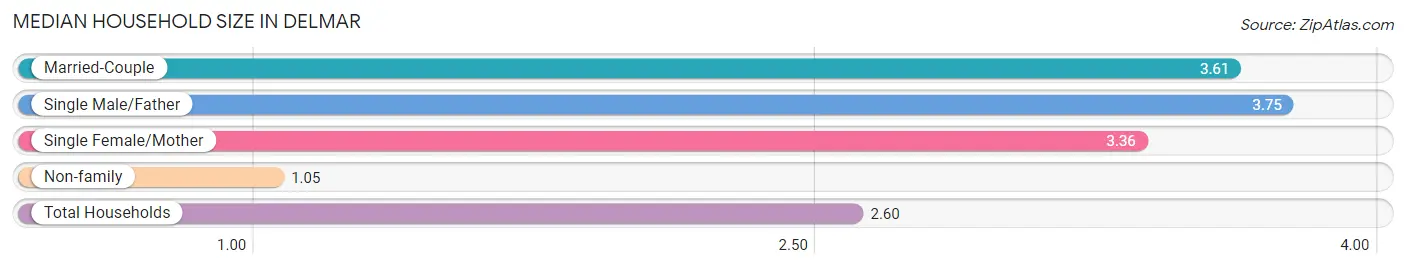
| Household Type | # Households | Household Size |
| Married-Couple | 332 (37.5%) | 3.61 |
| Single Male/Father | 51 (5.8%) | 3.75 |
| Single Female/Mother | 167 (18.9%) | 3.36 |
| Non-family | 336 (37.9%) | 1.05 |
| Total Households | 886 (100.0%) | 2.60 |
Household Size by Marriage Status in Delmar
Out of a total of 886 households in Delmar, 550 (62.1%) are family households, while 336 (37.9%) are nonfamily households. The most numerous type of family households are 2-person households, comprising 242, and the most common type of nonfamily households are 1-person households, comprising 320.
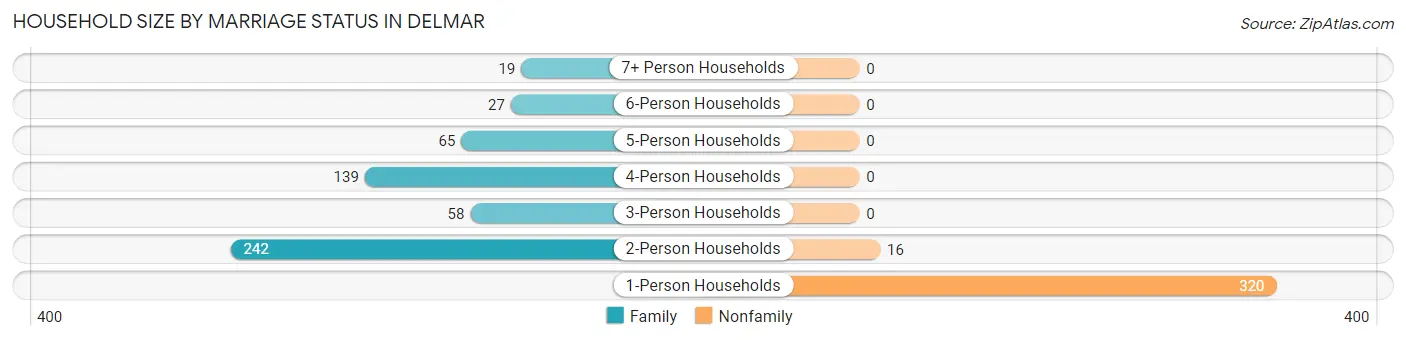
| Household Size | Family Households | Nonfamily Households |
| 1-Person Households | - | 320 (36.1%) |
| 2-Person Households | 242 (27.3%) | 16 (1.8%) |
| 3-Person Households | 58 (6.6%) | 0 (0.0%) |
| 4-Person Households | 139 (15.7%) | 0 (0.0%) |
| 5-Person Households | 65 (7.3%) | 0 (0.0%) |
| 6-Person Households | 27 (3.0%) | 0 (0.0%) |
| 7+ Person Households | 19 (2.1%) | 0 (0.0%) |
| Total | 550 (62.1%) | 336 (37.9%) |
Female Fertility in Delmar
Fertility by Age in Delmar
Average fertility rate in Delmar is 59.0 births per 1,000 women. Women in the age bracket of 20 to 34 years have the highest fertility rate with 125.0 births per 1,000 women. Women in the age bracket of 20 to 34 years acount for 100.0% of all women with births.
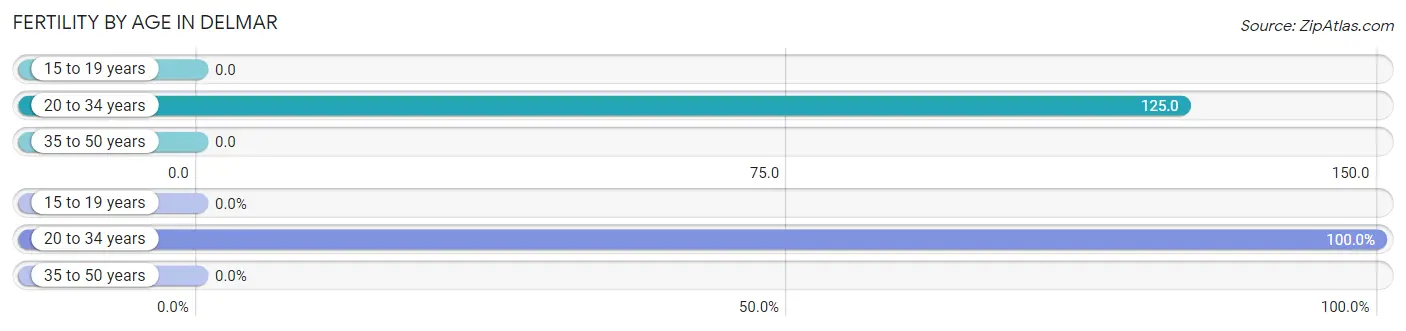
| Age Bracket | Women with Births | Births / 1,000 Women |
| 15 to 19 years | 0 (0.0%) | 0.0 |
| 20 to 34 years | 35 (100.0%) | 125.0 |
| 35 to 50 years | 0 (0.0%) | 0.0 |
| Total | 35 (100.0%) | 59.0 |
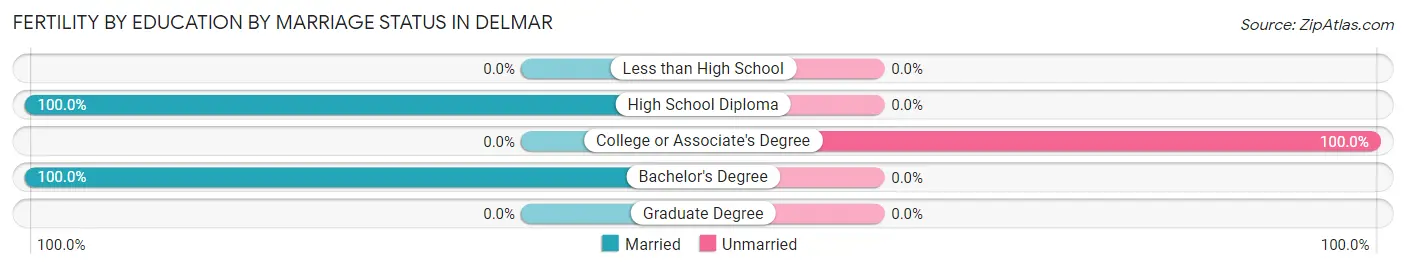
Fertility by Age by Marriage Status in Delmar
68.6% of women with births (35) in Delmar are married. The highest percentage of unmarried women with births falls into 20 to 34 years age bracket with 31.4% of them unmarried at the time of birth, while the lowest percentage of unmarried women with births belong to 20 to 34 years age bracket with 31.4% of them unmarried.
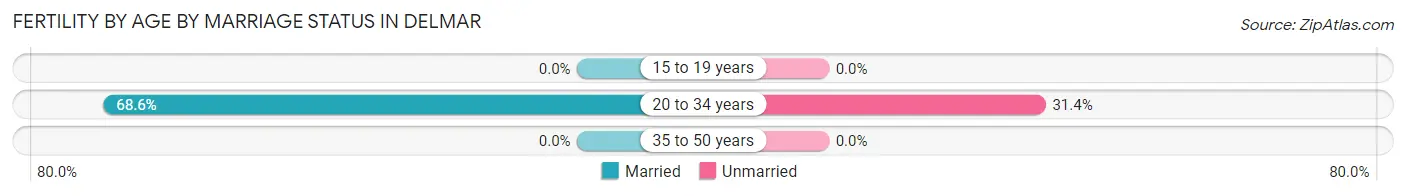
| Age Bracket | Married | Unmarried |
| 15 to 19 years | 0 (0.0%) | 0 (0.0%) |
| 20 to 34 years | 24 (68.6%) | 11 (31.4%) |
| 35 to 50 years | 0 (0.0%) | 0 (0.0%) |
| Total | 24 (68.6%) | 11 (31.4%) |
Fertility by Education in Delmar
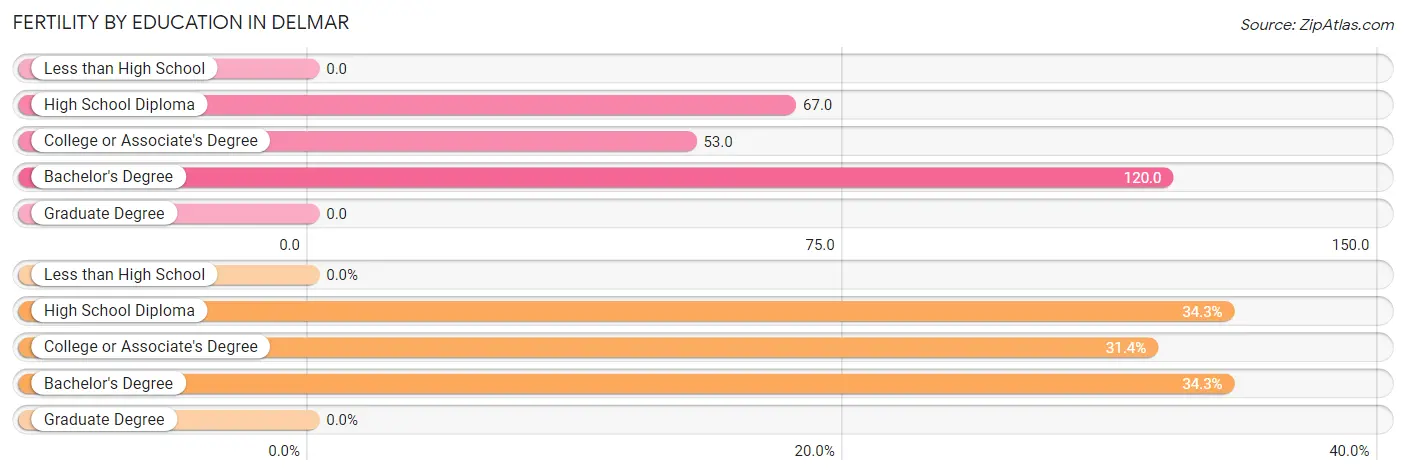
| Educational Attainment | Women with Births | Births / 1,000 Women |
| Less than High School | 0 (0.0%) | 0.0 |
| High School Diploma | 12 (34.3%) | 67.0 |
| College or Associate's Degree | 11 (31.4%) | 53.0 |
| Bachelor's Degree | 12 (34.3%) | 120.0 |
| Graduate Degree | 0 (0.0%) | 0.0 |
| Total | 35 (100.0%) | 59.0 |
Fertility by Education by Marriage Status in Delmar
31.4% of women with births in Delmar are unmarried. Women with the educational attainment of high school diploma are most likely to be married with 100.0% of them married at childbirth, while women with the educational attainment of college or associate's degree are least likely to be married with 100.0% of them unmarried at childbirth.
| Educational Attainment | Married | Unmarried |
| Less than High School | 0 (0.0%) | 0 (0.0%) |
| High School Diploma | 12 (100.0%) | 0 (0.0%) |
| College or Associate's Degree | 0 (0.0%) | 11 (100.0%) |
| Bachelor's Degree | 12 (100.0%) | 0 (0.0%) |
| Graduate Degree | 0 (0.0%) | 0 (0.0%) |
| Total | 24 (68.6%) | 11 (31.4%) |
Employment Characteristics in Delmar
Employment by Class of Employer in Delmar
Among the 905 employed individuals in Delmar, private company employees (679 | 75.0%), self-employed (not incorporated) (68 | 7.5%), and local government employees (54 | 6.0%) make up the most common classes of employment.
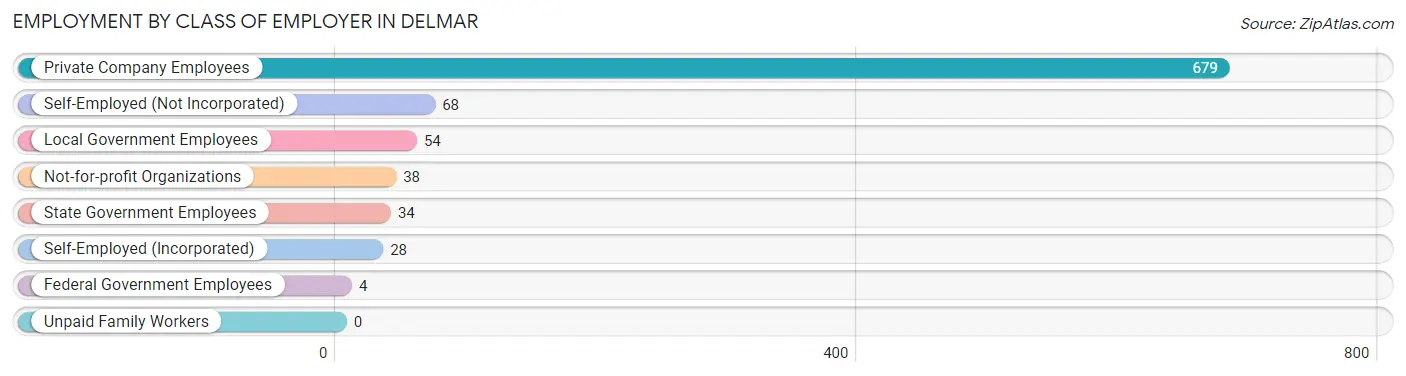
| Employer Class | # Employees | % Employees |
| Private Company Employees | 679 | 75.0% |
| Self-Employed (Incorporated) | 28 | 3.1% |
| Self-Employed (Not Incorporated) | 68 | 7.5% |
| Not-for-profit Organizations | 38 | 4.2% |
| Local Government Employees | 54 | 6.0% |
| State Government Employees | 34 | 3.8% |
| Federal Government Employees | 4 | 0.4% |
| Unpaid Family Workers | 0 | 0.0% |
| Total | 905 | 100.0% |
Employment Status by Age in Delmar
According to the labor force statistics for Delmar, out of the total population over 16 years of age (1,803), 57.9% or 1,044 individuals are in the labor force, with 5.2% or 54 of them unemployed. The age group with the highest labor force participation rate is 20 to 24 years, with 88.8% or 151 individuals in the labor force. Within the labor force, the 16 to 19 years age range has the highest percentage of unemployed individuals, with 41.7% or 15 of them being unemployed.
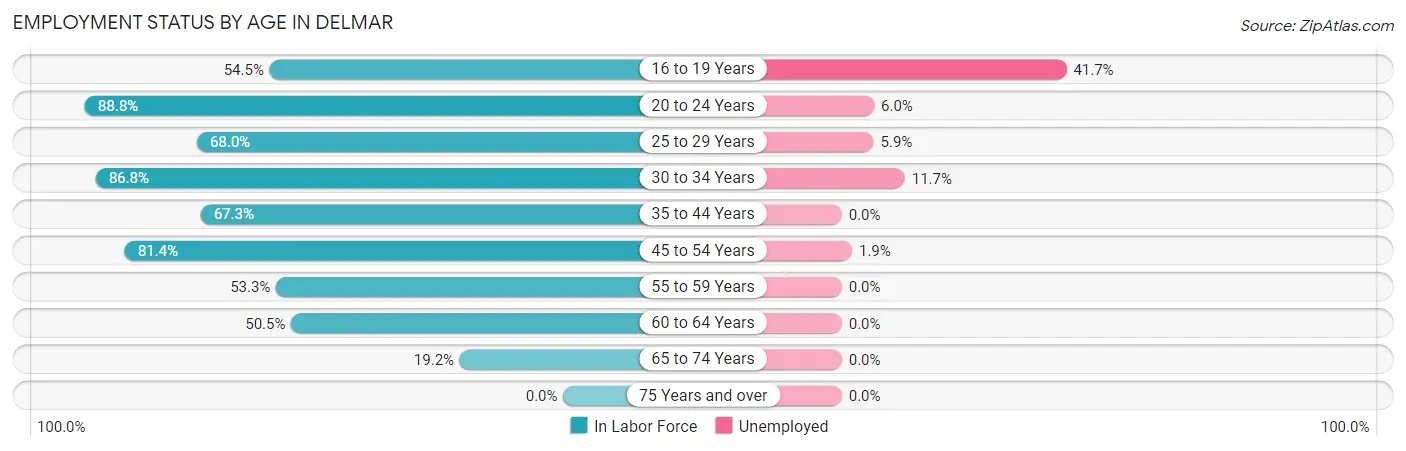
| Age Bracket | In Labor Force | Unemployed |
| 16 to 19 Years | 36 (54.5%) | 15 (41.7%) |
| 20 to 24 Years | 151 (88.8%) | 9 (6.0%) |
| 25 to 29 Years | 85 (68.0%) | 5 (5.9%) |
| 30 to 34 Years | 171 (86.8%) | 20 (11.7%) |
| 35 to 44 Years | 189 (67.3%) | 0 (0.0%) |
| 45 to 54 Years | 259 (81.4%) | 5 (1.9%) |
| 55 to 59 Years | 57 (53.3%) | 0 (0.0%) |
| 60 to 64 Years | 46 (50.5%) | 0 (0.0%) |
| 65 to 74 Years | 50 (19.2%) | 0 (0.0%) |
| 75 Years and over | 0 (0.0%) | 0 (0.0%) |
| Total | 1,044 (57.9%) | 54 (5.2%) |
Employment Status by Educational Attainment in Delmar
According to labor force statistics for Delmar, 72.1% of individuals (807) out of the total population between 25 and 64 years of age (1,119) are in the labor force, with 3.7% or 30 of them being unemployed. The group with the highest labor force participation rate are those with the educational attainment of less than high school, with 79.4% or 81 individuals in the labor force. Within the labor force, individuals with college / associate degree education have the highest percentage of unemployment, with 4.5% or 12 of them being unemployed.
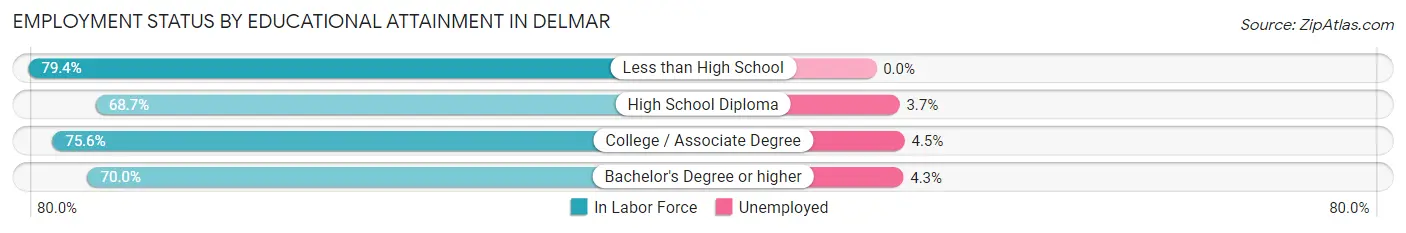
| Educational Attainment | In Labor Force | Unemployed |
| Less than High School | 81 (79.4%) | 0 (0.0%) |
| High School Diploma | 299 (68.7%) | 16 (3.7%) |
| College / Associate Degree | 266 (75.6%) | 16 (4.5%) |
| Bachelor's Degree or higher | 161 (70.0%) | 10 (4.3%) |
| Total | 807 (72.1%) | 41 (3.7%) |
Employment Occupations by Sex in Delmar
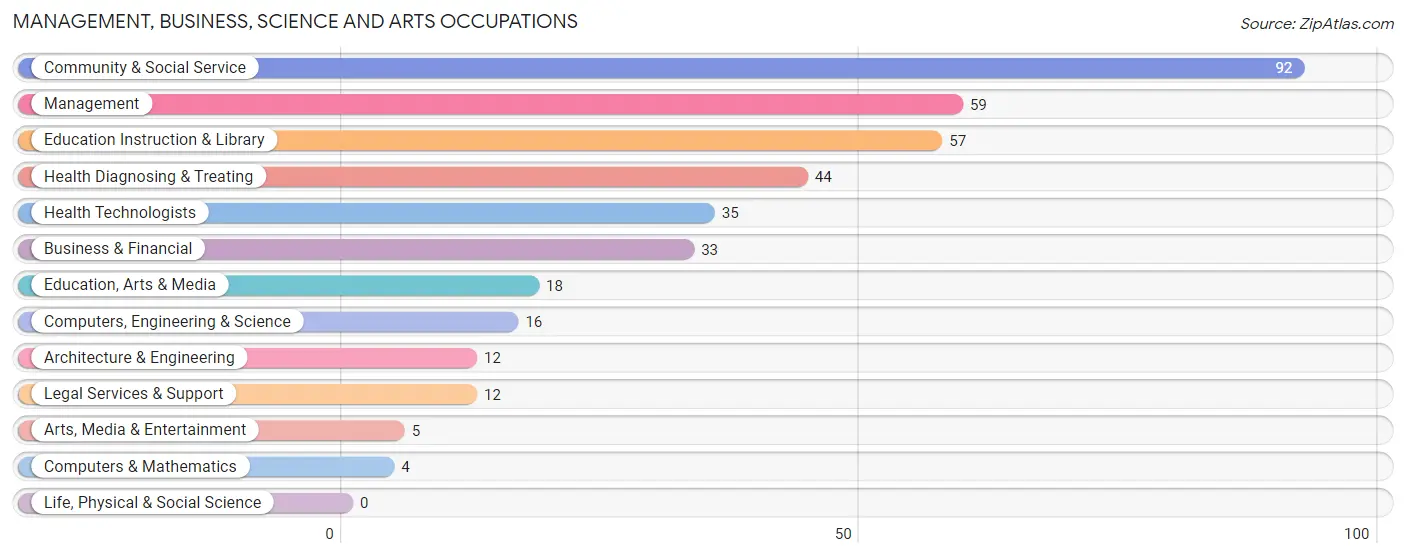
Management, Business, Science and Arts Occupations
The most common Management, Business, Science and Arts occupations in Delmar are Community & Social Service (92 | 9.3%), Management (59 | 6.0%), Education Instruction & Library (57 | 5.8%), Health Diagnosing & Treating (44 | 4.4%), and Health Technologists (35 | 3.5%).
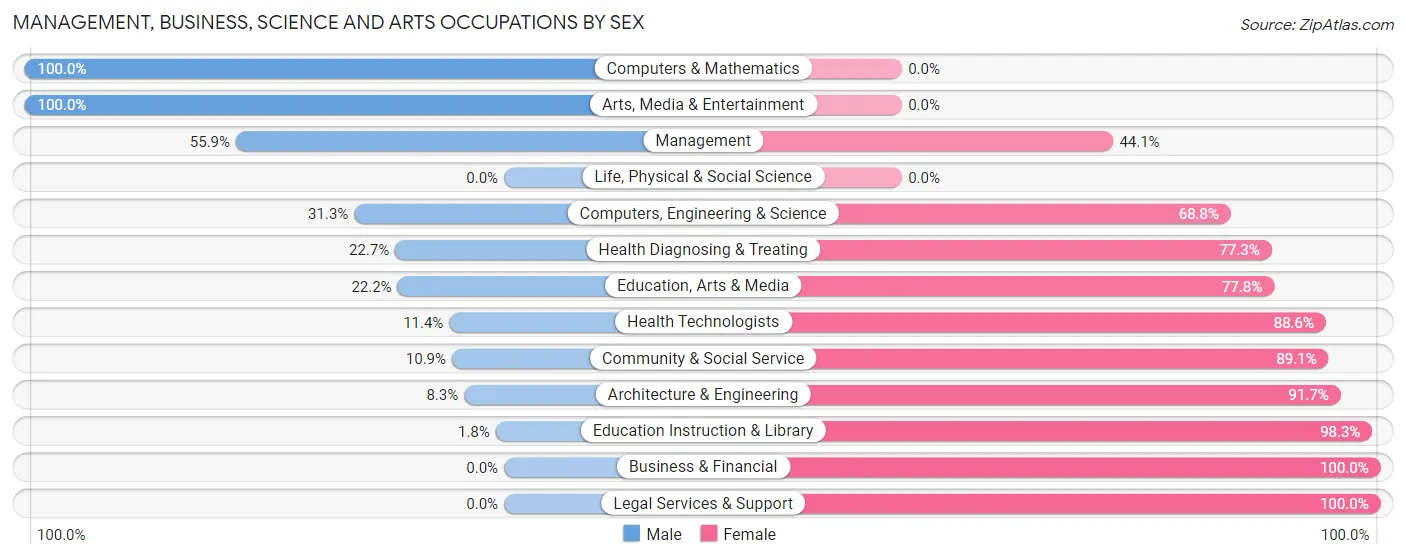
Management, Business, Science and Arts Occupations by Sex
Within the Management, Business, Science and Arts occupations in Delmar, the most male-oriented occupations are Computers & Mathematics (100.0%), Arts, Media & Entertainment (100.0%), and Management (55.9%), while the most female-oriented occupations are Business & Financial (100.0%), Legal Services & Support (100.0%), and Education Instruction & Library (98.3%).
| Occupation | Male | Female |
| Management | 33 (55.9%) | 26 (44.1%) |
| Business & Financial | 0 (0.0%) | 33 (100.0%) |
| Computers, Engineering & Science | 5 (31.2%) | 11 (68.8%) |
| Computers & Mathematics | 4 (100.0%) | 0 (0.0%) |
| Architecture & Engineering | 1 (8.3%) | 11 (91.7%) |
| Life, Physical & Social Science | 0 (0.0%) | 0 (0.0%) |
| Community & Social Service | 10 (10.9%) | 82 (89.1%) |
| Education, Arts & Media | 4 (22.2%) | 14 (77.8%) |
| Legal Services & Support | 0 (0.0%) | 12 (100.0%) |
| Education Instruction & Library | 1 (1.8%) | 56 (98.3%) |
| Arts, Media & Entertainment | 5 (100.0%) | 0 (0.0%) |
| Health Diagnosing & Treating | 10 (22.7%) | 34 (77.3%) |
| Health Technologists | 4 (11.4%) | 31 (88.6%) |
| Total (Category) | 58 (23.8%) | 186 (76.2%) |
| Total (Overall) | 476 (48.1%) | 514 (51.9%) |
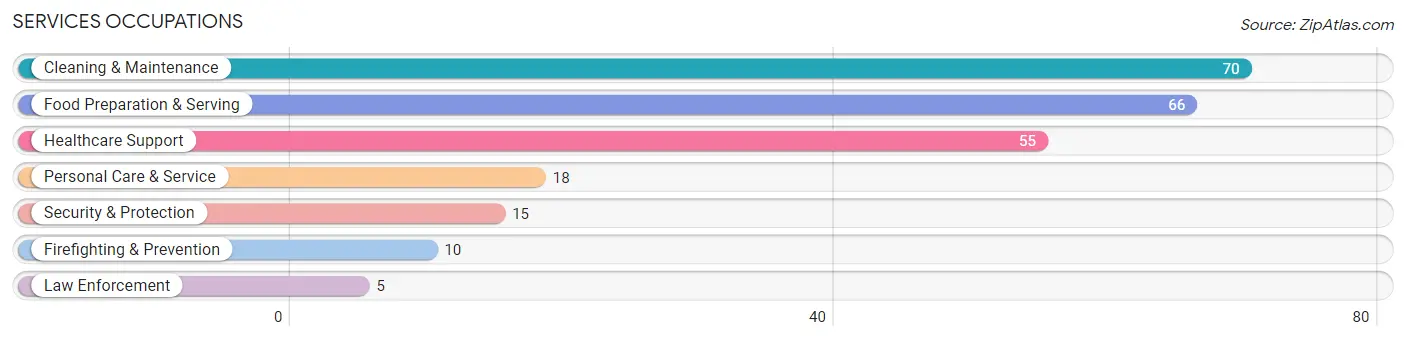
Services Occupations
The most common Services occupations in Delmar are Cleaning & Maintenance (70 | 7.1%), Food Preparation & Serving (66 | 6.7%), Healthcare Support (55 | 5.6%), Personal Care & Service (18 | 1.8%), and Security & Protection (15 | 1.5%).
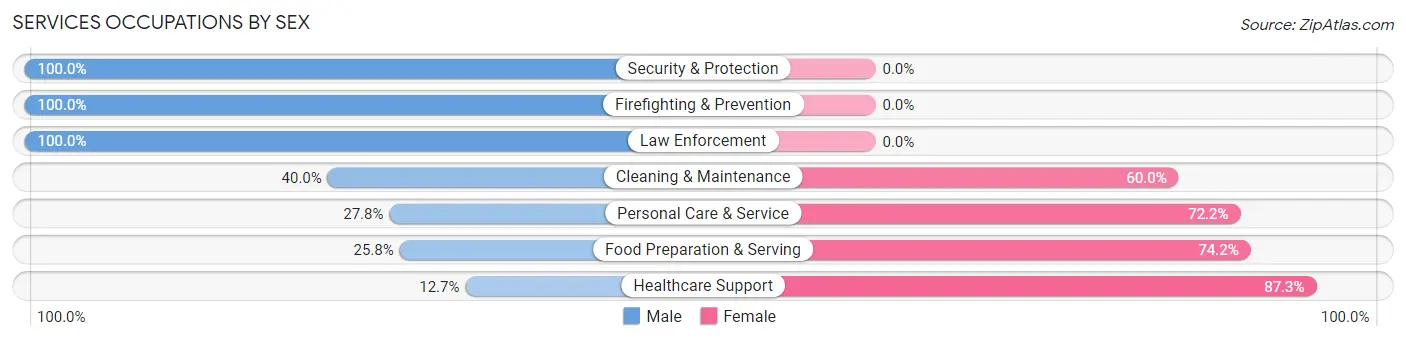
Services Occupations by Sex
Within the Services occupations in Delmar, the most male-oriented occupations are Security & Protection (100.0%), Firefighting & Prevention (100.0%), and Law Enforcement (100.0%), while the most female-oriented occupations are Healthcare Support (87.3%), Food Preparation & Serving (74.2%), and Personal Care & Service (72.2%).
| Occupation | Male | Female |
| Healthcare Support | 7 (12.7%) | 48 (87.3%) |
| Security & Protection | 15 (100.0%) | 0 (0.0%) |
| Firefighting & Prevention | 10 (100.0%) | 0 (0.0%) |
| Law Enforcement | 5 (100.0%) | 0 (0.0%) |
| Food Preparation & Serving | 17 (25.8%) | 49 (74.2%) |
| Cleaning & Maintenance | 28 (40.0%) | 42 (60.0%) |
| Personal Care & Service | 5 (27.8%) | 13 (72.2%) |
| Total (Category) | 72 (32.1%) | 152 (67.9%) |
| Total (Overall) | 476 (48.1%) | 514 (51.9%) |
Sales and Office Occupations
The most common Sales and Office occupations in Delmar are Sales & Related (158 | 16.0%), and Office & Administration (61 | 6.2%).

Sales and Office Occupations by Sex

| Occupation | Male | Female |
| Sales & Related | 83 (52.5%) | 75 (47.5%) |
| Office & Administration | 4 (6.6%) | 57 (93.4%) |
| Total (Category) | 87 (39.7%) | 132 (60.3%) |
| Total (Overall) | 476 (48.1%) | 514 (51.9%) |
Natural Resources, Construction and Maintenance Occupations
The most common Natural Resources, Construction and Maintenance occupations in Delmar are Construction & Extraction (83 | 8.4%), and Installation, Maintenance & Repair (22 | 2.2%).

Natural Resources, Construction and Maintenance Occupations by Sex
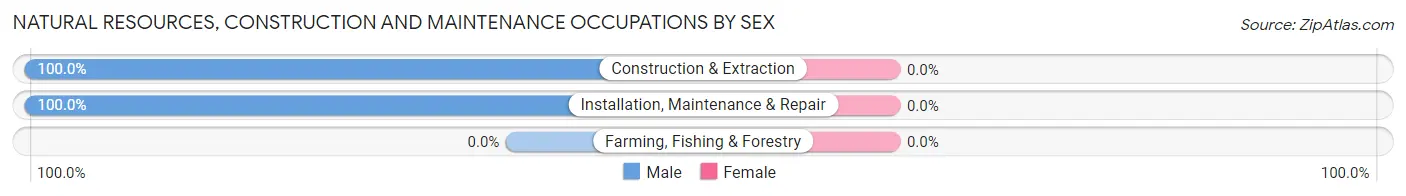
| Occupation | Male | Female |
| Farming, Fishing & Forestry | 0 (0.0%) | 0 (0.0%) |
| Construction & Extraction | 83 (100.0%) | 0 (0.0%) |
| Installation, Maintenance & Repair | 22 (100.0%) | 0 (0.0%) |
| Total (Category) | 105 (100.0%) | 0 (0.0%) |
| Total (Overall) | 476 (48.1%) | 514 (51.9%) |
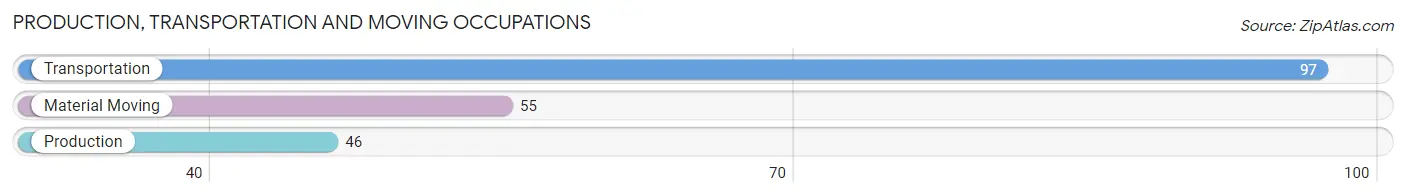
Production, Transportation and Moving Occupations
The most common Production, Transportation and Moving occupations in Delmar are Transportation (97 | 9.8%), Material Moving (55 | 5.6%), and Production (46 | 4.6%).
Production, Transportation and Moving Occupations by Sex
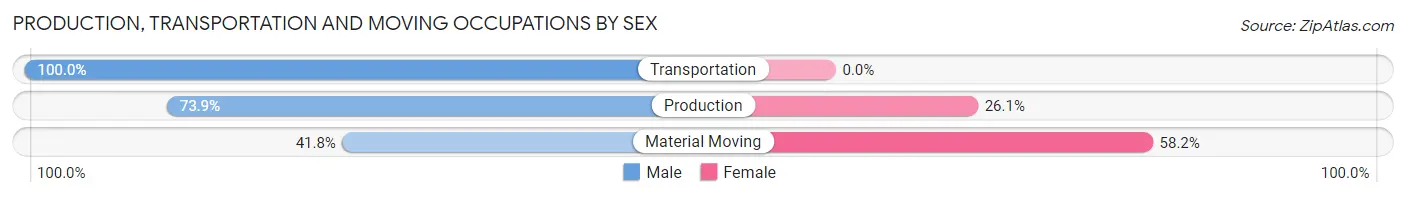
| Occupation | Male | Female |
| Production | 34 (73.9%) | 12 (26.1%) |
| Transportation | 97 (100.0%) | 0 (0.0%) |
| Material Moving | 23 (41.8%) | 32 (58.2%) |
| Total (Category) | 154 (77.8%) | 44 (22.2%) |
| Total (Overall) | 476 (48.1%) | 514 (51.9%) |
Employment Industries by Sex in Delmar
Employment Industries in Delmar
The major employment industries in Delmar include Retail Trade (206 | 20.8%), Health Care & Social Assistance (171 | 17.3%), Accommodation & Food Services (90 | 9.1%), Construction (77 | 7.8%), and Manufacturing (69 | 7.0%).
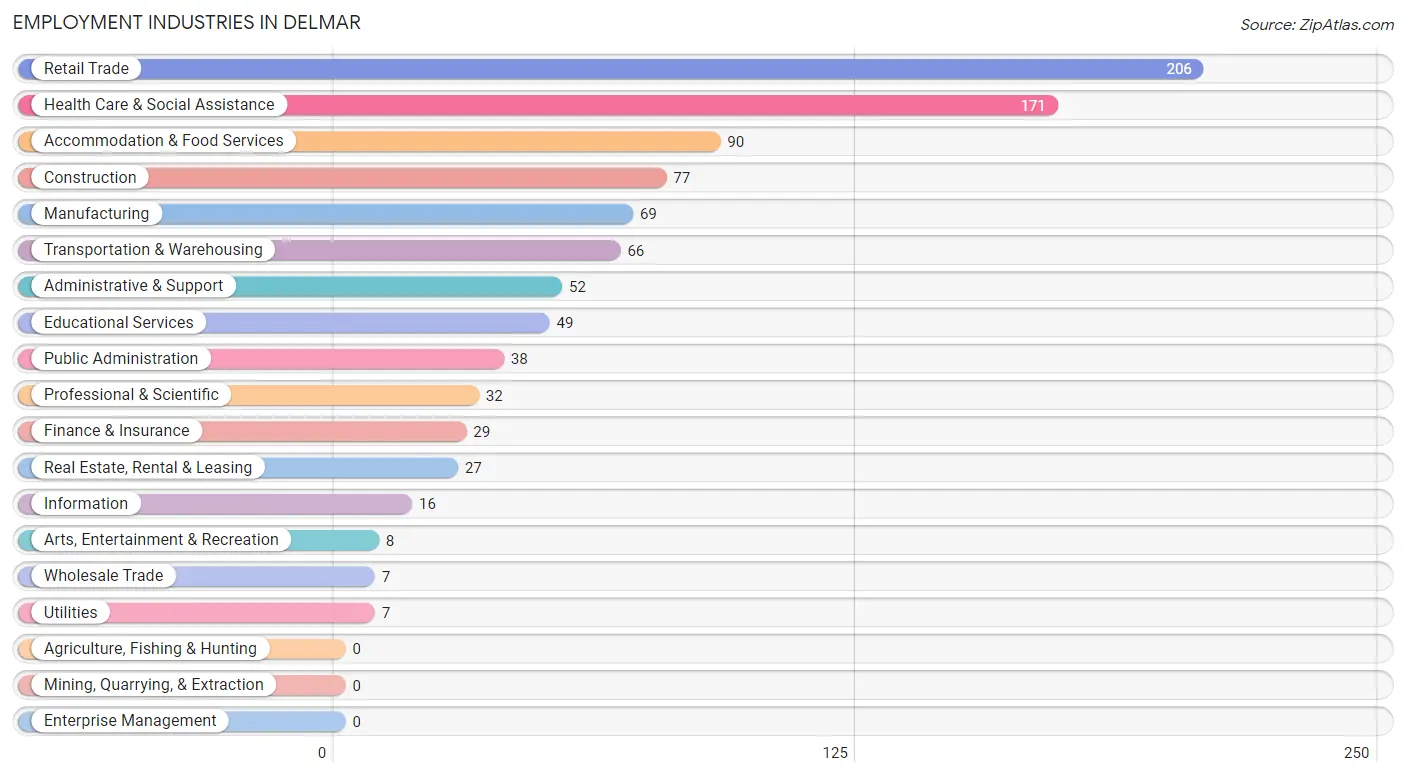
Employment Industries by Sex in Delmar
The Delmar industries that see more men than women are Wholesale Trade (100.0%), Transportation & Warehousing (100.0%), and Utilities (100.0%), whereas the industries that tend to have a higher number of women are Finance & Insurance (100.0%), Health Care & Social Assistance (86.6%), and Accommodation & Food Services (80.0%).
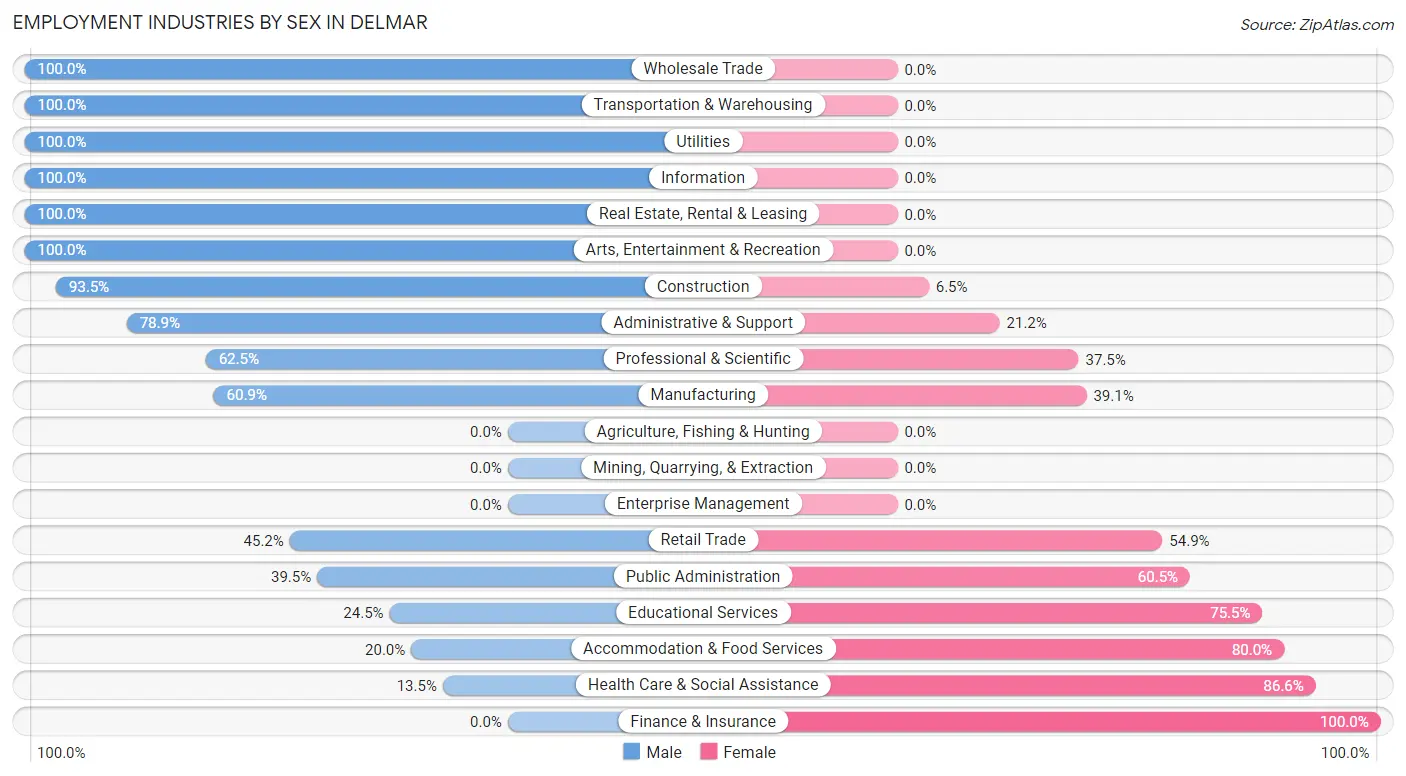
| Industry | Male | Female |
| Agriculture, Fishing & Hunting | 0 (0.0%) | 0 (0.0%) |
| Mining, Quarrying, & Extraction | 0 (0.0%) | 0 (0.0%) |
| Construction | 72 (93.5%) | 5 (6.5%) |
| Manufacturing | 42 (60.9%) | 27 (39.1%) |
| Wholesale Trade | 7 (100.0%) | 0 (0.0%) |
| Retail Trade | 93 (45.2%) | 113 (54.8%) |
| Transportation & Warehousing | 66 (100.0%) | 0 (0.0%) |
| Utilities | 7 (100.0%) | 0 (0.0%) |
| Information | 16 (100.0%) | 0 (0.0%) |
| Finance & Insurance | 0 (0.0%) | 29 (100.0%) |
| Real Estate, Rental & Leasing | 27 (100.0%) | 0 (0.0%) |
| Professional & Scientific | 20 (62.5%) | 12 (37.5%) |
| Enterprise Management | 0 (0.0%) | 0 (0.0%) |
| Administrative & Support | 41 (78.8%) | 11 (21.1%) |
| Educational Services | 12 (24.5%) | 37 (75.5%) |
| Health Care & Social Assistance | 23 (13.5%) | 148 (86.6%) |
| Arts, Entertainment & Recreation | 8 (100.0%) | 0 (0.0%) |
| Accommodation & Food Services | 18 (20.0%) | 72 (80.0%) |
| Public Administration | 15 (39.5%) | 23 (60.5%) |
| Total | 476 (48.1%) | 514 (51.9%) |
Education in Delmar
School Enrollment in Delmar
The most common levels of schooling among the 605 students in Delmar are middle school (194 | 32.1%), elementary school (143 | 23.6%), and high school (91 | 15.0%).
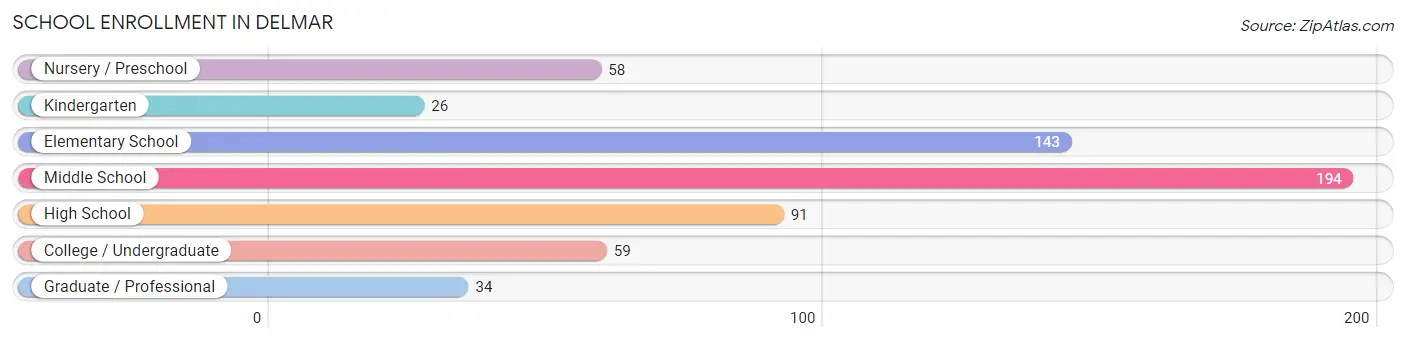
| School Level | # Students | % Students |
| Nursery / Preschool | 58 | 9.6% |
| Kindergarten | 26 | 4.3% |
| Elementary School | 143 | 23.6% |
| Middle School | 194 | 32.1% |
| High School | 91 | 15.0% |
| College / Undergraduate | 59 | 9.8% |
| Graduate / Professional | 34 | 5.6% |
| Total | 605 | 100.0% |
School Enrollment by Age by Funding Source in Delmar
Out of a total of 605 students who are enrolled in schools in Delmar, 85 (14.0%) attend a private institution, while the remaining 520 (86.0%) are enrolled in public schools. The age group of 3 to 4 year olds has the highest likelihood of being enrolled in private schools, with 31 (83.8% in the age bracket) enrolled. Conversely, the age group of 25 to 34 year olds has the lowest likelihood of being enrolled in a private school, with 39 (100.0% in the age bracket) attending a public institution.
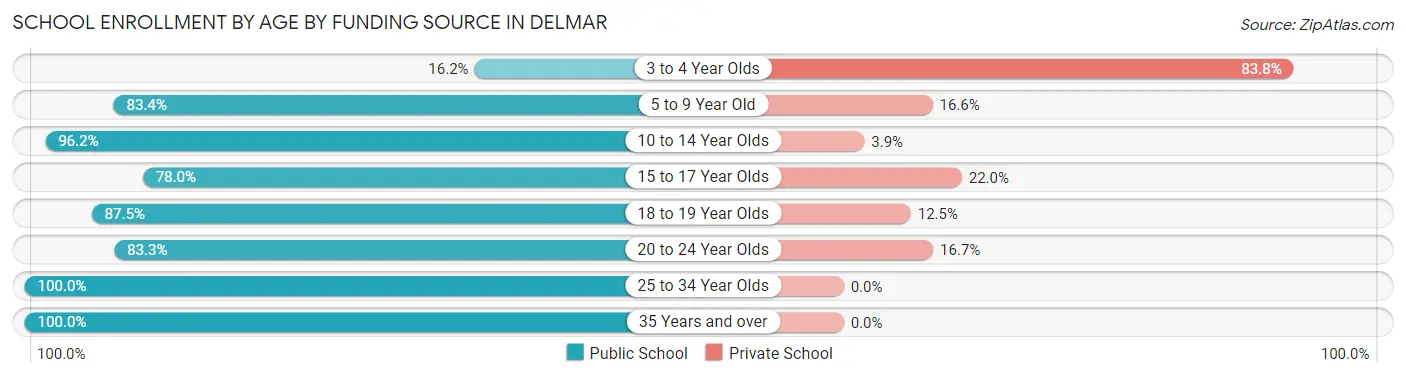
| Age Bracket | Public School | Private School |
| 3 to 4 Year Olds | 6 (16.2%) | 31 (83.8%) |
| 5 to 9 Year Old | 141 (83.4%) | 28 (16.6%) |
| 10 to 14 Year Olds | 225 (96.2%) | 9 (3.8%) |
| 15 to 17 Year Olds | 39 (78.0%) | 11 (22.0%) |
| 18 to 19 Year Olds | 7 (87.5%) | 1 (12.5%) |
| 20 to 24 Year Olds | 25 (83.3%) | 5 (16.7%) |
| 25 to 34 Year Olds | 39 (100.0%) | 0 (0.0%) |
| 35 Years and over | 38 (100.0%) | 0 (0.0%) |
| Total | 520 (86.0%) | 85 (14.0%) |
Educational Attainment by Field of Study in Delmar
Liberal arts & history (44 | 13.5%), education (40 | 12.3%), science & technology (34 | 10.5%), business (33 | 10.2%), and communications (32 | 9.9%) are the most common fields of study among 325 individuals in Delmar who have obtained a bachelor's degree or higher.
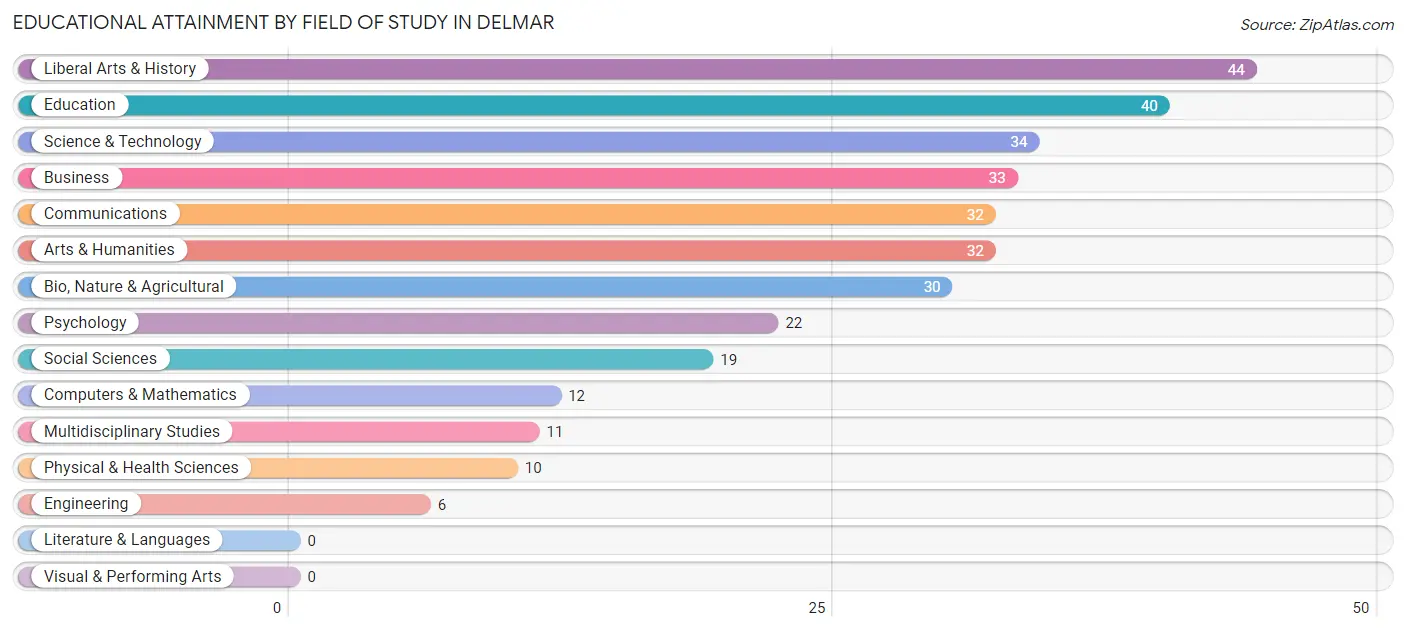
| Field of Study | # Graduates | % Graduates |
| Computers & Mathematics | 12 | 3.7% |
| Bio, Nature & Agricultural | 30 | 9.2% |
| Physical & Health Sciences | 10 | 3.1% |
| Psychology | 22 | 6.8% |
| Social Sciences | 19 | 5.9% |
| Engineering | 6 | 1.8% |
| Multidisciplinary Studies | 11 | 3.4% |
| Science & Technology | 34 | 10.5% |
| Business | 33 | 10.2% |
| Education | 40 | 12.3% |
| Literature & Languages | 0 | 0.0% |
| Liberal Arts & History | 44 | 13.5% |
| Visual & Performing Arts | 0 | 0.0% |
| Communications | 32 | 9.9% |
| Arts & Humanities | 32 | 9.9% |
| Total | 325 | 100.0% |
Transportation & Commute in Delmar
Vehicle Availability by Sex in Delmar
The most prevalent vehicle ownership categories in Delmar are males with 2 vehicles (235, accounting for 52.6%) and females with 2 vehicles (215, making up 51.3%).
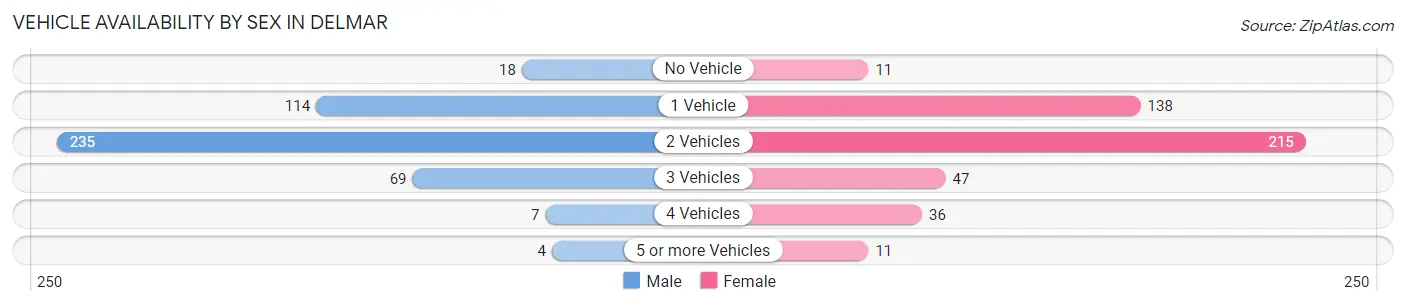
| Vehicles Available | Male | Female |
| No Vehicle | 18 (4.0%) | 11 (2.4%) |
| 1 Vehicle | 114 (25.5%) | 138 (30.1%) |
| 2 Vehicles | 235 (52.6%) | 215 (46.9%) |
| 3 Vehicles | 69 (15.4%) | 47 (10.3%) |
| 4 Vehicles | 7 (1.6%) | 36 (7.9%) |
| 5 or more Vehicles | 4 (0.9%) | 11 (2.4%) |
| Total | 447 (100.0%) | 458 (100.0%) |
Commute Time in Delmar
The most frequently occuring commute durations in Delmar are 15 to 19 minutes (201 commuters, 24.2%), 20 to 24 minutes (147 commuters, 17.7%), and 60 to 89 minutes (75 commuters, 9.0%).
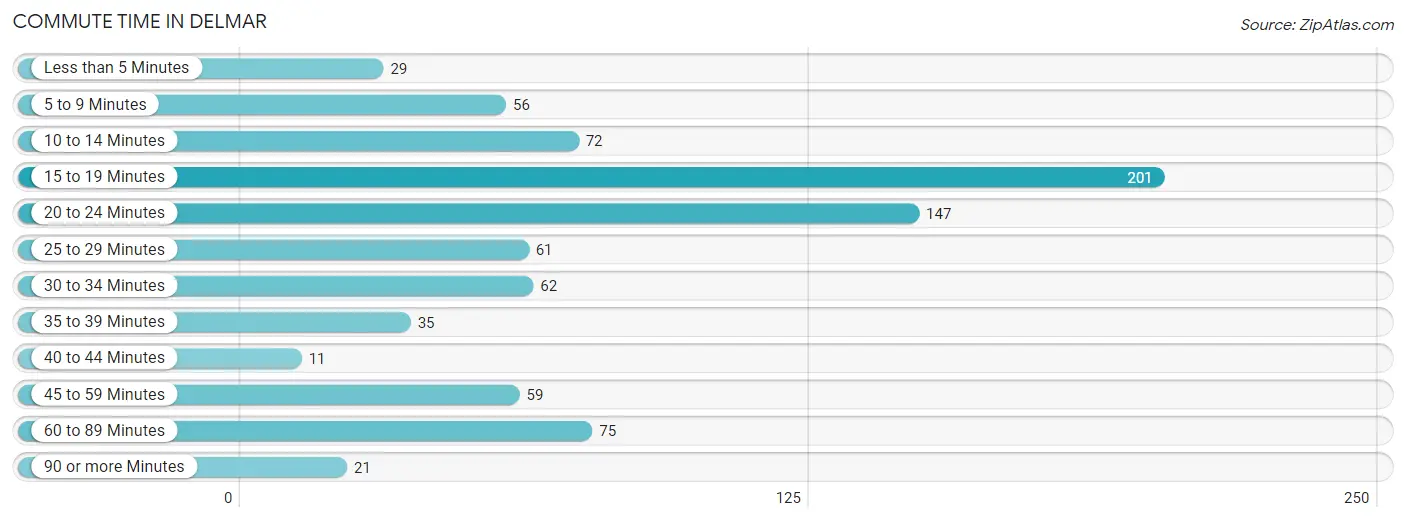
| Commute Time | # Commuters | % Commuters |
| Less than 5 Minutes | 29 | 3.5% |
| 5 to 9 Minutes | 56 | 6.8% |
| 10 to 14 Minutes | 72 | 8.7% |
| 15 to 19 Minutes | 201 | 24.2% |
| 20 to 24 Minutes | 147 | 17.7% |
| 25 to 29 Minutes | 61 | 7.4% |
| 30 to 34 Minutes | 62 | 7.5% |
| 35 to 39 Minutes | 35 | 4.2% |
| 40 to 44 Minutes | 11 | 1.3% |
| 45 to 59 Minutes | 59 | 7.1% |
| 60 to 89 Minutes | 75 | 9.0% |
| 90 or more Minutes | 21 | 2.5% |
Commute Time by Sex in Delmar
The most common commute times in Delmar are 15 to 19 minutes (74 commuters, 17.8%) for males and 15 to 19 minutes (127 commuters, 30.7%) for females.
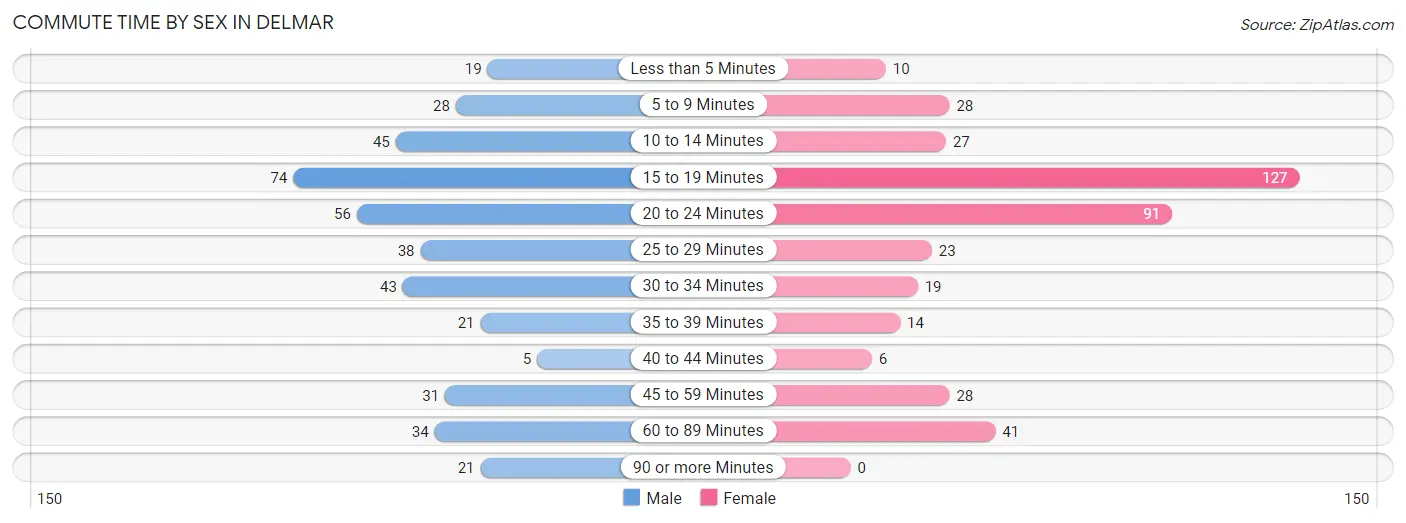
| Commute Time | Male | Female |
| Less than 5 Minutes | 19 (4.6%) | 10 (2.4%) |
| 5 to 9 Minutes | 28 (6.8%) | 28 (6.8%) |
| 10 to 14 Minutes | 45 (10.8%) | 27 (6.5%) |
| 15 to 19 Minutes | 74 (17.8%) | 127 (30.7%) |
| 20 to 24 Minutes | 56 (13.5%) | 91 (22.0%) |
| 25 to 29 Minutes | 38 (9.2%) | 23 (5.6%) |
| 30 to 34 Minutes | 43 (10.4%) | 19 (4.6%) |
| 35 to 39 Minutes | 21 (5.1%) | 14 (3.4%) |
| 40 to 44 Minutes | 5 (1.2%) | 6 (1.5%) |
| 45 to 59 Minutes | 31 (7.5%) | 28 (6.8%) |
| 60 to 89 Minutes | 34 (8.2%) | 41 (9.9%) |
| 90 or more Minutes | 21 (5.1%) | 0 (0.0%) |
Time of Departure to Work by Sex in Delmar
The most frequent times of departure to work in Delmar are 12:00 AM to 4:59 AM (86, 20.7%) for males and 7:00 AM to 7:29 AM (110, 26.6%) for females.
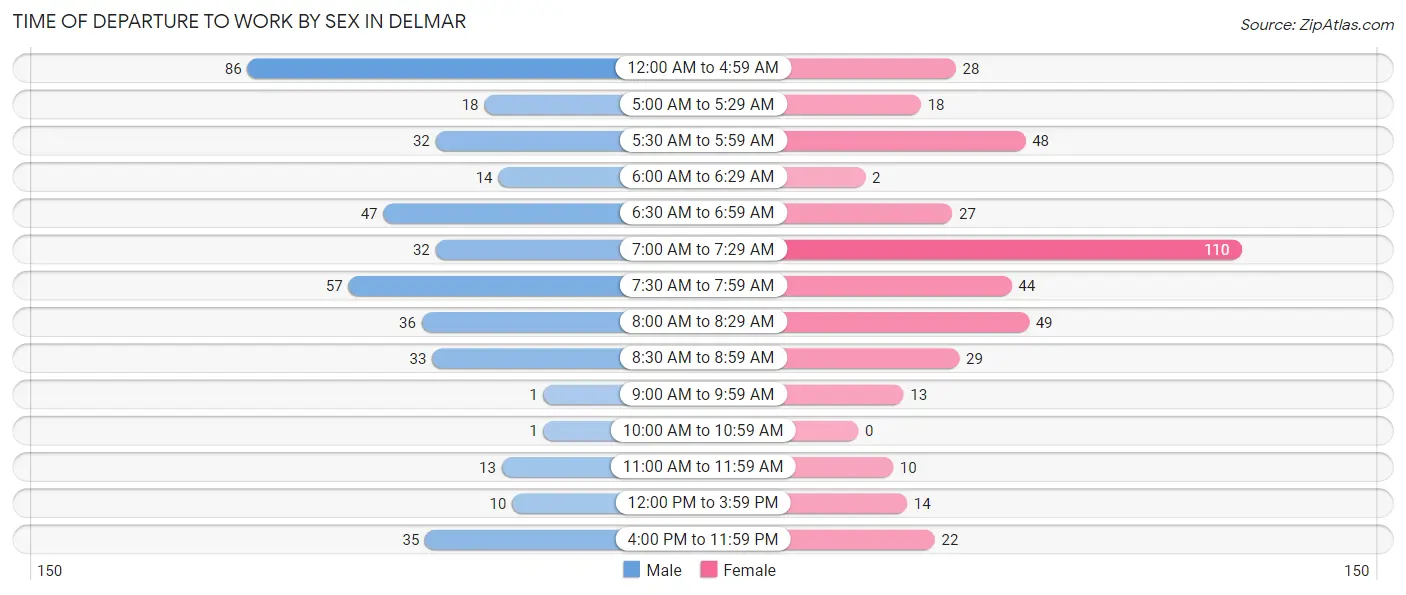
| Time of Departure | Male | Female |
| 12:00 AM to 4:59 AM | 86 (20.7%) | 28 (6.8%) |
| 5:00 AM to 5:29 AM | 18 (4.3%) | 18 (4.3%) |
| 5:30 AM to 5:59 AM | 32 (7.7%) | 48 (11.6%) |
| 6:00 AM to 6:29 AM | 14 (3.4%) | 2 (0.5%) |
| 6:30 AM to 6:59 AM | 47 (11.3%) | 27 (6.5%) |
| 7:00 AM to 7:29 AM | 32 (7.7%) | 110 (26.6%) |
| 7:30 AM to 7:59 AM | 57 (13.7%) | 44 (10.6%) |
| 8:00 AM to 8:29 AM | 36 (8.7%) | 49 (11.8%) |
| 8:30 AM to 8:59 AM | 33 (8.0%) | 29 (7.0%) |
| 9:00 AM to 9:59 AM | 1 (0.2%) | 13 (3.1%) |
| 10:00 AM to 10:59 AM | 1 (0.2%) | 0 (0.0%) |
| 11:00 AM to 11:59 AM | 13 (3.1%) | 10 (2.4%) |
| 12:00 PM to 3:59 PM | 10 (2.4%) | 14 (3.4%) |
| 4:00 PM to 11:59 PM | 35 (8.4%) | 22 (5.3%) |
| Total | 415 (100.0%) | 414 (100.0%) |
Housing Occupancy in Delmar
Occupancy by Ownership in Delmar
Of the total 886 dwellings in Delmar, owner-occupied units account for 551 (62.2%), while renter-occupied units make up 335 (37.8%).
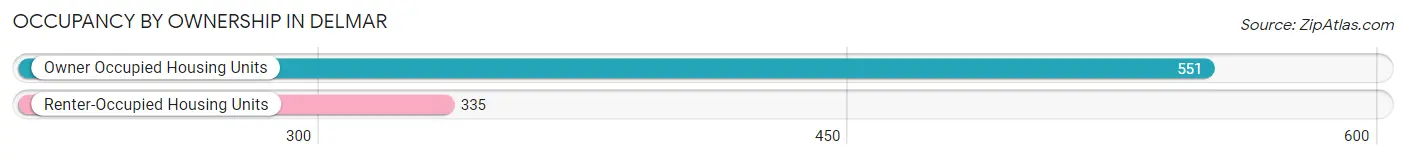
| Occupancy | # Housing Units | % Housing Units |
| Owner Occupied Housing Units | 551 | 62.2% |
| Renter-Occupied Housing Units | 335 | 37.8% |
| Total Occupied Housing Units | 886 | 100.0% |
Occupancy by Household Size in Delmar
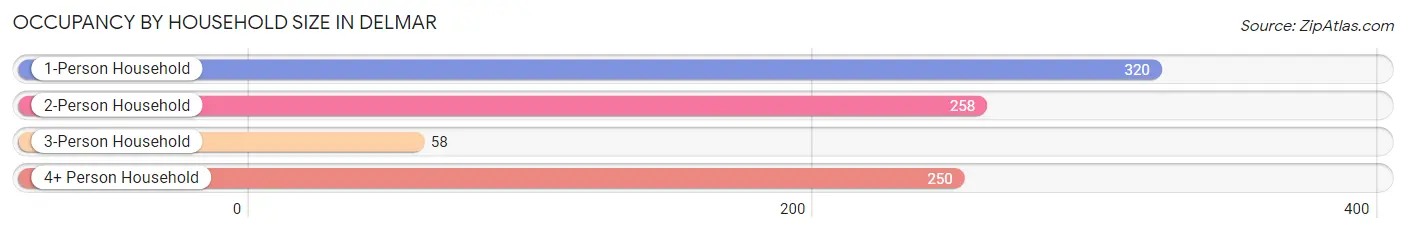
| Household Size | # Housing Units | % Housing Units |
| 1-Person Household | 320 | 36.1% |
| 2-Person Household | 258 | 29.1% |
| 3-Person Household | 58 | 6.6% |
| 4+ Person Household | 250 | 28.2% |
| Total Housing Units | 886 | 100.0% |
Occupancy by Ownership by Household Size in Delmar
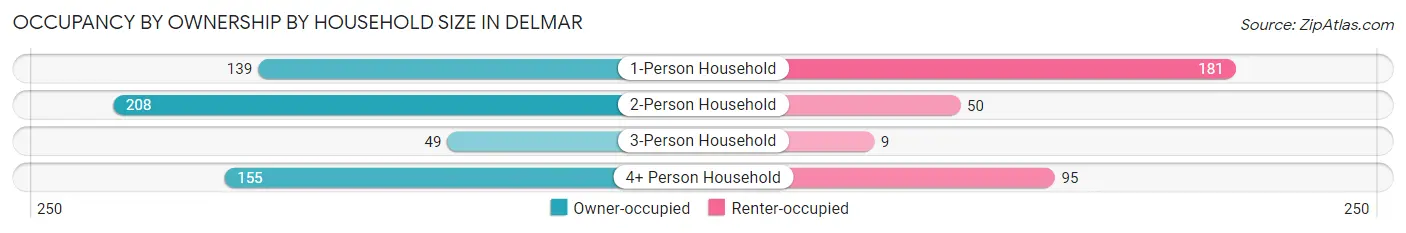
| Household Size | Owner-occupied | Renter-occupied |
| 1-Person Household | 139 (43.4%) | 181 (56.6%) |
| 2-Person Household | 208 (80.6%) | 50 (19.4%) |
| 3-Person Household | 49 (84.5%) | 9 (15.5%) |
| 4+ Person Household | 155 (62.0%) | 95 (38.0%) |
| Total Housing Units | 551 (62.2%) | 335 (37.8%) |
Occupancy by Educational Attainment in Delmar
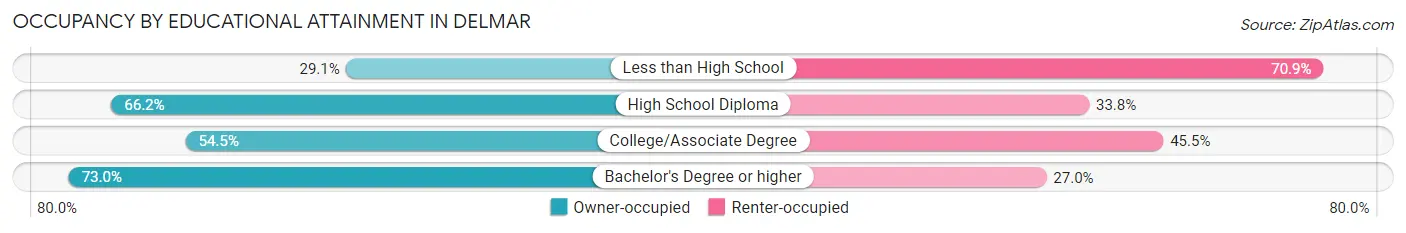
| Household Size | Owner-occupied | Renter-occupied |
| Less than High School | 16 (29.1%) | 39 (70.9%) |
| High School Diploma | 255 (66.2%) | 130 (33.8%) |
| College/Associate Degree | 134 (54.5%) | 112 (45.5%) |
| Bachelor's Degree or higher | 146 (73.0%) | 54 (27.0%) |
Occupancy by Age of Householder in Delmar
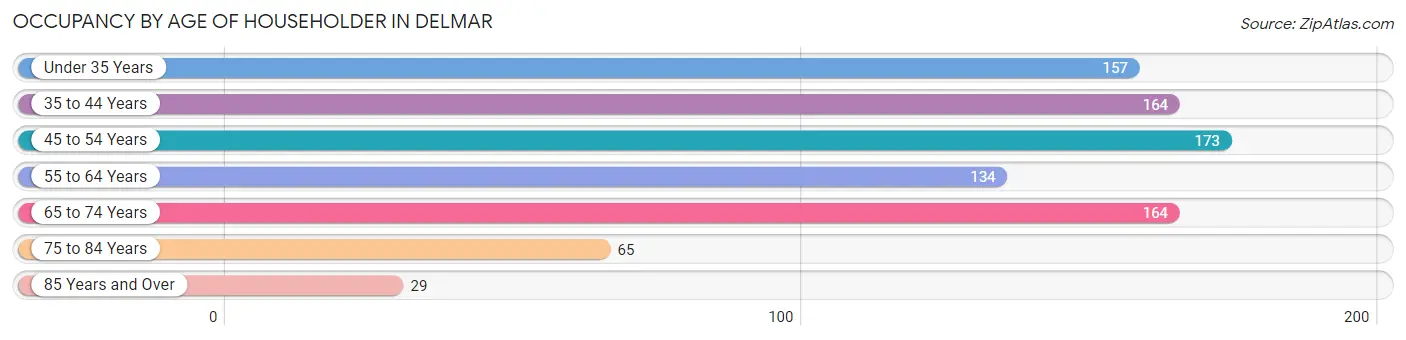
| Age Bracket | # Households | % Households |
| Under 35 Years | 157 | 17.7% |
| 35 to 44 Years | 164 | 18.5% |
| 45 to 54 Years | 173 | 19.5% |
| 55 to 64 Years | 134 | 15.1% |
| 65 to 74 Years | 164 | 18.5% |
| 75 to 84 Years | 65 | 7.3% |
| 85 Years and Over | 29 | 3.3% |
| Total | 886 | 100.0% |
Housing Finances in Delmar
Median Income by Occupancy in Delmar
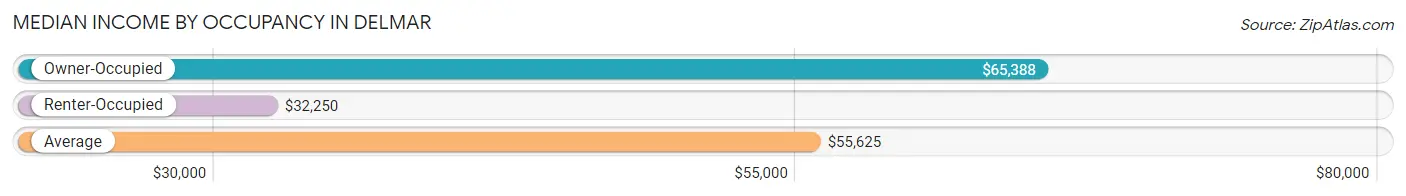
| Occupancy Type | # Households | Median Income |
| Owner-Occupied | 551 (62.2%) | $65,388 |
| Renter-Occupied | 335 (37.8%) | $32,250 |
| Average | 886 (100.0%) | $55,625 |
Occupancy by Householder Income Bracket in Delmar
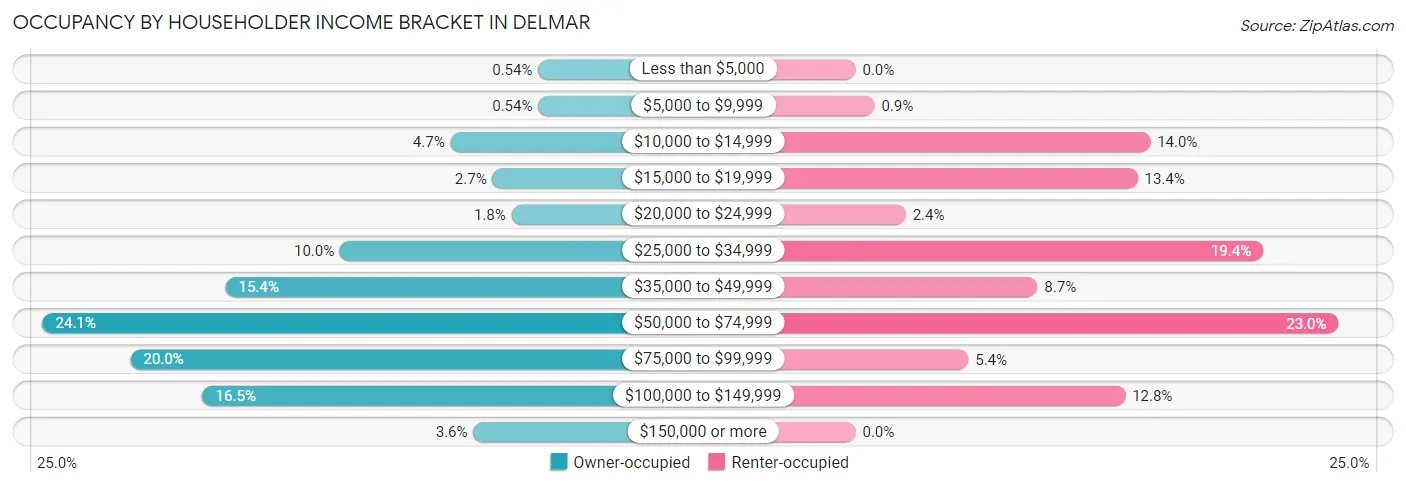
| Income Bracket | Owner-occupied | Renter-occupied |
| Less than $5,000 | 3 (0.5%) | 0 (0.0%) |
| $5,000 to $9,999 | 3 (0.5%) | 3 (0.9%) |
| $10,000 to $14,999 | 26 (4.7%) | 47 (14.0%) |
| $15,000 to $19,999 | 15 (2.7%) | 45 (13.4%) |
| $20,000 to $24,999 | 10 (1.8%) | 8 (2.4%) |
| $25,000 to $34,999 | 55 (10.0%) | 65 (19.4%) |
| $35,000 to $49,999 | 85 (15.4%) | 29 (8.7%) |
| $50,000 to $74,999 | 133 (24.1%) | 77 (23.0%) |
| $75,000 to $99,999 | 110 (20.0%) | 18 (5.4%) |
| $100,000 to $149,999 | 91 (16.5%) | 43 (12.8%) |
| $150,000 or more | 20 (3.6%) | 0 (0.0%) |
| Total | 551 (100.0%) | 335 (100.0%) |
Monthly Housing Cost Tiers in Delmar
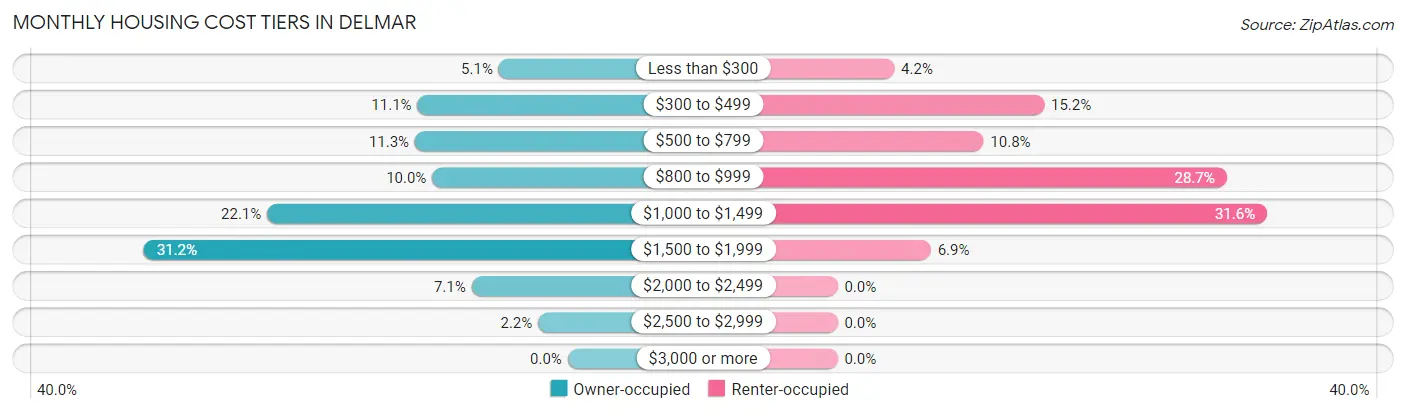
| Monthly Cost | Owner-occupied | Renter-occupied |
| Less than $300 | 28 (5.1%) | 14 (4.2%) |
| $300 to $499 | 61 (11.1%) | 51 (15.2%) |
| $500 to $799 | 62 (11.3%) | 36 (10.7%) |
| $800 to $999 | 55 (10.0%) | 96 (28.7%) |
| $1,000 to $1,499 | 122 (22.1%) | 106 (31.6%) |
| $1,500 to $1,999 | 172 (31.2%) | 23 (6.9%) |
| $2,000 to $2,499 | 39 (7.1%) | 0 (0.0%) |
| $2,500 to $2,999 | 12 (2.2%) | 0 (0.0%) |
| $3,000 or more | 0 (0.0%) | 0 (0.0%) |
| Total | 551 (100.0%) | 335 (100.0%) |
Physical Housing Characteristics in Delmar
Housing Structures in Delmar
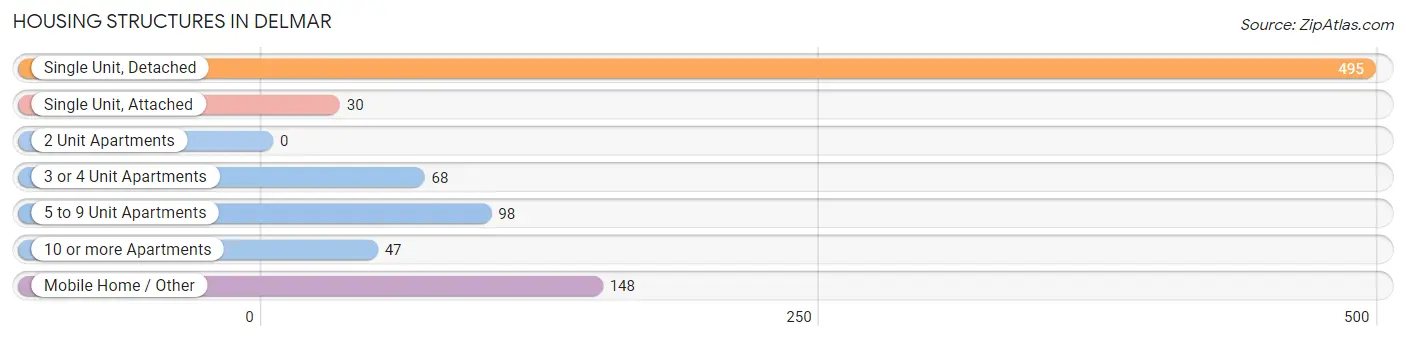
| Structure Type | # Housing Units | % Housing Units |
| Single Unit, Detached | 495 | 55.9% |
| Single Unit, Attached | 30 | 3.4% |
| 2 Unit Apartments | 0 | 0.0% |
| 3 or 4 Unit Apartments | 68 | 7.7% |
| 5 to 9 Unit Apartments | 98 | 11.1% |
| 10 or more Apartments | 47 | 5.3% |
| Mobile Home / Other | 148 | 16.7% |
| Total | 886 | 100.0% |
Housing Structures by Occupancy in Delmar
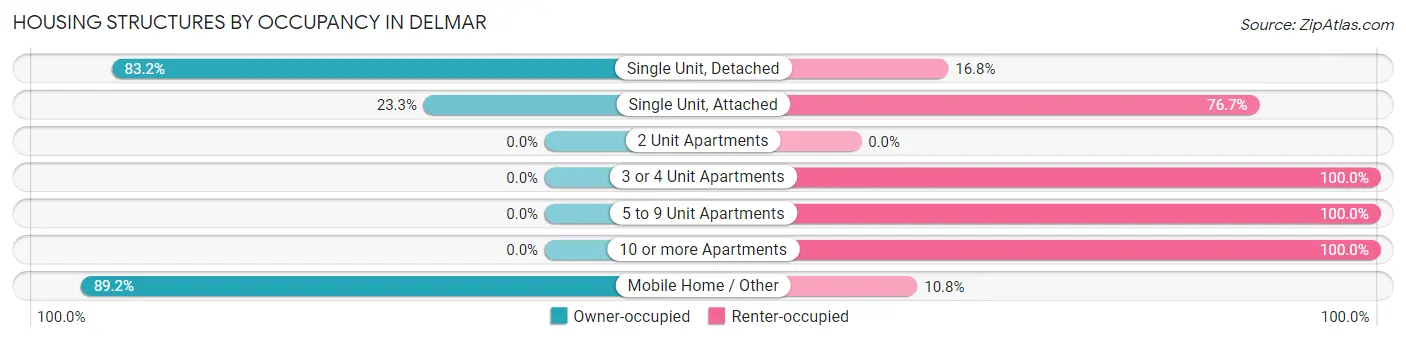
| Structure Type | Owner-occupied | Renter-occupied |
| Single Unit, Detached | 412 (83.2%) | 83 (16.8%) |
| Single Unit, Attached | 7 (23.3%) | 23 (76.7%) |
| 2 Unit Apartments | 0 (0.0%) | 0 (0.0%) |
| 3 or 4 Unit Apartments | 0 (0.0%) | 68 (100.0%) |
| 5 to 9 Unit Apartments | 0 (0.0%) | 98 (100.0%) |
| 10 or more Apartments | 0 (0.0%) | 47 (100.0%) |
| Mobile Home / Other | 132 (89.2%) | 16 (10.8%) |
| Total | 551 (62.2%) | 335 (37.8%) |
Housing Structures by Number of Rooms in Delmar
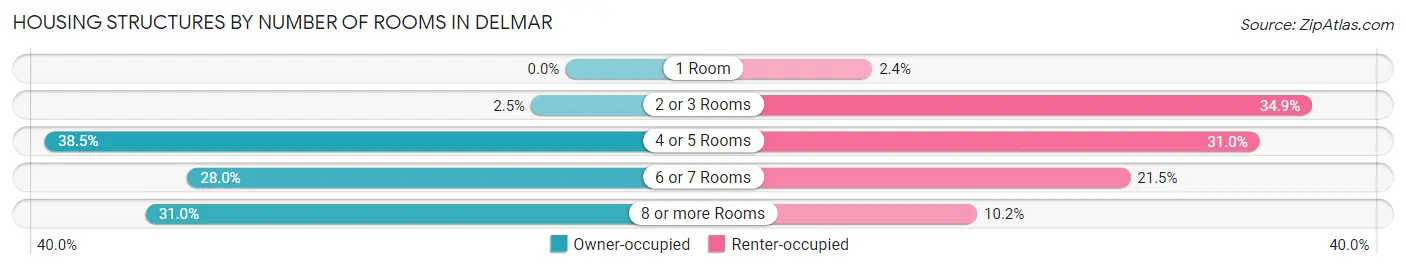
| Number of Rooms | Owner-occupied | Renter-occupied |
| 1 Room | 0 (0.0%) | 8 (2.4%) |
| 2 or 3 Rooms | 14 (2.5%) | 117 (34.9%) |
| 4 or 5 Rooms | 212 (38.5%) | 104 (31.0%) |
| 6 or 7 Rooms | 154 (28.0%) | 72 (21.5%) |
| 8 or more Rooms | 171 (31.0%) | 34 (10.2%) |
| Total | 551 (100.0%) | 335 (100.0%) |
Housing Structure by Heating Type in Delmar
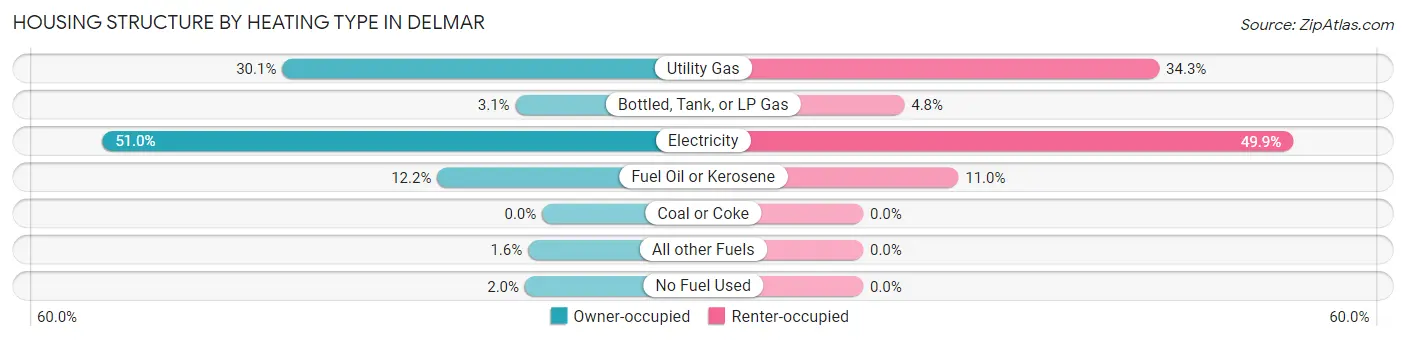
| Heating Type | Owner-occupied | Renter-occupied |
| Utility Gas | 166 (30.1%) | 115 (34.3%) |
| Bottled, Tank, or LP Gas | 17 (3.1%) | 16 (4.8%) |
| Electricity | 281 (51.0%) | 167 (49.8%) |
| Fuel Oil or Kerosene | 67 (12.2%) | 37 (11.0%) |
| Coal or Coke | 0 (0.0%) | 0 (0.0%) |
| All other Fuels | 9 (1.6%) | 0 (0.0%) |
| No Fuel Used | 11 (2.0%) | 0 (0.0%) |
| Total | 551 (100.0%) | 335 (100.0%) |
Household Vehicle Usage in Delmar
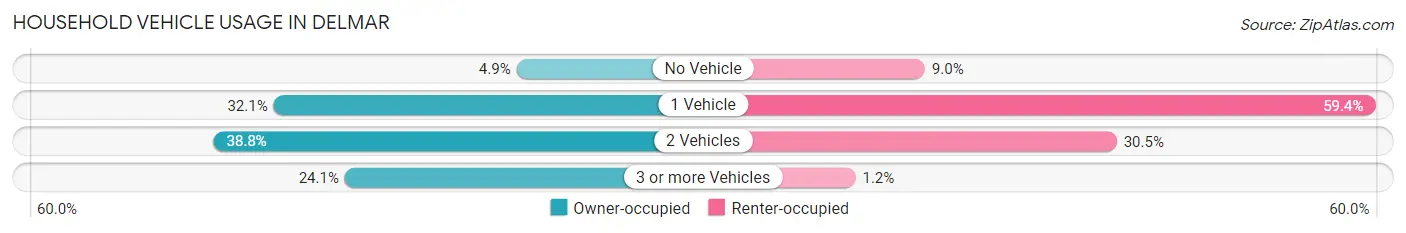
| Vehicles per Household | Owner-occupied | Renter-occupied |
| No Vehicle | 27 (4.9%) | 30 (9.0%) |
| 1 Vehicle | 177 (32.1%) | 199 (59.4%) |
| 2 Vehicles | 214 (38.8%) | 102 (30.4%) |
| 3 or more Vehicles | 133 (24.1%) | 4 (1.2%) |
| Total | 551 (100.0%) | 335 (100.0%) |
Real Estate & Mortgages in Delmar
Real Estate and Mortgage Overview in Delmar
| Characteristic | Without Mortgage | With Mortgage |
| Housing Units | 181 | 370 |
| Median Property Value | $201,600 | $223,000 |
| Median Household Income | $36,331 | $15 |
| Monthly Housing Costs | $538 | $0 |
| Real Estate Taxes | - | - |
Property Value by Mortgage Status in Delmar
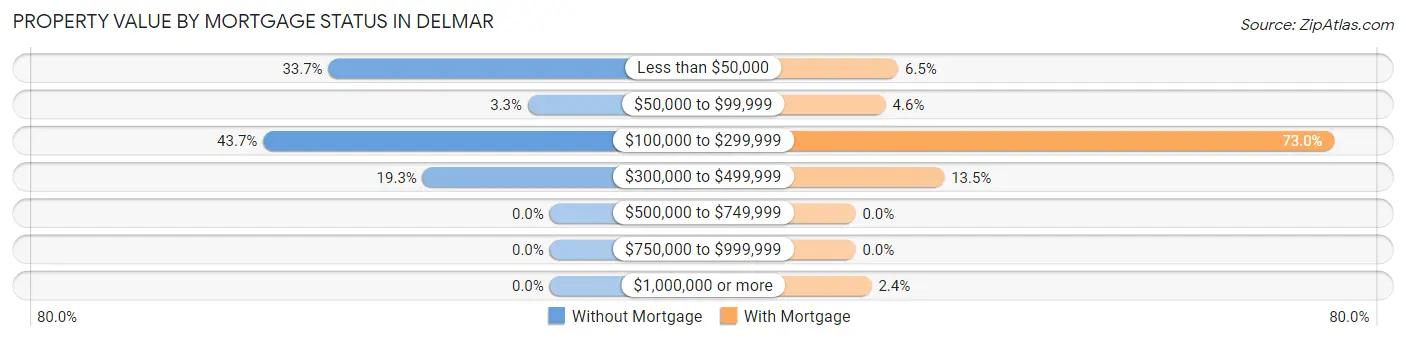
| Property Value | Without Mortgage | With Mortgage |
| Less than $50,000 | 61 (33.7%) | 24 (6.5%) |
| $50,000 to $99,999 | 6 (3.3%) | 17 (4.6%) |
| $100,000 to $299,999 | 79 (43.6%) | 270 (73.0%) |
| $300,000 to $499,999 | 35 (19.3%) | 50 (13.5%) |
| $500,000 to $749,999 | 0 (0.0%) | 0 (0.0%) |
| $750,000 to $999,999 | 0 (0.0%) | 0 (0.0%) |
| $1,000,000 or more | 0 (0.0%) | 9 (2.4%) |
| Total | 181 (100.0%) | 370 (100.0%) |
Household Income by Mortgage Status in Delmar
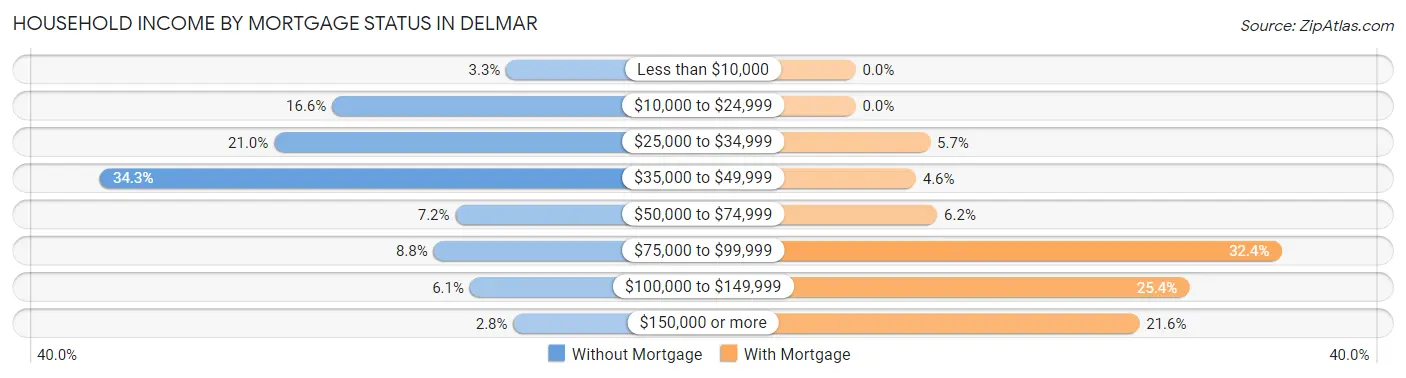
| Household Income | Without Mortgage | With Mortgage |
| Less than $10,000 | 6 (3.3%) | 0 (0.0%) |
| $10,000 to $24,999 | 30 (16.6%) | 0 (0.0%) |
| $25,000 to $34,999 | 38 (21.0%) | 21 (5.7%) |
| $35,000 to $49,999 | 62 (34.3%) | 17 (4.6%) |
| $50,000 to $74,999 | 13 (7.2%) | 23 (6.2%) |
| $75,000 to $99,999 | 16 (8.8%) | 120 (32.4%) |
| $100,000 to $149,999 | 11 (6.1%) | 94 (25.4%) |
| $150,000 or more | 5 (2.8%) | 80 (21.6%) |
| Total | 181 (100.0%) | 370 (100.0%) |
Property Value to Household Income Ratio in Delmar
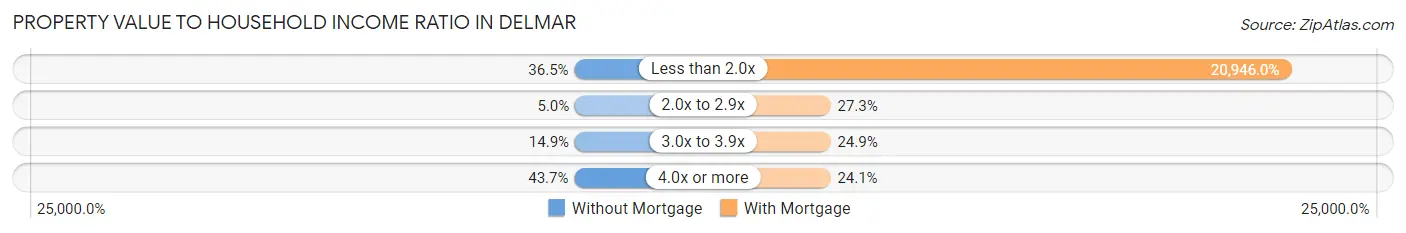
| Value-to-Income Ratio | Without Mortgage | With Mortgage |
| Less than 2.0x | 66 (36.5%) | 77,500 (20,945.9%) |
| 2.0x to 2.9x | 9 (5.0%) | 101 (27.3%) |
| 3.0x to 3.9x | 27 (14.9%) | 92 (24.9%) |
| 4.0x or more | 79 (43.6%) | 89 (24.0%) |
| Total | 181 (100.0%) | 370 (100.0%) |
Real Estate Taxes by Mortgage Status in Delmar
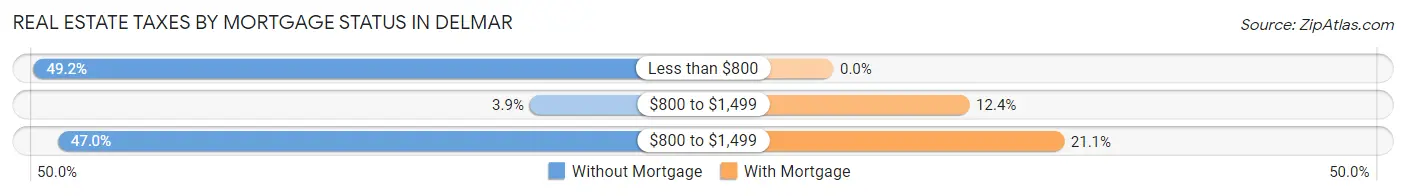
| Property Taxes | Without Mortgage | With Mortgage |
| Less than $800 | 89 (49.2%) | 0 (0.0%) |
| $800 to $1,499 | 7 (3.9%) | 46 (12.4%) |
| $800 to $1,499 | 85 (47.0%) | 78 (21.1%) |
| Total | 181 (100.0%) | 370 (100.0%) |
Health & Disability in Delmar
Health Insurance Coverage by Age in Delmar
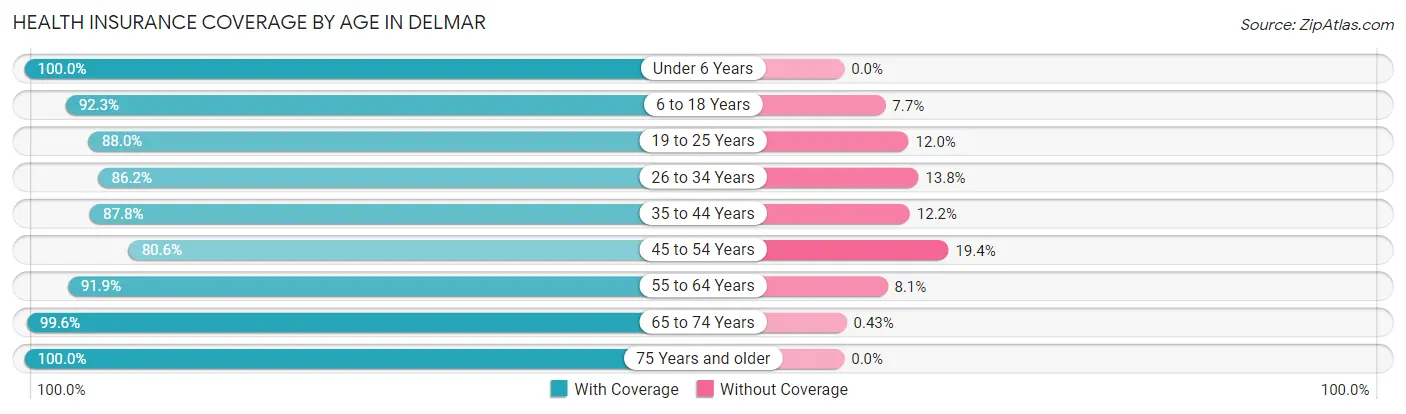
| Age Bracket | With Coverage | Without Coverage |
| Under 6 Years | 206 (100.0%) | 0 (0.0%) |
| 6 to 18 Years | 409 (92.3%) | 34 (7.7%) |
| 19 to 25 Years | 176 (88.0%) | 24 (12.0%) |
| 26 to 34 Years | 262 (86.2%) | 42 (13.8%) |
| 35 to 44 Years | 244 (87.8%) | 34 (12.2%) |
| 45 to 54 Years | 253 (80.6%) | 61 (19.4%) |
| 55 to 64 Years | 171 (91.9%) | 15 (8.1%) |
| 65 to 74 Years | 231 (99.6%) | 1 (0.4%) |
| 75 Years and older | 143 (100.0%) | 0 (0.0%) |
| Total | 2,095 (90.8%) | 211 (9.1%) |
Health Insurance Coverage by Citizenship Status in Delmar
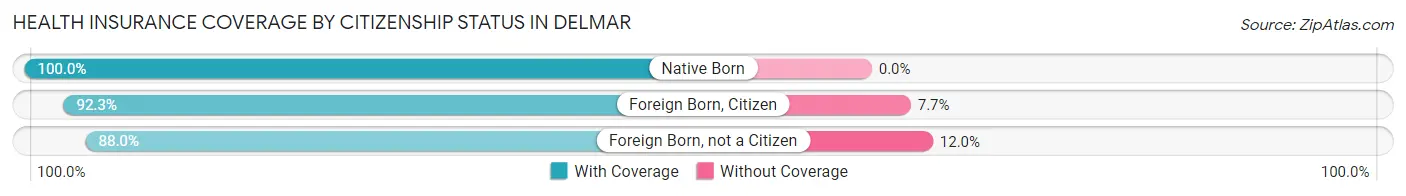
| Citizenship Status | With Coverage | Without Coverage |
| Native Born | 206 (100.0%) | 0 (0.0%) |
| Foreign Born, Citizen | 409 (92.3%) | 34 (7.7%) |
| Foreign Born, not a Citizen | 176 (88.0%) | 24 (12.0%) |
Health Insurance Coverage by Household Income in Delmar
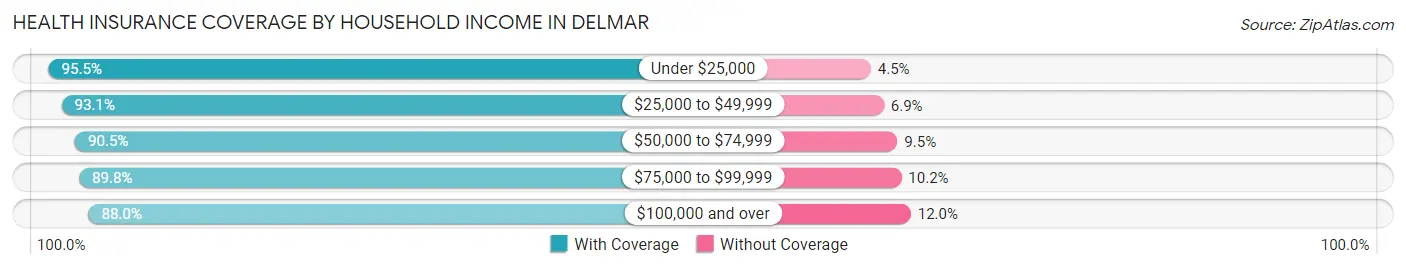
| Household Income | With Coverage | Without Coverage |
| Under $25,000 | 275 (95.5%) | 13 (4.5%) |
| $25,000 to $49,999 | 416 (93.1%) | 31 (6.9%) |
| $50,000 to $74,999 | 554 (90.5%) | 58 (9.5%) |
| $75,000 to $99,999 | 307 (89.8%) | 35 (10.2%) |
| $100,000 and over | 543 (88.0%) | 74 (12.0%) |
Public vs Private Health Insurance Coverage by Age in Delmar
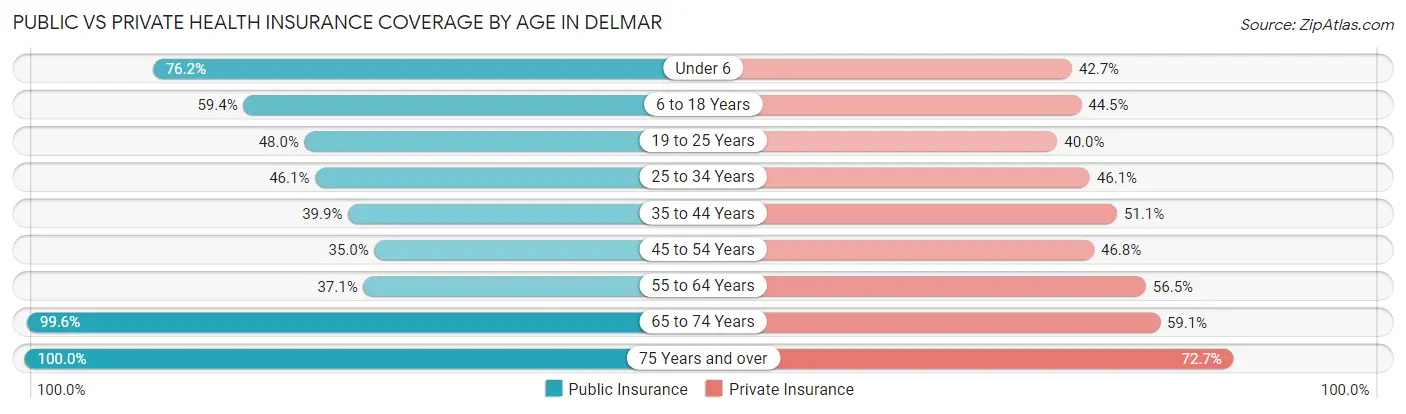
| Age Bracket | Public Insurance | Private Insurance |
| Under 6 | 157 (76.2%) | 88 (42.7%) |
| 6 to 18 Years | 263 (59.4%) | 197 (44.5%) |
| 19 to 25 Years | 96 (48.0%) | 80 (40.0%) |
| 25 to 34 Years | 140 (46.1%) | 140 (46.1%) |
| 35 to 44 Years | 111 (39.9%) | 142 (51.1%) |
| 45 to 54 Years | 110 (35.0%) | 147 (46.8%) |
| 55 to 64 Years | 69 (37.1%) | 105 (56.5%) |
| 65 to 74 Years | 231 (99.6%) | 137 (59.1%) |
| 75 Years and over | 143 (100.0%) | 104 (72.7%) |
| Total | 1,320 (57.2%) | 1,140 (49.4%) |
Disability Status by Sex by Age in Delmar
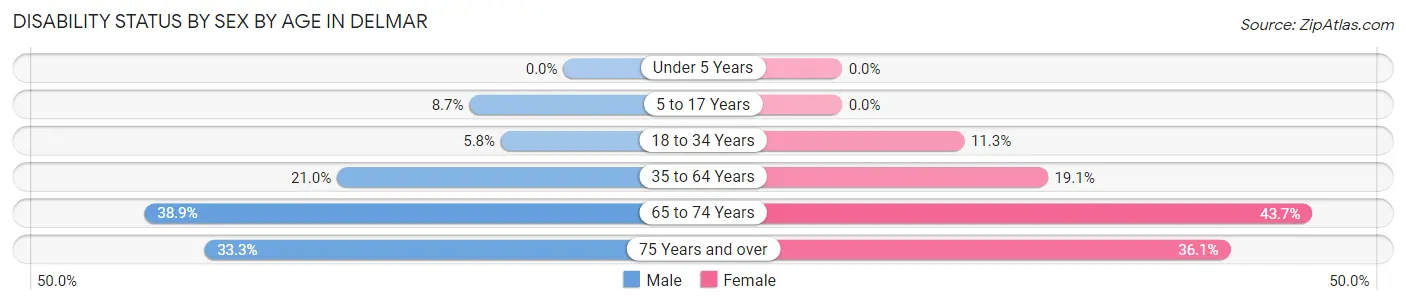
| Age Bracket | Male | Female |
| Under 5 Years | 0 (0.0%) | 0 (0.0%) |
| 5 to 17 Years | 20 (8.7%) | 0 (0.0%) |
| 18 to 34 Years | 13 (5.8%) | 33 (11.3%) |
| 35 to 64 Years | 71 (21.0%) | 84 (19.1%) |
| 65 to 74 Years | 35 (38.9%) | 62 (43.7%) |
| 75 Years and over | 19 (33.3%) | 31 (36.0%) |
Disability Class by Sex by Age in Delmar
Disability Class: Hearing Difficulty
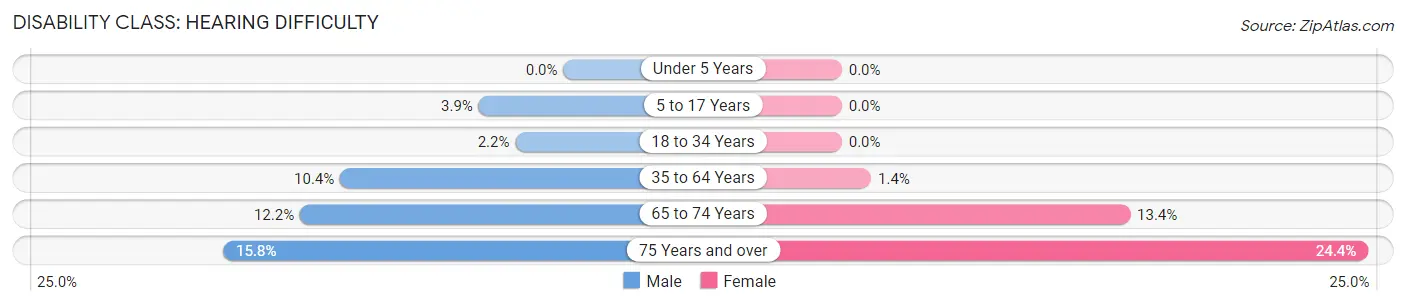
| Age Bracket | Male | Female |
| Under 5 Years | 0 (0.0%) | 0 (0.0%) |
| 5 to 17 Years | 9 (3.9%) | 0 (0.0%) |
| 18 to 34 Years | 5 (2.2%) | 0 (0.0%) |
| 35 to 64 Years | 35 (10.4%) | 6 (1.4%) |
| 65 to 74 Years | 11 (12.2%) | 19 (13.4%) |
| 75 Years and over | 9 (15.8%) | 21 (24.4%) |
Disability Class: Vision Difficulty
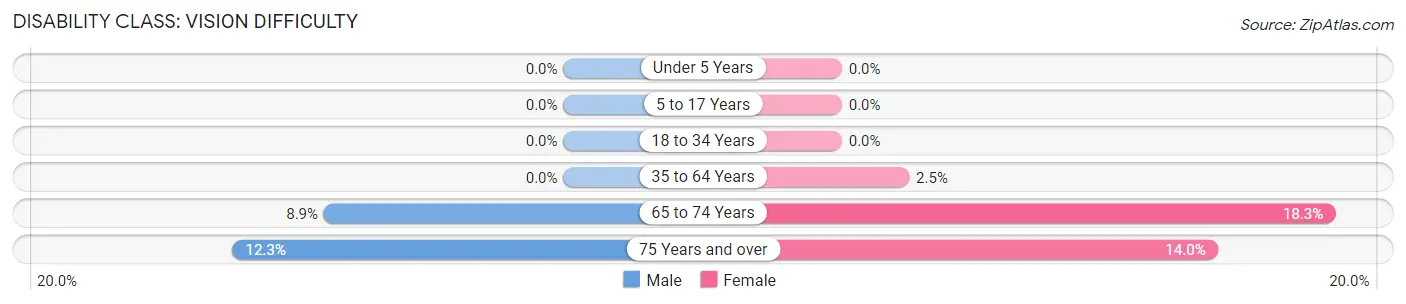
| Age Bracket | Male | Female |
| Under 5 Years | 0 (0.0%) | 0 (0.0%) |
| 5 to 17 Years | 0 (0.0%) | 0 (0.0%) |
| 18 to 34 Years | 0 (0.0%) | 0 (0.0%) |
| 35 to 64 Years | 0 (0.0%) | 11 (2.5%) |
| 65 to 74 Years | 8 (8.9%) | 26 (18.3%) |
| 75 Years and over | 7 (12.3%) | 12 (14.0%) |
Disability Class: Cognitive Difficulty
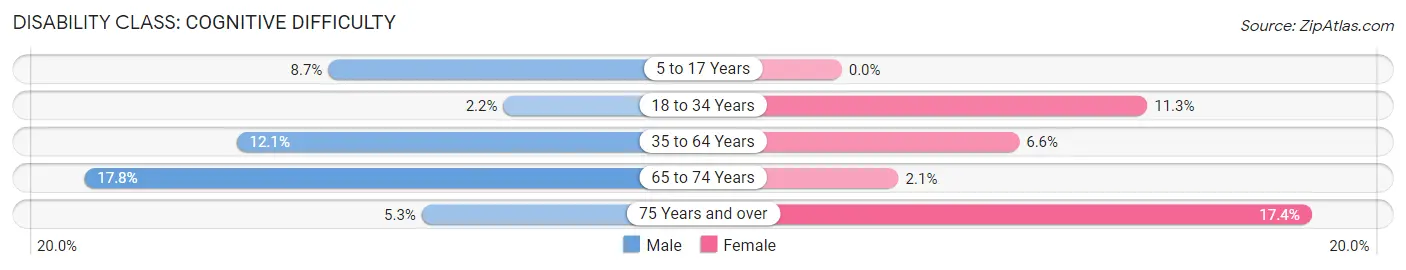
| Age Bracket | Male | Female |
| 5 to 17 Years | 20 (8.7%) | 0 (0.0%) |
| 18 to 34 Years | 5 (2.2%) | 33 (11.3%) |
| 35 to 64 Years | 41 (12.1%) | 29 (6.6%) |
| 65 to 74 Years | 16 (17.8%) | 3 (2.1%) |
| 75 Years and over | 3 (5.3%) | 15 (17.4%) |
Disability Class: Ambulatory Difficulty
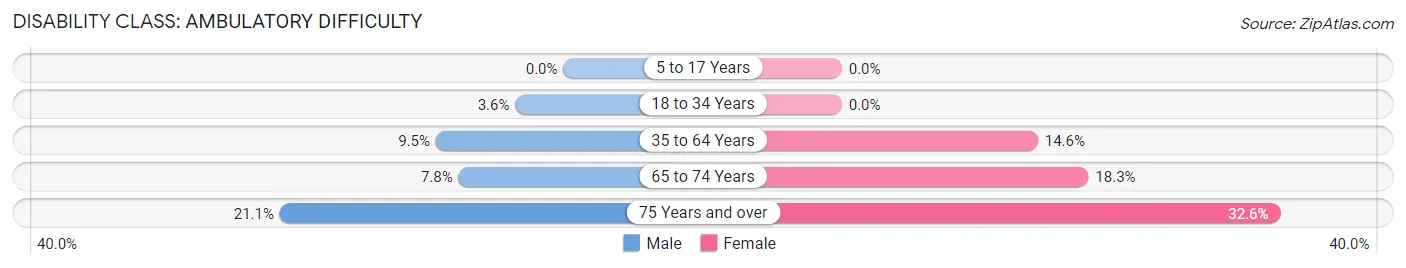
| Age Bracket | Male | Female |
| 5 to 17 Years | 0 (0.0%) | 0 (0.0%) |
| 18 to 34 Years | 8 (3.6%) | 0 (0.0%) |
| 35 to 64 Years | 32 (9.5%) | 64 (14.5%) |
| 65 to 74 Years | 7 (7.8%) | 26 (18.3%) |
| 75 Years and over | 12 (21.0%) | 28 (32.6%) |
Disability Class: Self-Care Difficulty
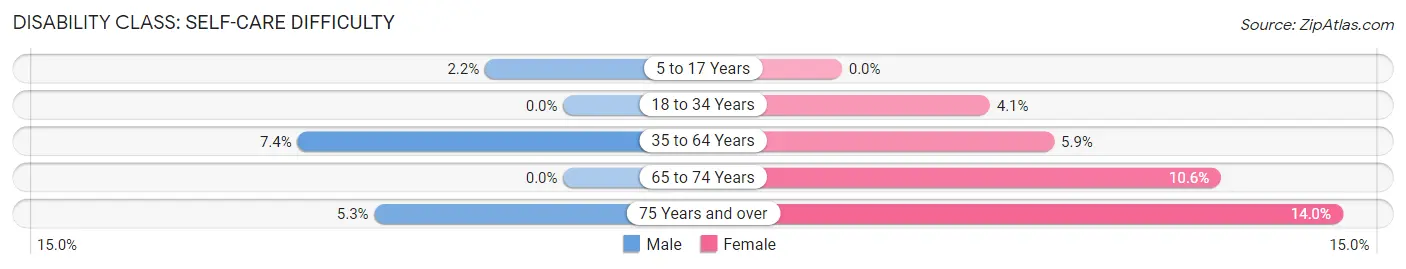
| Age Bracket | Male | Female |
| 5 to 17 Years | 5 (2.2%) | 0 (0.0%) |
| 18 to 34 Years | 0 (0.0%) | 12 (4.1%) |
| 35 to 64 Years | 25 (7.4%) | 26 (5.9%) |
| 65 to 74 Years | 0 (0.0%) | 15 (10.6%) |
| 75 Years and over | 3 (5.3%) | 12 (14.0%) |
Technology Access in Delmar
Computing Device Access in Delmar
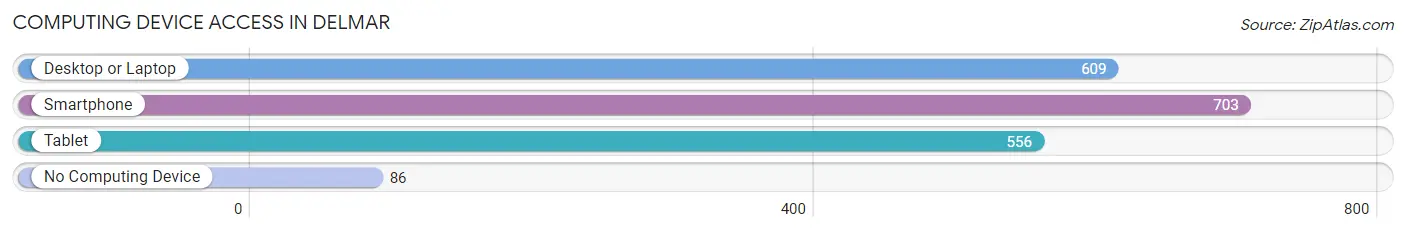
| Device Type | # Households | % Households |
| Desktop or Laptop | 609 | 68.7% |
| Smartphone | 703 | 79.3% |
| Tablet | 556 | 62.7% |
| No Computing Device | 86 | 9.7% |
| Total | 886 | 100.0% |
Internet Access in Delmar
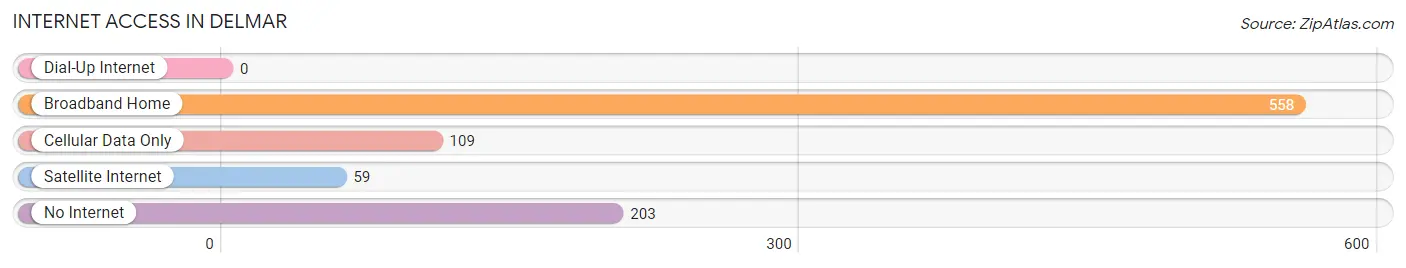
| Internet Type | # Households | % Households |
| Dial-Up Internet | 0 | 0.0% |
| Broadband Home | 558 | 63.0% |
| Cellular Data Only | 109 | 12.3% |
| Satellite Internet | 59 | 6.7% |
| No Internet | 203 | 22.9% |
| Total | 886 | 100.0% |
Delmar Summary
Delmar, Delaware is a small town located in Sussex County, Delaware. It is located on the Maryland-Delaware border, just south of Salisbury, Maryland. The town was founded in 1859 and is named after the Delmarva Peninsula, which is the landmass that encompasses the states of Delaware, Maryland, and Virginia. The town has a population of approximately 2,000 people and is a part of the Salisbury, Maryland-Delaware Metropolitan Statistical Area.
Geography
Delmar is located in the Delmarva Peninsula, which is a landmass that encompasses the states of Delaware, Maryland, and Virginia. The town is situated on the Maryland-Delaware border, just south of Salisbury, Maryland. The town is located in the Atlantic Coastal Plain, which is a flat, low-lying area that is characterized by sandy soils and a humid climate. The town is located in the Delmarva Lowlands, which is a region of low-lying land that is bordered by the Atlantic Ocean to the east and the Chesapeake Bay to the west. The town is located in the Delmarva Coastal Plain, which is a region of flat, low-lying land that is characterized by sandy soils and a humid climate.
The town is located in the Delmarva Coastal Plain, which is a region of flat, low-lying land that is characterized by sandy soils and a humid climate. The town is located in the Delmarva Lowlands, which is a region of low-lying land that is bordered by the Atlantic Ocean to the east and the Chesapeake Bay to the west. The town is located in the Delmarva Coastal Plain, which is a region of flat, low-lying land that is characterized by sandy soils and a humid climate.
The town is located in the Delmarva Coastal Plain, which is a region of flat, low-lying land that is characterized by sandy soils and a humid climate. The town is located in the Delmarva Lowlands, which is a region of low-lying land that is bordered by the Atlantic Ocean to the east and the Chesapeake Bay to the west. The town is located in the Delmarva Coastal Plain, which is a region of flat, low-lying land that is characterized by sandy soils and a humid climate.
Economy
Delmar’s economy is largely based on agriculture and tourism. The town is home to several farms, which produce a variety of crops, including corn, soybeans, wheat, and hay. The town is also home to several poultry farms, which produce eggs and poultry products. The town is also home to several seafood processing plants, which process and package seafood products for sale.
The town is also home to several tourist attractions, including the Delmarva Discovery Center, which is a museum and educational center that focuses on the history and culture of the Delmarva Peninsula. The town is also home to several restaurants, which serve a variety of local and regional cuisine.
Demographics
As of the 2010 census, the town had a population of 2,000 people. The racial makeup of the town was 94.2% White, 2.2% African American, 0.2% Native American, 0.2% Asian, 0.2% from other races, and 2.2% from two or more races. Hispanic or Latino of any race were 1.2% of the population.
The median income for a household in the town was $37,500, and the median income for a family was $45,000. The per capita income for the town was $18,000. About 11.2% of families and 14.2% of the population were below the poverty line, including 18.2% of those under age 18 and 8.2% of those age 65 or over.
Conclusion
Delmar, Delaware is a small town located in Sussex County, Delaware. It is located on the Maryland-Delaware border, just south of Salisbury, Maryland. The town was founded in 1859 and is named after the Delmarva Peninsula, which is the landmass that encompasses the states of Delaware, Maryland, and Virginia. The town has a population of approximately 2,000 people and is a part of the Salisbury, Maryland-Delaware Metropolitan Statistical Area. The town’s economy is largely based on agriculture and tourism, and the town is home to several farms, poultry farms, seafood processing plants, and tourist attractions. The town has a population that is 94.2% White, 2.2% African American, 0.2% Native American, 0.2% Asian, 0.2% from other races, and 2.2% from two or more races. The median income for a household in the town was $37,500, and the median income for a family was $45,000.
Common Questions
What is Per Capita Income in Delmar?
Per Capita income in Delmar is $25,221.
What is the Median Family Income in Delmar?
Median Family Income in Delmar is $65,948.
What is the Median Household income in Delmar?
Median Household Income in Delmar is $55,625.
What is Income or Wage Gap in Delmar?
Income or Wage Gap in Delmar is 32.1%.
Women in Delmar earn 67.9 cents for every dollar earned by a man.
What is Family Income Deficit in Delmar?
Family Income Deficit in Delmar is $8,338.
Families that are below poverty line in Delmar earn $8,338 less on average than the poverty threshold level.
What is Inequality or Gini Index in Delmar?
Inequality or Gini Index in Delmar is 0.37.
What is the Total Population of Delmar?
Total Population of Delmar is 2,398.
What is the Total Male Population of Delmar?
Total Male Population of Delmar is 1,107.
What is the Total Female Population of Delmar?
Total Female Population of Delmar is 1,291.
What is the Ratio of Males per 100 Females in Delmar?
There are 85.75 Males per 100 Females in Delmar.
What is the Ratio of Females per 100 Males in Delmar?
There are 116.62 Females per 100 Males in Delmar.
What is the Median Population Age in Delmar?
Median Population Age in Delmar is 36.5 Years.
What is the Average Family Size in Delmar
Average Family Size in Delmar is 3.4 People.
What is the Average Household Size in Delmar
Average Household Size in Delmar is 2.6 People.
How Large is the Labor Force in Delmar?
There are 1,044 People in the Labor Forcein in Delmar.
What is the Percentage of People in the Labor Force in Delmar?
57.9% of People are in the Labor Force in Delmar.
What is the Unemployment Rate in Delmar?
Unemployment Rate in Delmar is 5.2%.