Bellefonte, DE Map & Demographics
Bellefonte Map
Bellefonte Overview
$38,492
PER CAPITA INCOME
$99,500
AVG FAMILY INCOME
$81,563
AVG HOUSEHOLD INCOME
3.8%
WAGE / INCOME GAP [ % ]
96.2¢/ $1
WAGE / INCOME GAP [ $ ]
0.37
INEQUALITY / GINI INDEX
1,526
TOTAL POPULATION
783
MALE POPULATION
743
FEMALE POPULATION
105.38
MALES / 100 FEMALES
94.89
FEMALES / 100 MALES
40.7
MEDIAN AGE
3.3
AVG FAMILY SIZE
2.5
AVG HOUSEHOLD SIZE
863
LABOR FORCE [ PEOPLE ]
71.6%
PERCENT IN LABOR FORCE
4.5%
UNEMPLOYMENT RATE
Bellefonte Area Codes
Income in Bellefonte
Income Overview in Bellefonte
Per Capita Income in Bellefonte is $38,492, while median incomes of families and households are $99,500 and $81,563 respectively.
| Characteristic | Number | Measure |
| Per Capita Income | 1,526 | $38,492 |
| Median Family Income | 334 | $99,500 |
| Mean Family Income | 334 | $111,147 |
| Median Household Income | 620 | $81,563 |
| Mean Household Income | 620 | $92,751 |
| Income Deficit | 334 | $0 |
| Wage / Income Gap (%) | 1,526 | 3.83% |
| Wage / Income Gap ($) | 1,526 | 96.17¢ per $1 |
| Gini / Inequality Index | 1,526 | 0.37 |
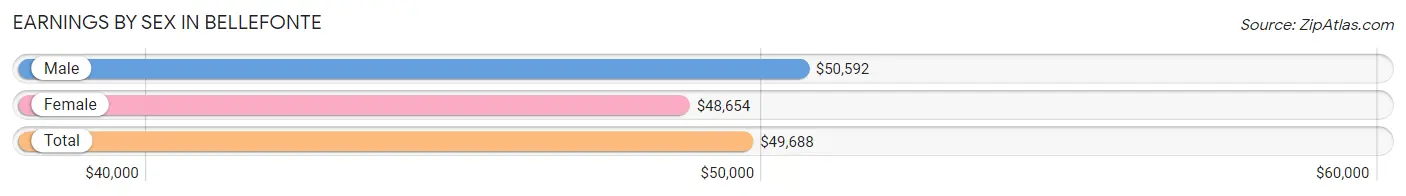
Earnings by Sex in Bellefonte
Average Earnings in Bellefonte are $49,688, $50,592 for men and $48,654 for women, a difference of 3.8%.
| Sex | Number | Average Earnings |
| Male | 455 (50.4%) | $50,592 |
| Female | 448 (49.6%) | $48,654 |
| Total | 903 (100.0%) | $49,688 |
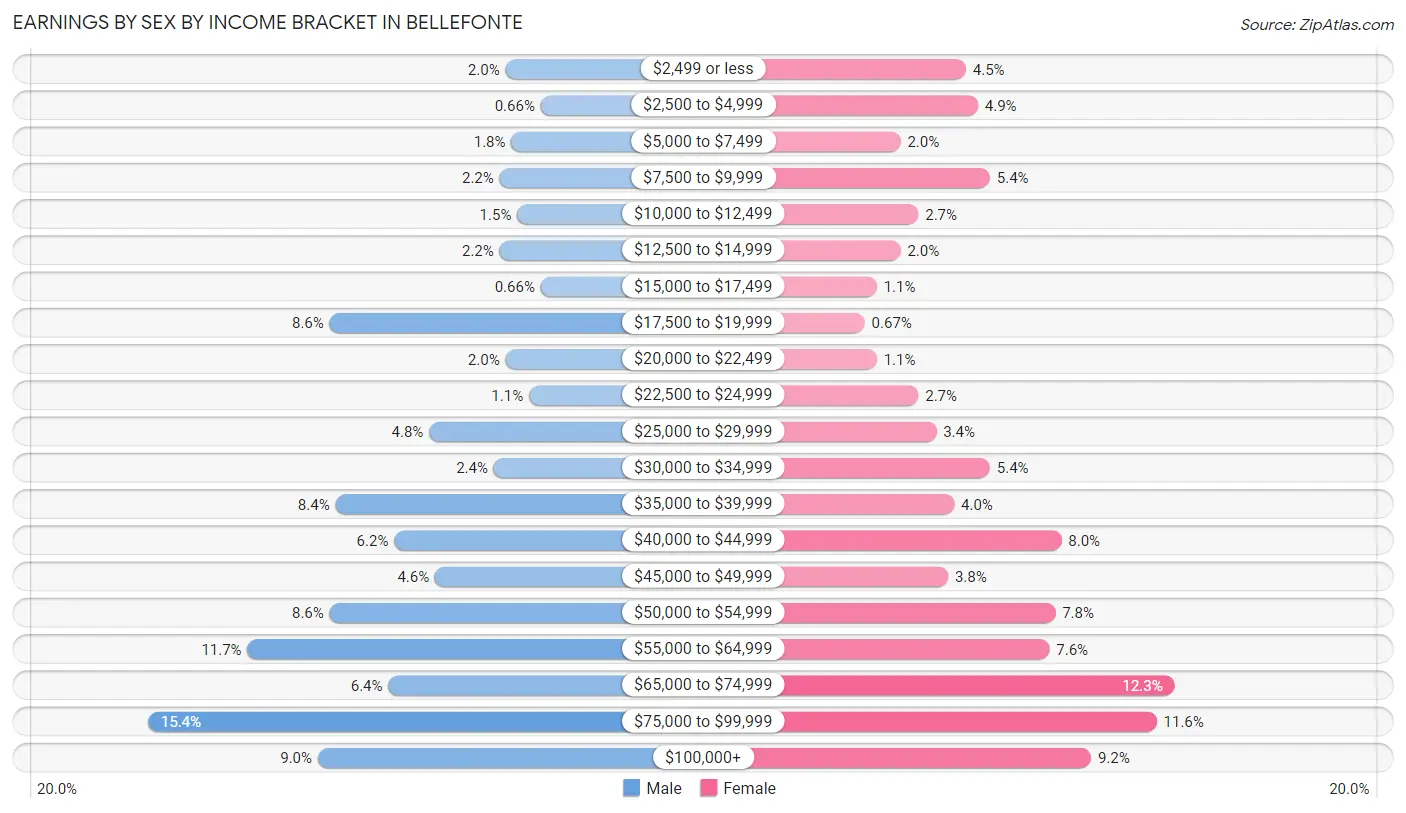
Earnings by Sex by Income Bracket in Bellefonte
The most common earnings brackets in Bellefonte are $75,000 to $99,999 for men (70 | 15.4%) and $65,000 to $74,999 for women (55 | 12.3%).
| Income | Male | Female |
| $2,499 or less | 9 (2.0%) | 20 (4.5%) |
| $2,500 to $4,999 | 3 (0.7%) | 22 (4.9%) |
| $5,000 to $7,499 | 8 (1.8%) | 9 (2.0%) |
| $7,500 to $9,999 | 10 (2.2%) | 24 (5.4%) |
| $10,000 to $12,499 | 7 (1.5%) | 12 (2.7%) |
| $12,500 to $14,999 | 10 (2.2%) | 9 (2.0%) |
| $15,000 to $17,499 | 3 (0.7%) | 5 (1.1%) |
| $17,500 to $19,999 | 39 (8.6%) | 3 (0.7%) |
| $20,000 to $22,499 | 9 (2.0%) | 5 (1.1%) |
| $22,500 to $24,999 | 5 (1.1%) | 12 (2.7%) |
| $25,000 to $29,999 | 22 (4.8%) | 15 (3.4%) |
| $30,000 to $34,999 | 11 (2.4%) | 24 (5.4%) |
| $35,000 to $39,999 | 38 (8.4%) | 18 (4.0%) |
| $40,000 to $44,999 | 28 (6.1%) | 36 (8.0%) |
| $45,000 to $49,999 | 21 (4.6%) | 17 (3.8%) |
| $50,000 to $54,999 | 39 (8.6%) | 35 (7.8%) |
| $55,000 to $64,999 | 53 (11.7%) | 34 (7.6%) |
| $65,000 to $74,999 | 29 (6.4%) | 55 (12.3%) |
| $75,000 to $99,999 | 70 (15.4%) | 52 (11.6%) |
| $100,000+ | 41 (9.0%) | 41 (9.1%) |
| Total | 455 (100.0%) | 448 (100.0%) |
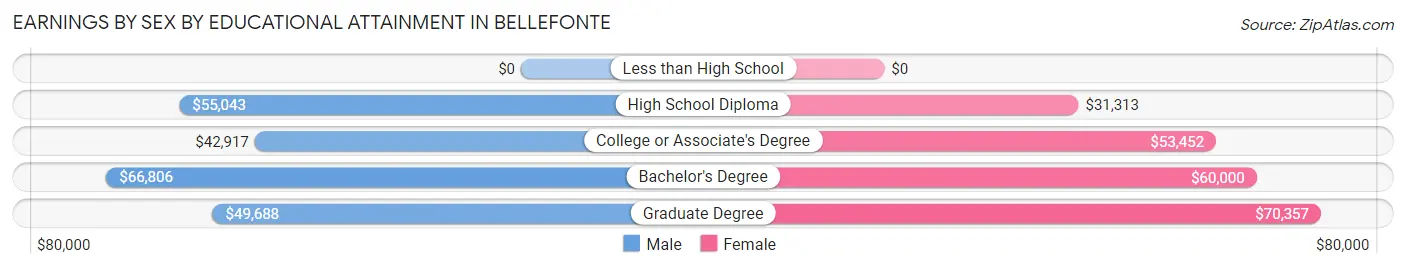
Earnings by Sex by Educational Attainment in Bellefonte
Average earnings in Bellefonte are $54,125 for men and $52,375 for women, a difference of 3.2%. Men with an educational attainment of bachelor's degree enjoy the highest average annual earnings of $66,806, while those with college or associate's degree education earn the least with $42,917. Women with an educational attainment of graduate degree earn the most with the average annual earnings of $70,357, while those with high school diploma education have the smallest earnings of $31,313.
| Educational Attainment | Male Income | Female Income |
| Less than High School | - | - |
| High School Diploma | $55,043 | $31,313 |
| College or Associate's Degree | $42,917 | $53,452 |
| Bachelor's Degree | $66,806 | $60,000 |
| Graduate Degree | $49,688 | $70,357 |
| Total | $54,125 | $52,375 |
Family Income in Bellefonte
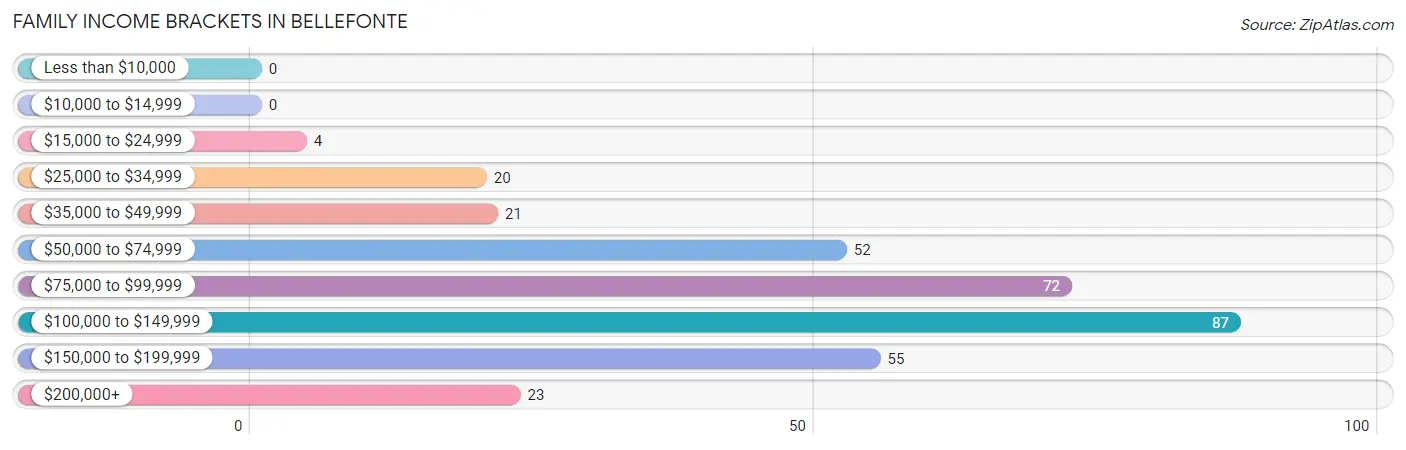
Family Income Brackets in Bellefonte
According to the Bellefonte family income data, there are 87 families falling into the $100,000 to $149,999 income range, which is the most common income bracket and makes up 26.1% of all families.
| Income Bracket | # Families | % Families |
| Less than $10,000 | 0 | 0.0% |
| $10,000 to $14,999 | 0 | 0.0% |
| $15,000 to $24,999 | 4 | 1.2% |
| $25,000 to $34,999 | 20 | 6.0% |
| $35,000 to $49,999 | 21 | 6.3% |
| $50,000 to $74,999 | 52 | 15.6% |
| $75,000 to $99,999 | 72 | 21.6% |
| $100,000 to $149,999 | 87 | 26.0% |
| $150,000 to $199,999 | 55 | 16.5% |
| $200,000+ | 23 | 6.9% |
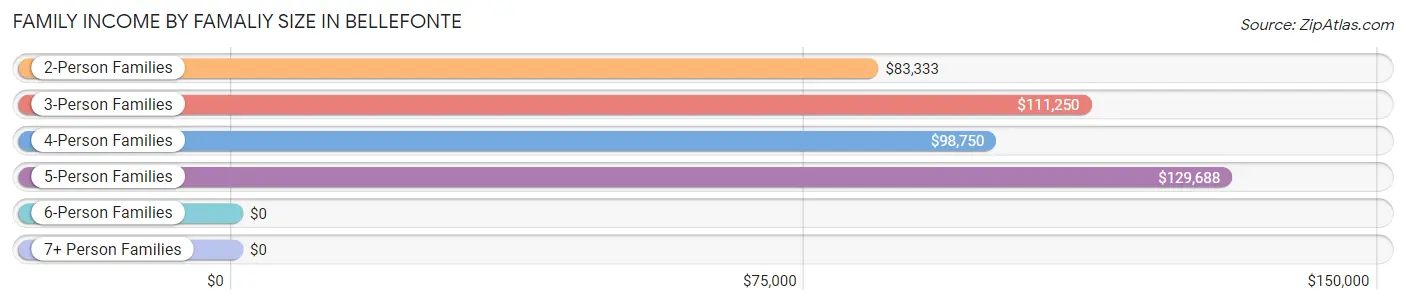
Family Income by Famaliy Size in Bellefonte
5-person families (9 | 2.7%) account for the highest median family income in Bellefonte with $129,688 per family, while 2-person families (160 | 47.9%) have the highest median income of $41,666 per family member.
| Income Bracket | # Families | Median Income |
| 2-Person Families | 160 (47.9%) | $83,333 |
| 3-Person Families | 51 (15.3%) | $111,250 |
| 4-Person Families | 108 (32.3%) | $98,750 |
| 5-Person Families | 9 (2.7%) | $129,688 |
| 6-Person Families | 0 (0.0%) | $0 |
| 7+ Person Families | 6 (1.8%) | $0 |
| Total | 334 (100.0%) | $99,500 |
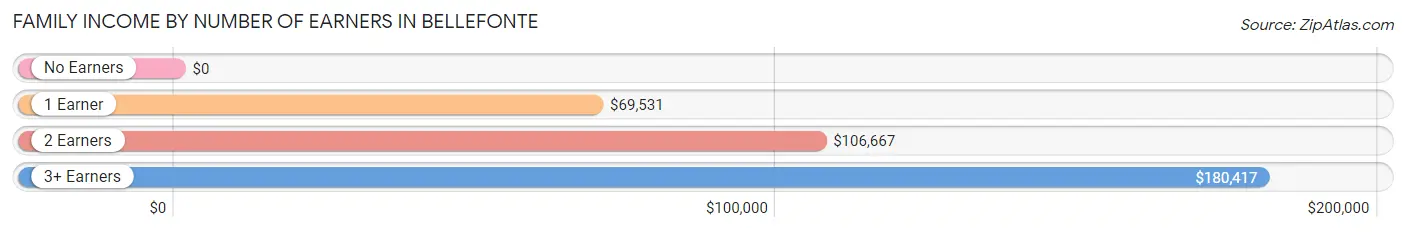
Family Income by Number of Earners in Bellefonte
| Number of Earners | # Families | Median Income |
| No Earners | 30 (9.0%) | $0 |
| 1 Earner | 92 (27.5%) | $69,531 |
| 2 Earners | 172 (51.5%) | $106,667 |
| 3+ Earners | 40 (12.0%) | $180,417 |
| Total | 334 (100.0%) | $99,500 |
Household Income in Bellefonte
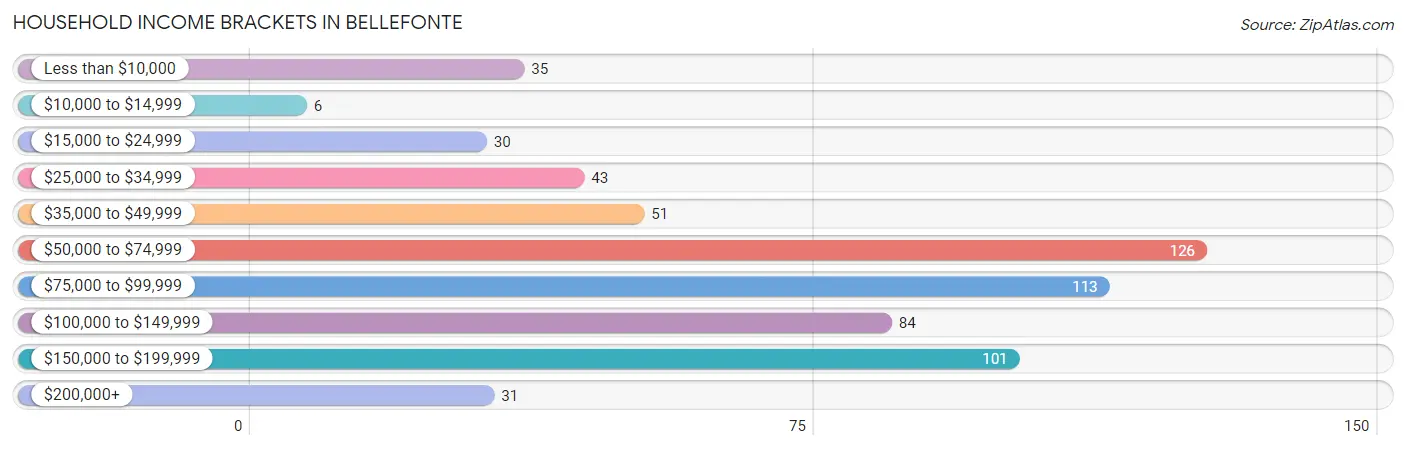
Household Income Brackets in Bellefonte
With 126 households falling in the category, the $50,000 to $74,999 income range is the most frequent in Bellefonte, accounting for 20.3% of all households. In contrast, only 6 households (1.0%) fall into the $10,000 to $14,999 income bracket, making it the least populous group.
| Income Bracket | # Households | % Households |
| Less than $10,000 | 35 | 5.6% |
| $10,000 to $14,999 | 6 | 1.0% |
| $15,000 to $24,999 | 30 | 4.8% |
| $25,000 to $34,999 | 43 | 6.9% |
| $35,000 to $49,999 | 51 | 8.2% |
| $50,000 to $74,999 | 126 | 20.3% |
| $75,000 to $99,999 | 113 | 18.2% |
| $100,000 to $149,999 | 84 | 13.5% |
| $150,000 to $199,999 | 101 | 16.3% |
| $200,000+ | 31 | 5.0% |
Household Income by Householder Age in Bellefonte
The median household income in Bellefonte is $81,563, with the highest median household income of $99,348 found in the 25 to 44 years age bracket for the primary householder. A total of 212 households (34.2%) fall into this category.
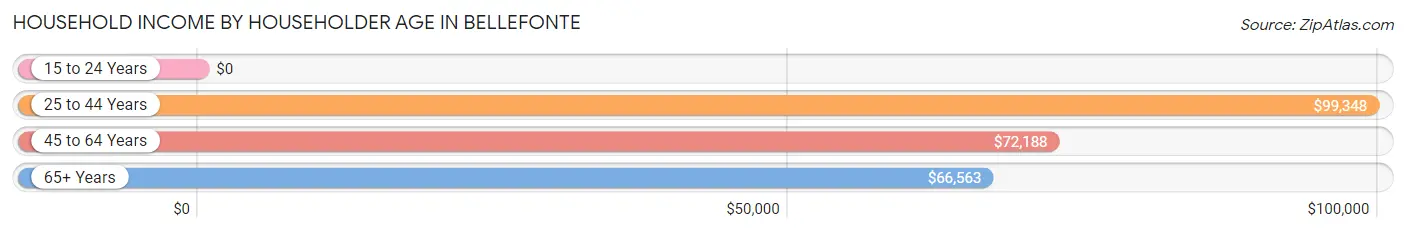
| Income Bracket | # Households | Median Income |
| 15 to 24 Years | 0 (0.0%) | $0 |
| 25 to 44 Years | 212 (34.2%) | $99,348 |
| 45 to 64 Years | 273 (44.0%) | $72,188 |
| 65+ Years | 135 (21.8%) | $66,563 |
| Total | 620 (100.0%) | $81,563 |
Poverty in Bellefonte
Income Below Poverty by Sex and Age in Bellefonte
With 2.8% poverty level for males and 7.1% for females among the residents of Bellefonte, 35 to 44 year old males and 75 year old and over females are the most vulnerable to poverty, with 8 males (7.1%) and 7 females (31.8%) in their respective age groups living below the poverty level.
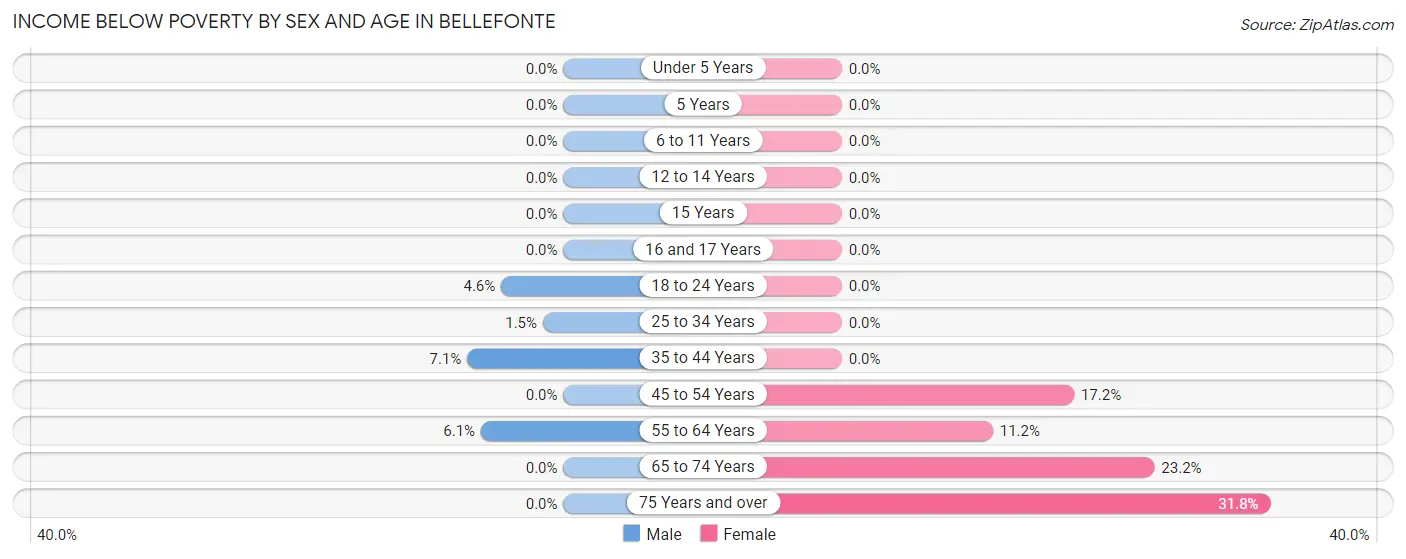
| Age Bracket | Male | Female |
| Under 5 Years | 0 (0.0%) | 0 (0.0%) |
| 5 Years | 0 (0.0%) | 0 (0.0%) |
| 6 to 11 Years | 0 (0.0%) | 0 (0.0%) |
| 12 to 14 Years | 0 (0.0%) | 0 (0.0%) |
| 15 Years | 0 (0.0%) | 0 (0.0%) |
| 16 and 17 Years | 0 (0.0%) | 0 (0.0%) |
| 18 to 24 Years | 3 (4.6%) | 0 (0.0%) |
| 25 to 34 Years | 2 (1.5%) | 0 (0.0%) |
| 35 to 44 Years | 8 (7.1%) | 0 (0.0%) |
| 45 to 54 Years | 0 (0.0%) | 20 (17.2%) |
| 55 to 64 Years | 9 (6.1%) | 13 (11.2%) |
| 65 to 74 Years | 0 (0.0%) | 13 (23.2%) |
| 75 Years and over | 0 (0.0%) | 7 (31.8%) |
| Total | 22 (2.8%) | 53 (7.1%) |
Income Above Poverty by Sex and Age in Bellefonte
According to the poverty statistics in Bellefonte, males aged under 5 years and females aged under 5 years are the age groups that are most secure financially, with 100.0% of males and 100.0% of females in these age groups living above the poverty line.
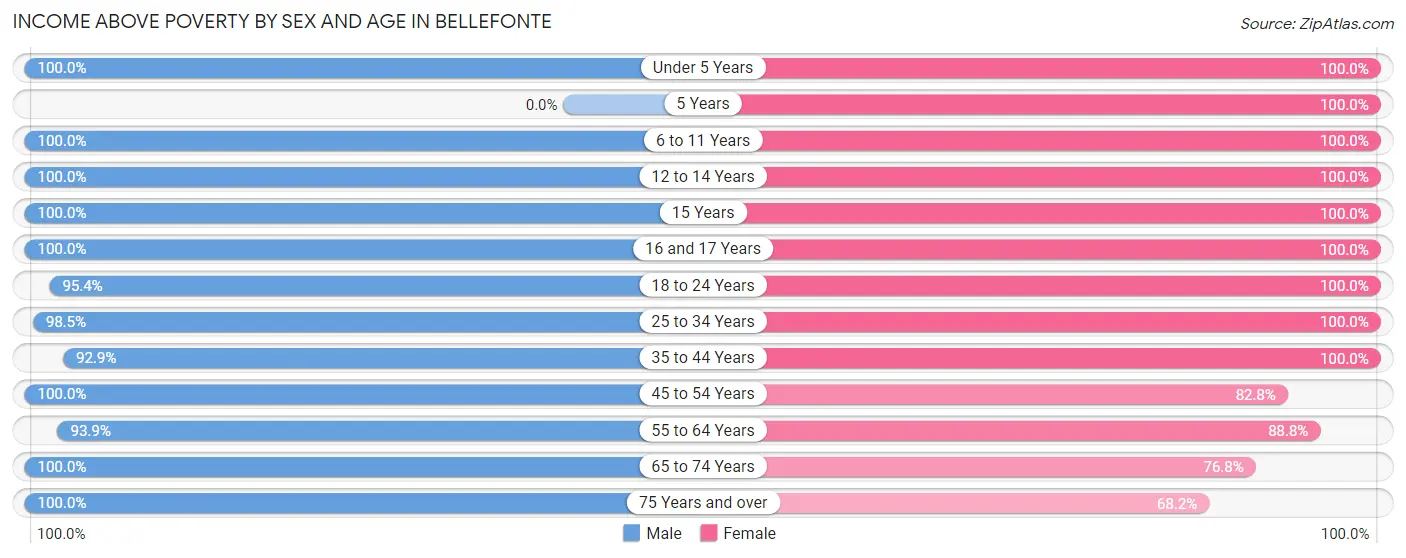
| Age Bracket | Male | Female |
| Under 5 Years | 66 (100.0%) | 78 (100.0%) |
| 5 Years | 0 (0.0%) | 8 (100.0%) |
| 6 to 11 Years | 45 (100.0%) | 62 (100.0%) |
| 12 to 14 Years | 38 (100.0%) | 11 (100.0%) |
| 15 Years | 4 (100.0%) | 4 (100.0%) |
| 16 and 17 Years | 9 (100.0%) | 14 (100.0%) |
| 18 to 24 Years | 62 (95.4%) | 38 (100.0%) |
| 25 to 34 Years | 130 (98.5%) | 97 (100.0%) |
| 35 to 44 Years | 104 (92.9%) | 121 (100.0%) |
| 45 to 54 Years | 73 (100.0%) | 96 (82.8%) |
| 55 to 64 Years | 138 (93.9%) | 103 (88.8%) |
| 65 to 74 Years | 60 (100.0%) | 43 (76.8%) |
| 75 Years and over | 28 (100.0%) | 15 (68.2%) |
| Total | 757 (97.2%) | 690 (92.9%) |
Income Below Poverty Among Married-Couple Families in Bellefonte
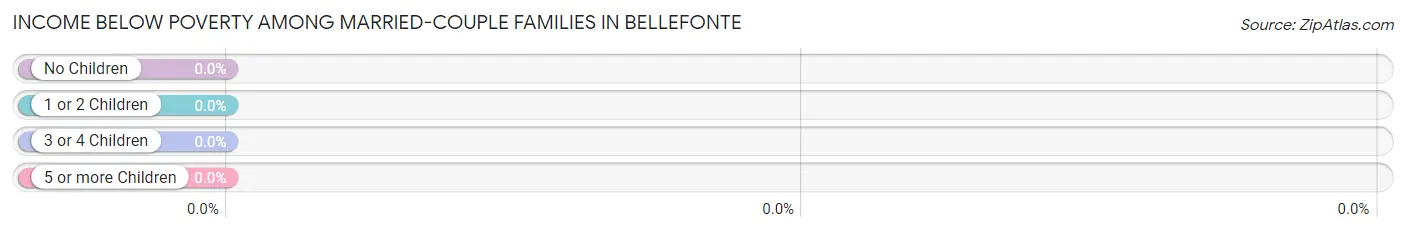
| Children | Above Poverty | Below Poverty |
| No Children | 111 (100.0%) | 0 (0.0%) |
| 1 or 2 Children | 75 (100.0%) | 0 (0.0%) |
| 3 or 4 Children | 8 (100.0%) | 0 (0.0%) |
| 5 or more Children | 0 (0.0%) | 0 (0.0%) |
| Total | 194 (100.0%) | 0 (0.0%) |
Income Below Poverty Among Single-Parent Households in Bellefonte
| Children | Single Father | Single Mother |
| No Children | 0 (0.0%) | 0 (0.0%) |
| 1 or 2 Children | 0 (0.0%) | 0 (0.0%) |
| 3 or 4 Children | 0 (0.0%) | 0 (0.0%) |
| 5 or more Children | 0 (0.0%) | 0 (0.0%) |
| Total | 0 (0.0%) | 0 (0.0%) |
Income Below Poverty Among Married-Couple vs Single-Parent Households in Bellefonte
| Children | Married-Couple Families | Single-Parent Households |
| No Children | 0 (0.0%) | 0 (0.0%) |
| 1 or 2 Children | 0 (0.0%) | 0 (0.0%) |
| 3 or 4 Children | 0 (0.0%) | 0 (0.0%) |
| 5 or more Children | 0 (0.0%) | 0 (0.0%) |
| Total | 0 (0.0%) | 0 (0.0%) |
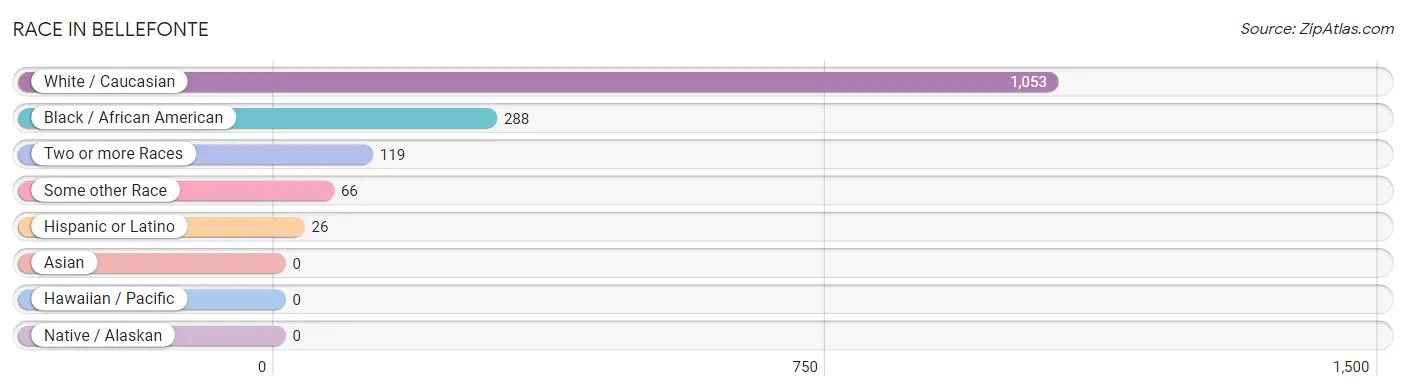
Race in Bellefonte
The most populous races in Bellefonte are White / Caucasian (1,053 | 69.0%), Black / African American (288 | 18.9%), and Two or more Races (119 | 7.8%).
| Race | # Population | % Population |
| Asian | 0 | 0.0% |
| Black / African American | 288 | 18.9% |
| Hawaiian / Pacific | 0 | 0.0% |
| Hispanic or Latino | 26 | 1.7% |
| Native / Alaskan | 0 | 0.0% |
| White / Caucasian | 1,053 | 69.0% |
| Two or more Races | 119 | 7.8% |
| Some other Race | 66 | 4.3% |
| Total | 1,526 | 100.0% |
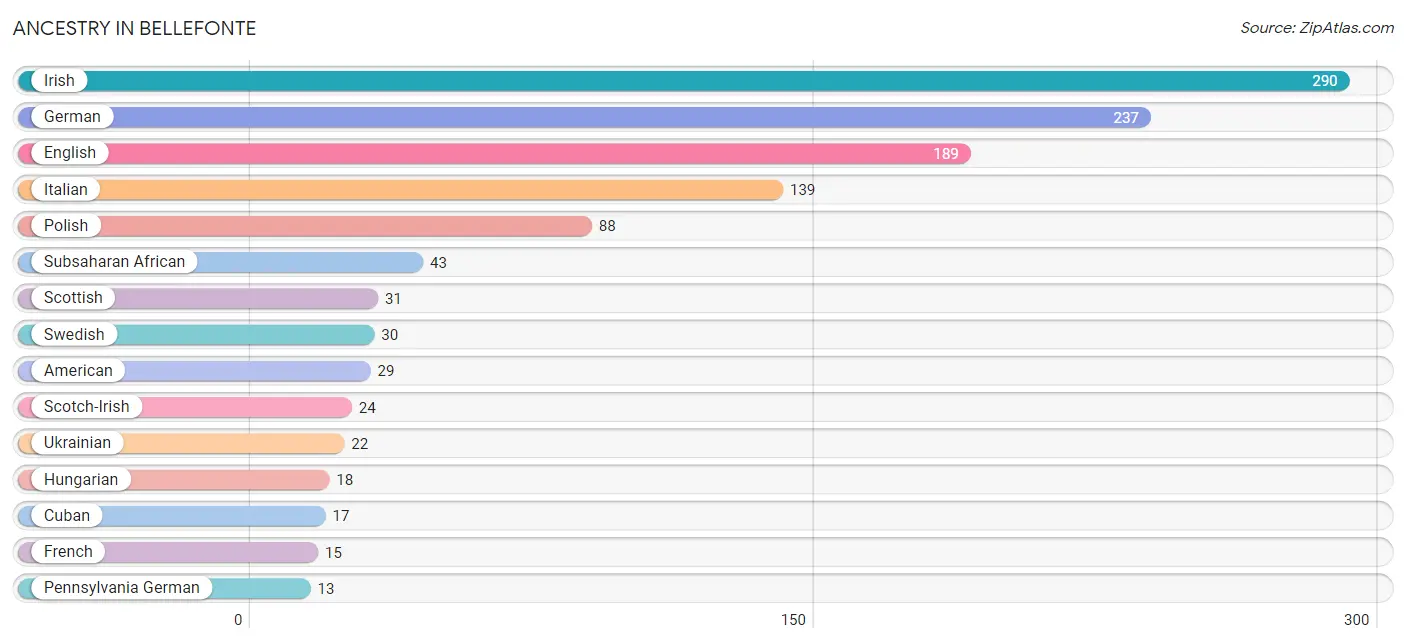
Ancestry in Bellefonte
The most populous ancestries reported in Bellefonte are Irish (290 | 19.0%), German (237 | 15.5%), English (189 | 12.4%), Italian (139 | 9.1%), and Polish (88 | 5.8%), together accounting for 61.8% of all Bellefonte residents.
| Ancestry | # Population | % Population |
| African | 9 | 0.6% |
| American | 29 | 1.9% |
| Blackfeet | 1 | 0.1% |
| Burmese | 3 | 0.2% |
| Cuban | 17 | 1.1% |
| Dutch | 6 | 0.4% |
| Eastern European | 7 | 0.5% |
| English | 189 | 12.4% |
| European | 6 | 0.4% |
| French | 15 | 1.0% |
| French Canadian | 3 | 0.2% |
| German | 237 | 15.5% |
| Greek | 4 | 0.3% |
| Hungarian | 18 | 1.2% |
| Irish | 290 | 19.0% |
| Italian | 139 | 9.1% |
| Jamaican | 5 | 0.3% |
| Norwegian | 4 | 0.3% |
| Pennsylvania German | 13 | 0.9% |
| Polish | 88 | 5.8% |
| Puerto Rican | 1 | 0.1% |
| Russian | 5 | 0.3% |
| Scotch-Irish | 24 | 1.6% |
| Scottish | 31 | 2.0% |
| South American | 5 | 0.3% |
| Subsaharan African | 43 | 2.8% |
| Swedish | 30 | 2.0% |
| Ukrainian | 22 | 1.4% |
| Venezuelan | 5 | 0.3% |
| Welsh | 3 | 0.2% | View All 30 Rows |
Immigrants in Bellefonte
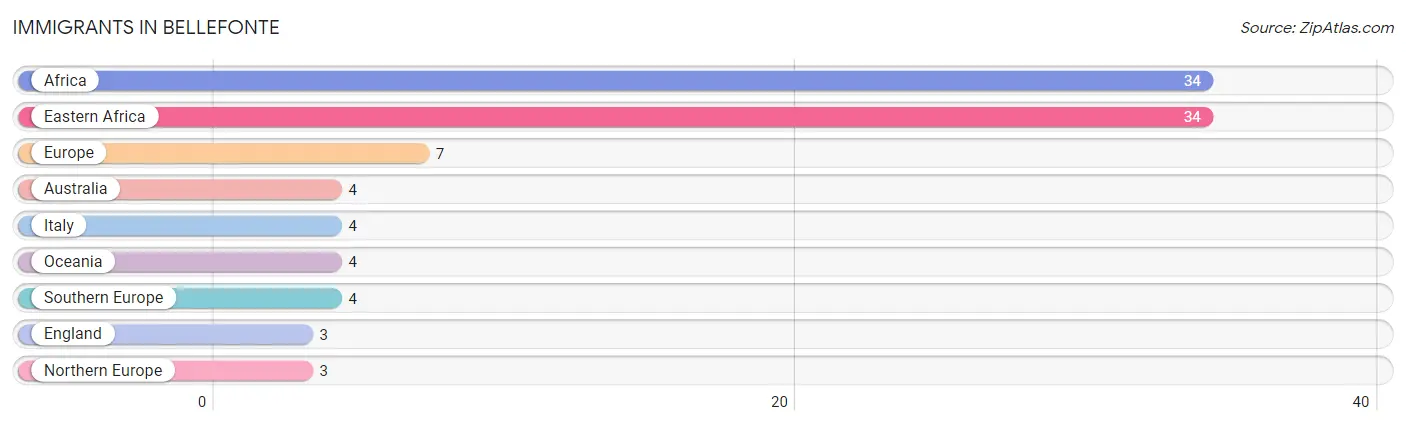
The most numerous immigrant groups reported in Bellefonte came from Africa (34 | 2.2%), Eastern Africa (34 | 2.2%), Europe (7 | 0.5%), Australia (4 | 0.3%), and Italy (4 | 0.3%), together accounting for 5.4% of all Bellefonte residents.
| Immigration Origin | # Population | % Population |
| Africa | 34 | 2.2% |
| Australia | 4 | 0.3% |
| Eastern Africa | 34 | 2.2% |
| England | 3 | 0.2% |
| Europe | 7 | 0.5% |
| Italy | 4 | 0.3% |
| Northern Europe | 3 | 0.2% |
| Oceania | 4 | 0.3% |
| Southern Europe | 4 | 0.3% | View All 9 Rows |
Sex and Age in Bellefonte
Sex and Age in Bellefonte
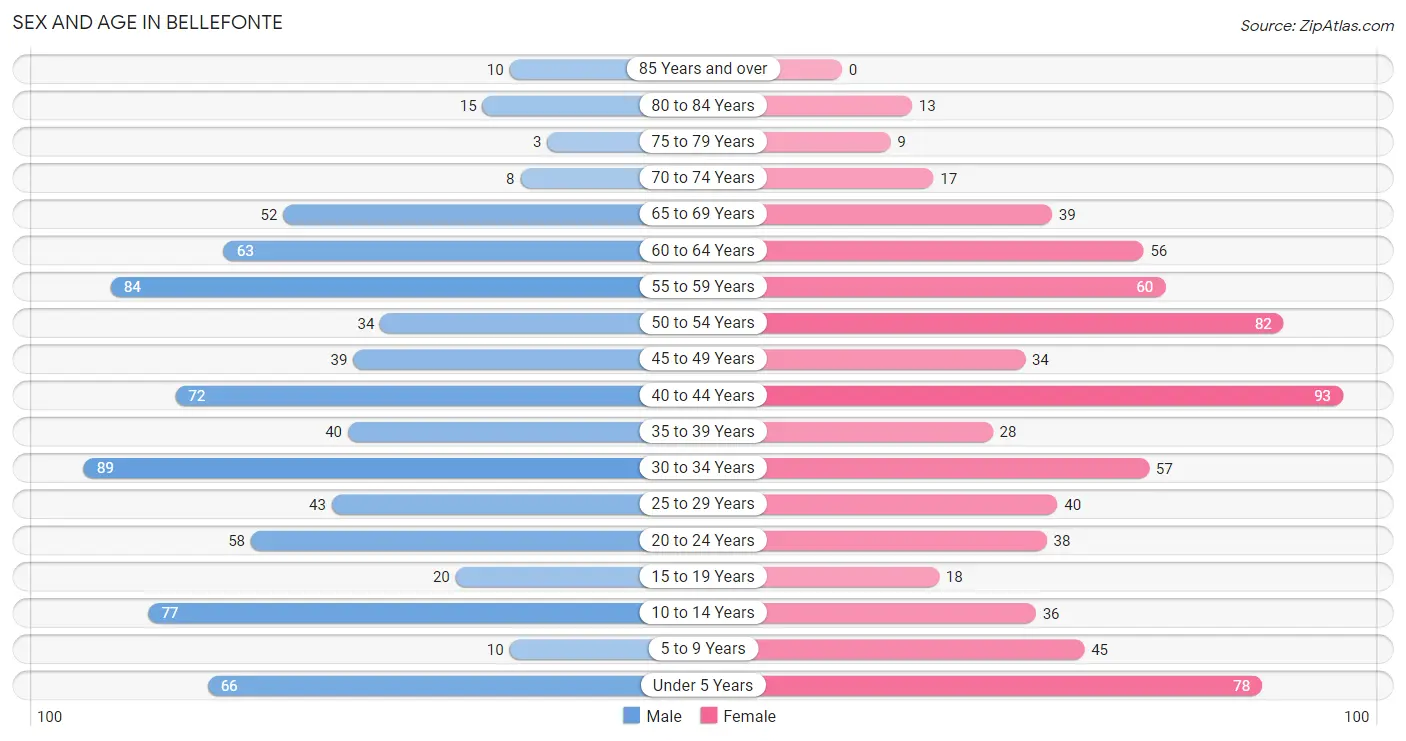
The most populous age groups in Bellefonte are 30 to 34 Years (89 | 11.4%) for men and 40 to 44 Years (93 | 12.5%) for women.
| Age Bracket | Male | Female |
| Under 5 Years | 66 (8.4%) | 78 (10.5%) |
| 5 to 9 Years | 10 (1.3%) | 45 (6.1%) |
| 10 to 14 Years | 77 (9.8%) | 36 (4.9%) |
| 15 to 19 Years | 20 (2.5%) | 18 (2.4%) |
| 20 to 24 Years | 58 (7.4%) | 38 (5.1%) |
| 25 to 29 Years | 43 (5.5%) | 40 (5.4%) |
| 30 to 34 Years | 89 (11.4%) | 57 (7.7%) |
| 35 to 39 Years | 40 (5.1%) | 28 (3.8%) |
| 40 to 44 Years | 72 (9.2%) | 93 (12.5%) |
| 45 to 49 Years | 39 (5.0%) | 34 (4.6%) |
| 50 to 54 Years | 34 (4.3%) | 82 (11.0%) |
| 55 to 59 Years | 84 (10.7%) | 60 (8.1%) |
| 60 to 64 Years | 63 (8.1%) | 56 (7.5%) |
| 65 to 69 Years | 52 (6.6%) | 39 (5.2%) |
| 70 to 74 Years | 8 (1.0%) | 17 (2.3%) |
| 75 to 79 Years | 3 (0.4%) | 9 (1.2%) |
| 80 to 84 Years | 15 (1.9%) | 13 (1.8%) |
| 85 Years and over | 10 (1.3%) | 0 (0.0%) |
| Total | 783 (100.0%) | 743 (100.0%) |
Families and Households in Bellefonte
Median Family Size in Bellefonte
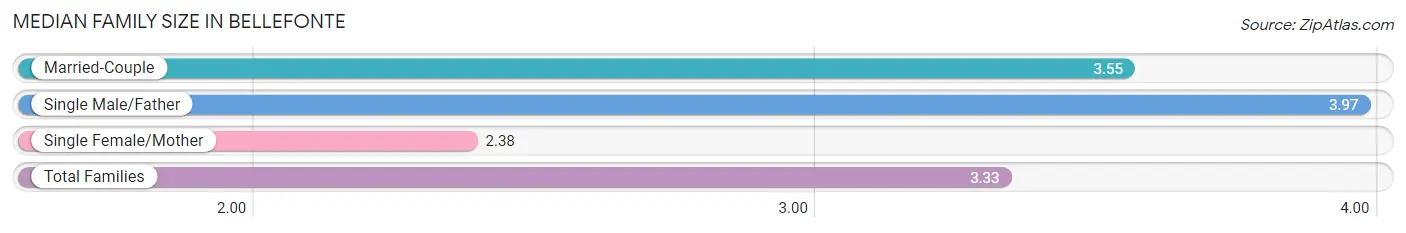
The median family size in Bellefonte is 3.33 persons per family, with single male/father families (58 | 17.4%) accounting for the largest median family size of 3.97 persons per family. On the other hand, single female/mother families (82 | 24.5%) represent the smallest median family size with 2.38 persons per family.
| Family Type | # Families | Family Size |
| Married-Couple | 194 (58.1%) | 3.55 |
| Single Male/Father | 58 (17.4%) | 3.97 |
| Single Female/Mother | 82 (24.5%) | 2.38 |
| Total Families | 334 (100.0%) | 3.33 |
Median Household Size in Bellefonte
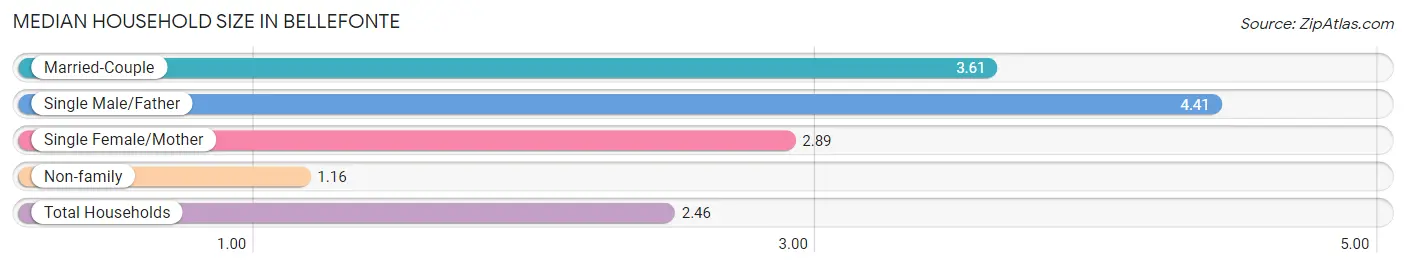
The median household size in Bellefonte is 2.46 persons per household, with single male/father households (58 | 9.3%) accounting for the largest median household size of 4.41 persons per household. non-family households (286 | 46.1%) represent the smallest median household size with 1.16 persons per household.
| Household Type | # Households | Household Size |
| Married-Couple | 194 (31.3%) | 3.61 |
| Single Male/Father | 58 (9.3%) | 4.41 |
| Single Female/Mother | 82 (13.2%) | 2.89 |
| Non-family | 286 (46.1%) | 1.16 |
| Total Households | 620 (100.0%) | 2.46 |
Household Size by Marriage Status in Bellefonte
Out of a total of 620 households in Bellefonte, 334 (53.9%) are family households, while 286 (46.1%) are nonfamily households. The most numerous type of family households are 2-person households, comprising 124, and the most common type of nonfamily households are 1-person households, comprising 246.
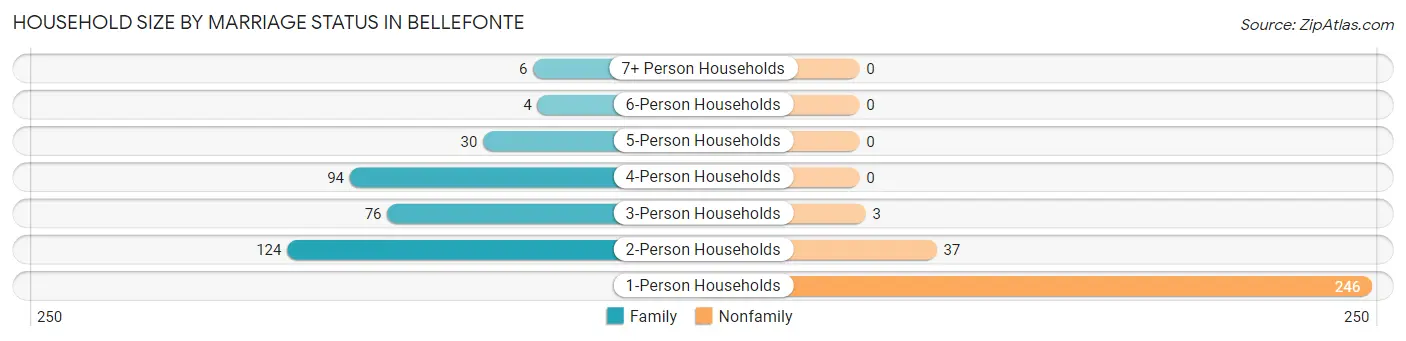
| Household Size | Family Households | Nonfamily Households |
| 1-Person Households | - | 246 (39.7%) |
| 2-Person Households | 124 (20.0%) | 37 (6.0%) |
| 3-Person Households | 76 (12.3%) | 3 (0.5%) |
| 4-Person Households | 94 (15.2%) | 0 (0.0%) |
| 5-Person Households | 30 (4.8%) | 0 (0.0%) |
| 6-Person Households | 4 (0.6%) | 0 (0.0%) |
| 7+ Person Households | 6 (1.0%) | 0 (0.0%) |
| Total | 334 (53.9%) | 286 (46.1%) |
Female Fertility in Bellefonte
Fertility by Age in Bellefonte
Average fertility rate in Bellefonte is 103.0 births per 1,000 women. Women in the age bracket of 20 to 34 years have the highest fertility rate with 230.0 births per 1,000 women. Women in the age bracket of 20 to 34 years acount for 93.9% of all women with births.
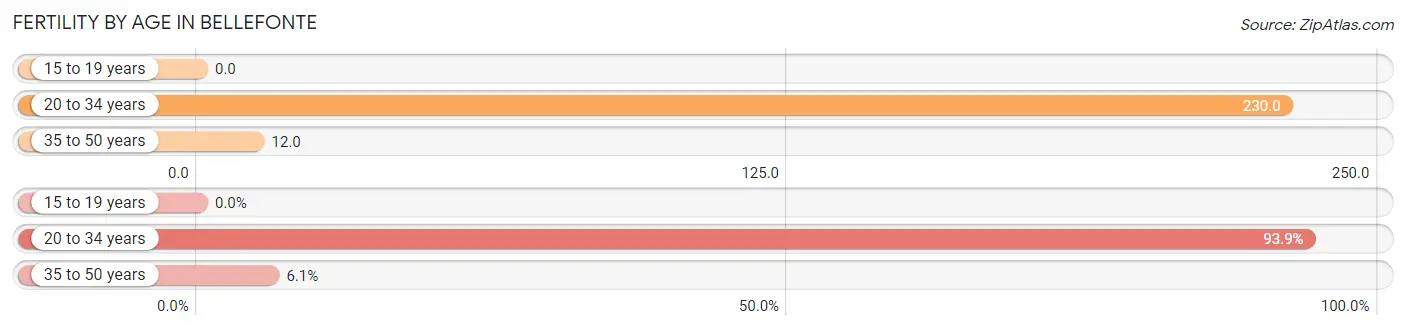
| Age Bracket | Women with Births | Births / 1,000 Women |
| 15 to 19 years | 0 (0.0%) | 0.0 |
| 20 to 34 years | 31 (93.9%) | 230.0 |
| 35 to 50 years | 2 (6.1%) | 12.0 |
| Total | 33 (100.0%) | 103.0 |
Fertility by Age by Marriage Status in Bellefonte
36.4% of women with births (33) in Bellefonte are married. The highest percentage of unmarried women with births falls into 20 to 34 years age bracket with 67.7% of them unmarried at the time of birth, while the lowest percentage of unmarried women with births belong to 35 to 50 years age bracket with 0.0% of them unmarried.
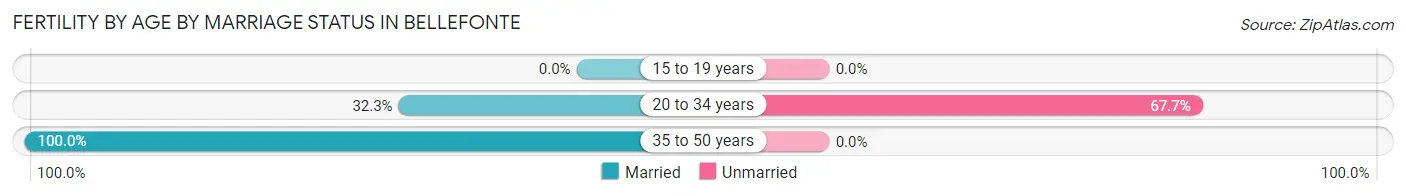
| Age Bracket | Married | Unmarried |
| 15 to 19 years | 0 (0.0%) | 0 (0.0%) |
| 20 to 34 years | 10 (32.3%) | 21 (67.7%) |
| 35 to 50 years | 2 (100.0%) | 0 (0.0%) |
| Total | 12 (36.4%) | 21 (63.6%) |
Fertility by Education in Bellefonte
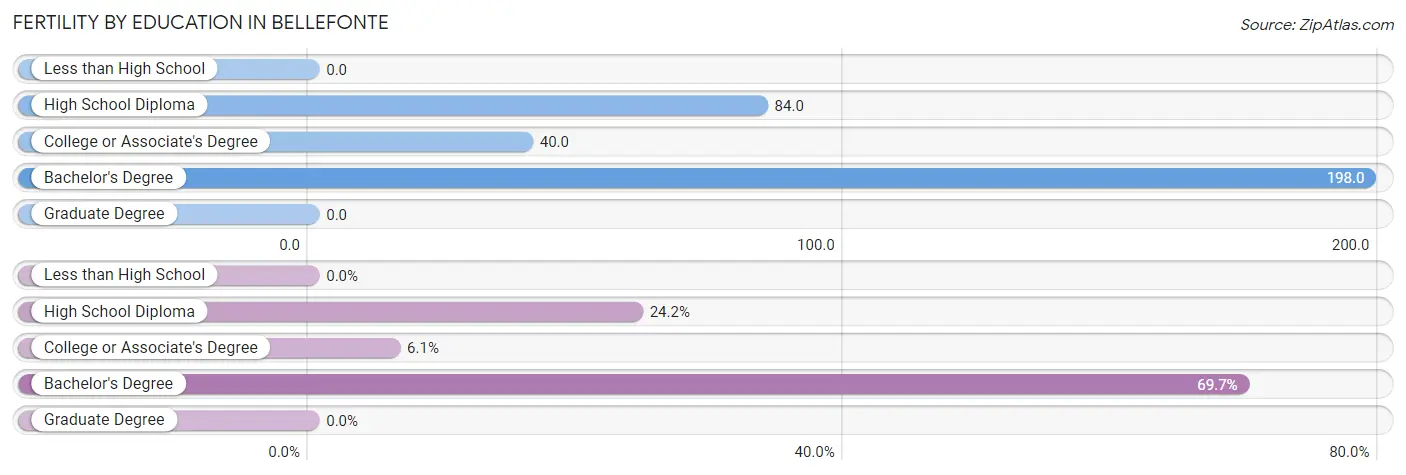
| Educational Attainment | Women with Births | Births / 1,000 Women |
| Less than High School | 0 (0.0%) | 0.0 |
| High School Diploma | 8 (24.2%) | 84.0 |
| College or Associate's Degree | 2 (6.1%) | 40.0 |
| Bachelor's Degree | 23 (69.7%) | 198.0 |
| Graduate Degree | 0 (0.0%) | 0.0 |
| Total | 33 (100.0%) | 103.0 |
Fertility by Education by Marriage Status in Bellefonte
63.6% of women with births in Bellefonte are unmarried. Women with the educational attainment of college or associate's degree are most likely to be married with 100.0% of them married at childbirth, while women with the educational attainment of high school diploma are least likely to be married with 100.0% of them unmarried at childbirth.
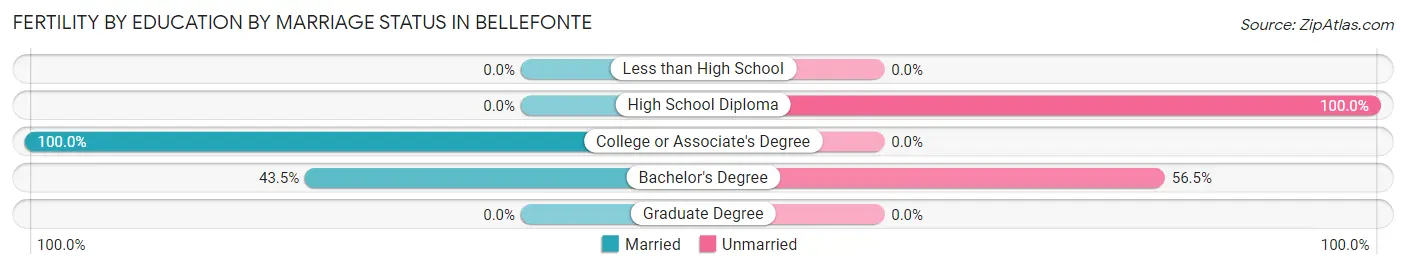
| Educational Attainment | Married | Unmarried |
| Less than High School | 0 (0.0%) | 0 (0.0%) |
| High School Diploma | 0 (0.0%) | 8 (100.0%) |
| College or Associate's Degree | 2 (100.0%) | 0 (0.0%) |
| Bachelor's Degree | 10 (43.5%) | 13 (56.5%) |
| Graduate Degree | 0 (0.0%) | 0 (0.0%) |
| Total | 12 (36.4%) | 21 (63.6%) |
Employment Characteristics in Bellefonte
Employment by Class of Employer in Bellefonte
Among the 808 employed individuals in Bellefonte, private company employees (538 | 66.6%), federal government employees (70 | 8.7%), and not-for-profit organizations (65 | 8.0%) make up the most common classes of employment.
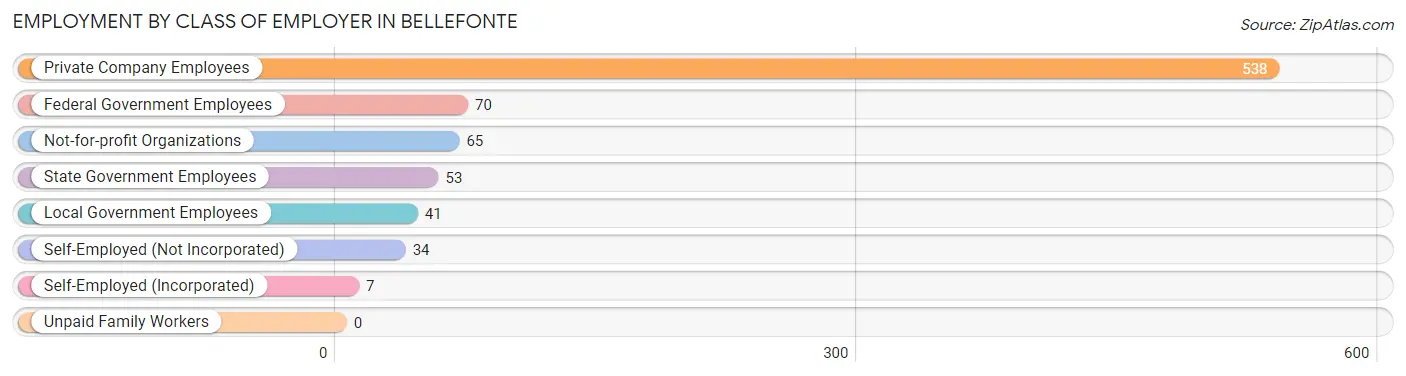
| Employer Class | # Employees | % Employees |
| Private Company Employees | 538 | 66.6% |
| Self-Employed (Incorporated) | 7 | 0.9% |
| Self-Employed (Not Incorporated) | 34 | 4.2% |
| Not-for-profit Organizations | 65 | 8.0% |
| Local Government Employees | 41 | 5.1% |
| State Government Employees | 53 | 6.6% |
| Federal Government Employees | 70 | 8.7% |
| Unpaid Family Workers | 0 | 0.0% |
| Total | 808 | 100.0% |
Employment Status by Age in Bellefonte
According to the labor force statistics for Bellefonte, out of the total population over 16 years of age (1,206), 71.6% or 863 individuals are in the labor force, with 4.5% or 39 of them unemployed. The age group with the highest labor force participation rate is 30 to 34 years, with 95.9% or 140 individuals in the labor force. Within the labor force, the 45 to 54 years age range has the highest percentage of unemployed individuals, with 17.0% or 29 of them being unemployed.
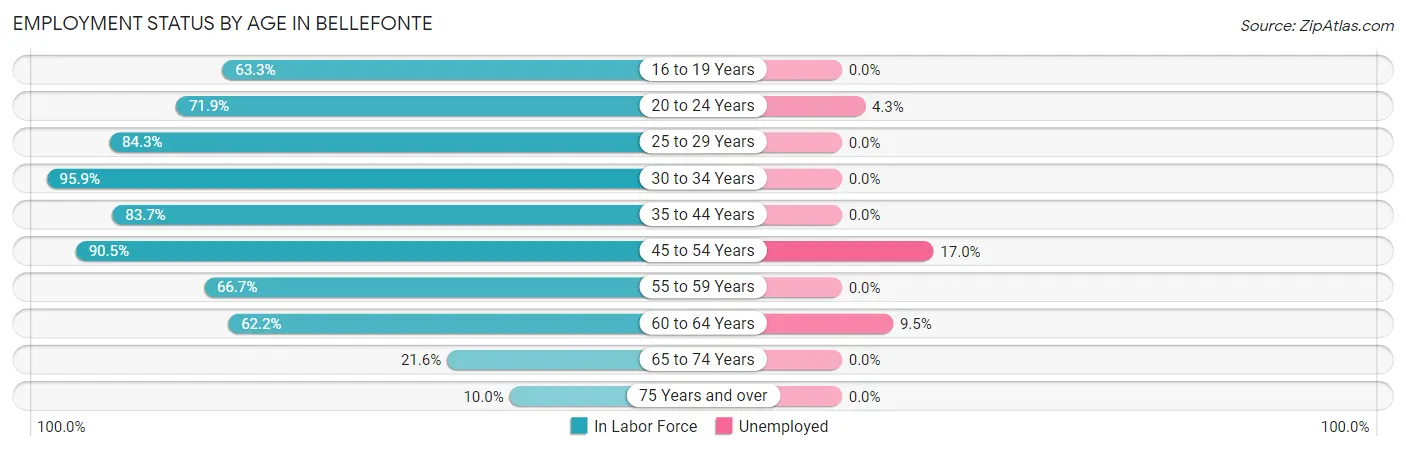
| Age Bracket | In Labor Force | Unemployed |
| 16 to 19 Years | 19 (63.3%) | 0 (0.0%) |
| 20 to 24 Years | 69 (71.9%) | 3 (4.3%) |
| 25 to 29 Years | 70 (84.3%) | 0 (0.0%) |
| 30 to 34 Years | 140 (95.9%) | 0 (0.0%) |
| 35 to 44 Years | 195 (83.7%) | 0 (0.0%) |
| 45 to 54 Years | 171 (90.5%) | 29 (17.0%) |
| 55 to 59 Years | 96 (66.7%) | 0 (0.0%) |
| 60 to 64 Years | 74 (62.2%) | 7 (9.5%) |
| 65 to 74 Years | 25 (21.6%) | 0 (0.0%) |
| 75 Years and over | 5 (10.0%) | 0 (0.0%) |
| Total | 863 (71.6%) | 39 (4.5%) |
Employment Status by Educational Attainment in Bellefonte
According to labor force statistics for Bellefonte, 81.6% of individuals (746) out of the total population between 25 and 64 years of age (914) are in the labor force, with 4.8% or 36 of them being unemployed. The group with the highest labor force participation rate are those with the educational attainment of bachelor's degree or higher, with 91.2% or 280 individuals in the labor force. Within the labor force, individuals with less than high school education have the highest percentage of unemployment, with 42.9% or 3 of them being unemployed.
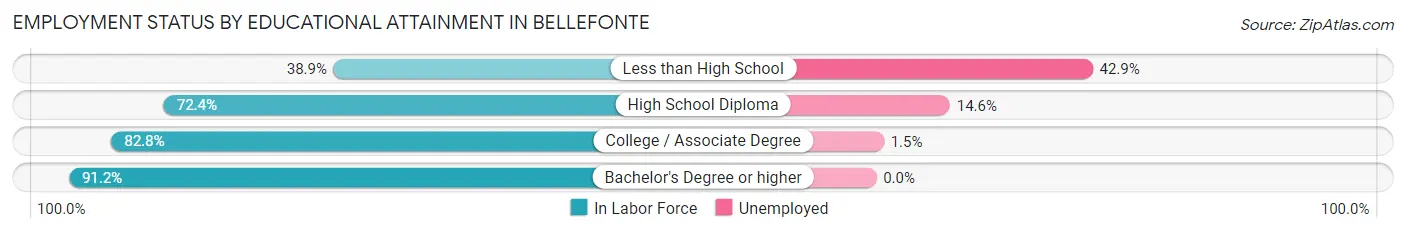
| Educational Attainment | In Labor Force | Unemployed |
| Less than High School | 7 (38.9%) | 8 (42.9%) |
| High School Diploma | 199 (72.4%) | 40 (14.6%) |
| College / Associate Degree | 260 (82.8%) | 5 (1.5%) |
| Bachelor's Degree or higher | 280 (91.2%) | 0 (0.0%) |
| Total | 746 (81.6%) | 44 (4.8%) |
Employment Occupations by Sex in Bellefonte
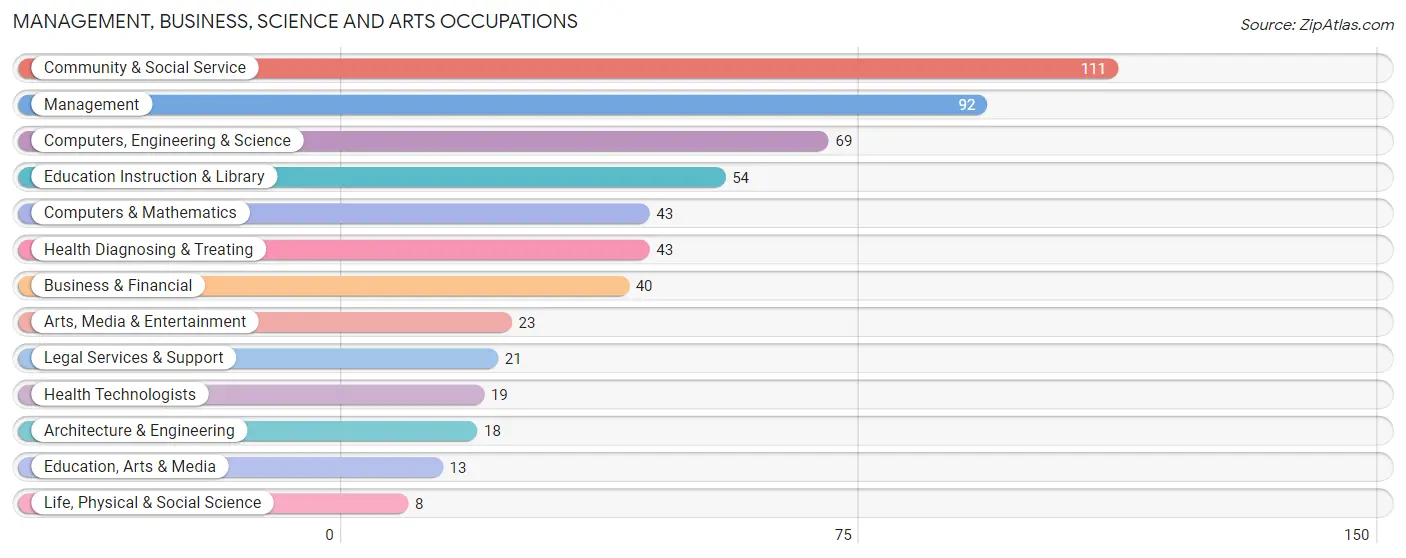
Management, Business, Science and Arts Occupations
The most common Management, Business, Science and Arts occupations in Bellefonte are Community & Social Service (111 | 13.5%), Management (92 | 11.2%), Computers, Engineering & Science (69 | 8.4%), Education Instruction & Library (54 | 6.6%), and Computers & Mathematics (43 | 5.2%).
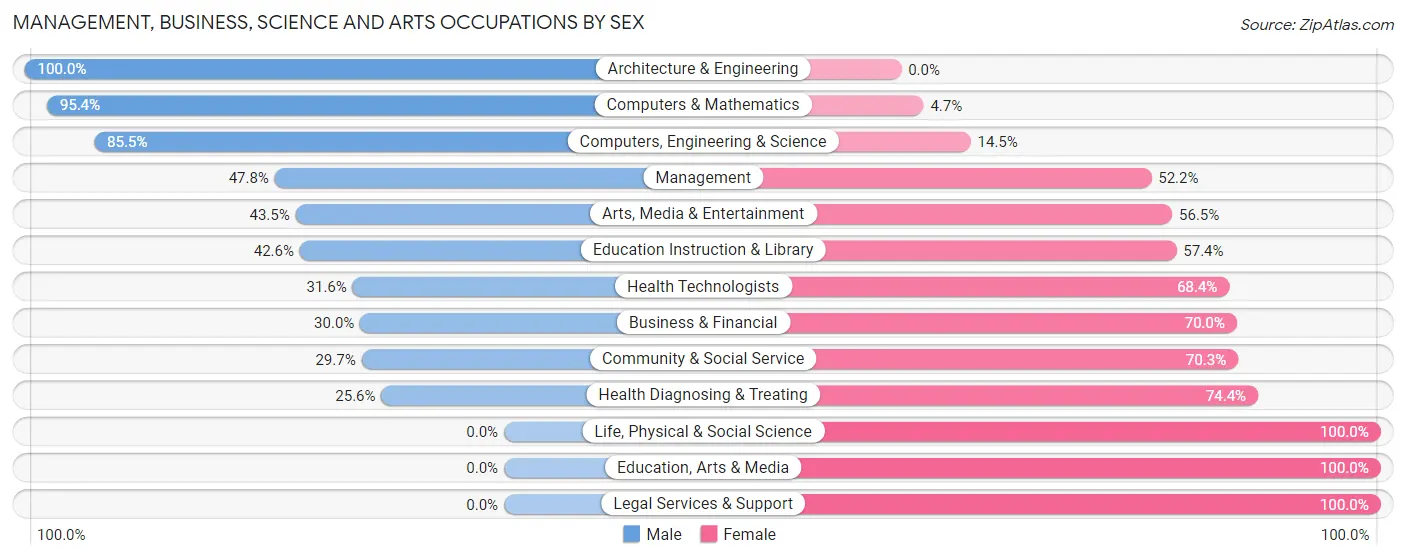
Management, Business, Science and Arts Occupations by Sex
Within the Management, Business, Science and Arts occupations in Bellefonte, the most male-oriented occupations are Architecture & Engineering (100.0%), Computers & Mathematics (95.4%), and Computers, Engineering & Science (85.5%), while the most female-oriented occupations are Life, Physical & Social Science (100.0%), Education, Arts & Media (100.0%), and Legal Services & Support (100.0%).
| Occupation | Male | Female |
| Management | 44 (47.8%) | 48 (52.2%) |
| Business & Financial | 12 (30.0%) | 28 (70.0%) |
| Computers, Engineering & Science | 59 (85.5%) | 10 (14.5%) |
| Computers & Mathematics | 41 (95.4%) | 2 (4.6%) |
| Architecture & Engineering | 18 (100.0%) | 0 (0.0%) |
| Life, Physical & Social Science | 0 (0.0%) | 8 (100.0%) |
| Community & Social Service | 33 (29.7%) | 78 (70.3%) |
| Education, Arts & Media | 0 (0.0%) | 13 (100.0%) |
| Legal Services & Support | 0 (0.0%) | 21 (100.0%) |
| Education Instruction & Library | 23 (42.6%) | 31 (57.4%) |
| Arts, Media & Entertainment | 10 (43.5%) | 13 (56.5%) |
| Health Diagnosing & Treating | 11 (25.6%) | 32 (74.4%) |
| Health Technologists | 6 (31.6%) | 13 (68.4%) |
| Total (Category) | 159 (44.8%) | 196 (55.2%) |
| Total (Overall) | 421 (51.0%) | 404 (49.0%) |
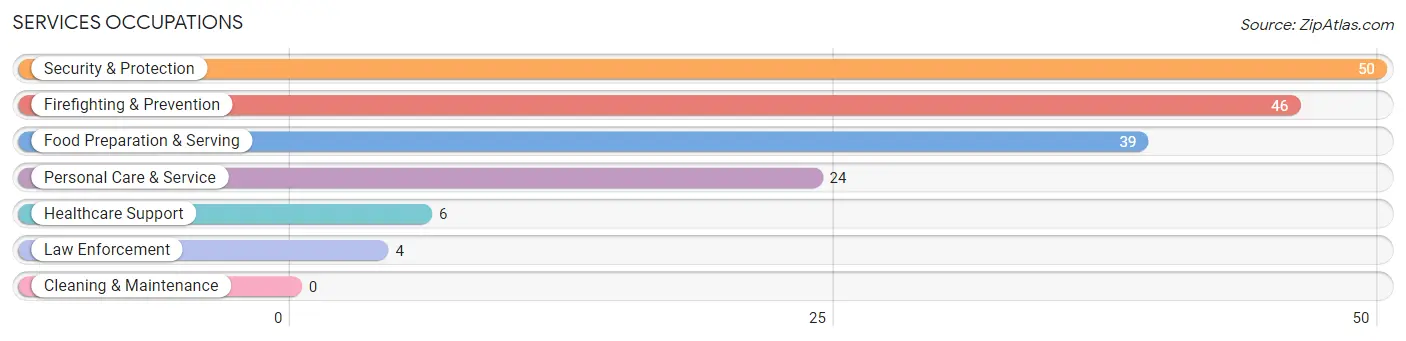
Services Occupations
The most common Services occupations in Bellefonte are Security & Protection (50 | 6.1%), Firefighting & Prevention (46 | 5.6%), Food Preparation & Serving (39 | 4.7%), Personal Care & Service (24 | 2.9%), and Healthcare Support (6 | 0.7%).
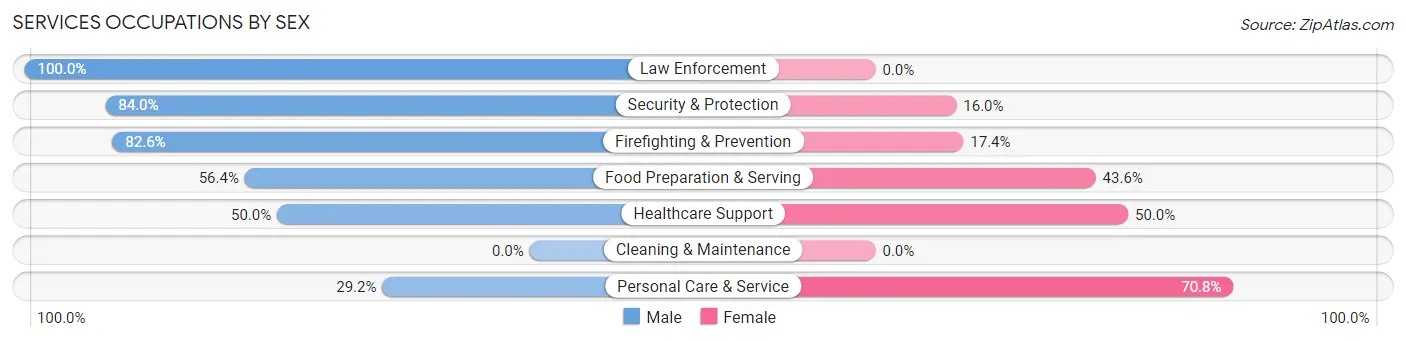
Services Occupations by Sex
Within the Services occupations in Bellefonte, the most male-oriented occupations are Law Enforcement (100.0%), Security & Protection (84.0%), and Firefighting & Prevention (82.6%), while the most female-oriented occupations are Personal Care & Service (70.8%), Healthcare Support (50.0%), and Food Preparation & Serving (43.6%).
| Occupation | Male | Female |
| Healthcare Support | 3 (50.0%) | 3 (50.0%) |
| Security & Protection | 42 (84.0%) | 8 (16.0%) |
| Firefighting & Prevention | 38 (82.6%) | 8 (17.4%) |
| Law Enforcement | 4 (100.0%) | 0 (0.0%) |
| Food Preparation & Serving | 22 (56.4%) | 17 (43.6%) |
| Cleaning & Maintenance | 0 (0.0%) | 0 (0.0%) |
| Personal Care & Service | 7 (29.2%) | 17 (70.8%) |
| Total (Category) | 74 (62.2%) | 45 (37.8%) |
| Total (Overall) | 421 (51.0%) | 404 (49.0%) |
Sales and Office Occupations
The most common Sales and Office occupations in Bellefonte are Office & Administration (115 | 13.9%), and Sales & Related (73 | 8.8%).
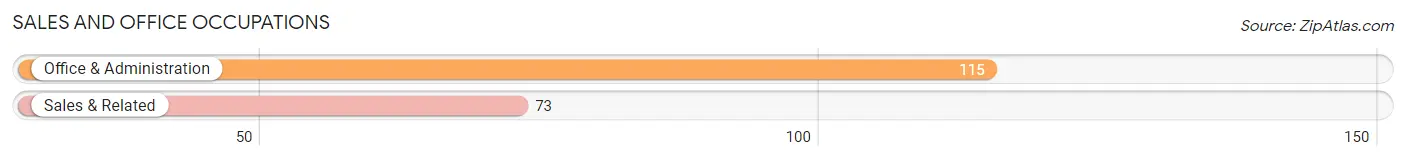
Sales and Office Occupations by Sex

| Occupation | Male | Female |
| Sales & Related | 34 (46.6%) | 39 (53.4%) |
| Office & Administration | 3 (2.6%) | 112 (97.4%) |
| Total (Category) | 37 (19.7%) | 151 (80.3%) |
| Total (Overall) | 421 (51.0%) | 404 (49.0%) |
Natural Resources, Construction and Maintenance Occupations
The most common Natural Resources, Construction and Maintenance occupations in Bellefonte are Installation, Maintenance & Repair (27 | 3.3%), and Construction & Extraction (21 | 2.5%).
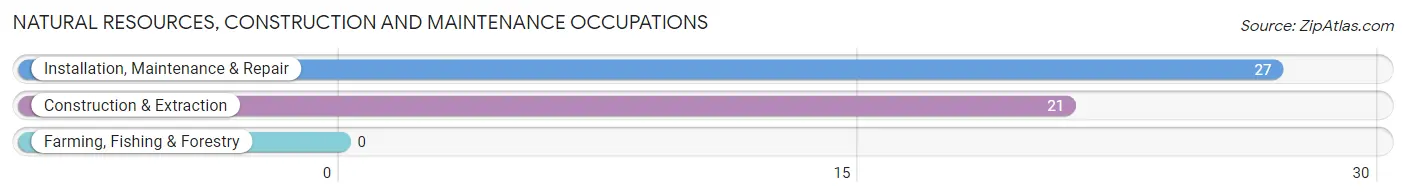
Natural Resources, Construction and Maintenance Occupations by Sex
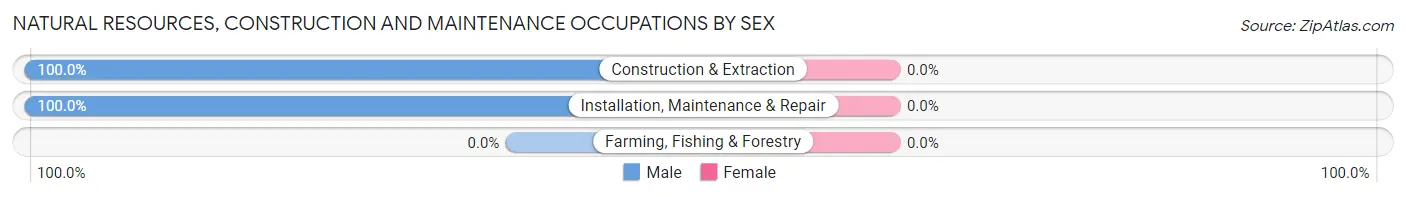
| Occupation | Male | Female |
| Farming, Fishing & Forestry | 0 (0.0%) | 0 (0.0%) |
| Construction & Extraction | 21 (100.0%) | 0 (0.0%) |
| Installation, Maintenance & Repair | 27 (100.0%) | 0 (0.0%) |
| Total (Category) | 48 (100.0%) | 0 (0.0%) |
| Total (Overall) | 421 (51.0%) | 404 (49.0%) |
Production, Transportation and Moving Occupations
The most common Production, Transportation and Moving occupations in Bellefonte are Transportation (41 | 5.0%), Material Moving (41 | 5.0%), and Production (33 | 4.0%).
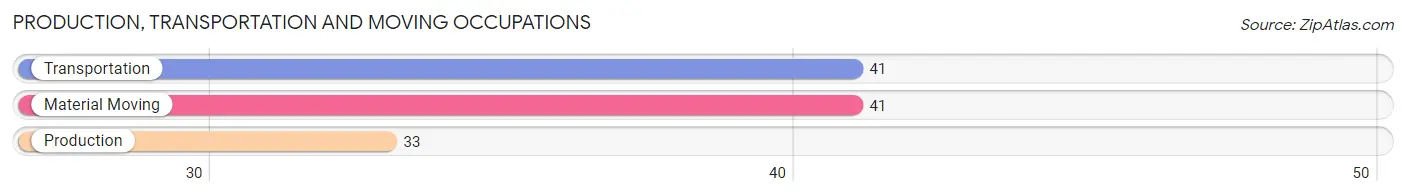
Production, Transportation and Moving Occupations by Sex
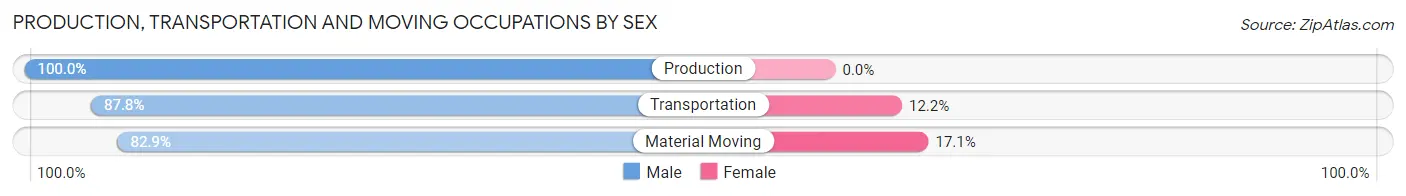
| Occupation | Male | Female |
| Production | 33 (100.0%) | 0 (0.0%) |
| Transportation | 36 (87.8%) | 5 (12.2%) |
| Material Moving | 34 (82.9%) | 7 (17.1%) |
| Total (Category) | 103 (89.6%) | 12 (10.4%) |
| Total (Overall) | 421 (51.0%) | 404 (49.0%) |
Employment Industries by Sex in Bellefonte
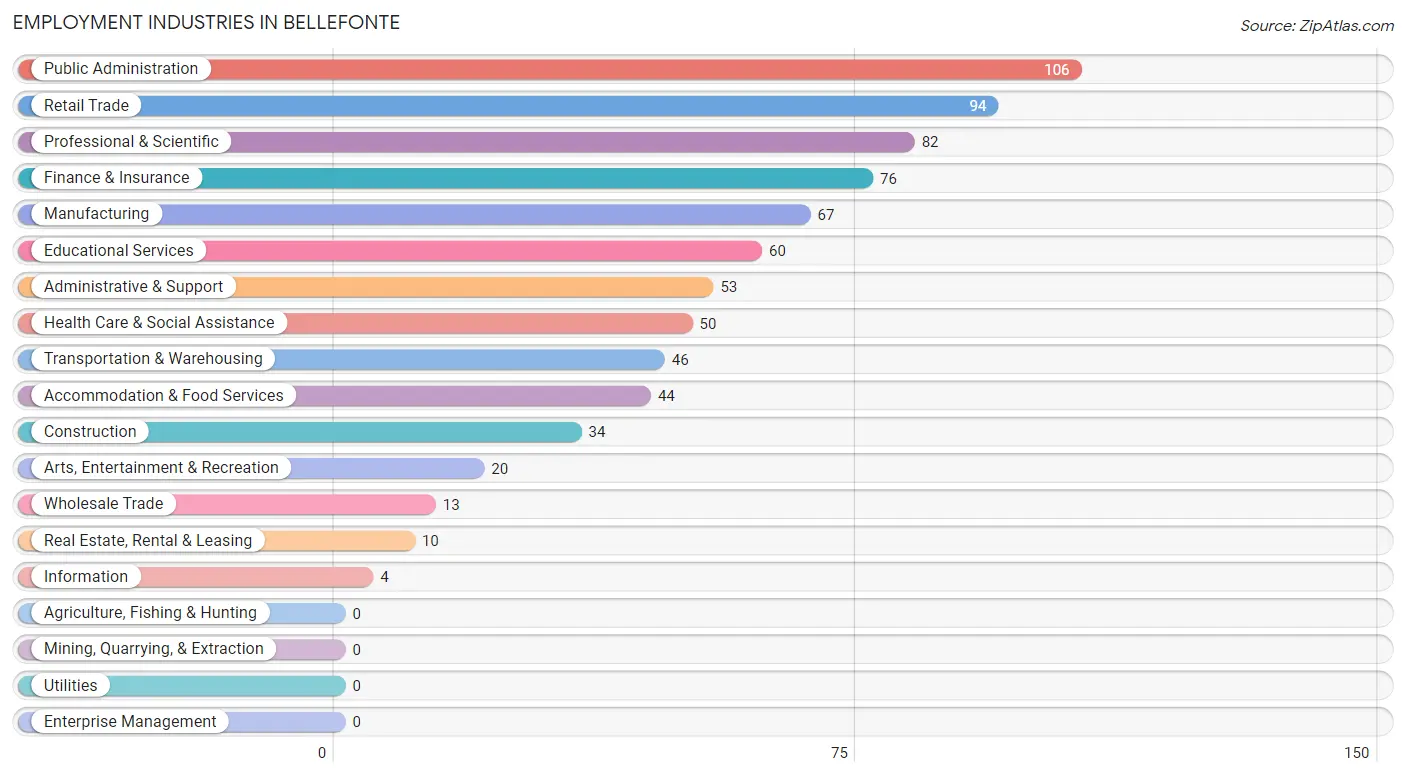
Employment Industries in Bellefonte
The major employment industries in Bellefonte include Public Administration (106 | 12.9%), Retail Trade (94 | 11.4%), Professional & Scientific (82 | 9.9%), Finance & Insurance (76 | 9.2%), and Manufacturing (67 | 8.1%).
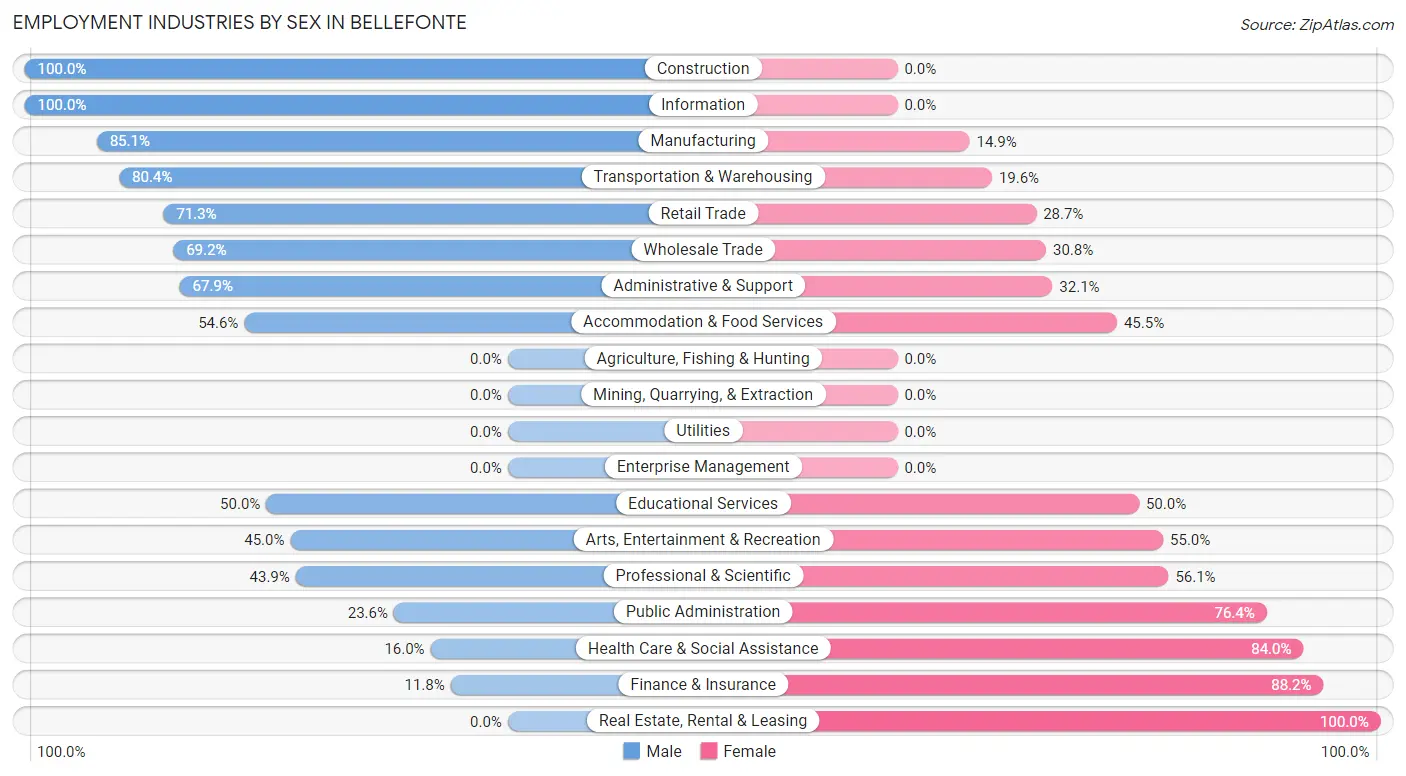
Employment Industries by Sex in Bellefonte
The Bellefonte industries that see more men than women are Construction (100.0%), Information (100.0%), and Manufacturing (85.1%), whereas the industries that tend to have a higher number of women are Real Estate, Rental & Leasing (100.0%), Finance & Insurance (88.2%), and Health Care & Social Assistance (84.0%).
| Industry | Male | Female |
| Agriculture, Fishing & Hunting | 0 (0.0%) | 0 (0.0%) |
| Mining, Quarrying, & Extraction | 0 (0.0%) | 0 (0.0%) |
| Construction | 34 (100.0%) | 0 (0.0%) |
| Manufacturing | 57 (85.1%) | 10 (14.9%) |
| Wholesale Trade | 9 (69.2%) | 4 (30.8%) |
| Retail Trade | 67 (71.3%) | 27 (28.7%) |
| Transportation & Warehousing | 37 (80.4%) | 9 (19.6%) |
| Utilities | 0 (0.0%) | 0 (0.0%) |
| Information | 4 (100.0%) | 0 (0.0%) |
| Finance & Insurance | 9 (11.8%) | 67 (88.2%) |
| Real Estate, Rental & Leasing | 0 (0.0%) | 10 (100.0%) |
| Professional & Scientific | 36 (43.9%) | 46 (56.1%) |
| Enterprise Management | 0 (0.0%) | 0 (0.0%) |
| Administrative & Support | 36 (67.9%) | 17 (32.1%) |
| Educational Services | 30 (50.0%) | 30 (50.0%) |
| Health Care & Social Assistance | 8 (16.0%) | 42 (84.0%) |
| Arts, Entertainment & Recreation | 9 (45.0%) | 11 (55.0%) |
| Accommodation & Food Services | 24 (54.5%) | 20 (45.5%) |
| Public Administration | 25 (23.6%) | 81 (76.4%) |
| Total | 421 (51.0%) | 404 (49.0%) |
Education in Bellefonte
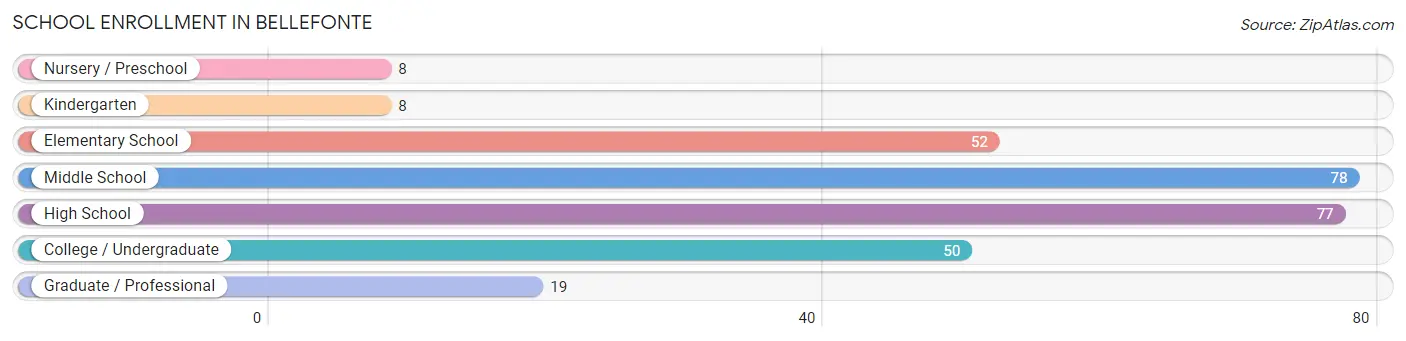
School Enrollment in Bellefonte
The most common levels of schooling among the 292 students in Bellefonte are middle school (78 | 26.7%), high school (77 | 26.4%), and elementary school (52 | 17.8%).
| School Level | # Students | % Students |
| Nursery / Preschool | 8 | 2.7% |
| Kindergarten | 8 | 2.7% |
| Elementary School | 52 | 17.8% |
| Middle School | 78 | 26.7% |
| High School | 77 | 26.4% |
| College / Undergraduate | 50 | 17.1% |
| Graduate / Professional | 19 | 6.5% |
| Total | 292 | 100.0% |
School Enrollment by Age by Funding Source in Bellefonte
Out of a total of 292 students who are enrolled in schools in Bellefonte, 45 (15.4%) attend a private institution, while the remaining 247 (84.6%) are enrolled in public schools. The age group of 3 to 4 year olds has the highest likelihood of being enrolled in private schools, with 7 (87.5% in the age bracket) enrolled. Conversely, the age group of 18 to 19 year olds has the lowest likelihood of being enrolled in a private school, with 5 (100.0% in the age bracket) attending a public institution.
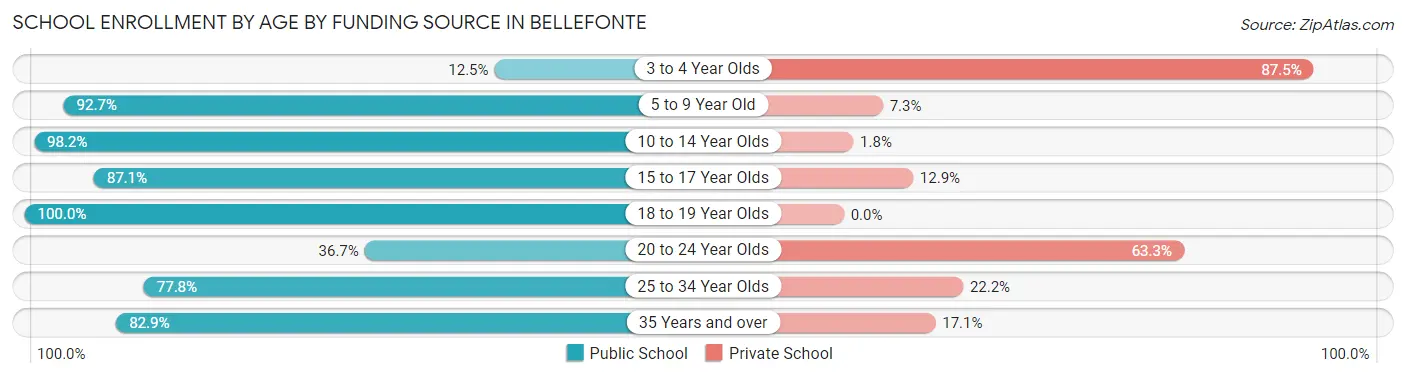
| Age Bracket | Public School | Private School |
| 3 to 4 Year Olds | 1 (12.5%) | 7 (87.5%) |
| 5 to 9 Year Old | 51 (92.7%) | 4 (7.3%) |
| 10 to 14 Year Olds | 111 (98.2%) | 2 (1.8%) |
| 15 to 17 Year Olds | 27 (87.1%) | 4 (12.9%) |
| 18 to 19 Year Olds | 5 (100.0%) | 0 (0.0%) |
| 20 to 24 Year Olds | 11 (36.7%) | 19 (63.3%) |
| 25 to 34 Year Olds | 7 (77.8%) | 2 (22.2%) |
| 35 Years and over | 34 (82.9%) | 7 (17.1%) |
| Total | 247 (84.6%) | 45 (15.4%) |
Educational Attainment by Field of Study in Bellefonte
Business (71 | 18.6%), education (44 | 11.6%), liberal arts & history (40 | 10.5%), science & technology (37 | 9.7%), and visual & performing arts (37 | 9.7%) are the most common fields of study among 381 individuals in Bellefonte who have obtained a bachelor's degree or higher.
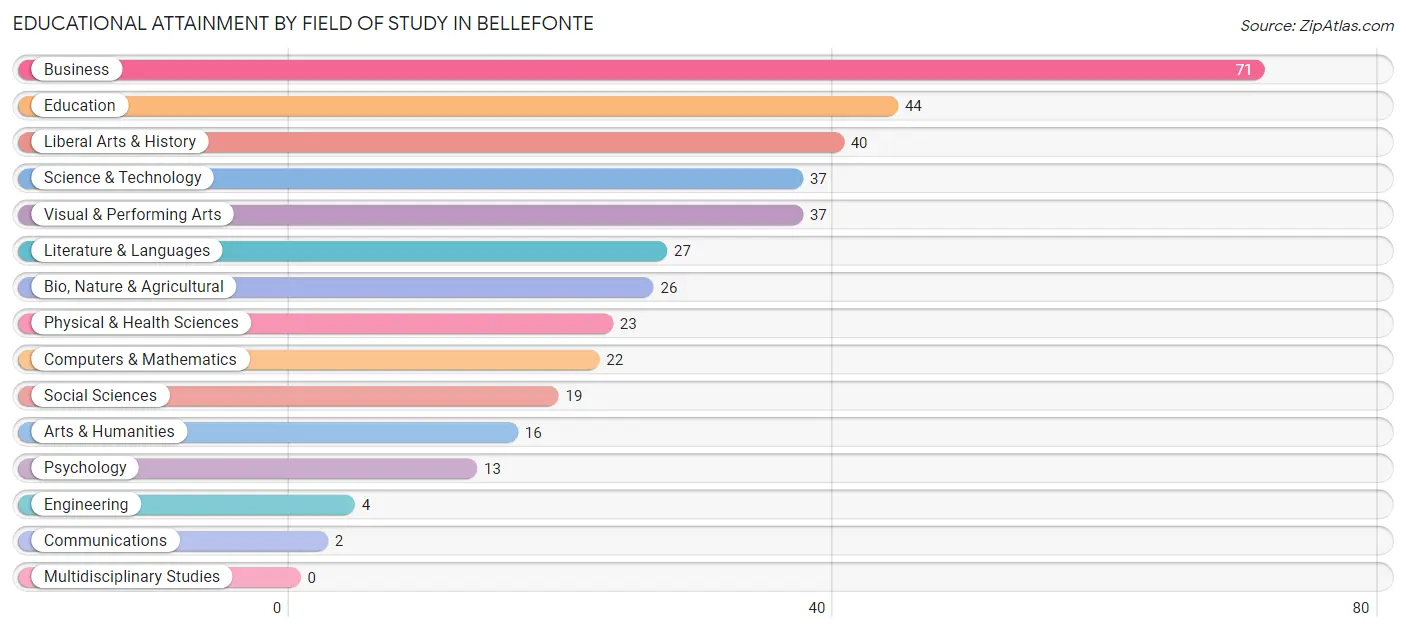
| Field of Study | # Graduates | % Graduates |
| Computers & Mathematics | 22 | 5.8% |
| Bio, Nature & Agricultural | 26 | 6.8% |
| Physical & Health Sciences | 23 | 6.0% |
| Psychology | 13 | 3.4% |
| Social Sciences | 19 | 5.0% |
| Engineering | 4 | 1.1% |
| Multidisciplinary Studies | 0 | 0.0% |
| Science & Technology | 37 | 9.7% |
| Business | 71 | 18.6% |
| Education | 44 | 11.6% |
| Literature & Languages | 27 | 7.1% |
| Liberal Arts & History | 40 | 10.5% |
| Visual & Performing Arts | 37 | 9.7% |
| Communications | 2 | 0.5% |
| Arts & Humanities | 16 | 4.2% |
| Total | 381 | 100.0% |
Transportation & Commute in Bellefonte
Vehicle Availability by Sex in Bellefonte
The most prevalent vehicle ownership categories in Bellefonte are males with 2 vehicles (206, accounting for 50.7%) and females with 2 vehicles (216, making up 51.2%).
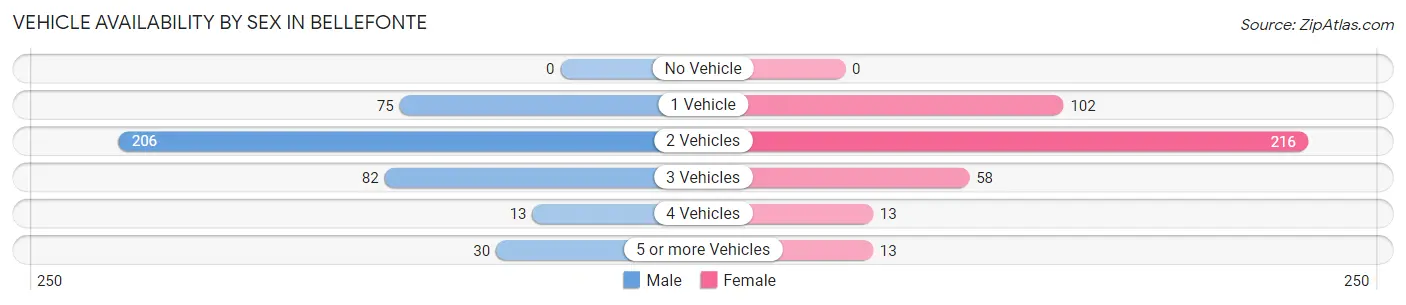
| Vehicles Available | Male | Female |
| No Vehicle | 0 (0.0%) | 0 (0.0%) |
| 1 Vehicle | 75 (18.5%) | 102 (25.4%) |
| 2 Vehicles | 206 (50.7%) | 216 (53.7%) |
| 3 Vehicles | 82 (20.2%) | 58 (14.4%) |
| 4 Vehicles | 13 (3.2%) | 13 (3.2%) |
| 5 or more Vehicles | 30 (7.4%) | 13 (3.2%) |
| Total | 406 (100.0%) | 402 (100.0%) |
Commute Time in Bellefonte
The most frequently occuring commute durations in Bellefonte are 15 to 19 minutes (124 commuters, 19.1%), 20 to 24 minutes (123 commuters, 19.0%), and 25 to 29 minutes (83 commuters, 12.8%).
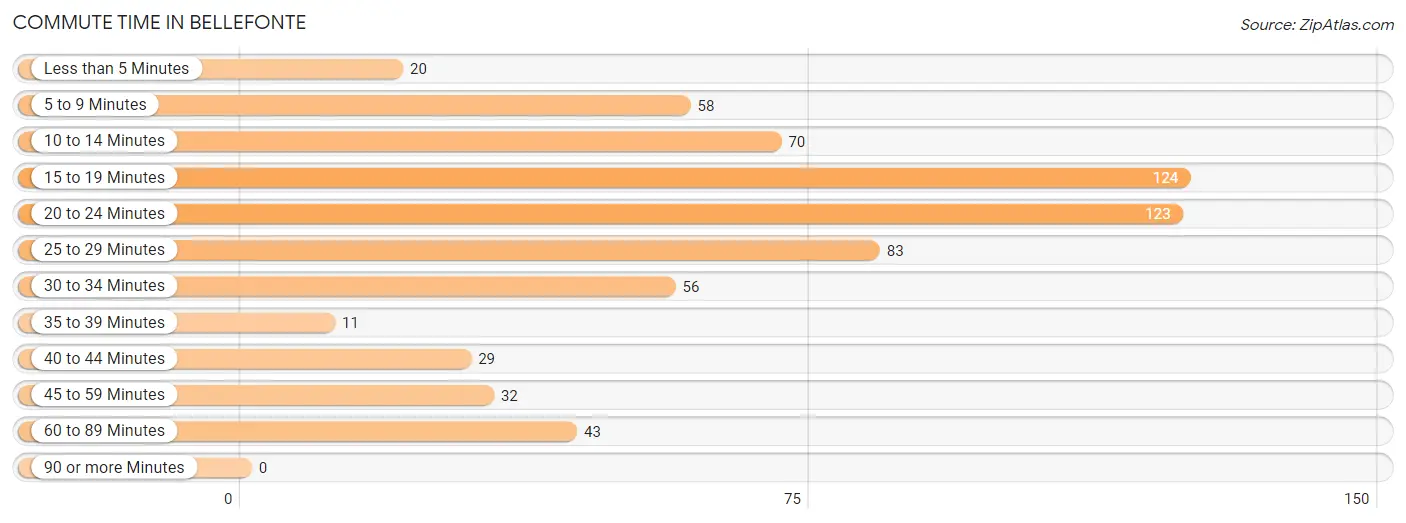
| Commute Time | # Commuters | % Commuters |
| Less than 5 Minutes | 20 | 3.1% |
| 5 to 9 Minutes | 58 | 8.9% |
| 10 to 14 Minutes | 70 | 10.8% |
| 15 to 19 Minutes | 124 | 19.1% |
| 20 to 24 Minutes | 123 | 19.0% |
| 25 to 29 Minutes | 83 | 12.8% |
| 30 to 34 Minutes | 56 | 8.6% |
| 35 to 39 Minutes | 11 | 1.7% |
| 40 to 44 Minutes | 29 | 4.5% |
| 45 to 59 Minutes | 32 | 4.9% |
| 60 to 89 Minutes | 43 | 6.6% |
| 90 or more Minutes | 0 | 0.0% |
Commute Time by Sex in Bellefonte
The most common commute times in Bellefonte are 15 to 19 minutes (71 commuters, 20.9%) for males and 20 to 24 minutes (78 commuters, 25.2%) for females.
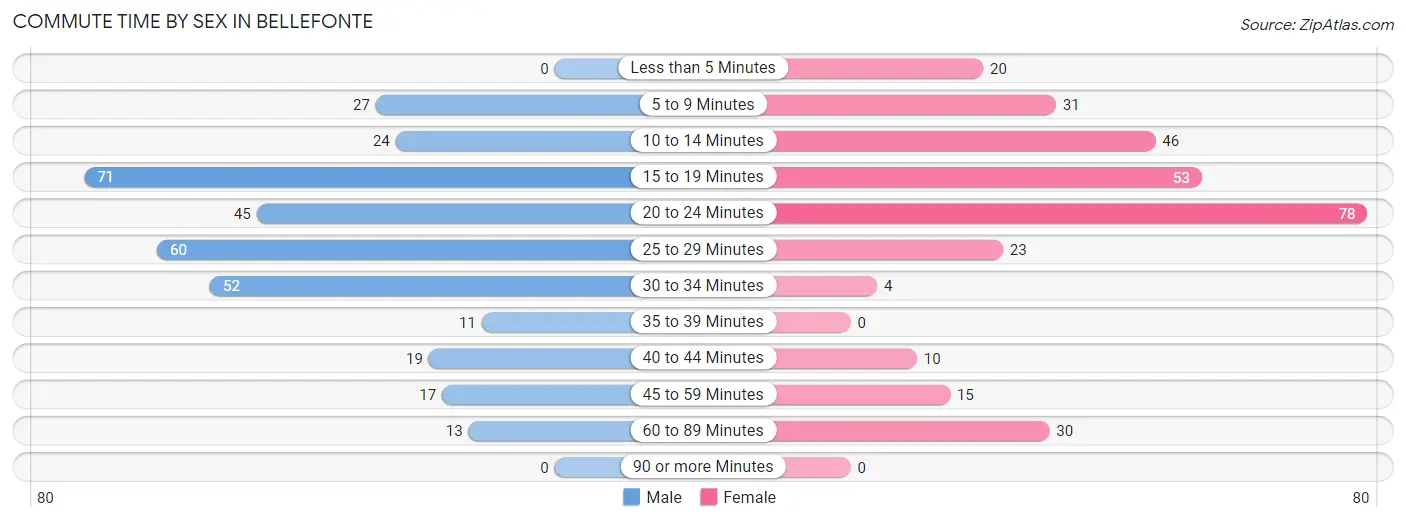
| Commute Time | Male | Female |
| Less than 5 Minutes | 0 (0.0%) | 20 (6.5%) |
| 5 to 9 Minutes | 27 (8.0%) | 31 (10.0%) |
| 10 to 14 Minutes | 24 (7.1%) | 46 (14.8%) |
| 15 to 19 Minutes | 71 (20.9%) | 53 (17.1%) |
| 20 to 24 Minutes | 45 (13.3%) | 78 (25.2%) |
| 25 to 29 Minutes | 60 (17.7%) | 23 (7.4%) |
| 30 to 34 Minutes | 52 (15.3%) | 4 (1.3%) |
| 35 to 39 Minutes | 11 (3.2%) | 0 (0.0%) |
| 40 to 44 Minutes | 19 (5.6%) | 10 (3.2%) |
| 45 to 59 Minutes | 17 (5.0%) | 15 (4.8%) |
| 60 to 89 Minutes | 13 (3.8%) | 30 (9.7%) |
| 90 or more Minutes | 0 (0.0%) | 0 (0.0%) |
Time of Departure to Work by Sex in Bellefonte
The most frequent times of departure to work in Bellefonte are 6:30 AM to 6:59 AM (66, 19.5%) for males and 7:00 AM to 7:29 AM (80, 25.8%) for females.
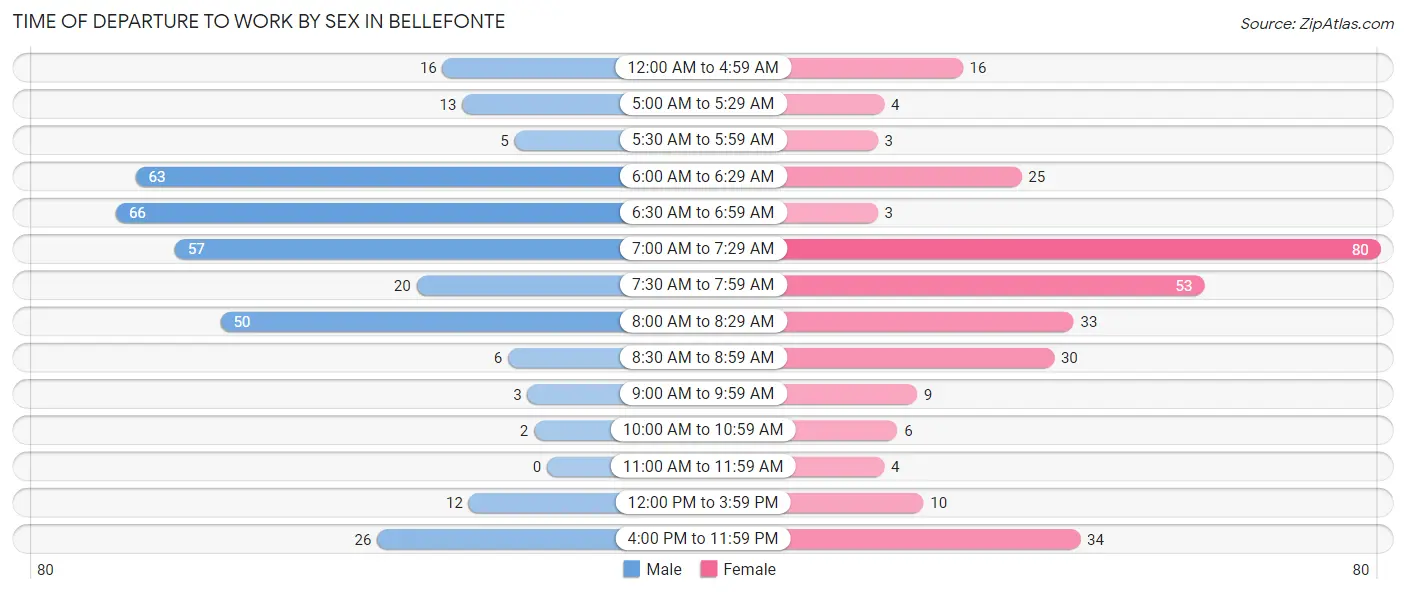
| Time of Departure | Male | Female |
| 12:00 AM to 4:59 AM | 16 (4.7%) | 16 (5.2%) |
| 5:00 AM to 5:29 AM | 13 (3.8%) | 4 (1.3%) |
| 5:30 AM to 5:59 AM | 5 (1.5%) | 3 (1.0%) |
| 6:00 AM to 6:29 AM | 63 (18.6%) | 25 (8.1%) |
| 6:30 AM to 6:59 AM | 66 (19.5%) | 3 (1.0%) |
| 7:00 AM to 7:29 AM | 57 (16.8%) | 80 (25.8%) |
| 7:30 AM to 7:59 AM | 20 (5.9%) | 53 (17.1%) |
| 8:00 AM to 8:29 AM | 50 (14.7%) | 33 (10.6%) |
| 8:30 AM to 8:59 AM | 6 (1.8%) | 30 (9.7%) |
| 9:00 AM to 9:59 AM | 3 (0.9%) | 9 (2.9%) |
| 10:00 AM to 10:59 AM | 2 (0.6%) | 6 (1.9%) |
| 11:00 AM to 11:59 AM | 0 (0.0%) | 4 (1.3%) |
| 12:00 PM to 3:59 PM | 12 (3.5%) | 10 (3.2%) |
| 4:00 PM to 11:59 PM | 26 (7.7%) | 34 (11.0%) |
| Total | 339 (100.0%) | 310 (100.0%) |
Housing Occupancy in Bellefonte
Occupancy by Ownership in Bellefonte
Of the total 620 dwellings in Bellefonte, owner-occupied units account for 414 (66.8%), while renter-occupied units make up 206 (33.2%).
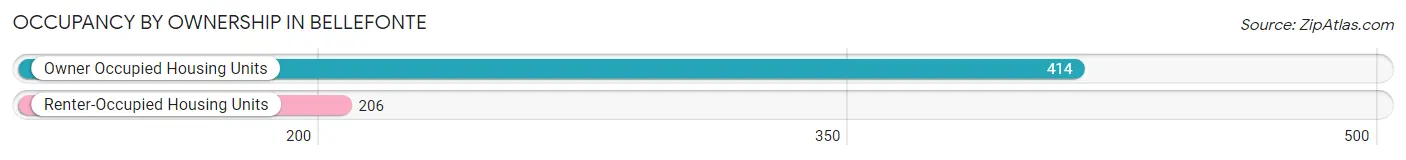
| Occupancy | # Housing Units | % Housing Units |
| Owner Occupied Housing Units | 414 | 66.8% |
| Renter-Occupied Housing Units | 206 | 33.2% |
| Total Occupied Housing Units | 620 | 100.0% |
Occupancy by Household Size in Bellefonte
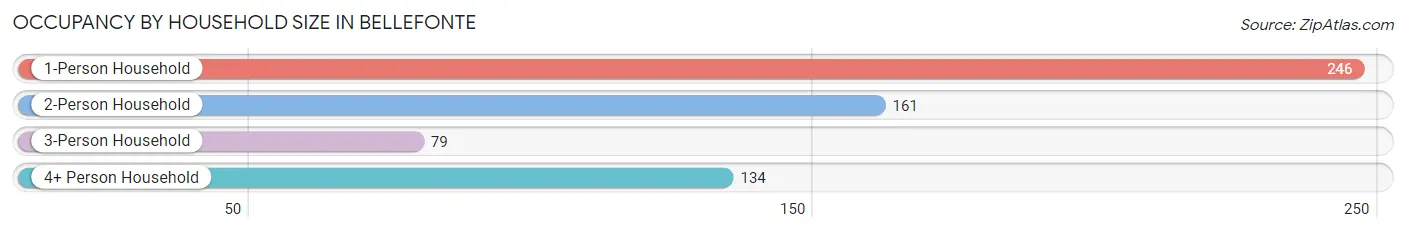
| Household Size | # Housing Units | % Housing Units |
| 1-Person Household | 246 | 39.7% |
| 2-Person Household | 161 | 26.0% |
| 3-Person Household | 79 | 12.7% |
| 4+ Person Household | 134 | 21.6% |
| Total Housing Units | 620 | 100.0% |
Occupancy by Ownership by Household Size in Bellefonte
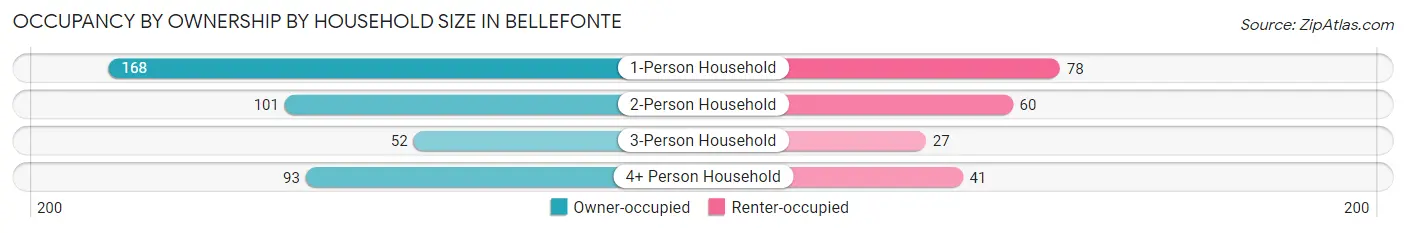
| Household Size | Owner-occupied | Renter-occupied |
| 1-Person Household | 168 (68.3%) | 78 (31.7%) |
| 2-Person Household | 101 (62.7%) | 60 (37.3%) |
| 3-Person Household | 52 (65.8%) | 27 (34.2%) |
| 4+ Person Household | 93 (69.4%) | 41 (30.6%) |
| Total Housing Units | 414 (66.8%) | 206 (33.2%) |
Occupancy by Educational Attainment in Bellefonte
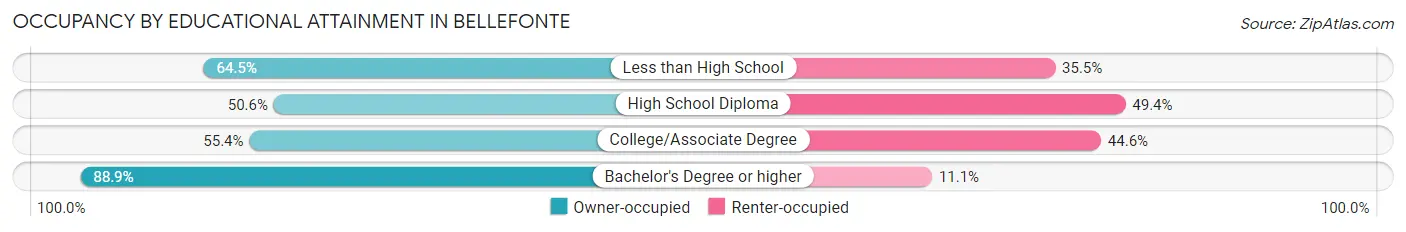
| Household Size | Owner-occupied | Renter-occupied |
| Less than High School | 20 (64.5%) | 11 (35.5%) |
| High School Diploma | 86 (50.6%) | 84 (49.4%) |
| College/Associate Degree | 107 (55.4%) | 86 (44.6%) |
| Bachelor's Degree or higher | 201 (88.9%) | 25 (11.1%) |
Occupancy by Age of Householder in Bellefonte
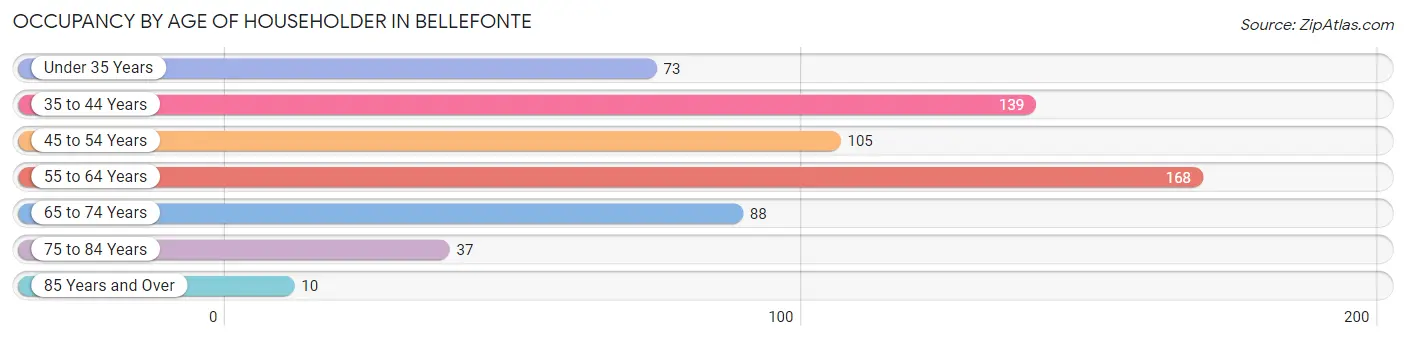
| Age Bracket | # Households | % Households |
| Under 35 Years | 73 | 11.8% |
| 35 to 44 Years | 139 | 22.4% |
| 45 to 54 Years | 105 | 16.9% |
| 55 to 64 Years | 168 | 27.1% |
| 65 to 74 Years | 88 | 14.2% |
| 75 to 84 Years | 37 | 6.0% |
| 85 Years and Over | 10 | 1.6% |
| Total | 620 | 100.0% |
Housing Finances in Bellefonte
Median Income by Occupancy in Bellefonte
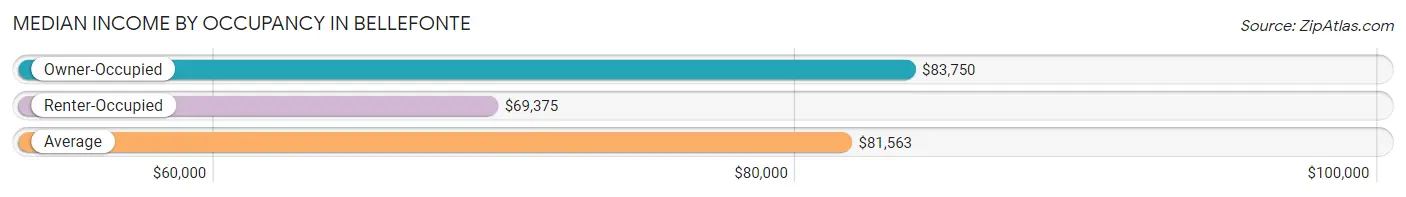
| Occupancy Type | # Households | Median Income |
| Owner-Occupied | 414 (66.8%) | $83,750 |
| Renter-Occupied | 206 (33.2%) | $69,375 |
| Average | 620 (100.0%) | $81,563 |
Occupancy by Householder Income Bracket in Bellefonte
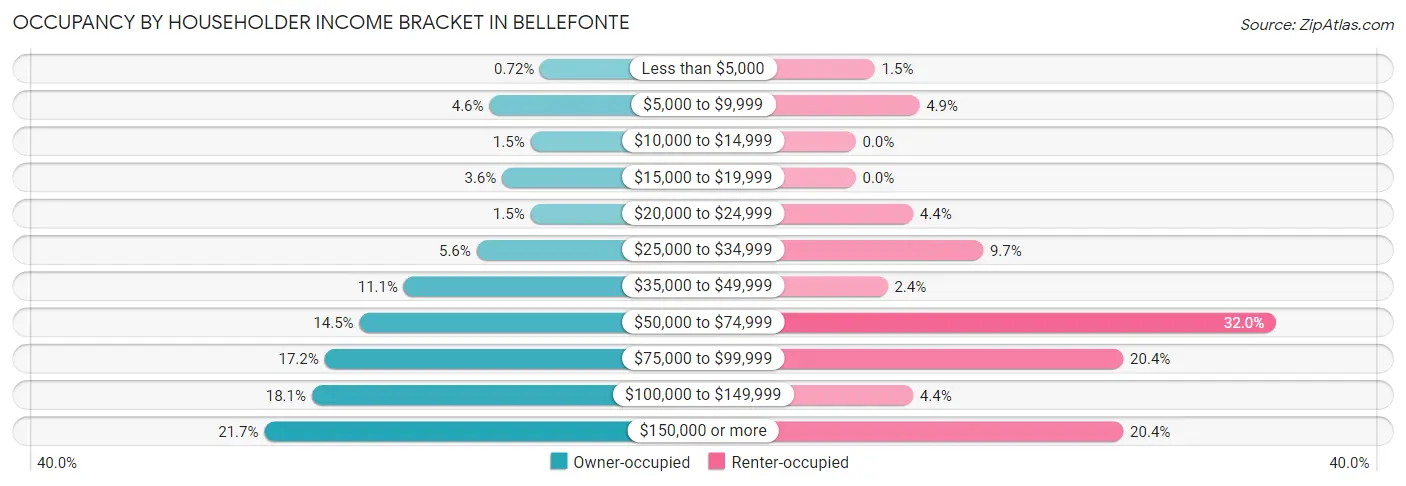
| Income Bracket | Owner-occupied | Renter-occupied |
| Less than $5,000 | 3 (0.7%) | 3 (1.5%) |
| $5,000 to $9,999 | 19 (4.6%) | 10 (4.9%) |
| $10,000 to $14,999 | 6 (1.5%) | 0 (0.0%) |
| $15,000 to $19,999 | 15 (3.6%) | 0 (0.0%) |
| $20,000 to $24,999 | 6 (1.5%) | 9 (4.4%) |
| $25,000 to $34,999 | 23 (5.6%) | 20 (9.7%) |
| $35,000 to $49,999 | 46 (11.1%) | 5 (2.4%) |
| $50,000 to $74,999 | 60 (14.5%) | 66 (32.0%) |
| $75,000 to $99,999 | 71 (17.2%) | 42 (20.4%) |
| $100,000 to $149,999 | 75 (18.1%) | 9 (4.4%) |
| $150,000 or more | 90 (21.7%) | 42 (20.4%) |
| Total | 414 (100.0%) | 206 (100.0%) |
Monthly Housing Cost Tiers in Bellefonte
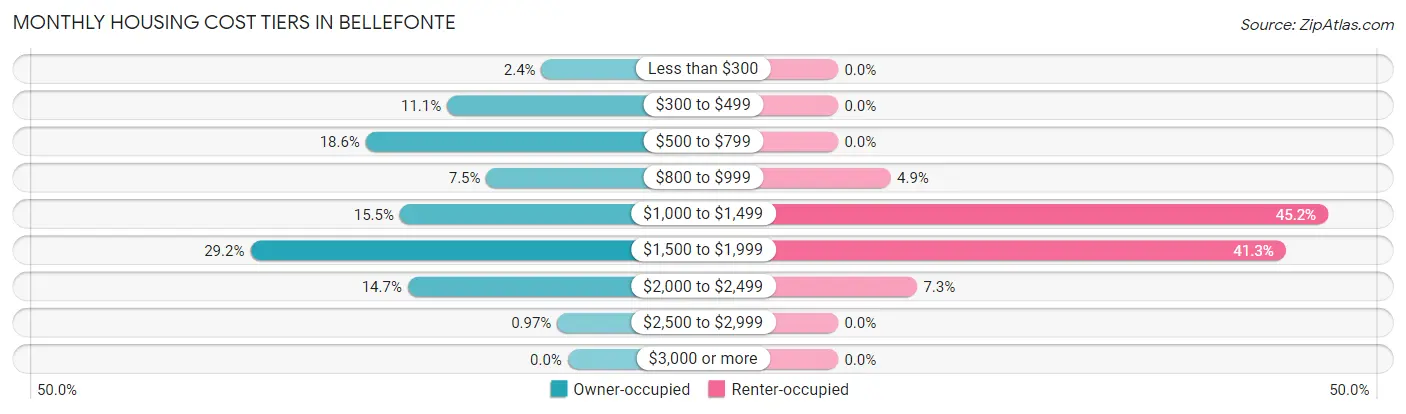
| Monthly Cost | Owner-occupied | Renter-occupied |
| Less than $300 | 10 (2.4%) | 0 (0.0%) |
| $300 to $499 | 46 (11.1%) | 0 (0.0%) |
| $500 to $799 | 77 (18.6%) | 0 (0.0%) |
| $800 to $999 | 31 (7.5%) | 10 (4.9%) |
| $1,000 to $1,499 | 64 (15.5%) | 93 (45.2%) |
| $1,500 to $1,999 | 121 (29.2%) | 85 (41.3%) |
| $2,000 to $2,499 | 61 (14.7%) | 15 (7.3%) |
| $2,500 to $2,999 | 4 (1.0%) | 0 (0.0%) |
| $3,000 or more | 0 (0.0%) | 0 (0.0%) |
| Total | 414 (100.0%) | 206 (100.0%) |
Physical Housing Characteristics in Bellefonte
Housing Structures in Bellefonte
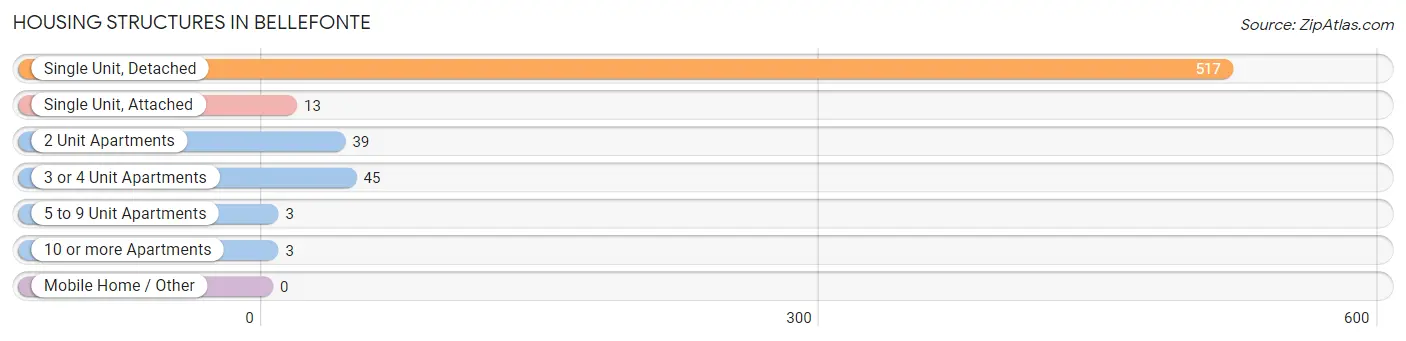
| Structure Type | # Housing Units | % Housing Units |
| Single Unit, Detached | 517 | 83.4% |
| Single Unit, Attached | 13 | 2.1% |
| 2 Unit Apartments | 39 | 6.3% |
| 3 or 4 Unit Apartments | 45 | 7.3% |
| 5 to 9 Unit Apartments | 3 | 0.5% |
| 10 or more Apartments | 3 | 0.5% |
| Mobile Home / Other | 0 | 0.0% |
| Total | 620 | 100.0% |
Housing Structures by Occupancy in Bellefonte
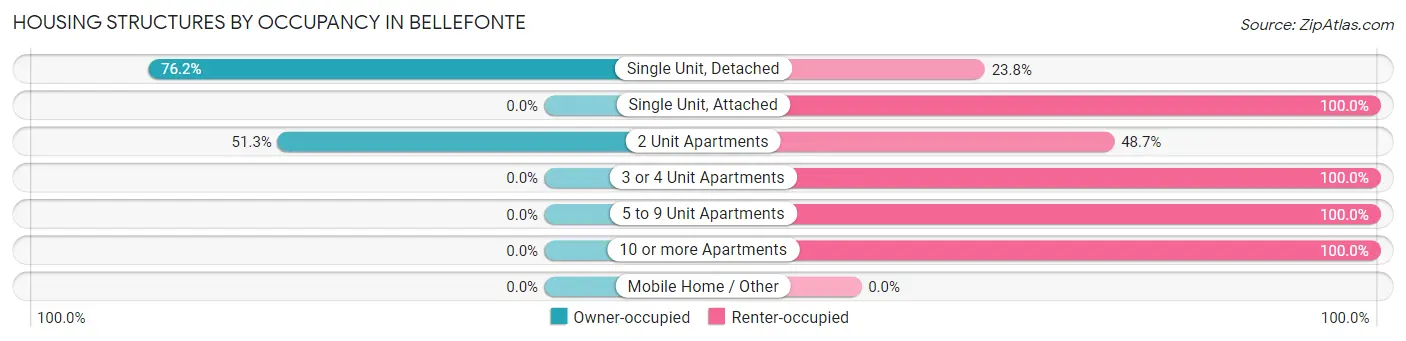
| Structure Type | Owner-occupied | Renter-occupied |
| Single Unit, Detached | 394 (76.2%) | 123 (23.8%) |
| Single Unit, Attached | 0 (0.0%) | 13 (100.0%) |
| 2 Unit Apartments | 20 (51.3%) | 19 (48.7%) |
| 3 or 4 Unit Apartments | 0 (0.0%) | 45 (100.0%) |
| 5 to 9 Unit Apartments | 0 (0.0%) | 3 (100.0%) |
| 10 or more Apartments | 0 (0.0%) | 3 (100.0%) |
| Mobile Home / Other | 0 (0.0%) | 0 (0.0%) |
| Total | 414 (66.8%) | 206 (33.2%) |
Housing Structures by Number of Rooms in Bellefonte
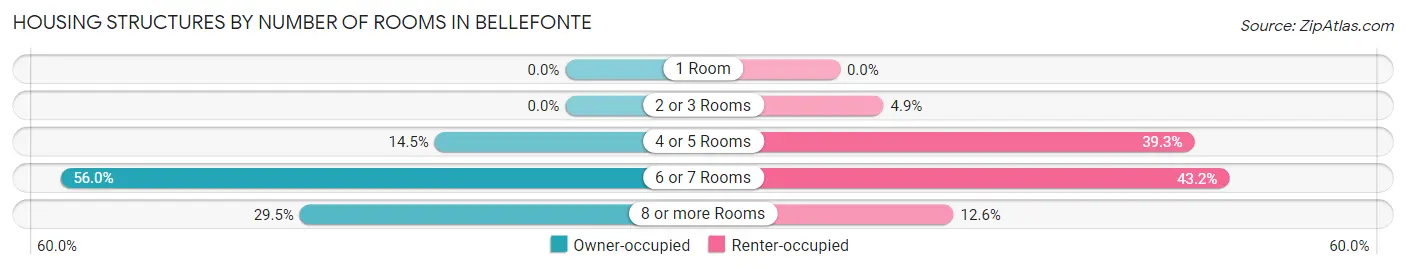
| Number of Rooms | Owner-occupied | Renter-occupied |
| 1 Room | 0 (0.0%) | 0 (0.0%) |
| 2 or 3 Rooms | 0 (0.0%) | 10 (4.9%) |
| 4 or 5 Rooms | 60 (14.5%) | 81 (39.3%) |
| 6 or 7 Rooms | 232 (56.0%) | 89 (43.2%) |
| 8 or more Rooms | 122 (29.5%) | 26 (12.6%) |
| Total | 414 (100.0%) | 206 (100.0%) |
Housing Structure by Heating Type in Bellefonte
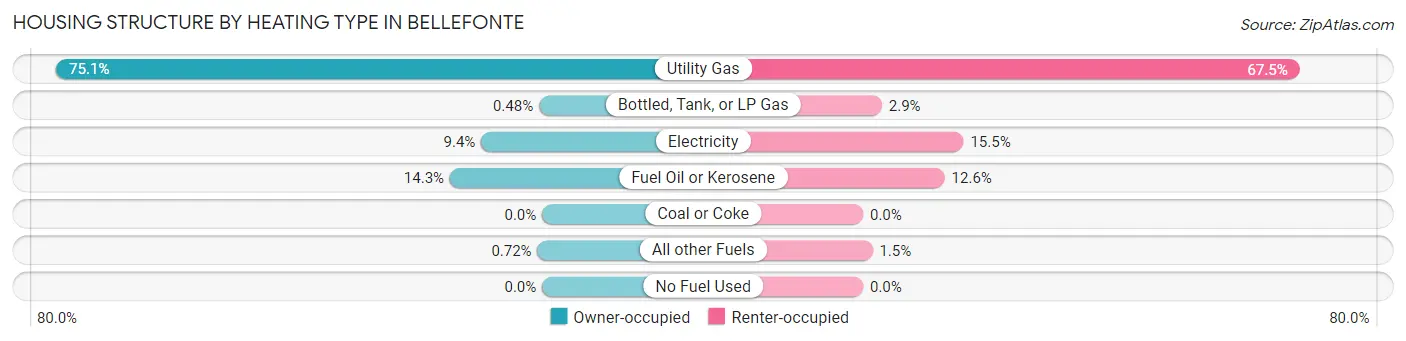
| Heating Type | Owner-occupied | Renter-occupied |
| Utility Gas | 311 (75.1%) | 139 (67.5%) |
| Bottled, Tank, or LP Gas | 2 (0.5%) | 6 (2.9%) |
| Electricity | 39 (9.4%) | 32 (15.5%) |
| Fuel Oil or Kerosene | 59 (14.2%) | 26 (12.6%) |
| Coal or Coke | 0 (0.0%) | 0 (0.0%) |
| All other Fuels | 3 (0.7%) | 3 (1.5%) |
| No Fuel Used | 0 (0.0%) | 0 (0.0%) |
| Total | 414 (100.0%) | 206 (100.0%) |
Household Vehicle Usage in Bellefonte
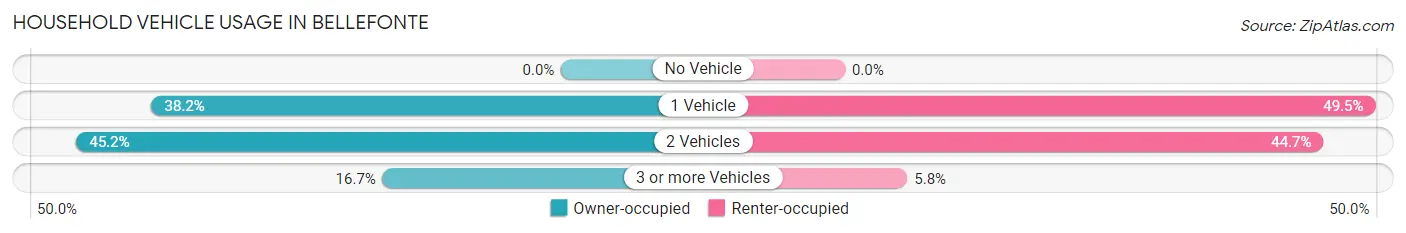
| Vehicles per Household | Owner-occupied | Renter-occupied |
| No Vehicle | 0 (0.0%) | 0 (0.0%) |
| 1 Vehicle | 158 (38.2%) | 102 (49.5%) |
| 2 Vehicles | 187 (45.2%) | 92 (44.7%) |
| 3 or more Vehicles | 69 (16.7%) | 12 (5.8%) |
| Total | 414 (100.0%) | 206 (100.0%) |
Real Estate & Mortgages in Bellefonte
Real Estate and Mortgage Overview in Bellefonte
| Characteristic | Without Mortgage | With Mortgage |
| Housing Units | 118 | 296 |
| Median Property Value | $233,300 | $269,000 |
| Median Household Income | $73,750 | $74 |
| Monthly Housing Costs | $527 | $0 |
| Real Estate Taxes | $2,000 | $13 |
Property Value by Mortgage Status in Bellefonte
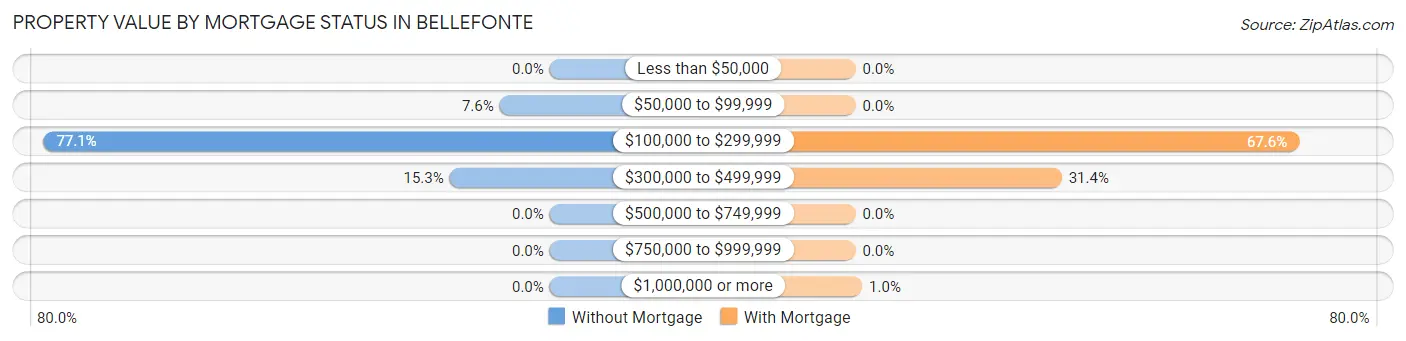
| Property Value | Without Mortgage | With Mortgage |
| Less than $50,000 | 0 (0.0%) | 0 (0.0%) |
| $50,000 to $99,999 | 9 (7.6%) | 0 (0.0%) |
| $100,000 to $299,999 | 91 (77.1%) | 200 (67.6%) |
| $300,000 to $499,999 | 18 (15.2%) | 93 (31.4%) |
| $500,000 to $749,999 | 0 (0.0%) | 0 (0.0%) |
| $750,000 to $999,999 | 0 (0.0%) | 0 (0.0%) |
| $1,000,000 or more | 0 (0.0%) | 3 (1.0%) |
| Total | 118 (100.0%) | 296 (100.0%) |
Household Income by Mortgage Status in Bellefonte
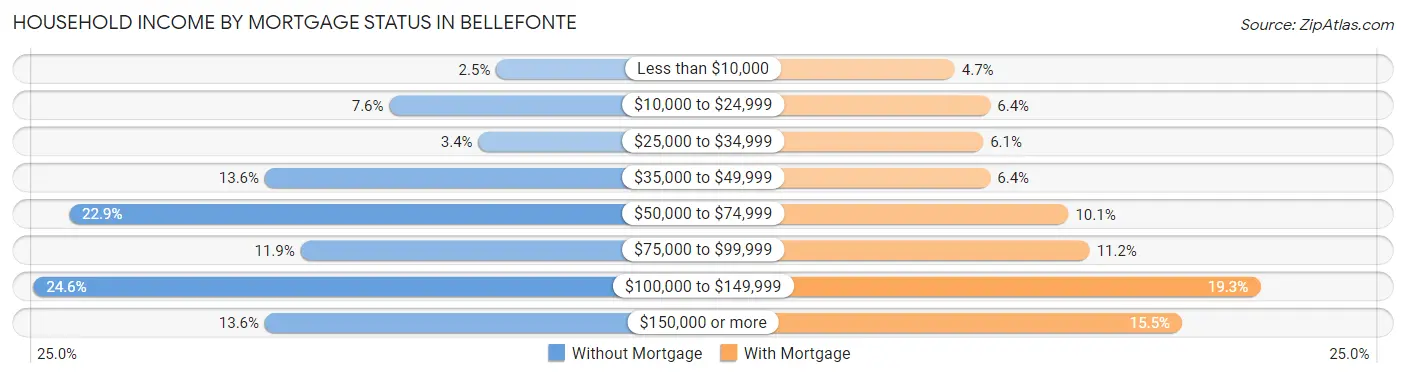
| Household Income | Without Mortgage | With Mortgage |
| Less than $10,000 | 3 (2.5%) | 14 (4.7%) |
| $10,000 to $24,999 | 9 (7.6%) | 19 (6.4%) |
| $25,000 to $34,999 | 4 (3.4%) | 18 (6.1%) |
| $35,000 to $49,999 | 16 (13.6%) | 19 (6.4%) |
| $50,000 to $74,999 | 27 (22.9%) | 30 (10.1%) |
| $75,000 to $99,999 | 14 (11.9%) | 33 (11.2%) |
| $100,000 to $149,999 | 29 (24.6%) | 57 (19.3%) |
| $150,000 or more | 16 (13.6%) | 46 (15.5%) |
| Total | 118 (100.0%) | 296 (100.0%) |
Property Value to Household Income Ratio in Bellefonte
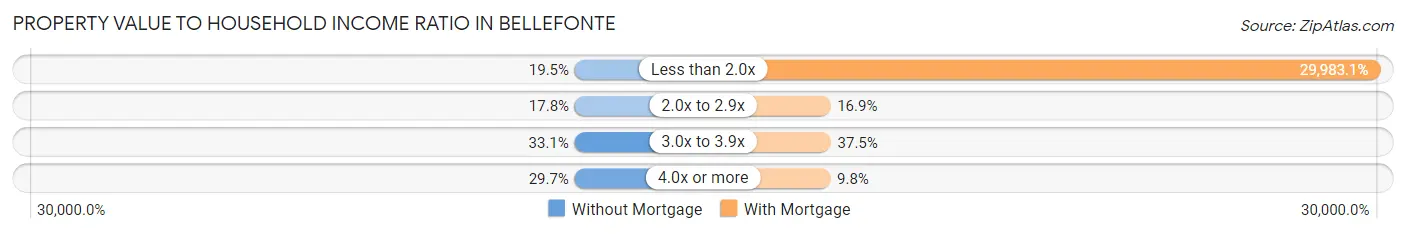
| Value-to-Income Ratio | Without Mortgage | With Mortgage |
| Less than 2.0x | 23 (19.5%) | 88,750 (29,983.1%) |
| 2.0x to 2.9x | 21 (17.8%) | 50 (16.9%) |
| 3.0x to 3.9x | 39 (33.1%) | 111 (37.5%) |
| 4.0x or more | 35 (29.7%) | 29 (9.8%) |
| Total | 118 (100.0%) | 296 (100.0%) |
Real Estate Taxes by Mortgage Status in Bellefonte
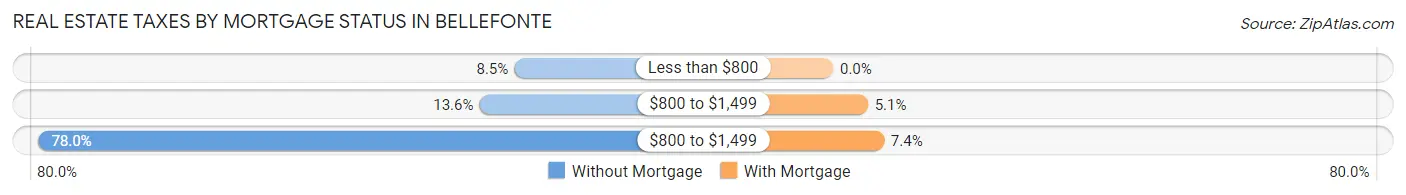
| Property Taxes | Without Mortgage | With Mortgage |
| Less than $800 | 10 (8.5%) | 0 (0.0%) |
| $800 to $1,499 | 16 (13.6%) | 15 (5.1%) |
| $800 to $1,499 | 92 (78.0%) | 22 (7.4%) |
| Total | 118 (100.0%) | 296 (100.0%) |
Health & Disability in Bellefonte
Health Insurance Coverage by Age in Bellefonte
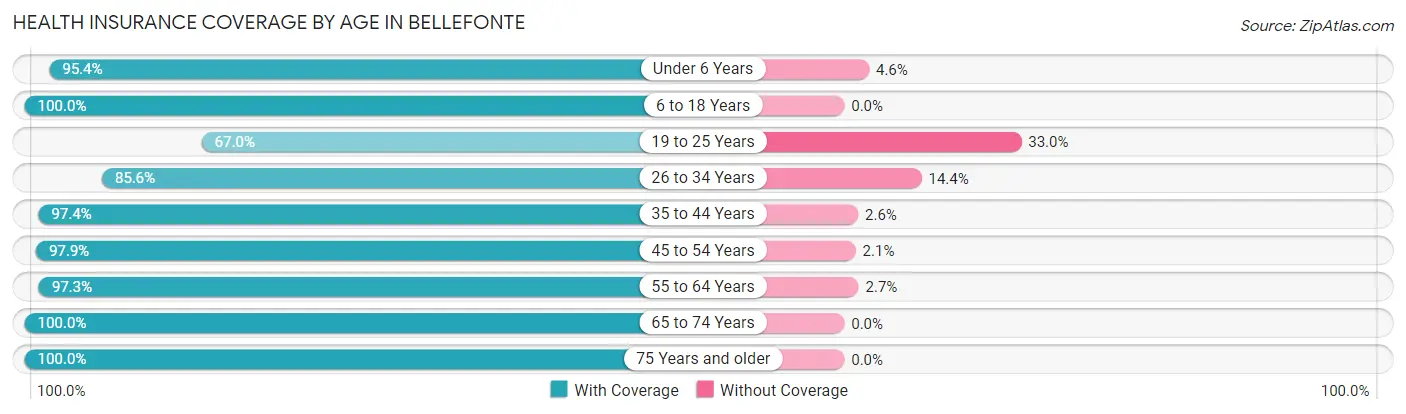
| Age Bracket | With Coverage | Without Coverage |
| Under 6 Years | 145 (95.4%) | 7 (4.6%) |
| 6 to 18 Years | 191 (100.0%) | 0 (0.0%) |
| 19 to 25 Years | 69 (67.0%) | 34 (33.0%) |
| 26 to 34 Years | 196 (85.6%) | 33 (14.4%) |
| 35 to 44 Years | 227 (97.4%) | 6 (2.6%) |
| 45 to 54 Years | 185 (97.9%) | 4 (2.1%) |
| 55 to 64 Years | 256 (97.3%) | 7 (2.7%) |
| 65 to 74 Years | 116 (100.0%) | 0 (0.0%) |
| 75 Years and older | 50 (100.0%) | 0 (0.0%) |
| Total | 1,435 (94.0%) | 91 (6.0%) |
Health Insurance Coverage by Citizenship Status in Bellefonte
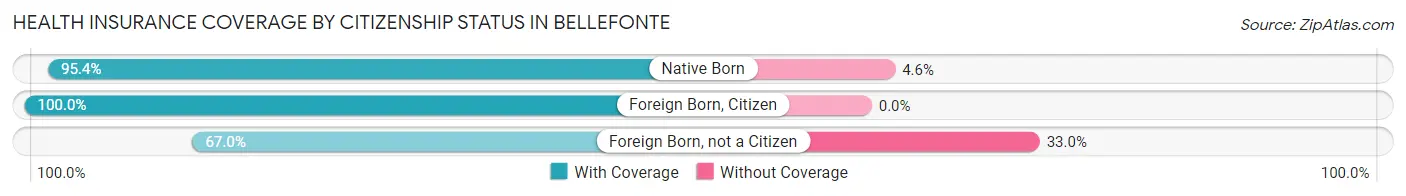
| Citizenship Status | With Coverage | Without Coverage |
| Native Born | 145 (95.4%) | 7 (4.6%) |
| Foreign Born, Citizen | 191 (100.0%) | 0 (0.0%) |
| Foreign Born, not a Citizen | 69 (67.0%) | 34 (33.0%) |
Health Insurance Coverage by Household Income in Bellefonte
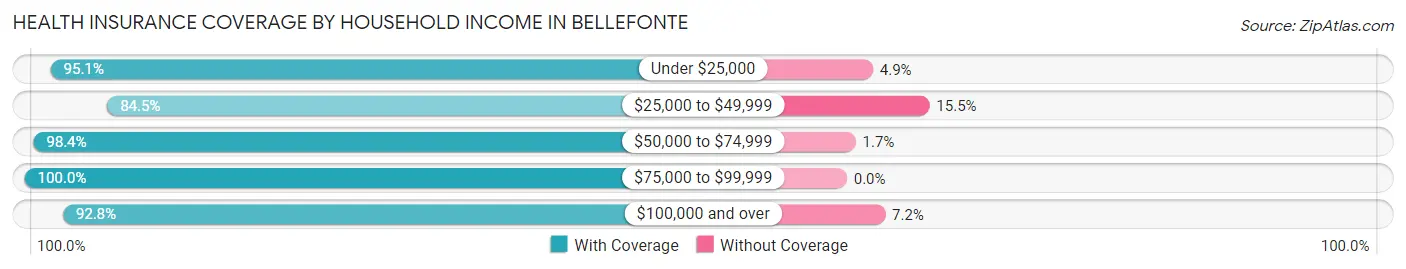
| Household Income | With Coverage | Without Coverage |
| Under $25,000 | 78 (95.1%) | 4 (4.9%) |
| $25,000 to $49,999 | 142 (84.5%) | 26 (15.5%) |
| $50,000 to $74,999 | 239 (98.4%) | 4 (1.7%) |
| $75,000 to $99,999 | 238 (100.0%) | 0 (0.0%) |
| $100,000 and over | 738 (92.8%) | 57 (7.2%) |
Public vs Private Health Insurance Coverage by Age in Bellefonte
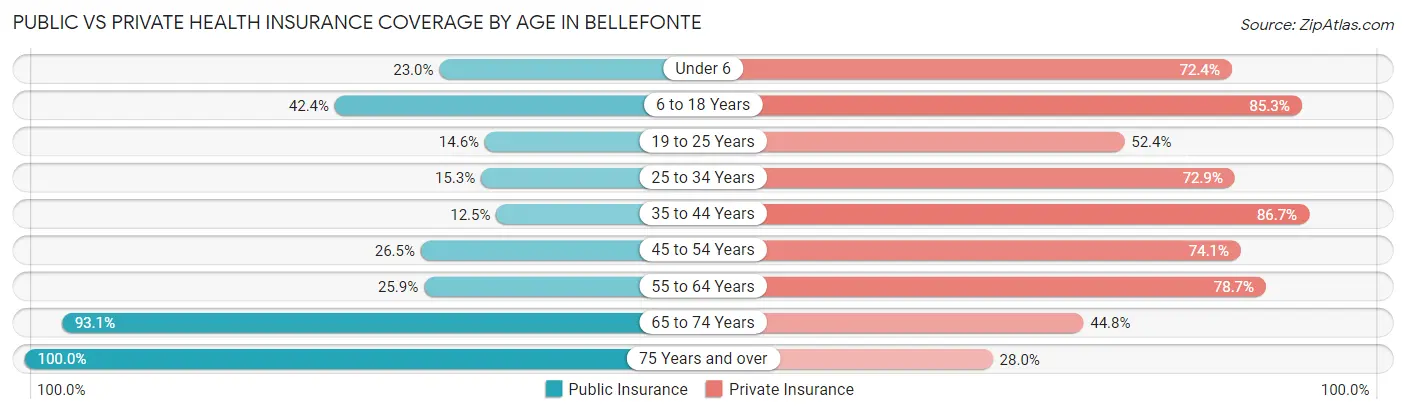
| Age Bracket | Public Insurance | Private Insurance |
| Under 6 | 35 (23.0%) | 110 (72.4%) |
| 6 to 18 Years | 81 (42.4%) | 163 (85.3%) |
| 19 to 25 Years | 15 (14.6%) | 54 (52.4%) |
| 25 to 34 Years | 35 (15.3%) | 167 (72.9%) |
| 35 to 44 Years | 29 (12.4%) | 202 (86.7%) |
| 45 to 54 Years | 50 (26.5%) | 140 (74.1%) |
| 55 to 64 Years | 68 (25.9%) | 207 (78.7%) |
| 65 to 74 Years | 108 (93.1%) | 52 (44.8%) |
| 75 Years and over | 50 (100.0%) | 14 (28.0%) |
| Total | 471 (30.9%) | 1,109 (72.7%) |
Disability Status by Sex by Age in Bellefonte
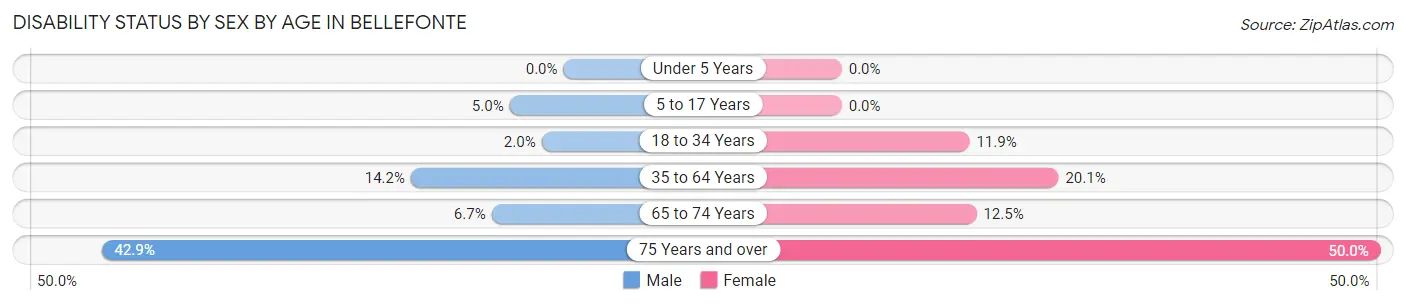
| Age Bracket | Male | Female |
| Under 5 Years | 0 (0.0%) | 0 (0.0%) |
| 5 to 17 Years | 5 (5.0%) | 0 (0.0%) |
| 18 to 34 Years | 4 (2.0%) | 16 (11.8%) |
| 35 to 64 Years | 47 (14.2%) | 71 (20.1%) |
| 65 to 74 Years | 4 (6.7%) | 7 (12.5%) |
| 75 Years and over | 12 (42.9%) | 11 (50.0%) |
Disability Class by Sex by Age in Bellefonte
Disability Class: Hearing Difficulty
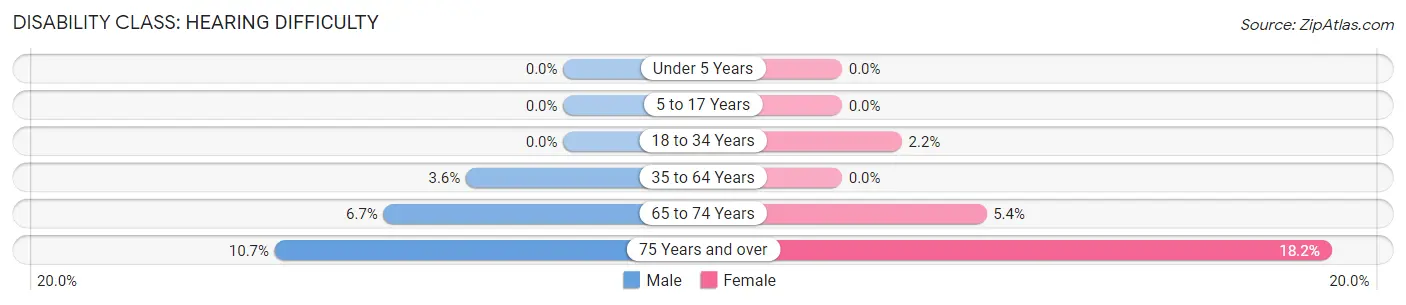
| Age Bracket | Male | Female |
| Under 5 Years | 0 (0.0%) | 0 (0.0%) |
| 5 to 17 Years | 0 (0.0%) | 0 (0.0%) |
| 18 to 34 Years | 0 (0.0%) | 3 (2.2%) |
| 35 to 64 Years | 12 (3.6%) | 0 (0.0%) |
| 65 to 74 Years | 4 (6.7%) | 3 (5.4%) |
| 75 Years and over | 3 (10.7%) | 4 (18.2%) |
Disability Class: Vision Difficulty
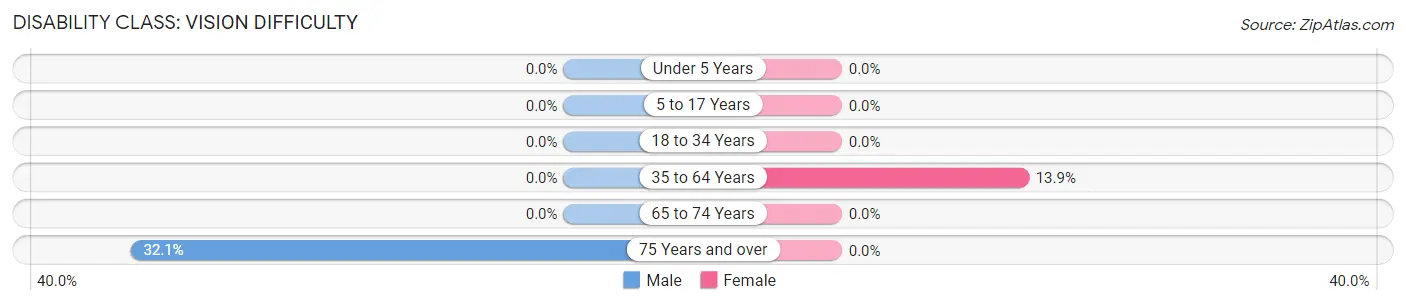
| Age Bracket | Male | Female |
| Under 5 Years | 0 (0.0%) | 0 (0.0%) |
| 5 to 17 Years | 0 (0.0%) | 0 (0.0%) |
| 18 to 34 Years | 0 (0.0%) | 0 (0.0%) |
| 35 to 64 Years | 0 (0.0%) | 49 (13.9%) |
| 65 to 74 Years | 0 (0.0%) | 0 (0.0%) |
| 75 Years and over | 9 (32.1%) | 0 (0.0%) |
Disability Class: Cognitive Difficulty
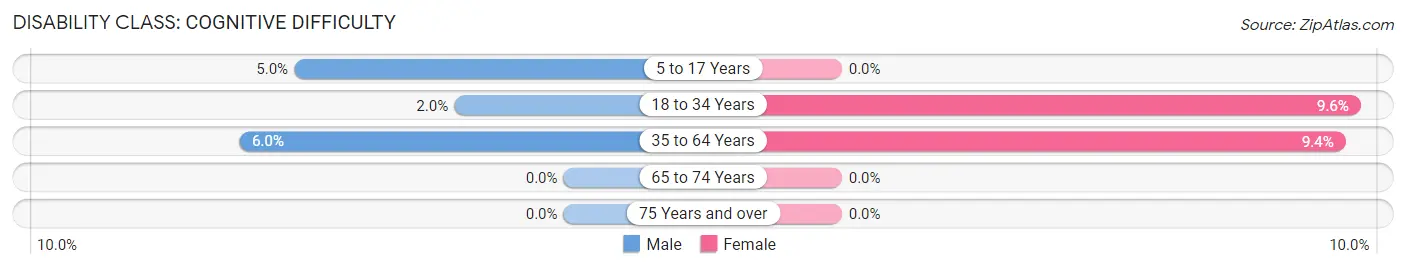
| Age Bracket | Male | Female |
| 5 to 17 Years | 5 (5.0%) | 0 (0.0%) |
| 18 to 34 Years | 4 (2.0%) | 13 (9.6%) |
| 35 to 64 Years | 20 (6.0%) | 33 (9.3%) |
| 65 to 74 Years | 0 (0.0%) | 0 (0.0%) |
| 75 Years and over | 0 (0.0%) | 0 (0.0%) |
Disability Class: Ambulatory Difficulty
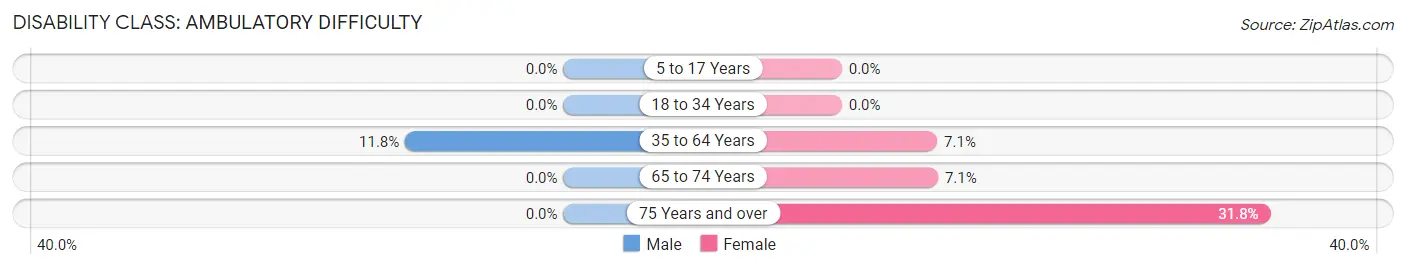
| Age Bracket | Male | Female |
| 5 to 17 Years | 0 (0.0%) | 0 (0.0%) |
| 18 to 34 Years | 0 (0.0%) | 0 (0.0%) |
| 35 to 64 Years | 39 (11.7%) | 25 (7.1%) |
| 65 to 74 Years | 0 (0.0%) | 4 (7.1%) |
| 75 Years and over | 0 (0.0%) | 7 (31.8%) |
Disability Class: Self-Care Difficulty
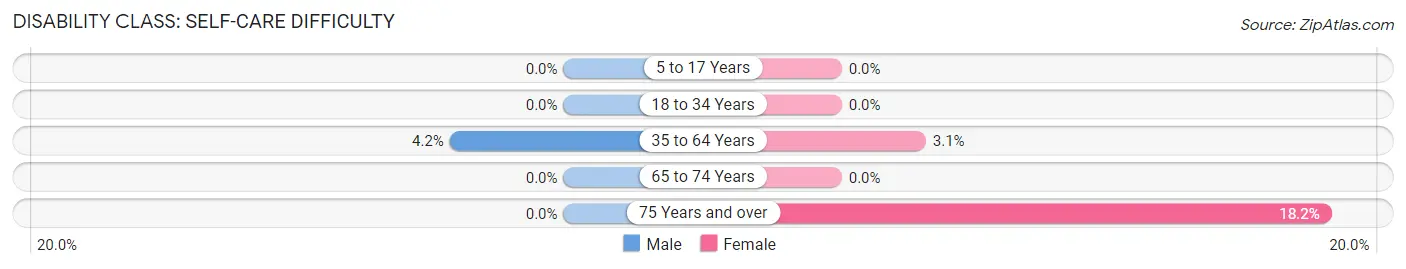
| Age Bracket | Male | Female |
| 5 to 17 Years | 0 (0.0%) | 0 (0.0%) |
| 18 to 34 Years | 0 (0.0%) | 0 (0.0%) |
| 35 to 64 Years | 14 (4.2%) | 11 (3.1%) |
| 65 to 74 Years | 0 (0.0%) | 0 (0.0%) |
| 75 Years and over | 0 (0.0%) | 4 (18.2%) |
Technology Access in Bellefonte
Computing Device Access in Bellefonte
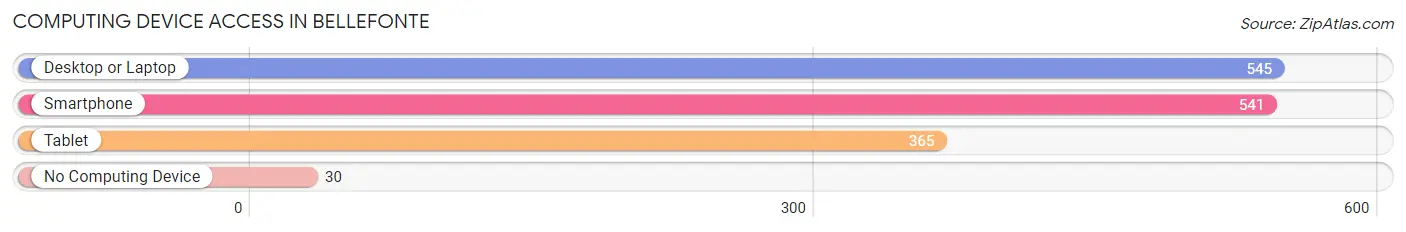
| Device Type | # Households | % Households |
| Desktop or Laptop | 545 | 87.9% |
| Smartphone | 541 | 87.3% |
| Tablet | 365 | 58.9% |
| No Computing Device | 30 | 4.8% |
| Total | 620 | 100.0% |
Internet Access in Bellefonte
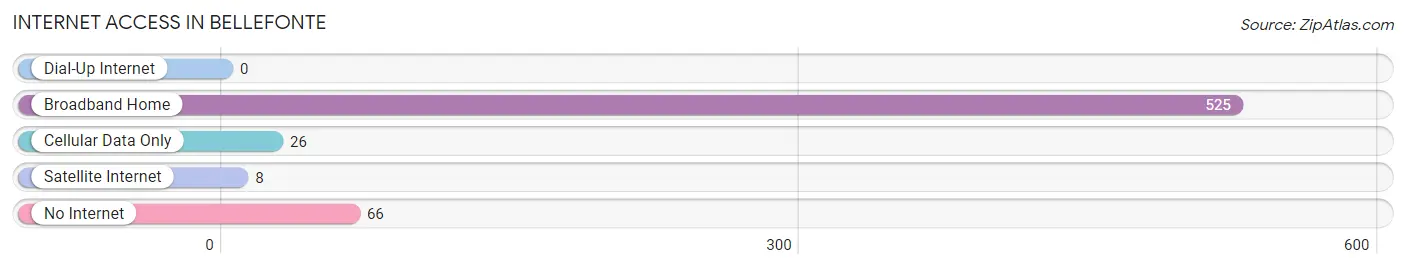
| Internet Type | # Households | % Households |
| Dial-Up Internet | 0 | 0.0% |
| Broadband Home | 525 | 84.7% |
| Cellular Data Only | 26 | 4.2% |
| Satellite Internet | 8 | 1.3% |
| No Internet | 66 | 10.6% |
| Total | 620 | 100.0% |
Bellefonte Summary
Bellefonte is a small town located in New Castle County, Delaware. It is situated on the banks of the Christina River, about 10 miles south of Wilmington. The town was founded in 1796 and is named after the French word for “beautiful fountain”. Bellefonte is a small, rural community with a population of just over 1,000 people.
History
Bellefonte was founded in 1796 by a group of Quakers from Pennsylvania. The town was originally known as “Fountain Town”, but was later renamed Bellefonte. The town was a popular stop for travelers on the Wilmington-Philadelphia stagecoach line. In the early 19th century, Bellefonte was a thriving agricultural community. The town was home to several mills, including a grist mill, a saw mill, and a paper mill.
In the late 19th century, Bellefonte began to decline as the railroad bypassed the town. The town’s population decreased and many of the businesses closed. In the early 20th century, the town was revitalized by the construction of a new railroad line. This allowed the town to become a popular tourist destination.
Geography
Bellefonte is located in New Castle County, Delaware. The town is situated on the banks of the Christina River, about 10 miles south of Wilmington. The town is surrounded by rolling hills and farmland. The climate in Bellefonte is mild, with temperatures ranging from the mid-30s in the winter to the mid-80s in the summer.
Economy
Bellefonte’s economy is largely based on agriculture and tourism. The town is home to several farms, which produce a variety of crops, including corn, soybeans, and wheat. The town is also home to several small businesses, including restaurants, antique shops, and art galleries.
Tourism is an important part of the town’s economy. Bellefonte is home to several historic sites, including the Bellefonte Historic District, which is listed on the National Register of Historic Places. The town is also home to several parks and recreational areas, including the Bellefonte State Park.
Demographics
As of the 2010 census, Bellefonte had a population of 1,068. The racial makeup of the town was 94.3% White, 2.2% African American, 0.3% Native American, 0.7% Asian, 0.1% Pacific Islander, and 2.4% from other races. The median household income in Bellefonte was $50,938, and the median family income was $60,625. The town’s population is largely made up of families, with the median age being 39.7 years.
Common Questions
What is Per Capita Income in Bellefonte?
Per Capita income in Bellefonte is $38,492.
What is the Median Family Income in Bellefonte?
Median Family Income in Bellefonte is $99,500.
What is the Median Household income in Bellefonte?
Median Household Income in Bellefonte is $81,563.
What is Income or Wage Gap in Bellefonte?
Income or Wage Gap in Bellefonte is 3.8%.
Women in Bellefonte earn 96.2 cents for every dollar earned by a man.
What is Inequality or Gini Index in Bellefonte?
Inequality or Gini Index in Bellefonte is 0.37.
What is the Total Population of Bellefonte?
Total Population of Bellefonte is 1,526.
What is the Total Male Population of Bellefonte?
Total Male Population of Bellefonte is 783.
What is the Total Female Population of Bellefonte?
Total Female Population of Bellefonte is 743.
What is the Ratio of Males per 100 Females in Bellefonte?
There are 105.38 Males per 100 Females in Bellefonte.
What is the Ratio of Females per 100 Males in Bellefonte?
There are 94.89 Females per 100 Males in Bellefonte.
What is the Median Population Age in Bellefonte?
Median Population Age in Bellefonte is 40.7 Years.
What is the Average Family Size in Bellefonte
Average Family Size in Bellefonte is 3.3 People.
What is the Average Household Size in Bellefonte
Average Household Size in Bellefonte is 2.5 People.
How Large is the Labor Force in Bellefonte?
There are 863 People in the Labor Forcein in Bellefonte.
What is the Percentage of People in the Labor Force in Bellefonte?
71.6% of People are in the Labor Force in Bellefonte.
What is the Unemployment Rate in Bellefonte?
Unemployment Rate in Bellefonte is 4.5%.