Odessa, DE Map & Demographics
Odessa Map
Odessa Overview
$45,905
PER CAPITA INCOME
$114,444
AVG FAMILY INCOME
$87,321
AVG HOUSEHOLD INCOME
32.8%
WAGE / INCOME GAP [ % ]
67.2¢/ $1
WAGE / INCOME GAP [ $ ]
0.40
INEQUALITY / GINI INDEX
389
TOTAL POPULATION
201
MALE POPULATION
188
FEMALE POPULATION
106.91
MALES / 100 FEMALES
93.53
FEMALES / 100 MALES
46.6
MEDIAN AGE
3.2
AVG FAMILY SIZE
2.5
AVG HOUSEHOLD SIZE
167
LABOR FORCE [ PEOPLE ]
58.0%
PERCENT IN LABOR FORCE
0.6%
UNEMPLOYMENT RATE
Odessa Zip Codes
Odessa Area Codes
Income in Odessa
Income Overview in Odessa
Per Capita Income in Odessa is $45,905, while median incomes of families and households are $114,444 and $87,321 respectively.
| Characteristic | Number | Measure |
| Per Capita Income | 389 | $45,905 |
| Median Family Income | 100 | $114,444 |
| Mean Family Income | 100 | $120,156 |
| Median Household Income | 153 | $87,321 |
| Mean Household Income | 153 | $110,455 |
| Income Deficit | 100 | $0 |
| Wage / Income Gap (%) | 389 | 32.81% |
| Wage / Income Gap ($) | 389 | 67.19¢ per $1 |
| Gini / Inequality Index | 389 | 0.40 |
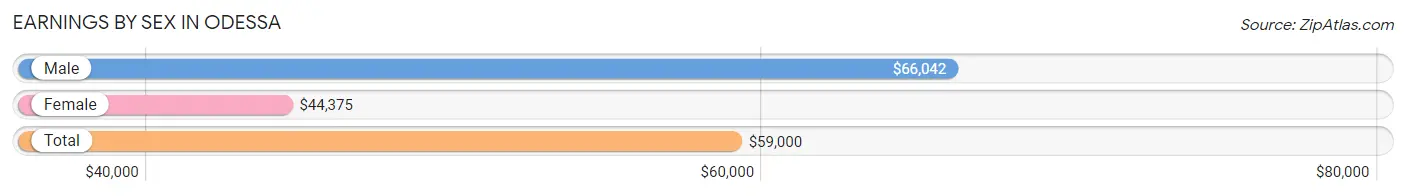
Earnings by Sex in Odessa
Average Earnings in Odessa are $59,000, $66,042 for men and $44,375 for women, a difference of 32.8%.
| Sex | Number | Average Earnings |
| Male | 99 (56.2%) | $66,042 |
| Female | 77 (43.8%) | $44,375 |
| Total | 176 (100.0%) | $59,000 |
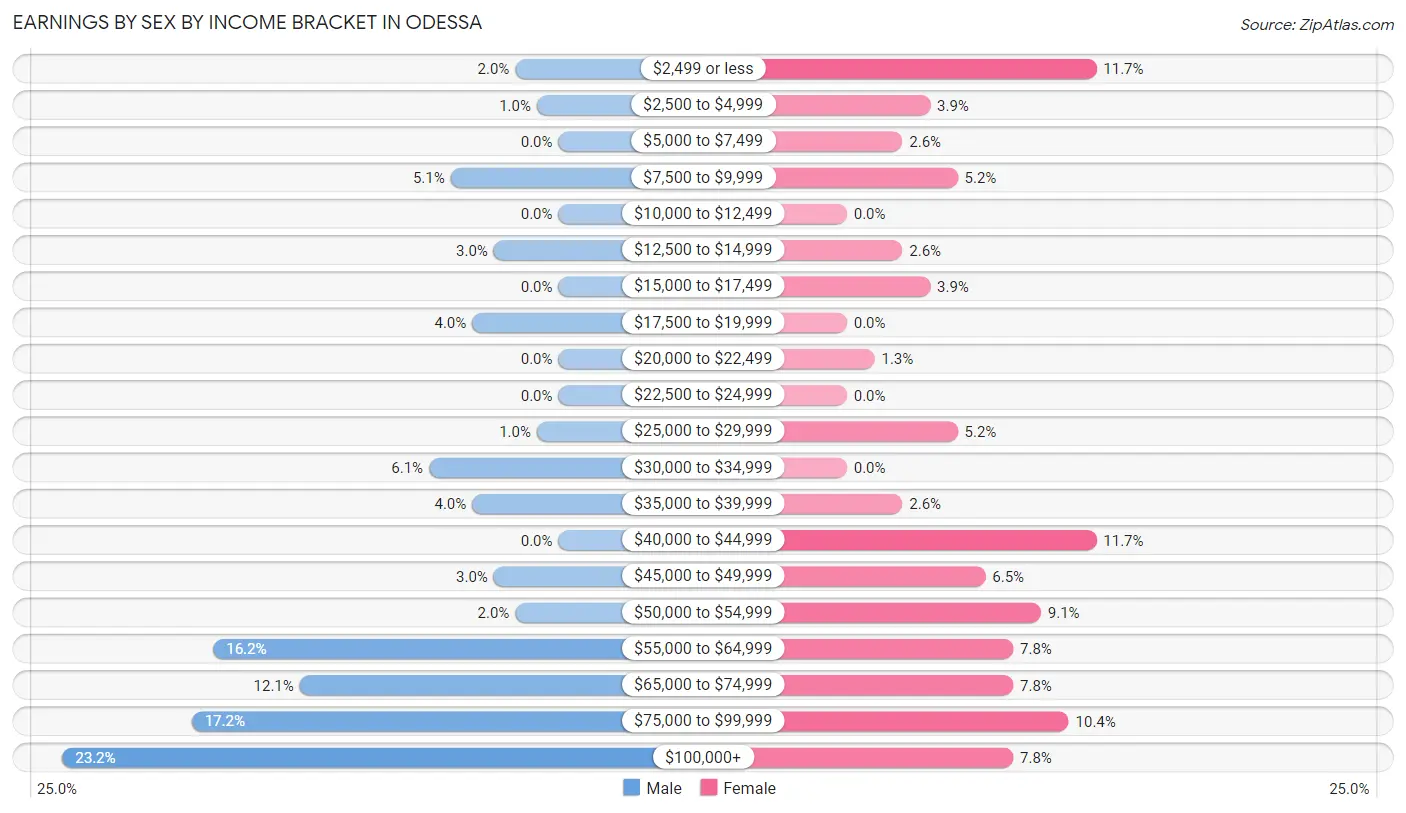
Earnings by Sex by Income Bracket in Odessa
The most common earnings brackets in Odessa are $100,000+ for men (23 | 23.2%) and $2,499 or less for women (9 | 11.7%).
| Income | Male | Female |
| $2,499 or less | 2 (2.0%) | 9 (11.7%) |
| $2,500 to $4,999 | 1 (1.0%) | 3 (3.9%) |
| $5,000 to $7,499 | 0 (0.0%) | 2 (2.6%) |
| $7,500 to $9,999 | 5 (5.1%) | 4 (5.2%) |
| $10,000 to $12,499 | 0 (0.0%) | 0 (0.0%) |
| $12,500 to $14,999 | 3 (3.0%) | 2 (2.6%) |
| $15,000 to $17,499 | 0 (0.0%) | 3 (3.9%) |
| $17,500 to $19,999 | 4 (4.0%) | 0 (0.0%) |
| $20,000 to $22,499 | 0 (0.0%) | 1 (1.3%) |
| $22,500 to $24,999 | 0 (0.0%) | 0 (0.0%) |
| $25,000 to $29,999 | 1 (1.0%) | 4 (5.2%) |
| $30,000 to $34,999 | 6 (6.1%) | 0 (0.0%) |
| $35,000 to $39,999 | 4 (4.0%) | 2 (2.6%) |
| $40,000 to $44,999 | 0 (0.0%) | 9 (11.7%) |
| $45,000 to $49,999 | 3 (3.0%) | 5 (6.5%) |
| $50,000 to $54,999 | 2 (2.0%) | 7 (9.1%) |
| $55,000 to $64,999 | 16 (16.2%) | 6 (7.8%) |
| $65,000 to $74,999 | 12 (12.1%) | 6 (7.8%) |
| $75,000 to $99,999 | 17 (17.2%) | 8 (10.4%) |
| $100,000+ | 23 (23.2%) | 6 (7.8%) |
| Total | 99 (100.0%) | 77 (100.0%) |
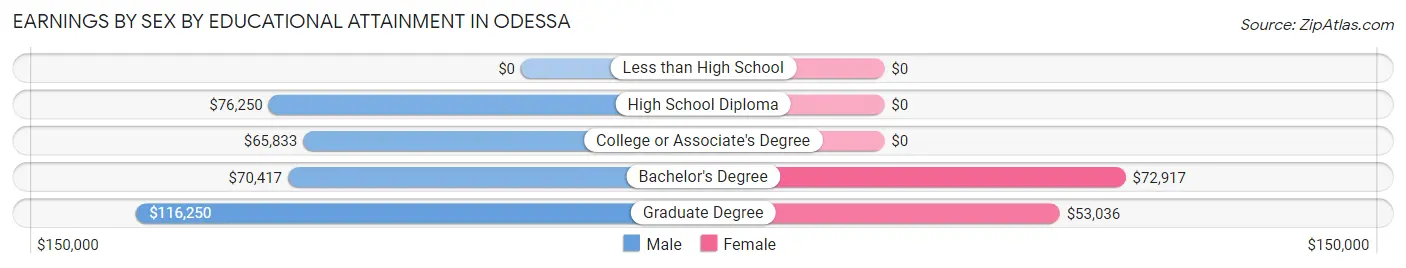
Earnings by Sex by Educational Attainment in Odessa
Average earnings in Odessa are $68,750 for men and $45,938 for women, a difference of 33.2%. Men with an educational attainment of graduate degree enjoy the highest average annual earnings of $116,250, while those with college or associate's degree education earn the least with $65,833. Women with an educational attainment of bachelor's degree earn the most with the average annual earnings of $72,917, while those with graduate degree education have the smallest earnings of $53,036.
| Educational Attainment | Male Income | Female Income |
| Less than High School | - | - |
| High School Diploma | $76,250 | $0 |
| College or Associate's Degree | $65,833 | $0 |
| Bachelor's Degree | $70,417 | $72,917 |
| Graduate Degree | $116,250 | $53,036 |
| Total | $68,750 | $45,938 |
Family Income in Odessa
Family Income Brackets in Odessa
According to the Odessa family income data, there are 41 families falling into the $100,000 to $149,999 income range, which is the most common income bracket and makes up 41.0% of all families.
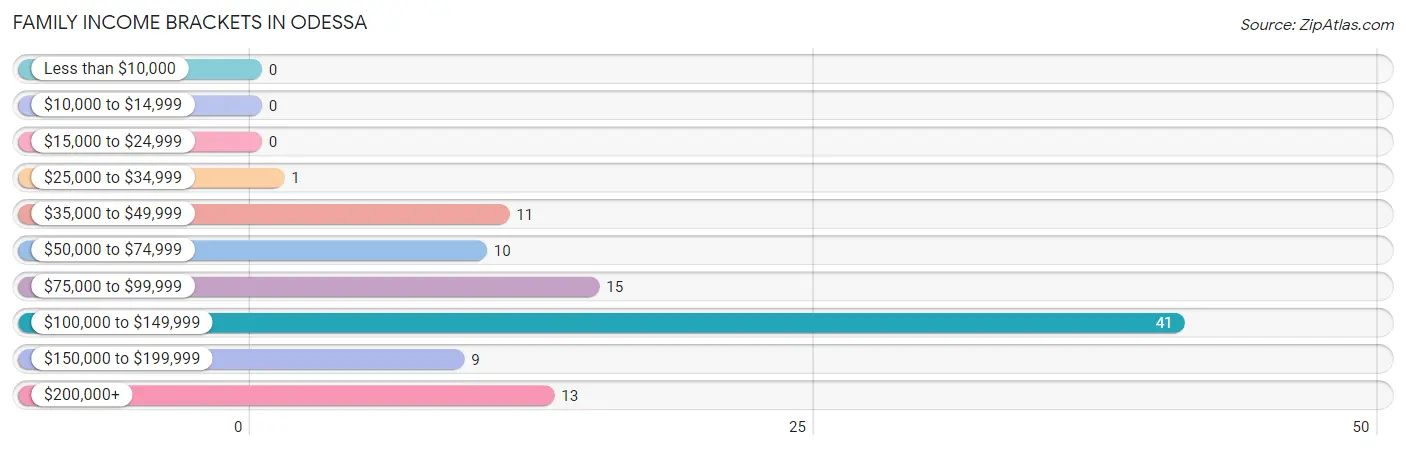
| Income Bracket | # Families | % Families |
| Less than $10,000 | 0 | 0.0% |
| $10,000 to $14,999 | 0 | 0.0% |
| $15,000 to $24,999 | 0 | 0.0% |
| $25,000 to $34,999 | 1 | 1.0% |
| $35,000 to $49,999 | 11 | 11.0% |
| $50,000 to $74,999 | 10 | 10.0% |
| $75,000 to $99,999 | 15 | 15.0% |
| $100,000 to $149,999 | 41 | 41.0% |
| $150,000 to $199,999 | 9 | 9.0% |
| $200,000+ | 13 | 13.0% |
Family Income by Famaliy Size in Odessa
4-person families (17 | 17.0%) account for the highest median family income in Odessa with $179,063 per family, while 2-person families (41 | 41.0%) have the highest median income of $54,375 per family member.
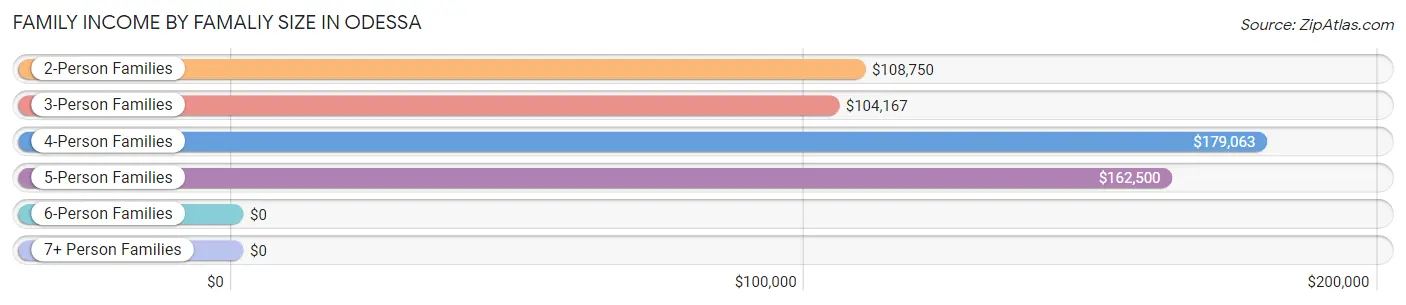
| Income Bracket | # Families | Median Income |
| 2-Person Families | 41 (41.0%) | $108,750 |
| 3-Person Families | 32 (32.0%) | $104,167 |
| 4-Person Families | 17 (17.0%) | $179,063 |
| 5-Person Families | 6 (6.0%) | $162,500 |
| 6-Person Families | 4 (4.0%) | $0 |
| 7+ Person Families | 0 (0.0%) | $0 |
| Total | 100 (100.0%) | $114,444 |
Family Income by Number of Earners in Odessa
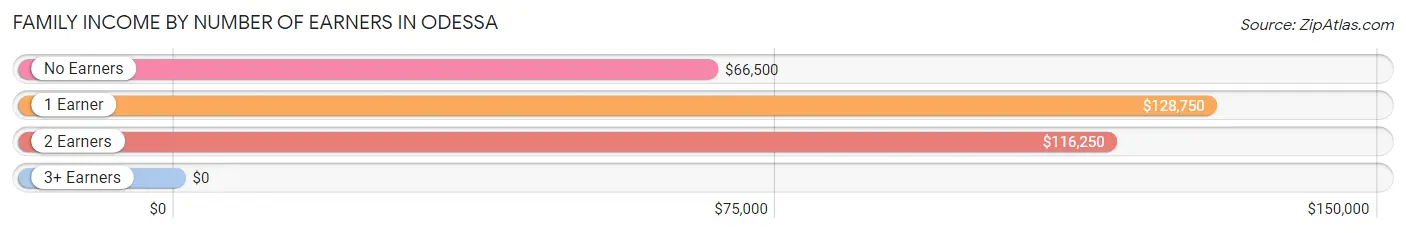
| Number of Earners | # Families | Median Income |
| No Earners | 22 (22.0%) | $66,500 |
| 1 Earner | 36 (36.0%) | $128,750 |
| 2 Earners | 40 (40.0%) | $116,250 |
| 3+ Earners | 2 (2.0%) | $0 |
| Total | 100 (100.0%) | $114,444 |
Household Income in Odessa
Household Income Brackets in Odessa
With 45 households falling in the category, the $100,000 to $149,999 income range is the most frequent in Odessa, accounting for 29.4% of all households. In contrast, only 3 households (2.0%) fall into the less than $10,000 income bracket, making it the least populous group.
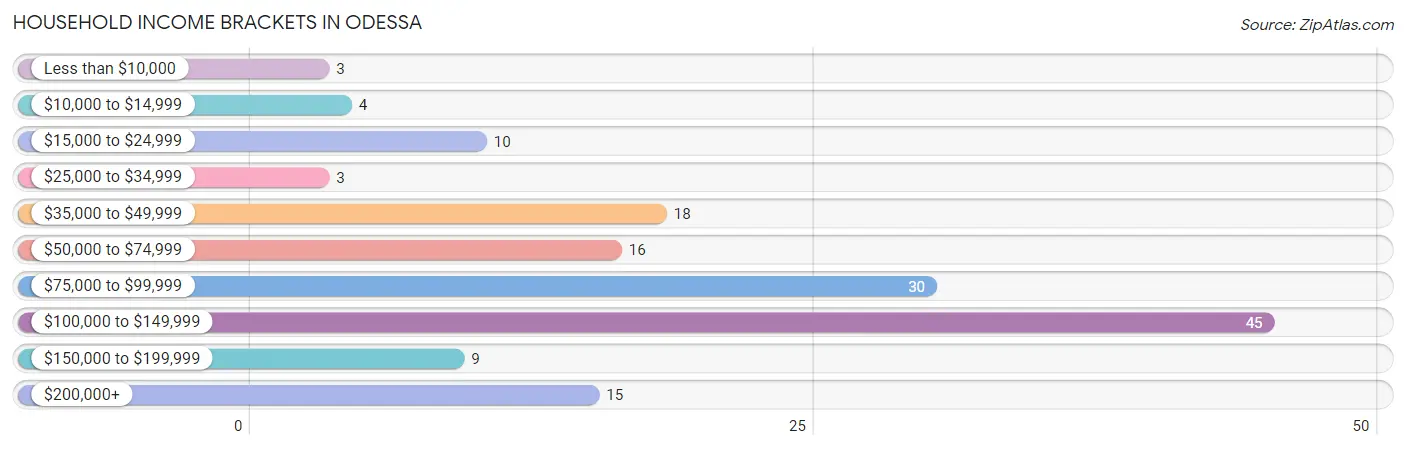
| Income Bracket | # Households | % Households |
| Less than $10,000 | 3 | 2.0% |
| $10,000 to $14,999 | 4 | 2.6% |
| $15,000 to $24,999 | 10 | 6.5% |
| $25,000 to $34,999 | 3 | 2.0% |
| $35,000 to $49,999 | 18 | 11.8% |
| $50,000 to $74,999 | 16 | 10.5% |
| $75,000 to $99,999 | 30 | 19.6% |
| $100,000 to $149,999 | 45 | 29.4% |
| $150,000 to $199,999 | 9 | 5.9% |
| $200,000+ | 15 | 9.8% |
Household Income by Householder Age in Odessa
The median household income in Odessa is $87,321, with the highest median household income of $118,125 found in the 45 to 64 years age bracket for the primary householder. A total of 47 households (30.7%) fall into this category. Meanwhile, the 15 to 24 years age bracket for the primary householder has the lowest median household income of $0, with 2 households (1.3%) in this group.
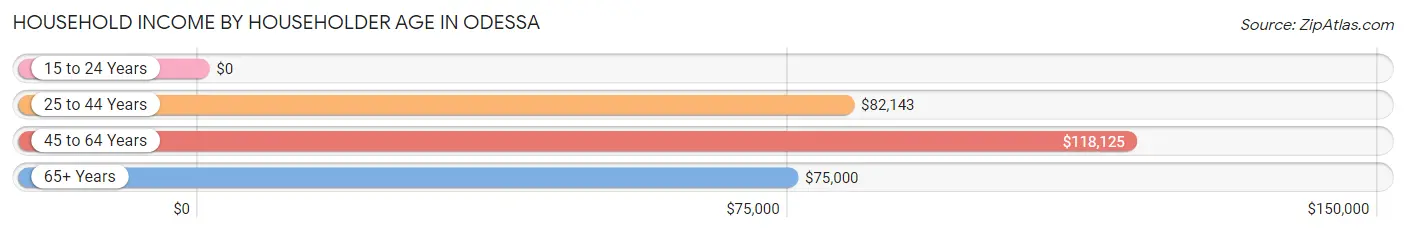
| Income Bracket | # Households | Median Income |
| 15 to 24 Years | 2 (1.3%) | $0 |
| 25 to 44 Years | 36 (23.5%) | $82,143 |
| 45 to 64 Years | 47 (30.7%) | $118,125 |
| 65+ Years | 68 (44.4%) | $75,000 |
| Total | 153 (100.0%) | $87,321 |
Poverty in Odessa
Income Below Poverty by Sex and Age in Odessa
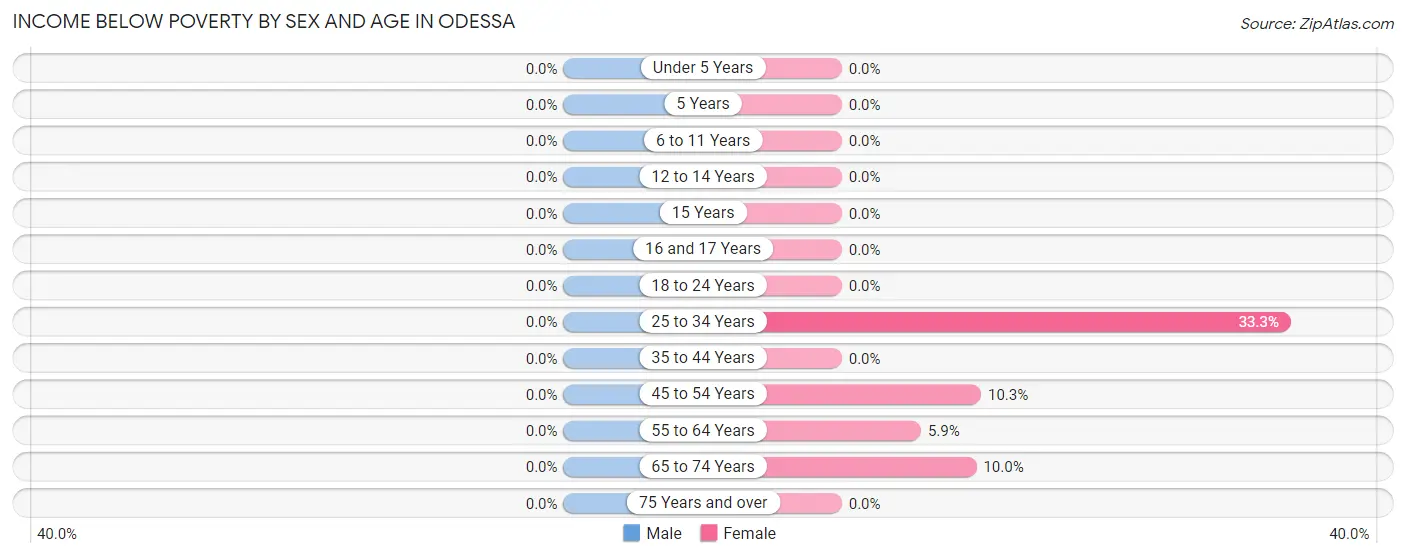
| Age Bracket | Male | Female |
| Under 5 Years | 0 (0.0%) | 0 (0.0%) |
| 5 Years | 0 (0.0%) | 0 (0.0%) |
| 6 to 11 Years | 0 (0.0%) | 0 (0.0%) |
| 12 to 14 Years | 0 (0.0%) | 0 (0.0%) |
| 15 Years | 0 (0.0%) | 0 (0.0%) |
| 16 and 17 Years | 0 (0.0%) | 0 (0.0%) |
| 18 to 24 Years | 0 (0.0%) | 0 (0.0%) |
| 25 to 34 Years | 0 (0.0%) | 3 (33.3%) |
| 35 to 44 Years | 0 (0.0%) | 0 (0.0%) |
| 45 to 54 Years | 0 (0.0%) | 3 (10.3%) |
| 55 to 64 Years | 0 (0.0%) | 1 (5.9%) |
| 65 to 74 Years | 0 (0.0%) | 4 (10.0%) |
| 75 Years and over | 0 (0.0%) | 0 (0.0%) |
| Total | 0 (0.0%) | 11 (5.9%) |
Income Above Poverty by Sex and Age in Odessa
According to the poverty statistics in Odessa, males aged 5 years and females aged under 5 years are the age groups that are most secure financially, with 100.0% of males and 100.0% of females in these age groups living above the poverty line.
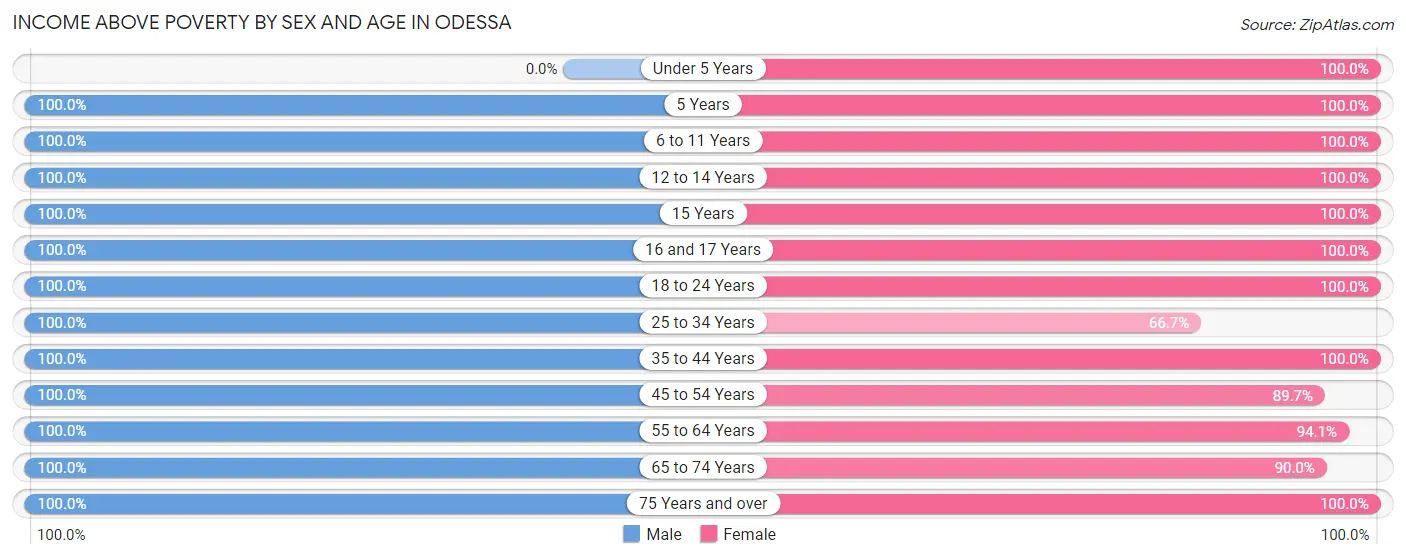
| Age Bracket | Male | Female |
| Under 5 Years | 0 (0.0%) | 7 (100.0%) |
| 5 Years | 6 (100.0%) | 1 (100.0%) |
| 6 to 11 Years | 33 (100.0%) | 17 (100.0%) |
| 12 to 14 Years | 17 (100.0%) | 15 (100.0%) |
| 15 Years | 4 (100.0%) | 1 (100.0%) |
| 16 and 17 Years | 1 (100.0%) | 8 (100.0%) |
| 18 to 24 Years | 6 (100.0%) | 4 (100.0%) |
| 25 to 34 Years | 13 (100.0%) | 6 (66.7%) |
| 35 to 44 Years | 17 (100.0%) | 22 (100.0%) |
| 45 to 54 Years | 34 (100.0%) | 26 (89.7%) |
| 55 to 64 Years | 28 (100.0%) | 16 (94.1%) |
| 65 to 74 Years | 21 (100.0%) | 36 (90.0%) |
| 75 Years and over | 21 (100.0%) | 18 (100.0%) |
| Total | 201 (100.0%) | 177 (94.2%) |
Income Below Poverty Among Married-Couple Families in Odessa
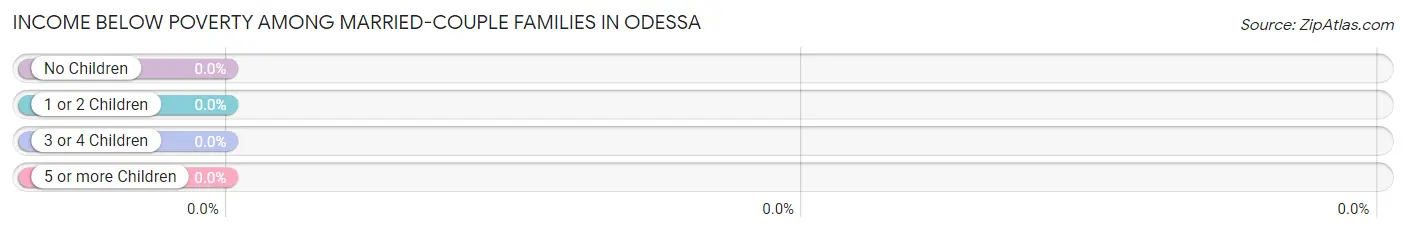
| Children | Above Poverty | Below Poverty |
| No Children | 33 (100.0%) | 0 (0.0%) |
| 1 or 2 Children | 36 (100.0%) | 0 (0.0%) |
| 3 or 4 Children | 8 (100.0%) | 0 (0.0%) |
| 5 or more Children | 0 (0.0%) | 0 (0.0%) |
| Total | 77 (100.0%) | 0 (0.0%) |
Income Below Poverty Among Single-Parent Households in Odessa
| Children | Single Father | Single Mother |
| No Children | 0 (0.0%) | 0 (0.0%) |
| 1 or 2 Children | 0 (0.0%) | 0 (0.0%) |
| 3 or 4 Children | 0 (0.0%) | 0 (0.0%) |
| 5 or more Children | 0 (0.0%) | 0 (0.0%) |
| Total | 0 (0.0%) | 0 (0.0%) |
Income Below Poverty Among Married-Couple vs Single-Parent Households in Odessa
| Children | Married-Couple Families | Single-Parent Households |
| No Children | 0 (0.0%) | 0 (0.0%) |
| 1 or 2 Children | 0 (0.0%) | 0 (0.0%) |
| 3 or 4 Children | 0 (0.0%) | 0 (0.0%) |
| 5 or more Children | 0 (0.0%) | 0 (0.0%) |
| Total | 0 (0.0%) | 0 (0.0%) |
Race in Odessa
The most populous races in Odessa are White / Caucasian (327 | 84.1%), Black / African American (45 | 11.6%), and Hispanic or Latino (18 | 4.6%).
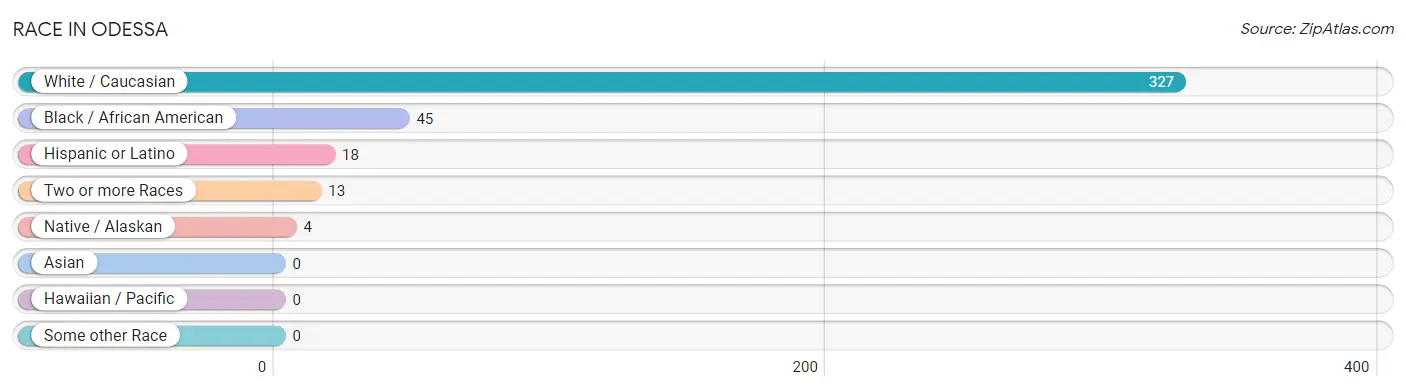
| Race | # Population | % Population |
| Asian | 0 | 0.0% |
| Black / African American | 45 | 11.6% |
| Hawaiian / Pacific | 0 | 0.0% |
| Hispanic or Latino | 18 | 4.6% |
| Native / Alaskan | 4 | 1.0% |
| White / Caucasian | 327 | 84.1% |
| Two or more Races | 13 | 3.3% |
| Some other Race | 0 | 0.0% |
| Total | 389 | 100.0% |
Ancestry in Odessa
The most populous ancestries reported in Odessa are English (79 | 20.3%), Irish (61 | 15.7%), Polish (42 | 10.8%), German (35 | 9.0%), and Italian (31 | 8.0%), together accounting for 63.8% of all Odessa residents.
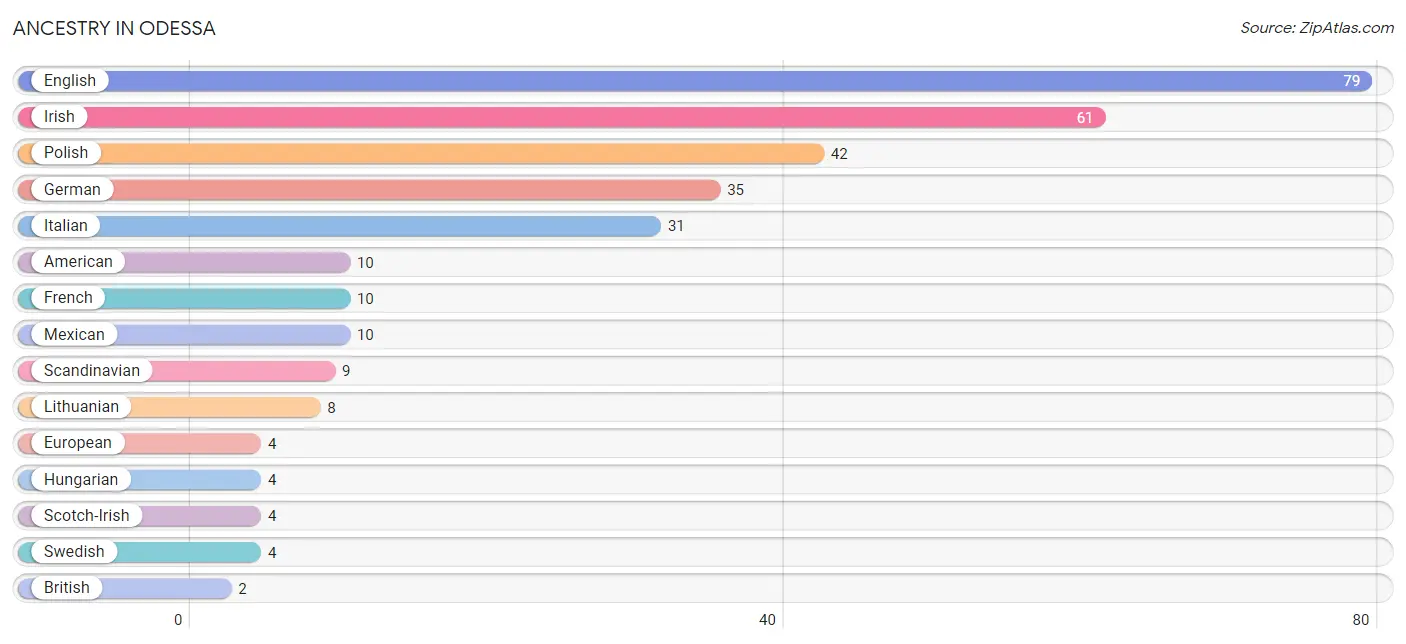
| Ancestry | # Population | % Population |
| American | 10 | 2.6% |
| British | 2 | 0.5% |
| Bulgarian | 2 | 0.5% |
| Cherokee | 1 | 0.3% |
| English | 79 | 20.3% |
| European | 4 | 1.0% |
| French | 10 | 2.6% |
| German | 35 | 9.0% |
| Hungarian | 4 | 1.0% |
| Irish | 61 | 15.7% |
| Italian | 31 | 8.0% |
| Lithuanian | 8 | 2.1% |
| Mexican | 10 | 2.6% |
| Norwegian | 1 | 0.3% |
| Polish | 42 | 10.8% |
| Puerto Rican | 1 | 0.3% |
| Scandinavian | 9 | 2.3% |
| Scotch-Irish | 4 | 1.0% |
| Swedish | 4 | 1.0% | View All 19 Rows |
Immigrants in Odessa
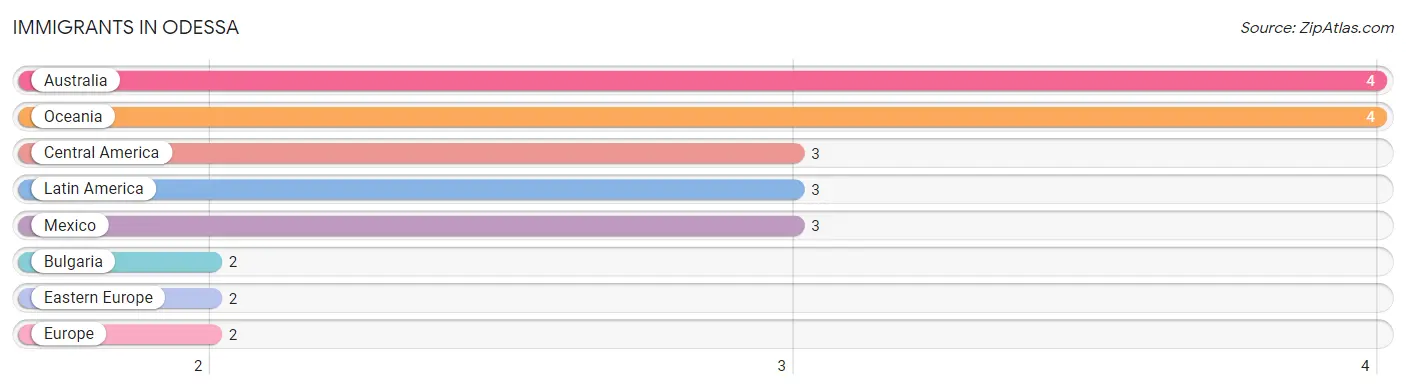
The most numerous immigrant groups reported in Odessa came from Australia (4 | 1.0%), Oceania (4 | 1.0%), Central America (3 | 0.8%), Latin America (3 | 0.8%), and Mexico (3 | 0.8%), together accounting for 4.4% of all Odessa residents.
| Immigration Origin | # Population | % Population |
| Australia | 4 | 1.0% |
| Bulgaria | 2 | 0.5% |
| Central America | 3 | 0.8% |
| Eastern Europe | 2 | 0.5% |
| Europe | 2 | 0.5% |
| Latin America | 3 | 0.8% |
| Mexico | 3 | 0.8% |
| Oceania | 4 | 1.0% | View All 8 Rows |
Sex and Age in Odessa
Sex and Age in Odessa
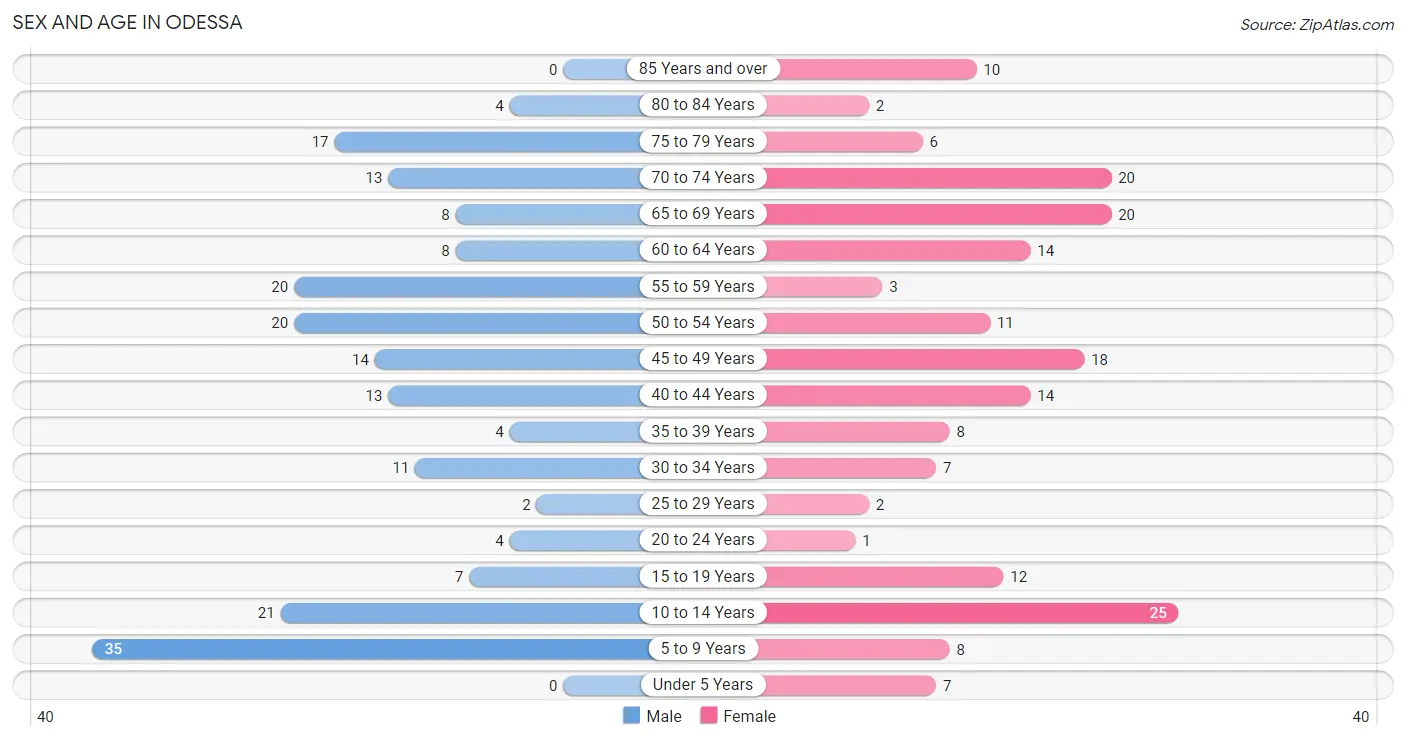
The most populous age groups in Odessa are 5 to 9 Years (35 | 17.4%) for men and 10 to 14 Years (25 | 13.3%) for women.
| Age Bracket | Male | Female |
| Under 5 Years | 0 (0.0%) | 7 (3.7%) |
| 5 to 9 Years | 35 (17.4%) | 8 (4.3%) |
| 10 to 14 Years | 21 (10.4%) | 25 (13.3%) |
| 15 to 19 Years | 7 (3.5%) | 12 (6.4%) |
| 20 to 24 Years | 4 (2.0%) | 1 (0.5%) |
| 25 to 29 Years | 2 (1.0%) | 2 (1.1%) |
| 30 to 34 Years | 11 (5.5%) | 7 (3.7%) |
| 35 to 39 Years | 4 (2.0%) | 8 (4.3%) |
| 40 to 44 Years | 13 (6.5%) | 14 (7.4%) |
| 45 to 49 Years | 14 (7.0%) | 18 (9.6%) |
| 50 to 54 Years | 20 (10.0%) | 11 (5.9%) |
| 55 to 59 Years | 20 (10.0%) | 3 (1.6%) |
| 60 to 64 Years | 8 (4.0%) | 14 (7.4%) |
| 65 to 69 Years | 8 (4.0%) | 20 (10.6%) |
| 70 to 74 Years | 13 (6.5%) | 20 (10.6%) |
| 75 to 79 Years | 17 (8.5%) | 6 (3.2%) |
| 80 to 84 Years | 4 (2.0%) | 2 (1.1%) |
| 85 Years and over | 0 (0.0%) | 10 (5.3%) |
| Total | 201 (100.0%) | 188 (100.0%) |
Families and Households in Odessa
Median Family Size in Odessa
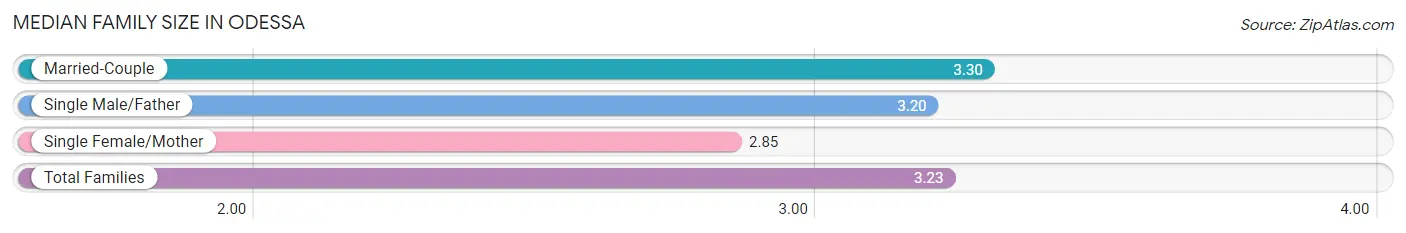
The median family size in Odessa is 3.23 persons per family, with married-couple families (77 | 77.0%) accounting for the largest median family size of 3.3 persons per family. On the other hand, single female/mother families (13 | 13.0%) represent the smallest median family size with 2.85 persons per family.
| Family Type | # Families | Family Size |
| Married-Couple | 77 (77.0%) | 3.30 |
| Single Male/Father | 10 (10.0%) | 3.20 |
| Single Female/Mother | 13 (13.0%) | 2.85 |
| Total Families | 100 (100.0%) | 3.23 |
Median Household Size in Odessa
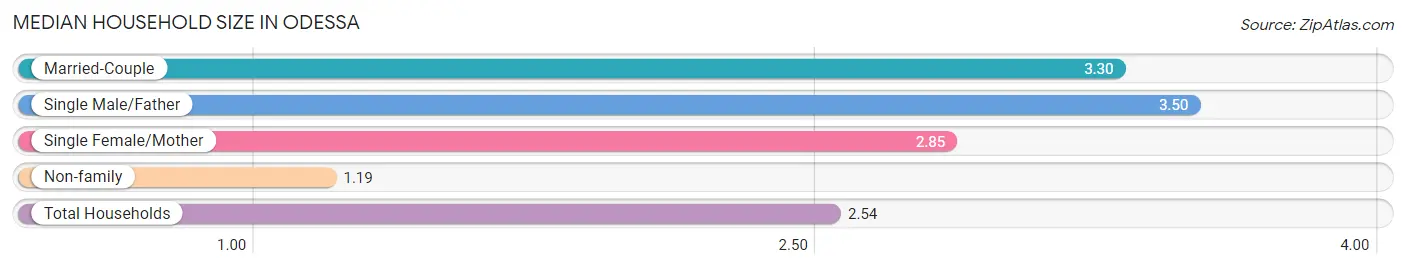
The median household size in Odessa is 2.54 persons per household, with single male/father households (10 | 6.5%) accounting for the largest median household size of 3.5 persons per household. non-family households (53 | 34.6%) represent the smallest median household size with 1.19 persons per household.
| Household Type | # Households | Household Size |
| Married-Couple | 77 (50.3%) | 3.30 |
| Single Male/Father | 10 (6.5%) | 3.50 |
| Single Female/Mother | 13 (8.5%) | 2.85 |
| Non-family | 53 (34.6%) | 1.19 |
| Total Households | 153 (100.0%) | 2.54 |
Household Size by Marriage Status in Odessa
Out of a total of 153 households in Odessa, 100 (65.4%) are family households, while 53 (34.6%) are nonfamily households. The most numerous type of family households are 2-person households, comprising 41, and the most common type of nonfamily households are 1-person households, comprising 44.
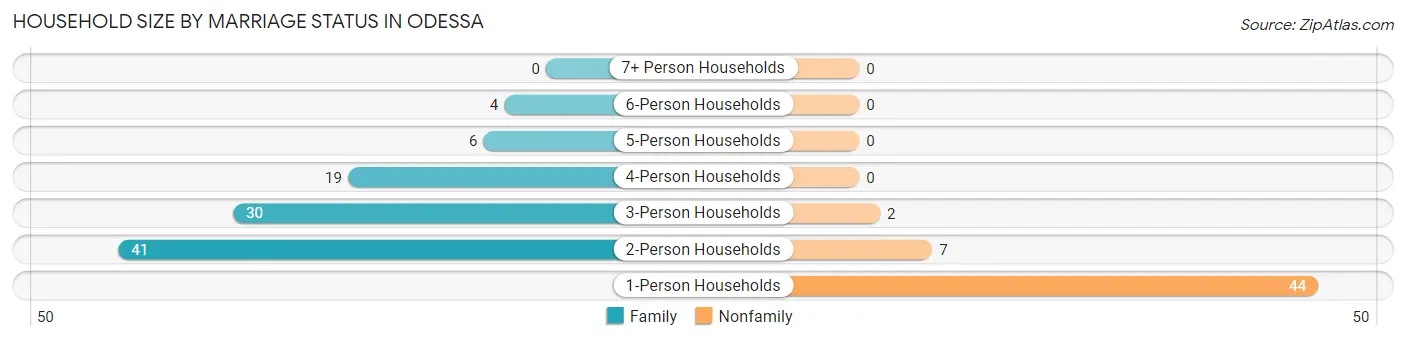
| Household Size | Family Households | Nonfamily Households |
| 1-Person Households | - | 44 (28.8%) |
| 2-Person Households | 41 (26.8%) | 7 (4.6%) |
| 3-Person Households | 30 (19.6%) | 2 (1.3%) |
| 4-Person Households | 19 (12.4%) | 0 (0.0%) |
| 5-Person Households | 6 (3.9%) | 0 (0.0%) |
| 6-Person Households | 4 (2.6%) | 0 (0.0%) |
| 7+ Person Households | 0 (0.0%) | 0 (0.0%) |
| Total | 100 (65.4%) | 53 (34.6%) |
Female Fertility in Odessa
Fertility by Age in Odessa
Average fertility rate in Odessa is 32.0 births per 1,000 women. Women in the age bracket of 20 to 34 years have the highest fertility rate with 200.0 births per 1,000 women. Women in the age bracket of 20 to 34 years acount for 100.0% of all women with births.
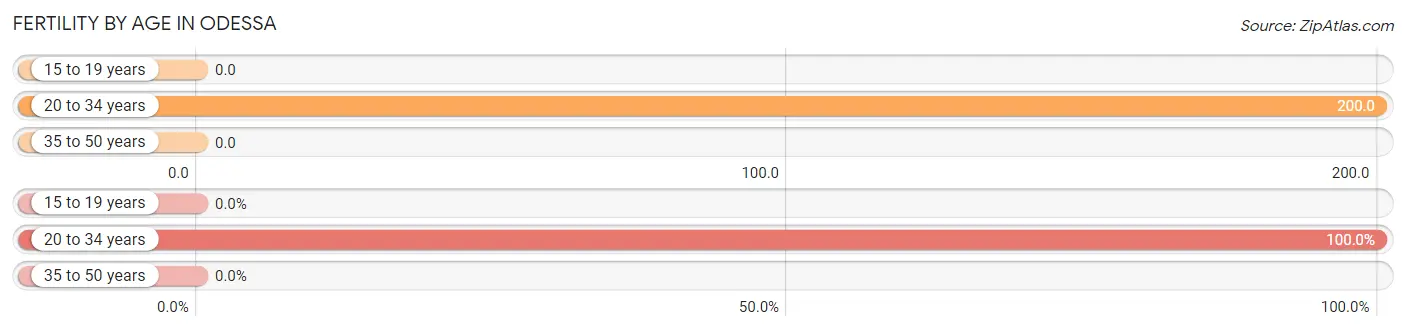
| Age Bracket | Women with Births | Births / 1,000 Women |
| 15 to 19 years | 0 (0.0%) | 0.0 |
| 20 to 34 years | 2 (100.0%) | 200.0 |
| 35 to 50 years | 0 (0.0%) | 0.0 |
| Total | 2 (100.0%) | 32.0 |
Fertility by Age by Marriage Status in Odessa
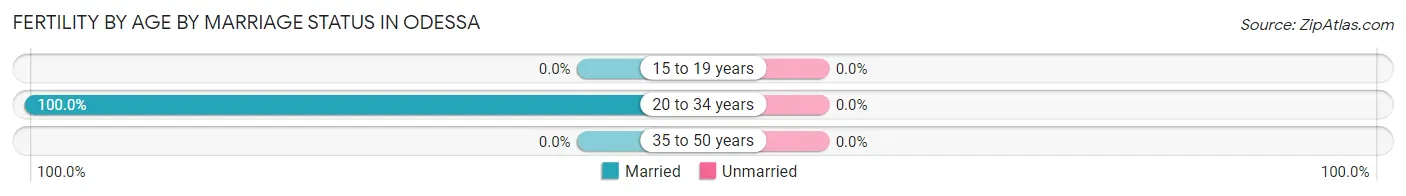
| Age Bracket | Married | Unmarried |
| 15 to 19 years | 0 (0.0%) | 0 (0.0%) |
| 20 to 34 years | 2 (100.0%) | 0 (0.0%) |
| 35 to 50 years | 0 (0.0%) | 0 (0.0%) |
| Total | 2 (100.0%) | 0 (0.0%) |
Fertility by Education in Odessa
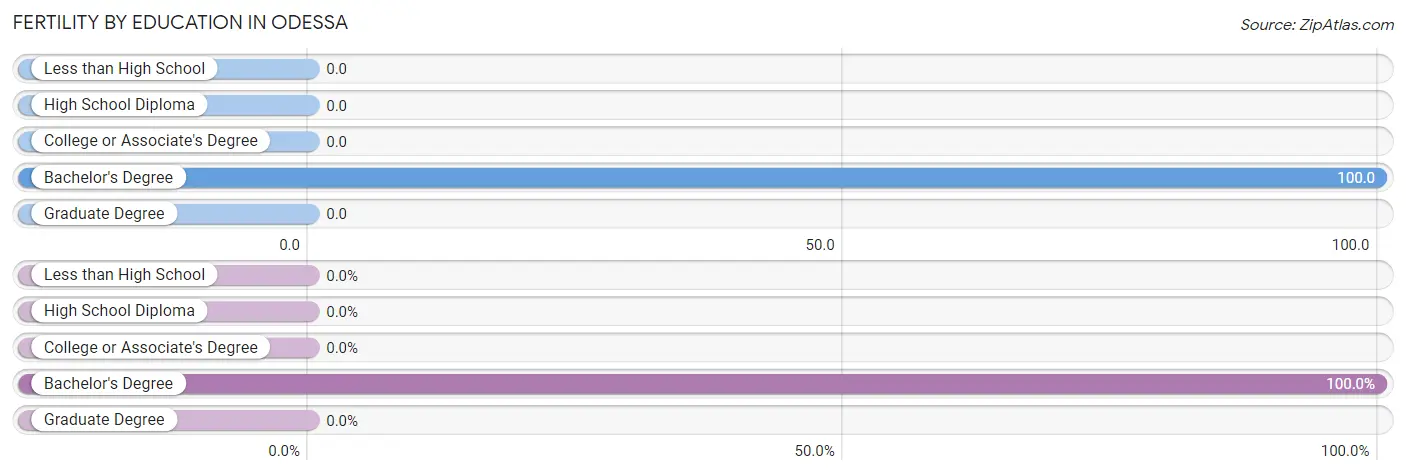
| Educational Attainment | Women with Births | Births / 1,000 Women |
| Less than High School | 0 (0.0%) | 0.0 |
| High School Diploma | 0 (0.0%) | 0.0 |
| College or Associate's Degree | 0 (0.0%) | 0.0 |
| Bachelor's Degree | 2 (100.0%) | 100.0 |
| Graduate Degree | 0 (0.0%) | 0.0 |
| Total | 2 (100.0%) | 32.0 |
Fertility by Education by Marriage Status in Odessa
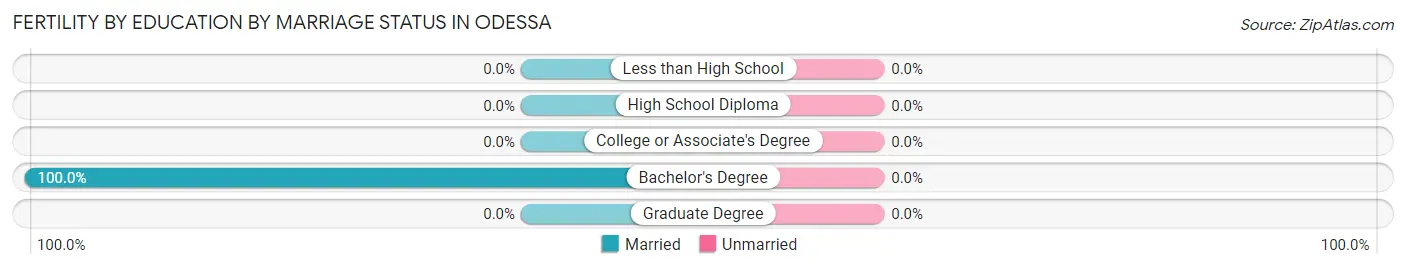
| Educational Attainment | Married | Unmarried |
| Less than High School | 0 (0.0%) | 0 (0.0%) |
| High School Diploma | 0 (0.0%) | 0 (0.0%) |
| College or Associate's Degree | 0 (0.0%) | 0 (0.0%) |
| Bachelor's Degree | 2 (100.0%) | 0 (0.0%) |
| Graduate Degree | 0 (0.0%) | 0 (0.0%) |
| Total | 2 (100.0%) | 0 (0.0%) |
Employment Characteristics in Odessa
Employment by Class of Employer in Odessa
Among the 164 employed individuals in Odessa, private company employees (84 | 51.2%), self-employed (incorporated) (26 | 15.9%), and not-for-profit organizations (16 | 9.8%) make up the most common classes of employment.
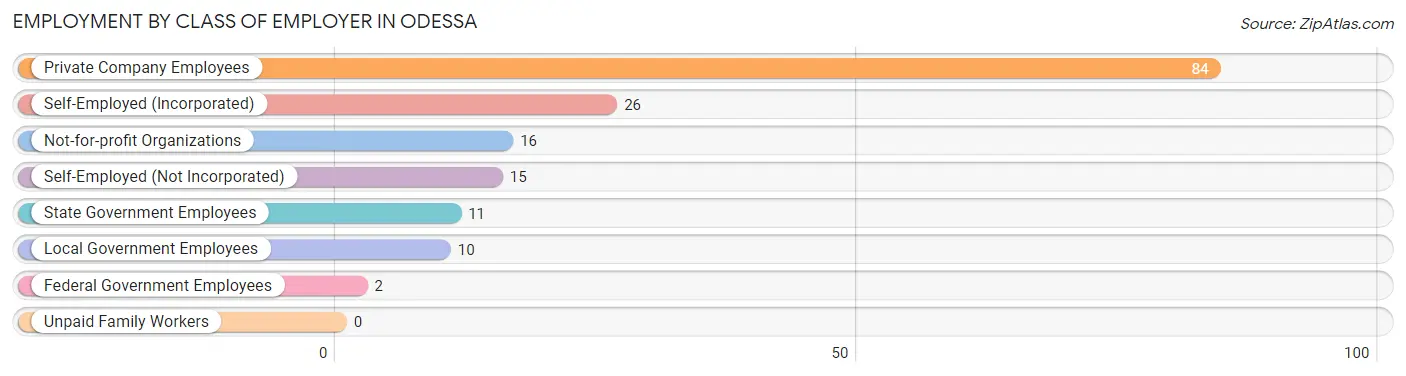
| Employer Class | # Employees | % Employees |
| Private Company Employees | 84 | 51.2% |
| Self-Employed (Incorporated) | 26 | 15.9% |
| Self-Employed (Not Incorporated) | 15 | 9.1% |
| Not-for-profit Organizations | 16 | 9.8% |
| Local Government Employees | 10 | 6.1% |
| State Government Employees | 11 | 6.7% |
| Federal Government Employees | 2 | 1.2% |
| Unpaid Family Workers | 0 | 0.0% |
| Total | 164 | 100.0% |
Employment Status by Age in Odessa
According to the labor force statistics for Odessa, out of the total population over 16 years of age (288), 58.0% or 167 individuals are in the labor force, with 0.6% or 1 of them unemployed. The age group with the highest labor force participation rate is 20 to 24 years, with 100.0% or 5 individuals in the labor force. Within the labor force, the 45 to 54 years age range has the highest percentage of unemployed individuals, with 2.0% or 1 of them being unemployed.
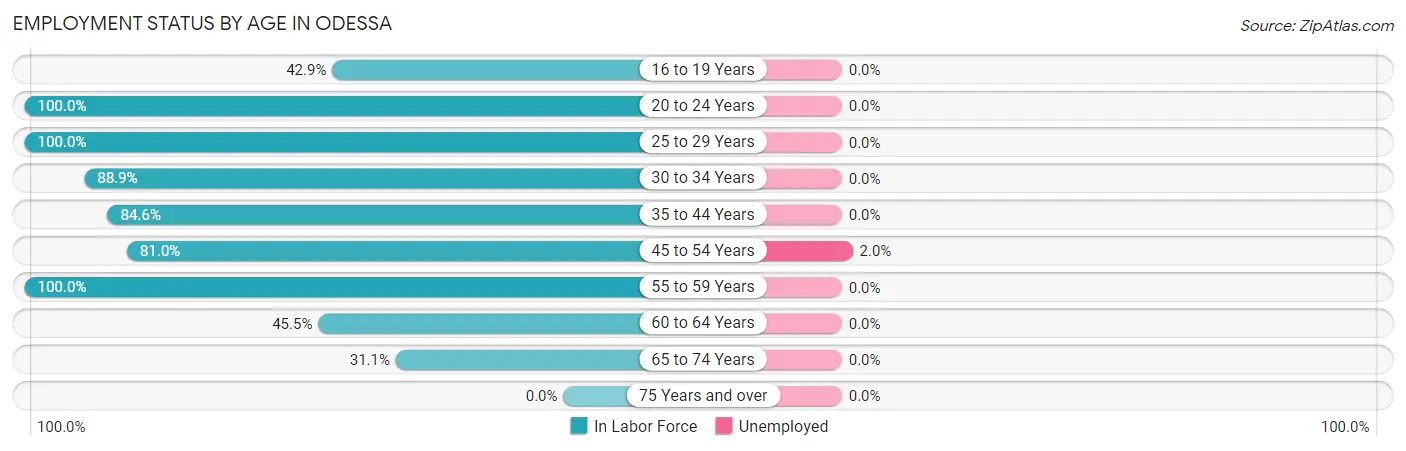
| Age Bracket | In Labor Force | Unemployed |
| 16 to 19 Years | 6 (42.9%) | 0 (0.0%) |
| 20 to 24 Years | 5 (100.0%) | 0 (0.0%) |
| 25 to 29 Years | 4 (100.0%) | 0 (0.0%) |
| 30 to 34 Years | 16 (88.9%) | 0 (0.0%) |
| 35 to 44 Years | 33 (84.6%) | 0 (0.0%) |
| 45 to 54 Years | 51 (81.0%) | 1 (2.0%) |
| 55 to 59 Years | 23 (100.0%) | 0 (0.0%) |
| 60 to 64 Years | 10 (45.5%) | 0 (0.0%) |
| 65 to 74 Years | 19 (31.1%) | 0 (0.0%) |
| 75 Years and over | 0 (0.0%) | 0 (0.0%) |
| Total | 167 (58.0%) | 1 (0.6%) |
Employment Status by Educational Attainment in Odessa
According to labor force statistics for Odessa, 81.1% of individuals (137) out of the total population between 25 and 64 years of age (169) are in the labor force, with 0.7% or 1 of them being unemployed. The group with the highest labor force participation rate are those with the educational attainment of bachelor's degree or higher, with 91.8% or 78 individuals in the labor force. Within the labor force, individuals with bachelor's degree or higher education have the highest percentage of unemployment, with 1.3% or 1 of them being unemployed.
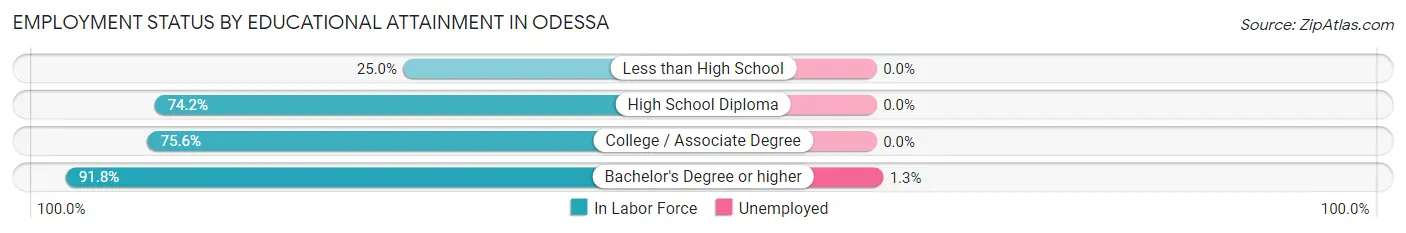
| Educational Attainment | In Labor Force | Unemployed |
| Less than High School | 2 (25.0%) | 0 (0.0%) |
| High School Diploma | 23 (74.2%) | 0 (0.0%) |
| College / Associate Degree | 34 (75.6%) | 0 (0.0%) |
| Bachelor's Degree or higher | 78 (91.8%) | 1 (1.3%) |
| Total | 137 (81.1%) | 1 (0.7%) |
Employment Occupations by Sex in Odessa
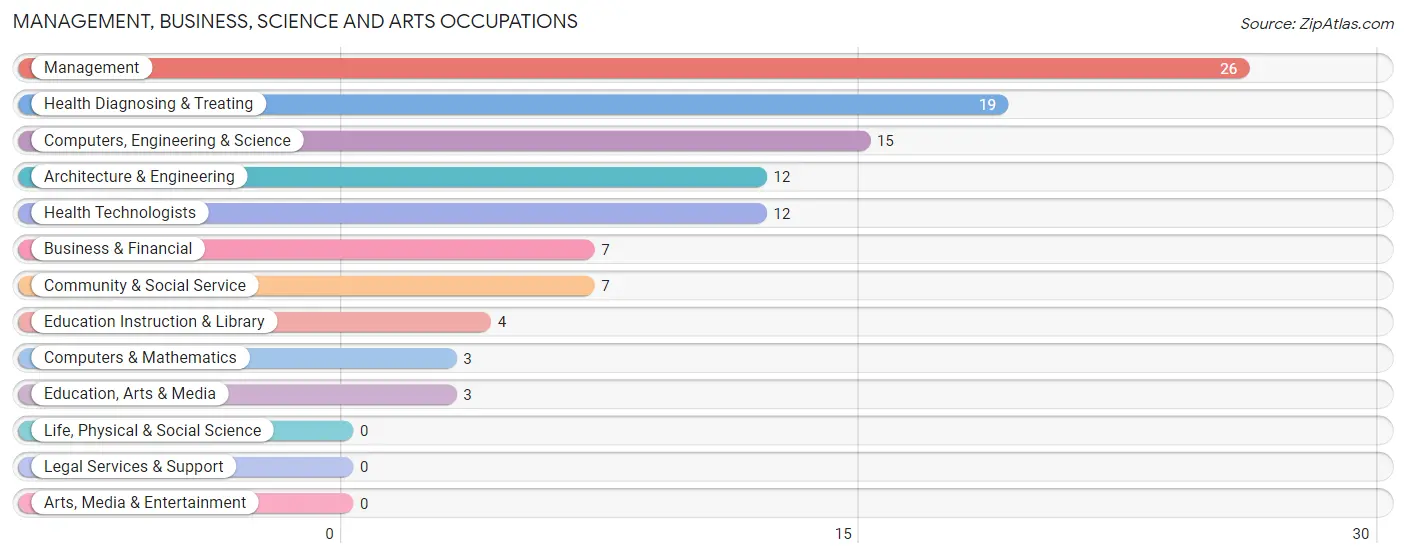
Management, Business, Science and Arts Occupations
The most common Management, Business, Science and Arts occupations in Odessa are Management (26 | 15.7%), Health Diagnosing & Treating (19 | 11.5%), Computers, Engineering & Science (15 | 9.0%), Architecture & Engineering (12 | 7.2%), and Health Technologists (12 | 7.2%).
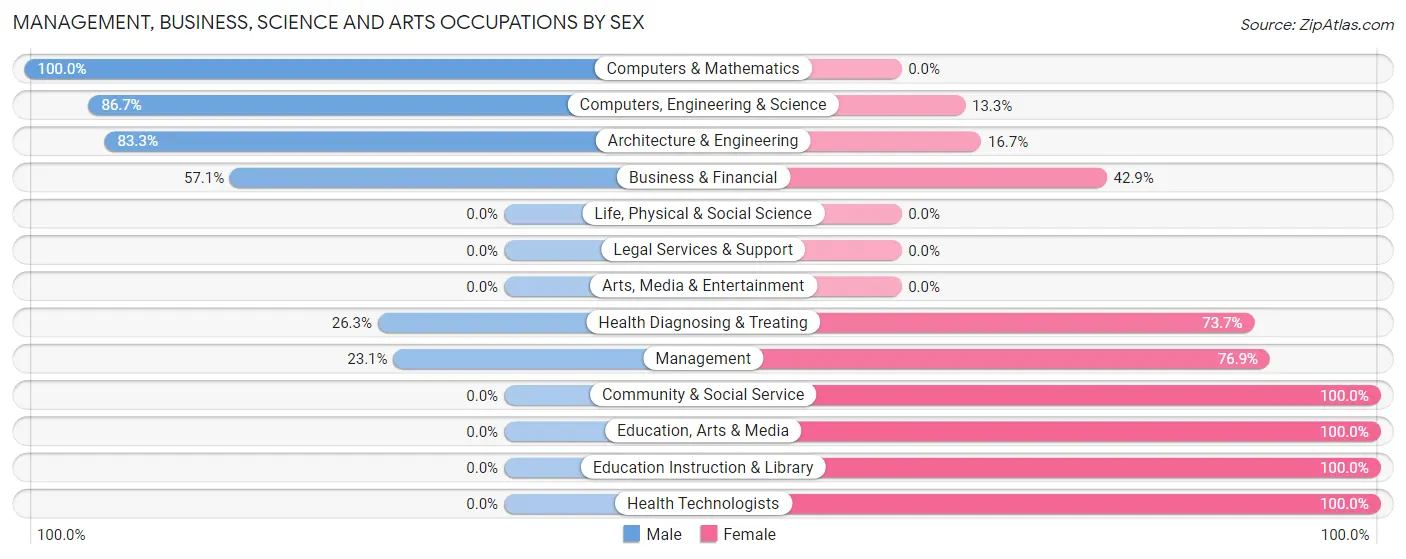
Management, Business, Science and Arts Occupations by Sex
Within the Management, Business, Science and Arts occupations in Odessa, the most male-oriented occupations are Computers & Mathematics (100.0%), Computers, Engineering & Science (86.7%), and Architecture & Engineering (83.3%), while the most female-oriented occupations are Community & Social Service (100.0%), Education, Arts & Media (100.0%), and Education Instruction & Library (100.0%).
| Occupation | Male | Female |
| Management | 6 (23.1%) | 20 (76.9%) |
| Business & Financial | 4 (57.1%) | 3 (42.9%) |
| Computers, Engineering & Science | 13 (86.7%) | 2 (13.3%) |
| Computers & Mathematics | 3 (100.0%) | 0 (0.0%) |
| Architecture & Engineering | 10 (83.3%) | 2 (16.7%) |
| Life, Physical & Social Science | 0 (0.0%) | 0 (0.0%) |
| Community & Social Service | 0 (0.0%) | 7 (100.0%) |
| Education, Arts & Media | 0 (0.0%) | 3 (100.0%) |
| Legal Services & Support | 0 (0.0%) | 0 (0.0%) |
| Education Instruction & Library | 0 (0.0%) | 4 (100.0%) |
| Arts, Media & Entertainment | 0 (0.0%) | 0 (0.0%) |
| Health Diagnosing & Treating | 5 (26.3%) | 14 (73.7%) |
| Health Technologists | 0 (0.0%) | 12 (100.0%) |
| Total (Category) | 28 (37.8%) | 46 (62.2%) |
| Total (Overall) | 95 (57.2%) | 71 (42.8%) |
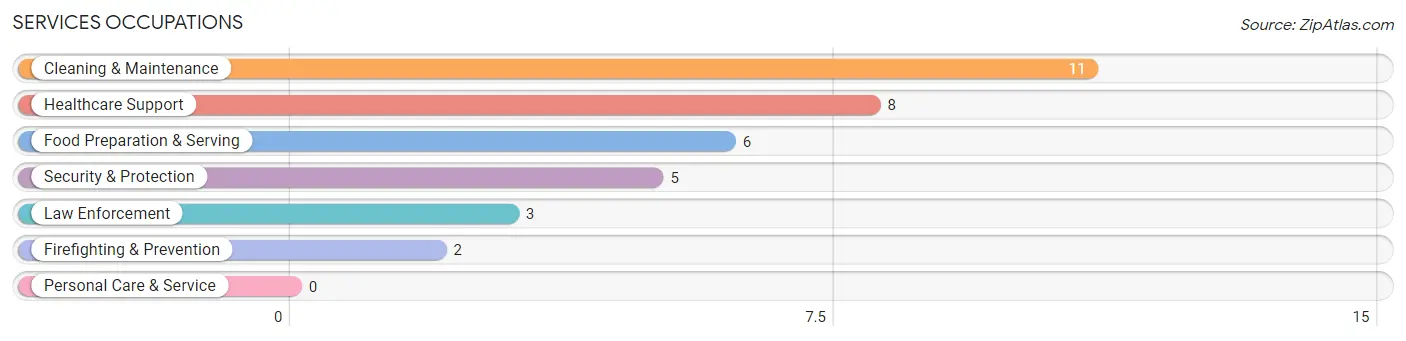
Services Occupations
The most common Services occupations in Odessa are Cleaning & Maintenance (11 | 6.6%), Healthcare Support (8 | 4.8%), Food Preparation & Serving (6 | 3.6%), Security & Protection (5 | 3.0%), and Law Enforcement (3 | 1.8%).
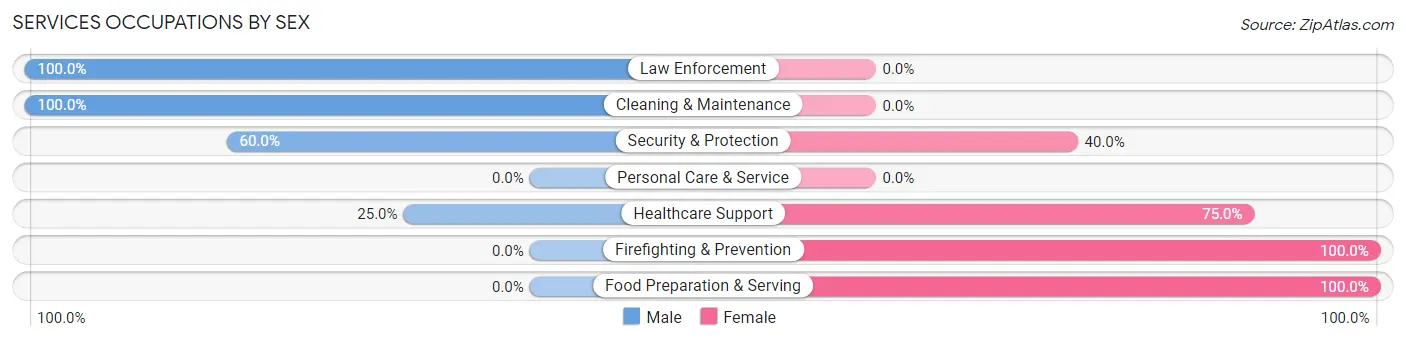
Services Occupations by Sex
Within the Services occupations in Odessa, the most male-oriented occupations are Law Enforcement (100.0%), Cleaning & Maintenance (100.0%), and Security & Protection (60.0%), while the most female-oriented occupations are Firefighting & Prevention (100.0%), Food Preparation & Serving (100.0%), and Healthcare Support (75.0%).
| Occupation | Male | Female |
| Healthcare Support | 2 (25.0%) | 6 (75.0%) |
| Security & Protection | 3 (60.0%) | 2 (40.0%) |
| Firefighting & Prevention | 0 (0.0%) | 2 (100.0%) |
| Law Enforcement | 3 (100.0%) | 0 (0.0%) |
| Food Preparation & Serving | 0 (0.0%) | 6 (100.0%) |
| Cleaning & Maintenance | 11 (100.0%) | 0 (0.0%) |
| Personal Care & Service | 0 (0.0%) | 0 (0.0%) |
| Total (Category) | 16 (53.3%) | 14 (46.7%) |
| Total (Overall) | 95 (57.2%) | 71 (42.8%) |
Sales and Office Occupations
The most common Sales and Office occupations in Odessa are Sales & Related (10 | 6.0%), and Office & Administration (6 | 3.6%).
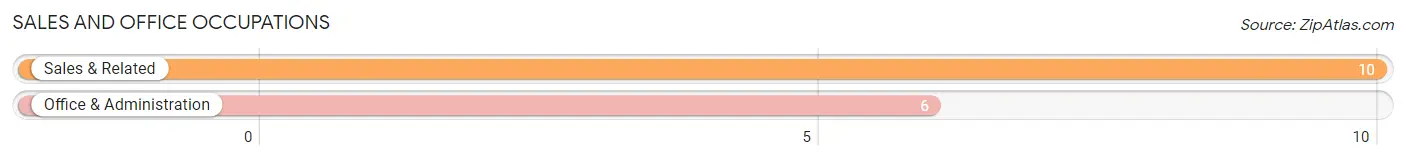
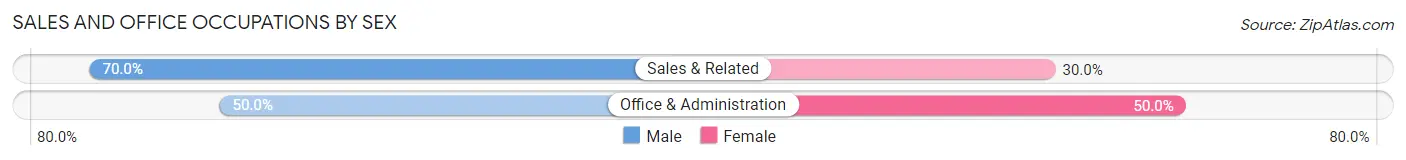
Sales and Office Occupations by Sex
| Occupation | Male | Female |
| Sales & Related | 7 (70.0%) | 3 (30.0%) |
| Office & Administration | 3 (50.0%) | 3 (50.0%) |
| Total (Category) | 10 (62.5%) | 6 (37.5%) |
| Total (Overall) | 95 (57.2%) | 71 (42.8%) |
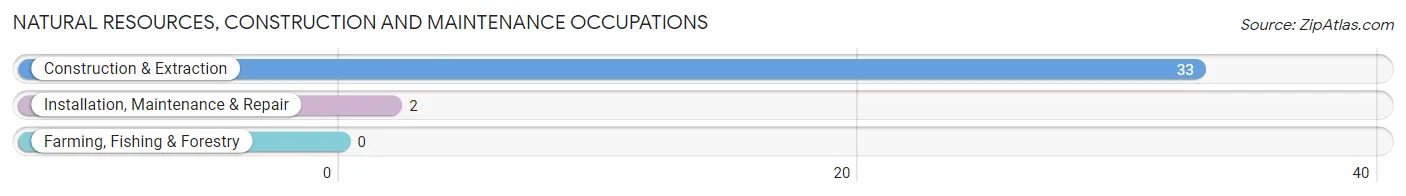
Natural Resources, Construction and Maintenance Occupations
The most common Natural Resources, Construction and Maintenance occupations in Odessa are Construction & Extraction (33 | 19.9%), and Installation, Maintenance & Repair (2 | 1.2%).
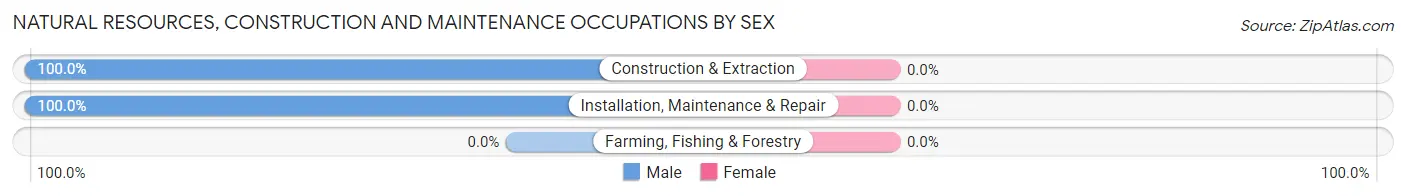
Natural Resources, Construction and Maintenance Occupations by Sex
| Occupation | Male | Female |
| Farming, Fishing & Forestry | 0 (0.0%) | 0 (0.0%) |
| Construction & Extraction | 33 (100.0%) | 0 (0.0%) |
| Installation, Maintenance & Repair | 2 (100.0%) | 0 (0.0%) |
| Total (Category) | 35 (100.0%) | 0 (0.0%) |
| Total (Overall) | 95 (57.2%) | 71 (42.8%) |
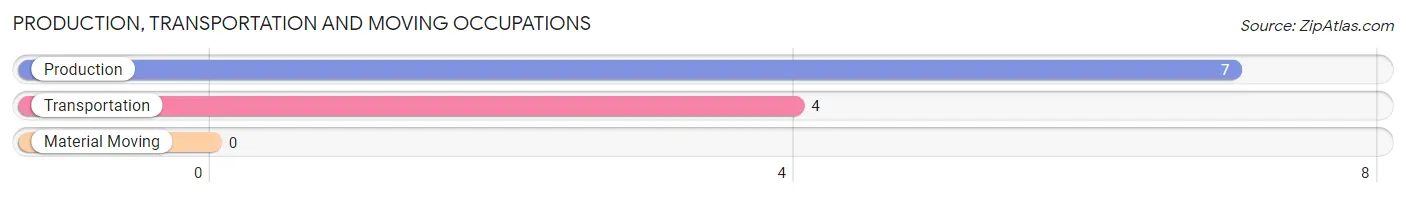
Production, Transportation and Moving Occupations
The most common Production, Transportation and Moving occupations in Odessa are Production (7 | 4.2%), and Transportation (4 | 2.4%).
Production, Transportation and Moving Occupations by Sex
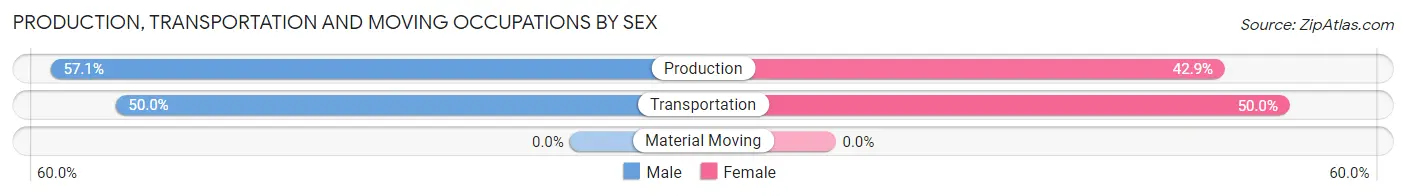
| Occupation | Male | Female |
| Production | 4 (57.1%) | 3 (42.9%) |
| Transportation | 2 (50.0%) | 2 (50.0%) |
| Material Moving | 0 (0.0%) | 0 (0.0%) |
| Total (Category) | 6 (54.5%) | 5 (45.5%) |
| Total (Overall) | 95 (57.2%) | 71 (42.8%) |
Employment Industries by Sex in Odessa
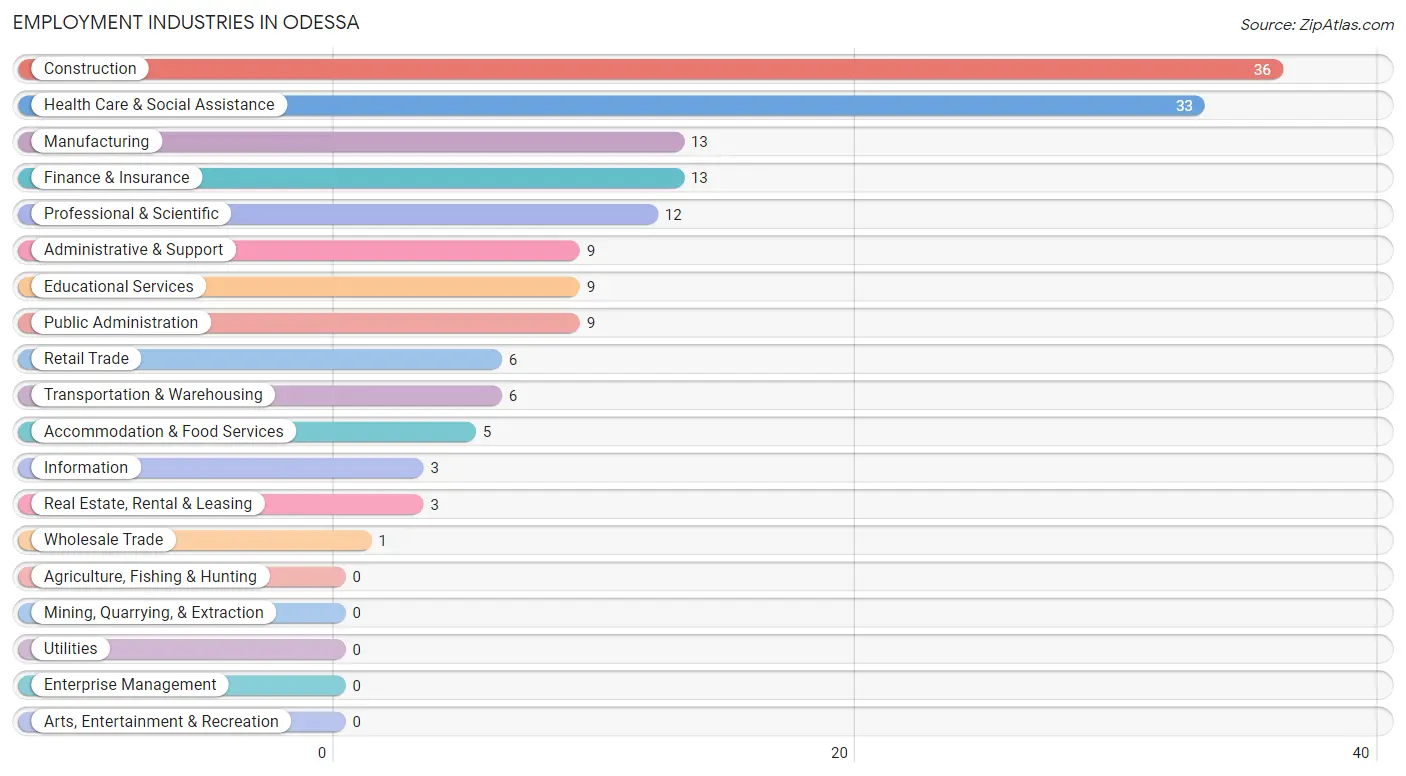
Employment Industries in Odessa
The major employment industries in Odessa include Construction (36 | 21.7%), Health Care & Social Assistance (33 | 19.9%), Manufacturing (13 | 7.8%), Finance & Insurance (13 | 7.8%), and Professional & Scientific (12 | 7.2%).
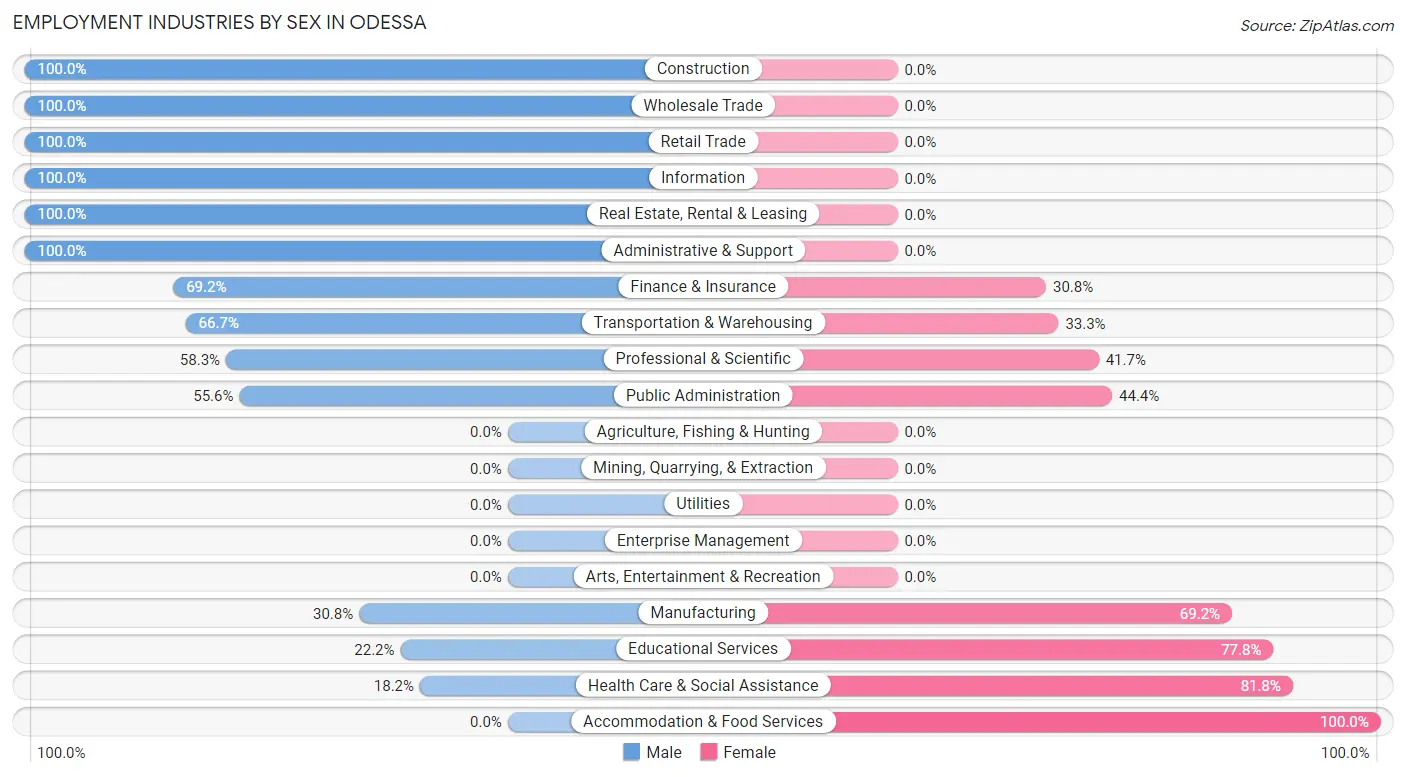
Employment Industries by Sex in Odessa
The Odessa industries that see more men than women are Construction (100.0%), Wholesale Trade (100.0%), and Retail Trade (100.0%), whereas the industries that tend to have a higher number of women are Accommodation & Food Services (100.0%), Health Care & Social Assistance (81.8%), and Educational Services (77.8%).
| Industry | Male | Female |
| Agriculture, Fishing & Hunting | 0 (0.0%) | 0 (0.0%) |
| Mining, Quarrying, & Extraction | 0 (0.0%) | 0 (0.0%) |
| Construction | 36 (100.0%) | 0 (0.0%) |
| Manufacturing | 4 (30.8%) | 9 (69.2%) |
| Wholesale Trade | 1 (100.0%) | 0 (0.0%) |
| Retail Trade | 6 (100.0%) | 0 (0.0%) |
| Transportation & Warehousing | 4 (66.7%) | 2 (33.3%) |
| Utilities | 0 (0.0%) | 0 (0.0%) |
| Information | 3 (100.0%) | 0 (0.0%) |
| Finance & Insurance | 9 (69.2%) | 4 (30.8%) |
| Real Estate, Rental & Leasing | 3 (100.0%) | 0 (0.0%) |
| Professional & Scientific | 7 (58.3%) | 5 (41.7%) |
| Enterprise Management | 0 (0.0%) | 0 (0.0%) |
| Administrative & Support | 9 (100.0%) | 0 (0.0%) |
| Educational Services | 2 (22.2%) | 7 (77.8%) |
| Health Care & Social Assistance | 6 (18.2%) | 27 (81.8%) |
| Arts, Entertainment & Recreation | 0 (0.0%) | 0 (0.0%) |
| Accommodation & Food Services | 0 (0.0%) | 5 (100.0%) |
| Public Administration | 5 (55.6%) | 4 (44.4%) |
| Total | 95 (57.2%) | 71 (42.8%) |
Education in Odessa
School Enrollment in Odessa
The most common levels of schooling among the 120 students in Odessa are elementary school (41 | 34.2%), middle school (32 | 26.7%), and high school (24 | 20.0%).
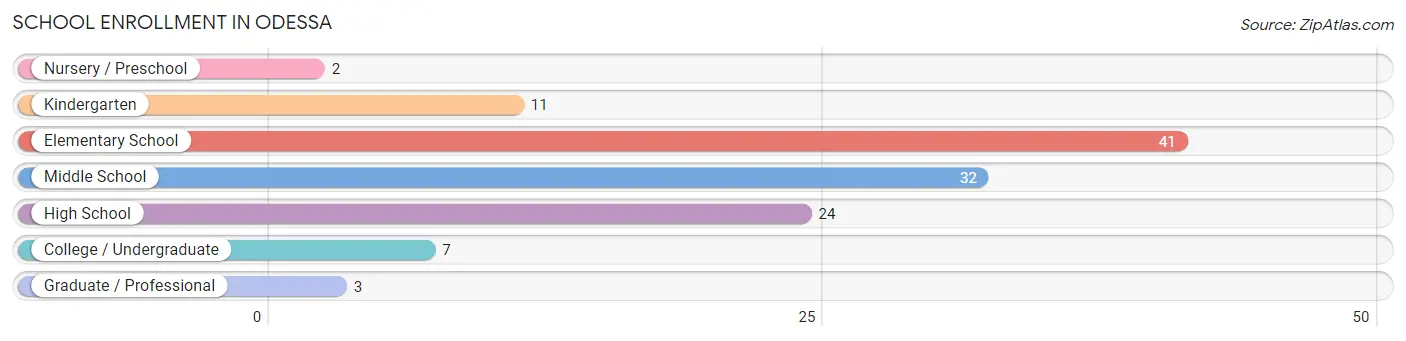
| School Level | # Students | % Students |
| Nursery / Preschool | 2 | 1.7% |
| Kindergarten | 11 | 9.2% |
| Elementary School | 41 | 34.2% |
| Middle School | 32 | 26.7% |
| High School | 24 | 20.0% |
| College / Undergraduate | 7 | 5.8% |
| Graduate / Professional | 3 | 2.5% |
| Total | 120 | 100.0% |
School Enrollment by Age by Funding Source in Odessa
Out of a total of 120 students who are enrolled in schools in Odessa, 8 (6.7%) attend a private institution, while the remaining 112 (93.3%) are enrolled in public schools. The age group of 3 to 4 year olds has the highest likelihood of being enrolled in private schools, with 2 (100.0% in the age bracket) enrolled. Conversely, the age group of 5 to 9 year old has the lowest likelihood of being enrolled in a private school, with 43 (100.0% in the age bracket) attending a public institution.
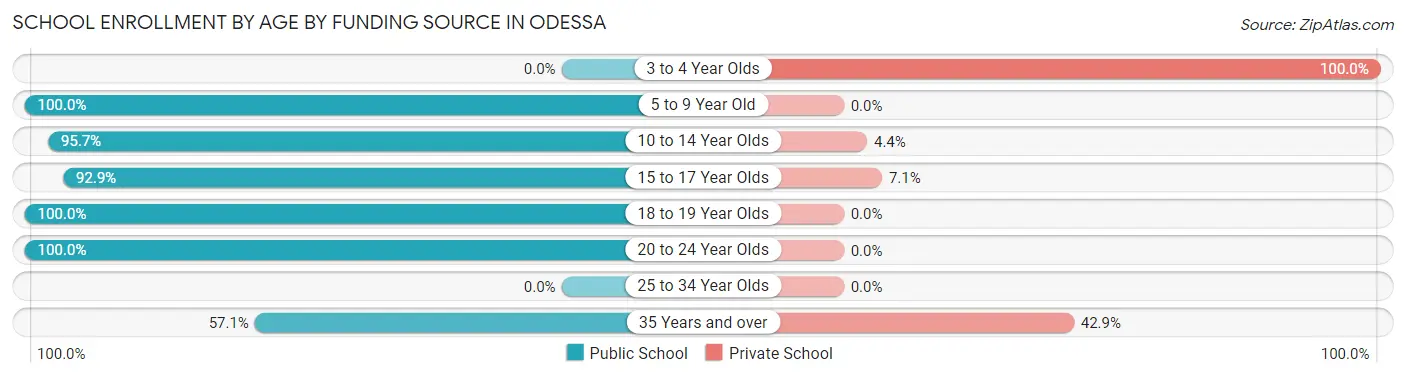
| Age Bracket | Public School | Private School |
| 3 to 4 Year Olds | 0 (0.0%) | 2 (100.0%) |
| 5 to 9 Year Old | 43 (100.0%) | 0 (0.0%) |
| 10 to 14 Year Olds | 44 (95.7%) | 2 (4.3%) |
| 15 to 17 Year Olds | 13 (92.9%) | 1 (7.1%) |
| 18 to 19 Year Olds | 5 (100.0%) | 0 (0.0%) |
| 20 to 24 Year Olds | 3 (100.0%) | 0 (0.0%) |
| 25 to 34 Year Olds | 0 (0.0%) | 0 (0.0%) |
| 35 Years and over | 4 (57.1%) | 3 (42.9%) |
| Total | 112 (93.3%) | 8 (6.7%) |
Educational Attainment by Field of Study in Odessa
Science & technology (24 | 18.3%), business (18 | 13.7%), engineering (17 | 13.0%), physical & health sciences (16 | 12.2%), and education (14 | 10.7%) are the most common fields of study among 131 individuals in Odessa who have obtained a bachelor's degree or higher.
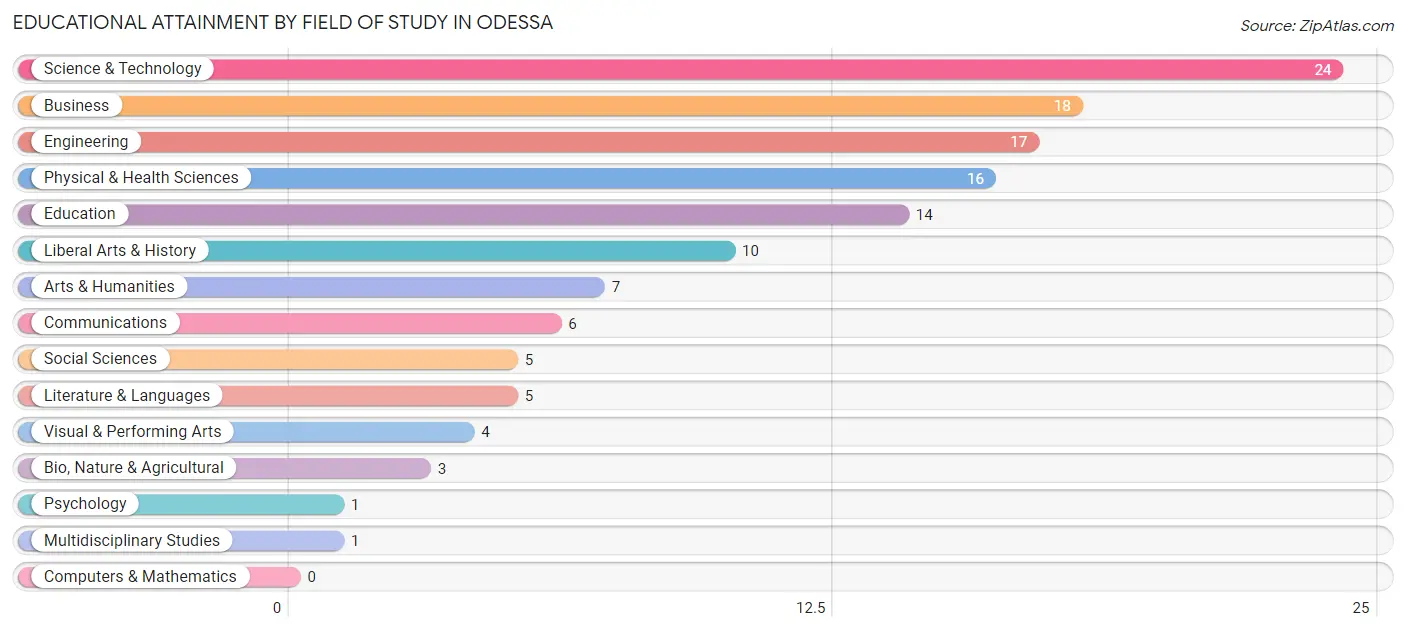
| Field of Study | # Graduates | % Graduates |
| Computers & Mathematics | 0 | 0.0% |
| Bio, Nature & Agricultural | 3 | 2.3% |
| Physical & Health Sciences | 16 | 12.2% |
| Psychology | 1 | 0.8% |
| Social Sciences | 5 | 3.8% |
| Engineering | 17 | 13.0% |
| Multidisciplinary Studies | 1 | 0.8% |
| Science & Technology | 24 | 18.3% |
| Business | 18 | 13.7% |
| Education | 14 | 10.7% |
| Literature & Languages | 5 | 3.8% |
| Liberal Arts & History | 10 | 7.6% |
| Visual & Performing Arts | 4 | 3.0% |
| Communications | 6 | 4.6% |
| Arts & Humanities | 7 | 5.3% |
| Total | 131 | 100.0% |
Transportation & Commute in Odessa
Vehicle Availability by Sex in Odessa
The most prevalent vehicle ownership categories in Odessa are males with 2 vehicles (63, accounting for 66.3%) and females with 2 vehicles (33, making up 91.3%).
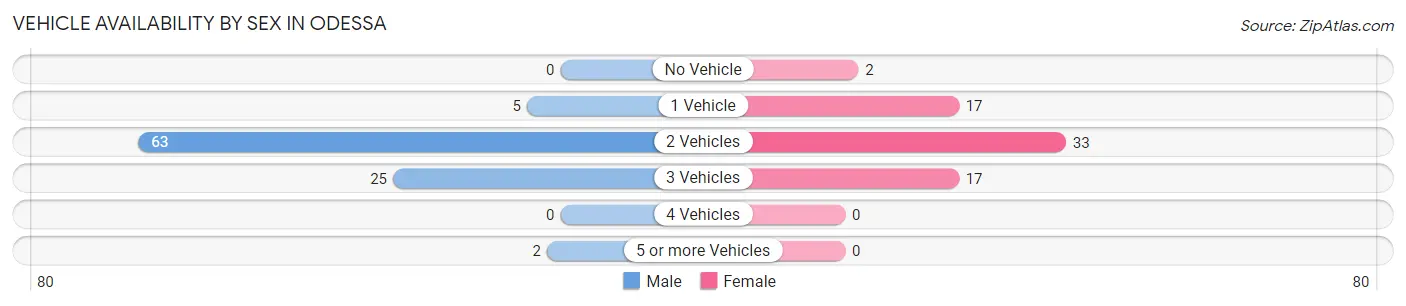
| Vehicles Available | Male | Female |
| No Vehicle | 0 (0.0%) | 2 (2.9%) |
| 1 Vehicle | 5 (5.3%) | 17 (24.6%) |
| 2 Vehicles | 63 (66.3%) | 33 (47.8%) |
| 3 Vehicles | 25 (26.3%) | 17 (24.6%) |
| 4 Vehicles | 0 (0.0%) | 0 (0.0%) |
| 5 or more Vehicles | 2 (2.1%) | 0 (0.0%) |
| Total | 95 (100.0%) | 69 (100.0%) |
Commute Time in Odessa
The most frequently occuring commute durations in Odessa are 30 to 34 minutes (38 commuters, 26.0%), 20 to 24 minutes (22 commuters, 15.1%), and 25 to 29 minutes (19 commuters, 13.0%).
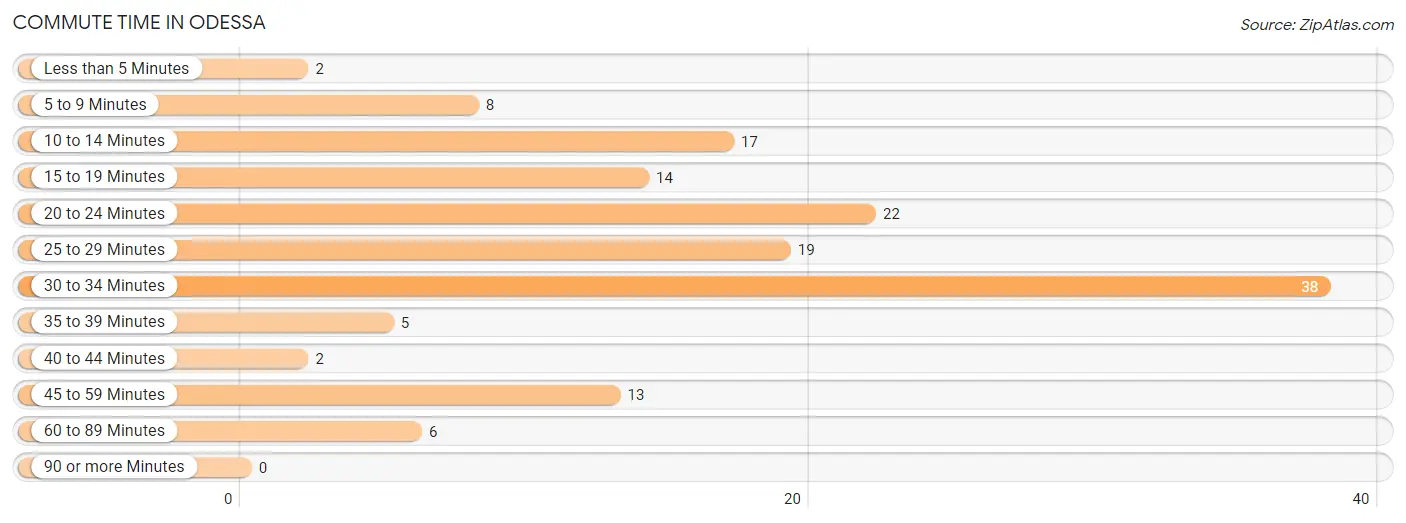
| Commute Time | # Commuters | % Commuters |
| Less than 5 Minutes | 2 | 1.4% |
| 5 to 9 Minutes | 8 | 5.5% |
| 10 to 14 Minutes | 17 | 11.6% |
| 15 to 19 Minutes | 14 | 9.6% |
| 20 to 24 Minutes | 22 | 15.1% |
| 25 to 29 Minutes | 19 | 13.0% |
| 30 to 34 Minutes | 38 | 26.0% |
| 35 to 39 Minutes | 5 | 3.4% |
| 40 to 44 Minutes | 2 | 1.4% |
| 45 to 59 Minutes | 13 | 8.9% |
| 60 to 89 Minutes | 6 | 4.1% |
| 90 or more Minutes | 0 | 0.0% |
Commute Time by Sex in Odessa
The most common commute times in Odessa are 30 to 34 minutes (22 commuters, 23.4%) for males and 30 to 34 minutes (16 commuters, 30.8%) for females.
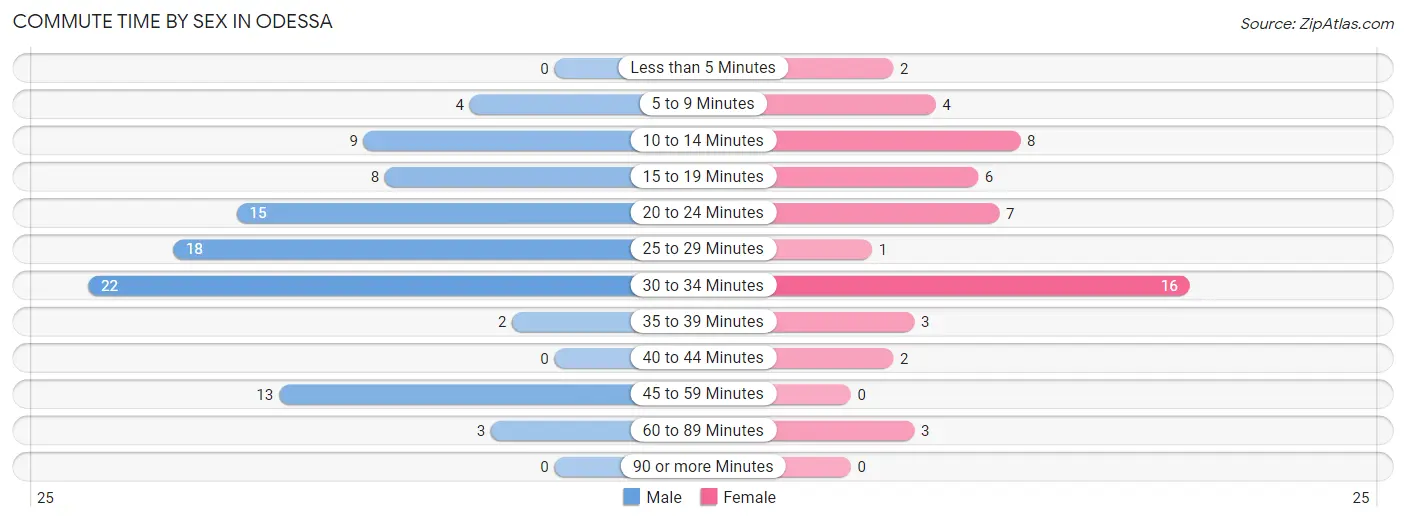
| Commute Time | Male | Female |
| Less than 5 Minutes | 0 (0.0%) | 2 (3.8%) |
| 5 to 9 Minutes | 4 (4.3%) | 4 (7.7%) |
| 10 to 14 Minutes | 9 (9.6%) | 8 (15.4%) |
| 15 to 19 Minutes | 8 (8.5%) | 6 (11.5%) |
| 20 to 24 Minutes | 15 (16.0%) | 7 (13.5%) |
| 25 to 29 Minutes | 18 (19.2%) | 1 (1.9%) |
| 30 to 34 Minutes | 22 (23.4%) | 16 (30.8%) |
| 35 to 39 Minutes | 2 (2.1%) | 3 (5.8%) |
| 40 to 44 Minutes | 0 (0.0%) | 2 (3.8%) |
| 45 to 59 Minutes | 13 (13.8%) | 0 (0.0%) |
| 60 to 89 Minutes | 3 (3.2%) | 3 (5.8%) |
| 90 or more Minutes | 0 (0.0%) | 0 (0.0%) |
Time of Departure to Work by Sex in Odessa
The most frequent times of departure to work in Odessa are 7:00 AM to 7:29 AM (29, 30.8%) for males and 7:30 AM to 7:59 AM (15, 28.8%) for females.
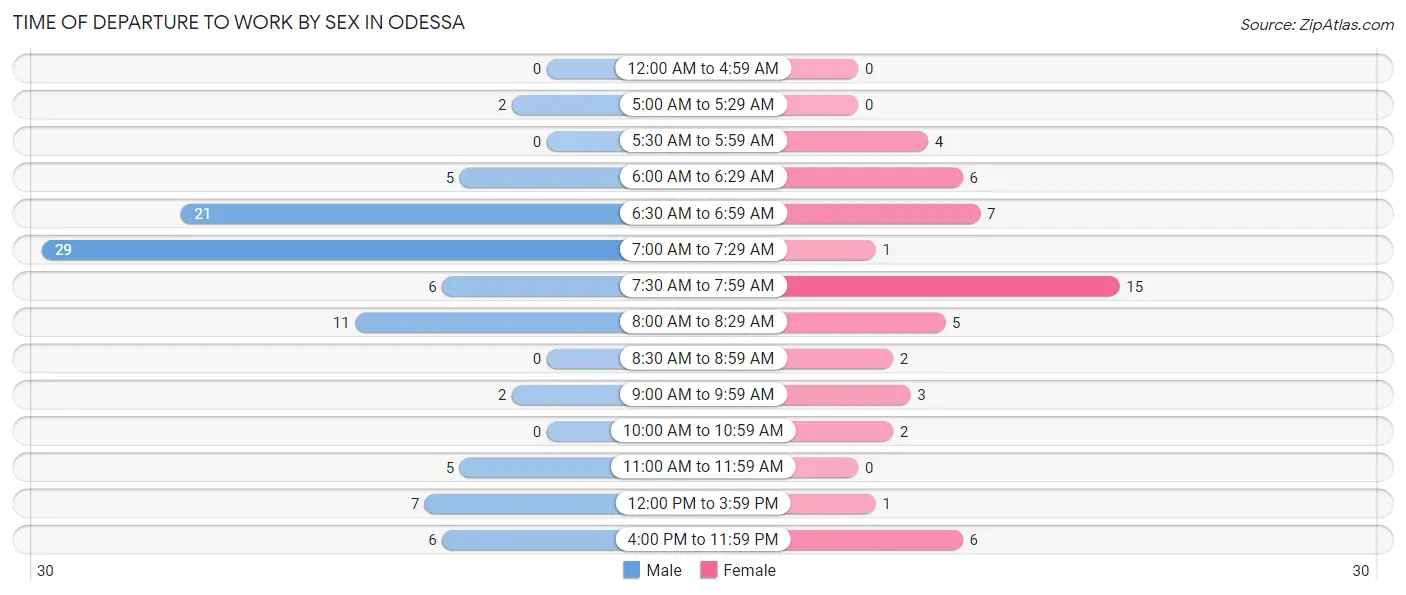
| Time of Departure | Male | Female |
| 12:00 AM to 4:59 AM | 0 (0.0%) | 0 (0.0%) |
| 5:00 AM to 5:29 AM | 2 (2.1%) | 0 (0.0%) |
| 5:30 AM to 5:59 AM | 0 (0.0%) | 4 (7.7%) |
| 6:00 AM to 6:29 AM | 5 (5.3%) | 6 (11.5%) |
| 6:30 AM to 6:59 AM | 21 (22.3%) | 7 (13.5%) |
| 7:00 AM to 7:29 AM | 29 (30.8%) | 1 (1.9%) |
| 7:30 AM to 7:59 AM | 6 (6.4%) | 15 (28.8%) |
| 8:00 AM to 8:29 AM | 11 (11.7%) | 5 (9.6%) |
| 8:30 AM to 8:59 AM | 0 (0.0%) | 2 (3.8%) |
| 9:00 AM to 9:59 AM | 2 (2.1%) | 3 (5.8%) |
| 10:00 AM to 10:59 AM | 0 (0.0%) | 2 (3.8%) |
| 11:00 AM to 11:59 AM | 5 (5.3%) | 0 (0.0%) |
| 12:00 PM to 3:59 PM | 7 (7.4%) | 1 (1.9%) |
| 4:00 PM to 11:59 PM | 6 (6.4%) | 6 (11.5%) |
| Total | 94 (100.0%) | 52 (100.0%) |
Housing Occupancy in Odessa
Occupancy by Ownership in Odessa
Of the total 153 dwellings in Odessa, owner-occupied units account for 134 (87.6%), while renter-occupied units make up 19 (12.4%).
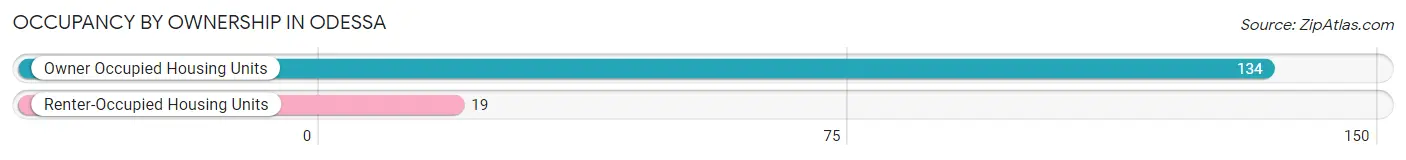
| Occupancy | # Housing Units | % Housing Units |
| Owner Occupied Housing Units | 134 | 87.6% |
| Renter-Occupied Housing Units | 19 | 12.4% |
| Total Occupied Housing Units | 153 | 100.0% |
Occupancy by Household Size in Odessa
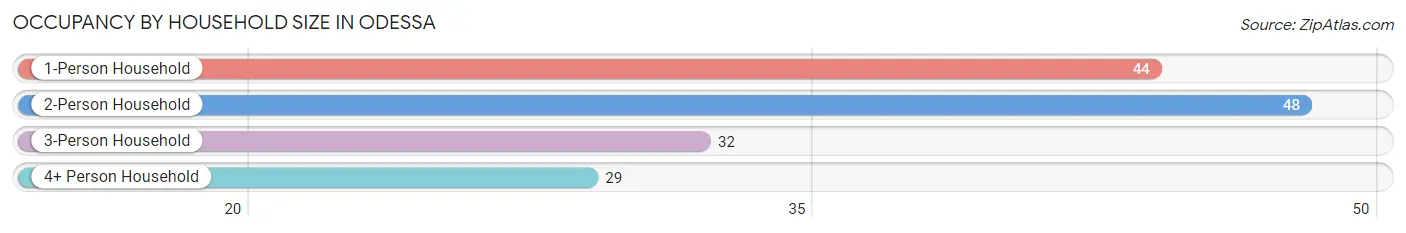
| Household Size | # Housing Units | % Housing Units |
| 1-Person Household | 44 | 28.8% |
| 2-Person Household | 48 | 31.4% |
| 3-Person Household | 32 | 20.9% |
| 4+ Person Household | 29 | 19.0% |
| Total Housing Units | 153 | 100.0% |
Occupancy by Ownership by Household Size in Odessa
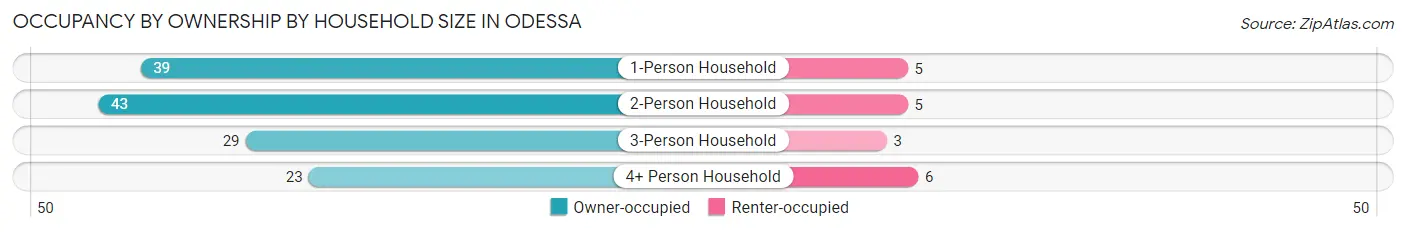
| Household Size | Owner-occupied | Renter-occupied |
| 1-Person Household | 39 (88.6%) | 5 (11.4%) |
| 2-Person Household | 43 (89.6%) | 5 (10.4%) |
| 3-Person Household | 29 (90.6%) | 3 (9.4%) |
| 4+ Person Household | 23 (79.3%) | 6 (20.7%) |
| Total Housing Units | 134 (87.6%) | 19 (12.4%) |
Occupancy by Educational Attainment in Odessa
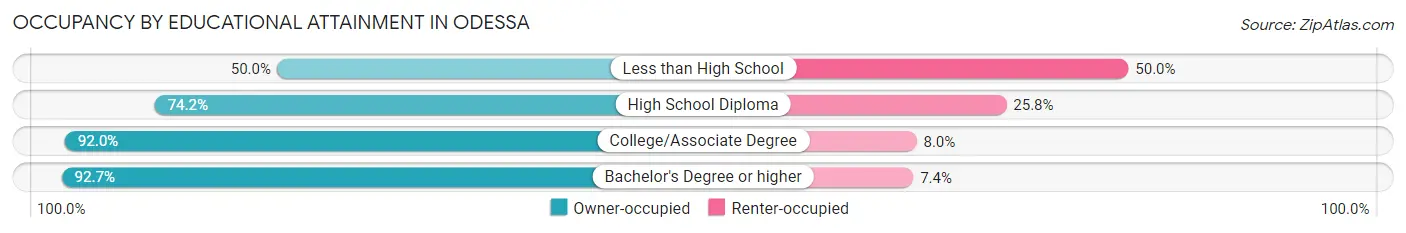
| Household Size | Owner-occupied | Renter-occupied |
| Less than High School | 2 (50.0%) | 2 (50.0%) |
| High School Diploma | 23 (74.2%) | 8 (25.8%) |
| College/Associate Degree | 46 (92.0%) | 4 (8.0%) |
| Bachelor's Degree or higher | 63 (92.6%) | 5 (7.3%) |
Occupancy by Age of Householder in Odessa
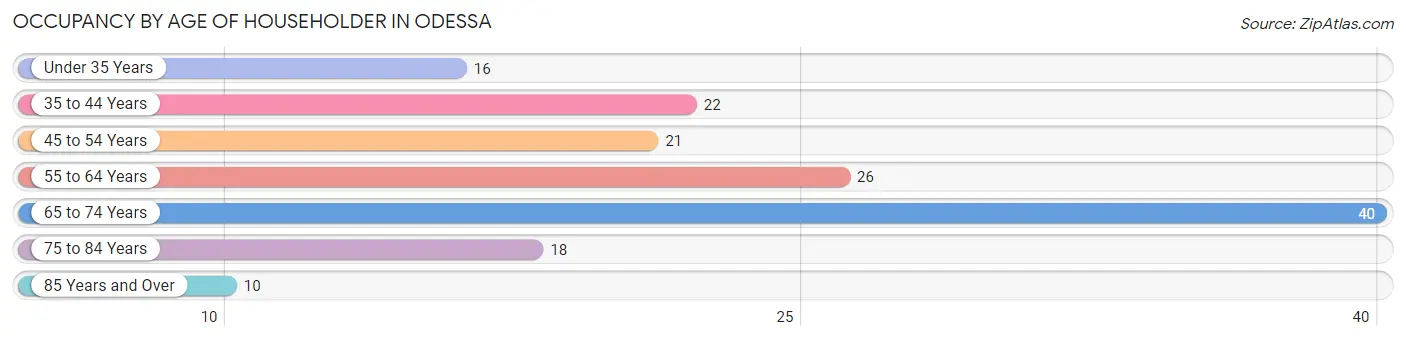
| Age Bracket | # Households | % Households |
| Under 35 Years | 16 | 10.5% |
| 35 to 44 Years | 22 | 14.4% |
| 45 to 54 Years | 21 | 13.7% |
| 55 to 64 Years | 26 | 17.0% |
| 65 to 74 Years | 40 | 26.1% |
| 75 to 84 Years | 18 | 11.8% |
| 85 Years and Over | 10 | 6.5% |
| Total | 153 | 100.0% |
Housing Finances in Odessa
Median Income by Occupancy in Odessa
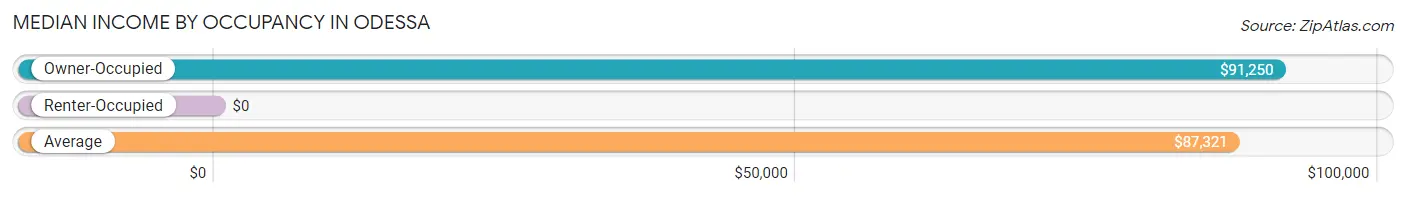
| Occupancy Type | # Households | Median Income |
| Owner-Occupied | 134 (87.6%) | $91,250 |
| Renter-Occupied | 19 (12.4%) | $0 |
| Average | 153 (100.0%) | $87,321 |
Occupancy by Householder Income Bracket in Odessa
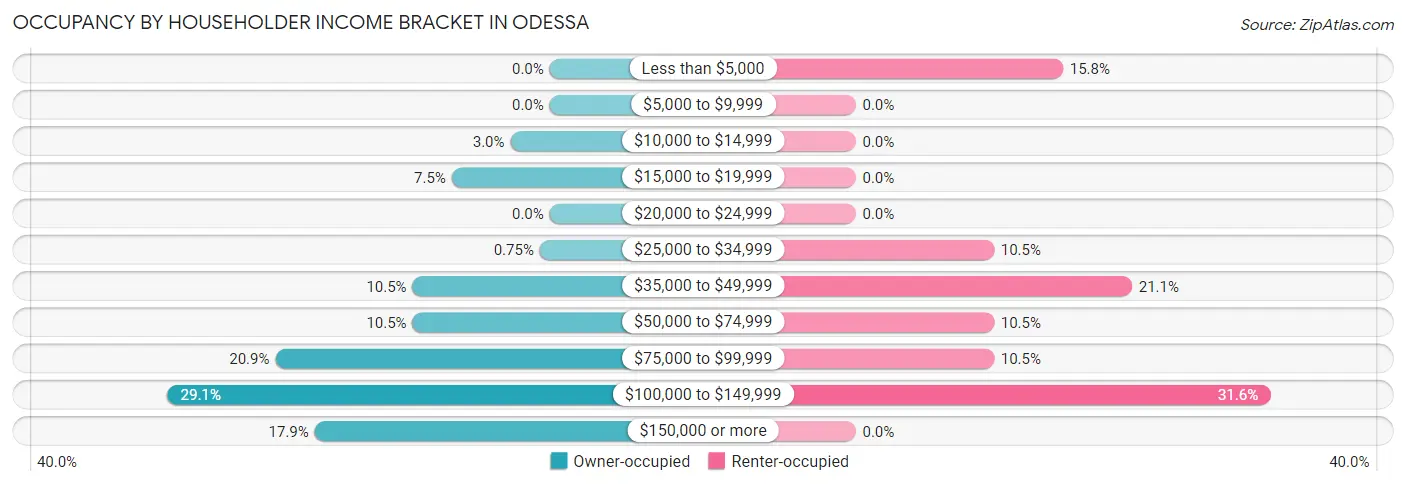
| Income Bracket | Owner-occupied | Renter-occupied |
| Less than $5,000 | 0 (0.0%) | 3 (15.8%) |
| $5,000 to $9,999 | 0 (0.0%) | 0 (0.0%) |
| $10,000 to $14,999 | 4 (3.0%) | 0 (0.0%) |
| $15,000 to $19,999 | 10 (7.5%) | 0 (0.0%) |
| $20,000 to $24,999 | 0 (0.0%) | 0 (0.0%) |
| $25,000 to $34,999 | 1 (0.7%) | 2 (10.5%) |
| $35,000 to $49,999 | 14 (10.4%) | 4 (21.0%) |
| $50,000 to $74,999 | 14 (10.4%) | 2 (10.5%) |
| $75,000 to $99,999 | 28 (20.9%) | 2 (10.5%) |
| $100,000 to $149,999 | 39 (29.1%) | 6 (31.6%) |
| $150,000 or more | 24 (17.9%) | 0 (0.0%) |
| Total | 134 (100.0%) | 19 (100.0%) |
Monthly Housing Cost Tiers in Odessa
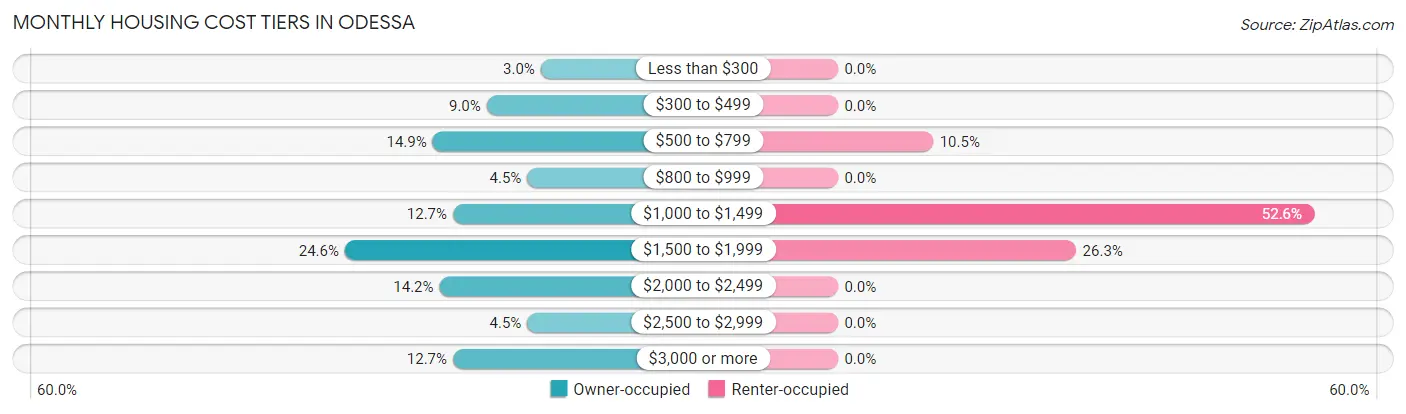
| Monthly Cost | Owner-occupied | Renter-occupied |
| Less than $300 | 4 (3.0%) | 0 (0.0%) |
| $300 to $499 | 12 (9.0%) | 0 (0.0%) |
| $500 to $799 | 20 (14.9%) | 2 (10.5%) |
| $800 to $999 | 6 (4.5%) | 0 (0.0%) |
| $1,000 to $1,499 | 17 (12.7%) | 10 (52.6%) |
| $1,500 to $1,999 | 33 (24.6%) | 5 (26.3%) |
| $2,000 to $2,499 | 19 (14.2%) | 0 (0.0%) |
| $2,500 to $2,999 | 6 (4.5%) | 0 (0.0%) |
| $3,000 or more | 17 (12.7%) | 0 (0.0%) |
| Total | 134 (100.0%) | 19 (100.0%) |
Physical Housing Characteristics in Odessa
Housing Structures in Odessa
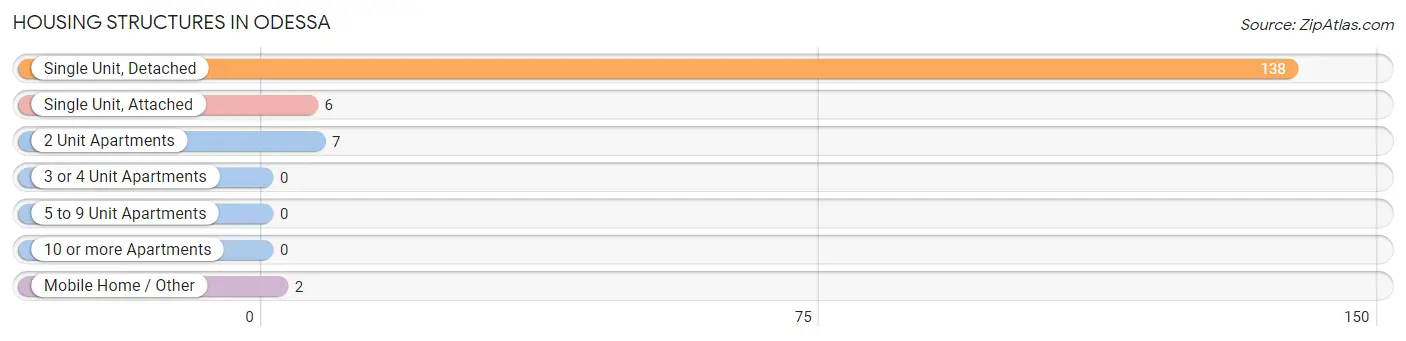
| Structure Type | # Housing Units | % Housing Units |
| Single Unit, Detached | 138 | 90.2% |
| Single Unit, Attached | 6 | 3.9% |
| 2 Unit Apartments | 7 | 4.6% |
| 3 or 4 Unit Apartments | 0 | 0.0% |
| 5 to 9 Unit Apartments | 0 | 0.0% |
| 10 or more Apartments | 0 | 0.0% |
| Mobile Home / Other | 2 | 1.3% |
| Total | 153 | 100.0% |
Housing Structures by Occupancy in Odessa
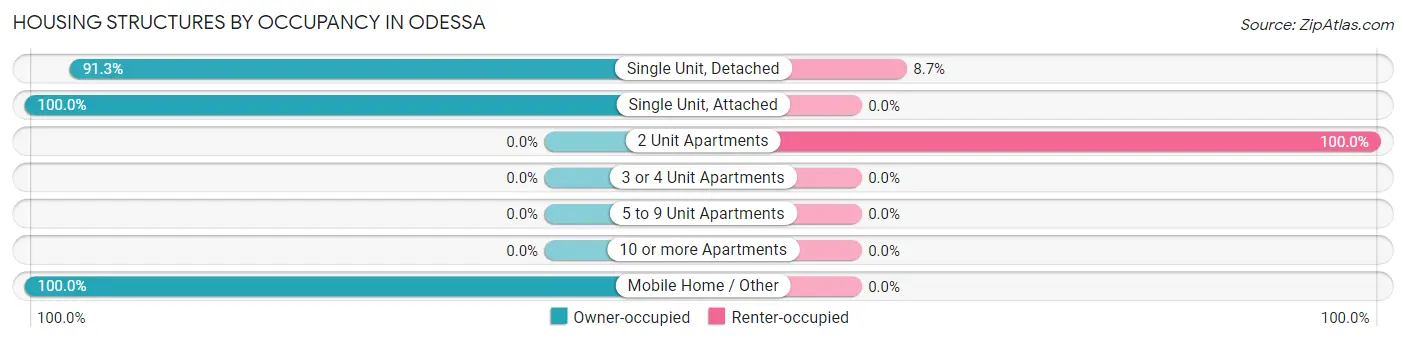
| Structure Type | Owner-occupied | Renter-occupied |
| Single Unit, Detached | 126 (91.3%) | 12 (8.7%) |
| Single Unit, Attached | 6 (100.0%) | 0 (0.0%) |
| 2 Unit Apartments | 0 (0.0%) | 7 (100.0%) |
| 3 or 4 Unit Apartments | 0 (0.0%) | 0 (0.0%) |
| 5 to 9 Unit Apartments | 0 (0.0%) | 0 (0.0%) |
| 10 or more Apartments | 0 (0.0%) | 0 (0.0%) |
| Mobile Home / Other | 2 (100.0%) | 0 (0.0%) |
| Total | 134 (87.6%) | 19 (12.4%) |
Housing Structures by Number of Rooms in Odessa
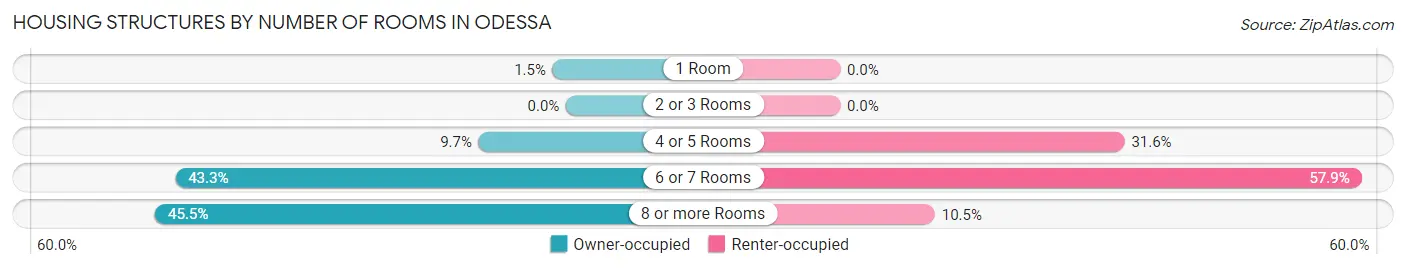
| Number of Rooms | Owner-occupied | Renter-occupied |
| 1 Room | 2 (1.5%) | 0 (0.0%) |
| 2 or 3 Rooms | 0 (0.0%) | 0 (0.0%) |
| 4 or 5 Rooms | 13 (9.7%) | 6 (31.6%) |
| 6 or 7 Rooms | 58 (43.3%) | 11 (57.9%) |
| 8 or more Rooms | 61 (45.5%) | 2 (10.5%) |
| Total | 134 (100.0%) | 19 (100.0%) |
Housing Structure by Heating Type in Odessa
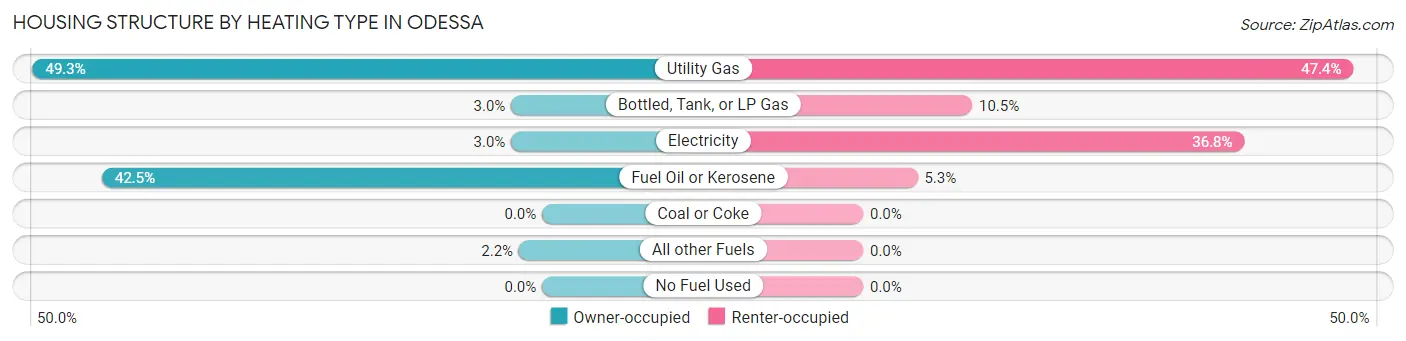
| Heating Type | Owner-occupied | Renter-occupied |
| Utility Gas | 66 (49.2%) | 9 (47.4%) |
| Bottled, Tank, or LP Gas | 4 (3.0%) | 2 (10.5%) |
| Electricity | 4 (3.0%) | 7 (36.8%) |
| Fuel Oil or Kerosene | 57 (42.5%) | 1 (5.3%) |
| Coal or Coke | 0 (0.0%) | 0 (0.0%) |
| All other Fuels | 3 (2.2%) | 0 (0.0%) |
| No Fuel Used | 0 (0.0%) | 0 (0.0%) |
| Total | 134 (100.0%) | 19 (100.0%) |
Household Vehicle Usage in Odessa
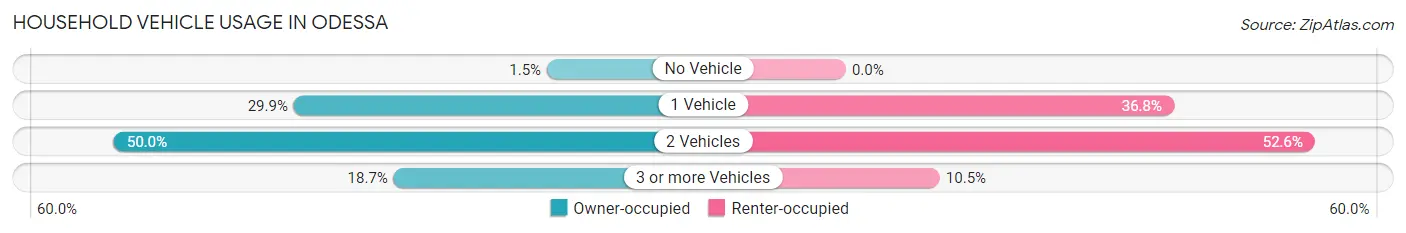
| Vehicles per Household | Owner-occupied | Renter-occupied |
| No Vehicle | 2 (1.5%) | 0 (0.0%) |
| 1 Vehicle | 40 (29.8%) | 7 (36.8%) |
| 2 Vehicles | 67 (50.0%) | 10 (52.6%) |
| 3 or more Vehicles | 25 (18.7%) | 2 (10.5%) |
| Total | 134 (100.0%) | 19 (100.0%) |
Real Estate & Mortgages in Odessa
Real Estate and Mortgage Overview in Odessa
| Characteristic | Without Mortgage | With Mortgage |
| Housing Units | 41 | 93 |
| Median Property Value | $289,300 | $346,300 |
| Median Household Income | - | - |
| Monthly Housing Costs | $556 | $17 |
| Real Estate Taxes | $2,107 | $4 |
Property Value by Mortgage Status in Odessa
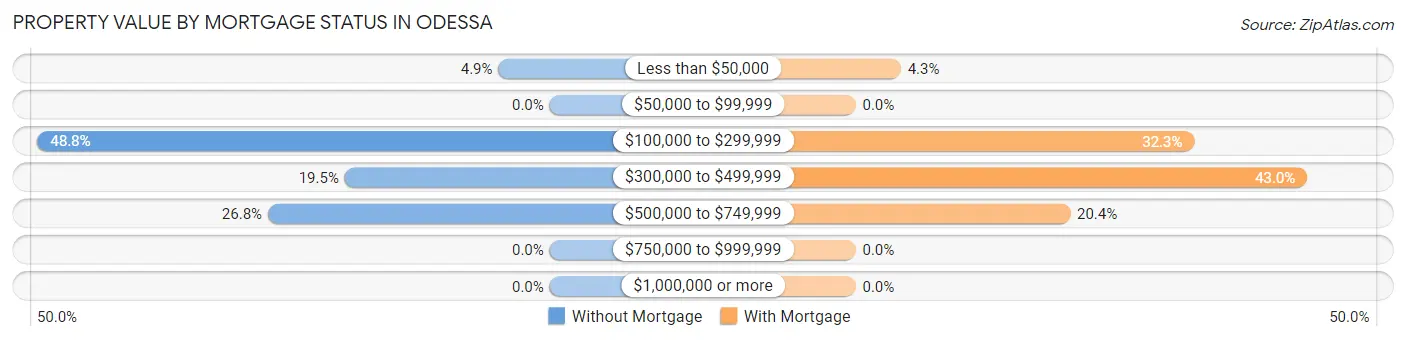
| Property Value | Without Mortgage | With Mortgage |
| Less than $50,000 | 2 (4.9%) | 4 (4.3%) |
| $50,000 to $99,999 | 0 (0.0%) | 0 (0.0%) |
| $100,000 to $299,999 | 20 (48.8%) | 30 (32.3%) |
| $300,000 to $499,999 | 8 (19.5%) | 40 (43.0%) |
| $500,000 to $749,999 | 11 (26.8%) | 19 (20.4%) |
| $750,000 to $999,999 | 0 (0.0%) | 0 (0.0%) |
| $1,000,000 or more | 0 (0.0%) | 0 (0.0%) |
| Total | 41 (100.0%) | 93 (100.0%) |
Household Income by Mortgage Status in Odessa
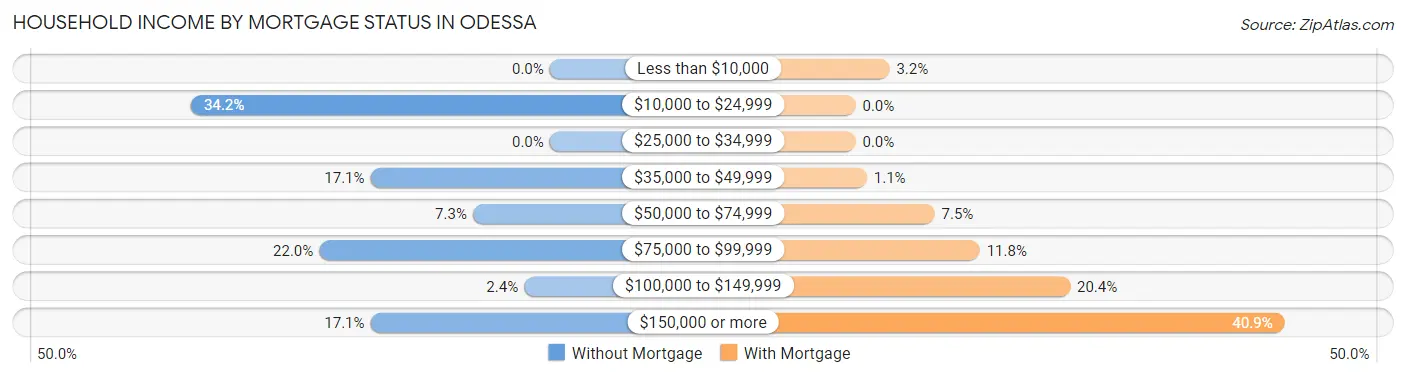
| Household Income | Without Mortgage | With Mortgage |
| Less than $10,000 | 0 (0.0%) | 3 (3.2%) |
| $10,000 to $24,999 | 14 (34.2%) | 0 (0.0%) |
| $25,000 to $34,999 | 0 (0.0%) | 0 (0.0%) |
| $35,000 to $49,999 | 7 (17.1%) | 1 (1.1%) |
| $50,000 to $74,999 | 3 (7.3%) | 7 (7.5%) |
| $75,000 to $99,999 | 9 (22.0%) | 11 (11.8%) |
| $100,000 to $149,999 | 1 (2.4%) | 19 (20.4%) |
| $150,000 or more | 7 (17.1%) | 38 (40.9%) |
| Total | 41 (100.0%) | 93 (100.0%) |
Property Value to Household Income Ratio in Odessa
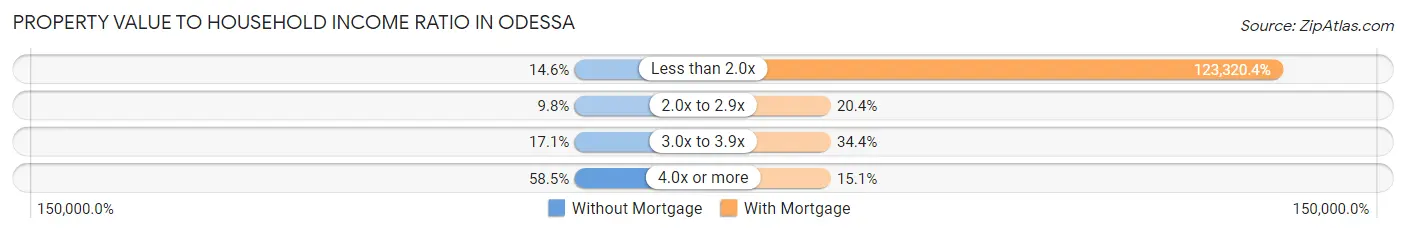
| Value-to-Income Ratio | Without Mortgage | With Mortgage |
| Less than 2.0x | 6 (14.6%) | 114,688 (123,320.4%) |
| 2.0x to 2.9x | 4 (9.8%) | 19 (20.4%) |
| 3.0x to 3.9x | 7 (17.1%) | 32 (34.4%) |
| 4.0x or more | 24 (58.5%) | 14 (15.0%) |
| Total | 41 (100.0%) | 93 (100.0%) |
Real Estate Taxes by Mortgage Status in Odessa
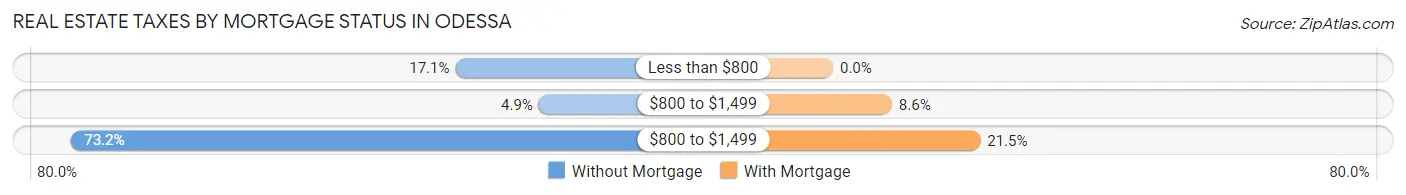
| Property Taxes | Without Mortgage | With Mortgage |
| Less than $800 | 7 (17.1%) | 0 (0.0%) |
| $800 to $1,499 | 2 (4.9%) | 8 (8.6%) |
| $800 to $1,499 | 30 (73.2%) | 20 (21.5%) |
| Total | 41 (100.0%) | 93 (100.0%) |
Health & Disability in Odessa
Health Insurance Coverage by Age in Odessa
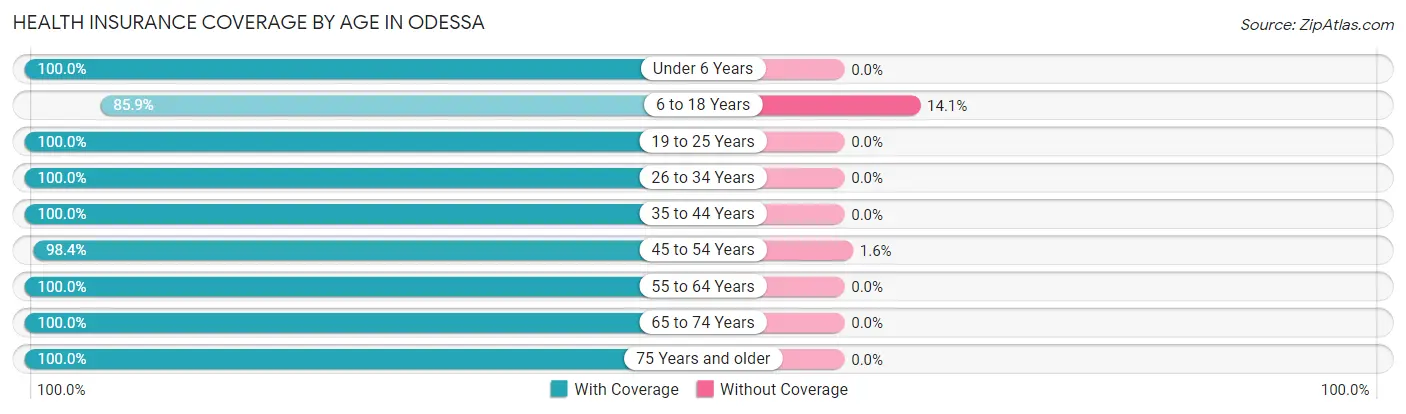
| Age Bracket | With Coverage | Without Coverage |
| Under 6 Years | 14 (100.0%) | 0 (0.0%) |
| 6 to 18 Years | 85 (85.9%) | 14 (14.1%) |
| 19 to 25 Years | 7 (100.0%) | 0 (0.0%) |
| 26 to 34 Years | 22 (100.0%) | 0 (0.0%) |
| 35 to 44 Years | 39 (100.0%) | 0 (0.0%) |
| 45 to 54 Years | 62 (98.4%) | 1 (1.6%) |
| 55 to 64 Years | 45 (100.0%) | 0 (0.0%) |
| 65 to 74 Years | 61 (100.0%) | 0 (0.0%) |
| 75 Years and older | 39 (100.0%) | 0 (0.0%) |
| Total | 374 (96.1%) | 15 (3.9%) |
Health Insurance Coverage by Citizenship Status in Odessa
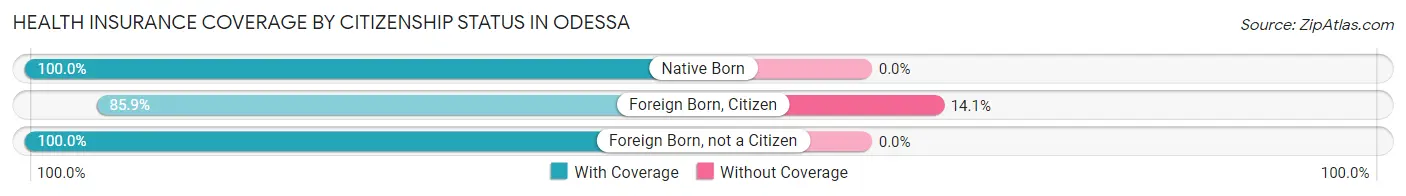
| Citizenship Status | With Coverage | Without Coverage |
| Native Born | 14 (100.0%) | 0 (0.0%) |
| Foreign Born, Citizen | 85 (85.9%) | 14 (14.1%) |
| Foreign Born, not a Citizen | 7 (100.0%) | 0 (0.0%) |
Health Insurance Coverage by Household Income in Odessa
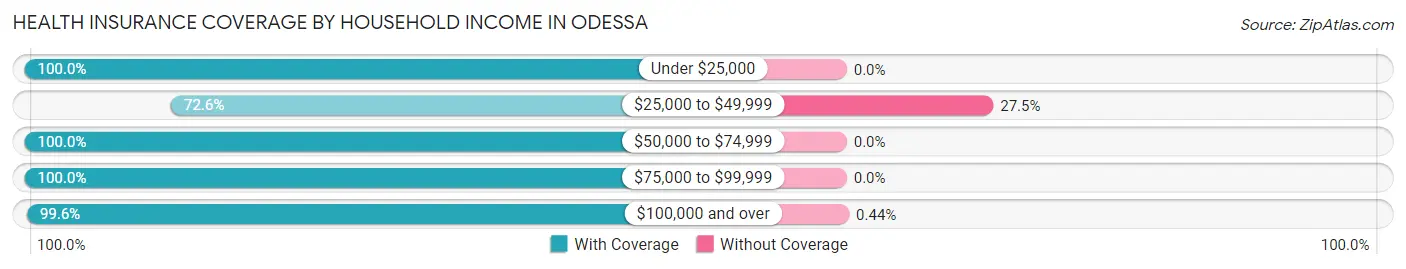
| Household Income | With Coverage | Without Coverage |
| Under $25,000 | 17 (100.0%) | 0 (0.0%) |
| $25,000 to $49,999 | 37 (72.6%) | 14 (27.5%) |
| $50,000 to $74,999 | 39 (100.0%) | 0 (0.0%) |
| $75,000 to $99,999 | 55 (100.0%) | 0 (0.0%) |
| $100,000 and over | 226 (99.6%) | 1 (0.4%) |
Public vs Private Health Insurance Coverage by Age in Odessa
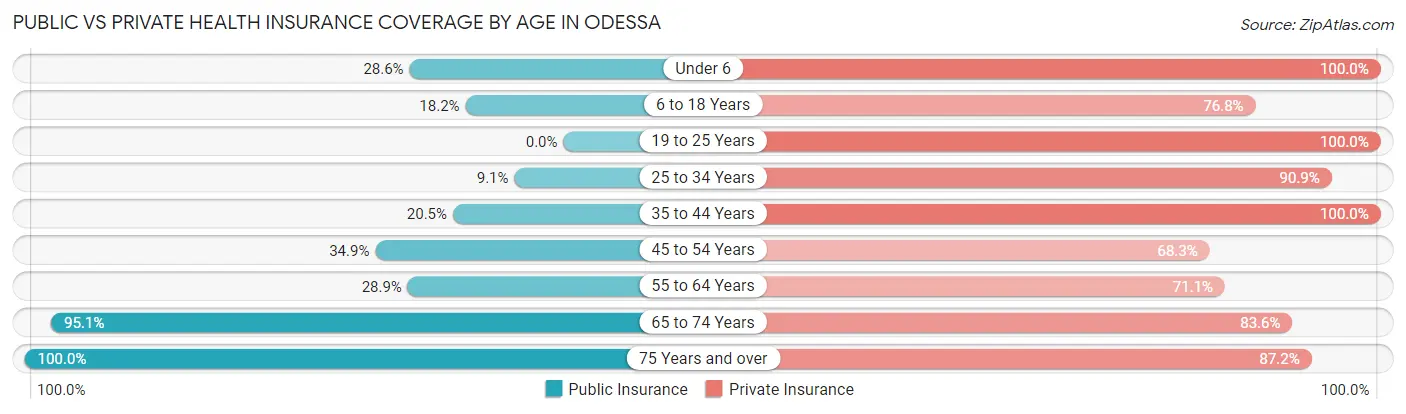
| Age Bracket | Public Insurance | Private Insurance |
| Under 6 | 4 (28.6%) | 14 (100.0%) |
| 6 to 18 Years | 18 (18.2%) | 76 (76.8%) |
| 19 to 25 Years | 0 (0.0%) | 7 (100.0%) |
| 25 to 34 Years | 2 (9.1%) | 20 (90.9%) |
| 35 to 44 Years | 8 (20.5%) | 39 (100.0%) |
| 45 to 54 Years | 22 (34.9%) | 43 (68.2%) |
| 55 to 64 Years | 13 (28.9%) | 32 (71.1%) |
| 65 to 74 Years | 58 (95.1%) | 51 (83.6%) |
| 75 Years and over | 39 (100.0%) | 34 (87.2%) |
| Total | 164 (42.2%) | 316 (81.2%) |
Disability Status by Sex by Age in Odessa
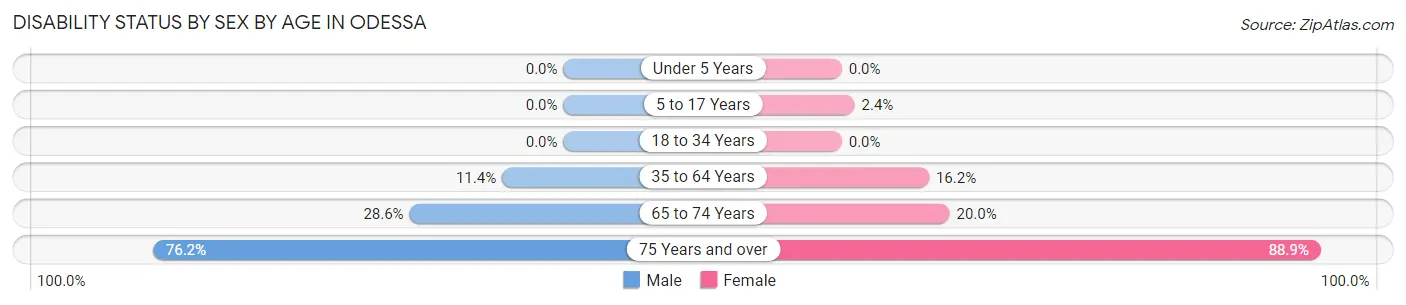
| Age Bracket | Male | Female |
| Under 5 Years | 0 (0.0%) | 0 (0.0%) |
| 5 to 17 Years | 0 (0.0%) | 1 (2.4%) |
| 18 to 34 Years | 0 (0.0%) | 0 (0.0%) |
| 35 to 64 Years | 9 (11.4%) | 11 (16.2%) |
| 65 to 74 Years | 6 (28.6%) | 8 (20.0%) |
| 75 Years and over | 16 (76.2%) | 16 (88.9%) |
Disability Class by Sex by Age in Odessa
Disability Class: Hearing Difficulty
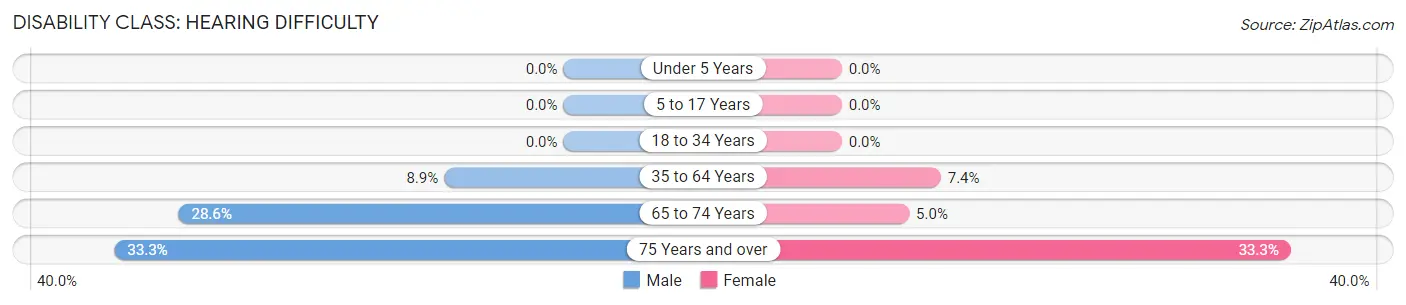
| Age Bracket | Male | Female |
| Under 5 Years | 0 (0.0%) | 0 (0.0%) |
| 5 to 17 Years | 0 (0.0%) | 0 (0.0%) |
| 18 to 34 Years | 0 (0.0%) | 0 (0.0%) |
| 35 to 64 Years | 7 (8.9%) | 5 (7.3%) |
| 65 to 74 Years | 6 (28.6%) | 2 (5.0%) |
| 75 Years and over | 7 (33.3%) | 6 (33.3%) |
Disability Class: Vision Difficulty
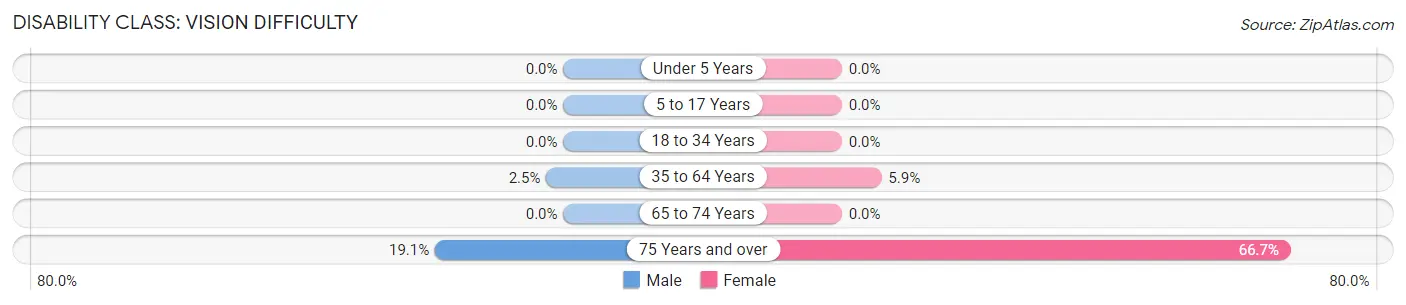
| Age Bracket | Male | Female |
| Under 5 Years | 0 (0.0%) | 0 (0.0%) |
| 5 to 17 Years | 0 (0.0%) | 0 (0.0%) |
| 18 to 34 Years | 0 (0.0%) | 0 (0.0%) |
| 35 to 64 Years | 2 (2.5%) | 4 (5.9%) |
| 65 to 74 Years | 0 (0.0%) | 0 (0.0%) |
| 75 Years and over | 4 (19.1%) | 12 (66.7%) |
Disability Class: Cognitive Difficulty
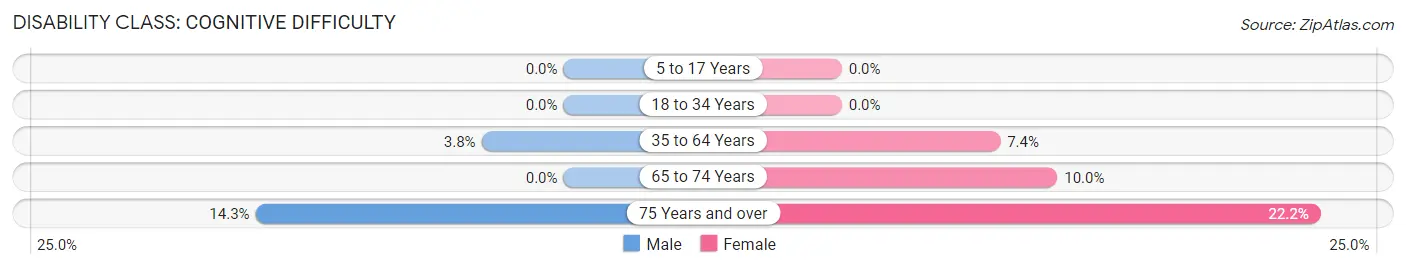
| Age Bracket | Male | Female |
| 5 to 17 Years | 0 (0.0%) | 0 (0.0%) |
| 18 to 34 Years | 0 (0.0%) | 0 (0.0%) |
| 35 to 64 Years | 3 (3.8%) | 5 (7.3%) |
| 65 to 74 Years | 0 (0.0%) | 4 (10.0%) |
| 75 Years and over | 3 (14.3%) | 4 (22.2%) |
Disability Class: Ambulatory Difficulty
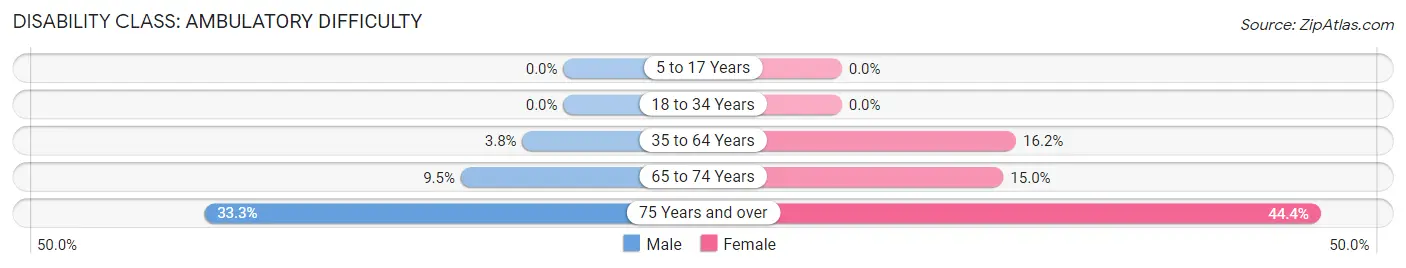
| Age Bracket | Male | Female |
| 5 to 17 Years | 0 (0.0%) | 0 (0.0%) |
| 18 to 34 Years | 0 (0.0%) | 0 (0.0%) |
| 35 to 64 Years | 3 (3.8%) | 11 (16.2%) |
| 65 to 74 Years | 2 (9.5%) | 6 (15.0%) |
| 75 Years and over | 7 (33.3%) | 8 (44.4%) |
Disability Class: Self-Care Difficulty
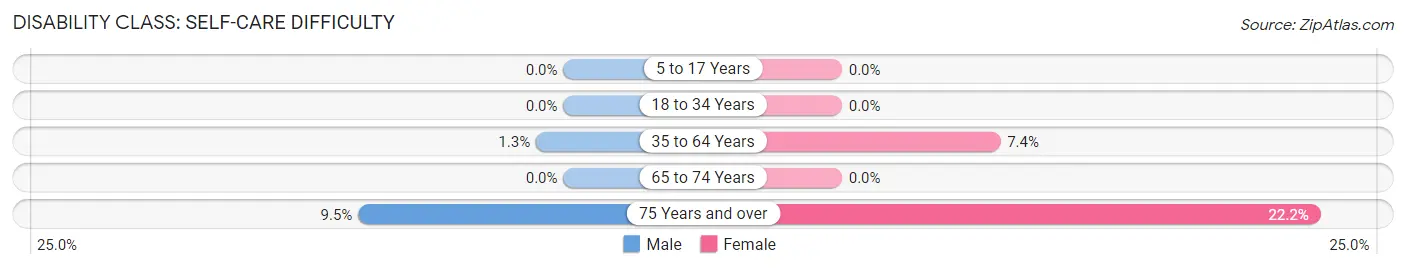
| Age Bracket | Male | Female |
| 5 to 17 Years | 0 (0.0%) | 0 (0.0%) |
| 18 to 34 Years | 0 (0.0%) | 0 (0.0%) |
| 35 to 64 Years | 1 (1.3%) | 5 (7.3%) |
| 65 to 74 Years | 0 (0.0%) | 0 (0.0%) |
| 75 Years and over | 2 (9.5%) | 4 (22.2%) |
Technology Access in Odessa
Computing Device Access in Odessa
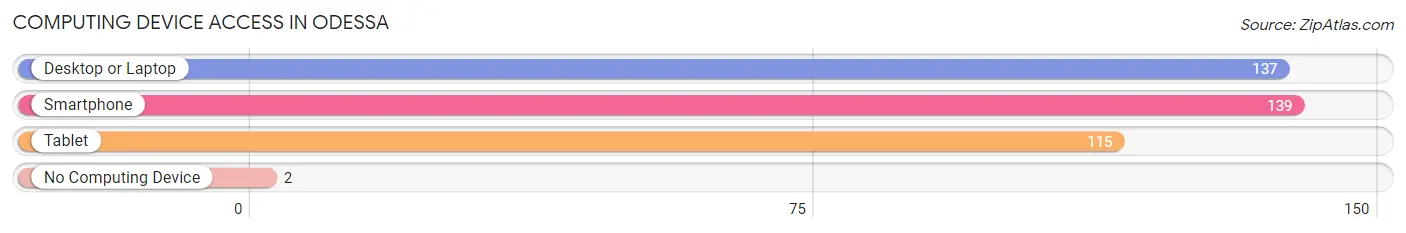
| Device Type | # Households | % Households |
| Desktop or Laptop | 137 | 89.5% |
| Smartphone | 139 | 90.8% |
| Tablet | 115 | 75.2% |
| No Computing Device | 2 | 1.3% |
| Total | 153 | 100.0% |
Internet Access in Odessa
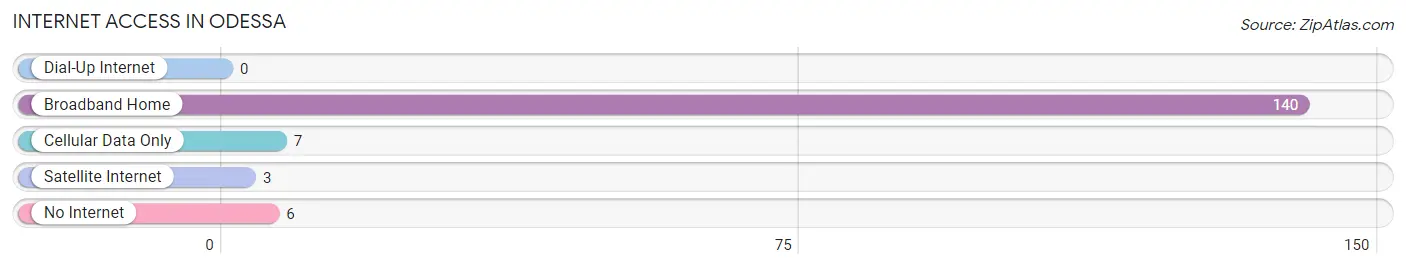
| Internet Type | # Households | % Households |
| Dial-Up Internet | 0 | 0.0% |
| Broadband Home | 140 | 91.5% |
| Cellular Data Only | 7 | 4.6% |
| Satellite Internet | 3 | 2.0% |
| No Internet | 6 | 3.9% |
| Total | 153 | 100.0% |
Odessa Summary
Odessa is a city located in the state of Delaware, in the United States of America. It is the county seat of New Castle County and is located on the Delaware River, about 25 miles south of Wilmington. The city has a population of approximately 7,000 people and is part of the Wilmington Metropolitan Statistical Area.
History
Odessa was founded in 1780 by a group of settlers from Pennsylvania. The town was named after the city of Odessa in Ukraine, which was the birthplace of one of the settlers. The town was originally a farming community, but it soon became a center for shipbuilding and trade. In the early 19th century, the town was a major port for the export of grain and other agricultural products.
In the mid-19th century, the town began to experience a period of industrialization. The Delaware and Chesapeake Canal was built in 1829, connecting the Delaware River to the Chesapeake Bay. This allowed for increased trade and commerce in the area. The town also became a major center for the production of iron and steel products.
In the late 19th century, the town experienced a period of growth and prosperity. The population increased from 1,000 in 1880 to over 5,000 in 1900. The town was incorporated in 1891 and was designated as the county seat of New Castle County in 1895.
Geography
Odessa is located in the northern part of New Castle County, in the state of Delaware. It is situated on the Delaware River, about 25 miles south of Wilmington. The city has a total area of 2.2 square miles, all of which is land. The city is located in a humid subtropical climate zone, with hot, humid summers and mild winters.
Economy
Odessa’s economy is largely based on manufacturing and services. The city is home to several large manufacturing companies, including a steel mill, a paper mill, and a chemical plant. The city also has a number of small businesses, including restaurants, retail stores, and professional services.
The city is also home to a number of educational institutions, including the University of Delaware, Delaware State University, and Wilmington University. These institutions provide a number of jobs in the area, as well as educational opportunities for the residents of Odessa.
Demographics
As of the 2010 census, the population of Odessa was 7,000. The racial makeup of the city was 79.3% White, 15.2% African American, 0.5% Native American, 1.2% Asian, 0.1% Pacific Islander, and 3.7% from other races. The median household income was $45,000, and the median family income was $50,000.
Odessa is a diverse city, with a variety of cultures and backgrounds represented. The city is home to a large Hispanic population, as well as a significant African American population. The city also has a large number of immigrants from various countries, including India, China, and the Philippines.
Conclusion
Odessa is a city located in the state of Delaware, in the United States of America. It is the county seat of New Castle County and is located on the Delaware River, about 25 miles south of Wilmington. The city has a population of approximately 7,000 people and is part of the Wilmington Metropolitan Statistical Area. The city’s economy is largely based on manufacturing and services, and it is home to a number of educational institutions. Odessa is a diverse city, with a variety of cultures and backgrounds represented.
Common Questions
What is Per Capita Income in Odessa?
Per Capita income in Odessa is $45,905.
What is the Median Family Income in Odessa?
Median Family Income in Odessa is $114,444.
What is the Median Household income in Odessa?
Median Household Income in Odessa is $87,321.
What is Income or Wage Gap in Odessa?
Income or Wage Gap in Odessa is 32.8%.
Women in Odessa earn 67.2 cents for every dollar earned by a man.
What is Inequality or Gini Index in Odessa?
Inequality or Gini Index in Odessa is 0.40.
What is the Total Population of Odessa?
Total Population of Odessa is 389.
What is the Total Male Population of Odessa?
Total Male Population of Odessa is 201.
What is the Total Female Population of Odessa?
Total Female Population of Odessa is 188.
What is the Ratio of Males per 100 Females in Odessa?
There are 106.91 Males per 100 Females in Odessa.
What is the Ratio of Females per 100 Males in Odessa?
There are 93.53 Females per 100 Males in Odessa.
What is the Median Population Age in Odessa?
Median Population Age in Odessa is 46.6 Years.
What is the Average Family Size in Odessa
Average Family Size in Odessa is 3.2 People.
What is the Average Household Size in Odessa
Average Household Size in Odessa is 2.5 People.
How Large is the Labor Force in Odessa?
There are 167 People in the Labor Forcein in Odessa.
What is the Percentage of People in the Labor Force in Odessa?
58.0% of People are in the Labor Force in Odessa.
What is the Unemployment Rate in Odessa?
Unemployment Rate in Odessa is 0.6%.