Magnolia, DE Map & Demographics
Magnolia Map
Magnolia Overview
$25,069
PER CAPITA INCOME
0.39
INEQUALITY / GINI INDEX
263
TOTAL POPULATION
135
MALE POPULATION
128
FEMALE POPULATION
105.47
MALES / 100 FEMALES
94.81
FEMALES / 100 MALES
36.5
MEDIAN AGE
3.1
AVG FAMILY SIZE
2.8
AVG HOUSEHOLD SIZE
98
LABOR FORCE [ PEOPLE ]
53.0%
PERCENT IN LABOR FORCE
9.4%
UNEMPLOYMENT RATE
Magnolia Zip Codes
Magnolia Area Codes
Income in Magnolia
Income Overview in Magnolia
| Characteristic | Number | Measure |
| Per Capita Income | 263 | $25,069 |
| Median Family Income | 69 | $0 |
| Mean Family Income | 69 | $84,097 |
| Median Household Income | 94 | $0 |
| Mean Household Income | 94 | $74,870 |
| Income Deficit | 69 | $0 |
| Wage / Income Gap (%) | 263 | 0.00% |
| Wage / Income Gap ($) | 263 | 100.00¢ per $1 |
| Gini / Inequality Index | 263 | 0.39 |
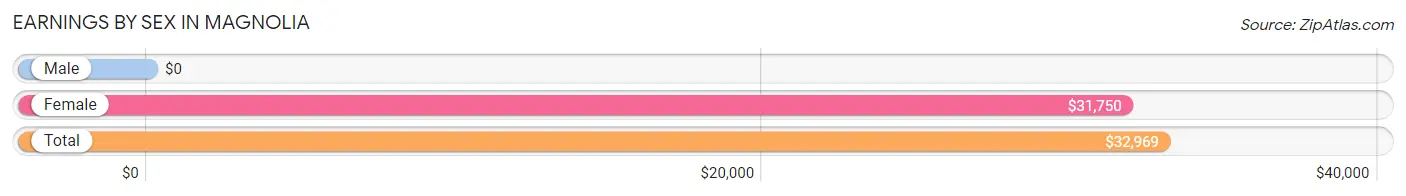
Earnings by Sex in Magnolia
| Sex | Number | Average Earnings |
| Male | 42 (41.6%) | $0 |
| Female | 59 (58.4%) | $31,750 |
| Total | 101 (100.0%) | $32,969 |
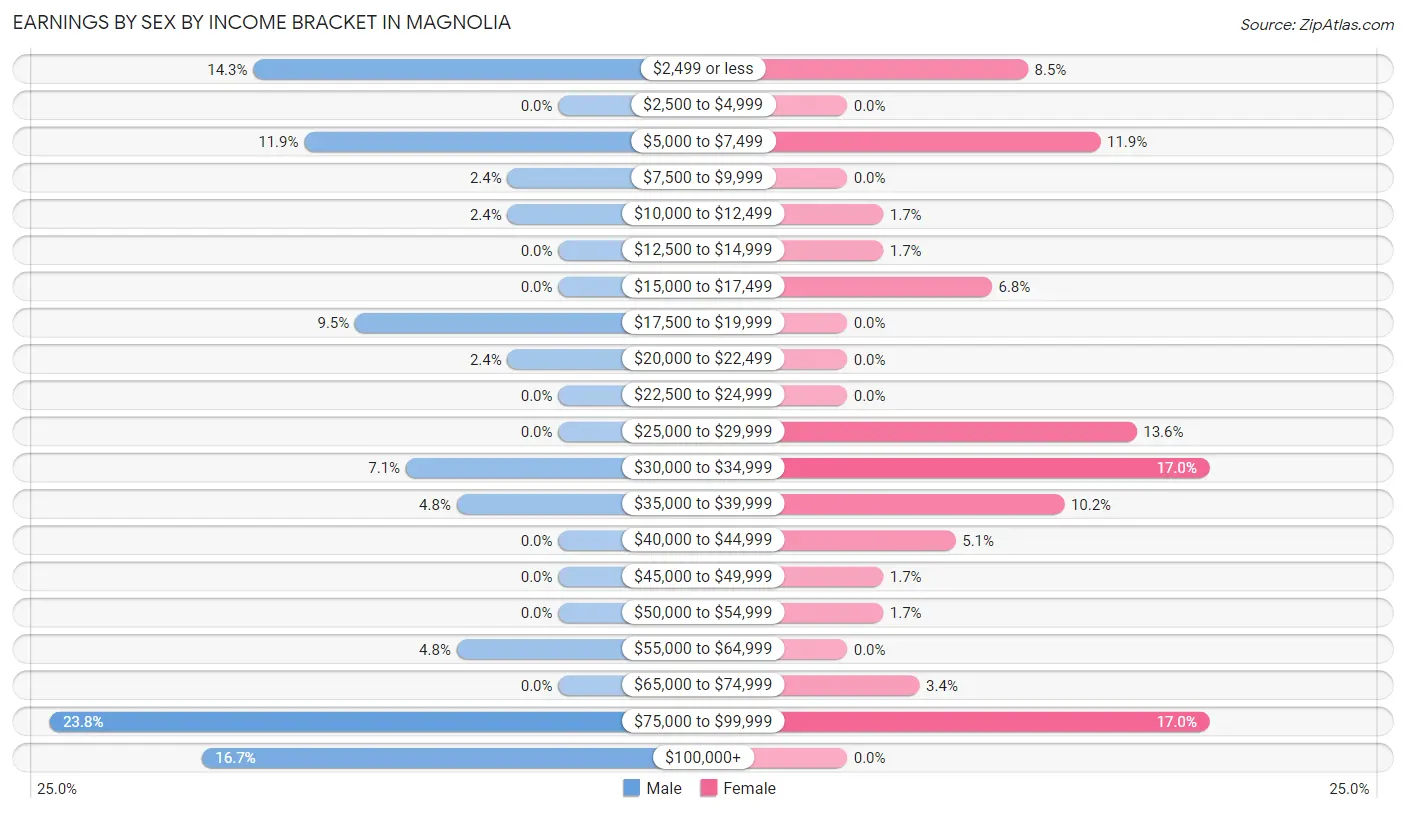
Earnings by Sex by Income Bracket in Magnolia
The most common earnings brackets in Magnolia are $75,000 to $99,999 for men (10 | 23.8%) and $30,000 to $34,999 for women (10 | 17.0%).
| Income | Male | Female |
| $2,499 or less | 6 (14.3%) | 5 (8.5%) |
| $2,500 to $4,999 | 0 (0.0%) | 0 (0.0%) |
| $5,000 to $7,499 | 5 (11.9%) | 7 (11.9%) |
| $7,500 to $9,999 | 1 (2.4%) | 0 (0.0%) |
| $10,000 to $12,499 | 1 (2.4%) | 1 (1.7%) |
| $12,500 to $14,999 | 0 (0.0%) | 1 (1.7%) |
| $15,000 to $17,499 | 0 (0.0%) | 4 (6.8%) |
| $17,500 to $19,999 | 4 (9.5%) | 0 (0.0%) |
| $20,000 to $22,499 | 1 (2.4%) | 0 (0.0%) |
| $22,500 to $24,999 | 0 (0.0%) | 0 (0.0%) |
| $25,000 to $29,999 | 0 (0.0%) | 8 (13.6%) |
| $30,000 to $34,999 | 3 (7.1%) | 10 (17.0%) |
| $35,000 to $39,999 | 2 (4.8%) | 6 (10.2%) |
| $40,000 to $44,999 | 0 (0.0%) | 3 (5.1%) |
| $45,000 to $49,999 | 0 (0.0%) | 1 (1.7%) |
| $50,000 to $54,999 | 0 (0.0%) | 1 (1.7%) |
| $55,000 to $64,999 | 2 (4.8%) | 0 (0.0%) |
| $65,000 to $74,999 | 0 (0.0%) | 2 (3.4%) |
| $75,000 to $99,999 | 10 (23.8%) | 10 (17.0%) |
| $100,000+ | 7 (16.7%) | 0 (0.0%) |
| Total | 42 (100.0%) | 59 (100.0%) |
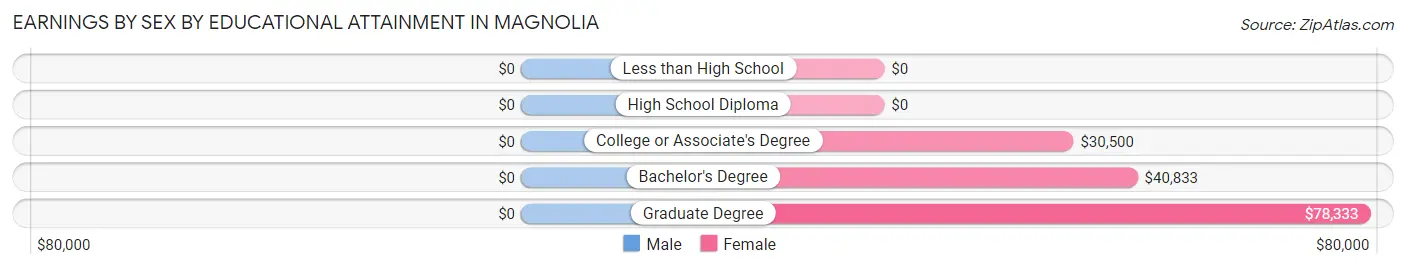
Earnings by Sex by Educational Attainment in Magnolia
| Educational Attainment | Male Income | Female Income |
| Less than High School | - | - |
| High School Diploma | - | - |
| College or Associate's Degree | - | - |
| Bachelor's Degree | - | - |
| Graduate Degree | - | - |
| Total | $78,750 | $33,250 |
Family Income in Magnolia
Family Income Brackets in Magnolia
According to the Magnolia family income data, there are 24 families falling into the $100,000 to $149,999 income range, which is the most common income bracket and makes up 34.8% of all families.
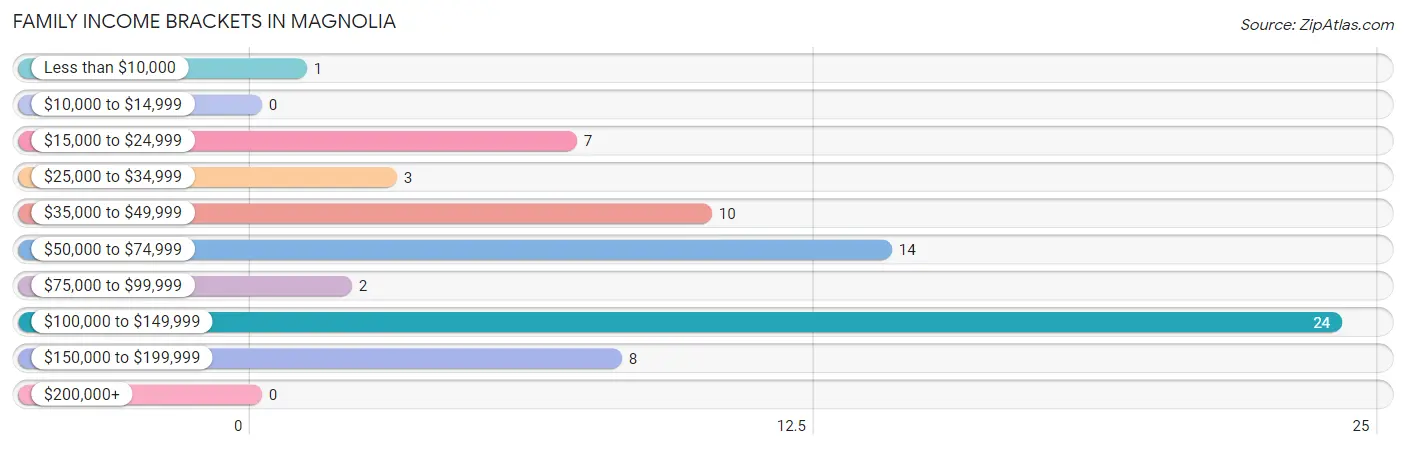
| Income Bracket | # Families | % Families |
| Less than $10,000 | 1 | 1.4% |
| $10,000 to $14,999 | 0 | 0.0% |
| $15,000 to $24,999 | 7 | 10.1% |
| $25,000 to $34,999 | 3 | 4.3% |
| $35,000 to $49,999 | 10 | 14.5% |
| $50,000 to $74,999 | 14 | 20.3% |
| $75,000 to $99,999 | 2 | 2.9% |
| $100,000 to $149,999 | 24 | 34.8% |
| $150,000 to $199,999 | 8 | 11.6% |
| $200,000+ | 0 | 0.0% |
Family Income by Famaliy Size in Magnolia
2-person families (45 | 65.2%) account for the highest median family income in Magnolia with $115,208 per family, while 2-person families (45 | 65.2%) have the highest median income of $57,604 per family member.
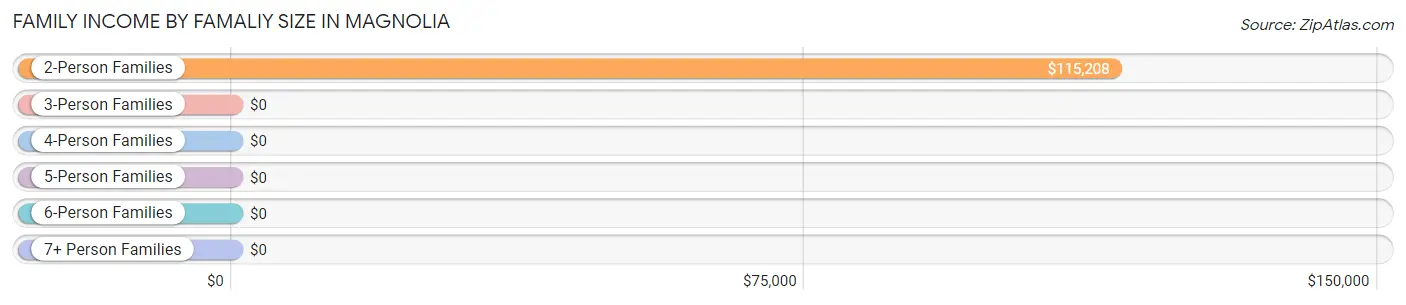
| Income Bracket | # Families | Median Income |
| 2-Person Families | 45 (65.2%) | $115,208 |
| 3-Person Families | 4 (5.8%) | $0 |
| 4-Person Families | 1 (1.5%) | $0 |
| 5-Person Families | 6 (8.7%) | $0 |
| 6-Person Families | 10 (14.5%) | $0 |
| 7+ Person Families | 3 (4.3%) | $0 |
| Total | 69 (100.0%) | $0 |
Family Income by Number of Earners in Magnolia
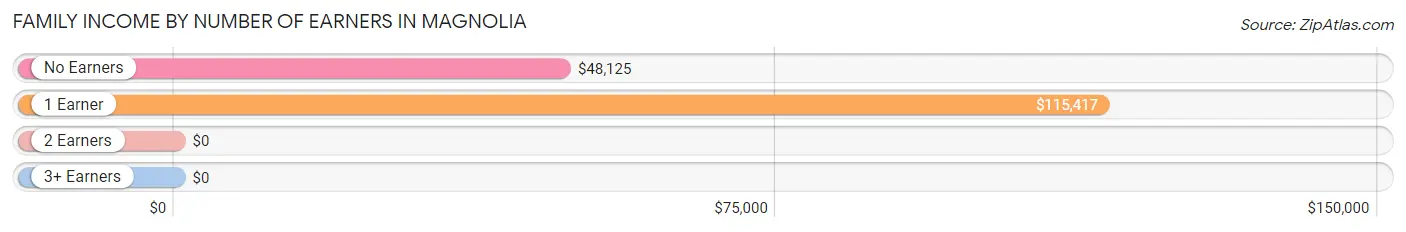
| Number of Earners | # Families | Median Income |
| No Earners | 9 (13.0%) | $48,125 |
| 1 Earner | 38 (55.1%) | $115,417 |
| 2 Earners | 19 (27.5%) | $0 |
| 3+ Earners | 3 (4.3%) | $0 |
| Total | 69 (100.0%) | $0 |
Household Income in Magnolia
Household Income Brackets in Magnolia
With 31 households falling in the category, the $100,000 to $149,999 income range is the most frequent in Magnolia, accounting for 33.0% of all households.
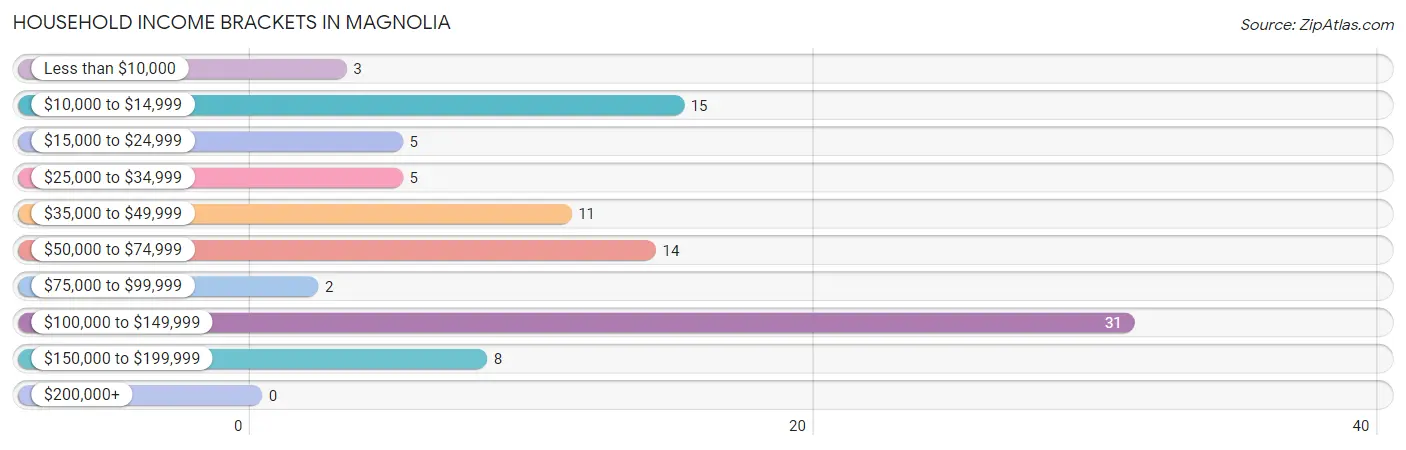
| Income Bracket | # Households | % Households |
| Less than $10,000 | 3 | 3.2% |
| $10,000 to $14,999 | 15 | 16.0% |
| $15,000 to $24,999 | 5 | 5.3% |
| $25,000 to $34,999 | 5 | 5.3% |
| $35,000 to $49,999 | 11 | 11.7% |
| $50,000 to $74,999 | 14 | 14.9% |
| $75,000 to $99,999 | 2 | 2.1% |
| $100,000 to $149,999 | 31 | 33.0% |
| $150,000 to $199,999 | 8 | 8.5% |
| $200,000+ | 0 | 0.0% |
Household Income by Householder Age in Magnolia
The median household income in Magnolia is $0, with the highest median household income of $115,903 found in the 65+ years age bracket for the primary householder. A total of 35 households (37.2%) fall into this category. Meanwhile, the 15 to 24 years age bracket for the primary householder has the lowest median household income of $0, with 5 households (5.3%) in this group.
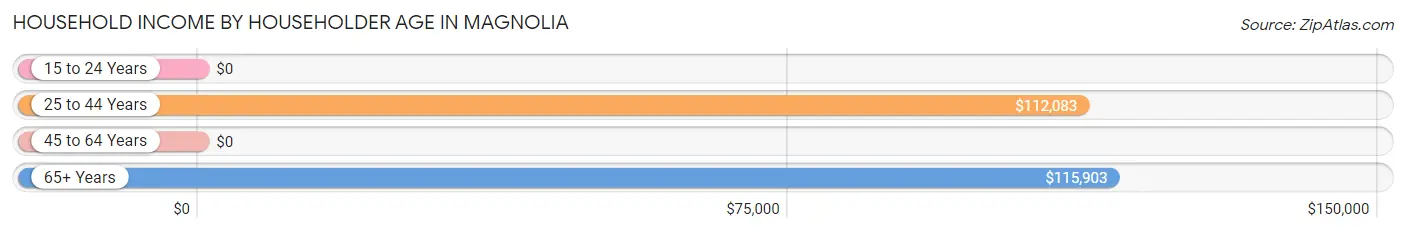
| Income Bracket | # Households | Median Income |
| 15 to 24 Years | 5 (5.3%) | $0 |
| 25 to 44 Years | 17 (18.1%) | $112,083 |
| 45 to 64 Years | 37 (39.4%) | $0 |
| 65+ Years | 35 (37.2%) | $115,903 |
| Total | 94 (100.0%) | $0 |
Poverty in Magnolia
Income Below Poverty by Sex and Age in Magnolia
With 16.4% poverty level for males and 17.2% for females among the residents of Magnolia, under 5 year old males and 16 and 17 year old females are the most vulnerable to poverty, with 2 males (100.0%) and 6 females (100.0%) in their respective age groups living below the poverty level.
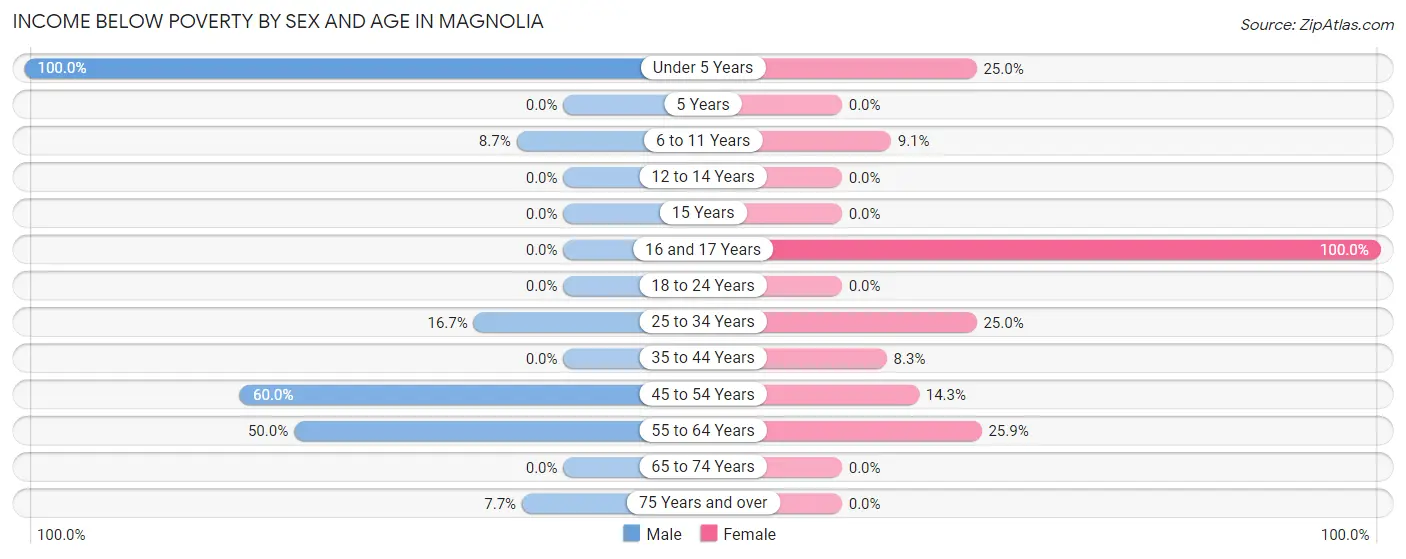
| Age Bracket | Male | Female |
| Under 5 Years | 2 (100.0%) | 1 (25.0%) |
| 5 Years | 0 (0.0%) | 0 (0.0%) |
| 6 to 11 Years | 2 (8.7%) | 3 (9.1%) |
| 12 to 14 Years | 0 (0.0%) | 0 (0.0%) |
| 15 Years | 0 (0.0%) | 0 (0.0%) |
| 16 and 17 Years | 0 (0.0%) | 6 (100.0%) |
| 18 to 24 Years | 0 (0.0%) | 0 (0.0%) |
| 25 to 34 Years | 2 (16.7%) | 2 (25.0%) |
| 35 to 44 Years | 0 (0.0%) | 1 (8.3%) |
| 45 to 54 Years | 6 (60.0%) | 2 (14.3%) |
| 55 to 64 Years | 8 (50.0%) | 7 (25.9%) |
| 65 to 74 Years | 0 (0.0%) | 0 (0.0%) |
| 75 Years and over | 1 (7.7%) | 0 (0.0%) |
| Total | 21 (16.4%) | 22 (17.2%) |
Income Above Poverty by Sex and Age in Magnolia
According to the poverty statistics in Magnolia, males aged 12 to 14 years and females aged 5 years are the age groups that are most secure financially, with 100.0% of males and 100.0% of females in these age groups living above the poverty line.
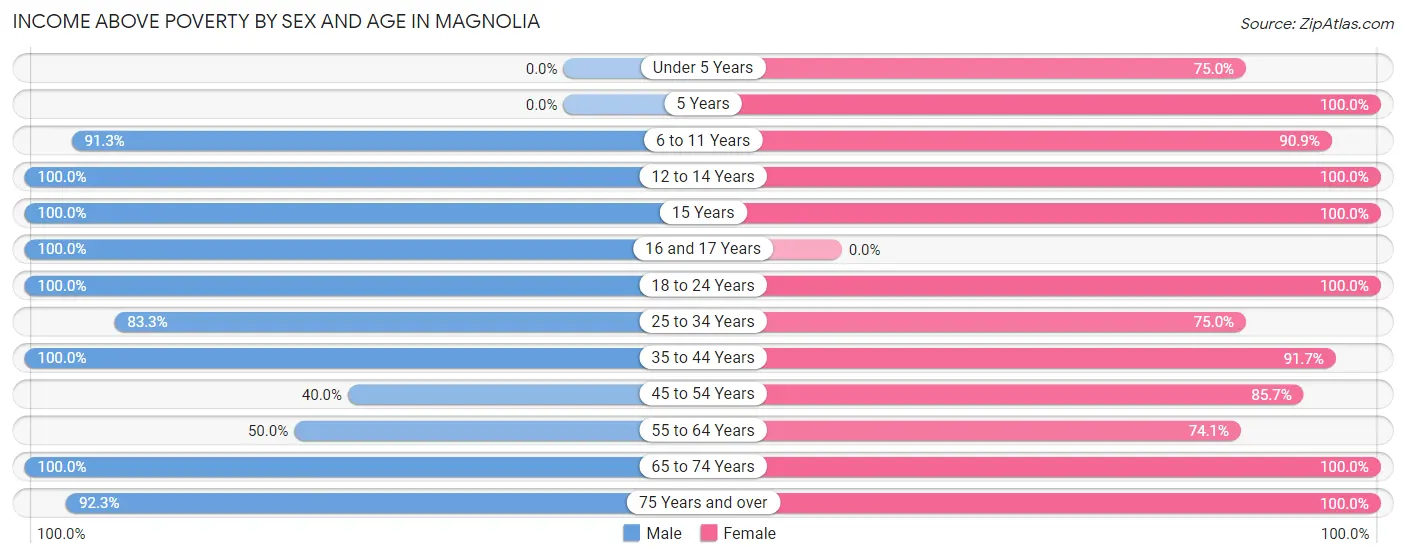
| Age Bracket | Male | Female |
| Under 5 Years | 0 (0.0%) | 3 (75.0%) |
| 5 Years | 0 (0.0%) | 2 (100.0%) |
| 6 to 11 Years | 21 (91.3%) | 30 (90.9%) |
| 12 to 14 Years | 2 (100.0%) | 2 (100.0%) |
| 15 Years | 2 (100.0%) | 1 (100.0%) |
| 16 and 17 Years | 5 (100.0%) | 0 (0.0%) |
| 18 to 24 Years | 10 (100.0%) | 6 (100.0%) |
| 25 to 34 Years | 10 (83.3%) | 6 (75.0%) |
| 35 to 44 Years | 7 (100.0%) | 11 (91.7%) |
| 45 to 54 Years | 4 (40.0%) | 12 (85.7%) |
| 55 to 64 Years | 8 (50.0%) | 20 (74.1%) |
| 65 to 74 Years | 26 (100.0%) | 9 (100.0%) |
| 75 Years and over | 12 (92.3%) | 4 (100.0%) |
| Total | 107 (83.6%) | 106 (82.8%) |
Income Below Poverty Among Married-Couple Families in Magnolia
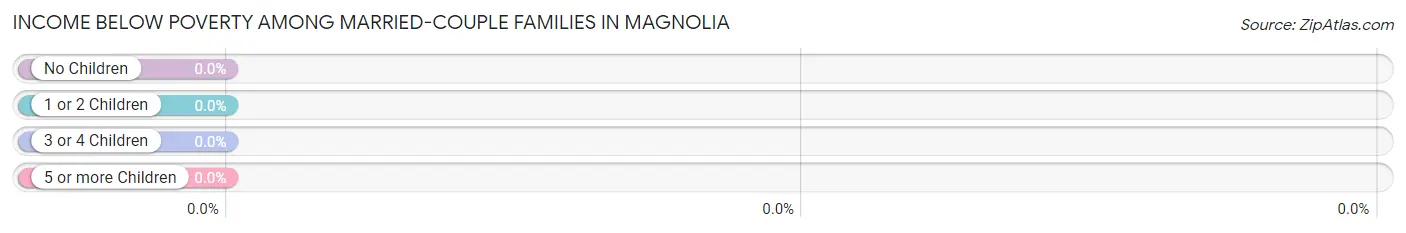
| Children | Above Poverty | Below Poverty |
| No Children | 40 (100.0%) | 0 (0.0%) |
| 1 or 2 Children | 4 (100.0%) | 0 (0.0%) |
| 3 or 4 Children | 1 (100.0%) | 0 (0.0%) |
| 5 or more Children | 0 (0.0%) | 0 (0.0%) |
| Total | 45 (100.0%) | 0 (0.0%) |
Income Below Poverty Among Single-Parent Households in Magnolia
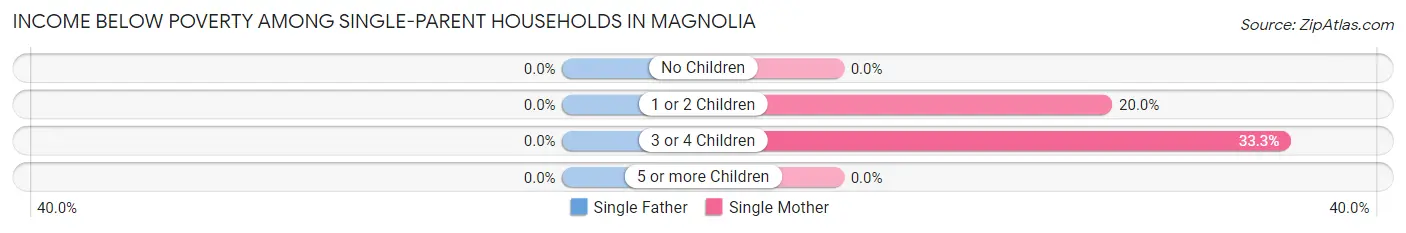
| Children | Single Father | Single Mother |
| No Children | 0 (0.0%) | 0 (0.0%) |
| 1 or 2 Children | 0 (0.0%) | 1 (20.0%) |
| 3 or 4 Children | 0 (0.0%) | 2 (33.3%) |
| 5 or more Children | 0 (0.0%) | 0 (0.0%) |
| Total | 0 (0.0%) | 3 (13.6%) |
Income Below Poverty Among Married-Couple vs Single-Parent Households in Magnolia
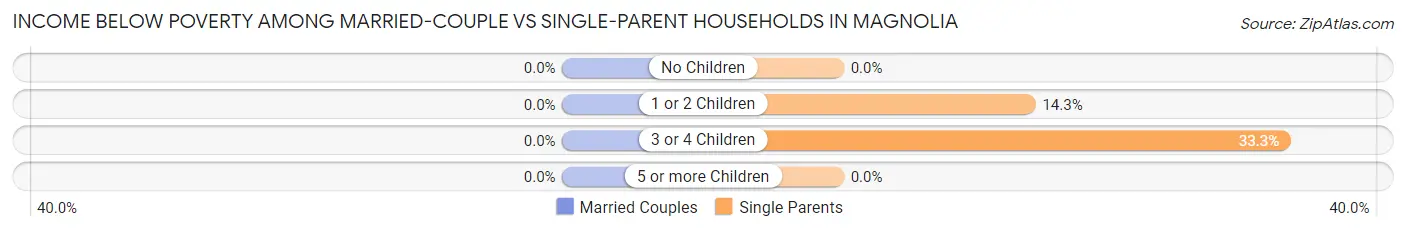
| Children | Married-Couple Families | Single-Parent Households |
| No Children | 0 (0.0%) | 0 (0.0%) |
| 1 or 2 Children | 0 (0.0%) | 1 (14.3%) |
| 3 or 4 Children | 0 (0.0%) | 2 (33.3%) |
| 5 or more Children | 0 (0.0%) | 0 (0.0%) |
| Total | 0 (0.0%) | 3 (12.5%) |
Race in Magnolia
The most populous races in Magnolia are White / Caucasian (160 | 60.8%), Hispanic or Latino (52 | 19.8%), and Some other Race (50 | 19.0%).
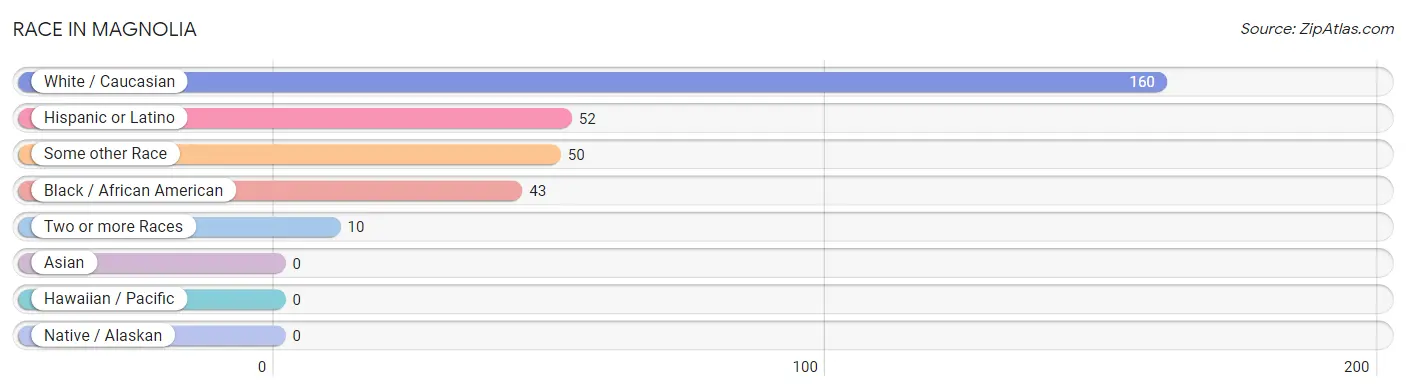
| Race | # Population | % Population |
| Asian | 0 | 0.0% |
| Black / African American | 43 | 16.4% |
| Hawaiian / Pacific | 0 | 0.0% |
| Hispanic or Latino | 52 | 19.8% |
| Native / Alaskan | 0 | 0.0% |
| White / Caucasian | 160 | 60.8% |
| Two or more Races | 10 | 3.8% |
| Some other Race | 50 | 19.0% |
| Total | 263 | 100.0% |
Ancestry in Magnolia
The most populous ancestries reported in Magnolia are Puerto Rican (50 | 19.0%), English (35 | 13.3%), Italian (33 | 12.6%), German (27 | 10.3%), and Irish (26 | 9.9%), together accounting for 65.0% of all Magnolia residents.
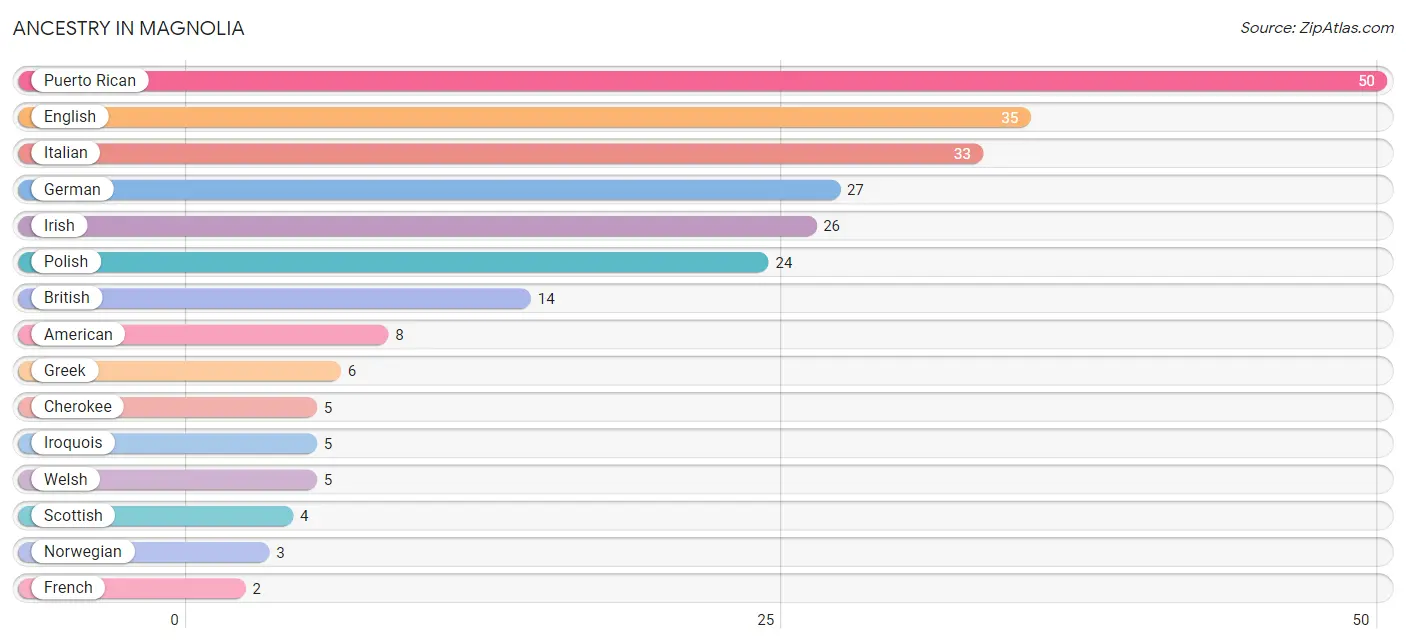
| Ancestry | # Population | % Population |
| American | 8 | 3.0% |
| British | 14 | 5.3% |
| Central American | 1 | 0.4% |
| Cherokee | 5 | 1.9% |
| Costa Rican | 1 | 0.4% |
| Dutch | 1 | 0.4% |
| English | 35 | 13.3% |
| French | 2 | 0.8% |
| German | 27 | 10.3% |
| Greek | 6 | 2.3% |
| Irish | 26 | 9.9% |
| Iroquois | 5 | 1.9% |
| Italian | 33 | 12.6% |
| Mexican | 1 | 0.4% |
| Norwegian | 3 | 1.1% |
| Polish | 24 | 9.1% |
| Portuguese | 2 | 0.8% |
| Puerto Rican | 50 | 19.0% |
| Scottish | 4 | 1.5% |
| Swiss | 1 | 0.4% |
| Welsh | 5 | 1.9% | View All 21 Rows |
Immigrants in Magnolia

| Immigration Origin | # Population | % Population | View All 0 Rows |
Sex and Age in Magnolia
Sex and Age in Magnolia
The most populous age groups in Magnolia are 65 to 69 Years (26 | 19.3%) for men and 10 to 14 Years (21 | 16.4%) for women.
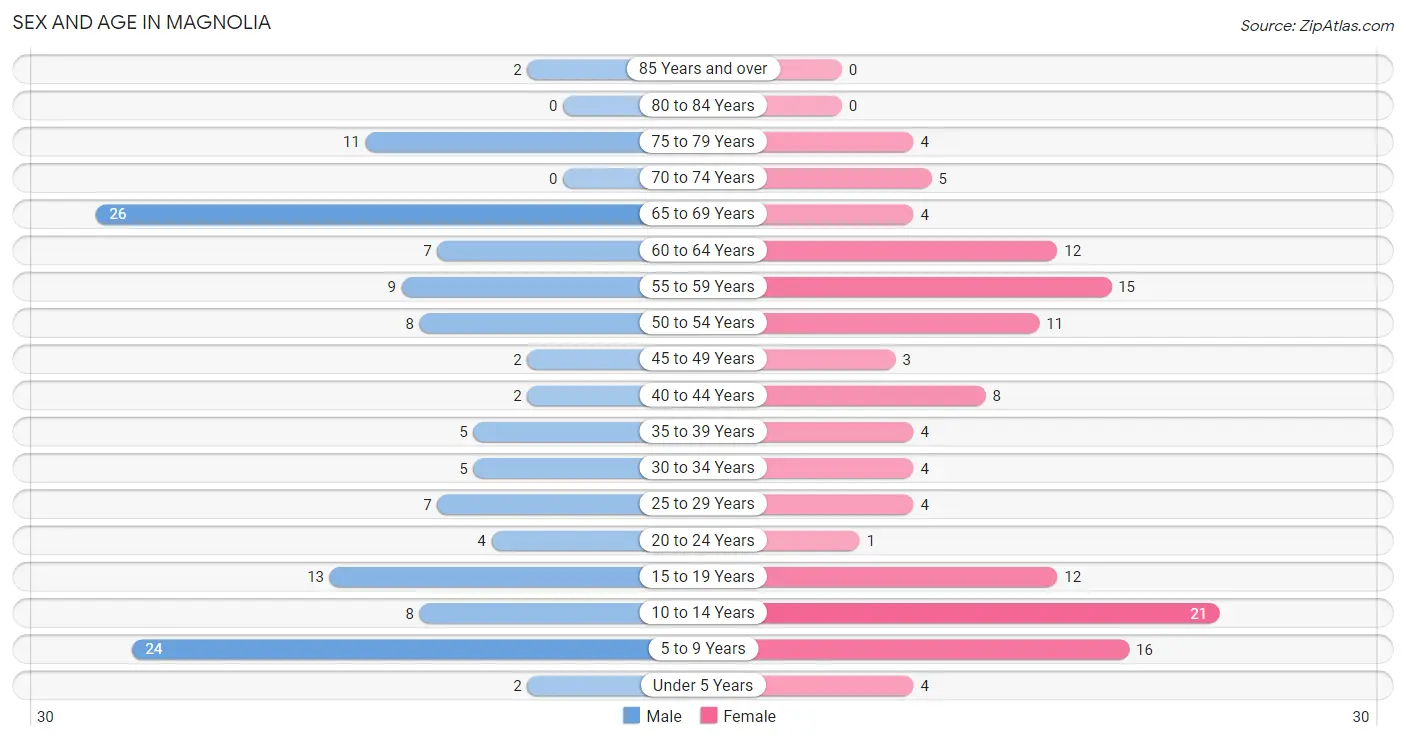
| Age Bracket | Male | Female |
| Under 5 Years | 2 (1.5%) | 4 (3.1%) |
| 5 to 9 Years | 24 (17.8%) | 16 (12.5%) |
| 10 to 14 Years | 8 (5.9%) | 21 (16.4%) |
| 15 to 19 Years | 13 (9.6%) | 12 (9.4%) |
| 20 to 24 Years | 4 (3.0%) | 1 (0.8%) |
| 25 to 29 Years | 7 (5.2%) | 4 (3.1%) |
| 30 to 34 Years | 5 (3.7%) | 4 (3.1%) |
| 35 to 39 Years | 5 (3.7%) | 4 (3.1%) |
| 40 to 44 Years | 2 (1.5%) | 8 (6.2%) |
| 45 to 49 Years | 2 (1.5%) | 3 (2.3%) |
| 50 to 54 Years | 8 (5.9%) | 11 (8.6%) |
| 55 to 59 Years | 9 (6.7%) | 15 (11.7%) |
| 60 to 64 Years | 7 (5.2%) | 12 (9.4%) |
| 65 to 69 Years | 26 (19.3%) | 4 (3.1%) |
| 70 to 74 Years | 0 (0.0%) | 5 (3.9%) |
| 75 to 79 Years | 11 (8.2%) | 4 (3.1%) |
| 80 to 84 Years | 0 (0.0%) | 0 (0.0%) |
| 85 Years and over | 2 (1.5%) | 0 (0.0%) |
| Total | 135 (100.0%) | 128 (100.0%) |
Families and Households in Magnolia
Median Family Size in Magnolia
The median family size in Magnolia is 3.13 persons per family, with single male/father families (2 | 2.9%) accounting for the largest median family size of 6 persons per family. On the other hand, married-couple families (45 | 65.2%) represent the smallest median family size with 2.42 persons per family.
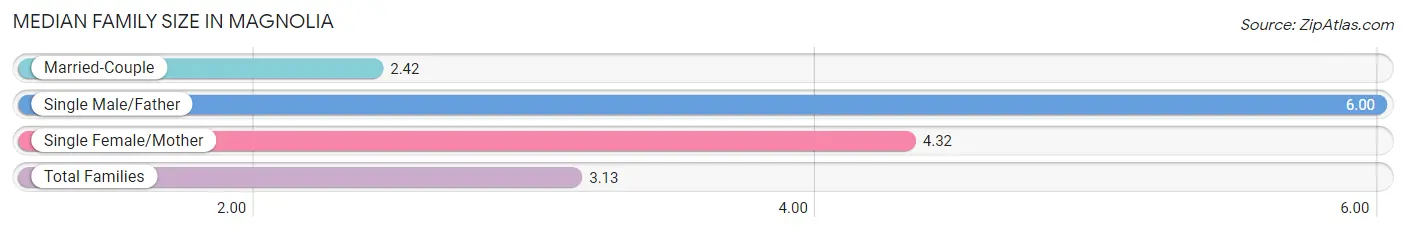
| Family Type | # Families | Family Size |
| Married-Couple | 45 (65.2%) | 2.42 |
| Single Male/Father | 2 (2.9%) | 6.00 |
| Single Female/Mother | 22 (31.9%) | 4.32 |
| Total Families | 69 (100.0%) | 3.13 |
Median Household Size in Magnolia
The median household size in Magnolia is 2.80 persons per household, with single male/father households (2 | 2.1%) accounting for the largest median household size of 6 persons per household. non-family households (25 | 26.6%) represent the smallest median household size with 1.20 persons per household.
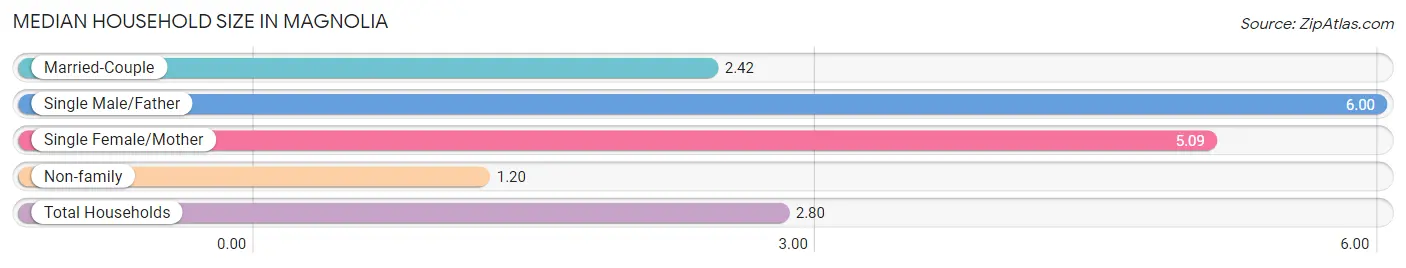
| Household Type | # Households | Household Size |
| Married-Couple | 45 (47.9%) | 2.42 |
| Single Male/Father | 2 (2.1%) | 6.00 |
| Single Female/Mother | 22 (23.4%) | 5.09 |
| Non-family | 25 (26.6%) | 1.20 |
| Total Households | 94 (100.0%) | 2.80 |
Household Size by Marriage Status in Magnolia
Out of a total of 94 households in Magnolia, 69 (73.4%) are family households, while 25 (26.6%) are nonfamily households. The most numerous type of family households are 2-person households, comprising 45, and the most common type of nonfamily households are 1-person households, comprising 19.
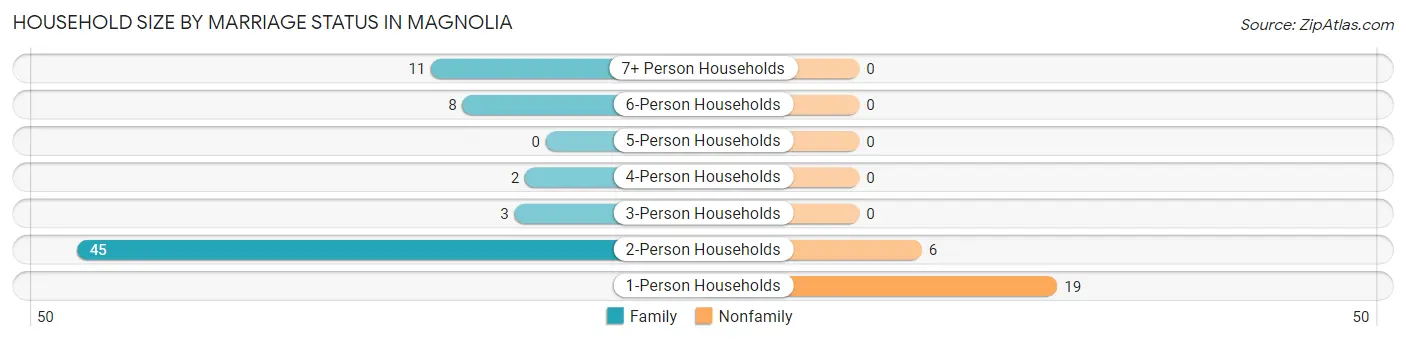
| Household Size | Family Households | Nonfamily Households |
| 1-Person Households | - | 19 (20.2%) |
| 2-Person Households | 45 (47.9%) | 6 (6.4%) |
| 3-Person Households | 3 (3.2%) | 0 (0.0%) |
| 4-Person Households | 2 (2.1%) | 0 (0.0%) |
| 5-Person Households | 0 (0.0%) | 0 (0.0%) |
| 6-Person Households | 8 (8.5%) | 0 (0.0%) |
| 7+ Person Households | 11 (11.7%) | 0 (0.0%) |
| Total | 69 (73.4%) | 25 (26.6%) |
Female Fertility in Magnolia
Fertility by Age in Magnolia
| Age Bracket | Women with Births | Births / 1,000 Women |
| 15 to 19 years | 0 (0.0%) | 0.0 |
| 20 to 34 years | 0 (0.0%) | 0.0 |
| 35 to 50 years | 0 (0.0%) | 0.0 |
| Total | 0 (0.0%) | 0.0 |
Fertility by Age by Marriage Status in Magnolia
| Age Bracket | Married | Unmarried |
| 15 to 19 years | 0 (0.0%) | 0 (0.0%) |
| 20 to 34 years | 0 (0.0%) | 0 (0.0%) |
| 35 to 50 years | 0 (0.0%) | 0 (0.0%) |
| Total | 0 (0.0%) | 0 (0.0%) |
Fertility by Education in Magnolia
| Educational Attainment | Women with Births | Births / 1,000 Women |
| Less than High School | 0 (0.0%) | 0.0 |
| High School Diploma | 0 (0.0%) | 0.0 |
| College or Associate's Degree | 0 (0.0%) | 0.0 |
| Bachelor's Degree | 0 (0.0%) | 0.0 |
| Graduate Degree | 0 (0.0%) | 0.0 |
| Total | 0 (0.0%) | 0.0 |
Fertility by Education by Marriage Status in Magnolia
| Educational Attainment | Married | Unmarried |
| Less than High School | 0 (0.0%) | 0 (0.0%) |
| High School Diploma | 0 (0.0%) | 0 (0.0%) |
| College or Associate's Degree | 0 (0.0%) | 0 (0.0%) |
| Bachelor's Degree | 0 (0.0%) | 0 (0.0%) |
| Graduate Degree | 0 (0.0%) | 0 (0.0%) |
| Total | 0 (0.0%) | 0 (0.0%) |
Employment Characteristics in Magnolia
Employment by Class of Employer in Magnolia
Among the 88 employed individuals in Magnolia, private company employees (40 | 45.5%), state government employees (20 | 22.7%), and federal government employees (9 | 10.2%) make up the most common classes of employment.
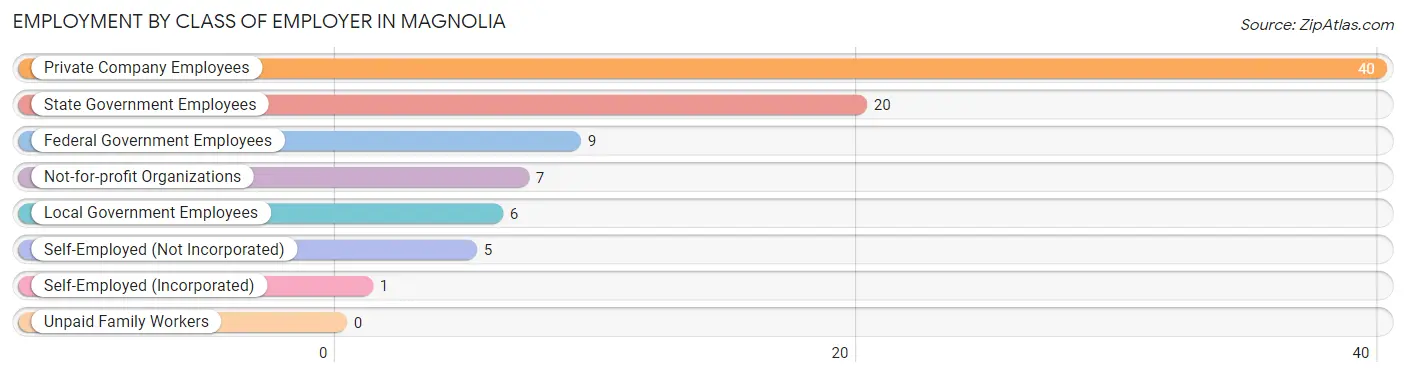
| Employer Class | # Employees | % Employees |
| Private Company Employees | 40 | 45.5% |
| Self-Employed (Incorporated) | 1 | 1.1% |
| Self-Employed (Not Incorporated) | 5 | 5.7% |
| Not-for-profit Organizations | 7 | 8.0% |
| Local Government Employees | 6 | 6.8% |
| State Government Employees | 20 | 22.7% |
| Federal Government Employees | 9 | 10.2% |
| Unpaid Family Workers | 0 | 0.0% |
| Total | 88 | 100.0% |
Employment Status by Age in Magnolia
According to the labor force statistics for Magnolia, out of the total population over 16 years of age (185), 53.0% or 98 individuals are in the labor force, with 9.4% or 9 of them unemployed. The age group with the highest labor force participation rate is 20 to 24 years, with 100.0% or 5 individuals in the labor force. Within the labor force, the 55 to 59 years age range has the highest percentage of unemployed individuals, with 22.7% or 5 of them being unemployed.
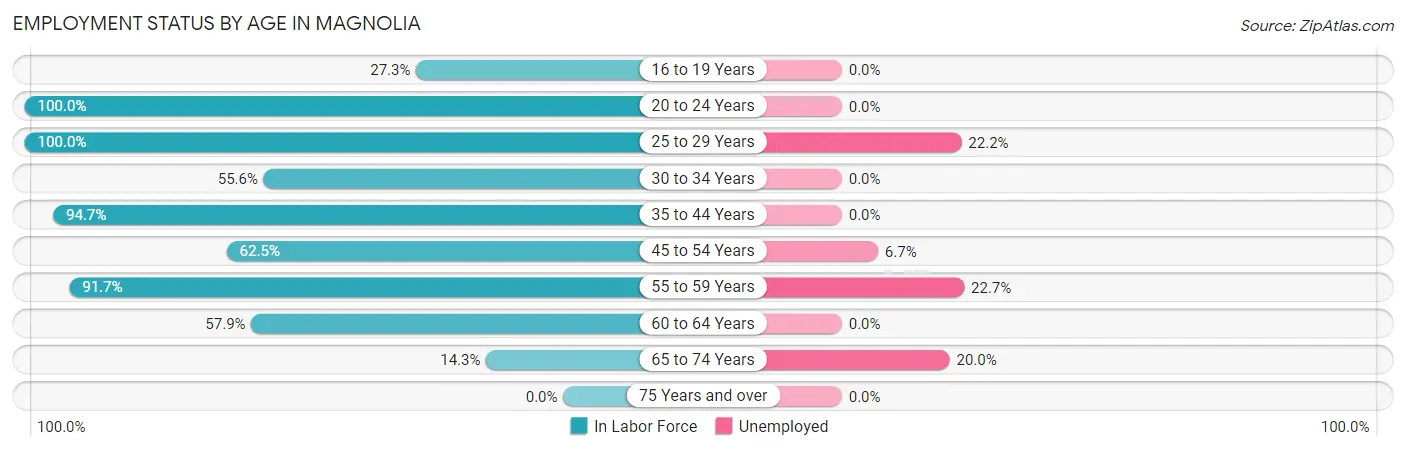
| Age Bracket | In Labor Force | Unemployed |
| 16 to 19 Years | 6 (27.3%) | 0 (0.0%) |
| 20 to 24 Years | 5 (100.0%) | 0 (0.0%) |
| 25 to 29 Years | 11 (100.0%) | 2 (22.2%) |
| 30 to 34 Years | 5 (55.6%) | 0 (0.0%) |
| 35 to 44 Years | 18 (94.7%) | 0 (0.0%) |
| 45 to 54 Years | 15 (62.5%) | 1 (6.7%) |
| 55 to 59 Years | 22 (91.7%) | 5 (22.7%) |
| 60 to 64 Years | 11 (57.9%) | 0 (0.0%) |
| 65 to 74 Years | 5 (14.3%) | 1 (20.0%) |
| 75 Years and over | 0 (0.0%) | 0 (0.0%) |
| Total | 98 (53.0%) | 9 (9.4%) |
Employment Status by Educational Attainment in Magnolia
According to labor force statistics for Magnolia, 77.4% of individuals (82) out of the total population between 25 and 64 years of age (106) are in the labor force, with 10.0% or 8 of them being unemployed. The group with the highest labor force participation rate are those with the educational attainment of college / associate degree, with 91.3% or 21 individuals in the labor force. Within the labor force, individuals with high school diploma education have the highest percentage of unemployment, with 23.1% or 6 of them being unemployed.
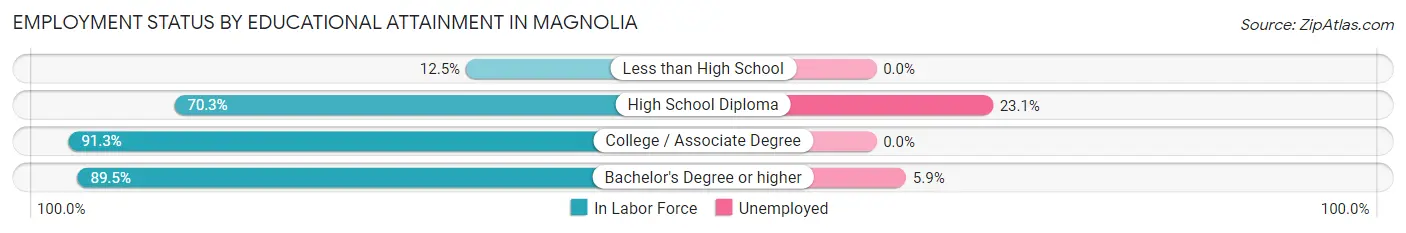
| Educational Attainment | In Labor Force | Unemployed |
| Less than High School | 1 (12.5%) | 0 (0.0%) |
| High School Diploma | 26 (70.3%) | 9 (23.1%) |
| College / Associate Degree | 21 (91.3%) | 0 (0.0%) |
| Bachelor's Degree or higher | 34 (89.5%) | 2 (5.9%) |
| Total | 82 (77.4%) | 11 (10.0%) |
Employment Occupations by Sex in Magnolia
Management, Business, Science and Arts Occupations
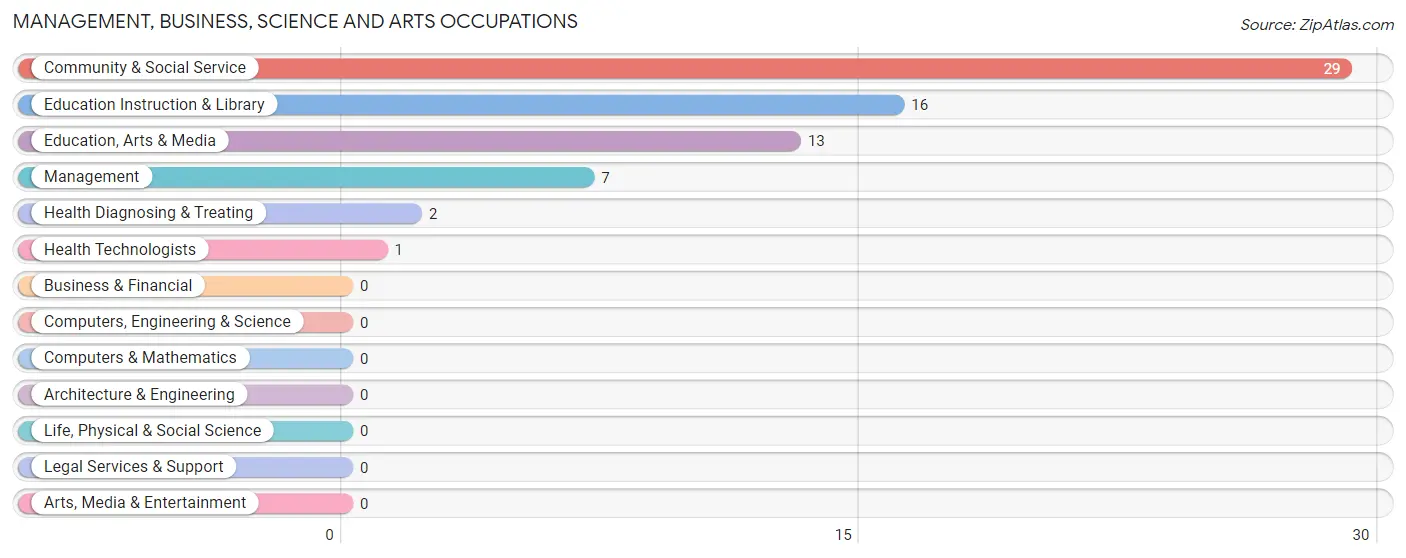
The most common Management, Business, Science and Arts occupations in Magnolia are Community & Social Service (29 | 33.3%), Education Instruction & Library (16 | 18.4%), Education, Arts & Media (13 | 14.9%), Management (7 | 8.1%), and Health Diagnosing & Treating (2 | 2.3%).
Management, Business, Science and Arts Occupations by Sex
Within the Management, Business, Science and Arts occupations in Magnolia, the most male-oriented occupations are Management (71.4%), Education Instruction & Library (12.5%), and Community & Social Service (6.9%), while the most female-oriented occupations are Education, Arts & Media (100.0%), Health Diagnosing & Treating (100.0%), and Health Technologists (100.0%).
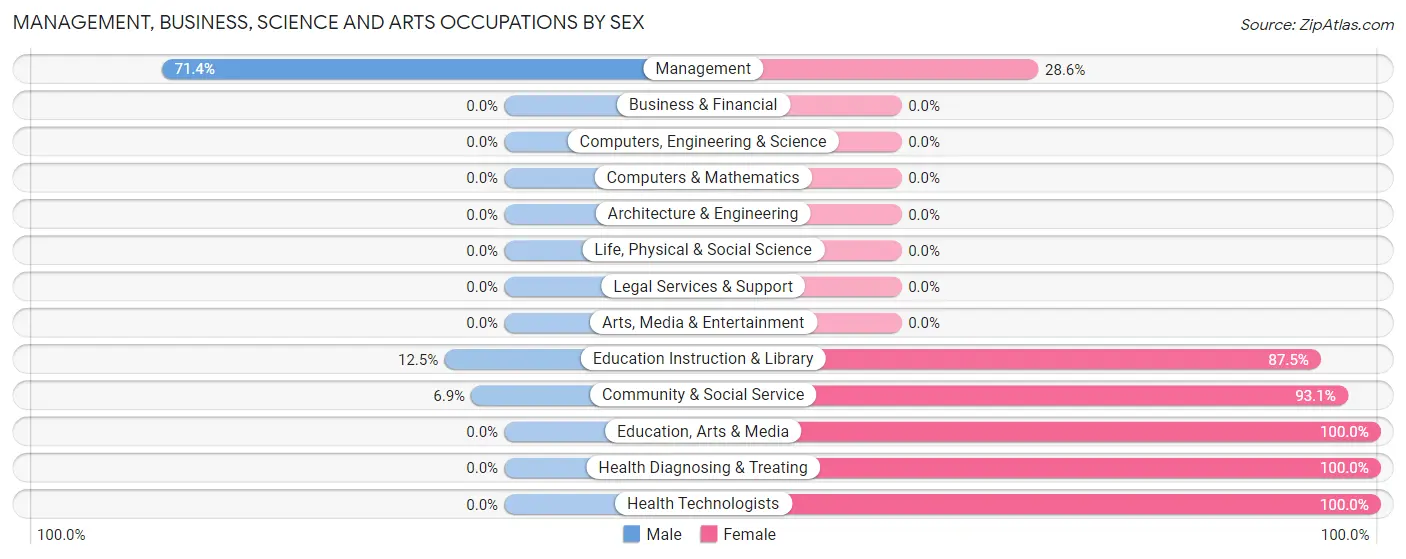
| Occupation | Male | Female |
| Management | 5 (71.4%) | 2 (28.6%) |
| Business & Financial | 0 (0.0%) | 0 (0.0%) |
| Computers, Engineering & Science | 0 (0.0%) | 0 (0.0%) |
| Computers & Mathematics | 0 (0.0%) | 0 (0.0%) |
| Architecture & Engineering | 0 (0.0%) | 0 (0.0%) |
| Life, Physical & Social Science | 0 (0.0%) | 0 (0.0%) |
| Community & Social Service | 2 (6.9%) | 27 (93.1%) |
| Education, Arts & Media | 0 (0.0%) | 13 (100.0%) |
| Legal Services & Support | 0 (0.0%) | 0 (0.0%) |
| Education Instruction & Library | 2 (12.5%) | 14 (87.5%) |
| Arts, Media & Entertainment | 0 (0.0%) | 0 (0.0%) |
| Health Diagnosing & Treating | 0 (0.0%) | 2 (100.0%) |
| Health Technologists | 0 (0.0%) | 1 (100.0%) |
| Total (Category) | 7 (18.4%) | 31 (81.6%) |
| Total (Overall) | 34 (39.1%) | 53 (60.9%) |
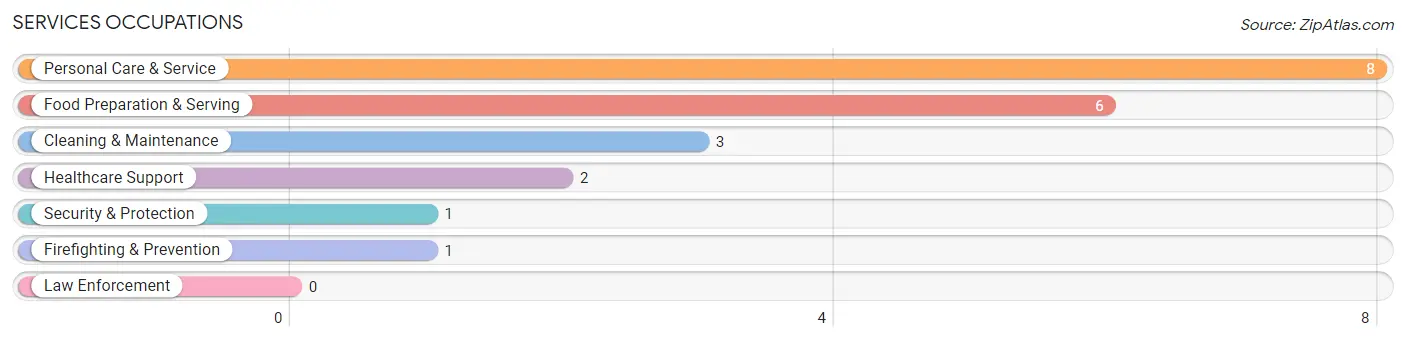
Services Occupations
The most common Services occupations in Magnolia are Personal Care & Service (8 | 9.2%), Food Preparation & Serving (6 | 6.9%), Cleaning & Maintenance (3 | 3.5%), Healthcare Support (2 | 2.3%), and Security & Protection (1 | 1.1%).
Services Occupations by Sex
Within the Services occupations in Magnolia, the most male-oriented occupations are Security & Protection (100.0%), Firefighting & Prevention (100.0%), and Food Preparation & Serving (83.3%), while the most female-oriented occupations are Healthcare Support (100.0%), Personal Care & Service (100.0%), and Cleaning & Maintenance (66.7%).
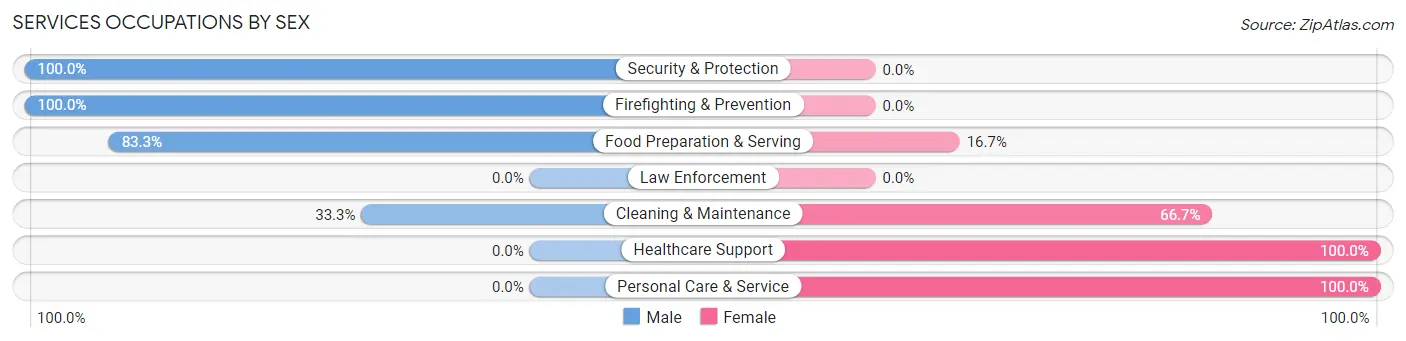
| Occupation | Male | Female |
| Healthcare Support | 0 (0.0%) | 2 (100.0%) |
| Security & Protection | 1 (100.0%) | 0 (0.0%) |
| Firefighting & Prevention | 1 (100.0%) | 0 (0.0%) |
| Law Enforcement | 0 (0.0%) | 0 (0.0%) |
| Food Preparation & Serving | 5 (83.3%) | 1 (16.7%) |
| Cleaning & Maintenance | 1 (33.3%) | 2 (66.7%) |
| Personal Care & Service | 0 (0.0%) | 8 (100.0%) |
| Total (Category) | 7 (35.0%) | 13 (65.0%) |
| Total (Overall) | 34 (39.1%) | 53 (60.9%) |
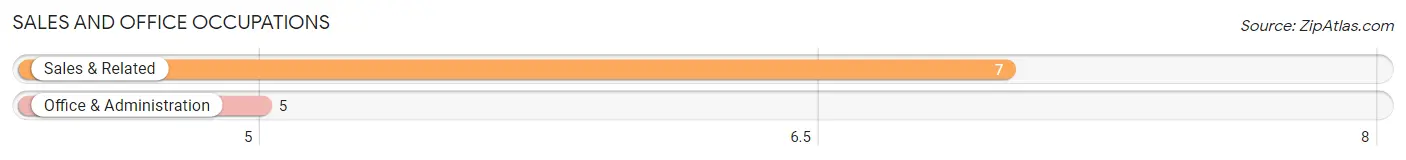
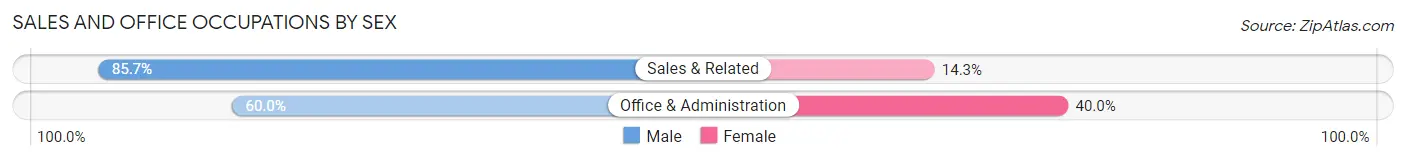
Sales and Office Occupations
The most common Sales and Office occupations in Magnolia are Sales & Related (7 | 8.1%), and Office & Administration (5 | 5.8%).
Sales and Office Occupations by Sex
| Occupation | Male | Female |
| Sales & Related | 6 (85.7%) | 1 (14.3%) |
| Office & Administration | 3 (60.0%) | 2 (40.0%) |
| Total (Category) | 9 (75.0%) | 3 (25.0%) |
| Total (Overall) | 34 (39.1%) | 53 (60.9%) |
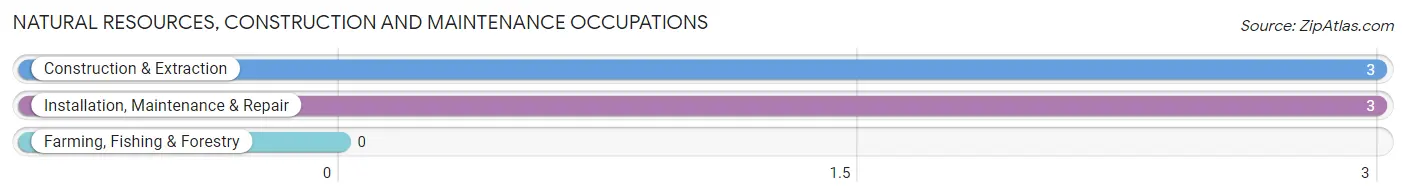
Natural Resources, Construction and Maintenance Occupations
The most common Natural Resources, Construction and Maintenance occupations in Magnolia are Construction & Extraction (3 | 3.5%), and Installation, Maintenance & Repair (3 | 3.5%).
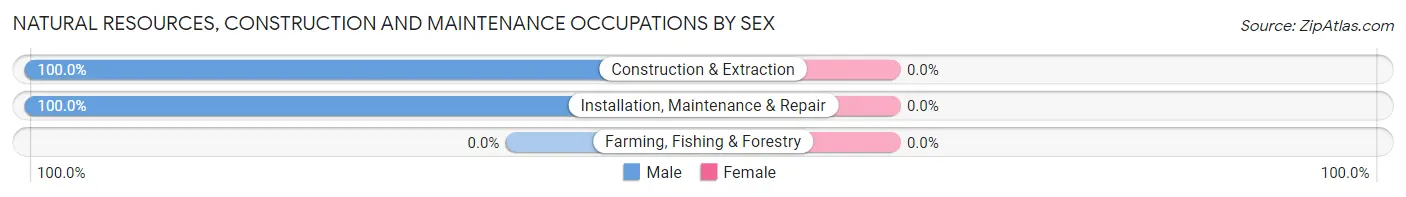
Natural Resources, Construction and Maintenance Occupations by Sex
| Occupation | Male | Female |
| Farming, Fishing & Forestry | 0 (0.0%) | 0 (0.0%) |
| Construction & Extraction | 3 (100.0%) | 0 (0.0%) |
| Installation, Maintenance & Repair | 3 (100.0%) | 0 (0.0%) |
| Total (Category) | 6 (100.0%) | 0 (0.0%) |
| Total (Overall) | 34 (39.1%) | 53 (60.9%) |
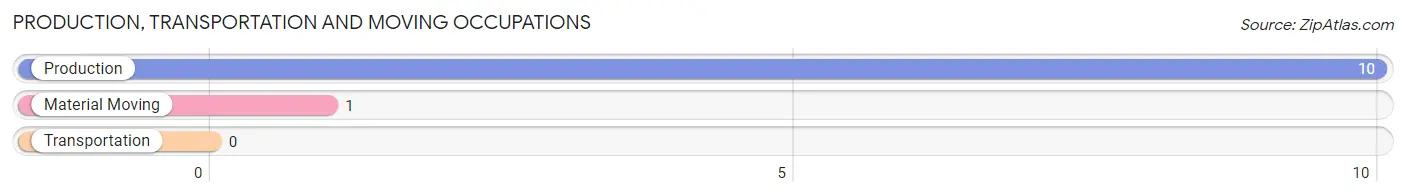
Production, Transportation and Moving Occupations
The most common Production, Transportation and Moving occupations in Magnolia are Production (10 | 11.5%), and Material Moving (1 | 1.1%).
Production, Transportation and Moving Occupations by Sex
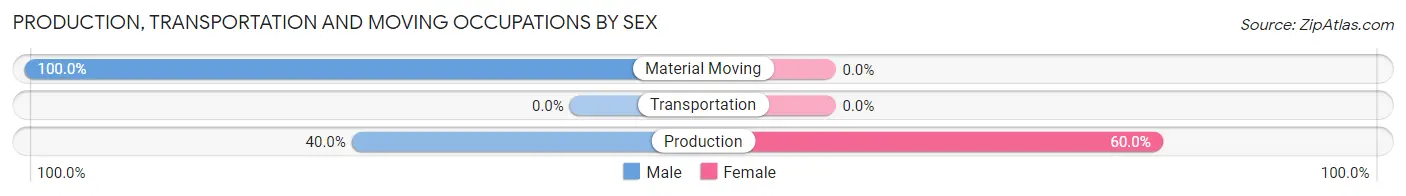
| Occupation | Male | Female |
| Production | 4 (40.0%) | 6 (60.0%) |
| Transportation | 0 (0.0%) | 0 (0.0%) |
| Material Moving | 1 (100.0%) | 0 (0.0%) |
| Total (Category) | 5 (45.5%) | 6 (54.5%) |
| Total (Overall) | 34 (39.1%) | 53 (60.9%) |
Employment Industries by Sex in Magnolia
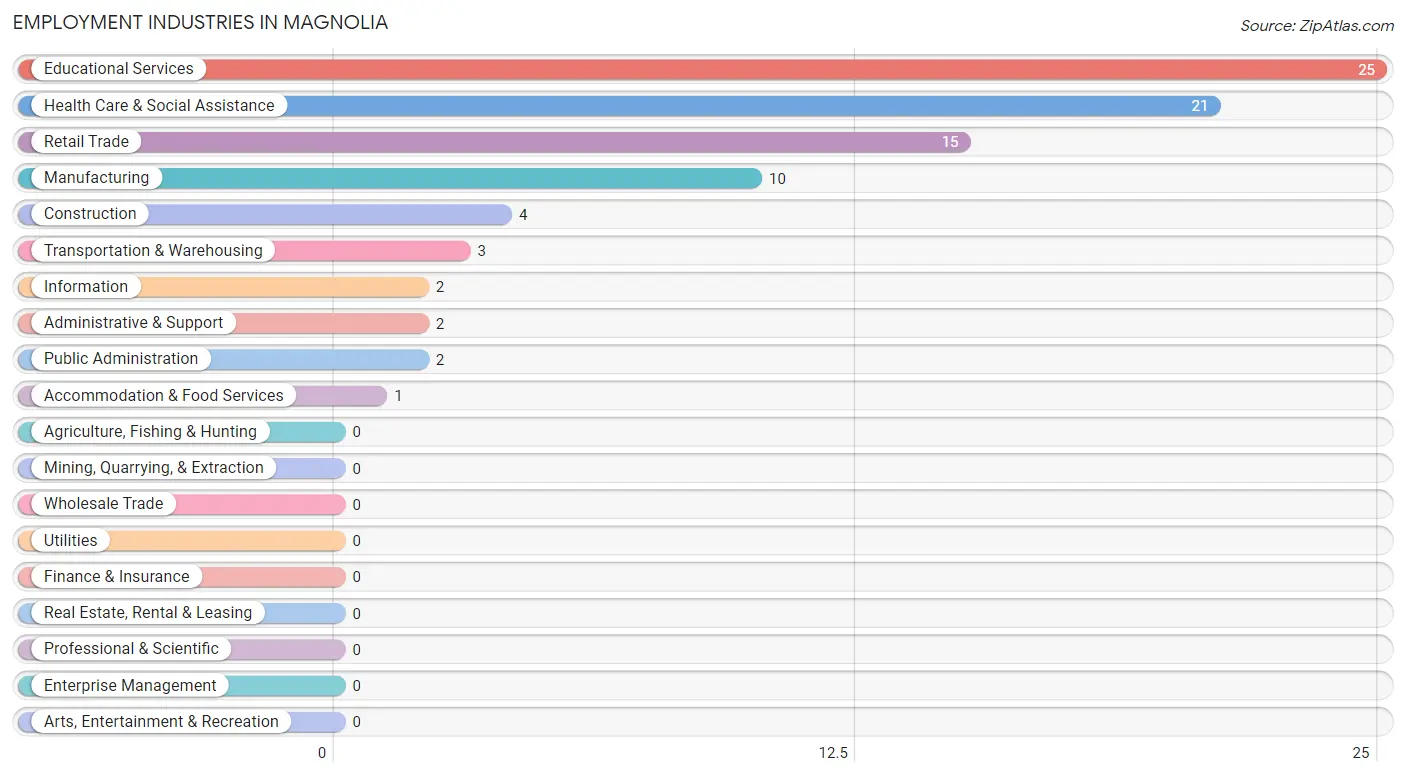
Employment Industries in Magnolia
The major employment industries in Magnolia include Educational Services (25 | 28.7%), Health Care & Social Assistance (21 | 24.1%), Retail Trade (15 | 17.2%), Manufacturing (10 | 11.5%), and Construction (4 | 4.6%).
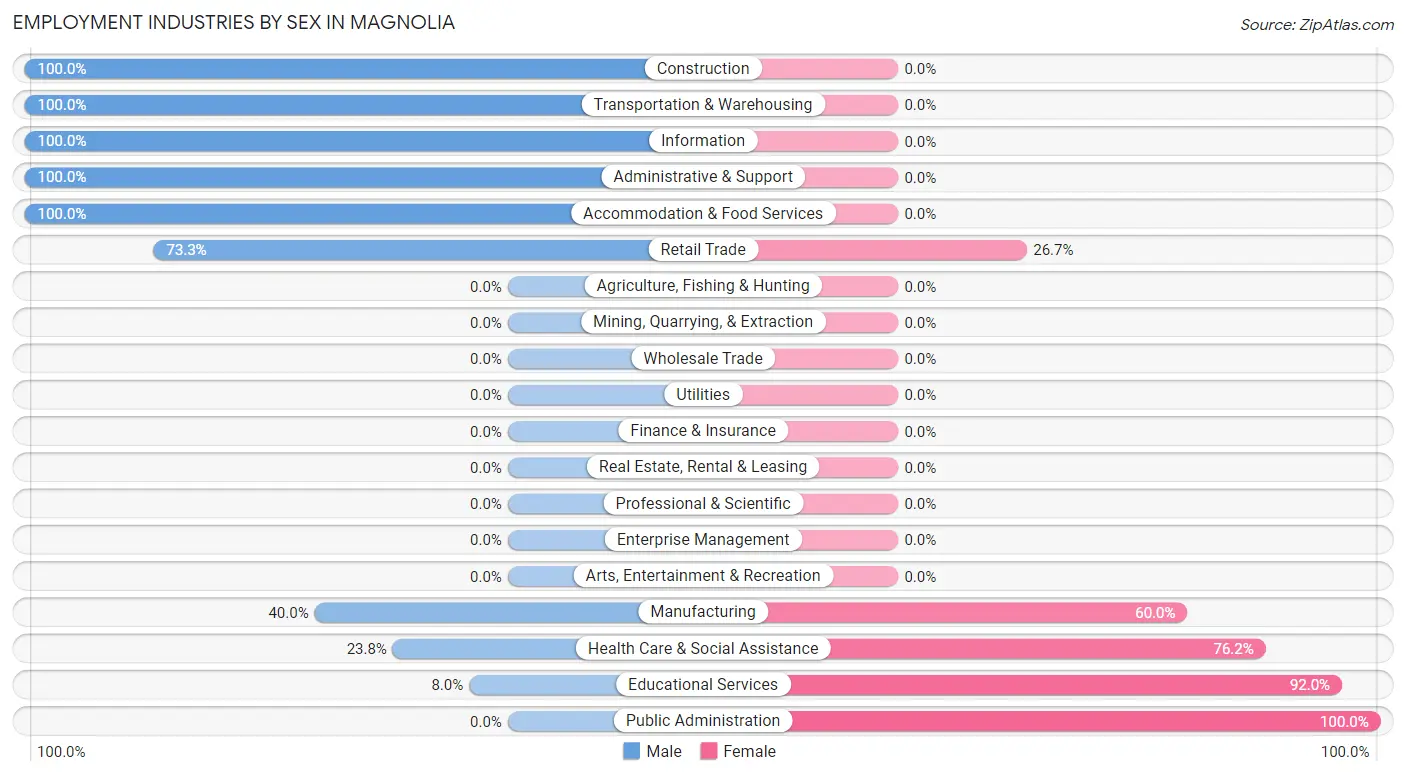
Employment Industries by Sex in Magnolia
The Magnolia industries that see more men than women are Construction (100.0%), Transportation & Warehousing (100.0%), and Information (100.0%), whereas the industries that tend to have a higher number of women are Public Administration (100.0%), Educational Services (92.0%), and Health Care & Social Assistance (76.2%).
| Industry | Male | Female |
| Agriculture, Fishing & Hunting | 0 (0.0%) | 0 (0.0%) |
| Mining, Quarrying, & Extraction | 0 (0.0%) | 0 (0.0%) |
| Construction | 4 (100.0%) | 0 (0.0%) |
| Manufacturing | 4 (40.0%) | 6 (60.0%) |
| Wholesale Trade | 0 (0.0%) | 0 (0.0%) |
| Retail Trade | 11 (73.3%) | 4 (26.7%) |
| Transportation & Warehousing | 3 (100.0%) | 0 (0.0%) |
| Utilities | 0 (0.0%) | 0 (0.0%) |
| Information | 2 (100.0%) | 0 (0.0%) |
| Finance & Insurance | 0 (0.0%) | 0 (0.0%) |
| Real Estate, Rental & Leasing | 0 (0.0%) | 0 (0.0%) |
| Professional & Scientific | 0 (0.0%) | 0 (0.0%) |
| Enterprise Management | 0 (0.0%) | 0 (0.0%) |
| Administrative & Support | 2 (100.0%) | 0 (0.0%) |
| Educational Services | 2 (8.0%) | 23 (92.0%) |
| Health Care & Social Assistance | 5 (23.8%) | 16 (76.2%) |
| Arts, Entertainment & Recreation | 0 (0.0%) | 0 (0.0%) |
| Accommodation & Food Services | 1 (100.0%) | 0 (0.0%) |
| Public Administration | 0 (0.0%) | 2 (100.0%) |
| Total | 34 (39.1%) | 53 (60.9%) |
Education in Magnolia
School Enrollment in Magnolia
The most common levels of schooling among the 94 students in Magnolia are elementary school (47 | 50.0%), college / undergraduate (15 | 16.0%), and middle school (13 | 13.8%).
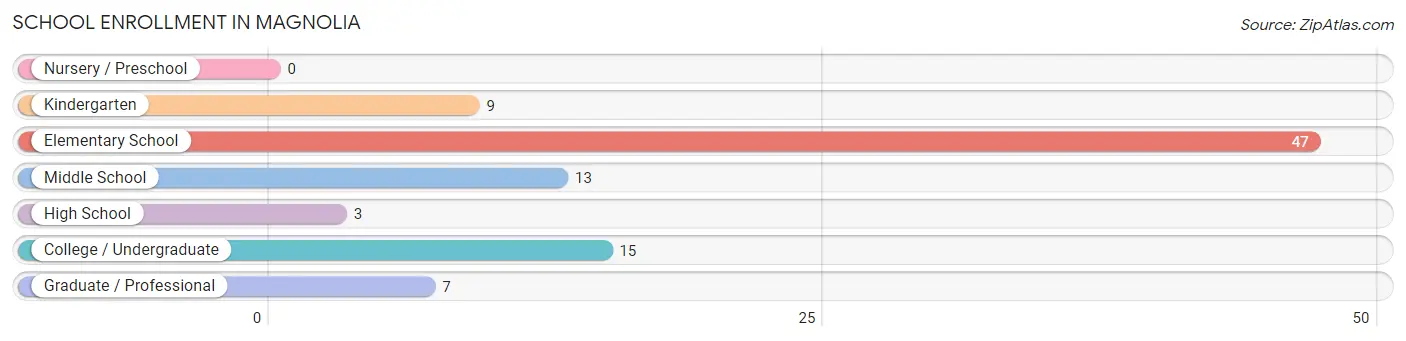
| School Level | # Students | % Students |
| Nursery / Preschool | 0 | 0.0% |
| Kindergarten | 9 | 9.6% |
| Elementary School | 47 | 50.0% |
| Middle School | 13 | 13.8% |
| High School | 3 | 3.2% |
| College / Undergraduate | 15 | 16.0% |
| Graduate / Professional | 7 | 7.4% |
| Total | 94 | 100.0% |
School Enrollment by Age by Funding Source in Magnolia
Out of a total of 94 students who are enrolled in schools in Magnolia, 16 (17.0%) attend a private institution, while the remaining 78 (83.0%) are enrolled in public schools. The age group of 10 to 14 year olds has the highest likelihood of being enrolled in private schools, with 8 (27.6% in the age bracket) enrolled. Conversely, the age group of 15 to 17 year olds has the lowest likelihood of being enrolled in a private school, with 3 (100.0% in the age bracket) attending a public institution.
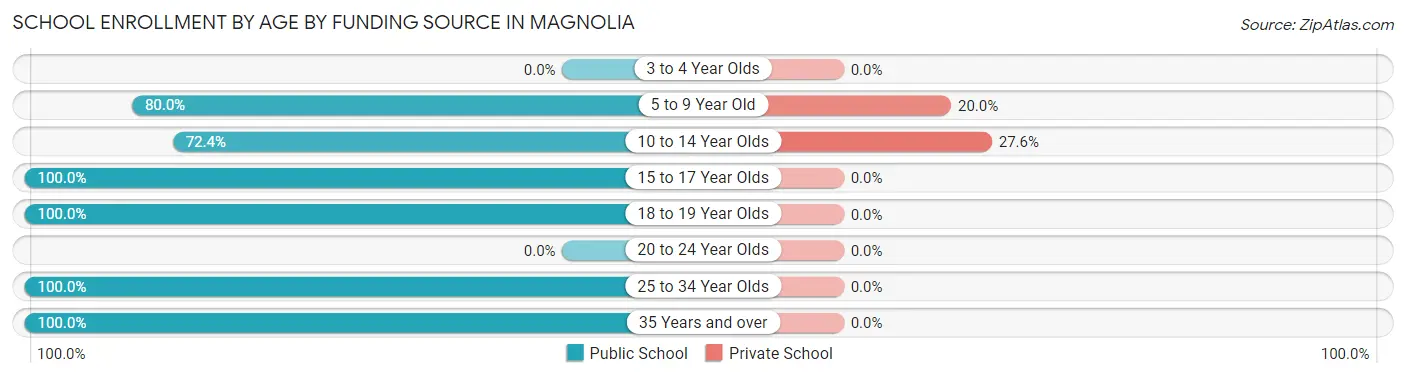
| Age Bracket | Public School | Private School |
| 3 to 4 Year Olds | 0 (0.0%) | 0 (0.0%) |
| 5 to 9 Year Old | 32 (80.0%) | 8 (20.0%) |
| 10 to 14 Year Olds | 21 (72.4%) | 8 (27.6%) |
| 15 to 17 Year Olds | 3 (100.0%) | 0 (0.0%) |
| 18 to 19 Year Olds | 5 (100.0%) | 0 (0.0%) |
| 20 to 24 Year Olds | 0 (0.0%) | 0 (0.0%) |
| 25 to 34 Year Olds | 8 (100.0%) | 0 (0.0%) |
| 35 Years and over | 9 (100.0%) | 0 (0.0%) |
| Total | 78 (83.0%) | 16 (17.0%) |
Educational Attainment by Field of Study in Magnolia
Business (25 | 43.1%), arts & humanities (10 | 17.2%), psychology (9 | 15.5%), education (6 | 10.3%), and social sciences (3 | 5.2%) are the most common fields of study among 58 individuals in Magnolia who have obtained a bachelor's degree or higher.
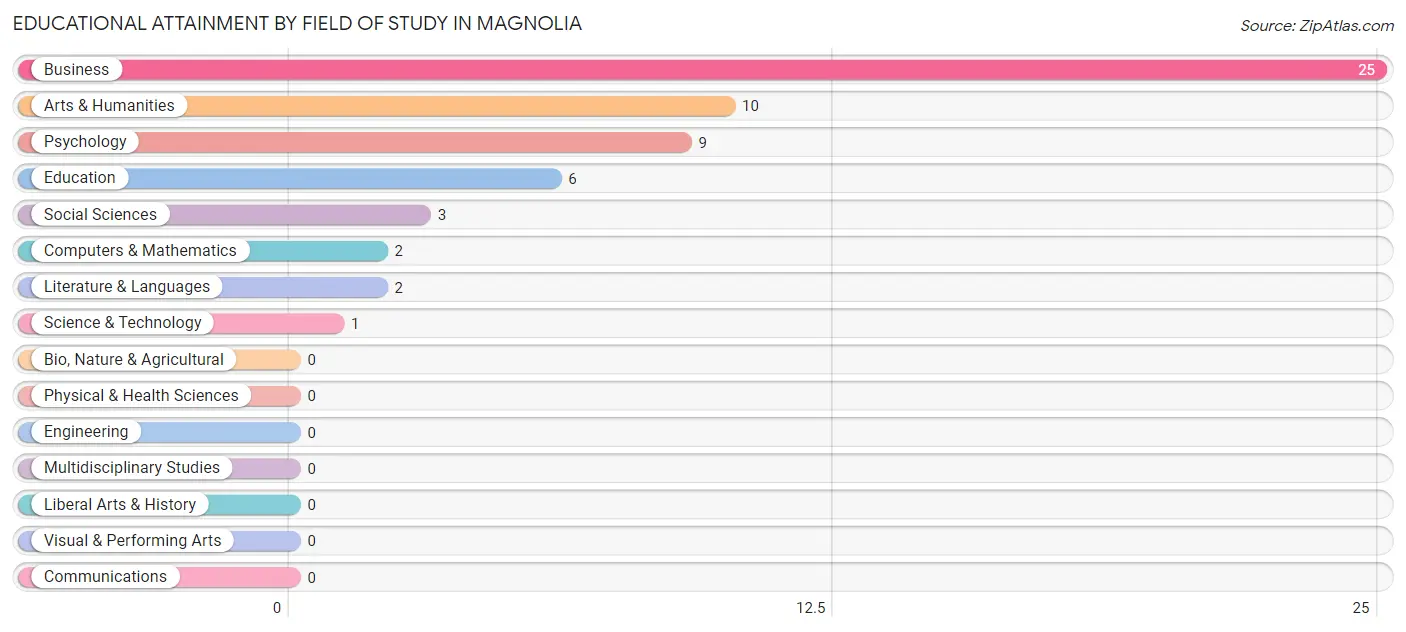
| Field of Study | # Graduates | % Graduates |
| Computers & Mathematics | 2 | 3.5% |
| Bio, Nature & Agricultural | 0 | 0.0% |
| Physical & Health Sciences | 0 | 0.0% |
| Psychology | 9 | 15.5% |
| Social Sciences | 3 | 5.2% |
| Engineering | 0 | 0.0% |
| Multidisciplinary Studies | 0 | 0.0% |
| Science & Technology | 1 | 1.7% |
| Business | 25 | 43.1% |
| Education | 6 | 10.3% |
| Literature & Languages | 2 | 3.5% |
| Liberal Arts & History | 0 | 0.0% |
| Visual & Performing Arts | 0 | 0.0% |
| Communications | 0 | 0.0% |
| Arts & Humanities | 10 | 17.2% |
| Total | 58 | 100.0% |
Transportation & Commute in Magnolia
Vehicle Availability by Sex in Magnolia
The most prevalent vehicle ownership categories in Magnolia are males with 2 vehicles (26, accounting for 72.2%) and females with 2 vehicles (23, making up 50.0%).
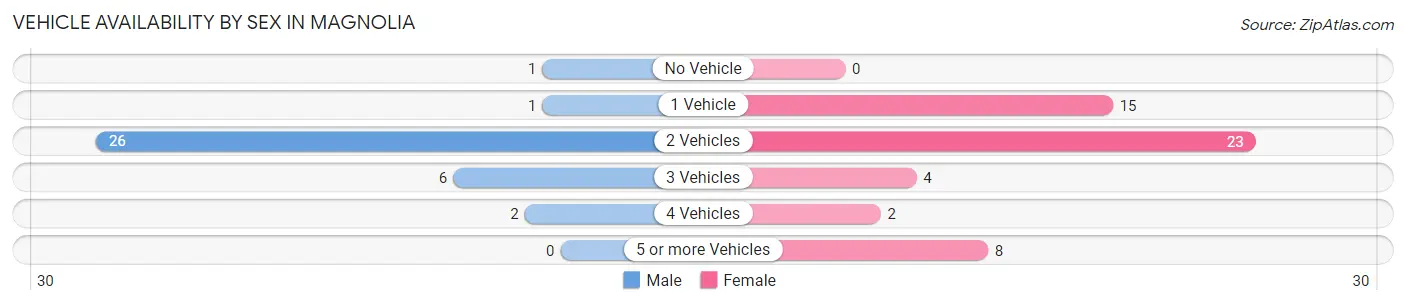
| Vehicles Available | Male | Female |
| No Vehicle | 1 (2.8%) | 0 (0.0%) |
| 1 Vehicle | 1 (2.8%) | 15 (28.8%) |
| 2 Vehicles | 26 (72.2%) | 23 (44.2%) |
| 3 Vehicles | 6 (16.7%) | 4 (7.7%) |
| 4 Vehicles | 2 (5.6%) | 2 (3.8%) |
| 5 or more Vehicles | 0 (0.0%) | 8 (15.4%) |
| Total | 36 (100.0%) | 52 (100.0%) |
Commute Time in Magnolia
The most frequently occuring commute durations in Magnolia are 20 to 24 minutes (21 commuters, 29.6%), 15 to 19 minutes (20 commuters, 28.2%), and 5 to 9 minutes (10 commuters, 14.1%).
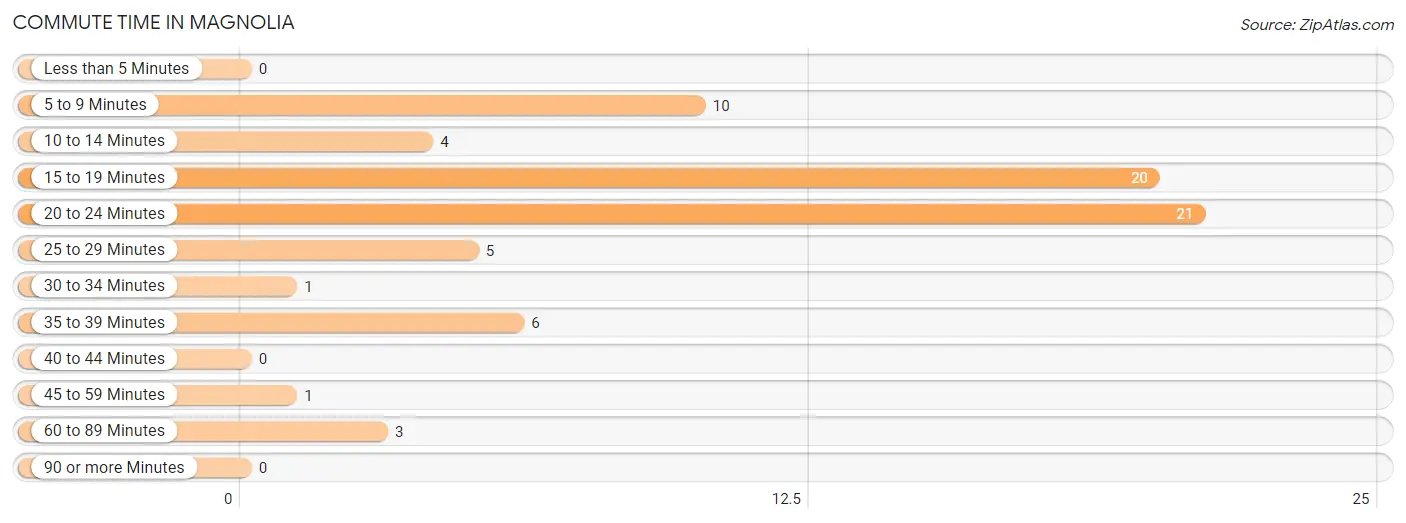
| Commute Time | # Commuters | % Commuters |
| Less than 5 Minutes | 0 | 0.0% |
| 5 to 9 Minutes | 10 | 14.1% |
| 10 to 14 Minutes | 4 | 5.6% |
| 15 to 19 Minutes | 20 | 28.2% |
| 20 to 24 Minutes | 21 | 29.6% |
| 25 to 29 Minutes | 5 | 7.0% |
| 30 to 34 Minutes | 1 | 1.4% |
| 35 to 39 Minutes | 6 | 8.5% |
| 40 to 44 Minutes | 0 | 0.0% |
| 45 to 59 Minutes | 1 | 1.4% |
| 60 to 89 Minutes | 3 | 4.2% |
| 90 or more Minutes | 0 | 0.0% |
Commute Time by Sex in Magnolia
The most common commute times in Magnolia are 20 to 24 minutes (13 commuters, 36.1%) for males and 15 to 19 minutes (11 commuters, 31.4%) for females.
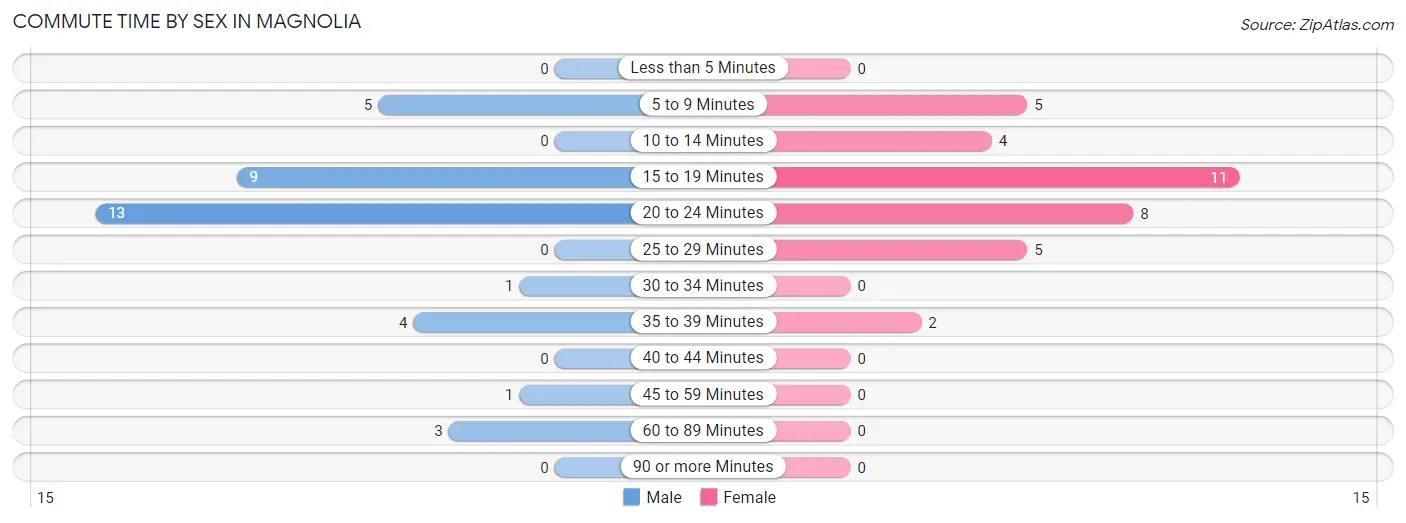
| Commute Time | Male | Female |
| Less than 5 Minutes | 0 (0.0%) | 0 (0.0%) |
| 5 to 9 Minutes | 5 (13.9%) | 5 (14.3%) |
| 10 to 14 Minutes | 0 (0.0%) | 4 (11.4%) |
| 15 to 19 Minutes | 9 (25.0%) | 11 (31.4%) |
| 20 to 24 Minutes | 13 (36.1%) | 8 (22.9%) |
| 25 to 29 Minutes | 0 (0.0%) | 5 (14.3%) |
| 30 to 34 Minutes | 1 (2.8%) | 0 (0.0%) |
| 35 to 39 Minutes | 4 (11.1%) | 2 (5.7%) |
| 40 to 44 Minutes | 0 (0.0%) | 0 (0.0%) |
| 45 to 59 Minutes | 1 (2.8%) | 0 (0.0%) |
| 60 to 89 Minutes | 3 (8.3%) | 0 (0.0%) |
| 90 or more Minutes | 0 (0.0%) | 0 (0.0%) |
Time of Departure to Work by Sex in Magnolia
The most frequent times of departure to work in Magnolia are 7:00 AM to 7:29 AM (11, 30.6%) for males and 8:00 AM to 8:29 AM (10, 28.6%) for females.
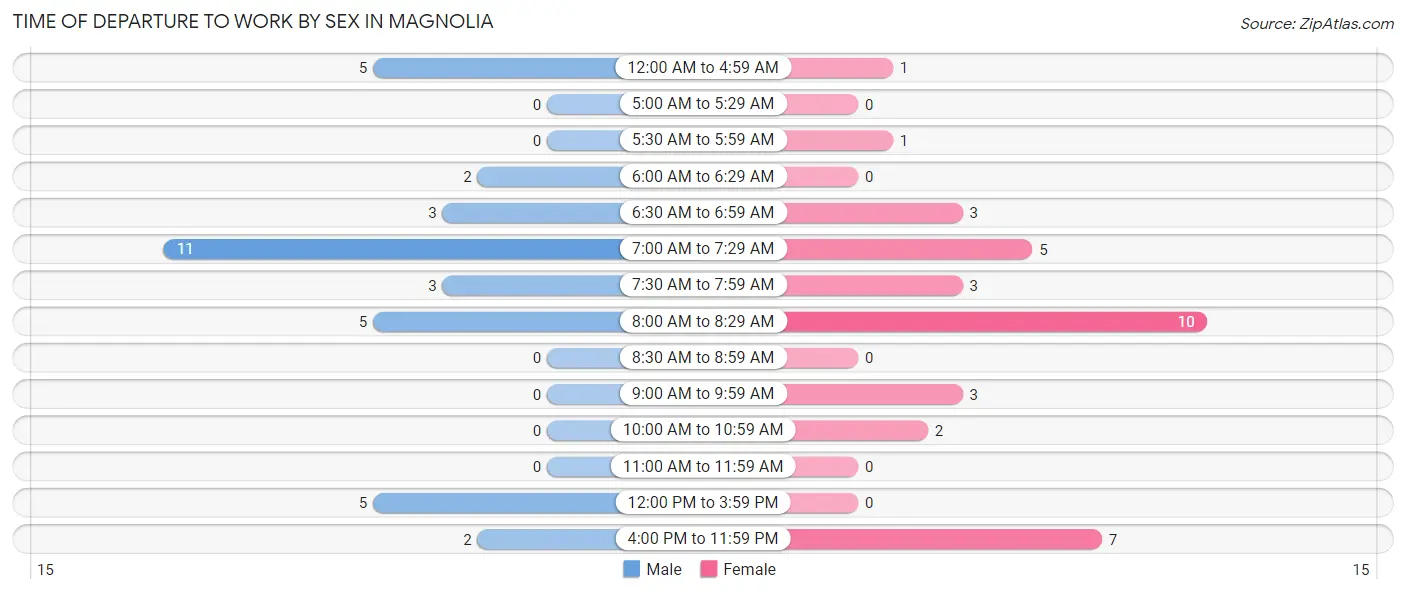
| Time of Departure | Male | Female |
| 12:00 AM to 4:59 AM | 5 (13.9%) | 1 (2.9%) |
| 5:00 AM to 5:29 AM | 0 (0.0%) | 0 (0.0%) |
| 5:30 AM to 5:59 AM | 0 (0.0%) | 1 (2.9%) |
| 6:00 AM to 6:29 AM | 2 (5.6%) | 0 (0.0%) |
| 6:30 AM to 6:59 AM | 3 (8.3%) | 3 (8.6%) |
| 7:00 AM to 7:29 AM | 11 (30.6%) | 5 (14.3%) |
| 7:30 AM to 7:59 AM | 3 (8.3%) | 3 (8.6%) |
| 8:00 AM to 8:29 AM | 5 (13.9%) | 10 (28.6%) |
| 8:30 AM to 8:59 AM | 0 (0.0%) | 0 (0.0%) |
| 9:00 AM to 9:59 AM | 0 (0.0%) | 3 (8.6%) |
| 10:00 AM to 10:59 AM | 0 (0.0%) | 2 (5.7%) |
| 11:00 AM to 11:59 AM | 0 (0.0%) | 0 (0.0%) |
| 12:00 PM to 3:59 PM | 5 (13.9%) | 0 (0.0%) |
| 4:00 PM to 11:59 PM | 2 (5.6%) | 7 (20.0%) |
| Total | 36 (100.0%) | 35 (100.0%) |
Housing Occupancy in Magnolia
Occupancy by Ownership in Magnolia
Of the total 94 dwellings in Magnolia, owner-occupied units account for 70 (74.5%), while renter-occupied units make up 24 (25.5%).
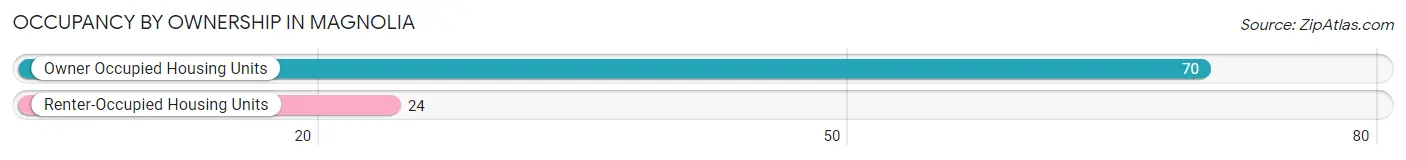
| Occupancy | # Housing Units | % Housing Units |
| Owner Occupied Housing Units | 70 | 74.5% |
| Renter-Occupied Housing Units | 24 | 25.5% |
| Total Occupied Housing Units | 94 | 100.0% |
Occupancy by Household Size in Magnolia
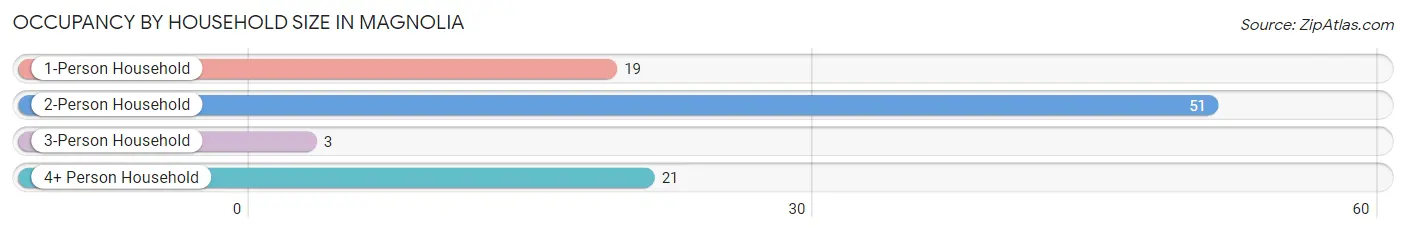
| Household Size | # Housing Units | % Housing Units |
| 1-Person Household | 19 | 20.2% |
| 2-Person Household | 51 | 54.3% |
| 3-Person Household | 3 | 3.2% |
| 4+ Person Household | 21 | 22.3% |
| Total Housing Units | 94 | 100.0% |
Occupancy by Ownership by Household Size in Magnolia
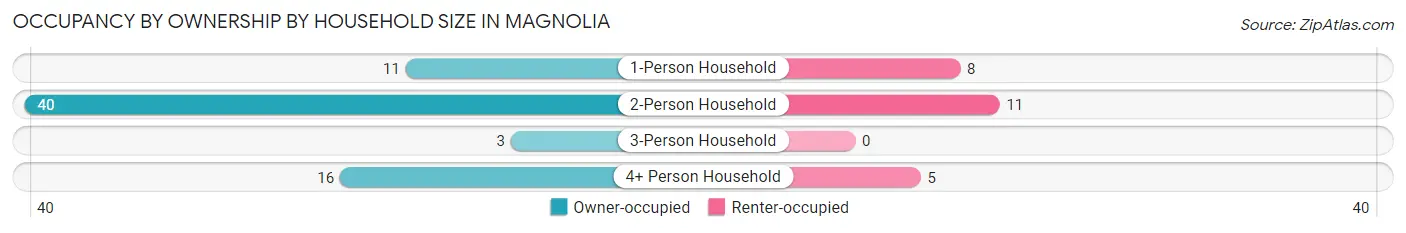
| Household Size | Owner-occupied | Renter-occupied |
| 1-Person Household | 11 (57.9%) | 8 (42.1%) |
| 2-Person Household | 40 (78.4%) | 11 (21.6%) |
| 3-Person Household | 3 (100.0%) | 0 (0.0%) |
| 4+ Person Household | 16 (76.2%) | 5 (23.8%) |
| Total Housing Units | 70 (74.5%) | 24 (25.5%) |
Occupancy by Educational Attainment in Magnolia
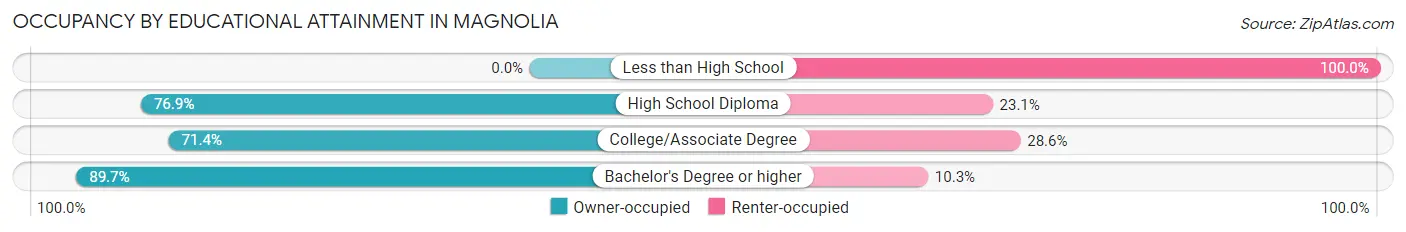
| Household Size | Owner-occupied | Renter-occupied |
| Less than High School | 0 (0.0%) | 8 (100.0%) |
| High School Diploma | 20 (76.9%) | 6 (23.1%) |
| College/Associate Degree | 15 (71.4%) | 6 (28.6%) |
| Bachelor's Degree or higher | 35 (89.7%) | 4 (10.3%) |
Occupancy by Age of Householder in Magnolia
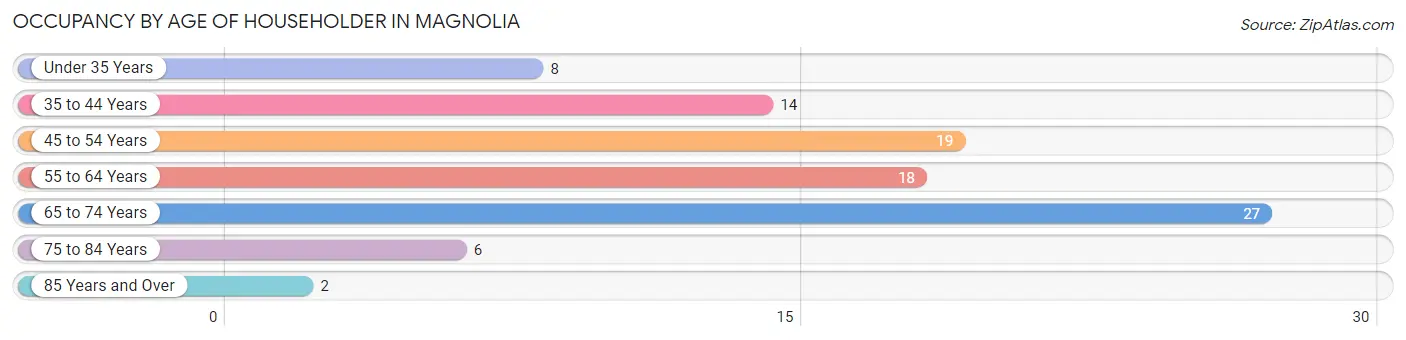
| Age Bracket | # Households | % Households |
| Under 35 Years | 8 | 8.5% |
| 35 to 44 Years | 14 | 14.9% |
| 45 to 54 Years | 19 | 20.2% |
| 55 to 64 Years | 18 | 19.2% |
| 65 to 74 Years | 27 | 28.7% |
| 75 to 84 Years | 6 | 6.4% |
| 85 Years and Over | 2 | 2.1% |
| Total | 94 | 100.0% |
Housing Finances in Magnolia
Median Income by Occupancy in Magnolia
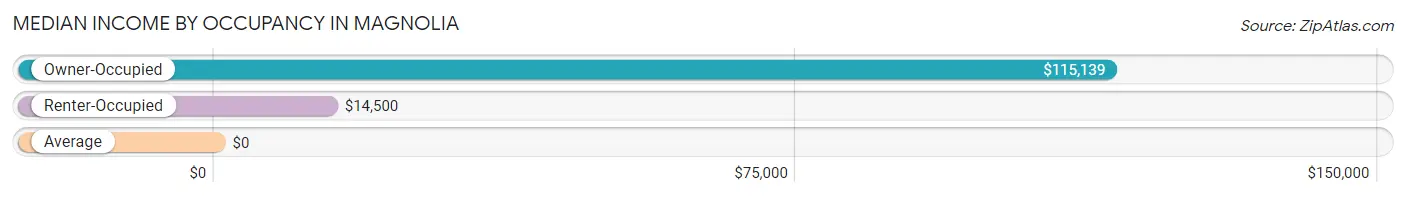
| Occupancy Type | # Households | Median Income |
| Owner-Occupied | 70 (74.5%) | $115,139 |
| Renter-Occupied | 24 (25.5%) | $14,500 |
| Average | 94 (100.0%) | $0 |
Occupancy by Householder Income Bracket in Magnolia
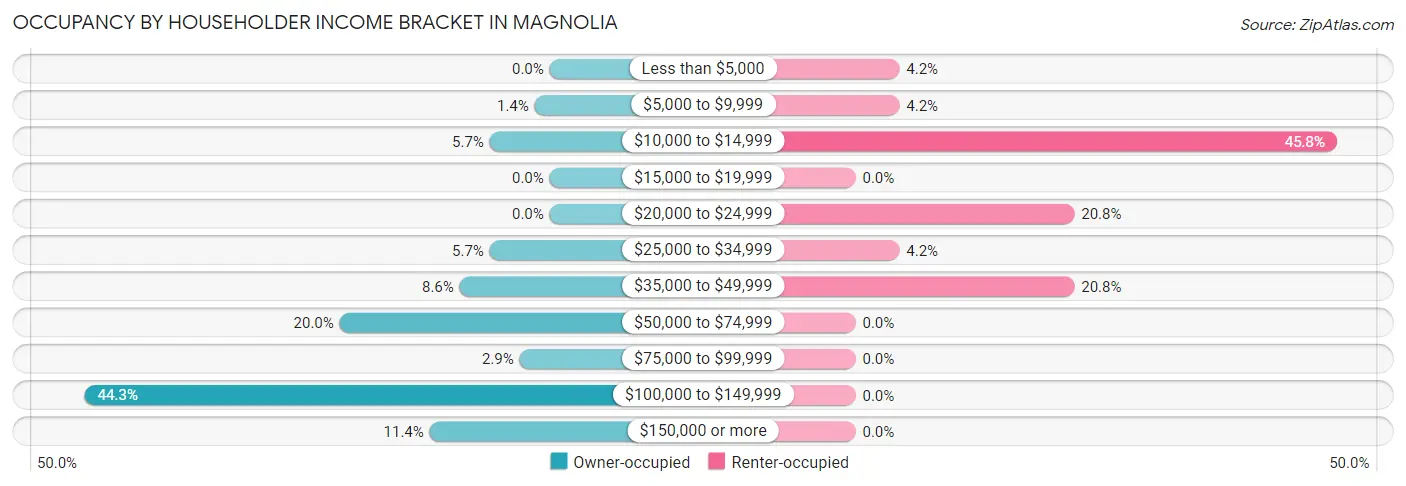
| Income Bracket | Owner-occupied | Renter-occupied |
| Less than $5,000 | 0 (0.0%) | 1 (4.2%) |
| $5,000 to $9,999 | 1 (1.4%) | 1 (4.2%) |
| $10,000 to $14,999 | 4 (5.7%) | 11 (45.8%) |
| $15,000 to $19,999 | 0 (0.0%) | 0 (0.0%) |
| $20,000 to $24,999 | 0 (0.0%) | 5 (20.8%) |
| $25,000 to $34,999 | 4 (5.7%) | 1 (4.2%) |
| $35,000 to $49,999 | 6 (8.6%) | 5 (20.8%) |
| $50,000 to $74,999 | 14 (20.0%) | 0 (0.0%) |
| $75,000 to $99,999 | 2 (2.9%) | 0 (0.0%) |
| $100,000 to $149,999 | 31 (44.3%) | 0 (0.0%) |
| $150,000 or more | 8 (11.4%) | 0 (0.0%) |
| Total | 70 (100.0%) | 24 (100.0%) |
Monthly Housing Cost Tiers in Magnolia
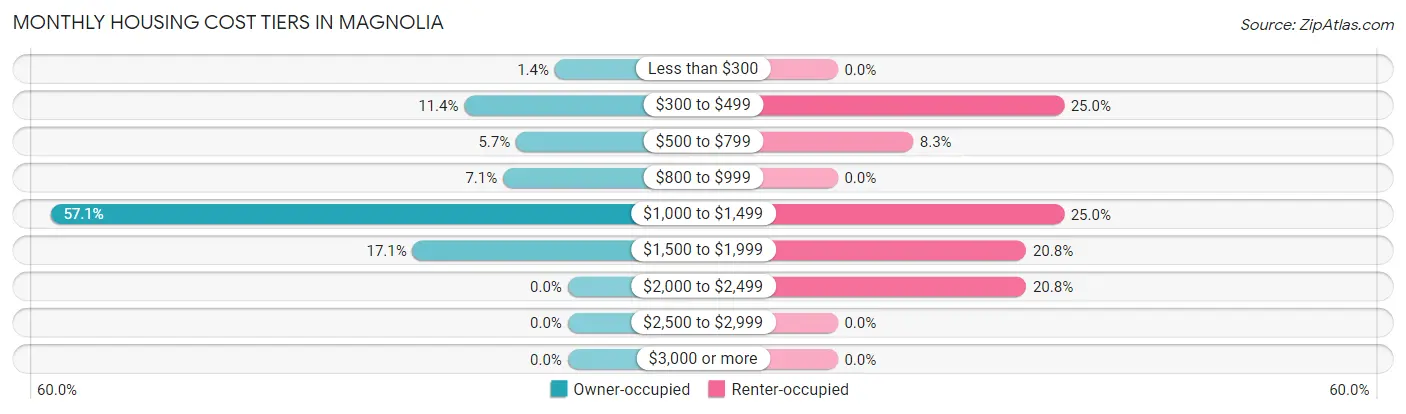
| Monthly Cost | Owner-occupied | Renter-occupied |
| Less than $300 | 1 (1.4%) | 0 (0.0%) |
| $300 to $499 | 8 (11.4%) | 6 (25.0%) |
| $500 to $799 | 4 (5.7%) | 2 (8.3%) |
| $800 to $999 | 5 (7.1%) | 0 (0.0%) |
| $1,000 to $1,499 | 40 (57.1%) | 6 (25.0%) |
| $1,500 to $1,999 | 12 (17.1%) | 5 (20.8%) |
| $2,000 to $2,499 | 0 (0.0%) | 5 (20.8%) |
| $2,500 to $2,999 | 0 (0.0%) | 0 (0.0%) |
| $3,000 or more | 0 (0.0%) | 0 (0.0%) |
| Total | 70 (100.0%) | 24 (100.0%) |
Physical Housing Characteristics in Magnolia
Housing Structures in Magnolia
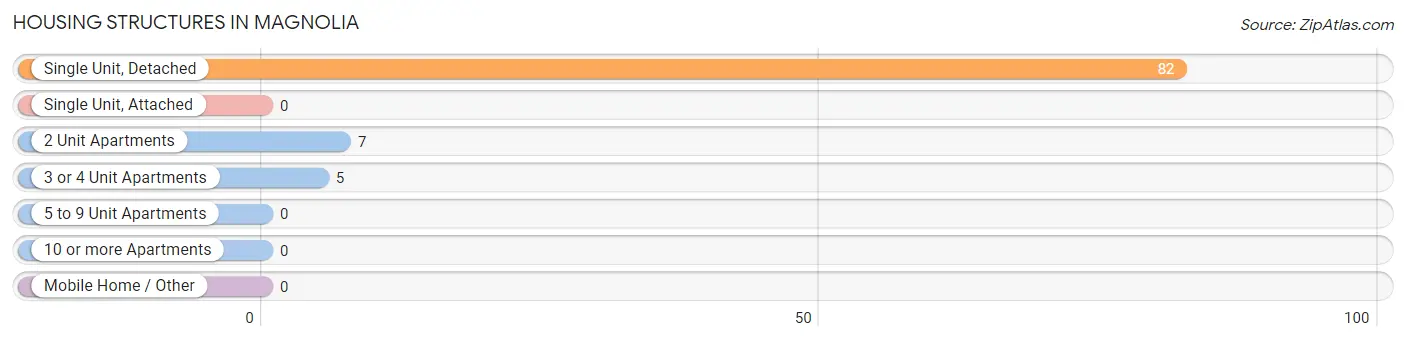
| Structure Type | # Housing Units | % Housing Units |
| Single Unit, Detached | 82 | 87.2% |
| Single Unit, Attached | 0 | 0.0% |
| 2 Unit Apartments | 7 | 7.4% |
| 3 or 4 Unit Apartments | 5 | 5.3% |
| 5 to 9 Unit Apartments | 0 | 0.0% |
| 10 or more Apartments | 0 | 0.0% |
| Mobile Home / Other | 0 | 0.0% |
| Total | 94 | 100.0% |
Housing Structures by Occupancy in Magnolia
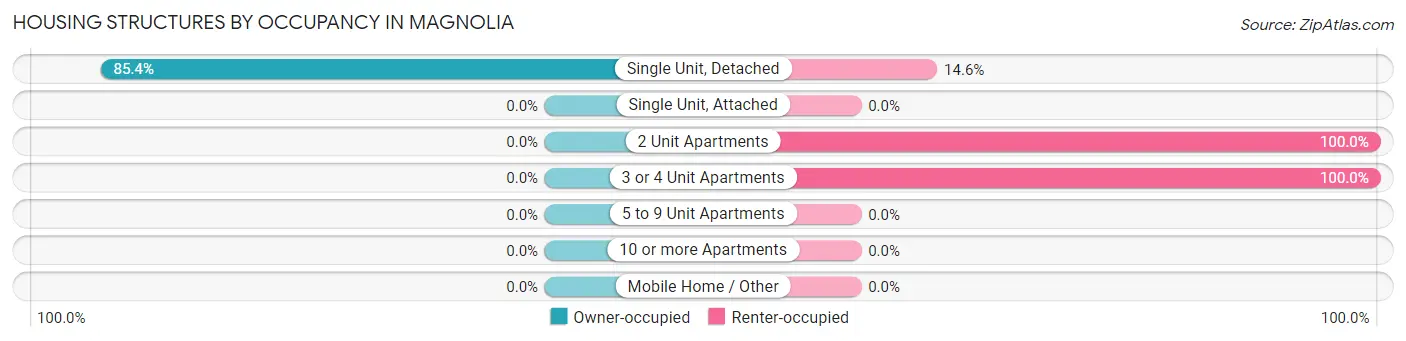
| Structure Type | Owner-occupied | Renter-occupied |
| Single Unit, Detached | 70 (85.4%) | 12 (14.6%) |
| Single Unit, Attached | 0 (0.0%) | 0 (0.0%) |
| 2 Unit Apartments | 0 (0.0%) | 7 (100.0%) |
| 3 or 4 Unit Apartments | 0 (0.0%) | 5 (100.0%) |
| 5 to 9 Unit Apartments | 0 (0.0%) | 0 (0.0%) |
| 10 or more Apartments | 0 (0.0%) | 0 (0.0%) |
| Mobile Home / Other | 0 (0.0%) | 0 (0.0%) |
| Total | 70 (74.5%) | 24 (25.5%) |
Housing Structures by Number of Rooms in Magnolia
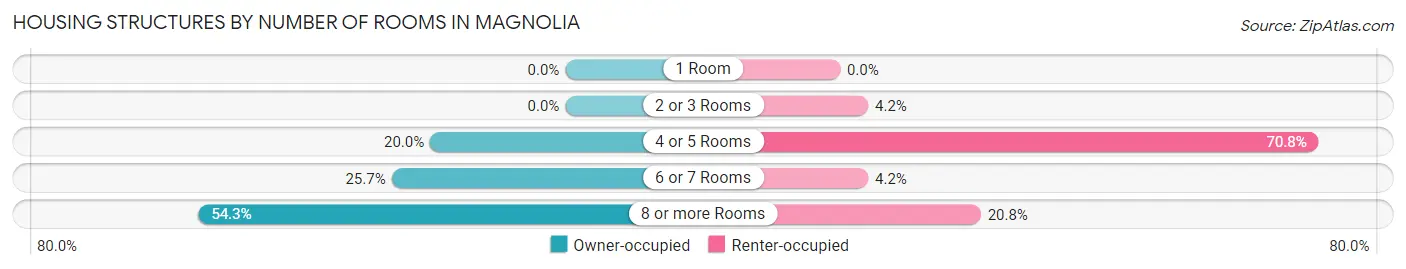
| Number of Rooms | Owner-occupied | Renter-occupied |
| 1 Room | 0 (0.0%) | 0 (0.0%) |
| 2 or 3 Rooms | 0 (0.0%) | 1 (4.2%) |
| 4 or 5 Rooms | 14 (20.0%) | 17 (70.8%) |
| 6 or 7 Rooms | 18 (25.7%) | 1 (4.2%) |
| 8 or more Rooms | 38 (54.3%) | 5 (20.8%) |
| Total | 70 (100.0%) | 24 (100.0%) |
Housing Structure by Heating Type in Magnolia
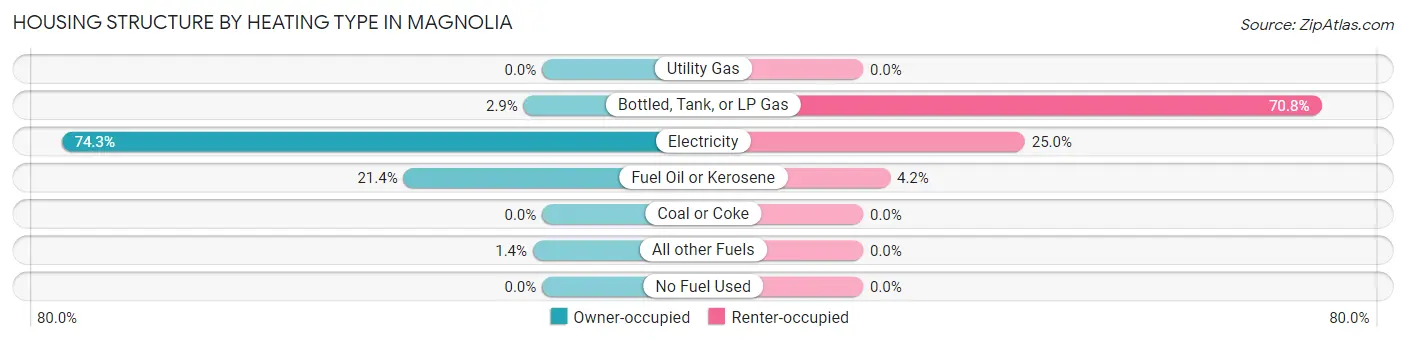
| Heating Type | Owner-occupied | Renter-occupied |
| Utility Gas | 0 (0.0%) | 0 (0.0%) |
| Bottled, Tank, or LP Gas | 2 (2.9%) | 17 (70.8%) |
| Electricity | 52 (74.3%) | 6 (25.0%) |
| Fuel Oil or Kerosene | 15 (21.4%) | 1 (4.2%) |
| Coal or Coke | 0 (0.0%) | 0 (0.0%) |
| All other Fuels | 1 (1.4%) | 0 (0.0%) |
| No Fuel Used | 0 (0.0%) | 0 (0.0%) |
| Total | 70 (100.0%) | 24 (100.0%) |
Household Vehicle Usage in Magnolia
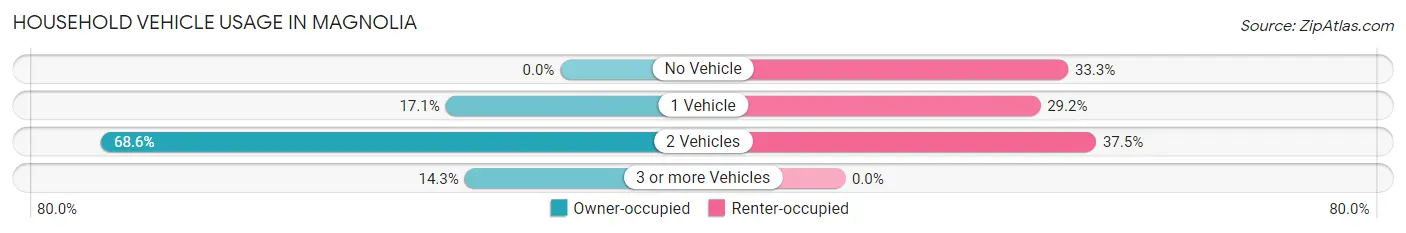
| Vehicles per Household | Owner-occupied | Renter-occupied |
| No Vehicle | 0 (0.0%) | 8 (33.3%) |
| 1 Vehicle | 12 (17.1%) | 7 (29.2%) |
| 2 Vehicles | 48 (68.6%) | 9 (37.5%) |
| 3 or more Vehicles | 10 (14.3%) | 0 (0.0%) |
| Total | 70 (100.0%) | 24 (100.0%) |
Real Estate & Mortgages in Magnolia
Real Estate and Mortgage Overview in Magnolia
| Characteristic | Without Mortgage | With Mortgage |
| Housing Units | 12 | 58 |
| Median Property Value | $221,400 | $178,300 |
| Median Household Income | - | - |
| Monthly Housing Costs | $375 | $0 |
| Real Estate Taxes | $640 | $0 |
Property Value by Mortgage Status in Magnolia
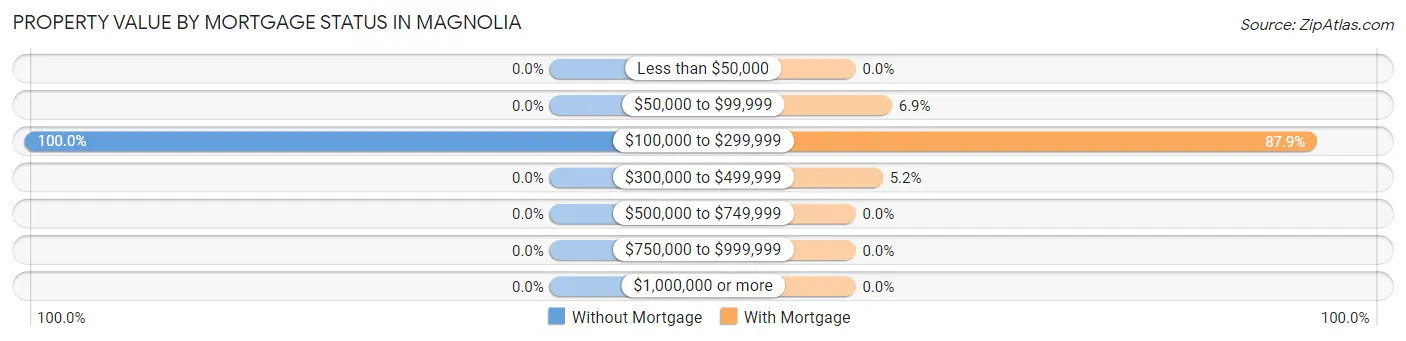
| Property Value | Without Mortgage | With Mortgage |
| Less than $50,000 | 0 (0.0%) | 0 (0.0%) |
| $50,000 to $99,999 | 0 (0.0%) | 4 (6.9%) |
| $100,000 to $299,999 | 12 (100.0%) | 51 (87.9%) |
| $300,000 to $499,999 | 0 (0.0%) | 3 (5.2%) |
| $500,000 to $749,999 | 0 (0.0%) | 0 (0.0%) |
| $750,000 to $999,999 | 0 (0.0%) | 0 (0.0%) |
| $1,000,000 or more | 0 (0.0%) | 0 (0.0%) |
| Total | 12 (100.0%) | 58 (100.0%) |
Household Income by Mortgage Status in Magnolia
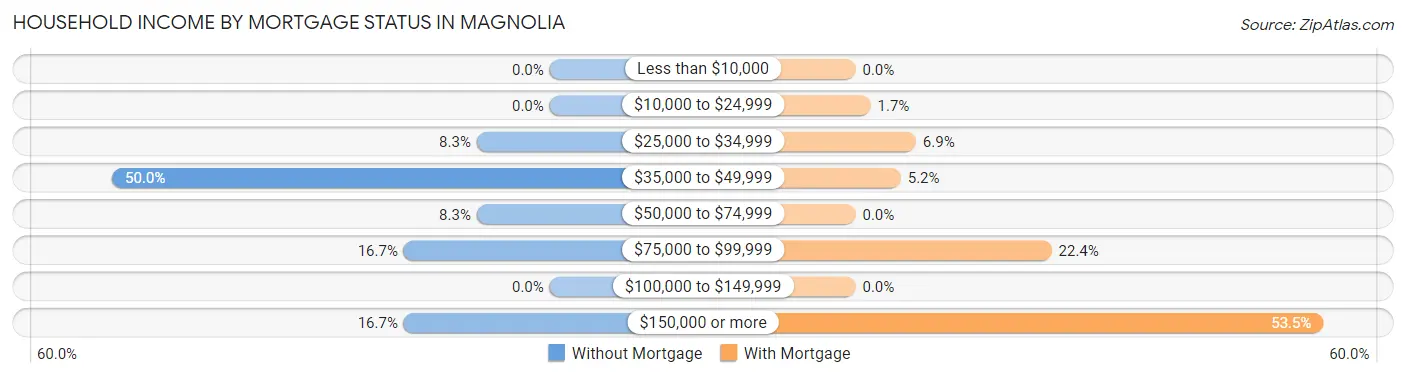
| Household Income | Without Mortgage | With Mortgage |
| Less than $10,000 | 0 (0.0%) | 0 (0.0%) |
| $10,000 to $24,999 | 0 (0.0%) | 1 (1.7%) |
| $25,000 to $34,999 | 1 (8.3%) | 4 (6.9%) |
| $35,000 to $49,999 | 6 (50.0%) | 3 (5.2%) |
| $50,000 to $74,999 | 1 (8.3%) | 0 (0.0%) |
| $75,000 to $99,999 | 2 (16.7%) | 13 (22.4%) |
| $100,000 to $149,999 | 0 (0.0%) | 0 (0.0%) |
| $150,000 or more | 2 (16.7%) | 31 (53.4%) |
| Total | 12 (100.0%) | 58 (100.0%) |
Property Value to Household Income Ratio in Magnolia
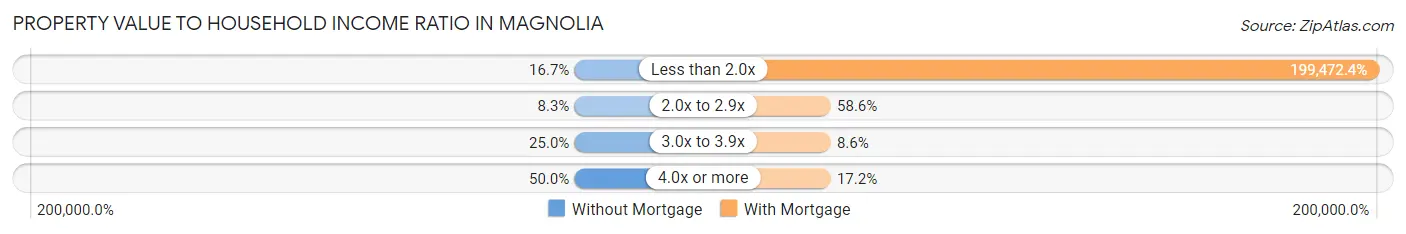
| Value-to-Income Ratio | Without Mortgage | With Mortgage |
| Less than 2.0x | 2 (16.7%) | 115,694 (199,472.4%) |
| 2.0x to 2.9x | 1 (8.3%) | 34 (58.6%) |
| 3.0x to 3.9x | 3 (25.0%) | 5 (8.6%) |
| 4.0x or more | 6 (50.0%) | 10 (17.2%) |
| Total | 12 (100.0%) | 58 (100.0%) |
Real Estate Taxes by Mortgage Status in Magnolia
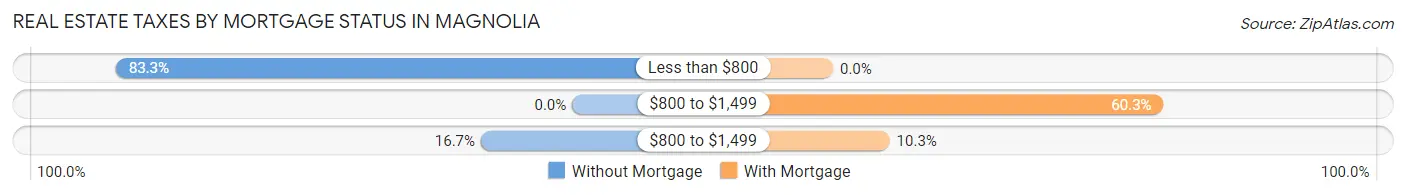
| Property Taxes | Without Mortgage | With Mortgage |
| Less than $800 | 10 (83.3%) | 0 (0.0%) |
| $800 to $1,499 | 0 (0.0%) | 35 (60.3%) |
| $800 to $1,499 | 2 (16.7%) | 6 (10.3%) |
| Total | 12 (100.0%) | 58 (100.0%) |
Health & Disability in Magnolia
Health Insurance Coverage by Age in Magnolia
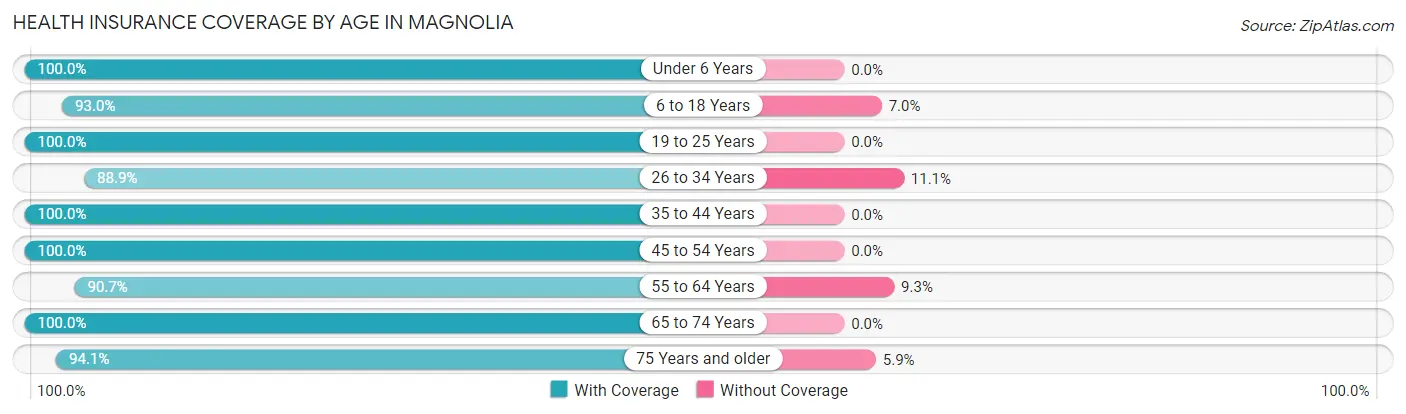
| Age Bracket | With Coverage | Without Coverage |
| Under 6 Years | 8 (100.0%) | 0 (0.0%) |
| 6 to 18 Years | 80 (93.0%) | 6 (7.0%) |
| 19 to 25 Years | 11 (100.0%) | 0 (0.0%) |
| 26 to 34 Years | 16 (88.9%) | 2 (11.1%) |
| 35 to 44 Years | 19 (100.0%) | 0 (0.0%) |
| 45 to 54 Years | 24 (100.0%) | 0 (0.0%) |
| 55 to 64 Years | 39 (90.7%) | 4 (9.3%) |
| 65 to 74 Years | 35 (100.0%) | 0 (0.0%) |
| 75 Years and older | 16 (94.1%) | 1 (5.9%) |
| Total | 248 (95.0%) | 13 (5.0%) |
Health Insurance Coverage by Citizenship Status in Magnolia
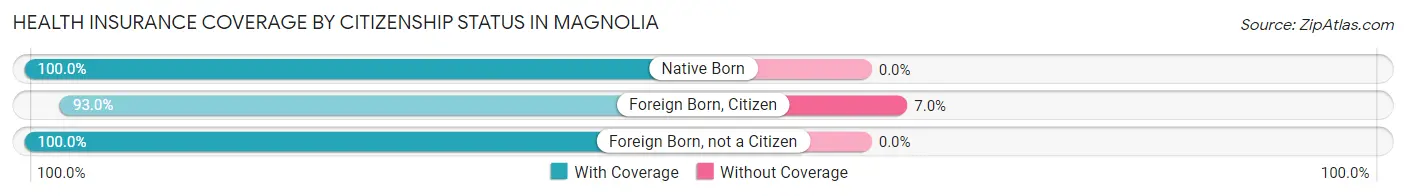
| Citizenship Status | With Coverage | Without Coverage |
| Native Born | 8 (100.0%) | 0 (0.0%) |
| Foreign Born, Citizen | 80 (93.0%) | 6 (7.0%) |
| Foreign Born, not a Citizen | 11 (100.0%) | 0 (0.0%) |
Health Insurance Coverage by Household Income in Magnolia
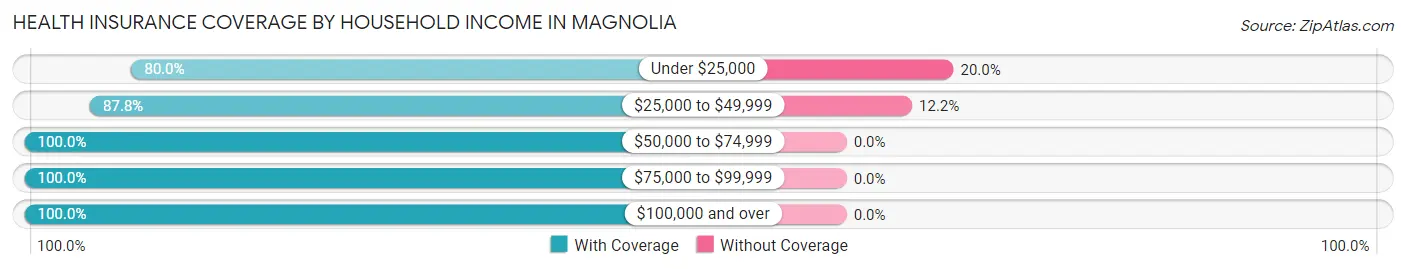
| Household Income | With Coverage | Without Coverage |
| Under $25,000 | 28 (80.0%) | 7 (20.0%) |
| $25,000 to $49,999 | 43 (87.8%) | 6 (12.2%) |
| $50,000 to $74,999 | 71 (100.0%) | 0 (0.0%) |
| $75,000 to $99,999 | 8 (100.0%) | 0 (0.0%) |
| $100,000 and over | 98 (100.0%) | 0 (0.0%) |
Public vs Private Health Insurance Coverage by Age in Magnolia
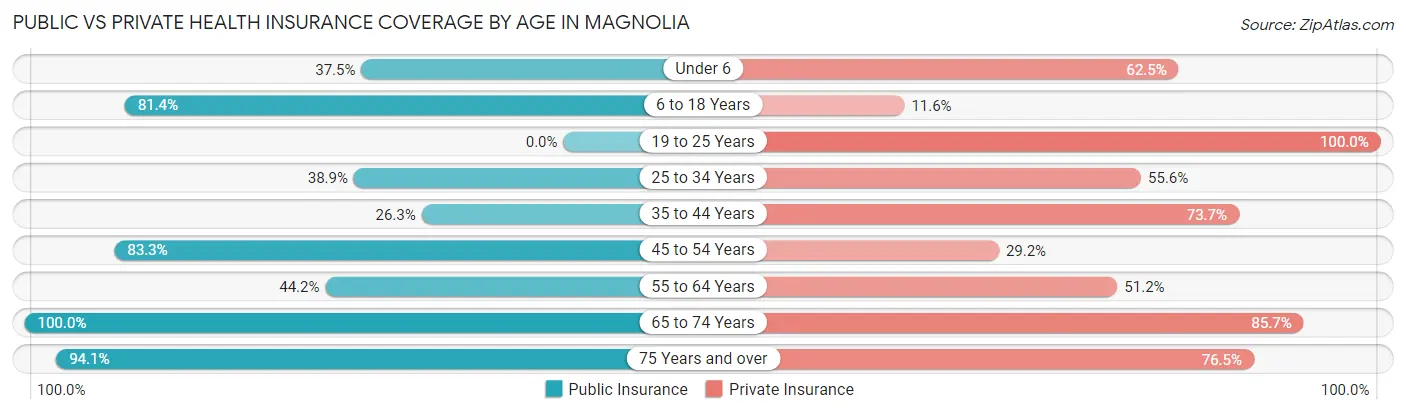
| Age Bracket | Public Insurance | Private Insurance |
| Under 6 | 3 (37.5%) | 5 (62.5%) |
| 6 to 18 Years | 70 (81.4%) | 10 (11.6%) |
| 19 to 25 Years | 0 (0.0%) | 11 (100.0%) |
| 25 to 34 Years | 7 (38.9%) | 10 (55.6%) |
| 35 to 44 Years | 5 (26.3%) | 14 (73.7%) |
| 45 to 54 Years | 20 (83.3%) | 7 (29.2%) |
| 55 to 64 Years | 19 (44.2%) | 22 (51.2%) |
| 65 to 74 Years | 35 (100.0%) | 30 (85.7%) |
| 75 Years and over | 16 (94.1%) | 13 (76.5%) |
| Total | 175 (67.0%) | 122 (46.7%) |
Disability Status by Sex by Age in Magnolia
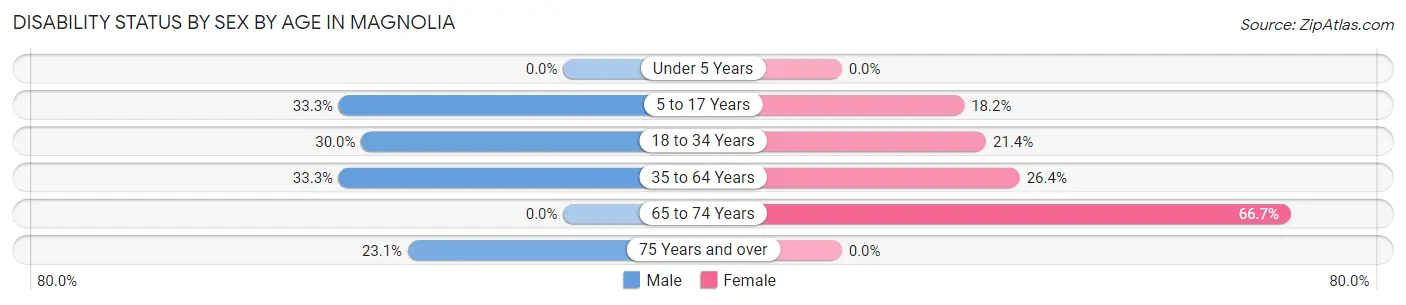
| Age Bracket | Male | Female |
| Under 5 Years | 0 (0.0%) | 0 (0.0%) |
| 5 to 17 Years | 13 (33.3%) | 8 (18.2%) |
| 18 to 34 Years | 6 (30.0%) | 3 (21.4%) |
| 35 to 64 Years | 11 (33.3%) | 14 (26.4%) |
| 65 to 74 Years | 0 (0.0%) | 6 (66.7%) |
| 75 Years and over | 3 (23.1%) | 0 (0.0%) |
Disability Class by Sex by Age in Magnolia
Disability Class: Hearing Difficulty
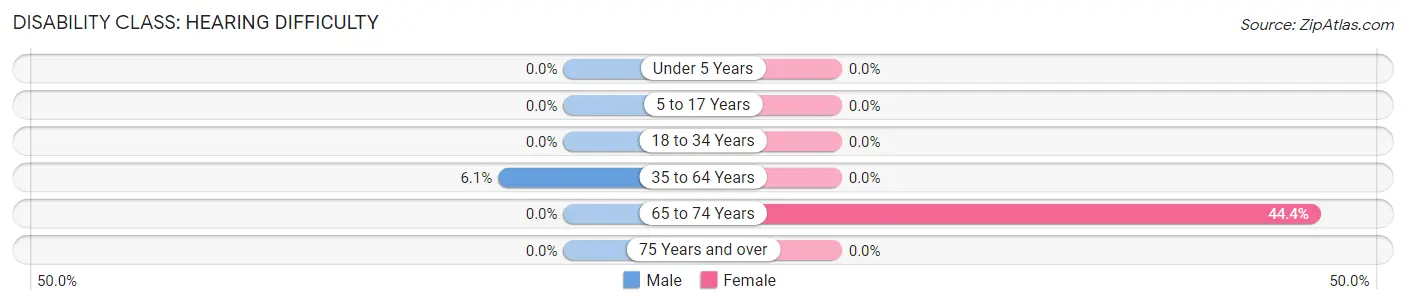
| Age Bracket | Male | Female |
| Under 5 Years | 0 (0.0%) | 0 (0.0%) |
| 5 to 17 Years | 0 (0.0%) | 0 (0.0%) |
| 18 to 34 Years | 0 (0.0%) | 0 (0.0%) |
| 35 to 64 Years | 2 (6.1%) | 0 (0.0%) |
| 65 to 74 Years | 0 (0.0%) | 4 (44.4%) |
| 75 Years and over | 0 (0.0%) | 0 (0.0%) |
Disability Class: Vision Difficulty
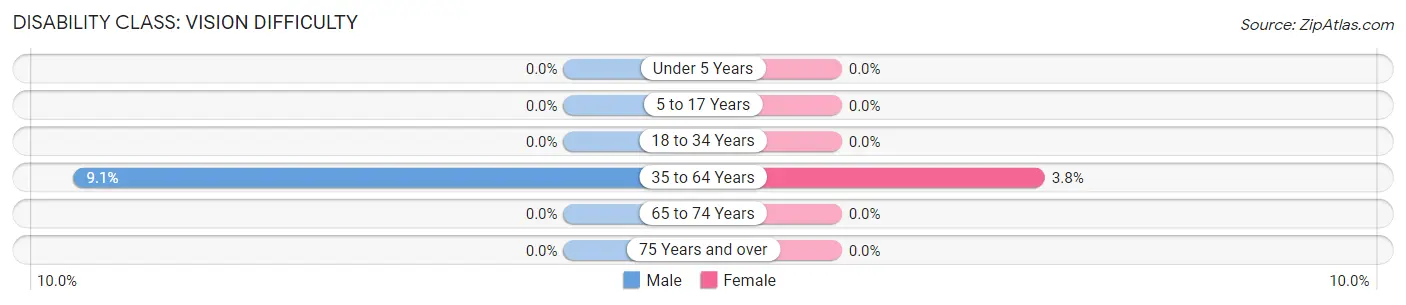
| Age Bracket | Male | Female |
| Under 5 Years | 0 (0.0%) | 0 (0.0%) |
| 5 to 17 Years | 0 (0.0%) | 0 (0.0%) |
| 18 to 34 Years | 0 (0.0%) | 0 (0.0%) |
| 35 to 64 Years | 3 (9.1%) | 2 (3.8%) |
| 65 to 74 Years | 0 (0.0%) | 0 (0.0%) |
| 75 Years and over | 0 (0.0%) | 0 (0.0%) |
Disability Class: Cognitive Difficulty
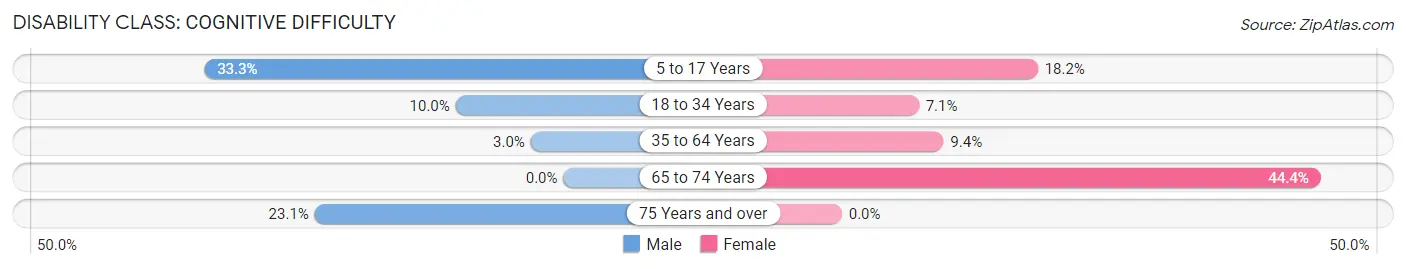
| Age Bracket | Male | Female |
| 5 to 17 Years | 13 (33.3%) | 8 (18.2%) |
| 18 to 34 Years | 2 (10.0%) | 1 (7.1%) |
| 35 to 64 Years | 1 (3.0%) | 5 (9.4%) |
| 65 to 74 Years | 0 (0.0%) | 4 (44.4%) |
| 75 Years and over | 3 (23.1%) | 0 (0.0%) |
Disability Class: Ambulatory Difficulty
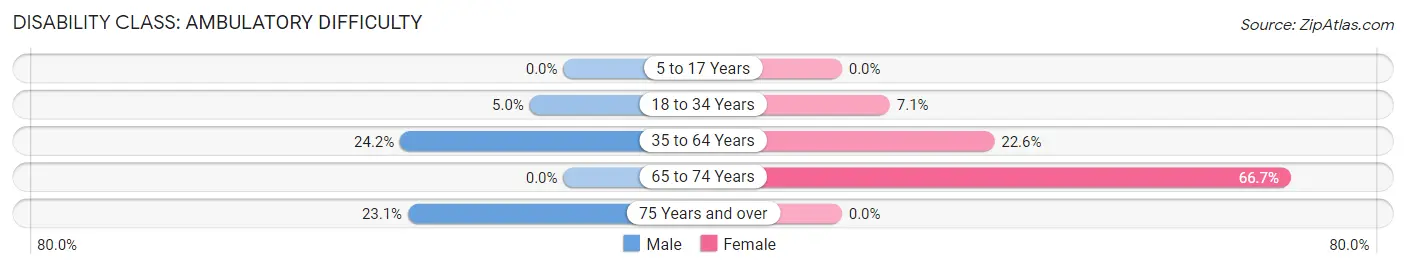
| Age Bracket | Male | Female |
| 5 to 17 Years | 0 (0.0%) | 0 (0.0%) |
| 18 to 34 Years | 1 (5.0%) | 1 (7.1%) |
| 35 to 64 Years | 8 (24.2%) | 12 (22.6%) |
| 65 to 74 Years | 0 (0.0%) | 6 (66.7%) |
| 75 Years and over | 3 (23.1%) | 0 (0.0%) |
Disability Class: Self-Care Difficulty
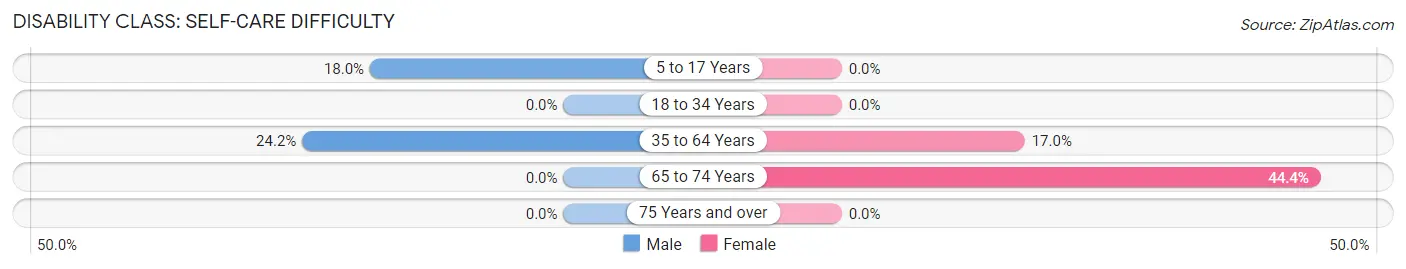
| Age Bracket | Male | Female |
| 5 to 17 Years | 7 (17.9%) | 0 (0.0%) |
| 18 to 34 Years | 0 (0.0%) | 0 (0.0%) |
| 35 to 64 Years | 8 (24.2%) | 9 (17.0%) |
| 65 to 74 Years | 0 (0.0%) | 4 (44.4%) |
| 75 Years and over | 0 (0.0%) | 0 (0.0%) |
Technology Access in Magnolia
Computing Device Access in Magnolia
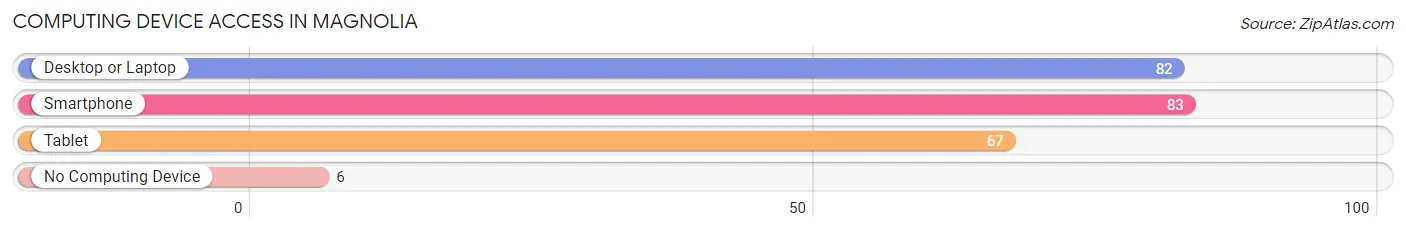
| Device Type | # Households | % Households |
| Desktop or Laptop | 82 | 87.2% |
| Smartphone | 83 | 88.3% |
| Tablet | 67 | 71.3% |
| No Computing Device | 6 | 6.4% |
| Total | 94 | 100.0% |
Internet Access in Magnolia
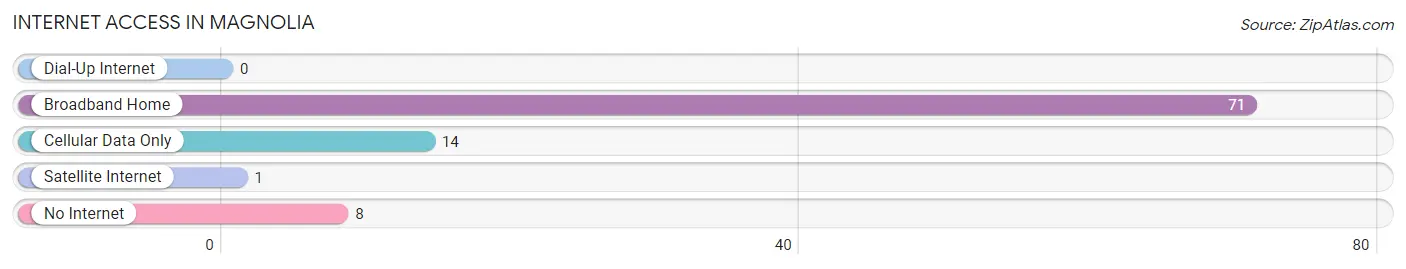
| Internet Type | # Households | % Households |
| Dial-Up Internet | 0 | 0.0% |
| Broadband Home | 71 | 75.5% |
| Cellular Data Only | 14 | 14.9% |
| Satellite Internet | 1 | 1.1% |
| No Internet | 8 | 8.5% |
| Total | 94 | 100.0% |
Magnolia Summary
Magnolia is a small town located in Kent County, Delaware, United States. It is located on the banks of the Murderkill River, and is part of the Dover Metropolitan Statistical Area. The town has a population of approximately 1,400 people, and is known for its small-town charm and rural atmosphere.
History
The area that is now Magnolia was first settled in the late 1600s by English settlers. The town was originally known as “Murderkill”, after the Murderkill River that runs through the area. The town was renamed “Magnolia” in 1845, after the magnolia trees that grew in the area.
The town was an important stop on the Delaware Railroad, which ran from Philadelphia to Dover. The railroad was an important part of the town’s economy, and helped to bring in new businesses and residents.
In the late 1800s, Magnolia was a popular destination for tourists, who came to enjoy the town’s rural atmosphere and natural beauty. The town was also known for its oyster industry, which was a major source of income for many of the town’s residents.
Geography
Magnolia is located in Kent County, Delaware, and is part of the Dover Metropolitan Statistical Area. The town is situated on the banks of the Murderkill River, and is surrounded by farmland and woodlands. The town is located approximately 25 miles south of Wilmington, and is about a 45-minute drive from the Delaware beaches.
The town has a total area of 1.2 square miles, all of which is land. The town has a humid subtropical climate, with hot, humid summers and mild winters.
Economy
The economy of Magnolia is largely based on agriculture and tourism. The town is home to several farms, which produce a variety of crops, including corn, soybeans, and wheat. The town is also home to several wineries, which produce a variety of wines.
The town is also a popular destination for tourists, who come to enjoy the town’s rural atmosphere and natural beauty. The town is home to several bed and breakfasts, as well as a variety of restaurants and shops.
Demographics
As of the 2010 census, the town had a population of 1,400 people. The racial makeup of the town was 94.3% White, 2.4% African American, 0.3% Native American, 0.7% Asian, 0.1% Pacific Islander, and 1.2% from other races. Hispanic or Latino of any race were 2.3% of the population.
The median household income in the town was $45,000, and the median family income was $50,000. The per capita income in the town was $20,000. About 8.3% of the population was below the poverty line.
Common Questions
What is Per Capita Income in Magnolia?
Per Capita income in Magnolia is $25,069.
What is Inequality or Gini Index in Magnolia?
Inequality or Gini Index in Magnolia is 0.39.
What is the Total Population of Magnolia?
Total Population of Magnolia is 263.
What is the Total Male Population of Magnolia?
Total Male Population of Magnolia is 135.
What is the Total Female Population of Magnolia?
Total Female Population of Magnolia is 128.
What is the Ratio of Males per 100 Females in Magnolia?
There are 105.47 Males per 100 Females in Magnolia.
What is the Ratio of Females per 100 Males in Magnolia?
There are 94.81 Females per 100 Males in Magnolia.
What is the Median Population Age in Magnolia?
Median Population Age in Magnolia is 36.5 Years.
What is the Average Family Size in Magnolia
Average Family Size in Magnolia is 3.1 People.
What is the Average Household Size in Magnolia
Average Household Size in Magnolia is 2.8 People.
How Large is the Labor Force in Magnolia?
There are 98 People in the Labor Forcein in Magnolia.
What is the Percentage of People in the Labor Force in Magnolia?
53.0% of People are in the Labor Force in Magnolia.
What is the Unemployment Rate in Magnolia?
Unemployment Rate in Magnolia is 9.4%.