Zip Codes with the Highest Percentage of Population Employed in Food Preparation & Serving in Dover, DE
RELATED REPORTS & OPTIONS
Food Preparation & Serving
Dover
Compare Zip Codes
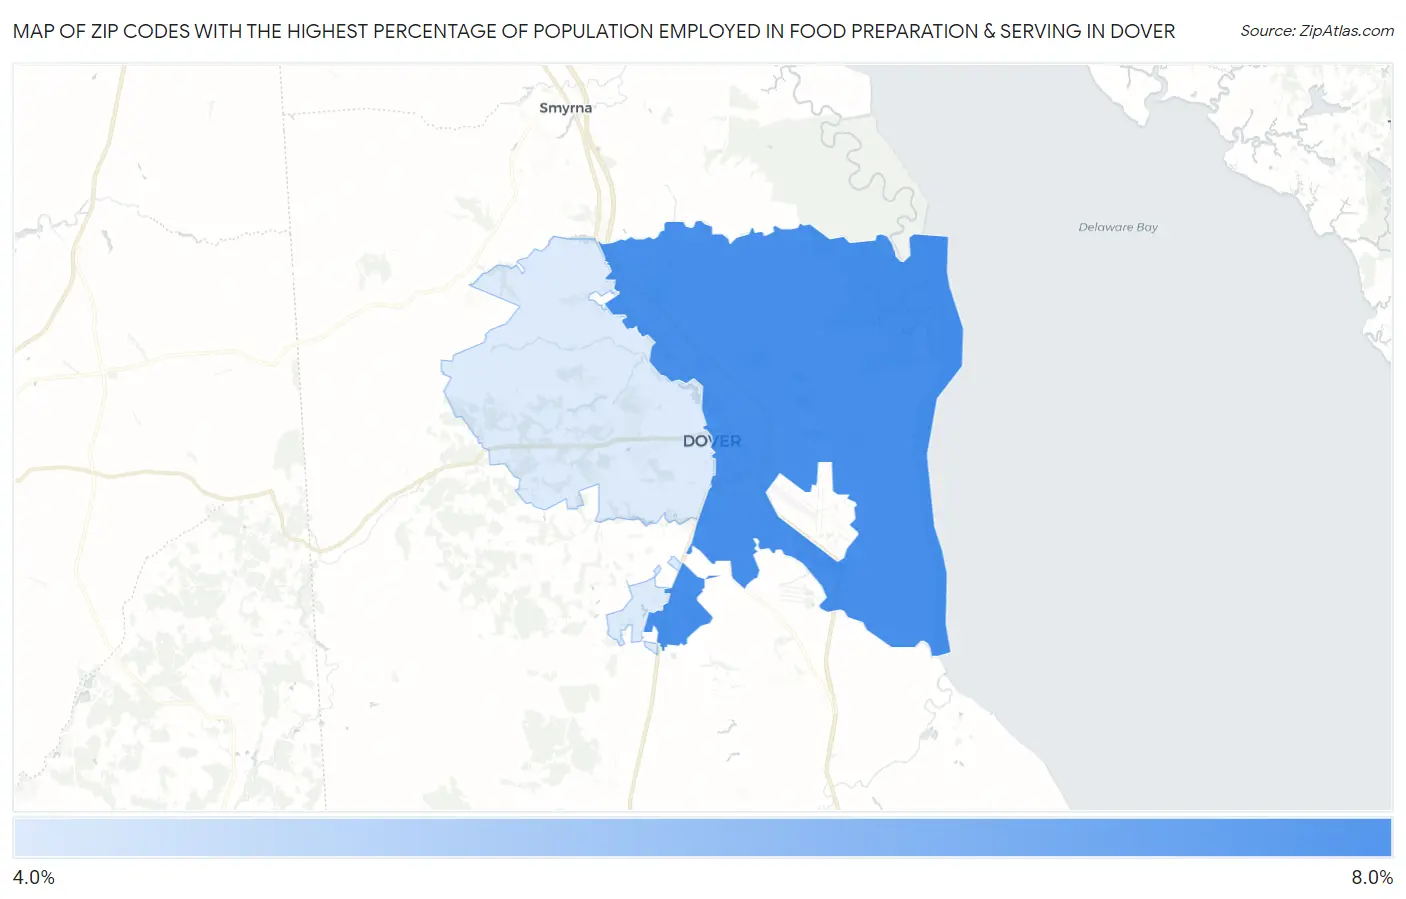
Map of Zip Codes with the Highest Percentage of Population Employed in Food Preparation & Serving in Dover
4.7%
6.9%
Zip Codes with the Highest Percentage of Population Employed in Food Preparation & Serving in Dover, DE
| Zip Code | % Employed | vs State | vs National | |
| 1. | 19901 | 6.9% | 5.0%(+1.95)#14 | 5.3%(+1.63)#6,785 |
| 2. | 19904 | 4.7% | 5.0%(-0.277)#30 | 5.3%(-0.600)#14,213 |
1
Common Questions
What are the Top Zip Codes with the Highest Percentage of Population Employed in Food Preparation & Serving in Dover, DE?
Top Zip Codes with the Highest Percentage of Population Employed in Food Preparation & Serving in Dover, DE are:
What zip code has the Highest Percentage of Population Employed in Food Preparation & Serving in Dover, DE?
19901 has the Highest Percentage of Population Employed in Food Preparation & Serving in Dover, DE with 6.9%.
What is the Percentage of Population Employed in Food Preparation & Serving in Dover, DE?
Percentage of Population Employed in Food Preparation & Serving in Dover is 6.9%.
What is the Percentage of Population Employed in Food Preparation & Serving in Delaware?
Percentage of Population Employed in Food Preparation & Serving in Delaware is 5.0%.
What is the Percentage of Population Employed in Food Preparation & Serving in the United States?
Percentage of Population Employed in Food Preparation & Serving in the United States is 5.3%.