Rodney Village, DE Map & Demographics
Rodney Village Map
Rodney Village Overview
$18,256
PER CAPITA INCOME
$33,319
AVG FAMILY INCOME
$33,534
AVG HOUSEHOLD INCOME
2.6%
WAGE / INCOME GAP [ % ]
97.4¢/ $1
WAGE / INCOME GAP [ $ ]
0.40
INEQUALITY / GINI INDEX
1,304
TOTAL POPULATION
572
MALE POPULATION
732
FEMALE POPULATION
78.14
MALES / 100 FEMALES
127.97
FEMALES / 100 MALES
39.6
MEDIAN AGE
3.2
AVG FAMILY SIZE
2.6
AVG HOUSEHOLD SIZE
575
LABOR FORCE [ PEOPLE ]
59.6%
PERCENT IN LABOR FORCE
4.9%
UNEMPLOYMENT RATE
Income in Rodney Village
Income Overview in Rodney Village
Per Capita Income in Rodney Village is $18,256, while median incomes of families and households are $33,319 and $33,534 respectively.
| Characteristic | Number | Measure |
| Per Capita Income | 1,304 | $18,256 |
| Median Family Income | 345 | $33,319 |
| Mean Family Income | 345 | $53,023 |
| Median Household Income | 500 | $33,534 |
| Mean Household Income | 500 | $47,982 |
| Income Deficit | 345 | $0 |
| Wage / Income Gap (%) | 1,304 | 2.56% |
| Wage / Income Gap ($) | 1,304 | 97.44¢ per $1 |
| Gini / Inequality Index | 1,304 | 0.40 |
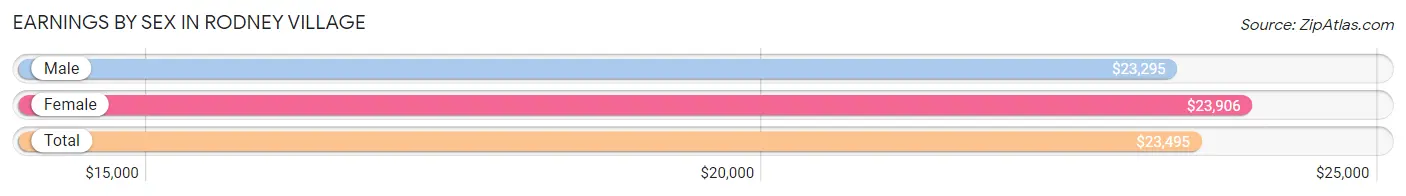
Earnings by Sex in Rodney Village
Average Earnings in Rodney Village are $23,495, $23,295 for men and $23,906 for women, a difference of 2.6%.
| Sex | Number | Average Earnings |
| Male | 281 (49.7%) | $23,295 |
| Female | 284 (50.3%) | $23,906 |
| Total | 565 (100.0%) | $23,495 |
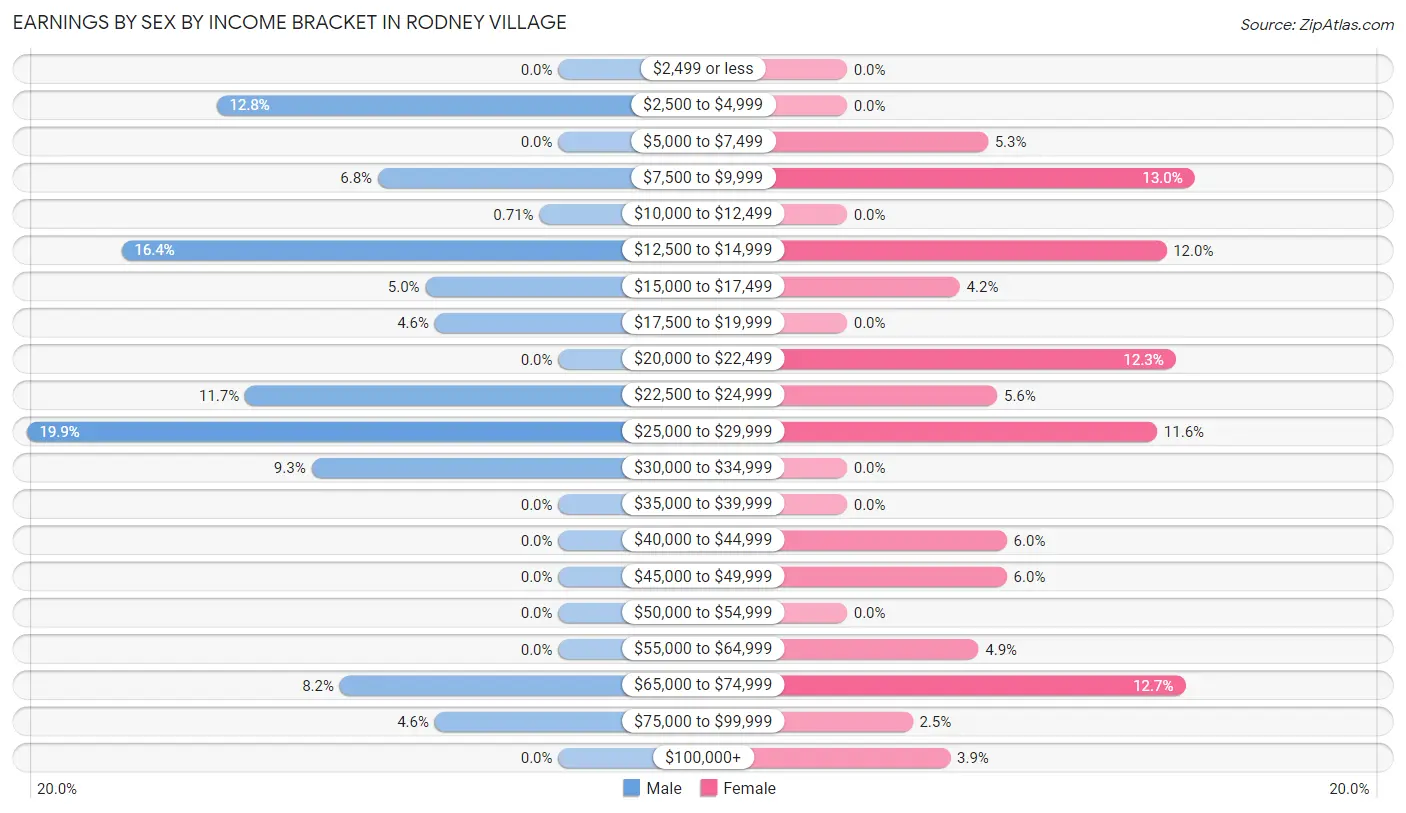
Earnings by Sex by Income Bracket in Rodney Village
The most common earnings brackets in Rodney Village are $25,000 to $29,999 for men (56 | 19.9%) and $7,500 to $9,999 for women (37 | 13.0%).
| Income | Male | Female |
| $2,499 or less | 0 (0.0%) | 0 (0.0%) |
| $2,500 to $4,999 | 36 (12.8%) | 0 (0.0%) |
| $5,000 to $7,499 | 0 (0.0%) | 15 (5.3%) |
| $7,500 to $9,999 | 19 (6.8%) | 37 (13.0%) |
| $10,000 to $12,499 | 2 (0.7%) | 0 (0.0%) |
| $12,500 to $14,999 | 46 (16.4%) | 34 (12.0%) |
| $15,000 to $17,499 | 14 (5.0%) | 12 (4.2%) |
| $17,500 to $19,999 | 13 (4.6%) | 0 (0.0%) |
| $20,000 to $22,499 | 0 (0.0%) | 35 (12.3%) |
| $22,500 to $24,999 | 33 (11.7%) | 16 (5.6%) |
| $25,000 to $29,999 | 56 (19.9%) | 33 (11.6%) |
| $30,000 to $34,999 | 26 (9.2%) | 0 (0.0%) |
| $35,000 to $39,999 | 0 (0.0%) | 0 (0.0%) |
| $40,000 to $44,999 | 0 (0.0%) | 17 (6.0%) |
| $45,000 to $49,999 | 0 (0.0%) | 17 (6.0%) |
| $50,000 to $54,999 | 0 (0.0%) | 0 (0.0%) |
| $55,000 to $64,999 | 0 (0.0%) | 14 (4.9%) |
| $65,000 to $74,999 | 23 (8.2%) | 36 (12.7%) |
| $75,000 to $99,999 | 13 (4.6%) | 7 (2.5%) |
| $100,000+ | 0 (0.0%) | 11 (3.9%) |
| Total | 281 (100.0%) | 284 (100.0%) |
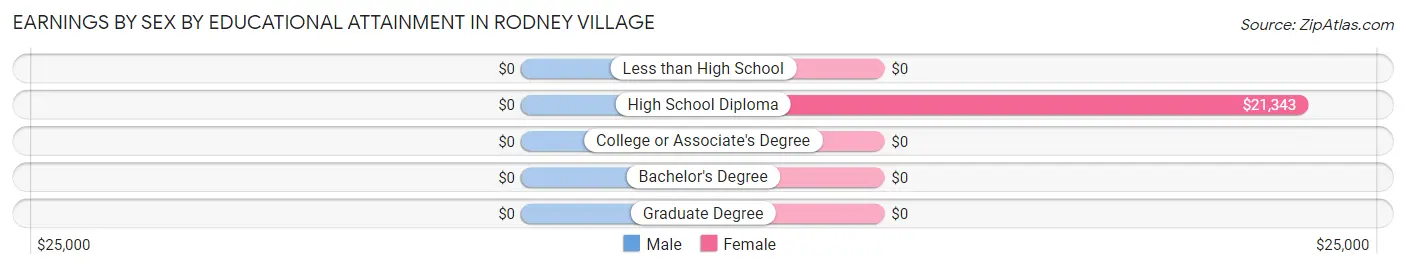
Earnings by Sex by Educational Attainment in Rodney Village
| Educational Attainment | Male Income | Female Income |
| Less than High School | - | - |
| High School Diploma | - | - |
| College or Associate's Degree | - | - |
| Bachelor's Degree | - | - |
| Graduate Degree | - | - |
| Total | $26,674 | $28,073 |
Family Income in Rodney Village
Family Income Brackets in Rodney Village
According to the Rodney Village family income data, there are 119 families falling into the $25,000 to $34,999 income range, which is the most common income bracket and makes up 34.5% of all families.
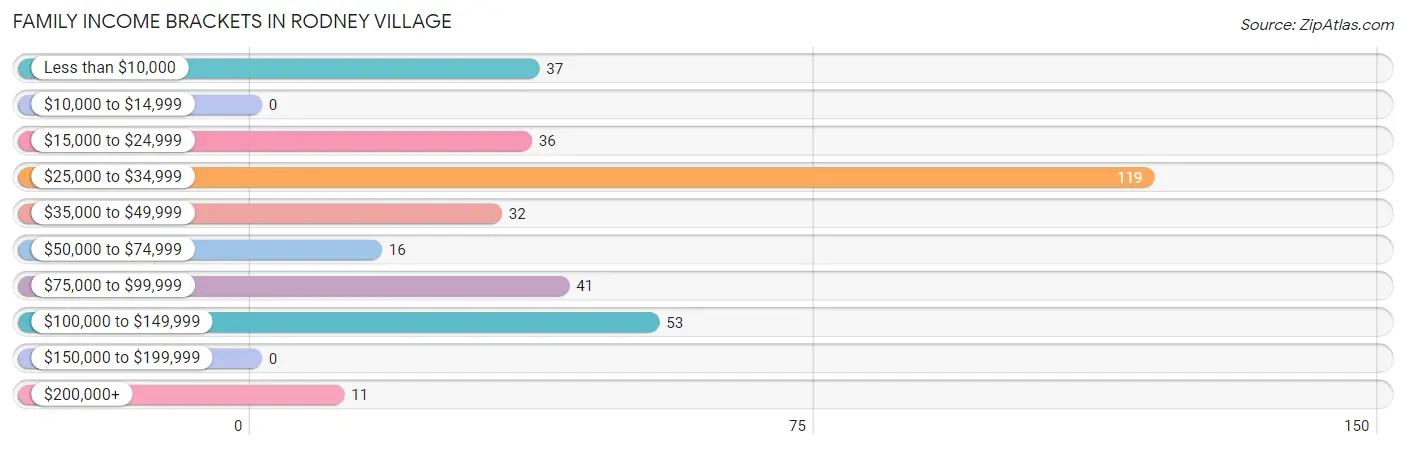
| Income Bracket | # Families | % Families |
| Less than $10,000 | 37 | 10.7% |
| $10,000 to $14,999 | 0 | 0.0% |
| $15,000 to $24,999 | 36 | 10.4% |
| $25,000 to $34,999 | 119 | 34.5% |
| $35,000 to $49,999 | 32 | 9.3% |
| $50,000 to $74,999 | 16 | 4.6% |
| $75,000 to $99,999 | 41 | 11.9% |
| $100,000 to $149,999 | 53 | 15.4% |
| $150,000 to $199,999 | 0 | 0.0% |
| $200,000+ | 11 | 3.2% |
Family Income by Famaliy Size in Rodney Village
3-person families (32 | 9.3%) account for the highest median family income in Rodney Village with $76,786 per family, while 3-person families (32 | 9.3%) have the highest median income of $25,595 per family member.
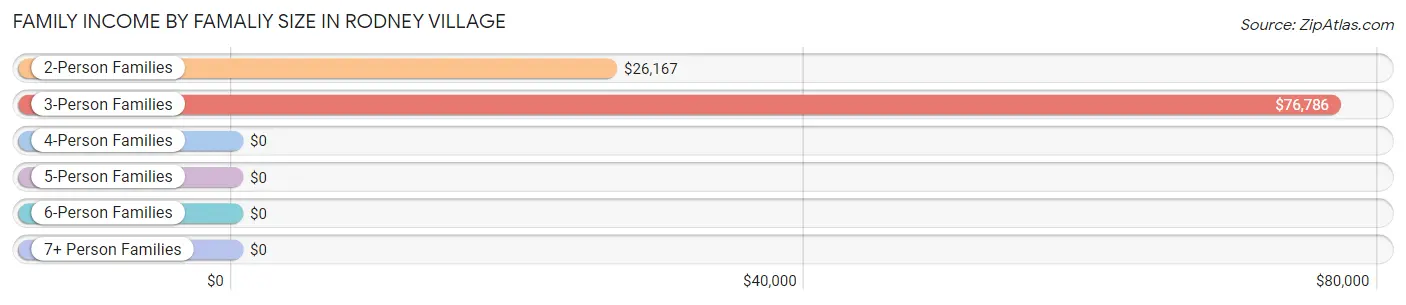
| Income Bracket | # Families | Median Income |
| 2-Person Families | 158 (45.8%) | $26,167 |
| 3-Person Families | 32 (9.3%) | $76,786 |
| 4-Person Families | 91 (26.4%) | $0 |
| 5-Person Families | 35 (10.1%) | $0 |
| 6-Person Families | 29 (8.4%) | $0 |
| 7+ Person Families | 0 (0.0%) | $0 |
| Total | 345 (100.0%) | $33,319 |
Family Income by Number of Earners in Rodney Village
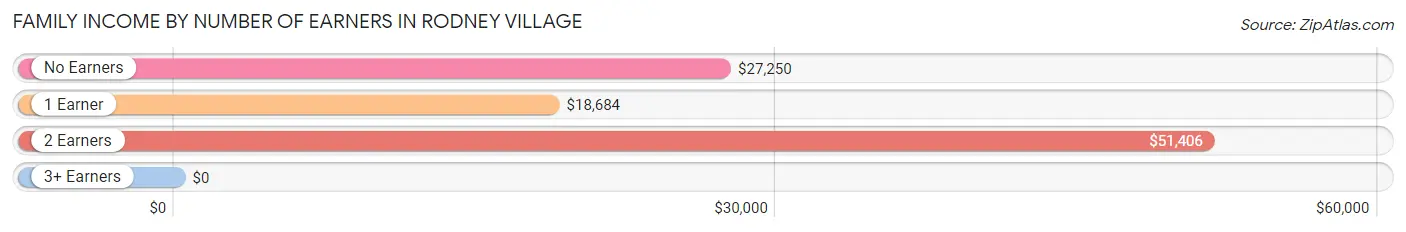
| Number of Earners | # Families | Median Income |
| No Earners | 72 (20.9%) | $27,250 |
| 1 Earner | 92 (26.7%) | $18,684 |
| 2 Earners | 158 (45.8%) | $51,406 |
| 3+ Earners | 23 (6.7%) | $0 |
| Total | 345 (100.0%) | $33,319 |
Household Income in Rodney Village
Household Income Brackets in Rodney Village
With 144 households falling in the category, the $25,000 to $34,999 income range is the most frequent in Rodney Village, accounting for 28.8% of all households.
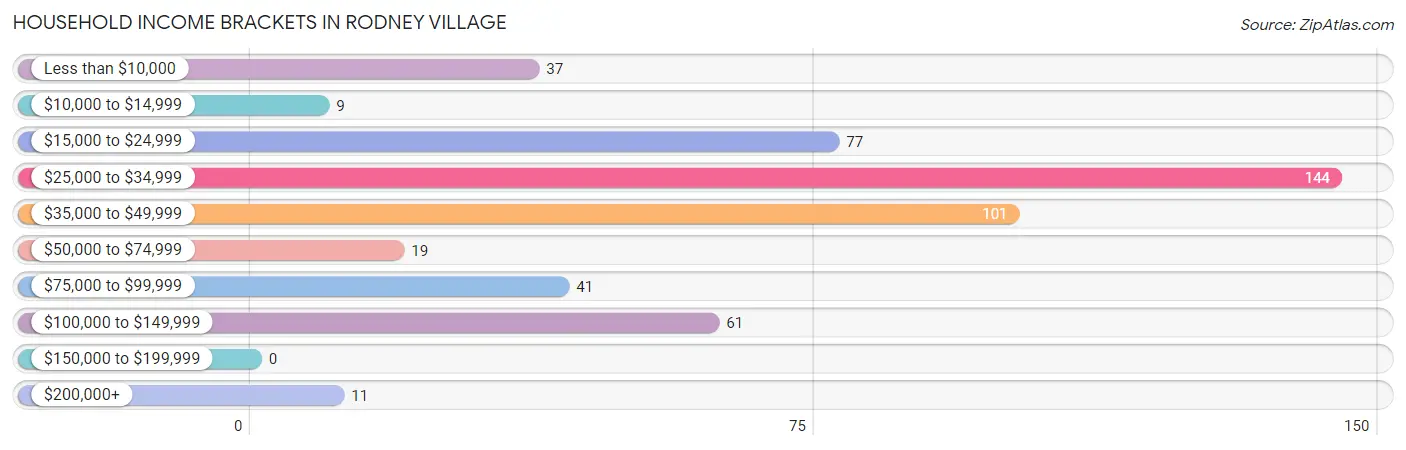
| Income Bracket | # Households | % Households |
| Less than $10,000 | 37 | 7.4% |
| $10,000 to $14,999 | 9 | 1.8% |
| $15,000 to $24,999 | 77 | 15.4% |
| $25,000 to $34,999 | 144 | 28.8% |
| $35,000 to $49,999 | 101 | 20.2% |
| $50,000 to $74,999 | 19 | 3.8% |
| $75,000 to $99,999 | 41 | 8.2% |
| $100,000 to $149,999 | 61 | 12.2% |
| $150,000 to $199,999 | 0 | 0.0% |
| $200,000+ | 11 | 2.2% |
Household Income by Householder Age in Rodney Village
The median household income in Rodney Village is $33,534, with the highest median household income of $49,052 found in the 25 to 44 years age bracket for the primary householder. A total of 62 households (12.4%) fall into this category. Meanwhile, the 15 to 24 years age bracket for the primary householder has the lowest median household income of $0, with 38 households (7.6%) in this group.
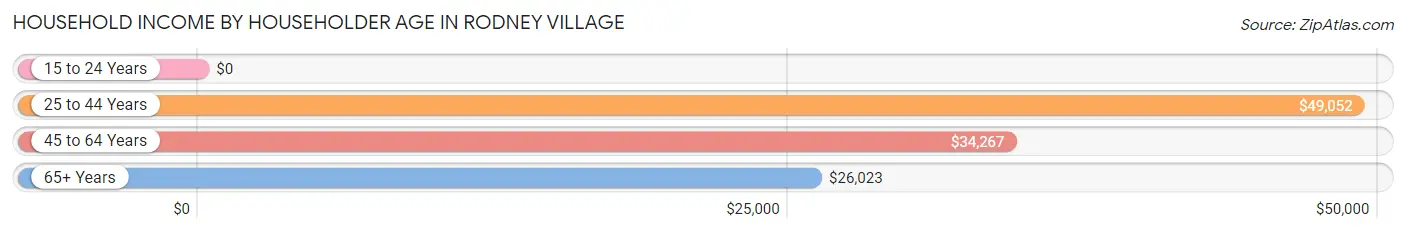
| Income Bracket | # Households | Median Income |
| 15 to 24 Years | 38 (7.6%) | $0 |
| 25 to 44 Years | 62 (12.4%) | $49,052 |
| 45 to 64 Years | 271 (54.2%) | $34,267 |
| 65+ Years | 129 (25.8%) | $26,023 |
| Total | 500 (100.0%) | $33,534 |
Poverty in Rodney Village
Income Below Poverty by Sex and Age in Rodney Village
With 14.7% poverty level for males and 24.0% for females among the residents of Rodney Village, 6 to 11 year old males and under 5 year old females are the most vulnerable to poverty, with 23 males (82.1%) and 74 females (68.5%) in their respective age groups living below the poverty level.
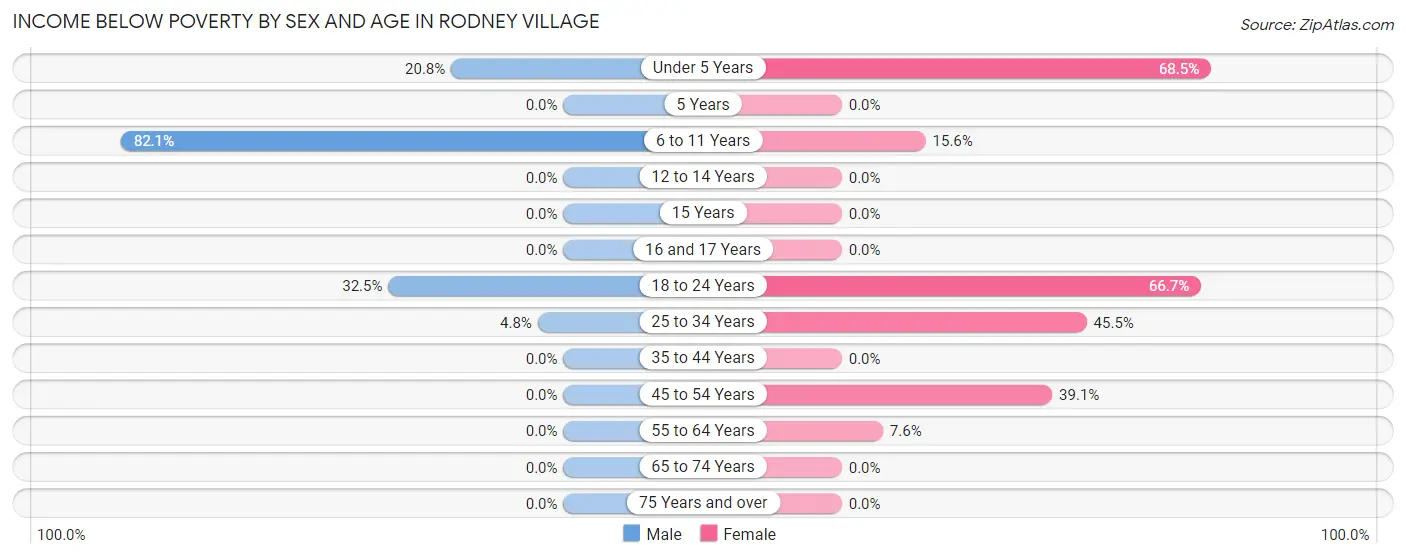
| Age Bracket | Male | Female |
| Under 5 Years | 20 (20.8%) | 74 (68.5%) |
| 5 Years | 0 (0.0%) | 0 (0.0%) |
| 6 to 11 Years | 23 (82.1%) | 7 (15.6%) |
| 12 to 14 Years | 0 (0.0%) | 0 (0.0%) |
| 15 Years | 0 (0.0%) | 0 (0.0%) |
| 16 and 17 Years | 0 (0.0%) | 0 (0.0%) |
| 18 to 24 Years | 39 (32.5%) | 34 (66.7%) |
| 25 to 34 Years | 2 (4.8%) | 10 (45.5%) |
| 35 to 44 Years | 0 (0.0%) | 0 (0.0%) |
| 45 to 54 Years | 0 (0.0%) | 41 (39.1%) |
| 55 to 64 Years | 0 (0.0%) | 10 (7.6%) |
| 65 to 74 Years | 0 (0.0%) | 0 (0.0%) |
| 75 Years and over | 0 (0.0%) | 0 (0.0%) |
| Total | 84 (14.7%) | 176 (24.0%) |
Income Above Poverty by Sex and Age in Rodney Village
According to the poverty statistics in Rodney Village, males aged 12 to 14 years and females aged 12 to 14 years are the age groups that are most secure financially, with 100.0% of males and 100.0% of females in these age groups living above the poverty line.
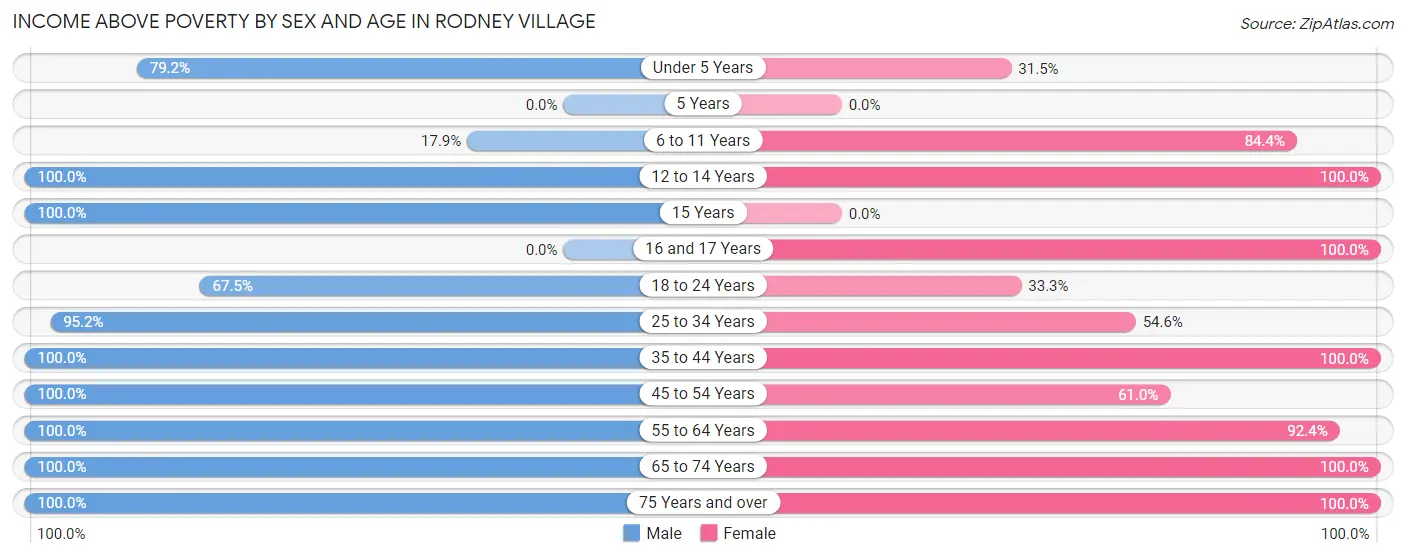
| Age Bracket | Male | Female |
| Under 5 Years | 76 (79.2%) | 34 (31.5%) |
| 5 Years | 0 (0.0%) | 0 (0.0%) |
| 6 to 11 Years | 5 (17.9%) | 38 (84.4%) |
| 12 to 14 Years | 18 (100.0%) | 36 (100.0%) |
| 15 Years | 9 (100.0%) | 0 (0.0%) |
| 16 and 17 Years | 0 (0.0%) | 32 (100.0%) |
| 18 to 24 Years | 81 (67.5%) | 17 (33.3%) |
| 25 to 34 Years | 40 (95.2%) | 12 (54.5%) |
| 35 to 44 Years | 74 (100.0%) | 105 (100.0%) |
| 45 to 54 Years | 47 (100.0%) | 64 (61.0%) |
| 55 to 64 Years | 57 (100.0%) | 121 (92.4%) |
| 65 to 74 Years | 66 (100.0%) | 57 (100.0%) |
| 75 Years and over | 15 (100.0%) | 40 (100.0%) |
| Total | 488 (85.3%) | 556 (76.0%) |
Income Below Poverty Among Married-Couple Families in Rodney Village
The poverty statistics for married-couple families in Rodney Village show that 18.9% or 38 of the total 201 families live below the poverty line. Families with 1 or 2 children have the highest poverty rate of 39.2%, comprising of 38 families. On the other hand, families with no children have the lowest poverty rate of 0.0%, which includes 0 families.
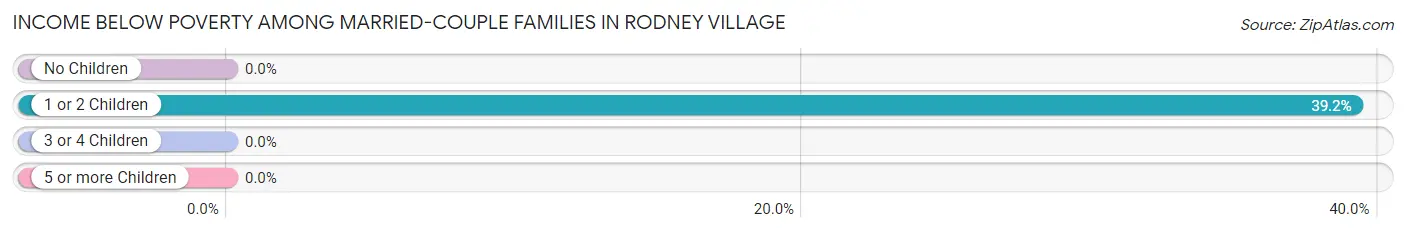
| Children | Above Poverty | Below Poverty |
| No Children | 75 (100.0%) | 0 (0.0%) |
| 1 or 2 Children | 59 (60.8%) | 38 (39.2%) |
| 3 or 4 Children | 29 (100.0%) | 0 (0.0%) |
| 5 or more Children | 0 (0.0%) | 0 (0.0%) |
| Total | 163 (81.1%) | 38 (18.9%) |
Income Below Poverty Among Single-Parent Households in Rodney Village
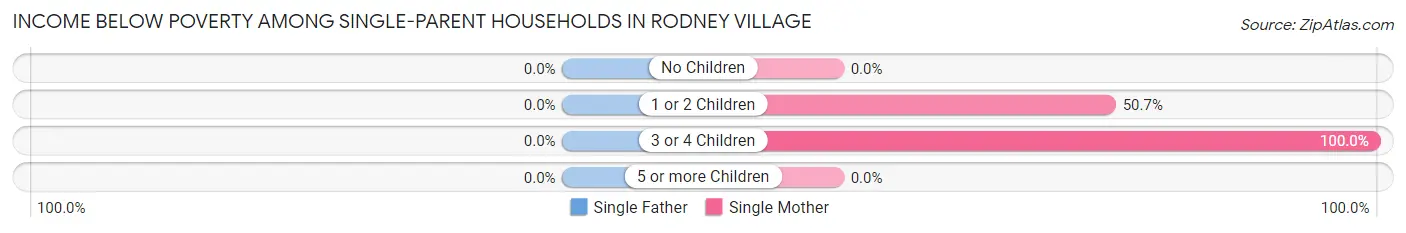
| Children | Single Father | Single Mother |
| No Children | 0 (0.0%) | 0 (0.0%) |
| 1 or 2 Children | 0 (0.0%) | 37 (50.7%) |
| 3 or 4 Children | 0 (0.0%) | 8 (100.0%) |
| 5 or more Children | 0 (0.0%) | 0 (0.0%) |
| Total | 0 (0.0%) | 45 (31.2%) |
Income Below Poverty Among Married-Couple vs Single-Parent Households in Rodney Village
The poverty data for Rodney Village shows that 38 of the married-couple family households (18.9%) and 45 of the single-parent households (31.2%) are living below the poverty level. Within the married-couple family households, those with 1 or 2 children have the highest poverty rate, with 38 households (39.2%) falling below the poverty line. Among the single-parent households, those with 3 or 4 children have the highest poverty rate, with 8 household (100.0%) living below poverty.
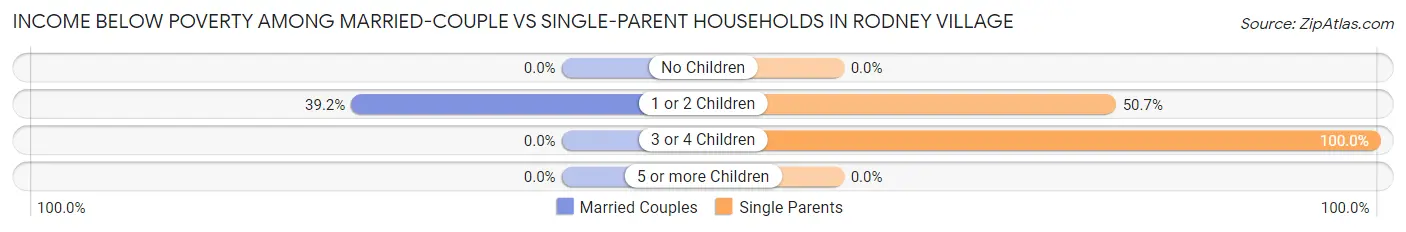
| Children | Married-Couple Families | Single-Parent Households |
| No Children | 0 (0.0%) | 0 (0.0%) |
| 1 or 2 Children | 38 (39.2%) | 37 (50.7%) |
| 3 or 4 Children | 0 (0.0%) | 8 (100.0%) |
| 5 or more Children | 0 (0.0%) | 0 (0.0%) |
| Total | 38 (18.9%) | 45 (31.2%) |
Race in Rodney Village
The most populous races in Rodney Village are Black / African American (871 | 66.8%), White / Caucasian (345 | 26.5%), and Two or more Races (88 | 6.8%).
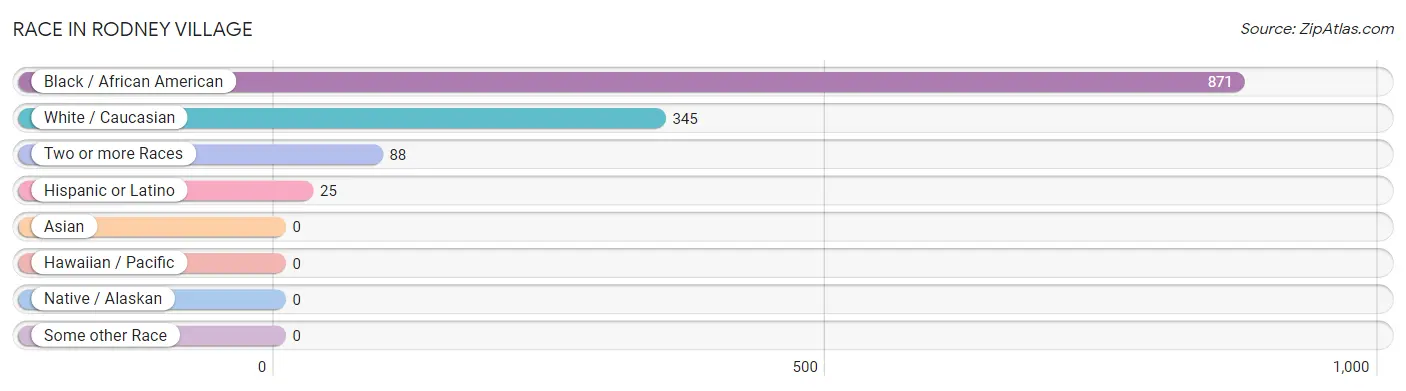
| Race | # Population | % Population |
| Asian | 0 | 0.0% |
| Black / African American | 871 | 66.8% |
| Hawaiian / Pacific | 0 | 0.0% |
| Hispanic or Latino | 25 | 1.9% |
| Native / Alaskan | 0 | 0.0% |
| White / Caucasian | 345 | 26.5% |
| Two or more Races | 88 | 6.8% |
| Some other Race | 0 | 0.0% |
| Total | 1,304 | 100.0% |
Ancestry in Rodney Village
The most populous ancestries reported in Rodney Village are Haitian (234 | 17.9%), German (137 | 10.5%), Irish (65 | 5.0%), English (61 | 4.7%), and Trinidadian and Tobagonian (35 | 2.7%), together accounting for 40.8% of all Rodney Village residents.
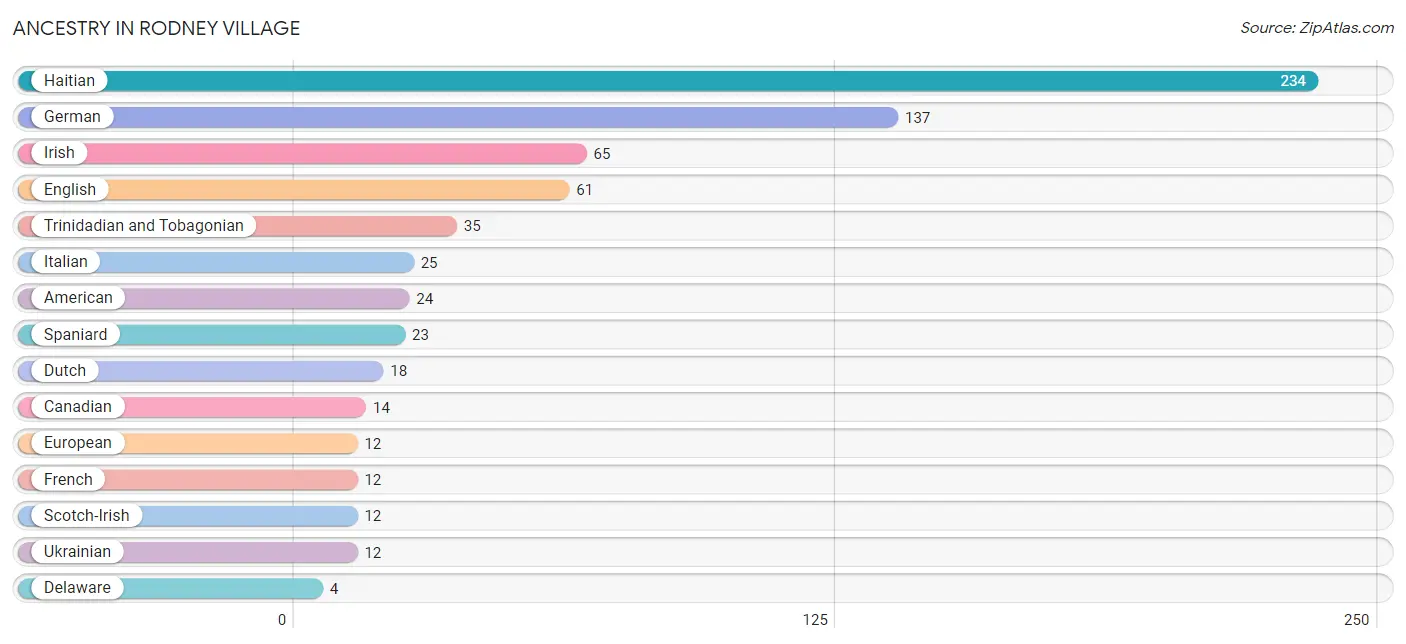
| Ancestry | # Population | % Population |
| African | 3 | 0.2% |
| American | 24 | 1.8% |
| Canadian | 14 | 1.1% |
| Delaware | 4 | 0.3% |
| Dutch | 18 | 1.4% |
| English | 61 | 4.7% |
| European | 12 | 0.9% |
| French | 12 | 0.9% |
| German | 137 | 10.5% |
| Haitian | 234 | 17.9% |
| Irish | 65 | 5.0% |
| Italian | 25 | 1.9% |
| Puerto Rican | 2 | 0.2% |
| Scotch-Irish | 12 | 0.9% |
| Spaniard | 23 | 1.8% |
| Subsaharan African | 3 | 0.2% |
| Trinidadian and Tobagonian | 35 | 2.7% |
| Ukrainian | 12 | 0.9% | View All 18 Rows |
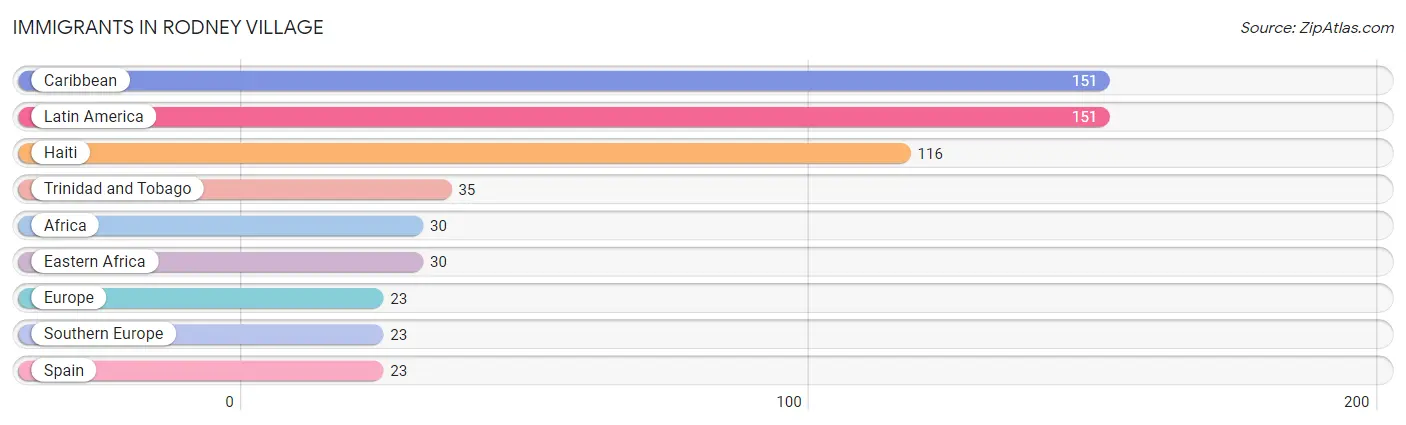
Immigrants in Rodney Village
The most numerous immigrant groups reported in Rodney Village came from Caribbean (151 | 11.6%), Latin America (151 | 11.6%), Haiti (116 | 8.9%), Trinidad and Tobago (35 | 2.7%), and Africa (30 | 2.3%), together accounting for 37.0% of all Rodney Village residents.
| Immigration Origin | # Population | % Population |
| Africa | 30 | 2.3% |
| Caribbean | 151 | 11.6% |
| Eastern Africa | 30 | 2.3% |
| Europe | 23 | 1.8% |
| Haiti | 116 | 8.9% |
| Latin America | 151 | 11.6% |
| Southern Europe | 23 | 1.8% |
| Spain | 23 | 1.8% |
| Trinidad and Tobago | 35 | 2.7% | View All 9 Rows |
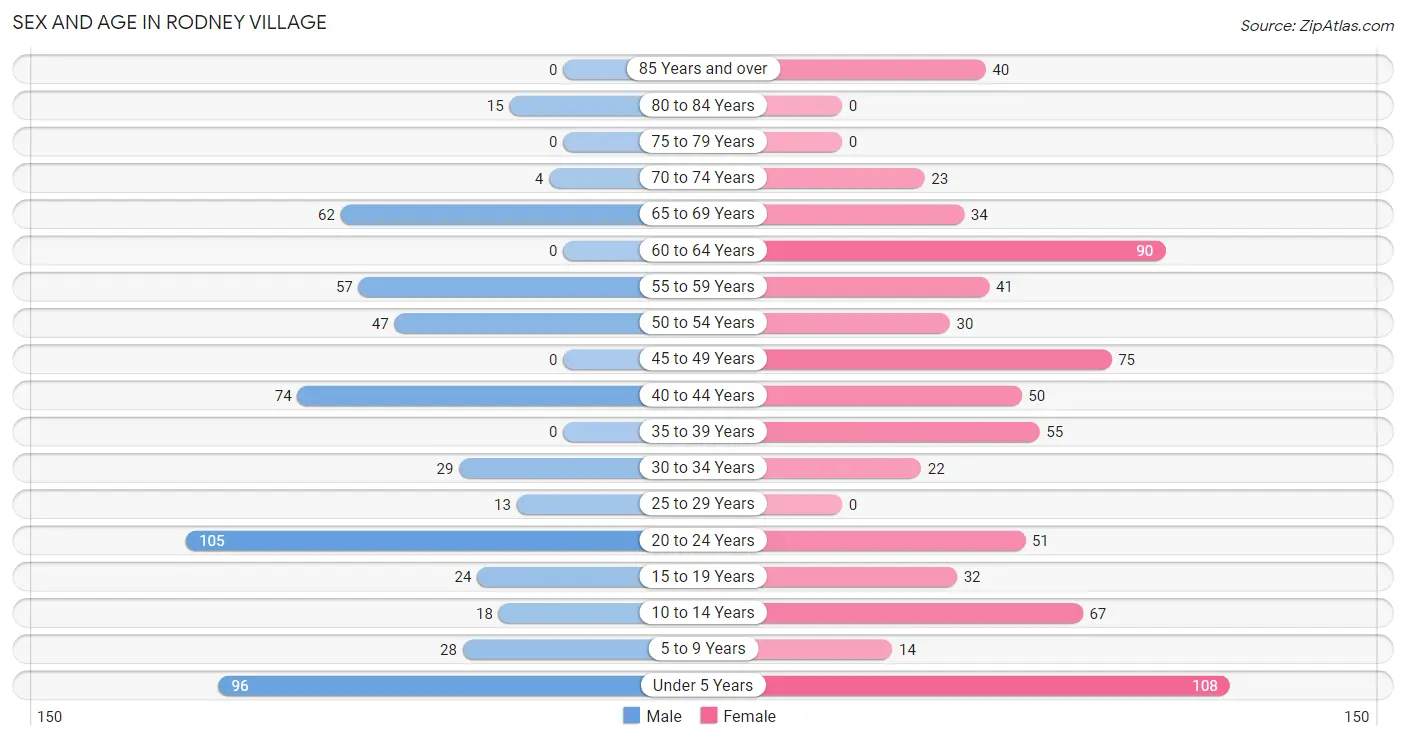
Sex and Age in Rodney Village
Sex and Age in Rodney Village
The most populous age groups in Rodney Village are 20 to 24 Years (105 | 18.4%) for men and Under 5 Years (108 | 14.7%) for women.
| Age Bracket | Male | Female |
| Under 5 Years | 96 (16.8%) | 108 (14.7%) |
| 5 to 9 Years | 28 (4.9%) | 14 (1.9%) |
| 10 to 14 Years | 18 (3.2%) | 67 (9.1%) |
| 15 to 19 Years | 24 (4.2%) | 32 (4.4%) |
| 20 to 24 Years | 105 (18.4%) | 51 (7.0%) |
| 25 to 29 Years | 13 (2.3%) | 0 (0.0%) |
| 30 to 34 Years | 29 (5.1%) | 22 (3.0%) |
| 35 to 39 Years | 0 (0.0%) | 55 (7.5%) |
| 40 to 44 Years | 74 (12.9%) | 50 (6.8%) |
| 45 to 49 Years | 0 (0.0%) | 75 (10.2%) |
| 50 to 54 Years | 47 (8.2%) | 30 (4.1%) |
| 55 to 59 Years | 57 (10.0%) | 41 (5.6%) |
| 60 to 64 Years | 0 (0.0%) | 90 (12.3%) |
| 65 to 69 Years | 62 (10.8%) | 34 (4.6%) |
| 70 to 74 Years | 4 (0.7%) | 23 (3.1%) |
| 75 to 79 Years | 0 (0.0%) | 0 (0.0%) |
| 80 to 84 Years | 15 (2.6%) | 0 (0.0%) |
| 85 Years and over | 0 (0.0%) | 40 (5.5%) |
| Total | 572 (100.0%) | 732 (100.0%) |
Families and Households in Rodney Village
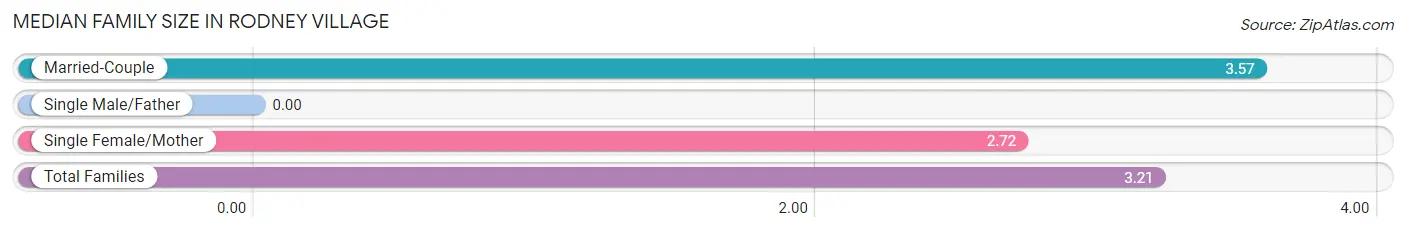
Median Family Size in Rodney Village
| Family Type | # Families | Family Size |
| Married-Couple | 201 (58.3%) | 3.57 |
| Single Male/Father | 0 (0.0%) | - |
| Single Female/Mother | 144 (41.7%) | 2.72 |
| Total Families | 345 (100.0%) | 3.21 |
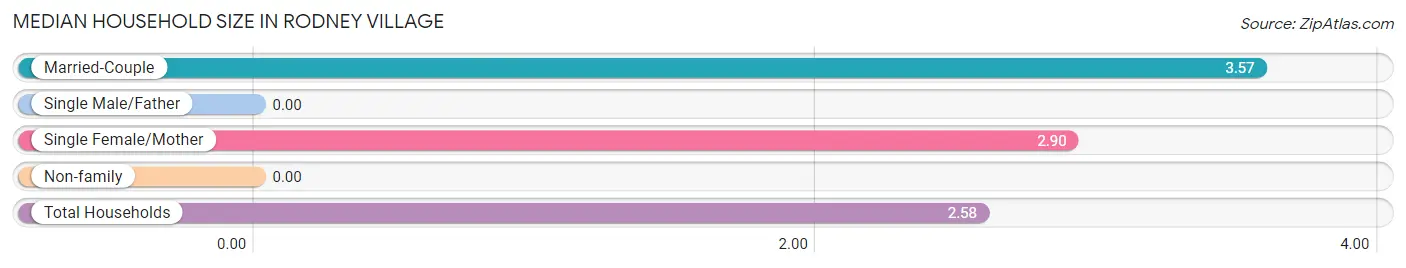
Median Household Size in Rodney Village
| Household Type | # Households | Household Size |
| Married-Couple | 201 (40.2%) | 3.57 |
| Single Male/Father | 0 (0.0%) | - |
| Single Female/Mother | 144 (28.8%) | 2.90 |
| Non-family | 155 (31.0%) | - |
| Total Households | 500 (100.0%) | 2.58 |
Household Size by Marriage Status in Rodney Village
Out of a total of 500 households in Rodney Village, 345 (69.0%) are family households, while 155 (31.0%) are nonfamily households. The most numerous type of family households are 2-person households, comprising 136, and the most common type of nonfamily households are 1-person households, comprising 155.
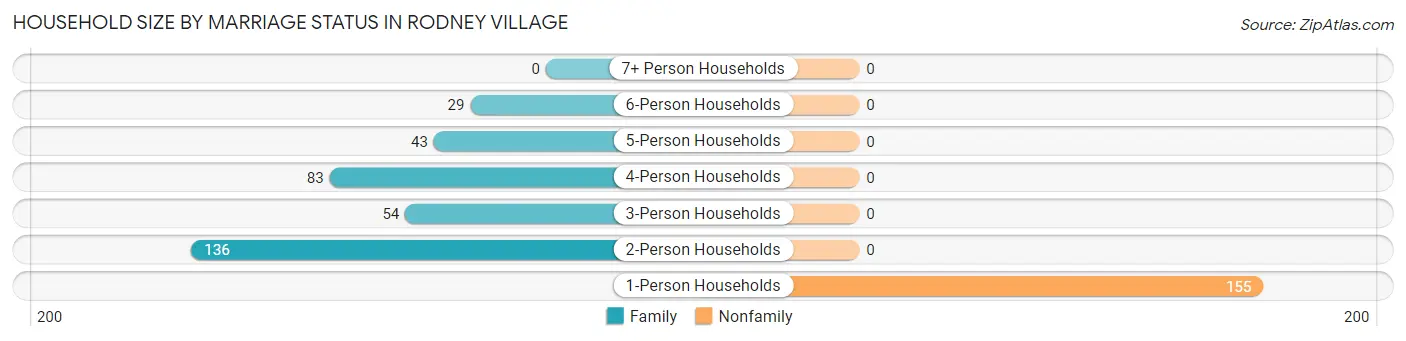
| Household Size | Family Households | Nonfamily Households |
| 1-Person Households | - | 155 (31.0%) |
| 2-Person Households | 136 (27.2%) | 0 (0.0%) |
| 3-Person Households | 54 (10.8%) | 0 (0.0%) |
| 4-Person Households | 83 (16.6%) | 0 (0.0%) |
| 5-Person Households | 43 (8.6%) | 0 (0.0%) |
| 6-Person Households | 29 (5.8%) | 0 (0.0%) |
| 7+ Person Households | 0 (0.0%) | 0 (0.0%) |
| Total | 345 (69.0%) | 155 (31.0%) |
Female Fertility in Rodney Village
Fertility by Age in Rodney Village
Average fertility rate in Rodney Village is 253.0 births per 1,000 women. Women in the age bracket of 20 to 34 years have the highest fertility rate with 616.0 births per 1,000 women. Women in the age bracket of 20 to 34 years acount for 62.5% of all women with births.
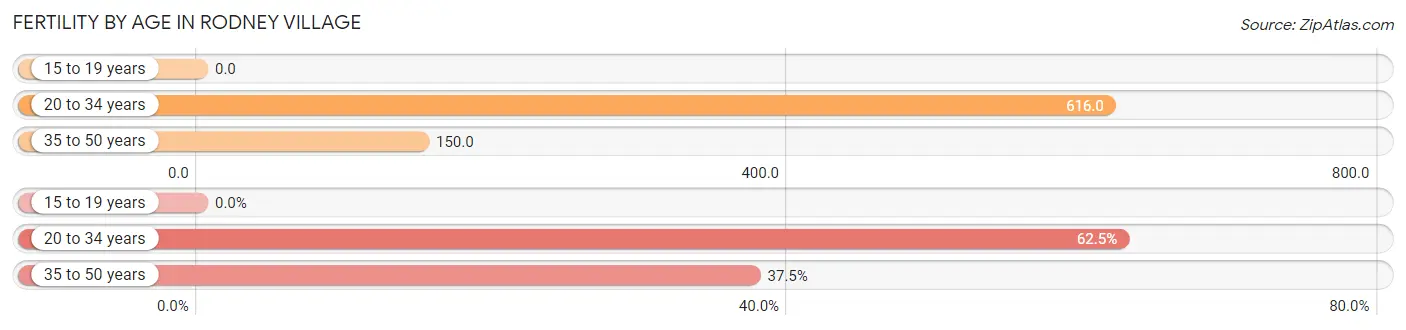
| Age Bracket | Women with Births | Births / 1,000 Women |
| 15 to 19 years | 0 (0.0%) | 0.0 |
| 20 to 34 years | 45 (62.5%) | 616.0 |
| 35 to 50 years | 27 (37.5%) | 150.0 |
| Total | 72 (100.0%) | 253.0 |
Fertility by Age by Marriage Status in Rodney Village
84.7% of women with births (72) in Rodney Village are married. The highest percentage of unmarried women with births falls into 20 to 34 years age bracket with 24.4% of them unmarried at the time of birth, while the lowest percentage of unmarried women with births belong to 35 to 50 years age bracket with 0.0% of them unmarried.
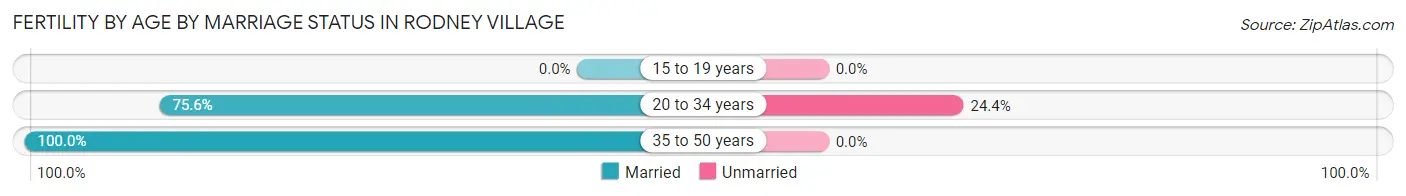
| Age Bracket | Married | Unmarried |
| 15 to 19 years | 0 (0.0%) | 0 (0.0%) |
| 20 to 34 years | 34 (75.6%) | 11 (24.4%) |
| 35 to 50 years | 27 (100.0%) | 0 (0.0%) |
| Total | 61 (84.7%) | 11 (15.3%) |
Fertility by Education in Rodney Village
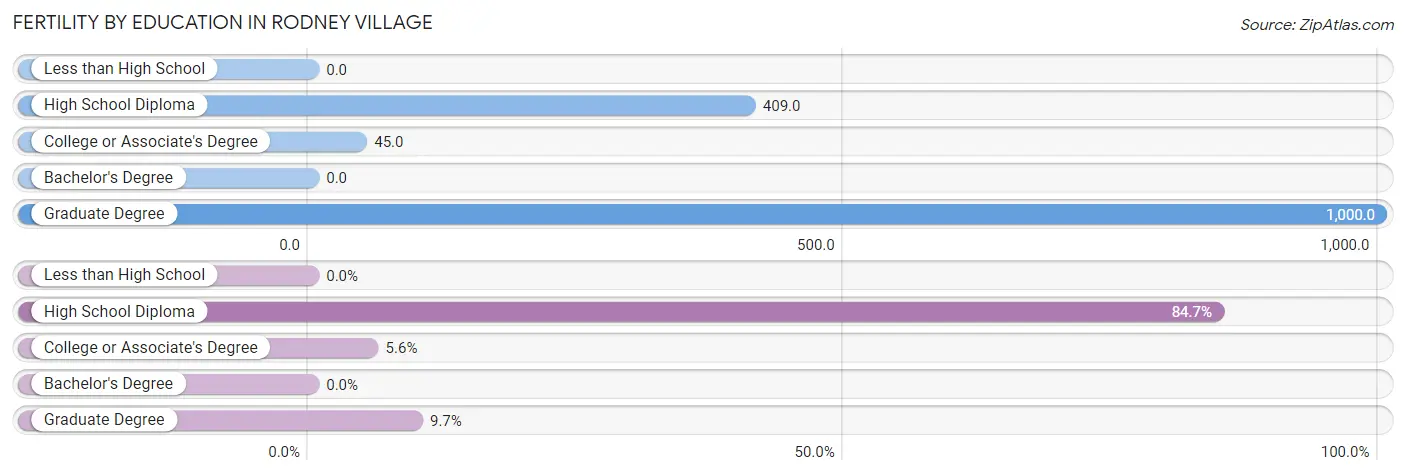
| Educational Attainment | Women with Births | Births / 1,000 Women |
| Less than High School | 0 (0.0%) | 0.0 |
| High School Diploma | 61 (84.7%) | 409.0 |
| College or Associate's Degree | 4 (5.6%) | 45.0 |
| Bachelor's Degree | 0 (0.0%) | 0.0 |
| Graduate Degree | 7 (9.7%) | 1,000.0 |
| Total | 72 (100.0%) | 253.0 |
Fertility by Education by Marriage Status in Rodney Village
15.3% of women with births in Rodney Village are unmarried. Women with the educational attainment of high school diploma are most likely to be married with 100.0% of them married at childbirth, while women with the educational attainment of college or associate's degree are least likely to be married with 100.0% of them unmarried at childbirth.
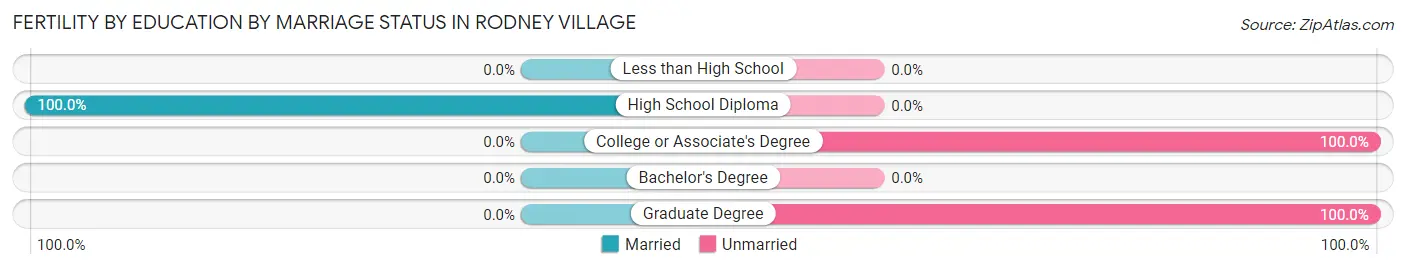
| Educational Attainment | Married | Unmarried |
| Less than High School | 0 (0.0%) | 0 (0.0%) |
| High School Diploma | 61 (100.0%) | 0 (0.0%) |
| College or Associate's Degree | 0 (0.0%) | 4 (100.0%) |
| Bachelor's Degree | 0 (0.0%) | 0 (0.0%) |
| Graduate Degree | 0 (0.0%) | 7 (100.0%) |
| Total | 61 (84.7%) | 11 (15.3%) |
Employment Characteristics in Rodney Village
Employment by Class of Employer in Rodney Village
Among the 547 employed individuals in Rodney Village, private company employees (398 | 72.8%), state government employees (95 | 17.4%), and not-for-profit organizations (42 | 7.7%) make up the most common classes of employment.
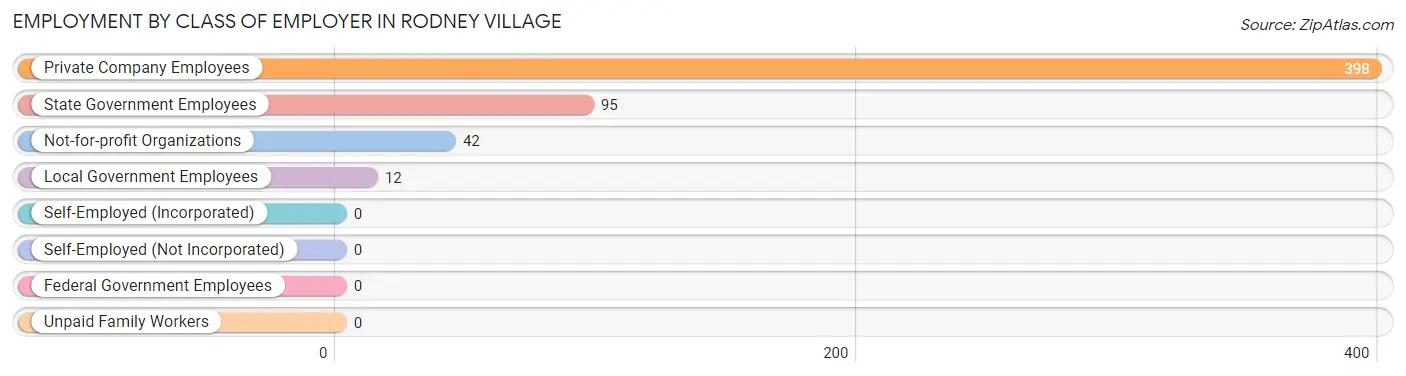
| Employer Class | # Employees | % Employees |
| Private Company Employees | 398 | 72.8% |
| Self-Employed (Incorporated) | 0 | 0.0% |
| Self-Employed (Not Incorporated) | 0 | 0.0% |
| Not-for-profit Organizations | 42 | 7.7% |
| Local Government Employees | 12 | 2.2% |
| State Government Employees | 95 | 17.4% |
| Federal Government Employees | 0 | 0.0% |
| Unpaid Family Workers | 0 | 0.0% |
| Total | 547 | 100.0% |
Employment Status by Age in Rodney Village
According to the labor force statistics for Rodney Village, out of the total population over 16 years of age (964), 59.6% or 575 individuals are in the labor force, with 4.9% or 28 of them unemployed. The age group with the highest labor force participation rate is 20 to 24 years, with 100.0% or 156 individuals in the labor force. Within the labor force, the 20 to 24 years age range has the highest percentage of unemployed individuals, with 11.5% or 18 of them being unemployed.
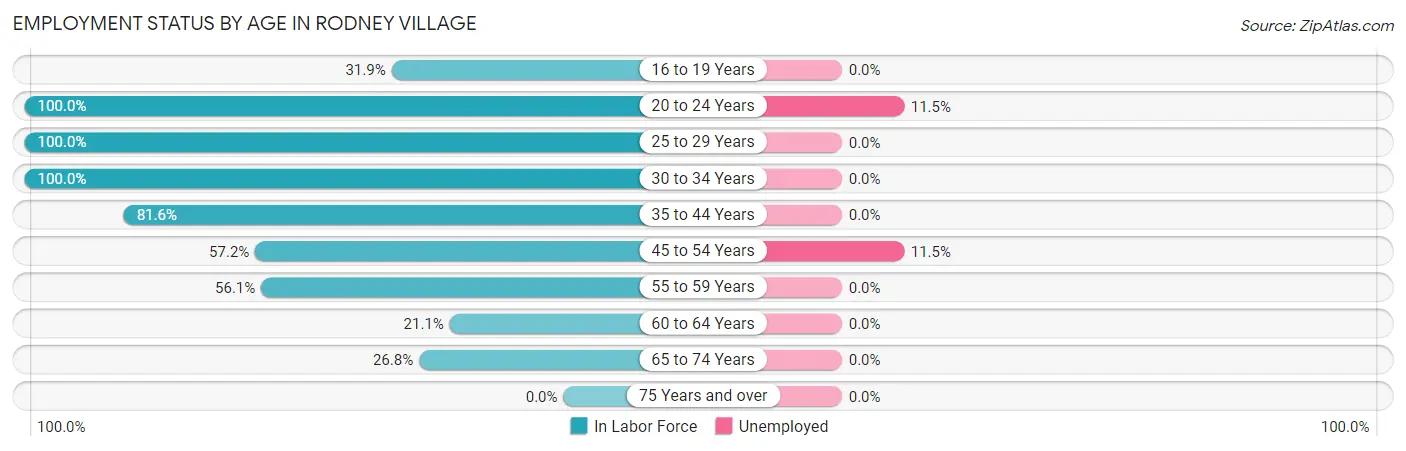
| Age Bracket | In Labor Force | Unemployed |
| 16 to 19 Years | 15 (31.9%) | 0 (0.0%) |
| 20 to 24 Years | 156 (100.0%) | 18 (11.5%) |
| 25 to 29 Years | 13 (100.0%) | 0 (0.0%) |
| 30 to 34 Years | 51 (100.0%) | 0 (0.0%) |
| 35 to 44 Years | 146 (81.6%) | 0 (0.0%) |
| 45 to 54 Years | 87 (57.2%) | 10 (11.5%) |
| 55 to 59 Years | 55 (56.1%) | 0 (0.0%) |
| 60 to 64 Years | 19 (21.1%) | 0 (0.0%) |
| 65 to 74 Years | 33 (26.8%) | 0 (0.0%) |
| 75 Years and over | 0 (0.0%) | 0 (0.0%) |
| Total | 575 (59.6%) | 28 (4.9%) |
Employment Status by Educational Attainment in Rodney Village
According to labor force statistics for Rodney Village, 63.6% of individuals (371) out of the total population between 25 and 64 years of age (583) are in the labor force, with 2.7% or 10 of them being unemployed. The group with the highest labor force participation rate are those with the educational attainment of college / associate degree, with 88.2% or 127 individuals in the labor force. Within the labor force, individuals with high school diploma education have the highest percentage of unemployment, with 5.2% or 10 of them being unemployed.
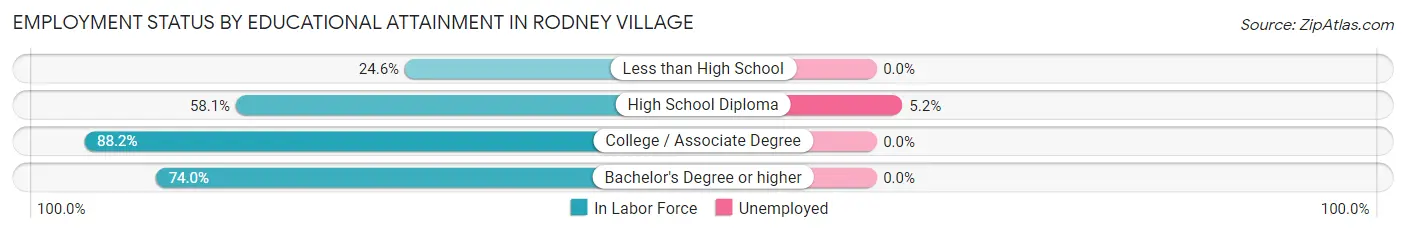
| Educational Attainment | In Labor Force | Unemployed |
| Less than High School | 14 (24.6%) | 0 (0.0%) |
| High School Diploma | 193 (58.1%) | 17 (5.2%) |
| College / Associate Degree | 127 (88.2%) | 0 (0.0%) |
| Bachelor's Degree or higher | 37 (74.0%) | 0 (0.0%) |
| Total | 371 (63.6%) | 16 (2.7%) |
Employment Occupations by Sex in Rodney Village
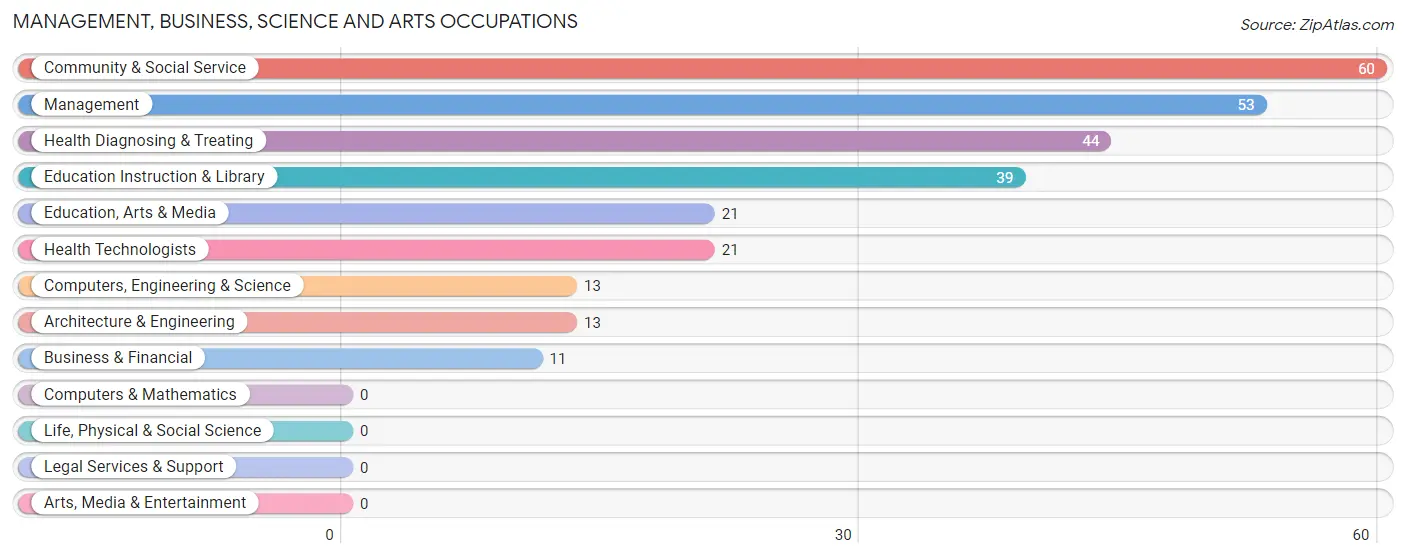
Management, Business, Science and Arts Occupations
The most common Management, Business, Science and Arts occupations in Rodney Village are Community & Social Service (60 | 11.0%), Management (53 | 9.7%), Health Diagnosing & Treating (44 | 8.0%), Education Instruction & Library (39 | 7.1%), and Education, Arts & Media (21 | 3.8%).
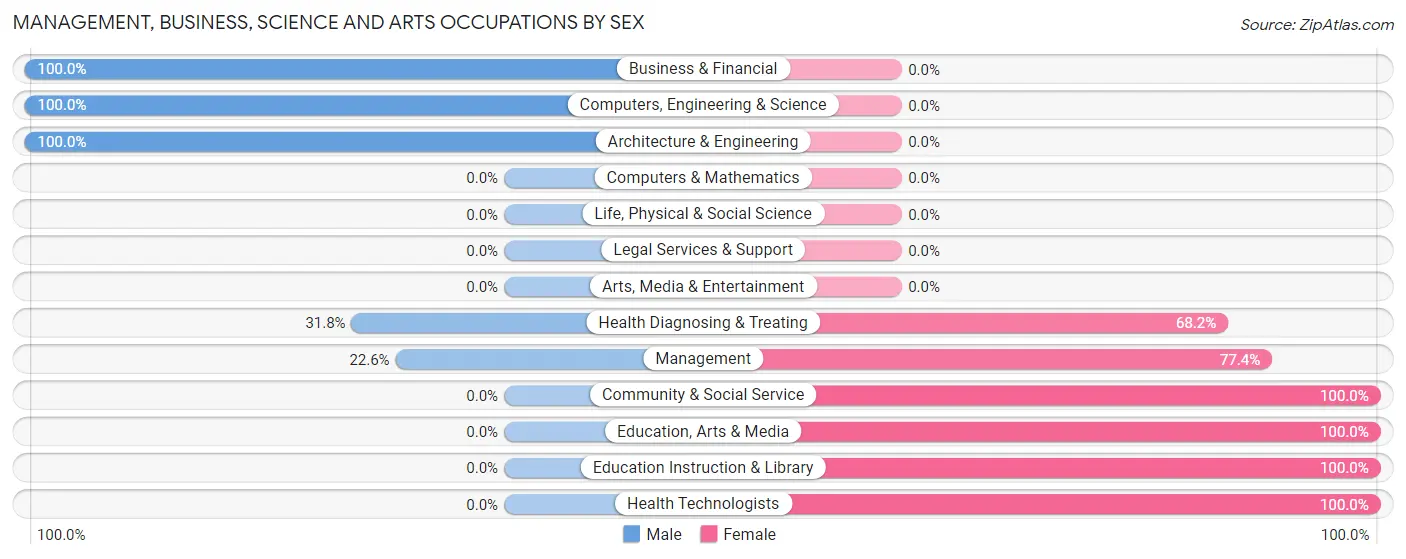
Management, Business, Science and Arts Occupations by Sex
Within the Management, Business, Science and Arts occupations in Rodney Village, the most male-oriented occupations are Business & Financial (100.0%), Computers, Engineering & Science (100.0%), and Architecture & Engineering (100.0%), while the most female-oriented occupations are Community & Social Service (100.0%), Education, Arts & Media (100.0%), and Education Instruction & Library (100.0%).
| Occupation | Male | Female |
| Management | 12 (22.6%) | 41 (77.4%) |
| Business & Financial | 11 (100.0%) | 0 (0.0%) |
| Computers, Engineering & Science | 13 (100.0%) | 0 (0.0%) |
| Computers & Mathematics | 0 (0.0%) | 0 (0.0%) |
| Architecture & Engineering | 13 (100.0%) | 0 (0.0%) |
| Life, Physical & Social Science | 0 (0.0%) | 0 (0.0%) |
| Community & Social Service | 0 (0.0%) | 60 (100.0%) |
| Education, Arts & Media | 0 (0.0%) | 21 (100.0%) |
| Legal Services & Support | 0 (0.0%) | 0 (0.0%) |
| Education Instruction & Library | 0 (0.0%) | 39 (100.0%) |
| Arts, Media & Entertainment | 0 (0.0%) | 0 (0.0%) |
| Health Diagnosing & Treating | 14 (31.8%) | 30 (68.2%) |
| Health Technologists | 0 (0.0%) | 21 (100.0%) |
| Total (Category) | 50 (27.6%) | 131 (72.4%) |
| Total (Overall) | 263 (48.1%) | 284 (51.9%) |
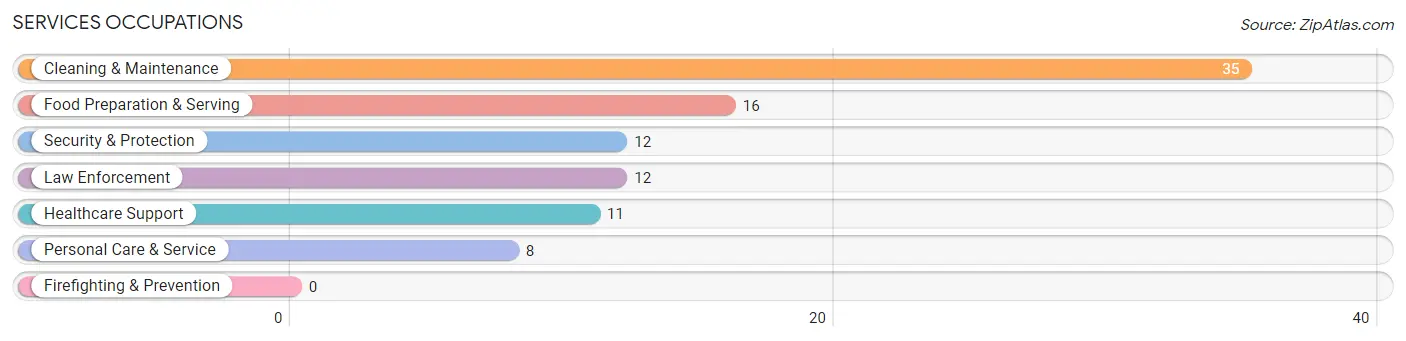
Services Occupations
The most common Services occupations in Rodney Village are Cleaning & Maintenance (35 | 6.4%), Food Preparation & Serving (16 | 2.9%), Security & Protection (12 | 2.2%), Law Enforcement (12 | 2.2%), and Healthcare Support (11 | 2.0%).
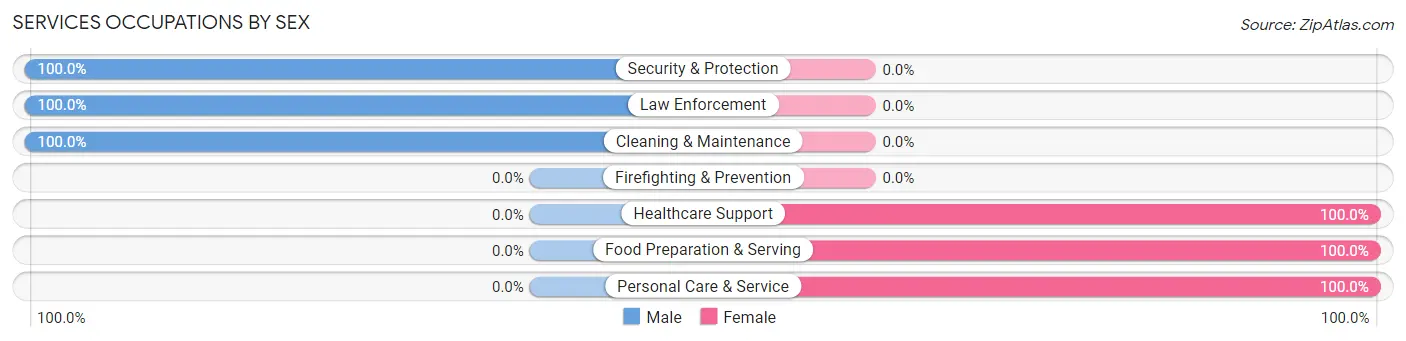
Services Occupations by Sex
Within the Services occupations in Rodney Village, the most male-oriented occupations are Security & Protection (100.0%), Law Enforcement (100.0%), and Cleaning & Maintenance (100.0%), while the most female-oriented occupations are Healthcare Support (100.0%), Food Preparation & Serving (100.0%), and Personal Care & Service (100.0%).
| Occupation | Male | Female |
| Healthcare Support | 0 (0.0%) | 11 (100.0%) |
| Security & Protection | 12 (100.0%) | 0 (0.0%) |
| Firefighting & Prevention | 0 (0.0%) | 0 (0.0%) |
| Law Enforcement | 12 (100.0%) | 0 (0.0%) |
| Food Preparation & Serving | 0 (0.0%) | 16 (100.0%) |
| Cleaning & Maintenance | 35 (100.0%) | 0 (0.0%) |
| Personal Care & Service | 0 (0.0%) | 8 (100.0%) |
| Total (Category) | 47 (57.3%) | 35 (42.7%) |
| Total (Overall) | 263 (48.1%) | 284 (51.9%) |
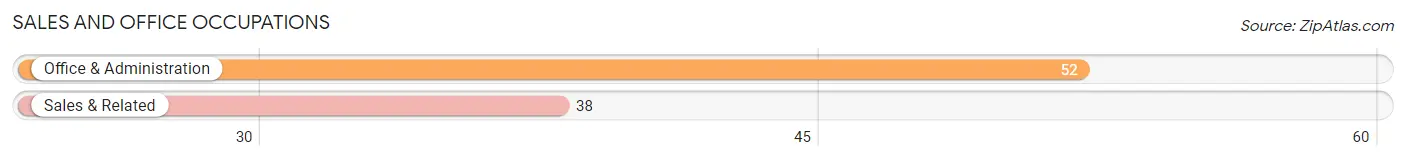
Sales and Office Occupations
The most common Sales and Office occupations in Rodney Village are Office & Administration (52 | 9.5%), and Sales & Related (38 | 7.0%).
Sales and Office Occupations by Sex
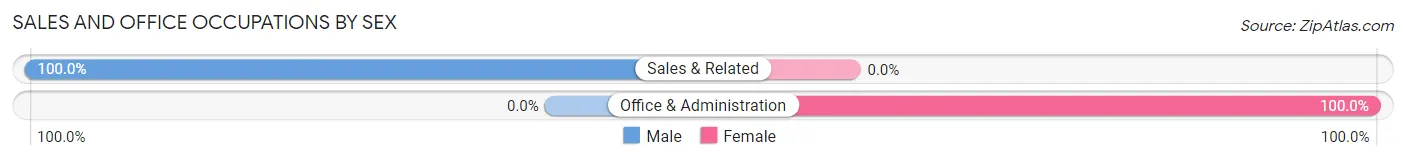
| Occupation | Male | Female |
| Sales & Related | 38 (100.0%) | 0 (0.0%) |
| Office & Administration | 0 (0.0%) | 52 (100.0%) |
| Total (Category) | 38 (42.2%) | 52 (57.8%) |
| Total (Overall) | 263 (48.1%) | 284 (51.9%) |
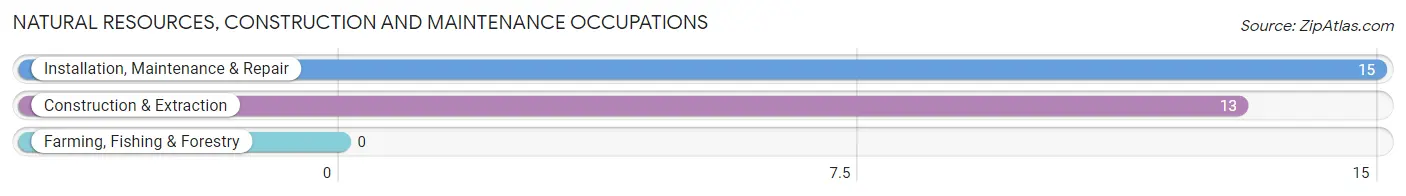
Natural Resources, Construction and Maintenance Occupations
The most common Natural Resources, Construction and Maintenance occupations in Rodney Village are Installation, Maintenance & Repair (15 | 2.7%), and Construction & Extraction (13 | 2.4%).
Natural Resources, Construction and Maintenance Occupations by Sex
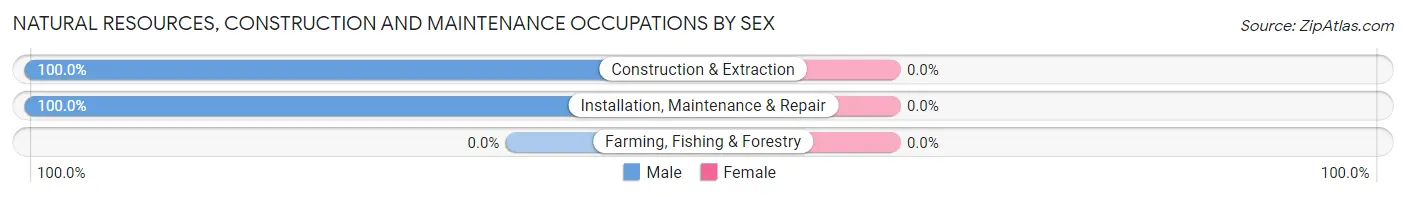
| Occupation | Male | Female |
| Farming, Fishing & Forestry | 0 (0.0%) | 0 (0.0%) |
| Construction & Extraction | 13 (100.0%) | 0 (0.0%) |
| Installation, Maintenance & Repair | 15 (100.0%) | 0 (0.0%) |
| Total (Category) | 28 (100.0%) | 0 (0.0%) |
| Total (Overall) | 263 (48.1%) | 284 (51.9%) |
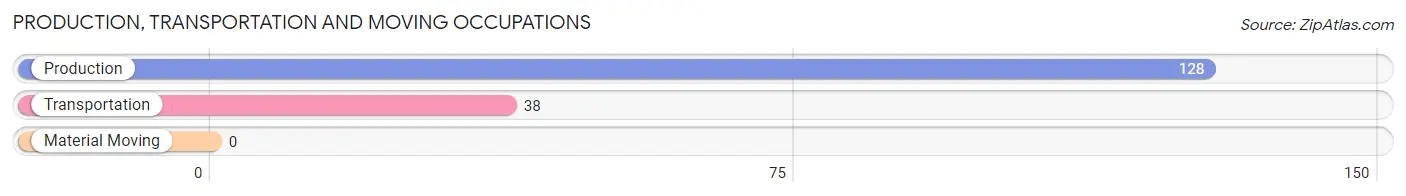
Production, Transportation and Moving Occupations
The most common Production, Transportation and Moving occupations in Rodney Village are Production (128 | 23.4%), and Transportation (38 | 7.0%).
Production, Transportation and Moving Occupations by Sex
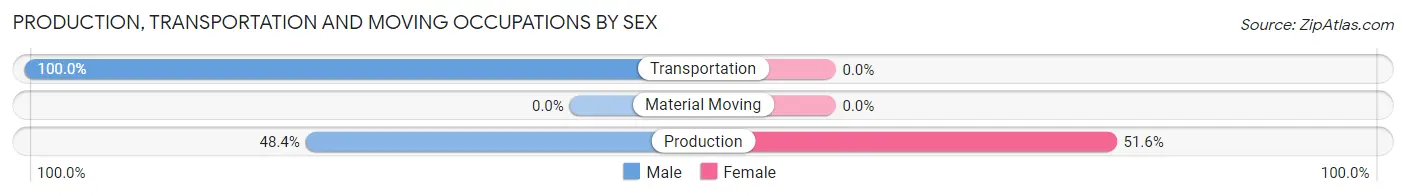
| Occupation | Male | Female |
| Production | 62 (48.4%) | 66 (51.6%) |
| Transportation | 38 (100.0%) | 0 (0.0%) |
| Material Moving | 0 (0.0%) | 0 (0.0%) |
| Total (Category) | 100 (60.2%) | 66 (39.8%) |
| Total (Overall) | 263 (48.1%) | 284 (51.9%) |
Employment Industries by Sex in Rodney Village
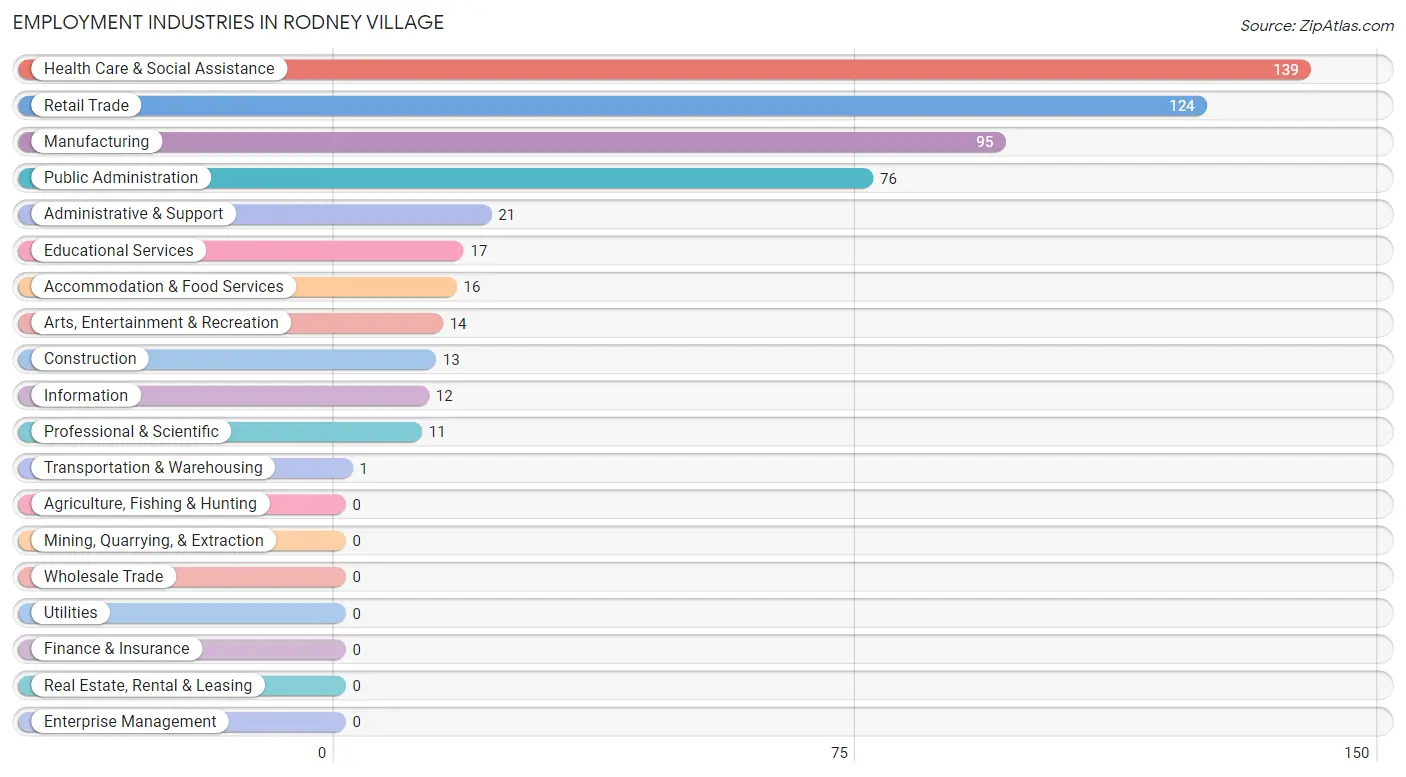
Employment Industries in Rodney Village
The major employment industries in Rodney Village include Health Care & Social Assistance (139 | 25.4%), Retail Trade (124 | 22.7%), Manufacturing (95 | 17.4%), Public Administration (76 | 13.9%), and Administrative & Support (21 | 3.8%).
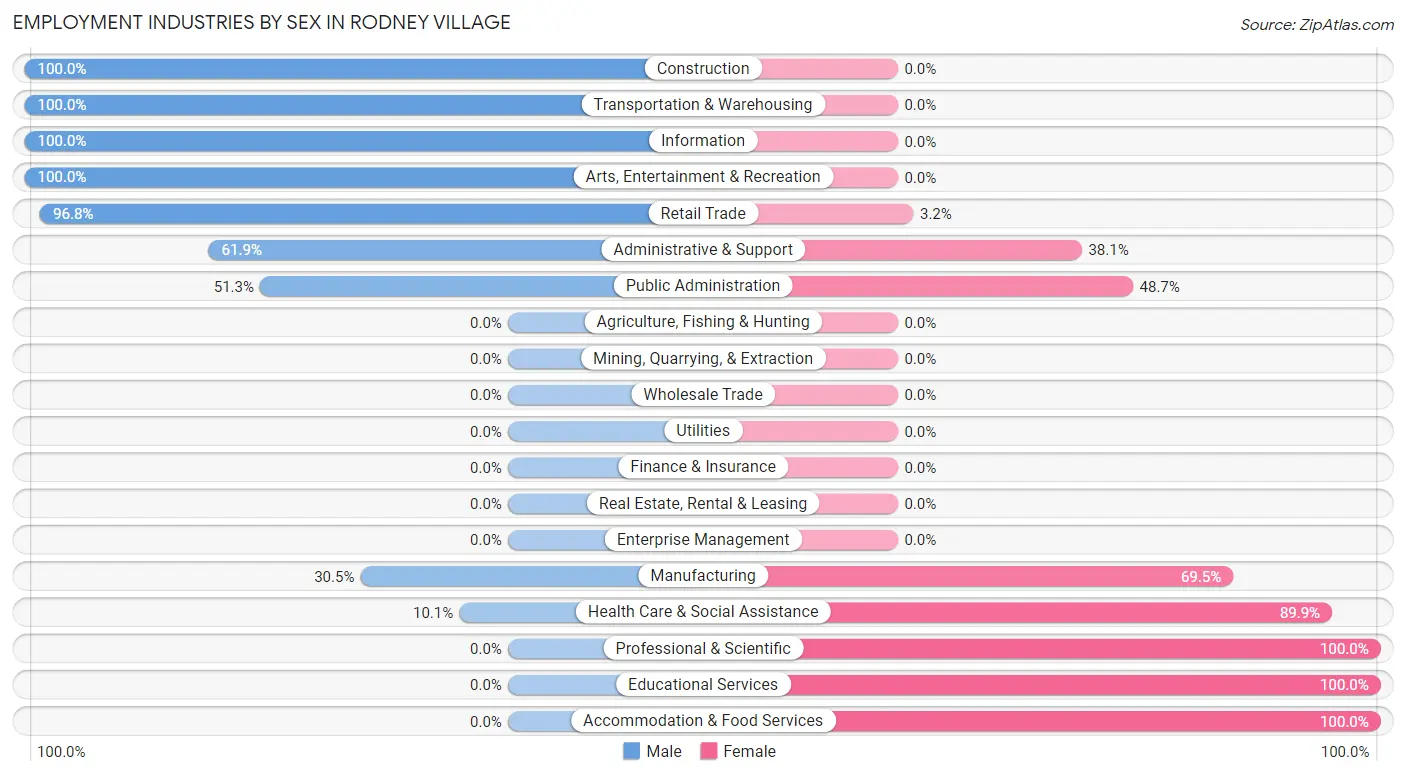
Employment Industries by Sex in Rodney Village
The Rodney Village industries that see more men than women are Construction (100.0%), Transportation & Warehousing (100.0%), and Information (100.0%), whereas the industries that tend to have a higher number of women are Professional & Scientific (100.0%), Educational Services (100.0%), and Accommodation & Food Services (100.0%).
| Industry | Male | Female |
| Agriculture, Fishing & Hunting | 0 (0.0%) | 0 (0.0%) |
| Mining, Quarrying, & Extraction | 0 (0.0%) | 0 (0.0%) |
| Construction | 13 (100.0%) | 0 (0.0%) |
| Manufacturing | 29 (30.5%) | 66 (69.5%) |
| Wholesale Trade | 0 (0.0%) | 0 (0.0%) |
| Retail Trade | 120 (96.8%) | 4 (3.2%) |
| Transportation & Warehousing | 1 (100.0%) | 0 (0.0%) |
| Utilities | 0 (0.0%) | 0 (0.0%) |
| Information | 12 (100.0%) | 0 (0.0%) |
| Finance & Insurance | 0 (0.0%) | 0 (0.0%) |
| Real Estate, Rental & Leasing | 0 (0.0%) | 0 (0.0%) |
| Professional & Scientific | 0 (0.0%) | 11 (100.0%) |
| Enterprise Management | 0 (0.0%) | 0 (0.0%) |
| Administrative & Support | 13 (61.9%) | 8 (38.1%) |
| Educational Services | 0 (0.0%) | 17 (100.0%) |
| Health Care & Social Assistance | 14 (10.1%) | 125 (89.9%) |
| Arts, Entertainment & Recreation | 14 (100.0%) | 0 (0.0%) |
| Accommodation & Food Services | 0 (0.0%) | 16 (100.0%) |
| Public Administration | 39 (51.3%) | 37 (48.7%) |
| Total | 263 (48.1%) | 284 (51.9%) |
Education in Rodney Village
School Enrollment in Rodney Village
The most common levels of schooling among the 273 students in Rodney Village are middle school (85 | 31.1%), college / undergraduate (75 | 27.5%), and elementary school (42 | 15.4%).
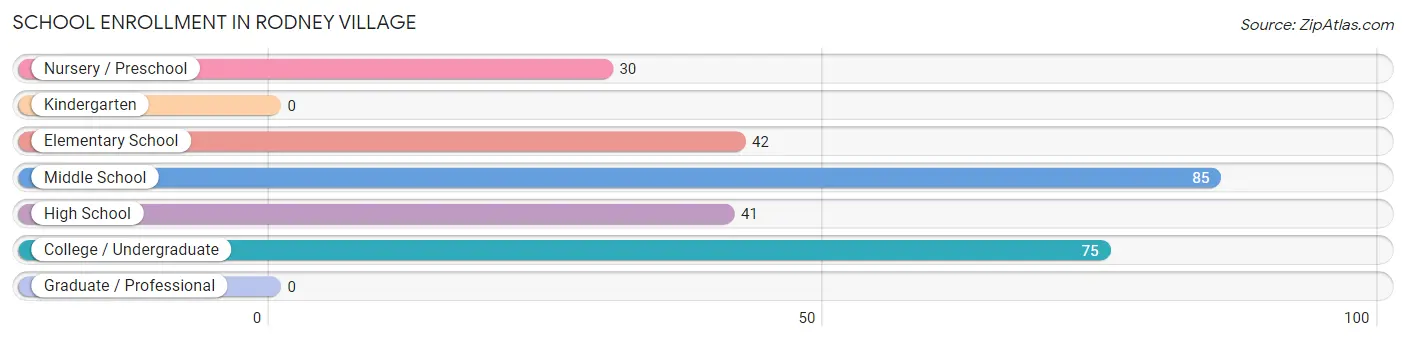
| School Level | # Students | % Students |
| Nursery / Preschool | 30 | 11.0% |
| Kindergarten | 0 | 0.0% |
| Elementary School | 42 | 15.4% |
| Middle School | 85 | 31.1% |
| High School | 41 | 15.0% |
| College / Undergraduate | 75 | 27.5% |
| Graduate / Professional | 0 | 0.0% |
| Total | 273 | 100.0% |
School Enrollment by Age by Funding Source in Rodney Village
Out of a total of 273 students who are enrolled in schools in Rodney Village, 41 (15.0%) attend a private institution, while the remaining 232 (85.0%) are enrolled in public schools. The age group of 20 to 24 year olds has the highest likelihood of being enrolled in private schools, with 36 (73.5% in the age bracket) enrolled. Conversely, the age group of 3 to 4 year olds has the lowest likelihood of being enrolled in a private school, with 30 (100.0% in the age bracket) attending a public institution.
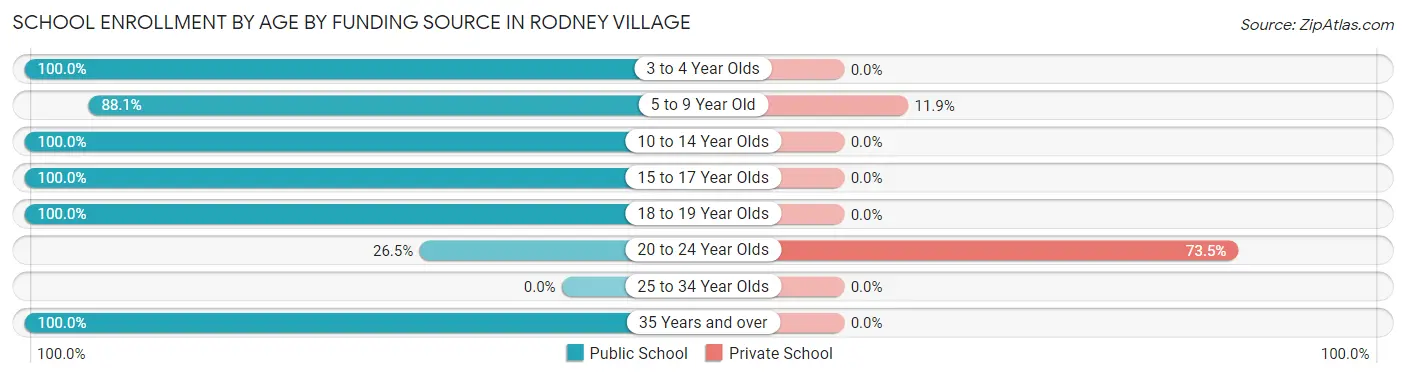
| Age Bracket | Public School | Private School |
| 3 to 4 Year Olds | 30 (100.0%) | 0 (0.0%) |
| 5 to 9 Year Old | 37 (88.1%) | 5 (11.9%) |
| 10 to 14 Year Olds | 85 (100.0%) | 0 (0.0%) |
| 15 to 17 Year Olds | 41 (100.0%) | 0 (0.0%) |
| 18 to 19 Year Olds | 14 (100.0%) | 0 (0.0%) |
| 20 to 24 Year Olds | 13 (26.5%) | 36 (73.5%) |
| 25 to 34 Year Olds | 0 (0.0%) | 0 (0.0%) |
| 35 Years and over | 12 (100.0%) | 0 (0.0%) |
| Total | 232 (85.0%) | 41 (15.0%) |
Educational Attainment by Field of Study in Rodney Village
Psychology (42 | 50.6%), engineering (14 | 16.9%), business (11 | 13.3%), arts & humanities (9 | 10.8%), and education (7 | 8.4%) are the most common fields of study among 83 individuals in Rodney Village who have obtained a bachelor's degree or higher.
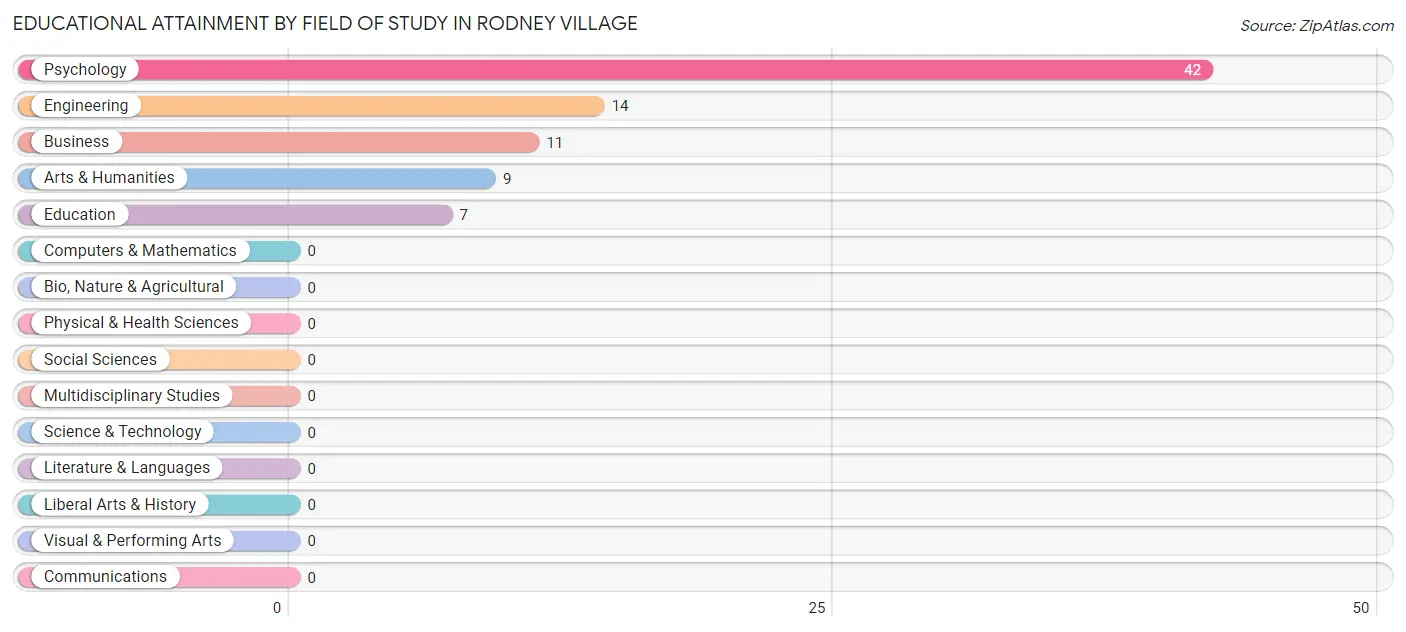
| Field of Study | # Graduates | % Graduates |
| Computers & Mathematics | 0 | 0.0% |
| Bio, Nature & Agricultural | 0 | 0.0% |
| Physical & Health Sciences | 0 | 0.0% |
| Psychology | 42 | 50.6% |
| Social Sciences | 0 | 0.0% |
| Engineering | 14 | 16.9% |
| Multidisciplinary Studies | 0 | 0.0% |
| Science & Technology | 0 | 0.0% |
| Business | 11 | 13.3% |
| Education | 7 | 8.4% |
| Literature & Languages | 0 | 0.0% |
| Liberal Arts & History | 0 | 0.0% |
| Visual & Performing Arts | 0 | 0.0% |
| Communications | 0 | 0.0% |
| Arts & Humanities | 9 | 10.8% |
| Total | 83 | 100.0% |
Transportation & Commute in Rodney Village
Vehicle Availability by Sex in Rodney Village
The most prevalent vehicle ownership categories in Rodney Village are males with 2 vehicles (89, accounting for 34.1%) and females with 2 vehicles (128, making up 32.0%).
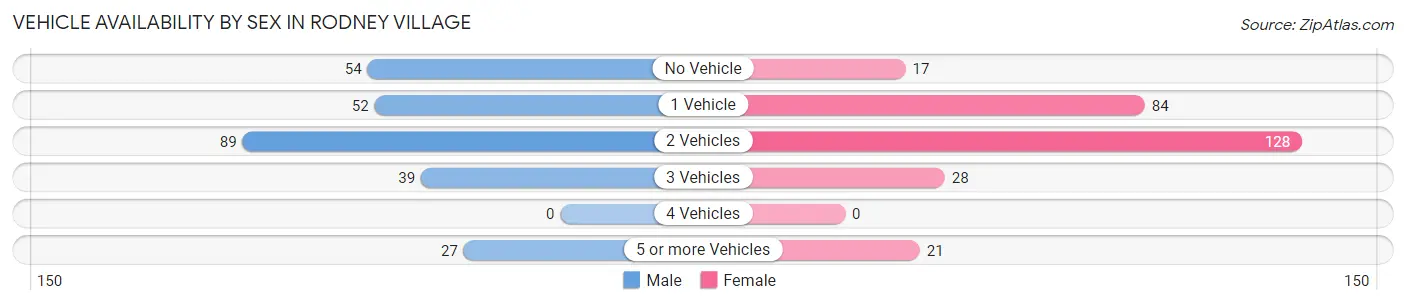
| Vehicles Available | Male | Female |
| No Vehicle | 54 (20.7%) | 17 (6.1%) |
| 1 Vehicle | 52 (19.9%) | 84 (30.2%) |
| 2 Vehicles | 89 (34.1%) | 128 (46.0%) |
| 3 Vehicles | 39 (14.9%) | 28 (10.1%) |
| 4 Vehicles | 0 (0.0%) | 0 (0.0%) |
| 5 or more Vehicles | 27 (10.3%) | 21 (7.5%) |
| Total | 261 (100.0%) | 278 (100.0%) |
Commute Time in Rodney Village
The most frequently occuring commute durations in Rodney Village are 15 to 19 minutes (122 commuters, 22.3%), 30 to 34 minutes (93 commuters, 17.0%), and 10 to 14 minutes (65 commuters, 11.9%).
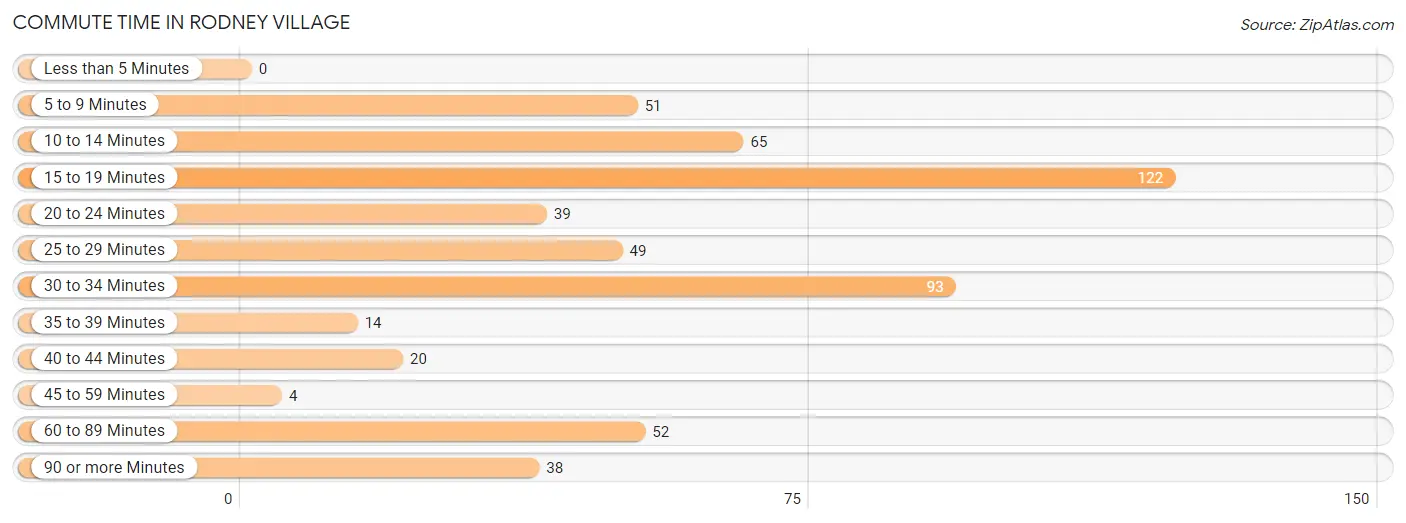
| Commute Time | # Commuters | % Commuters |
| Less than 5 Minutes | 0 | 0.0% |
| 5 to 9 Minutes | 51 | 9.3% |
| 10 to 14 Minutes | 65 | 11.9% |
| 15 to 19 Minutes | 122 | 22.3% |
| 20 to 24 Minutes | 39 | 7.1% |
| 25 to 29 Minutes | 49 | 9.0% |
| 30 to 34 Minutes | 93 | 17.0% |
| 35 to 39 Minutes | 14 | 2.6% |
| 40 to 44 Minutes | 20 | 3.7% |
| 45 to 59 Minutes | 4 | 0.7% |
| 60 to 89 Minutes | 52 | 9.5% |
| 90 or more Minutes | 38 | 7.0% |
Commute Time by Sex in Rodney Village
The most common commute times in Rodney Village are 15 to 19 minutes (92 commuters, 35.0%) for males and 5 to 9 minutes (51 commuters, 18.0%) for females.
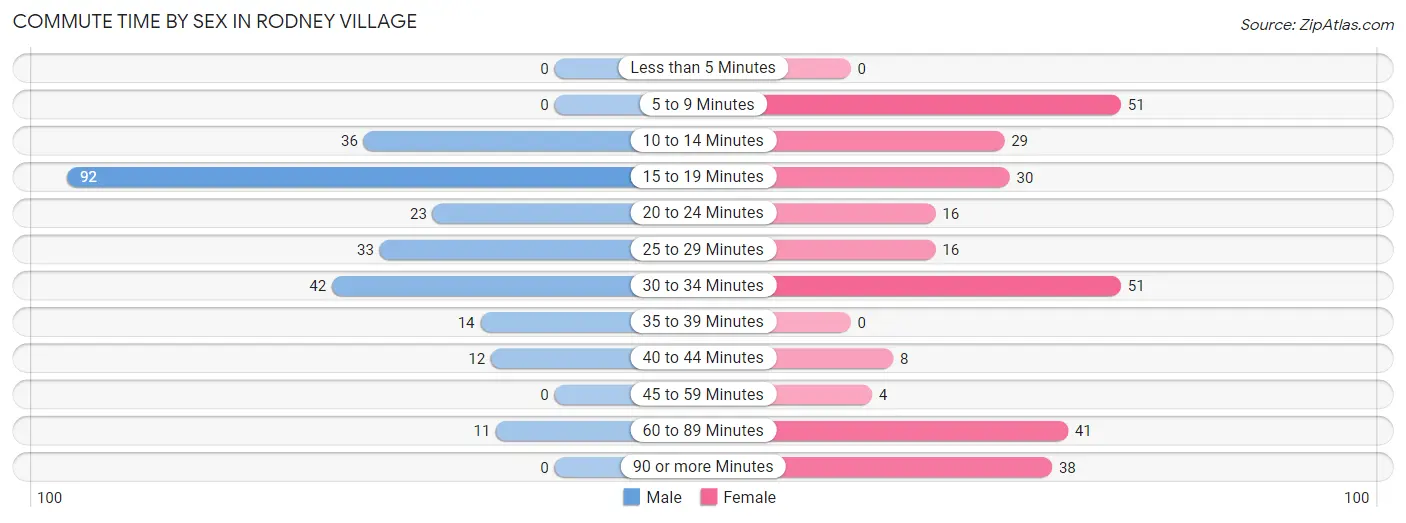
| Commute Time | Male | Female |
| Less than 5 Minutes | 0 (0.0%) | 0 (0.0%) |
| 5 to 9 Minutes | 0 (0.0%) | 51 (18.0%) |
| 10 to 14 Minutes | 36 (13.7%) | 29 (10.2%) |
| 15 to 19 Minutes | 92 (35.0%) | 30 (10.6%) |
| 20 to 24 Minutes | 23 (8.7%) | 16 (5.6%) |
| 25 to 29 Minutes | 33 (12.6%) | 16 (5.6%) |
| 30 to 34 Minutes | 42 (16.0%) | 51 (18.0%) |
| 35 to 39 Minutes | 14 (5.3%) | 0 (0.0%) |
| 40 to 44 Minutes | 12 (4.6%) | 8 (2.8%) |
| 45 to 59 Minutes | 0 (0.0%) | 4 (1.4%) |
| 60 to 89 Minutes | 11 (4.2%) | 41 (14.4%) |
| 90 or more Minutes | 0 (0.0%) | 38 (13.4%) |
Time of Departure to Work by Sex in Rodney Village
The most frequent times of departure to work in Rodney Village are 12:00 PM to 3:59 PM (133, 50.6%) for males and 7:00 AM to 7:29 AM (104, 36.6%) for females.
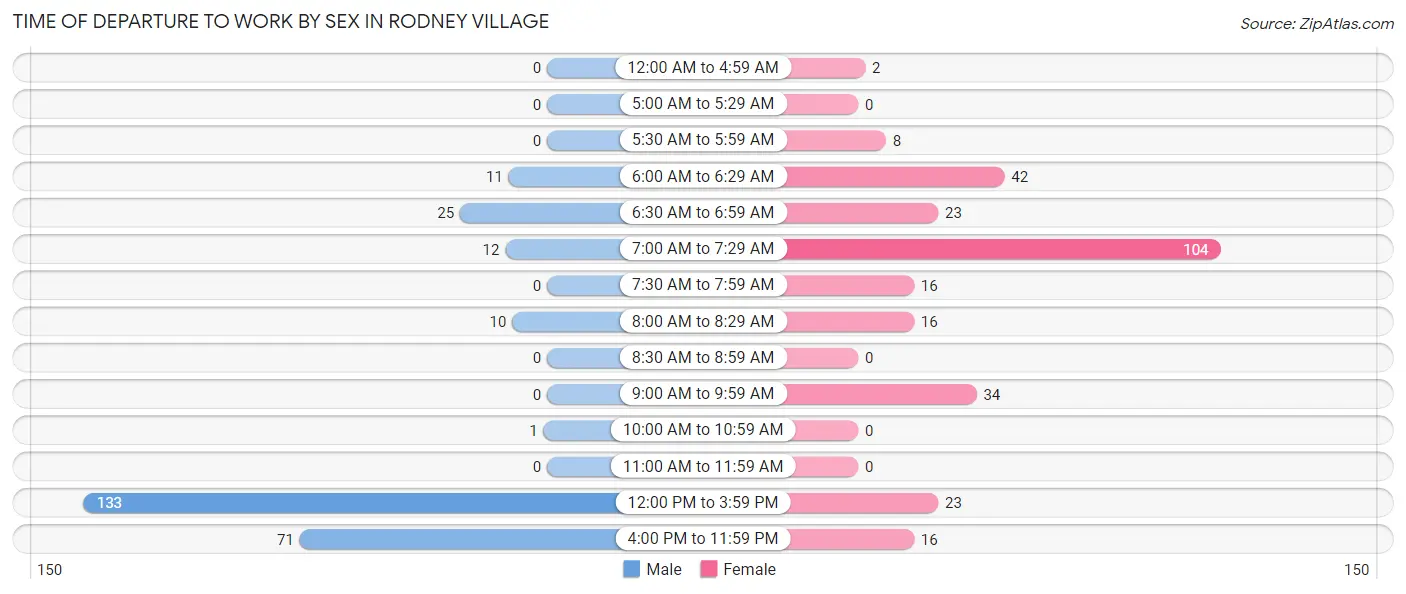
| Time of Departure | Male | Female |
| 12:00 AM to 4:59 AM | 0 (0.0%) | 2 (0.7%) |
| 5:00 AM to 5:29 AM | 0 (0.0%) | 0 (0.0%) |
| 5:30 AM to 5:59 AM | 0 (0.0%) | 8 (2.8%) |
| 6:00 AM to 6:29 AM | 11 (4.2%) | 42 (14.8%) |
| 6:30 AM to 6:59 AM | 25 (9.5%) | 23 (8.1%) |
| 7:00 AM to 7:29 AM | 12 (4.6%) | 104 (36.6%) |
| 7:30 AM to 7:59 AM | 0 (0.0%) | 16 (5.6%) |
| 8:00 AM to 8:29 AM | 10 (3.8%) | 16 (5.6%) |
| 8:30 AM to 8:59 AM | 0 (0.0%) | 0 (0.0%) |
| 9:00 AM to 9:59 AM | 0 (0.0%) | 34 (12.0%) |
| 10:00 AM to 10:59 AM | 1 (0.4%) | 0 (0.0%) |
| 11:00 AM to 11:59 AM | 0 (0.0%) | 0 (0.0%) |
| 12:00 PM to 3:59 PM | 133 (50.6%) | 23 (8.1%) |
| 4:00 PM to 11:59 PM | 71 (27.0%) | 16 (5.6%) |
| Total | 263 (100.0%) | 284 (100.0%) |
Housing Occupancy in Rodney Village
Occupancy by Ownership in Rodney Village
Of the total 500 dwellings in Rodney Village, owner-occupied units account for 224 (44.8%), while renter-occupied units make up 276 (55.2%).
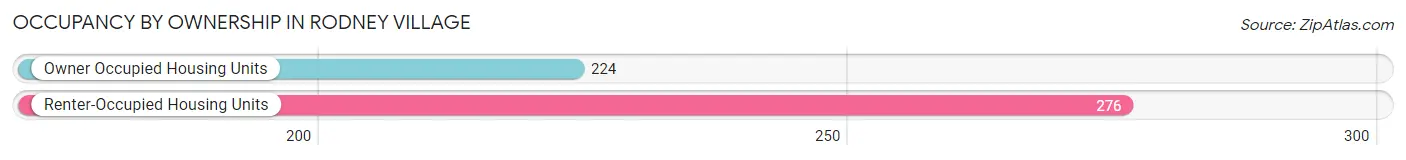
| Occupancy | # Housing Units | % Housing Units |
| Owner Occupied Housing Units | 224 | 44.8% |
| Renter-Occupied Housing Units | 276 | 55.2% |
| Total Occupied Housing Units | 500 | 100.0% |
Occupancy by Household Size in Rodney Village
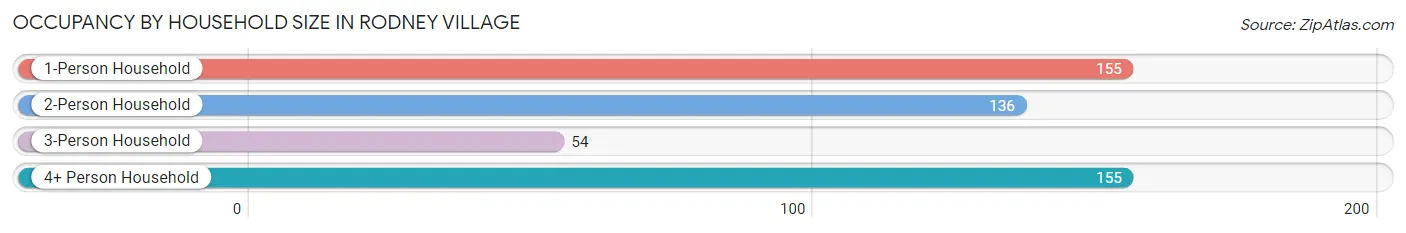
| Household Size | # Housing Units | % Housing Units |
| 1-Person Household | 155 | 31.0% |
| 2-Person Household | 136 | 27.2% |
| 3-Person Household | 54 | 10.8% |
| 4+ Person Household | 155 | 31.0% |
| Total Housing Units | 500 | 100.0% |
Occupancy by Ownership by Household Size in Rodney Village
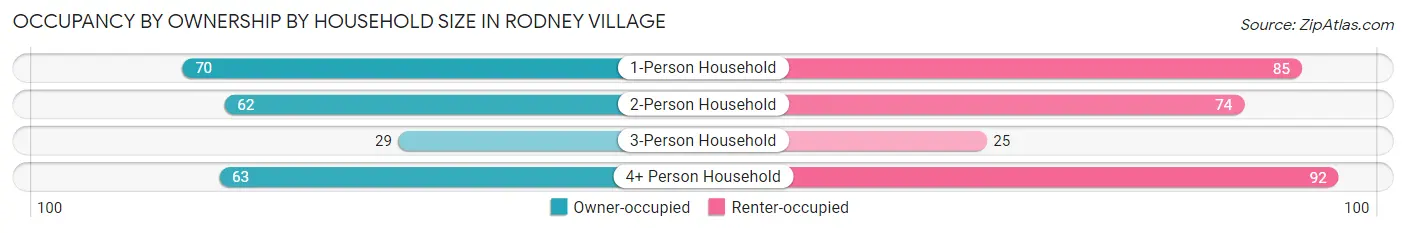
| Household Size | Owner-occupied | Renter-occupied |
| 1-Person Household | 70 (45.2%) | 85 (54.8%) |
| 2-Person Household | 62 (45.6%) | 74 (54.4%) |
| 3-Person Household | 29 (53.7%) | 25 (46.3%) |
| 4+ Person Household | 63 (40.6%) | 92 (59.4%) |
| Total Housing Units | 224 (44.8%) | 276 (55.2%) |
Occupancy by Educational Attainment in Rodney Village
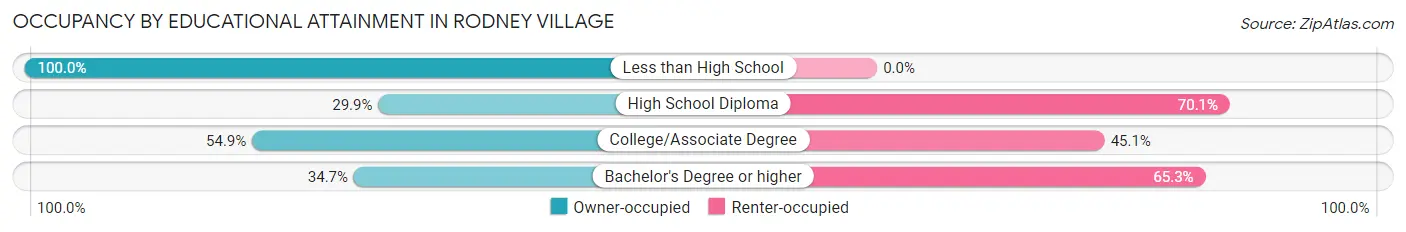
| Household Size | Owner-occupied | Renter-occupied |
| Less than High School | 54 (100.0%) | 0 (0.0%) |
| High School Diploma | 72 (29.9%) | 169 (70.1%) |
| College/Associate Degree | 73 (54.9%) | 60 (45.1%) |
| Bachelor's Degree or higher | 25 (34.7%) | 47 (65.3%) |
Occupancy by Age of Householder in Rodney Village
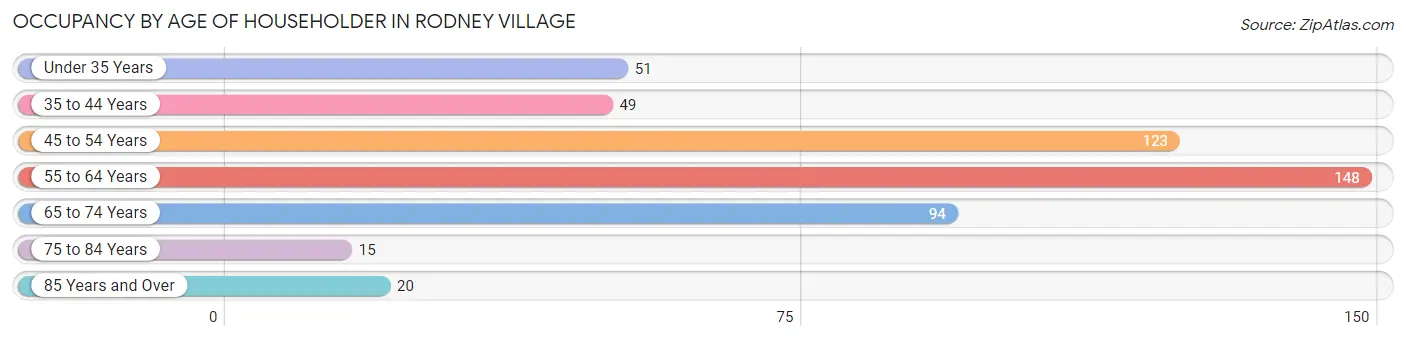
| Age Bracket | # Households | % Households |
| Under 35 Years | 51 | 10.2% |
| 35 to 44 Years | 49 | 9.8% |
| 45 to 54 Years | 123 | 24.6% |
| 55 to 64 Years | 148 | 29.6% |
| 65 to 74 Years | 94 | 18.8% |
| 75 to 84 Years | 15 | 3.0% |
| 85 Years and Over | 20 | 4.0% |
| Total | 500 | 100.0% |
Housing Finances in Rodney Village
Median Income by Occupancy in Rodney Village
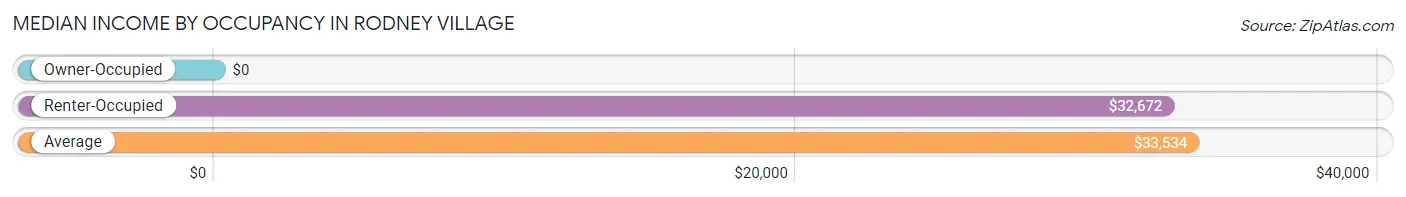
| Occupancy Type | # Households | Median Income |
| Owner-Occupied | 224 (44.8%) | $0 |
| Renter-Occupied | 276 (55.2%) | $32,672 |
| Average | 500 (100.0%) | $33,534 |
Occupancy by Householder Income Bracket in Rodney Village
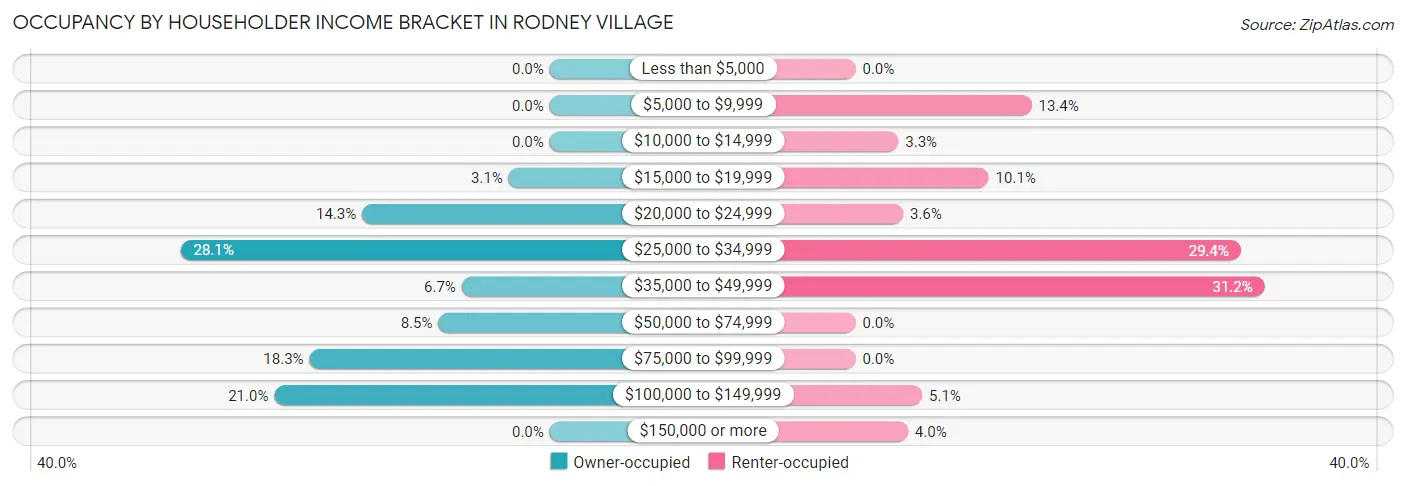
| Income Bracket | Owner-occupied | Renter-occupied |
| Less than $5,000 | 0 (0.0%) | 0 (0.0%) |
| $5,000 to $9,999 | 0 (0.0%) | 37 (13.4%) |
| $10,000 to $14,999 | 0 (0.0%) | 9 (3.3%) |
| $15,000 to $19,999 | 7 (3.1%) | 28 (10.1%) |
| $20,000 to $24,999 | 32 (14.3%) | 10 (3.6%) |
| $25,000 to $34,999 | 63 (28.1%) | 81 (29.3%) |
| $35,000 to $49,999 | 15 (6.7%) | 86 (31.2%) |
| $50,000 to $74,999 | 19 (8.5%) | 0 (0.0%) |
| $75,000 to $99,999 | 41 (18.3%) | 0 (0.0%) |
| $100,000 to $149,999 | 47 (21.0%) | 14 (5.1%) |
| $150,000 or more | 0 (0.0%) | 11 (4.0%) |
| Total | 224 (100.0%) | 276 (100.0%) |
Monthly Housing Cost Tiers in Rodney Village
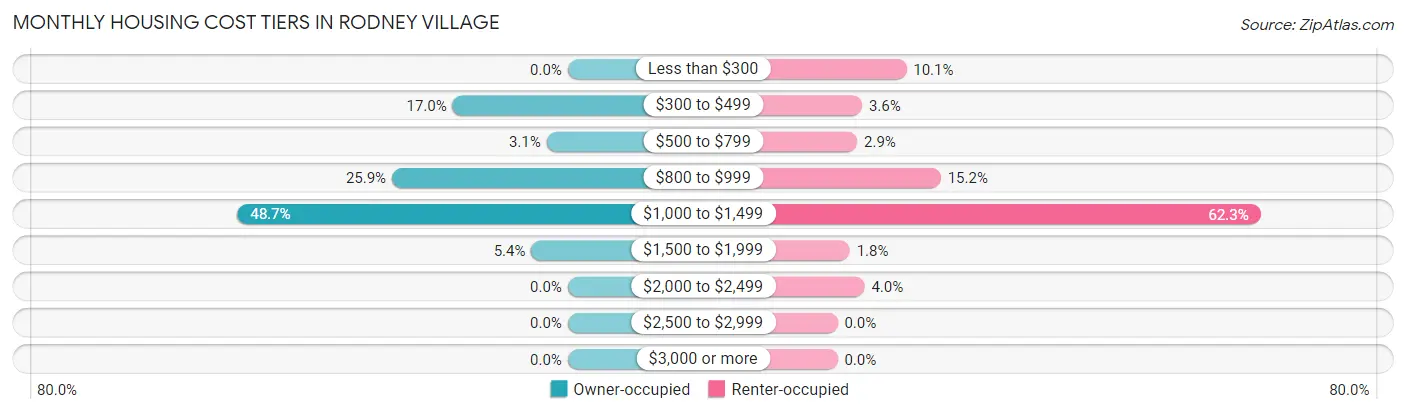
| Monthly Cost | Owner-occupied | Renter-occupied |
| Less than $300 | 0 (0.0%) | 28 (10.1%) |
| $300 to $499 | 38 (17.0%) | 10 (3.6%) |
| $500 to $799 | 7 (3.1%) | 8 (2.9%) |
| $800 to $999 | 58 (25.9%) | 42 (15.2%) |
| $1,000 to $1,499 | 109 (48.7%) | 172 (62.3%) |
| $1,500 to $1,999 | 12 (5.4%) | 5 (1.8%) |
| $2,000 to $2,499 | 0 (0.0%) | 11 (4.0%) |
| $2,500 to $2,999 | 0 (0.0%) | 0 (0.0%) |
| $3,000 or more | 0 (0.0%) | 0 (0.0%) |
| Total | 224 (100.0%) | 276 (100.0%) |
Physical Housing Characteristics in Rodney Village
Housing Structures in Rodney Village
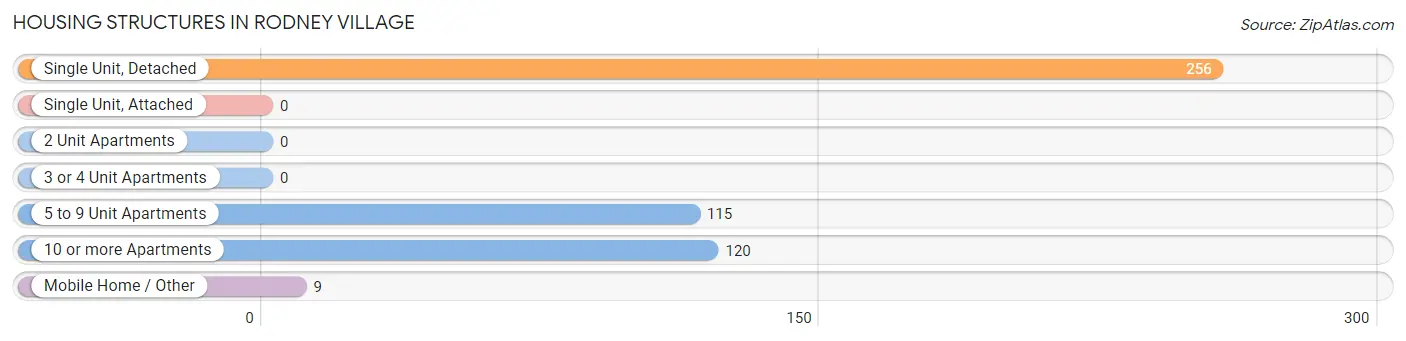
| Structure Type | # Housing Units | % Housing Units |
| Single Unit, Detached | 256 | 51.2% |
| Single Unit, Attached | 0 | 0.0% |
| 2 Unit Apartments | 0 | 0.0% |
| 3 or 4 Unit Apartments | 0 | 0.0% |
| 5 to 9 Unit Apartments | 115 | 23.0% |
| 10 or more Apartments | 120 | 24.0% |
| Mobile Home / Other | 9 | 1.8% |
| Total | 500 | 100.0% |
Housing Structures by Occupancy in Rodney Village
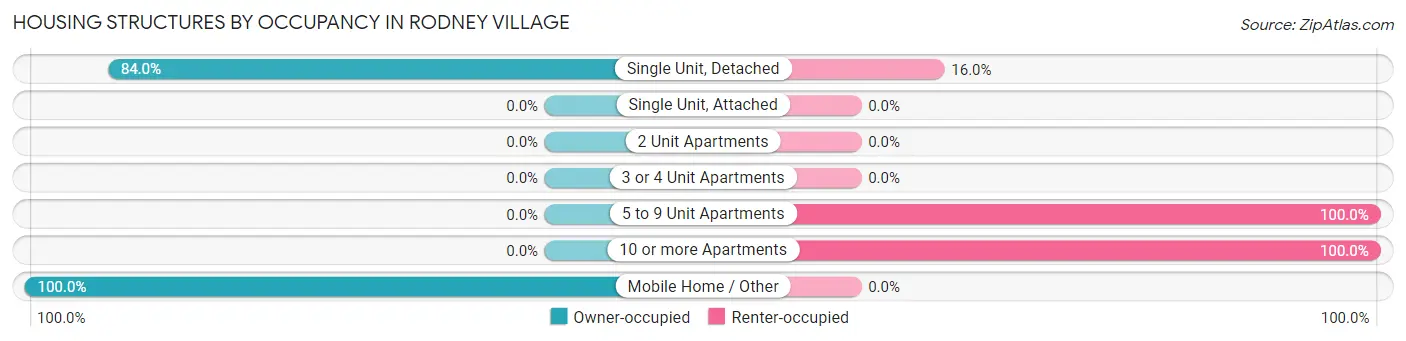
| Structure Type | Owner-occupied | Renter-occupied |
| Single Unit, Detached | 215 (84.0%) | 41 (16.0%) |
| Single Unit, Attached | 0 (0.0%) | 0 (0.0%) |
| 2 Unit Apartments | 0 (0.0%) | 0 (0.0%) |
| 3 or 4 Unit Apartments | 0 (0.0%) | 0 (0.0%) |
| 5 to 9 Unit Apartments | 0 (0.0%) | 115 (100.0%) |
| 10 or more Apartments | 0 (0.0%) | 120 (100.0%) |
| Mobile Home / Other | 9 (100.0%) | 0 (0.0%) |
| Total | 224 (44.8%) | 276 (55.2%) |
Housing Structures by Number of Rooms in Rodney Village
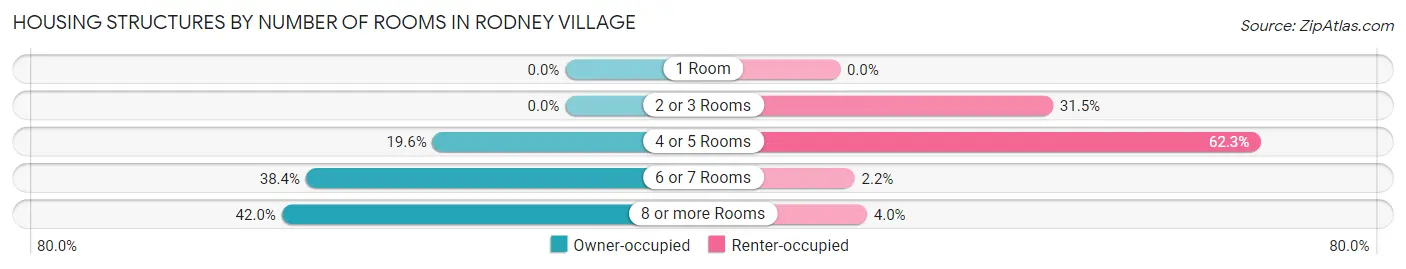
| Number of Rooms | Owner-occupied | Renter-occupied |
| 1 Room | 0 (0.0%) | 0 (0.0%) |
| 2 or 3 Rooms | 0 (0.0%) | 87 (31.5%) |
| 4 or 5 Rooms | 44 (19.6%) | 172 (62.3%) |
| 6 or 7 Rooms | 86 (38.4%) | 6 (2.2%) |
| 8 or more Rooms | 94 (42.0%) | 11 (4.0%) |
| Total | 224 (100.0%) | 276 (100.0%) |
Housing Structure by Heating Type in Rodney Village
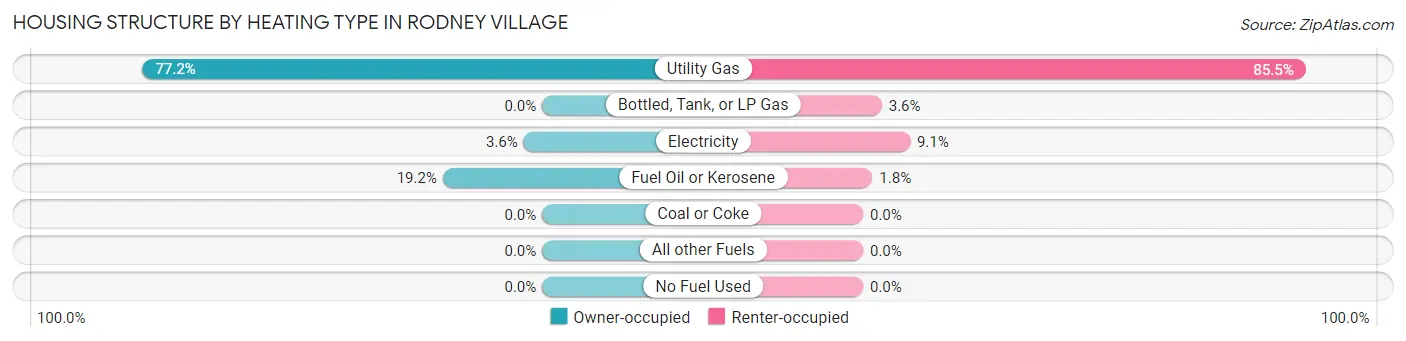
| Heating Type | Owner-occupied | Renter-occupied |
| Utility Gas | 173 (77.2%) | 236 (85.5%) |
| Bottled, Tank, or LP Gas | 0 (0.0%) | 10 (3.6%) |
| Electricity | 8 (3.6%) | 25 (9.1%) |
| Fuel Oil or Kerosene | 43 (19.2%) | 5 (1.8%) |
| Coal or Coke | 0 (0.0%) | 0 (0.0%) |
| All other Fuels | 0 (0.0%) | 0 (0.0%) |
| No Fuel Used | 0 (0.0%) | 0 (0.0%) |
| Total | 224 (100.0%) | 276 (100.0%) |
Household Vehicle Usage in Rodney Village
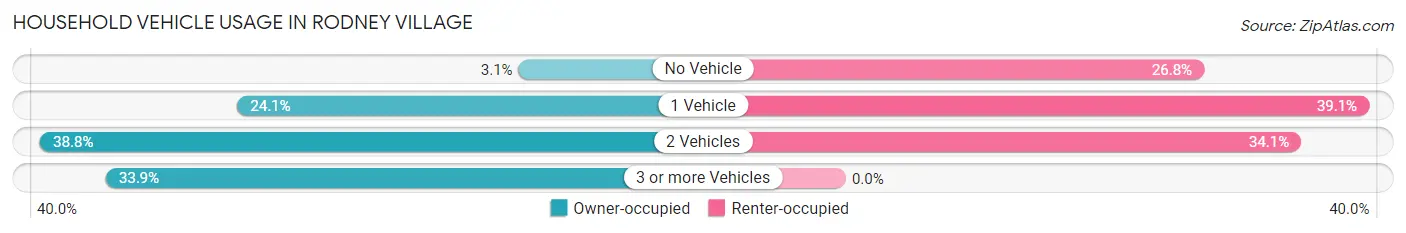
| Vehicles per Household | Owner-occupied | Renter-occupied |
| No Vehicle | 7 (3.1%) | 74 (26.8%) |
| 1 Vehicle | 54 (24.1%) | 108 (39.1%) |
| 2 Vehicles | 87 (38.8%) | 94 (34.1%) |
| 3 or more Vehicles | 76 (33.9%) | 0 (0.0%) |
| Total | 224 (100.0%) | 276 (100.0%) |
Real Estate & Mortgages in Rodney Village
Real Estate and Mortgage Overview in Rodney Village
| Characteristic | Without Mortgage | With Mortgage |
| Housing Units | 45 | 179 |
| Median Property Value | $201,100 | $151,000 |
| Median Household Income | $21,685 | $0 |
| Monthly Housing Costs | $366 | $0 |
| Real Estate Taxes | $1,125 | $0 |
Property Value by Mortgage Status in Rodney Village
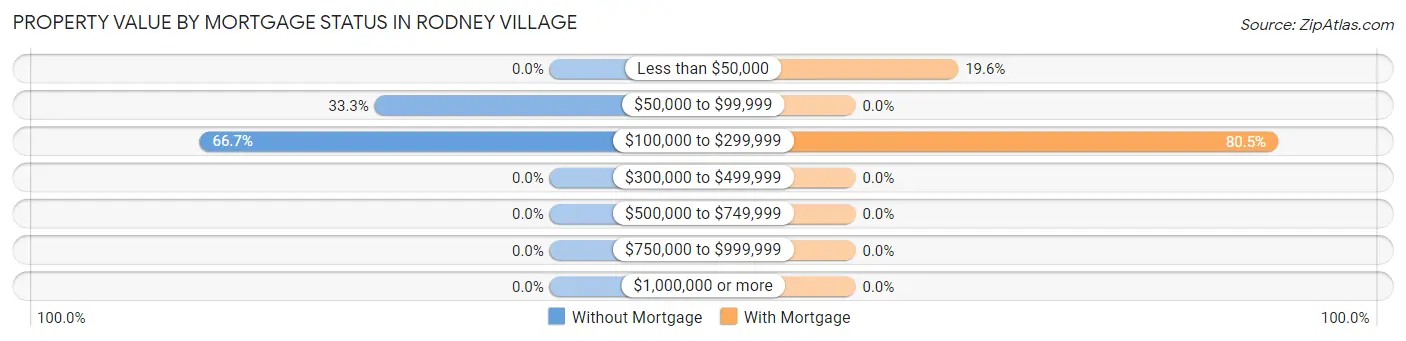
| Property Value | Without Mortgage | With Mortgage |
| Less than $50,000 | 0 (0.0%) | 35 (19.6%) |
| $50,000 to $99,999 | 15 (33.3%) | 0 (0.0%) |
| $100,000 to $299,999 | 30 (66.7%) | 144 (80.4%) |
| $300,000 to $499,999 | 0 (0.0%) | 0 (0.0%) |
| $500,000 to $749,999 | 0 (0.0%) | 0 (0.0%) |
| $750,000 to $999,999 | 0 (0.0%) | 0 (0.0%) |
| $1,000,000 or more | 0 (0.0%) | 0 (0.0%) |
| Total | 45 (100.0%) | 179 (100.0%) |
Household Income by Mortgage Status in Rodney Village
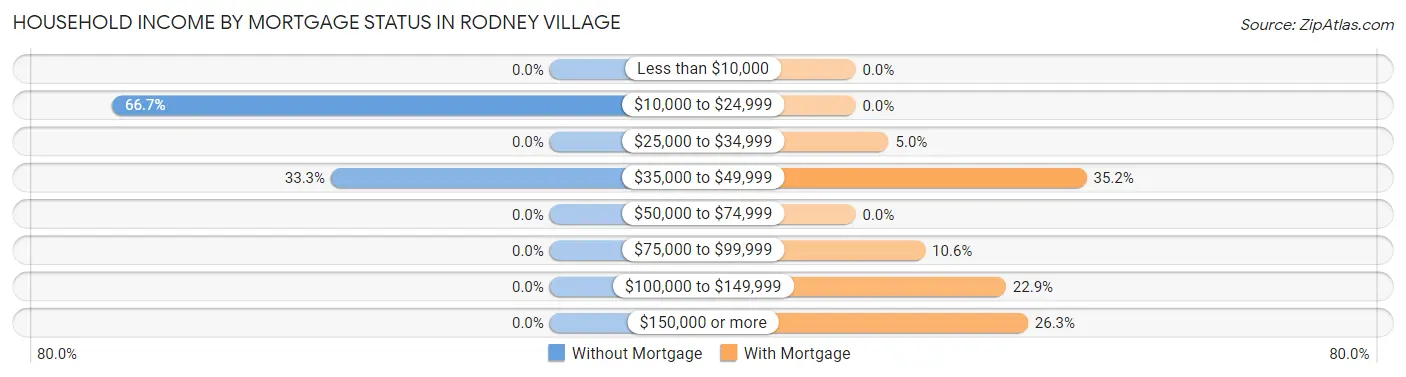
| Household Income | Without Mortgage | With Mortgage |
| Less than $10,000 | 0 (0.0%) | 0 (0.0%) |
| $10,000 to $24,999 | 30 (66.7%) | 0 (0.0%) |
| $25,000 to $34,999 | 0 (0.0%) | 9 (5.0%) |
| $35,000 to $49,999 | 15 (33.3%) | 63 (35.2%) |
| $50,000 to $74,999 | 0 (0.0%) | 0 (0.0%) |
| $75,000 to $99,999 | 0 (0.0%) | 19 (10.6%) |
| $100,000 to $149,999 | 0 (0.0%) | 41 (22.9%) |
| $150,000 or more | 0 (0.0%) | 47 (26.3%) |
| Total | 45 (100.0%) | 179 (100.0%) |
Property Value to Household Income Ratio in Rodney Village
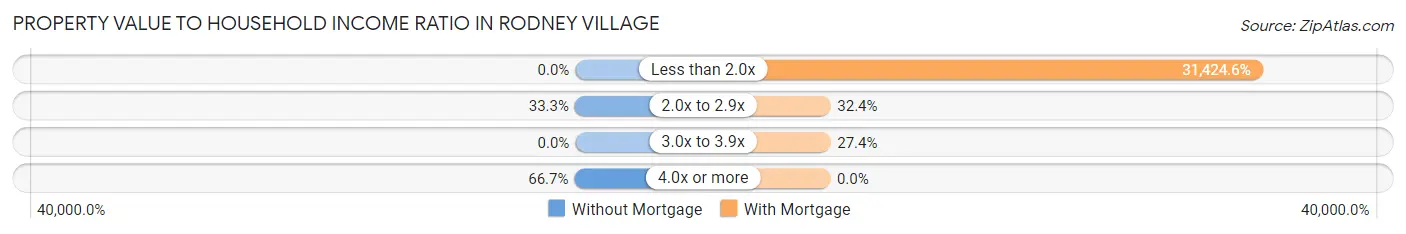
| Value-to-Income Ratio | Without Mortgage | With Mortgage |
| Less than 2.0x | 0 (0.0%) | 56,250 (31,424.6%) |
| 2.0x to 2.9x | 15 (33.3%) | 58 (32.4%) |
| 3.0x to 3.9x | 0 (0.0%) | 49 (27.4%) |
| 4.0x or more | 30 (66.7%) | 0 (0.0%) |
| Total | 45 (100.0%) | 179 (100.0%) |
Real Estate Taxes by Mortgage Status in Rodney Village
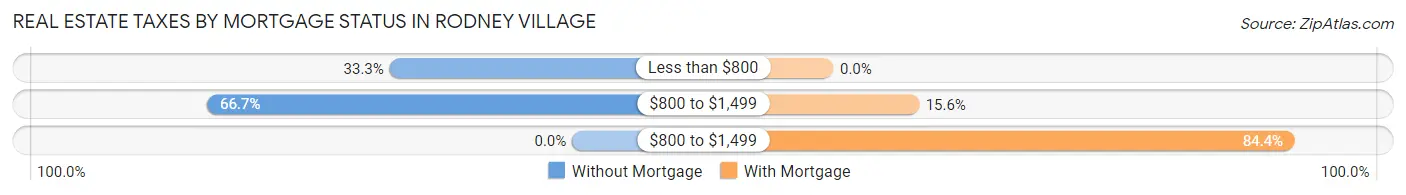
| Property Taxes | Without Mortgage | With Mortgage |
| Less than $800 | 15 (33.3%) | 0 (0.0%) |
| $800 to $1,499 | 30 (66.7%) | 28 (15.6%) |
| $800 to $1,499 | 0 (0.0%) | 151 (84.4%) |
| Total | 45 (100.0%) | 179 (100.0%) |
Health & Disability in Rodney Village
Health Insurance Coverage by Age in Rodney Village
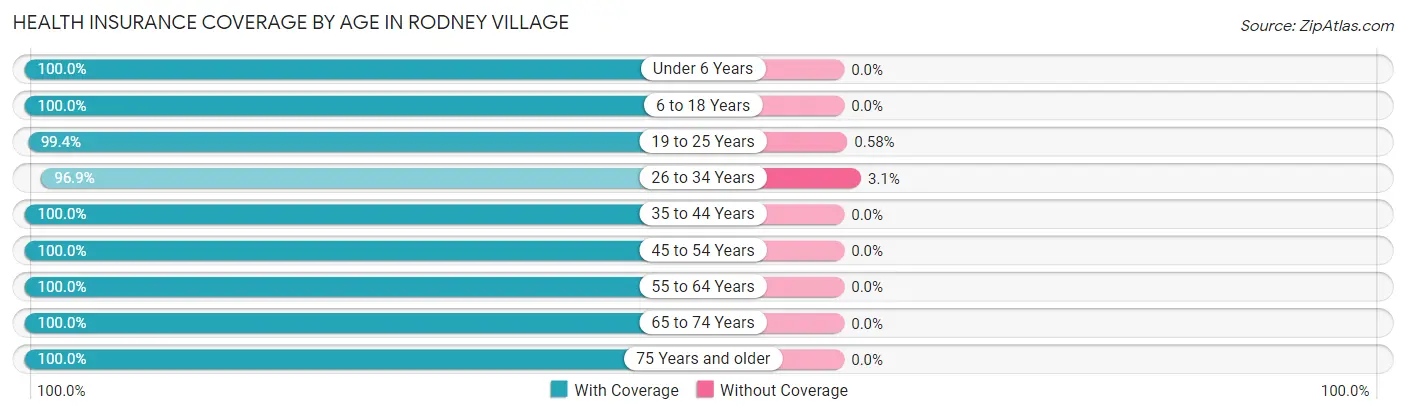
| Age Bracket | With Coverage | Without Coverage |
| Under 6 Years | 204 (100.0%) | 0 (0.0%) |
| 6 to 18 Years | 168 (100.0%) | 0 (0.0%) |
| 19 to 25 Years | 170 (99.4%) | 1 (0.6%) |
| 26 to 34 Years | 62 (96.9%) | 2 (3.1%) |
| 35 to 44 Years | 179 (100.0%) | 0 (0.0%) |
| 45 to 54 Years | 152 (100.0%) | 0 (0.0%) |
| 55 to 64 Years | 188 (100.0%) | 0 (0.0%) |
| 65 to 74 Years | 123 (100.0%) | 0 (0.0%) |
| 75 Years and older | 55 (100.0%) | 0 (0.0%) |
| Total | 1,301 (99.8%) | 3 (0.2%) |
Health Insurance Coverage by Citizenship Status in Rodney Village
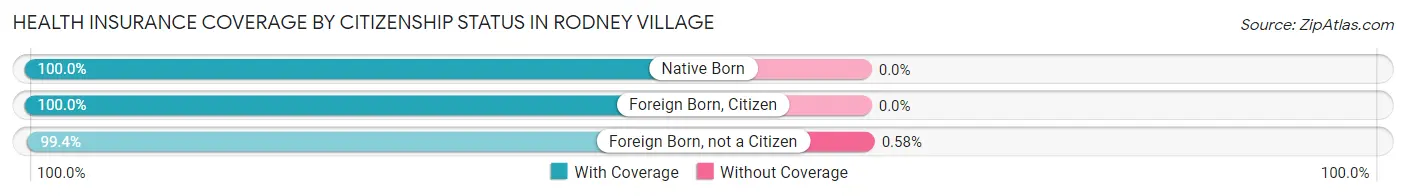
| Citizenship Status | With Coverage | Without Coverage |
| Native Born | 204 (100.0%) | 0 (0.0%) |
| Foreign Born, Citizen | 168 (100.0%) | 0 (0.0%) |
| Foreign Born, not a Citizen | 170 (99.4%) | 1 (0.6%) |
Health Insurance Coverage by Household Income in Rodney Village
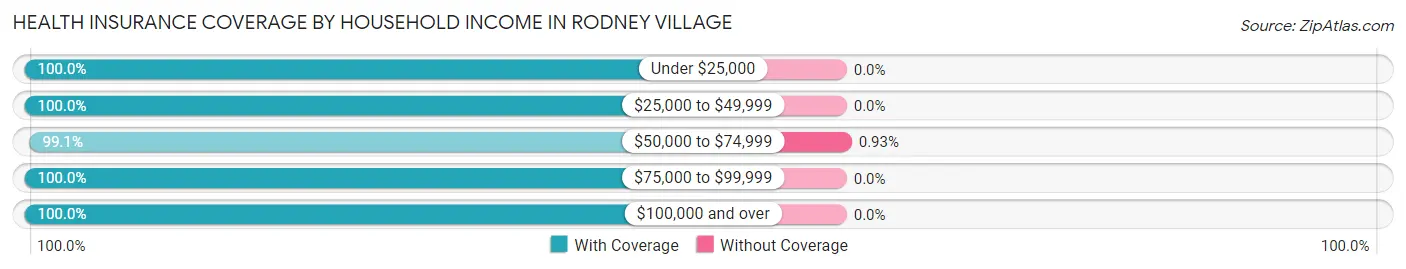
| Household Income | With Coverage | Without Coverage |
| Under $25,000 | 154 (100.0%) | 0 (0.0%) |
| $25,000 to $49,999 | 627 (100.0%) | 0 (0.0%) |
| $50,000 to $74,999 | 106 (99.1%) | 1 (0.9%) |
| $75,000 to $99,999 | 109 (100.0%) | 0 (0.0%) |
| $100,000 and over | 293 (100.0%) | 0 (0.0%) |
Public vs Private Health Insurance Coverage by Age in Rodney Village
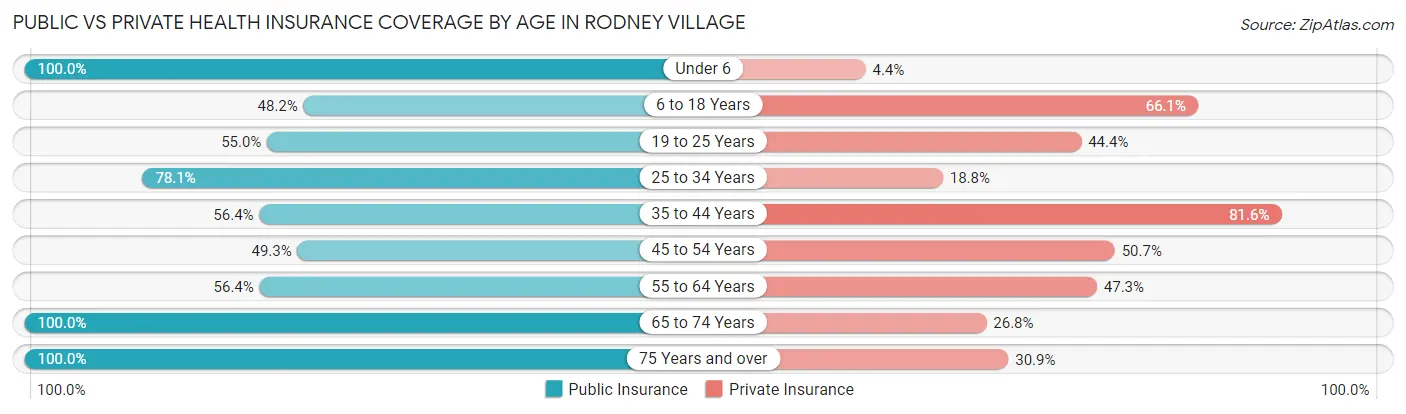
| Age Bracket | Public Insurance | Private Insurance |
| Under 6 | 204 (100.0%) | 9 (4.4%) |
| 6 to 18 Years | 81 (48.2%) | 111 (66.1%) |
| 19 to 25 Years | 94 (55.0%) | 76 (44.4%) |
| 25 to 34 Years | 50 (78.1%) | 12 (18.8%) |
| 35 to 44 Years | 101 (56.4%) | 146 (81.6%) |
| 45 to 54 Years | 75 (49.3%) | 77 (50.7%) |
| 55 to 64 Years | 106 (56.4%) | 89 (47.3%) |
| 65 to 74 Years | 123 (100.0%) | 33 (26.8%) |
| 75 Years and over | 55 (100.0%) | 17 (30.9%) |
| Total | 889 (68.2%) | 570 (43.7%) |
Disability Status by Sex by Age in Rodney Village
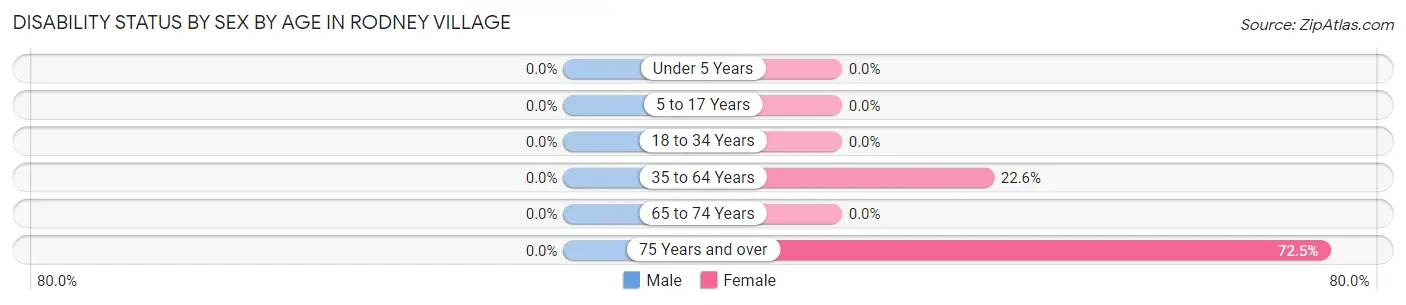
| Age Bracket | Male | Female |
| Under 5 Years | 0 (0.0%) | 0 (0.0%) |
| 5 to 17 Years | 0 (0.0%) | 0 (0.0%) |
| 18 to 34 Years | 0 (0.0%) | 0 (0.0%) |
| 35 to 64 Years | 0 (0.0%) | 77 (22.6%) |
| 65 to 74 Years | 0 (0.0%) | 0 (0.0%) |
| 75 Years and over | 0 (0.0%) | 29 (72.5%) |
Disability Class by Sex by Age in Rodney Village
Disability Class: Hearing Difficulty
| Age Bracket | Male | Female |
| Under 5 Years | 0 (0.0%) | 0 (0.0%) |
| 5 to 17 Years | 0 (0.0%) | 0 (0.0%) |
| 18 to 34 Years | 0 (0.0%) | 0 (0.0%) |
| 35 to 64 Years | 0 (0.0%) | 0 (0.0%) |
| 65 to 74 Years | 0 (0.0%) | 0 (0.0%) |
| 75 Years and over | 0 (0.0%) | 0 (0.0%) |
Disability Class: Vision Difficulty
| Age Bracket | Male | Female |
| Under 5 Years | 0 (0.0%) | 0 (0.0%) |
| 5 to 17 Years | 0 (0.0%) | 0 (0.0%) |
| 18 to 34 Years | 0 (0.0%) | 0 (0.0%) |
| 35 to 64 Years | 0 (0.0%) | 0 (0.0%) |
| 65 to 74 Years | 0 (0.0%) | 0 (0.0%) |
| 75 Years and over | 0 (0.0%) | 0 (0.0%) |
Disability Class: Cognitive Difficulty
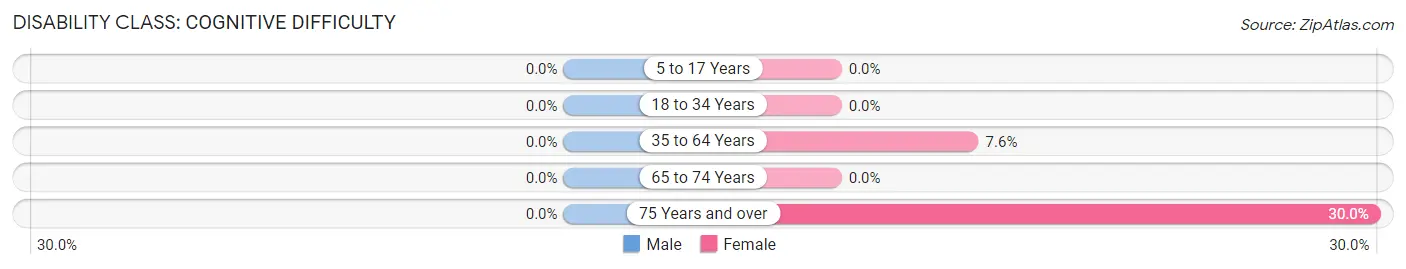
| Age Bracket | Male | Female |
| 5 to 17 Years | 0 (0.0%) | 0 (0.0%) |
| 18 to 34 Years | 0 (0.0%) | 0 (0.0%) |
| 35 to 64 Years | 0 (0.0%) | 26 (7.6%) |
| 65 to 74 Years | 0 (0.0%) | 0 (0.0%) |
| 75 Years and over | 0 (0.0%) | 12 (30.0%) |
Disability Class: Ambulatory Difficulty
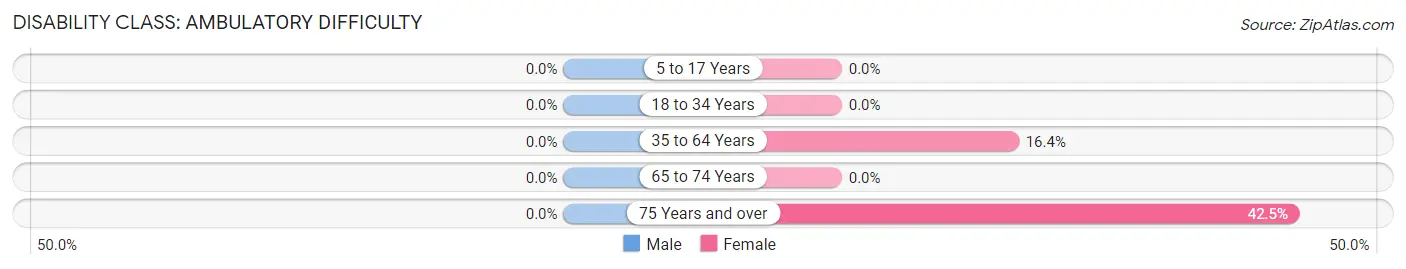
| Age Bracket | Male | Female |
| 5 to 17 Years | 0 (0.0%) | 0 (0.0%) |
| 18 to 34 Years | 0 (0.0%) | 0 (0.0%) |
| 35 to 64 Years | 0 (0.0%) | 56 (16.4%) |
| 65 to 74 Years | 0 (0.0%) | 0 (0.0%) |
| 75 Years and over | 0 (0.0%) | 17 (42.5%) |
Disability Class: Self-Care Difficulty
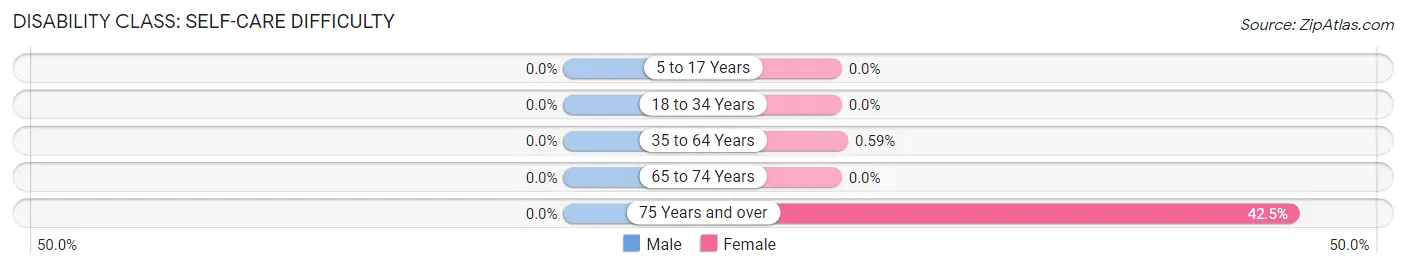
| Age Bracket | Male | Female |
| 5 to 17 Years | 0 (0.0%) | 0 (0.0%) |
| 18 to 34 Years | 0 (0.0%) | 0 (0.0%) |
| 35 to 64 Years | 0 (0.0%) | 2 (0.6%) |
| 65 to 74 Years | 0 (0.0%) | 0 (0.0%) |
| 75 Years and over | 0 (0.0%) | 17 (42.5%) |
Technology Access in Rodney Village
Computing Device Access in Rodney Village
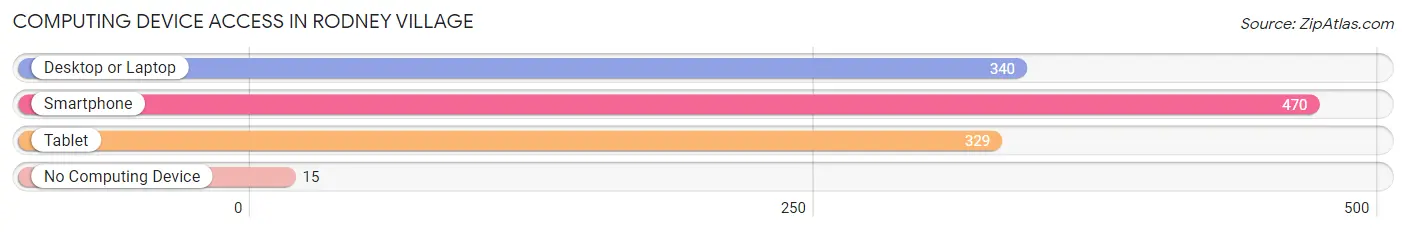
| Device Type | # Households | % Households |
| Desktop or Laptop | 340 | 68.0% |
| Smartphone | 470 | 94.0% |
| Tablet | 329 | 65.8% |
| No Computing Device | 15 | 3.0% |
| Total | 500 | 100.0% |
Internet Access in Rodney Village
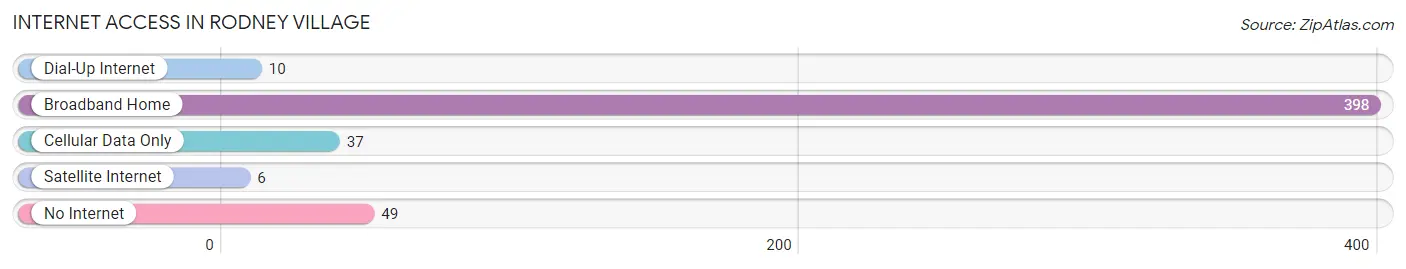
| Internet Type | # Households | % Households |
| Dial-Up Internet | 10 | 2.0% |
| Broadband Home | 398 | 79.6% |
| Cellular Data Only | 37 | 7.4% |
| Satellite Internet | 6 | 1.2% |
| No Internet | 49 | 9.8% |
| Total | 500 | 100.0% |
Rodney Village Summary
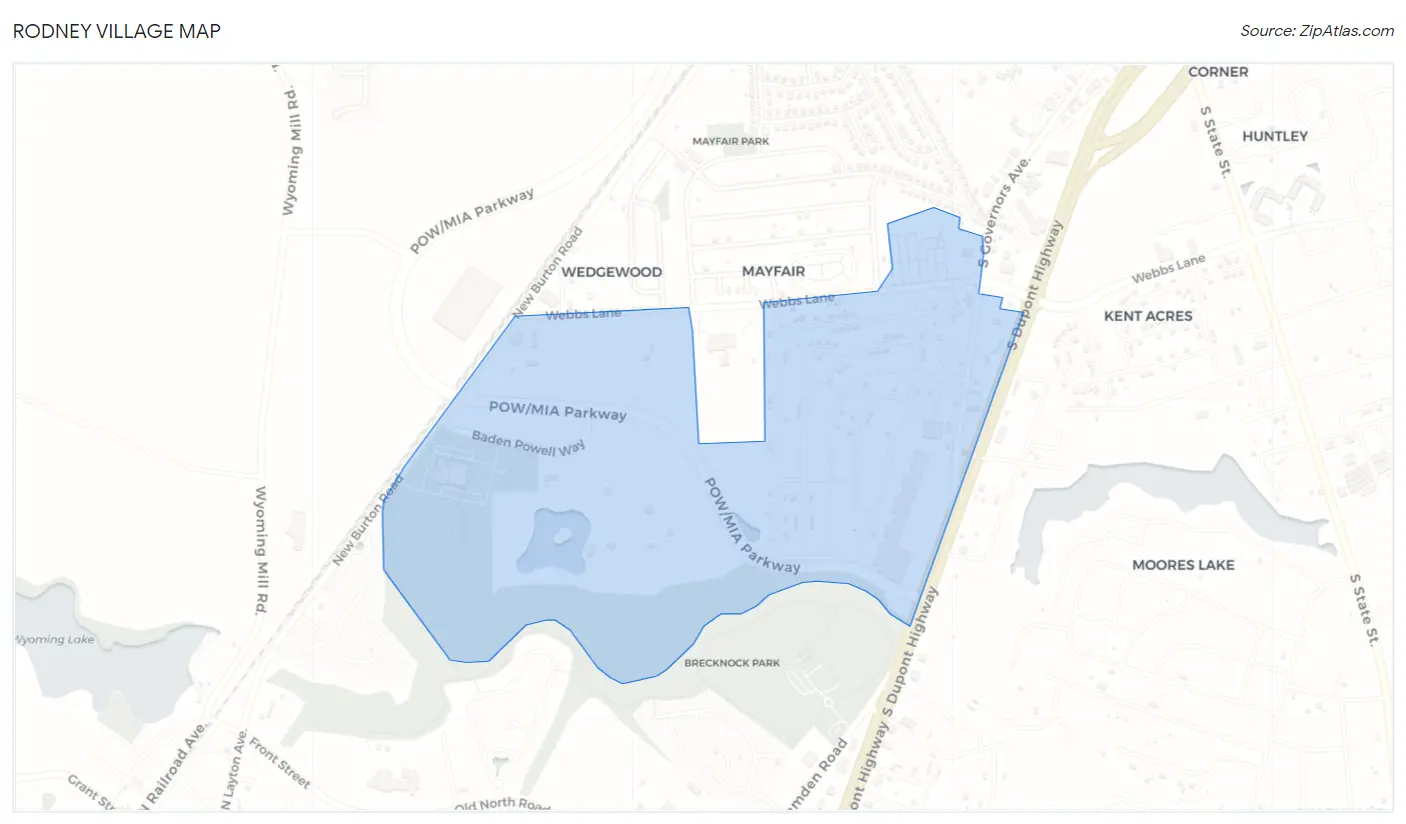
Rodney Village is a small unincorporated community located in Kent County, Delaware. It is situated in the northern part of the state, approximately 10 miles south of Dover, the state capital. The community is bordered by the towns of Camden and Wyoming to the north, and the towns of Hartly and Dover to the south. The population of Rodney Village was estimated to be 1,845 in the year 2000.
History
Rodney Village was first settled in the late 1700s by a group of Quakers from Pennsylvania. The community was named after Caesar Rodney, a signer of the Declaration of Independence and a former governor of Delaware. The village was originally a farming community, but in the early 1900s, it began to develop into a small industrial center. The first industry to locate in the village was a canning factory, which opened in 1906. This was followed by a furniture factory in 1910 and a brickyard in 1912.
Geography
Rodney Village is located in the northern part of Kent County, Delaware. It is situated in the Delmarva Peninsula, which is bordered by the Chesapeake Bay to the east and the Atlantic Ocean to the south. The village is located on the banks of the St. Jones River, which flows through the center of the community. The terrain of the area is mostly flat, with some rolling hills in the surrounding countryside.
Economy
The economy of Rodney Village is largely based on agriculture and light industry. The village is home to several small businesses, including a grocery store, a hardware store, and a few restaurants. The village also has a small industrial park, which is home to several manufacturing companies. The largest employer in the village is the Kent County School District, which employs over 500 people.
Demographics
As of the 2000 census, the population of Rodney Village was 1,845. The racial makeup of the village was 94.3% White, 2.7% African American, 0.7% Native American, 0.4% Asian, 0.2% Pacific Islander, and 1.5% from other races. The median household income was $37,917, and the median family income was $45,917. The per capita income was $19,917. About 8.3% of the population was below the poverty line.
Conclusion
Rodney Village is a small unincorporated community located in Kent County, Delaware. It has a long history, dating back to the late 1700s, and is home to a diverse population. The economy of the village is largely based on agriculture and light industry, and the largest employer is the Kent County School District. The population of Rodney Village was estimated to be 1,845 in the year 2000.
Common Questions
What is Per Capita Income in Rodney Village?
Per Capita income in Rodney Village is $18,256.
What is the Median Family Income in Rodney Village?
Median Family Income in Rodney Village is $33,319.
What is the Median Household income in Rodney Village?
Median Household Income in Rodney Village is $33,534.
What is Income or Wage Gap in Rodney Village?
Income or Wage Gap in Rodney Village is 2.6%.
Women in Rodney Village earn 97.4 cents for every dollar earned by a man.
What is Inequality or Gini Index in Rodney Village?
Inequality or Gini Index in Rodney Village is 0.40.
What is the Total Population of Rodney Village?
Total Population of Rodney Village is 1,304.
What is the Total Male Population of Rodney Village?
Total Male Population of Rodney Village is 572.
What is the Total Female Population of Rodney Village?
Total Female Population of Rodney Village is 732.
What is the Ratio of Males per 100 Females in Rodney Village?
There are 78.14 Males per 100 Females in Rodney Village.
What is the Ratio of Females per 100 Males in Rodney Village?
There are 127.97 Females per 100 Males in Rodney Village.
What is the Median Population Age in Rodney Village?
Median Population Age in Rodney Village is 39.6 Years.
What is the Average Family Size in Rodney Village
Average Family Size in Rodney Village is 3.2 People.
What is the Average Household Size in Rodney Village
Average Household Size in Rodney Village is 2.6 People.
How Large is the Labor Force in Rodney Village?
There are 575 People in the Labor Forcein in Rodney Village.
What is the Percentage of People in the Labor Force in Rodney Village?
59.6% of People are in the Labor Force in Rodney Village.
What is the Unemployment Rate in Rodney Village?
Unemployment Rate in Rodney Village is 4.9%.