Area Code 475 Map & Demographics
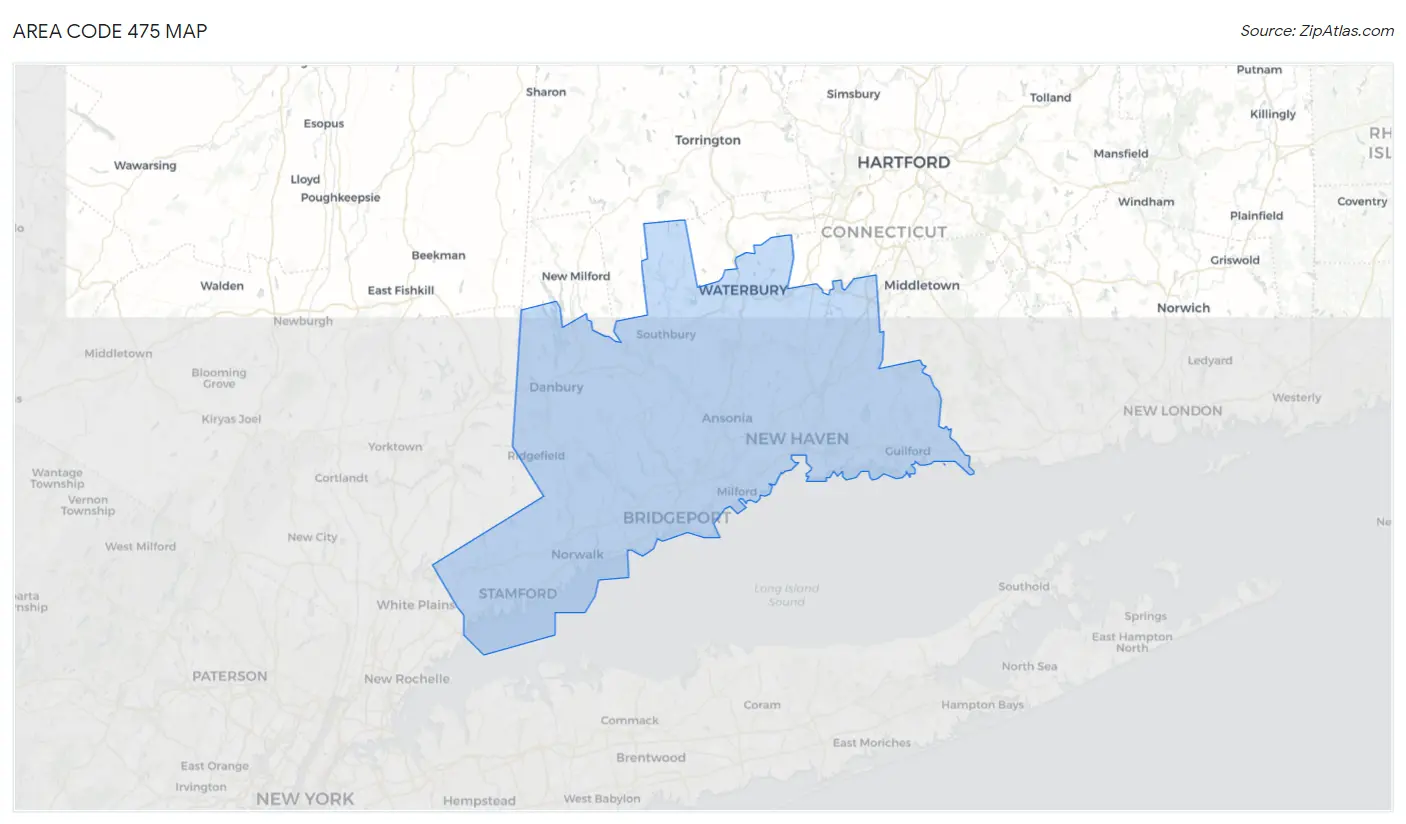
Area Code 475 Map
Area Code 475 Overview
$44,687
PER CAPITA INCOME
$103,612
AVG FAMILY INCOME
$84,515
AVG HOUSEHOLD INCOME
22.9%
WAGE / INCOME GAP [ % ]
77.1¢/ $1
WAGE / INCOME GAP [ $ ]
$11,310
FAMILY INCOME DEFICIT
11.29
INEQUALITY / GINI INDEX
606,991
TOTAL POPULATION
296,635
MALE POPULATION
310,356
FEMALE POPULATION
95.58
MALES / 100 FEMALES
104.63
FEMALES / 100 MALES
38.8
MEDIAN AGE
3.1
AVG FAMILY SIZE
2.5
AVG HOUSEHOLD SIZE
324,114
LABOR FORCE [ PEOPLE ]
65.5%
PERCENT IN LABOR FORCE
7.9%
UNEMPLOYMENT RATE
Income in Area Code 475
Income Overview in Area Code 475
Per Capita Income in Area Code 475 is $44,687, while median incomes of families and households are $103,612 and $84,515 respectively.
| Characteristic | Number | Measure |
| Per Capita Income | 606,991 | $44,687 |
| Median Family Income | 143,327 | $103,612 |
| Mean Family Income | 143,327 | $3,208,925 |
| Median Household Income | 230,713 | $84,515 |
| Mean Household Income | 230,713 | $2,715,980 |
| Income Deficit | 143,327 | $11,310 |
| Wage / Income Gap (%) | 606,991 | 22.86% |
| Wage / Income Gap ($) | 606,991 | 77.14¢ per $1 |
| Gini / Inequality Index | 606,991 | 11.29 |
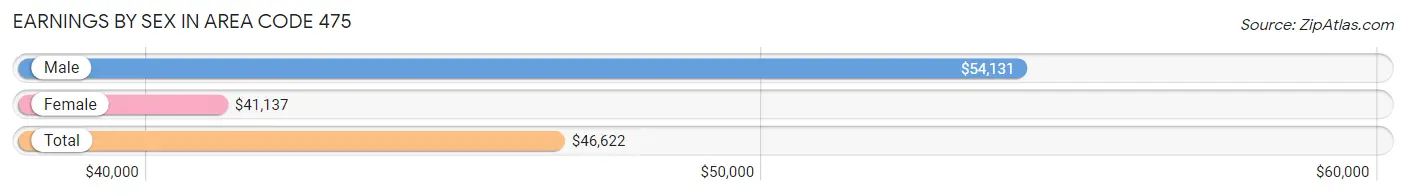
Earnings by Sex in Area Code 475
Average Earnings in Area Code 475 are $46,622, $54,131 for men and $41,137 for women, a difference of 24.0%.
| Sex | Number | Average Earnings |
| Male | 179,177 (51.6%) | $54,131 |
| Female | 167,867 (48.4%) | $41,137 |
| Total | 347,044 (100.0%) | $46,622 |
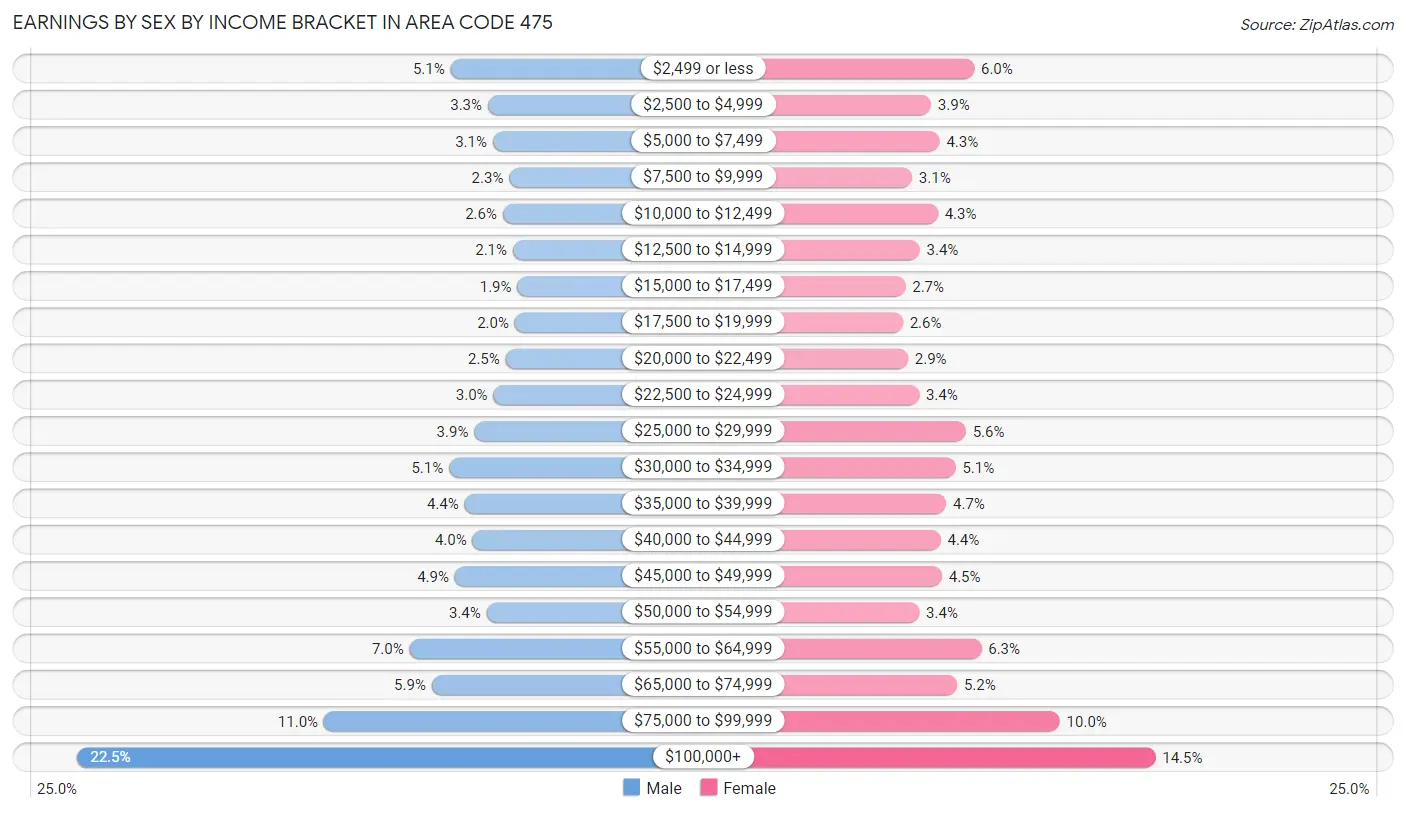
Earnings by Sex by Income Bracket in Area Code 475
The most common earnings brackets in Area Code 475 are $100,000+ for men (40,366 | 22.5%) and $100,000+ for women (24,265 | 14.4%).
| Income | Male | Female |
| $2,499 or less | 9,040 (5.1%) | 10,008 (6.0%) |
| $2,500 to $4,999 | 5,908 (3.3%) | 6,606 (3.9%) |
| $5,000 to $7,499 | 5,493 (3.1%) | 7,288 (4.3%) |
| $7,500 to $9,999 | 4,114 (2.3%) | 5,117 (3.0%) |
| $10,000 to $12,499 | 4,659 (2.6%) | 7,155 (4.3%) |
| $12,500 to $14,999 | 3,823 (2.1%) | 5,729 (3.4%) |
| $15,000 to $17,499 | 3,442 (1.9%) | 4,603 (2.7%) |
| $17,500 to $19,999 | 3,650 (2.0%) | 4,403 (2.6%) |
| $20,000 to $22,499 | 4,427 (2.5%) | 4,800 (2.9%) |
| $22,500 to $24,999 | 5,443 (3.0%) | 5,674 (3.4%) |
| $25,000 to $29,999 | 7,064 (3.9%) | 9,353 (5.6%) |
| $30,000 to $34,999 | 9,182 (5.1%) | 8,544 (5.1%) |
| $35,000 to $39,999 | 7,859 (4.4%) | 7,810 (4.6%) |
| $40,000 to $44,999 | 7,199 (4.0%) | 7,366 (4.4%) |
| $45,000 to $49,999 | 8,693 (4.9%) | 7,475 (4.4%) |
| $50,000 to $54,999 | 6,023 (3.4%) | 5,690 (3.4%) |
| $55,000 to $64,999 | 12,485 (7.0%) | 10,576 (6.3%) |
| $65,000 to $74,999 | 10,634 (5.9%) | 8,662 (5.2%) |
| $75,000 to $99,999 | 19,673 (11.0%) | 16,743 (10.0%) |
| $100,000+ | 40,366 (22.5%) | 24,265 (14.4%) |
| Total | 179,177 (100.0%) | 167,867 (100.0%) |
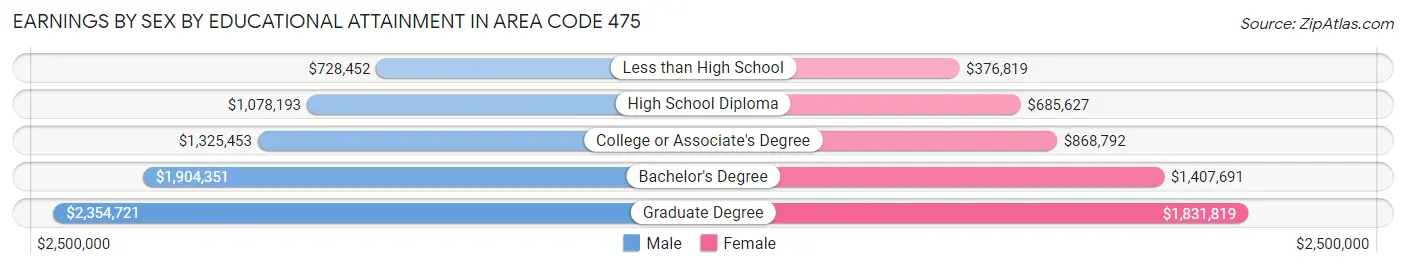
Earnings by Sex by Educational Attainment in Area Code 475
Average earnings in Area Code 475 are $1,510,000 for men and $1,147,453 for women, a difference of 24.0%. Men with an educational attainment of graduate degree enjoy the highest average annual earnings of $2,354,721, while those with less than high school education earn the least with $728,452. Women with an educational attainment of graduate degree earn the most with the average annual earnings of $1,831,819, while those with less than high school education have the smallest earnings of $376,819.
| Educational Attainment | Male Income | Female Income |
| Less than High School | $728,452 | $376,819 |
| High School Diploma | $1,078,193 | $685,627 |
| College or Associate's Degree | $1,325,453 | $868,792 |
| Bachelor's Degree | $1,904,351 | $1,407,691 |
| Graduate Degree | $2,354,721 | $1,831,819 |
| Total | $1,510,000 | $1,147,453 |
Family Income in Area Code 475
Family Income Brackets in Area Code 475
According to the Area Code 475 family income data, there are 693,416 families falling into the $200,000+ income range, which is the most common income bracket and makes up 483.8% of all families. Conversely, the $10,000 to $14,999 income bracket is the least frequent group with only 86,283 families (60.2%) belonging to this category.
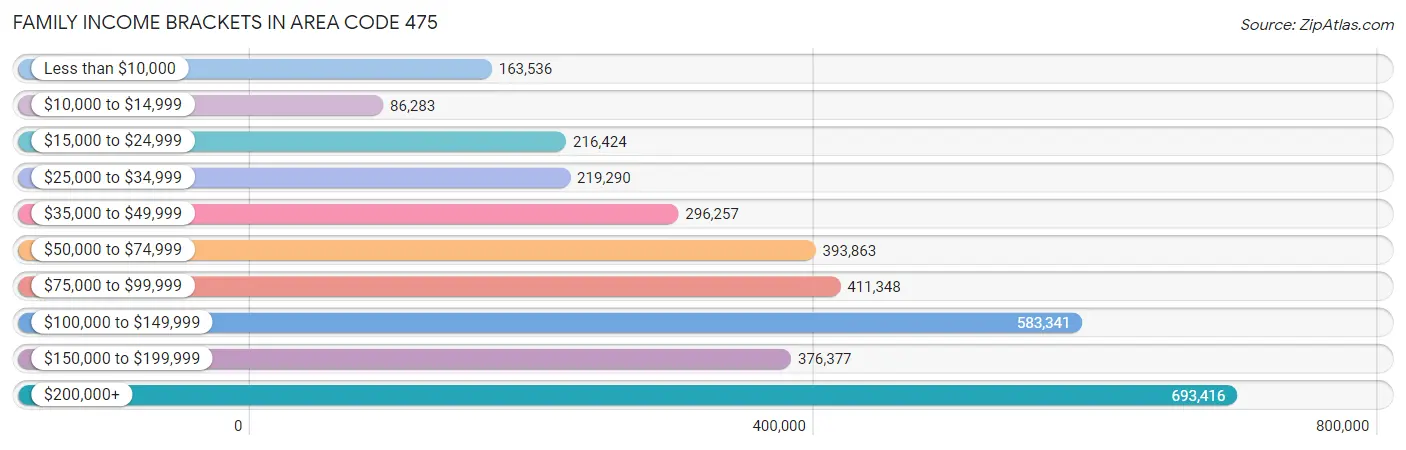
| Income Bracket | # Families | % Families |
| Less than $10,000 | 163,536 | 114.1% |
| $10,000 to $14,999 | 86,283 | 60.2% |
| $15,000 to $24,999 | 216,424 | 151.0% |
| $25,000 to $34,999 | 219,290 | 153.0% |
| $35,000 to $49,999 | 296,257 | 206.7% |
| $50,000 to $74,999 | 393,863 | 274.8% |
| $75,000 to $99,999 | 411,348 | 287.0% |
| $100,000 to $149,999 | 583,341 | 407.0% |
| $150,000 to $199,999 | 376,377 | 262.6% |
| $200,000+ | 693,416 | 483.8% |
Family Income by Famaliy Size in Area Code 475
7+ person families (2,180 | 1.5%) account for the highest median family income in Area Code 475 with $155,775 per family, while 2-person families (62,454 | 43.6%) have the highest median income of $46,157 per family member.
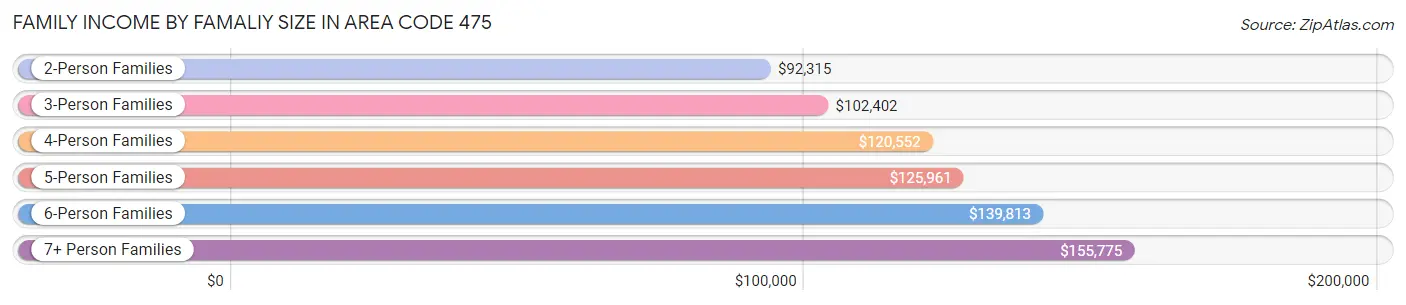
| Income Bracket | # Families | Median Income |
| 2-Person Families | 62,454 (43.6%) | $92,315 |
| 3-Person Families | 35,688 (24.9%) | $102,402 |
| 4-Person Families | 27,970 (19.5%) | $120,552 |
| 5-Person Families | 11,717 (8.2%) | $125,961 |
| 6-Person Families | 3,318 (2.3%) | $139,813 |
| 7+ Person Families | 2,180 (1.5%) | $155,775 |
| Total | 143,327 (100.0%) | $103,612 |
Family Income by Number of Earners in Area Code 475
The median family income in Area Code 475 is $103,612, with families comprising 3+ earners (21,442) having the highest median family income of $159,699, while families with no earners (15,779) have the lowest median family income of $46,627, accounting for 15.0% and 11.0% of families, respectively.
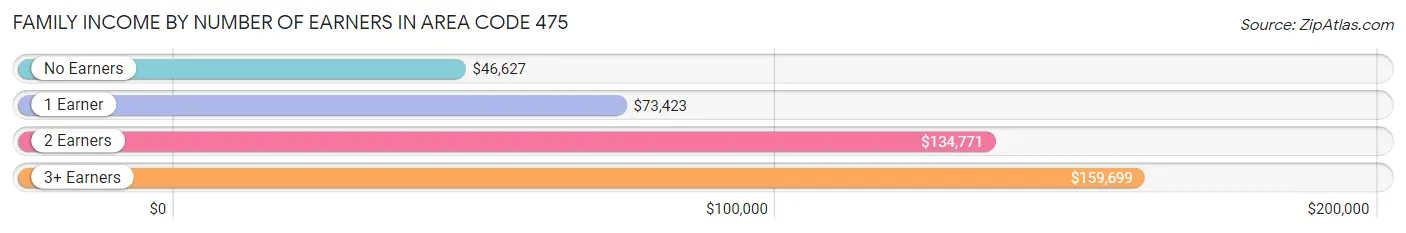
| Number of Earners | # Families | Median Income |
| No Earners | 15,779 (11.0%) | $46,627 |
| 1 Earner | 44,148 (30.8%) | $73,423 |
| 2 Earners | 61,958 (43.2%) | $134,771 |
| 3+ Earners | 21,442 (15.0%) | $159,699 |
| Total | 143,327 (100.0%) | $103,612 |
Household Income in Area Code 475
Household Income Brackets in Area Code 475
With 858,944 households falling in the category, the $100,000 to $149,999 income range is the most frequent in Area Code 475, accounting for 372.3% of all households. In contrast, only 317,000 households (137.4%) fall into the $10,000 to $14,999 income bracket, making it the least populous group.
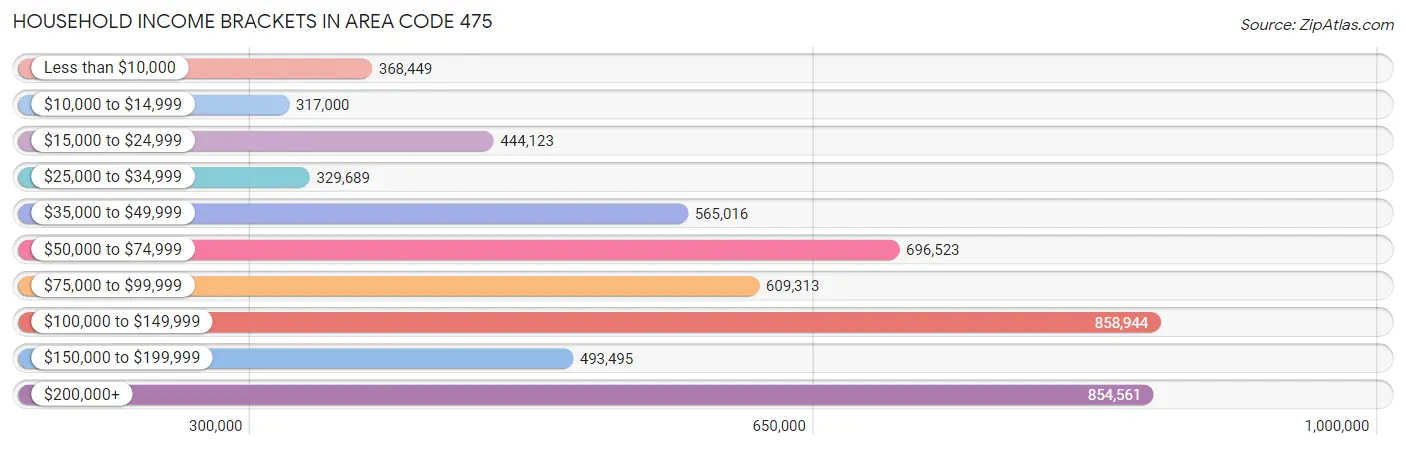
| Income Bracket | # Households | % Households |
| Less than $10,000 | 368,449 | 159.7% |
| $10,000 to $14,999 | 317,000 | 137.4% |
| $15,000 to $24,999 | 444,123 | 192.5% |
| $25,000 to $34,999 | 329,689 | 142.9% |
| $35,000 to $49,999 | 565,016 | 244.9% |
| $50,000 to $74,999 | 696,523 | 301.9% |
| $75,000 to $99,999 | 609,313 | 264.1% |
| $100,000 to $149,999 | 858,944 | 372.3% |
| $150,000 to $199,999 | 493,495 | 213.9% |
| $200,000+ | 854,561 | 370.4% |
Household Income by Householder Age in Area Code 475
The median household income in Area Code 475 is $84,515, with the highest median household income of $100,931 found in the 45 to 64 years age bracket for the primary householder. A total of 89,329 households (38.7%) fall into this category. Meanwhile, the 15 to 24 years age bracket for the primary householder has the lowest median household income of $50,604, with 8,132 households (3.5%) in this group.
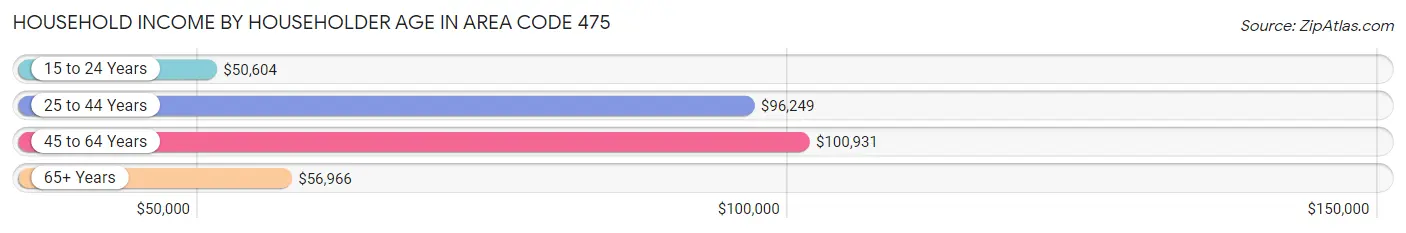
| Income Bracket | # Households | Median Income |
| 15 to 24 Years | 8,132 (3.5%) | $50,604 |
| 25 to 44 Years | 78,523 (34.0%) | $96,249 |
| 45 to 64 Years | 89,329 (38.7%) | $100,931 |
| 65+ Years | 54,729 (23.7%) | $56,966 |
| Total | 230,713 (100.0%) | $84,515 |
Poverty in Area Code 475
Income Below Poverty by Sex and Age in Area Code 475
With 12.0% poverty level for males and 14.7% for females among the residents of Area Code 475, 5 year old males and 18 to 24 year old females are the most vulnerable to poverty, with 913 males (24.7%) and 5,835 females (22.2%) in their respective age groups living below the poverty level.
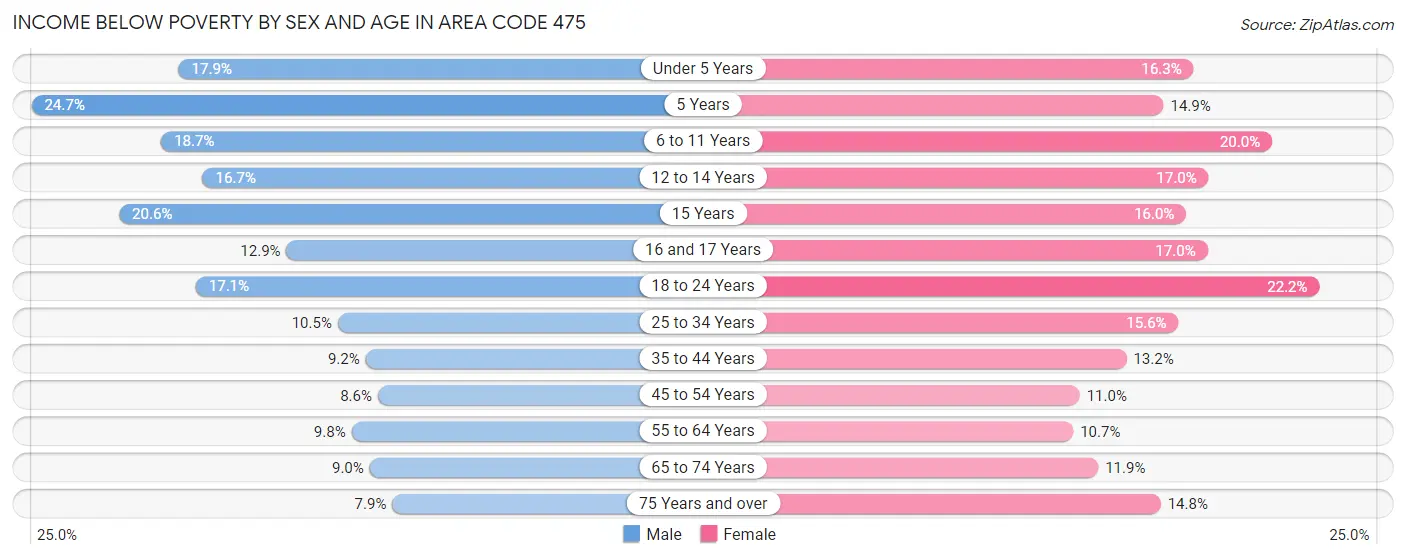
| Age Bracket | Male | Female |
| Under 5 Years | 3,067 (17.8%) | 2,637 (16.3%) |
| 5 Years | 913 (24.7%) | 457 (14.9%) |
| 6 to 11 Years | 3,707 (18.7%) | 4,137 (20.0%) |
| 12 to 14 Years | 1,787 (16.7%) | 1,803 (17.0%) |
| 15 Years | 858 (20.6%) | 643 (16.0%) |
| 16 and 17 Years | 949 (12.9%) | 1,280 (17.0%) |
| 18 to 24 Years | 4,704 (17.1%) | 5,835 (22.2%) |
| 25 to 34 Years | 4,586 (10.5%) | 6,922 (15.6%) |
| 35 to 44 Years | 3,532 (9.2%) | 5,221 (13.2%) |
| 45 to 54 Years | 3,263 (8.6%) | 4,205 (11.0%) |
| 55 to 64 Years | 3,737 (9.8%) | 4,444 (10.7%) |
| 65 to 74 Years | 2,141 (9.0%) | 3,058 (11.9%) |
| 75 Years and over | 1,102 (7.9%) | 3,252 (14.8%) |
| Total | 34,346 (12.0%) | 43,894 (14.7%) |
Income Above Poverty by Sex and Age in Area Code 475
According to the poverty statistics in Area Code 475, males aged 75 years and over and females aged 55 to 64 years are the age groups that are most secure financially, with 92.1% of males and 89.3% of females in these age groups living above the poverty line.
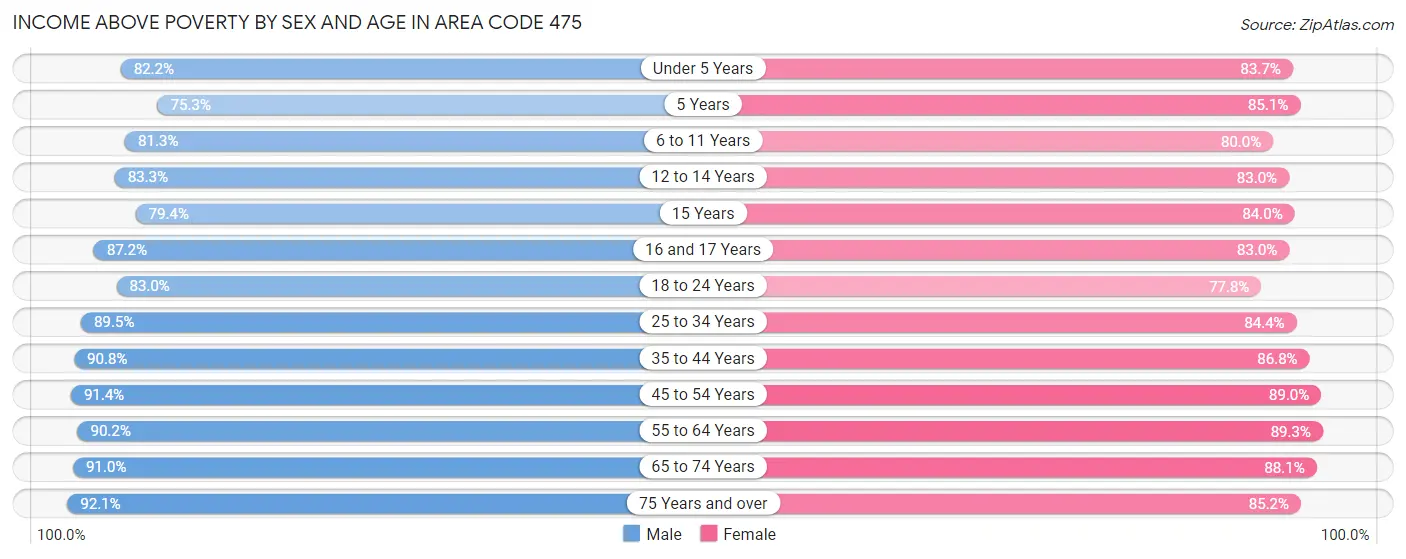
| Age Bracket | Male | Female |
| Under 5 Years | 14,116 (82.2%) | 13,521 (83.7%) |
| 5 Years | 2,786 (75.3%) | 2,603 (85.1%) |
| 6 to 11 Years | 16,164 (81.3%) | 16,588 (80.0%) |
| 12 to 14 Years | 8,887 (83.3%) | 8,793 (83.0%) |
| 15 Years | 3,305 (79.4%) | 3,381 (84.0%) |
| 16 and 17 Years | 6,438 (87.2%) | 6,264 (83.0%) |
| 18 to 24 Years | 22,883 (83.0%) | 20,500 (77.8%) |
| 25 to 34 Years | 39,229 (89.5%) | 37,398 (84.4%) |
| 35 to 44 Years | 34,924 (90.8%) | 34,317 (86.8%) |
| 45 to 54 Years | 34,648 (91.4%) | 33,894 (89.0%) |
| 55 to 64 Years | 34,275 (90.2%) | 36,946 (89.3%) |
| 65 to 74 Years | 21,678 (91.0%) | 22,630 (88.1%) |
| 75 Years and over | 12,777 (92.1%) | 18,714 (85.2%) |
| Total | 252,110 (88.0%) | 255,549 (85.3%) |
Income Below Poverty Among Married-Couple Families in Area Code 475
The poverty statistics for married-couple families in Area Code 475 show that 4.1% or 4,091 of the total 98,921 families live below the poverty line. Families with 5 or more children have the highest poverty rate of 20.5%, comprising of 107 families. On the other hand, families with no children have the lowest poverty rate of 3.4%, which includes 1,942 families.
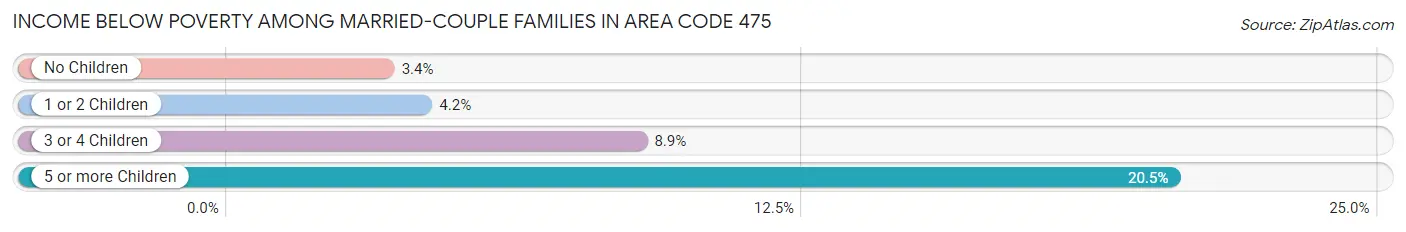
| Children | Above Poverty | Below Poverty |
| No Children | 54,998 (96.6%) | 1,942 (3.4%) |
| 1 or 2 Children | 33,794 (95.8%) | 1,492 (4.2%) |
| 3 or 4 Children | 5,623 (91.1%) | 550 (8.9%) |
| 5 or more Children | 415 (79.5%) | 107 (20.5%) |
| Total | 94,830 (95.9%) | 4,091 (4.1%) |
Income Below Poverty Among Single-Parent Households in Area Code 475
According to the poverty data in Area Code 475, 15.7% or 1,818 single-father households and 23.0% or 7,565 single-mother households are living below the poverty line. Among single-father households, those with 5 or more children have the highest poverty rate, with 36 households (81.8%) experiencing poverty. Likewise, among single-mother households, those with 5 or more children have the highest poverty rate, with 137 households (65.5%) falling below the poverty line.
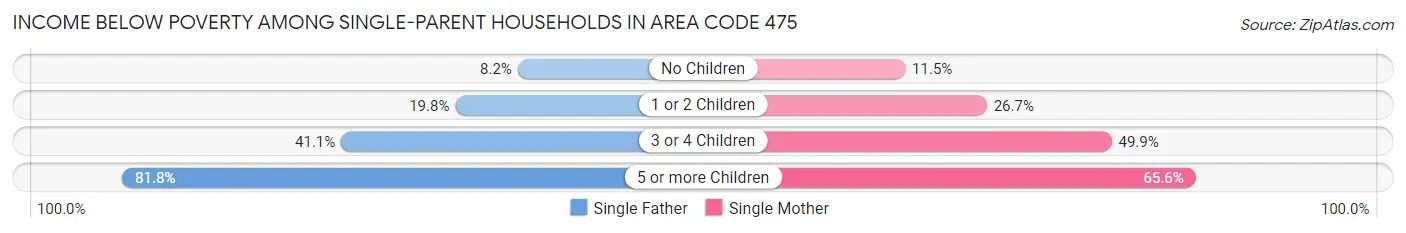
| Children | Single Father | Single Mother |
| No Children | 471 (8.2%) | 1,512 (11.5%) |
| 1 or 2 Children | 967 (19.8%) | 4,339 (26.7%) |
| 3 or 4 Children | 344 (41.0%) | 1,577 (49.9%) |
| 5 or more Children | 36 (81.8%) | 137 (65.5%) |
| Total | 1,818 (15.7%) | 7,565 (23.0%) |
Income Below Poverty Among Married-Couple vs Single-Parent Households in Area Code 475
The poverty data for Area Code 475 shows that 4,091 of the married-couple family households (4.1%) and 9,383 of the single-parent households (21.1%) are living below the poverty level. Within the married-couple family households, those with 5 or more children have the highest poverty rate, with 107 households (20.5%) falling below the poverty line. Among the single-parent households, those with 5 or more children have the highest poverty rate, with 173 household (68.4%) living below poverty.
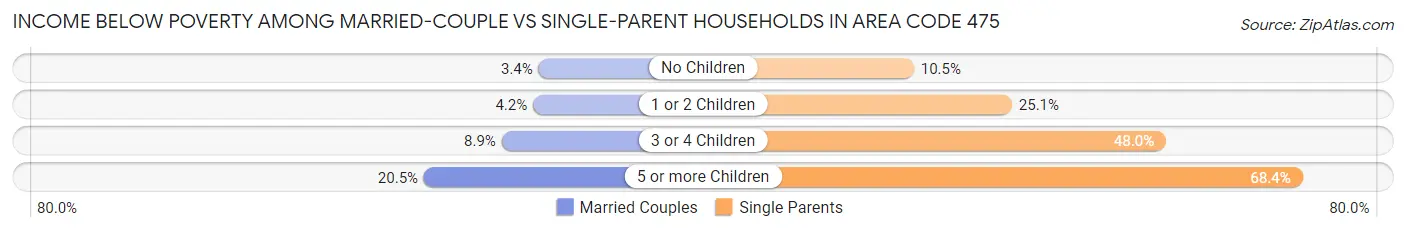
| Children | Married-Couple Families | Single-Parent Households |
| No Children | 1,942 (3.4%) | 1,983 (10.4%) |
| 1 or 2 Children | 1,492 (4.2%) | 5,306 (25.1%) |
| 3 or 4 Children | 550 (8.9%) | 1,921 (48.0%) |
| 5 or more Children | 107 (20.5%) | 173 (68.4%) |
| Total | 4,091 (4.1%) | 9,383 (21.1%) |
Race in Area Code 475
The most populous races in Area Code 475 are White / Caucasian (354,915 | 58.5%), Hispanic or Latino (147,577 | 24.3%), and Black / African American (95,143 | 15.7%).
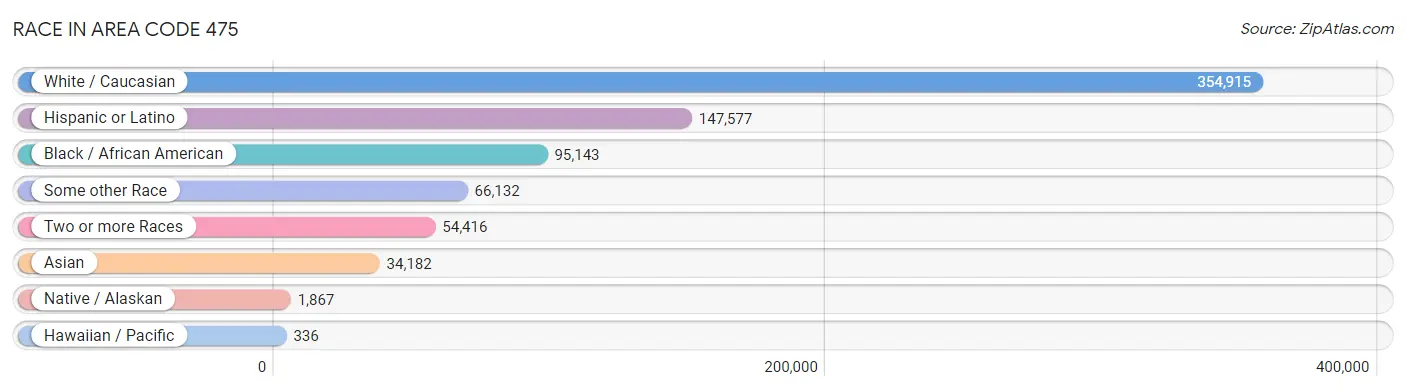
| Race | # Population | % Population |
| Asian | 34,182 | 5.6% |
| Black / African American | 95,143 | 15.7% |
| Hawaiian / Pacific | 336 | 0.1% |
| Hispanic or Latino | 147,577 | 24.3% |
| Native / Alaskan | 1,867 | 0.3% |
| White / Caucasian | 354,915 | 58.5% |
| Two or more Races | 54,416 | 9.0% |
| Some other Race | 66,132 | 10.9% |
| Total | 606,991 | 100.0% |
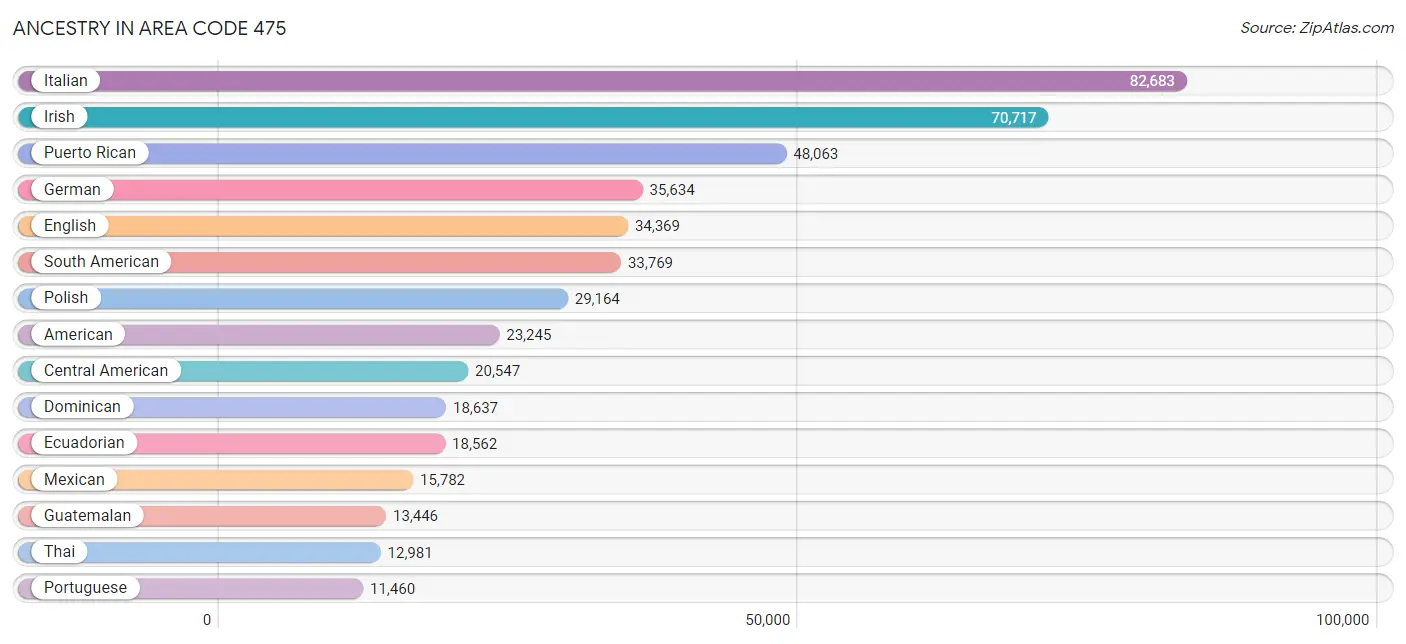
Ancestry in Area Code 475
The most populous ancestries reported in Area Code 475 are Italian (82,683 | 13.6%), Irish (70,717 | 11.7%), Puerto Rican (48,063 | 7.9%), German (35,634 | 5.9%), and English (34,369 | 5.7%), together accounting for 44.7% of all Area Code 475 residents.
| Ancestry | # Population | % Population |
| Afghan | 1,493 | 0.3% |
| African | 3,173 | 0.5% |
| Albanian | 2,746 | 0.4% |
| Alsatian | 17 | 0.0% |
| American | 23,245 | 3.8% |
| Apache | 19 | 0.0% |
| Arab | 6,086 | 1.0% |
| Argentinean | 1,625 | 0.3% |
| Armenian | 827 | 0.1% |
| Australian | 418 | 0.1% |
| Austrian | 1,689 | 0.3% |
| Bahamian | 63 | 0.0% |
| Barbadian | 581 | 0.1% |
| Basque | 48 | 0.0% |
| Belgian | 180 | 0.0% |
| Belizean | 59 | 0.0% |
| Bhutanese | 823 | 0.1% |
| Blackfeet | 199 | 0.0% |
| Bolivian | 236 | 0.0% |
| Brazilian | 10,071 | 1.7% |
| British | 3,057 | 0.5% |
| British West Indian | 582 | 0.1% |
| Bulgarian | 335 | 0.1% |
| Burmese | 2,329 | 0.4% |
| Cajun | 10 | 0.0% |
| Cambodian | 142 | 0.0% |
| Canadian | 1,500 | 0.3% |
| Cape Verdean | 947 | 0.2% |
| Carpatho Rusyn | 44 | 0.0% |
| Central American | 20,547 | 3.4% |
| Central American Indian | 1,048 | 0.2% |
| Cherokee | 728 | 0.1% |
| Cheyenne | 15 | 0.0% |
| Chilean | 466 | 0.1% |
| Chippewa | 30 | 0.0% |
| Choctaw | 35 | 0.0% |
| Colombian | 7,065 | 1.2% |
| Comanche | 4 | 0.0% |
| Costa Rican | 501 | 0.1% |
| Cree | 19 | 0.0% |
| Creek | 20 | 0.0% |
| Croatian | 792 | 0.1% |
| Cuban | 3,011 | 0.5% |
| Czech | 1,690 | 0.3% |
| Czechoslovakian | 627 | 0.1% |
| Danish | 1,472 | 0.2% |
| Delaware | 6 | 0.0% |
| Dominican | 18,637 | 3.1% |
| Dutch | 2,284 | 0.4% |
| Dutch West Indian | 11 | 0.0% |
| Eastern European | 3,440 | 0.6% |
| Ecuadorian | 18,562 | 3.1% |
| Egyptian | 588 | 0.1% |
| English | 34,369 | 5.7% |
| Estonian | 56 | 0.0% |
| Ethiopian | 284 | 0.1% |
| European | 5,308 | 0.9% |
| Fijian | 22 | 0.0% |
| Filipino | 161 | 0.0% |
| Finnish | 225 | 0.0% |
| French | 10,111 | 1.7% |
| French American Indian | 48 | 0.0% |
| French Canadian | 5,741 | 0.9% |
| German | 35,634 | 5.9% |
| Ghanaian | 1,544 | 0.3% |
| Greek | 4,354 | 0.7% |
| Guamanian / Chamorro | 77 | 0.0% |
| Guatemalan | 13,446 | 2.2% |
| Guyanese | 684 | 0.1% |
| Haitian | 7,101 | 1.2% |
| Hmong | 12 | 0.0% |
| Honduran | 2,126 | 0.4% |
| Hungarian | 8,807 | 1.5% |
| Icelander | 30 | 0.0% |
| Indian (Asian) | 9,578 | 1.6% |
| Indonesian | 31 | 0.0% |
| Inupiat | 3 | 0.0% |
| Iranian | 349 | 0.1% |
| Iraqi | 128 | 0.0% |
| Irish | 70,717 | 11.7% |
| Iroquois | 55 | 0.0% |
| Israeli | 485 | 0.1% |
| Italian | 82,683 | 13.6% |
| Jamaican | 10,959 | 1.8% |
| Japanese | 2,110 | 0.4% |
| Jordanian | 120 | 0.0% |
| Kenyan | 115 | 0.0% |
| Korean | 2,653 | 0.4% |
| Laotian | 96 | 0.0% |
| Latvian | 677 | 0.1% |
| Lebanese | 1,963 | 0.3% |
| Liberian | 203 | 0.0% |
| Lithuanian | 3,938 | 0.6% |
| Lumbee | 69 | 0.0% |
| Luxembourger | 13 | 0.0% |
| Macedonian | 269 | 0.0% |
| Malaysian | 1,042 | 0.2% |
| Maltese | 19 | 0.0% |
| Mexican | 15,782 | 2.6% |
| Mexican American Indian | 349 | 0.1% |
| Mongolian | 113 | 0.0% |
| Moroccan | 275 | 0.1% |
| Native Hawaiian | 61 | 0.0% |
| Navajo | 80 | 0.0% |
| New Zealander | 107 | 0.0% |
| Nicaraguan | 890 | 0.2% |
| Nigerian | 732 | 0.1% |
| Northern European | 369 | 0.1% |
| Norwegian | 2,504 | 0.4% |
| Okinawan | 7 | 0.0% |
| Osage | 1 | 0.0% |
| Pakistani | 284 | 0.1% |
| Palestinian | 227 | 0.0% |
| Panamanian | 285 | 0.1% |
| Paraguayan | 65 | 0.0% |
| Pennsylvania German | 54 | 0.0% |
| Peruvian | 4,045 | 0.7% |
| Polish | 29,164 | 4.8% |
| Portuguese | 11,460 | 1.9% |
| Puerto Rican | 48,063 | 7.9% |
| Romanian | 1,530 | 0.3% |
| Russian | 8,695 | 1.4% |
| Salvadoran | 2,923 | 0.5% |
| Samoan | 125 | 0.0% |
| Scandinavian | 820 | 0.1% |
| Scotch-Irish | 1,834 | 0.3% |
| Scottish | 6,061 | 1.0% |
| Seminole | 16 | 0.0% |
| Serbian | 474 | 0.1% |
| Slavic | 512 | 0.1% |
| Slovak | 4,331 | 0.7% |
| Slovene | 138 | 0.0% |
| South African | 203 | 0.0% |
| South American | 33,769 | 5.6% |
| South American Indian | 216 | 0.0% |
| Spaniard | 1,118 | 0.2% |
| Spanish | 830 | 0.1% |
| Spanish American | 50 | 0.0% |
| Sri Lankan | 2,067 | 0.3% |
| Subsaharan African | 8,990 | 1.5% |
| Sudanese | 8 | 0.0% |
| Swedish | 4,224 | 0.7% |
| Swiss | 929 | 0.2% |
| Syrian | 1,277 | 0.2% |
| Thai | 12,981 | 2.1% |
| Trinidadian and Tobagonian | 795 | 0.1% |
| Turkish | 468 | 0.1% |
| U.S. Virgin Islander | 54 | 0.0% |
| Ugandan | 252 | 0.0% |
| Ukrainian | 3,297 | 0.5% |
| Uruguayan | 466 | 0.1% |
| Venezuelan | 1,073 | 0.2% |
| Vietnamese | 1,024 | 0.2% |
| Welsh | 1,375 | 0.2% |
| West Indian | 1,057 | 0.2% |
| Yaqui | 8 | 0.0% |
| Yugoslavian | 477 | 0.1% |
| Zimbabwean | 89 | 0.0% | View All 158 Rows |
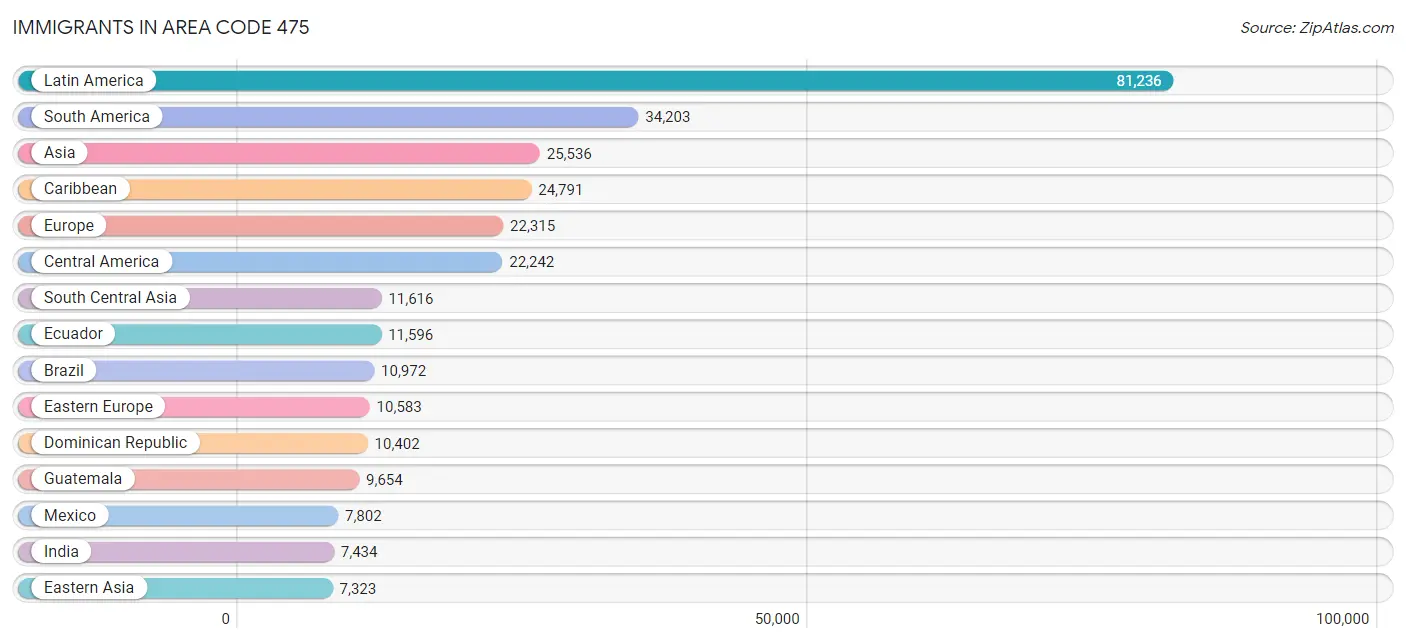
Immigrants in Area Code 475
The most numerous immigrant groups reported in Area Code 475 came from Latin America (81,236 | 13.4%), South America (34,203 | 5.6%), Asia (25,536 | 4.2%), Caribbean (24,791 | 4.1%), and Europe (22,315 | 3.7%), together accounting for 31.0% of all Area Code 475 residents.
| Immigration Origin | # Population | % Population |
| Afghanistan | 1,282 | 0.2% |
| Africa | 7,189 | 1.2% |
| Albania | 1,356 | 0.2% |
| Argentina | 1,232 | 0.2% |
| Armenia | 29 | 0.0% |
| Asia | 25,536 | 4.2% |
| Australia | 221 | 0.0% |
| Austria | 76 | 0.0% |
| Azores | 18 | 0.0% |
| Bahamas | 4 | 0.0% |
| Bangladesh | 1,151 | 0.2% |
| Barbados | 166 | 0.0% |
| Belarus | 190 | 0.0% |
| Belgium | 16 | 0.0% |
| Belize | 54 | 0.0% |
| Bolivia | 94 | 0.0% |
| Bosnia and Herzegovina | 85 | 0.0% |
| Brazil | 10,972 | 1.8% |
| Bulgaria | 312 | 0.1% |
| Cabo Verde | 260 | 0.0% |
| Cambodia | 331 | 0.1% |
| Cameroon | 62 | 0.0% |
| Canada | 1,843 | 0.3% |
| Caribbean | 24,791 | 4.1% |
| Central America | 22,242 | 3.7% |
| Chile | 479 | 0.1% |
| China | 5,676 | 0.9% |
| Colombia | 4,698 | 0.8% |
| Congo | 184 | 0.0% |
| Costa Rica | 411 | 0.1% |
| Croatia | 168 | 0.0% |
| Cuba | 716 | 0.1% |
| Czechoslovakia | 303 | 0.1% |
| Denmark | 205 | 0.0% |
| Dominica | 309 | 0.1% |
| Dominican Republic | 10,402 | 1.7% |
| Eastern Africa | 1,227 | 0.2% |
| Eastern Asia | 7,323 | 1.2% |
| Eastern Europe | 10,583 | 1.7% |
| Ecuador | 11,596 | 1.9% |
| Egypt | 472 | 0.1% |
| El Salvador | 1,697 | 0.3% |
| England | 924 | 0.2% |
| Eritrea | 11 | 0.0% |
| Ethiopia | 206 | 0.0% |
| Europe | 22,315 | 3.7% |
| France | 452 | 0.1% |
| Germany | 1,087 | 0.2% |
| Ghana | 1,248 | 0.2% |
| Greece | 938 | 0.2% |
| Grenada | 53 | 0.0% |
| Guatemala | 9,654 | 1.6% |
| Guyana | 651 | 0.1% |
| Haiti | 4,969 | 0.8% |
| Honduras | 1,849 | 0.3% |
| Hong Kong | 185 | 0.0% |
| Hungary | 702 | 0.1% |
| India | 7,434 | 1.2% |
| Indonesia | 114 | 0.0% |
| Iran | 300 | 0.1% |
| Iraq | 149 | 0.0% |
| Ireland | 536 | 0.1% |
| Israel | 324 | 0.1% |
| Italy | 2,599 | 0.4% |
| Jamaica | 6,509 | 1.1% |
| Japan | 302 | 0.1% |
| Jordan | 161 | 0.0% |
| Kazakhstan | 16 | 0.0% |
| Kenya | 68 | 0.0% |
| Korea | 1,223 | 0.2% |
| Kuwait | 15 | 0.0% |
| Laos | 306 | 0.1% |
| Latin America | 81,236 | 13.4% |
| Latvia | 112 | 0.0% |
| Lebanon | 323 | 0.1% |
| Liberia | 126 | 0.0% |
| Lithuania | 534 | 0.1% |
| Malaysia | 112 | 0.0% |
| Mexico | 7,802 | 1.3% |
| Middle Africa | 1,573 | 0.3% |
| Moldova | 98 | 0.0% |
| Morocco | 358 | 0.1% |
| Nepal | 112 | 0.0% |
| Netherlands | 219 | 0.0% |
| Nicaragua | 701 | 0.1% |
| Nigeria | 825 | 0.1% |
| North Macedonia | 268 | 0.0% |
| Northern Africa | 1,065 | 0.2% |
| Northern Europe | 2,850 | 0.5% |
| Norway | 19 | 0.0% |
| Oceania | 386 | 0.1% |
| Pakistan | 1,171 | 0.2% |
| Panama | 74 | 0.0% |
| Peru | 3,163 | 0.5% |
| Philippines | 1,775 | 0.3% |
| Poland | 2,543 | 0.4% |
| Portugal | 2,745 | 0.4% |
| Romania | 602 | 0.1% |
| Russia | 1,393 | 0.2% |
| Saudi Arabia | 124 | 0.0% |
| Scotland | 218 | 0.0% |
| Senegal | 4 | 0.0% |
| Serbia | 246 | 0.0% |
| Sierra Leone | 49 | 0.0% |
| Singapore | 105 | 0.0% |
| Somalia | 151 | 0.0% |
| South Africa | 236 | 0.0% |
| South America | 34,203 | 5.6% |
| South Central Asia | 11,616 | 1.9% |
| South Eastern Asia | 3,983 | 0.7% |
| Southern Europe | 6,773 | 1.1% |
| Spain | 475 | 0.1% |
| Sri Lanka | 125 | 0.0% |
| St. Vincent and the Grenadines | 104 | 0.0% |
| Sudan | 38 | 0.0% |
| Sweden | 139 | 0.0% |
| Switzerland | 182 | 0.0% |
| Syria | 893 | 0.2% |
| Taiwan | 323 | 0.1% |
| Thailand | 335 | 0.1% |
| Trinidad and Tobago | 799 | 0.1% |
| Turkey | 386 | 0.1% |
| Uganda | 196 | 0.0% |
| Ukraine | 1,011 | 0.2% |
| Uruguay | 215 | 0.0% |
| Uzbekistan | 25 | 0.0% |
| Venezuela | 1,012 | 0.2% |
| Vietnam | 847 | 0.1% |
| West Indies | 494 | 0.1% |
| Western Africa | 2,718 | 0.4% |
| Western Asia | 2,614 | 0.4% |
| Western Europe | 2,032 | 0.3% |
| Yemen | 25 | 0.0% |
| Zaire | 1,125 | 0.2% |
| Zimbabwe | 79 | 0.0% | View All 135 Rows |
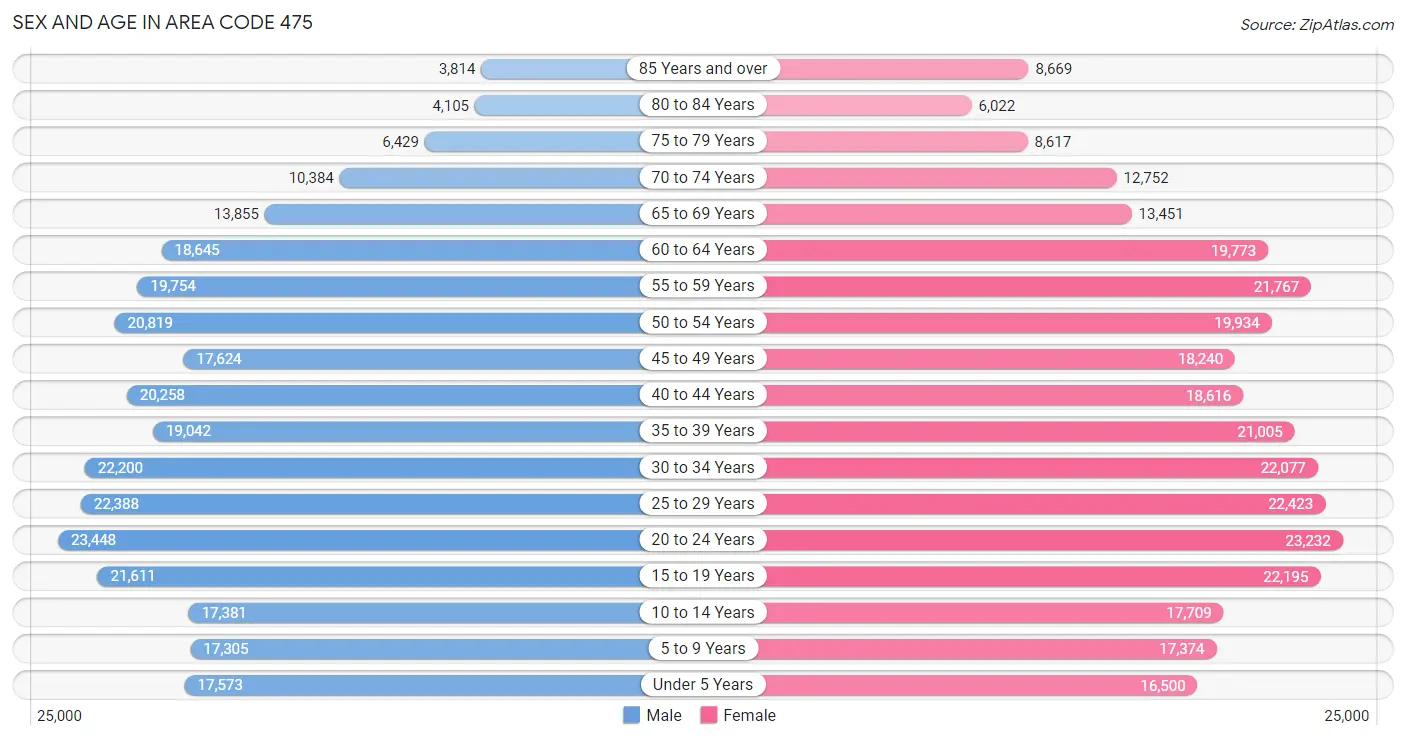
Sex and Age in Area Code 475
Sex and Age in Area Code 475
The most populous age groups in Area Code 475 are 20 to 24 Years (23,448 | 7.9%) for men and 20 to 24 Years (23,232 | 7.5%) for women.
| Age Bracket | Male | Female |
| Under 5 Years | 17,573 (5.9%) | 16,500 (5.3%) |
| 5 to 9 Years | 17,305 (5.8%) | 17,374 (5.6%) |
| 10 to 14 Years | 17,381 (5.9%) | 17,709 (5.7%) |
| 15 to 19 Years | 21,611 (7.3%) | 22,195 (7.1%) |
| 20 to 24 Years | 23,448 (7.9%) | 23,232 (7.5%) |
| 25 to 29 Years | 22,388 (7.5%) | 22,423 (7.2%) |
| 30 to 34 Years | 22,200 (7.5%) | 22,077 (7.1%) |
| 35 to 39 Years | 19,042 (6.4%) | 21,005 (6.8%) |
| 40 to 44 Years | 20,258 (6.8%) | 18,616 (6.0%) |
| 45 to 49 Years | 17,624 (5.9%) | 18,240 (5.9%) |
| 50 to 54 Years | 20,819 (7.0%) | 19,934 (6.4%) |
| 55 to 59 Years | 19,754 (6.7%) | 21,767 (7.0%) |
| 60 to 64 Years | 18,645 (6.3%) | 19,773 (6.4%) |
| 65 to 69 Years | 13,855 (4.7%) | 13,451 (4.3%) |
| 70 to 74 Years | 10,384 (3.5%) | 12,752 (4.1%) |
| 75 to 79 Years | 6,429 (2.2%) | 8,617 (2.8%) |
| 80 to 84 Years | 4,105 (1.4%) | 6,022 (1.9%) |
| 85 Years and over | 3,814 (1.3%) | 8,669 (2.8%) |
| Total | 296,635 (100.0%) | 310,356 (100.0%) |
Families and Households in Area Code 475
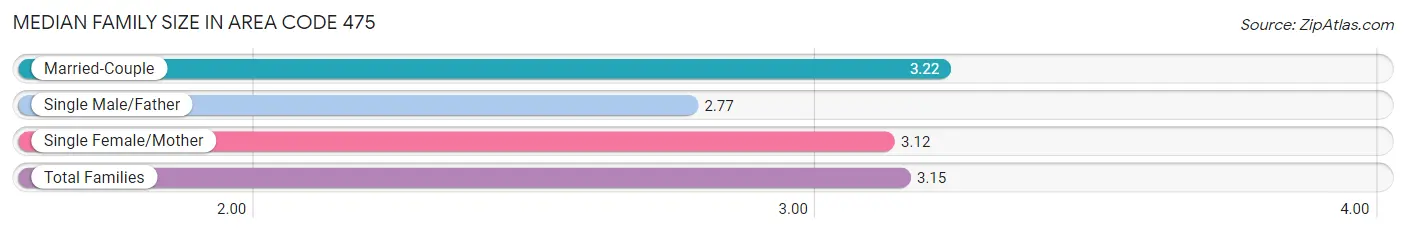
Median Family Size in Area Code 475
The median family size in Area Code 475 is 3.15 persons per family, with married-couple families (98,921 | 69.0%) accounting for the largest median family size of 3.2225 persons per family. On the other hand, single male/father families (11,547 | 8.1%) represent the smallest median family size with 2.77 persons per family.
| Family Type | # Families | Family Size |
| Married-Couple | 98,921 (69.0%) | 3.22 |
| Single Male/Father | 11,547 (8.1%) | 2.77 |
| Single Female/Mother | 32,859 (22.9%) | 3.12 |
| Total Families | 143,327 (100.0%) | 3.15 |
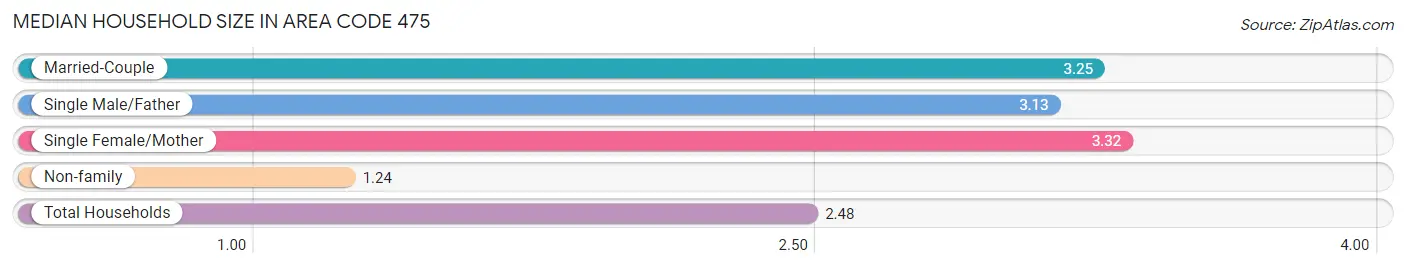
Median Household Size in Area Code 475
The median household size in Area Code 475 is 2.48 persons per household, with single female/mother households (32,859 | 14.2%) accounting for the largest median household size of 3.32083 persons per household. non-family households (87,386 | 37.9%) represent the smallest median household size with 1.24 persons per household.
| Household Type | # Households | Household Size |
| Married-Couple | 98,921 (42.9%) | 3.25 |
| Single Male/Father | 11,547 (5.0%) | 3.13 |
| Single Female/Mother | 32,859 (14.2%) | 3.32 |
| Non-family | 87,386 (37.9%) | 1.24 |
| Total Households | 230,713 (100.0%) | 2.48 |
Household Size by Marriage Status in Area Code 475
Out of a total of 230,713 households in Area Code 475, 143,327 (62.1%) are family households, while 87,386 (37.9%) are nonfamily households. The most numerous type of family households are 2-person households, comprising 57,388, and the most common type of nonfamily households are 1-person households, comprising 70,534.
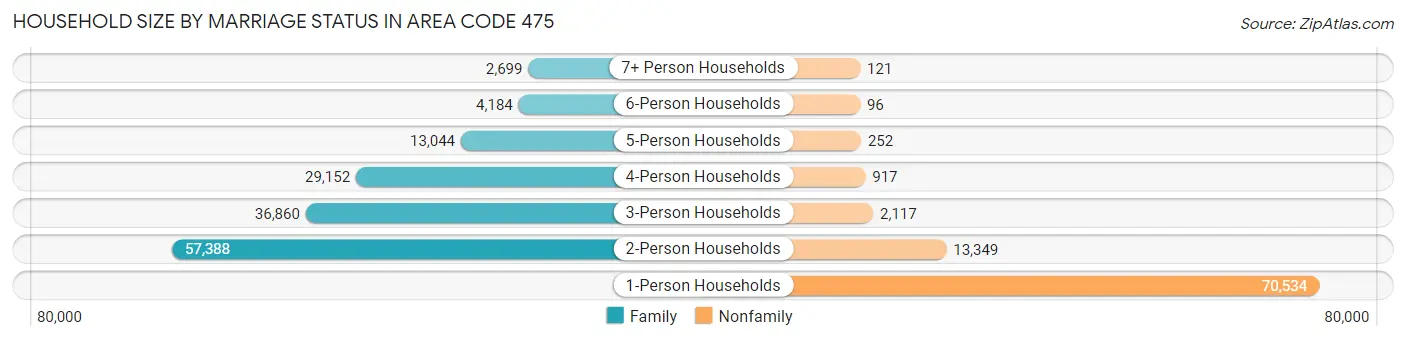
| Household Size | Family Households | Nonfamily Households |
| 1-Person Households | - | 70,534 (30.6%) |
| 2-Person Households | 57,388 (24.9%) | 13,349 (5.8%) |
| 3-Person Households | 36,860 (16.0%) | 2,117 (0.9%) |
| 4-Person Households | 29,152 (12.6%) | 917 (0.4%) |
| 5-Person Households | 13,044 (5.7%) | 252 (0.1%) |
| 6-Person Households | 4,184 (1.8%) | 96 (0.0%) |
| 7+ Person Households | 2,699 (1.2%) | 121 (0.1%) |
| Total | 143,327 (62.1%) | 87,386 (37.9%) |
Female Fertility in Area Code 475
Fertility by Age in Area Code 475
Average fertility rate in Area Code 475 is 43.3 births per 1,000 women. Women in the age bracket of 20 to 34 years have the highest fertility rate with 59.9 births per 1,000 women. Women in the age bracket of 20 to 34 years acount for 58.7% of all women with births.
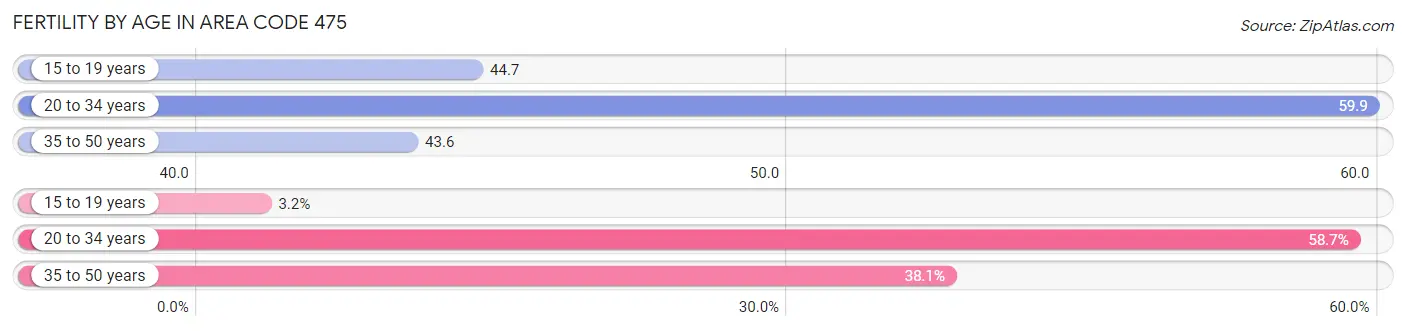
| Age Bracket | Women with Births | Births / 1,000 Women |
| 15 to 19 years | 220 (3.2%) | 44.7 |
| 20 to 34 years | 3,997 (58.7%) | 59.9 |
| 35 to 50 years | 2,597 (38.1%) | 43.6 |
| Total | 6,814 (100.0%) | 43.3 |
Fertility by Age by Marriage Status in Area Code 475
70.3% of women with births (6,814) in Area Code 475 are married. The highest percentage of unmarried women with births falls into 15 to 19 years age bracket with 100.0% of them unmarried at the time of birth, while the lowest percentage of unmarried women with births belong to 35 to 50 years age bracket with 30.9% of them unmarried.
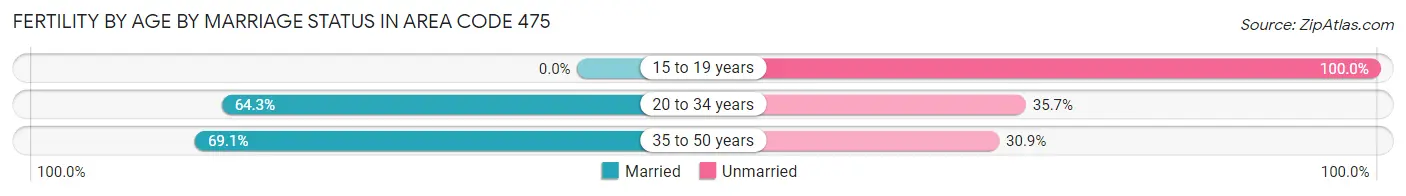
| Age Bracket | Married | Unmarried |
| 15 to 19 years | 0 (0.0%) | 220 (100.0%) |
| 20 to 34 years | 2,569 (64.3%) | 1,428 (35.7%) |
| 35 to 50 years | 1,795 (69.1%) | 802 (30.9%) |
| Total | 4,788 (70.3%) | 2,026 (29.7%) |
Fertility by Education in Area Code 475
Average fertility rate in Area Code 475 is 43.3 births per 1,000 women. Women with the education attainment of graduate degree have the highest fertility rate of 68.4 births per 1,000 women, while women with the education attainment of college or associate's degree have the lowest fertility at 40.5 births per 1,000 women. Women with the education attainment of bachelor's degree represent 30.5% of all women with births.
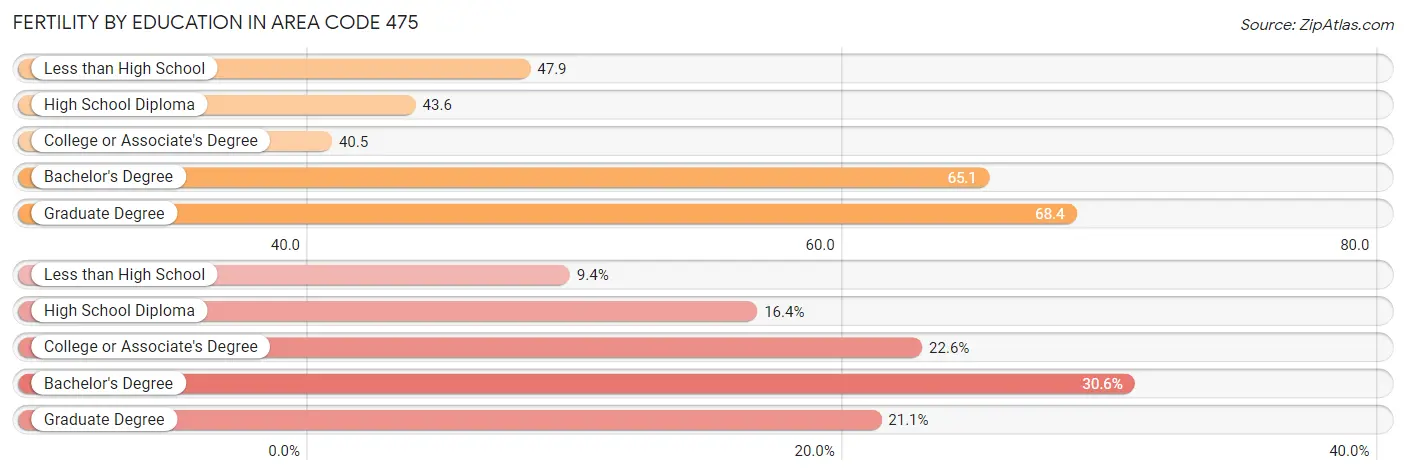
| Educational Attainment | Women with Births | Births / 1,000 Women |
| Less than High School | 640 (9.4%) | 47.9 |
| High School Diploma | 1,118 (16.4%) | 43.6 |
| College or Associate's Degree | 1,539 (22.6%) | 40.5 |
| Bachelor's Degree | 2,082 (30.5%) | 65.1 |
| Graduate Degree | 1,435 (21.1%) | 68.4 |
| Total | 6,814 (100.0%) | 43.3 |
Fertility by Education by Marriage Status in Area Code 475
29.7% of women with births in Area Code 475 are unmarried. Women with the educational attainment of graduate degree are most likely to be married with 70.3% of them married at childbirth, while women with the educational attainment of high school diploma are least likely to be married with 70.1% of them unmarried at childbirth.
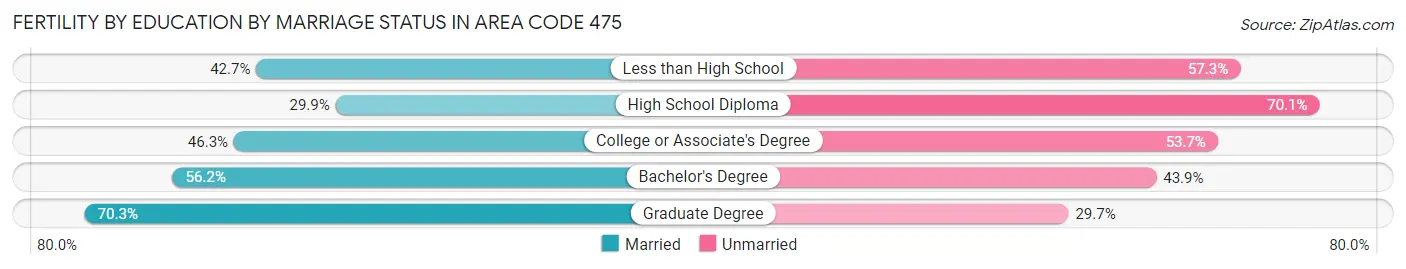
| Educational Attainment | Married | Unmarried |
| Less than High School | 273 (42.7%) | 367 (57.3%) |
| High School Diploma | 334 (29.9%) | 784 (70.1%) |
| College or Associate's Degree | 712 (46.3%) | 827 (53.7%) |
| Bachelor's Degree | 1,169 (56.1%) | 913 (43.9%) |
| Graduate Degree | 1,009 (70.3%) | 426 (29.7%) |
| Total | 4,788 (70.3%) | 2,026 (29.7%) |
Employment Characteristics in Area Code 475
Employment by Class of Employer in Area Code 475
Among the 304,019 employed individuals in Area Code 475, private company employees (206,147 | 67.8%), not-for-profit organizations (36,211 | 11.9%), and self-employed (not incorporated) (19,343 | 6.4%) make up the most common classes of employment.
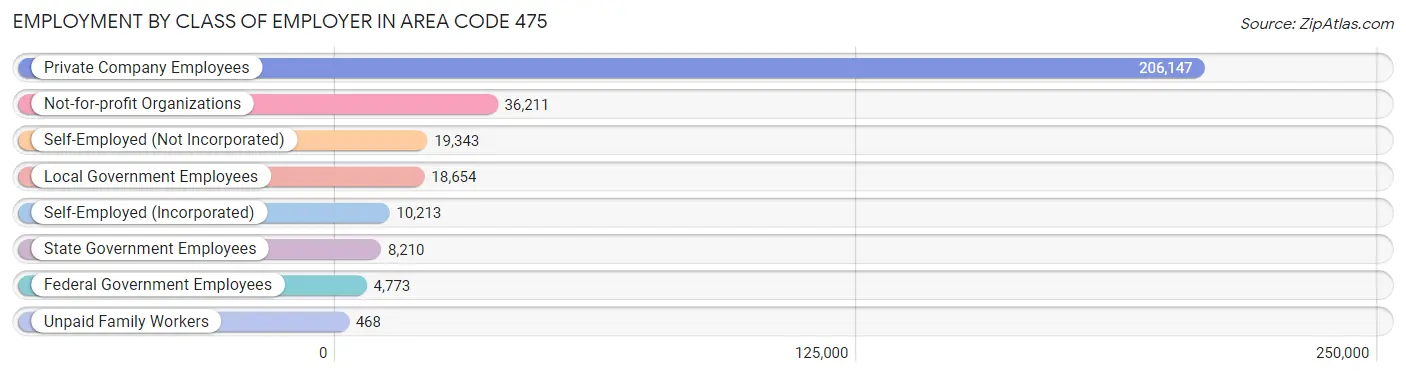
| Employer Class | # Employees | % Employees |
| Private Company Employees | 206,147 | 67.8% |
| Self-Employed (Incorporated) | 10,213 | 3.4% |
| Self-Employed (Not Incorporated) | 19,343 | 6.4% |
| Not-for-profit Organizations | 36,211 | 11.9% |
| Local Government Employees | 18,654 | 6.1% |
| State Government Employees | 8,210 | 2.7% |
| Federal Government Employees | 4,773 | 1.6% |
| Unpaid Family Workers | 468 | 0.2% |
| Total | 304,019 | 100.0% |
Employment Status by Age in Area Code 475
According to the labor force statistics for Area Code 475, out of the total population over 16 years of age (494,956), 65.5% or 324,097 individuals are in the labor force, with 7.9% or 25,442 of them unemployed. The age group with the highest labor force participation rate is 30 to 34 years, with 84.9% or 37,582 individuals in the labor force. Within the labor force, the 16 to 19 years age range has the highest percentage of unemployed individuals, with 436.1% or 56,453 of them being unemployed.
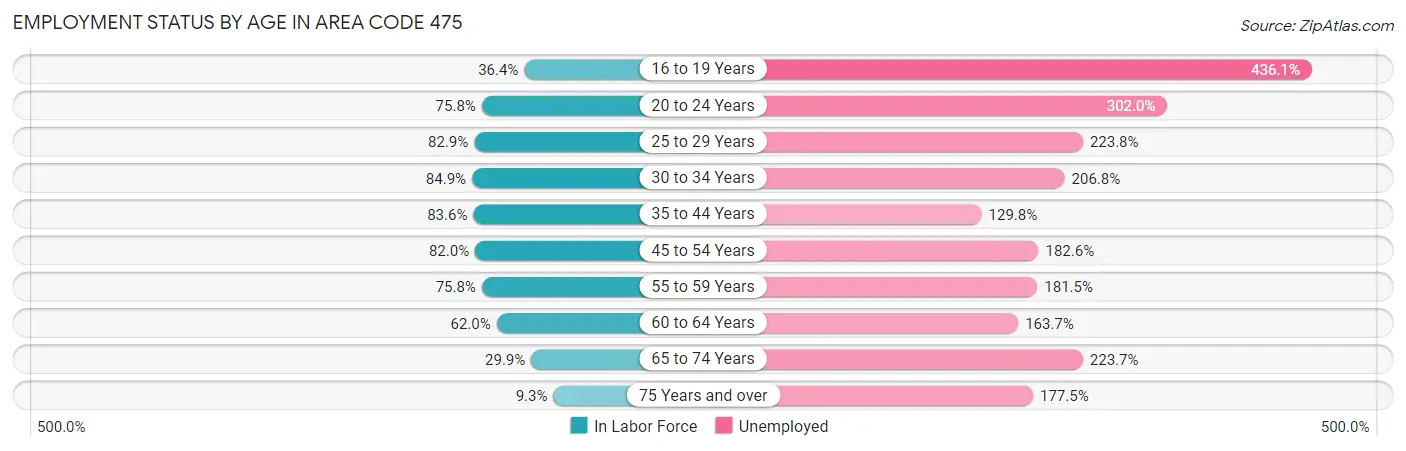
| Age Bracket | In Labor Force | Unemployed |
| 16 to 19 Years | 12,947 (36.3%) | 56,453 (436.1%) |
| 20 to 24 Years | 35,401 (75.8%) | 106,914 (302.0%) |
| 25 to 29 Years | 37,133 (82.9%) | 83,108 (223.8%) |
| 30 to 34 Years | 37,584 (84.9%) | 77,720 (206.8%) |
| 35 to 44 Years | 66,004 (83.6%) | 85,671 (129.8%) |
| 45 to 54 Years | 62,832 (82.0%) | 114,735 (182.6%) |
| 55 to 59 Years | 31,466 (75.8%) | 57,109 (181.5%) |
| 60 to 64 Years | 23,811 (62.0%) | 38,979 (163.7%) |
| 65 to 74 Years | 15,097 (29.9%) | 33,772 (223.7%) |
| 75 Years and over | 3,505 (9.3%) | 6,223 (177.5%) |
| Total | 324,114 (65.5%) | 25,442 (7.9%) |
Employment Status by Educational Attainment in Area Code 475
According to labor force statistics for Area Code 475, 79.7% of individuals (258,841) out of the total population between 25 and 64 years of age (324,565) are in the labor force, with 167.8% or 434,335 of them being unemployed. The group with the highest labor force participation rate are those with the educational attainment of bachelor's degree or higher, with 88.4% or 122,937 individuals in the labor force. Within the labor force, individuals with less than high school education have the highest percentage of unemployment, with 226.5% or 50,317 of them being unemployed.
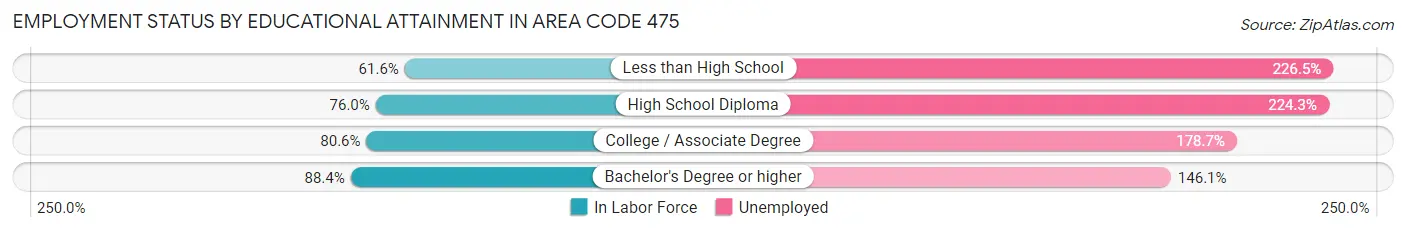
| Educational Attainment | In Labor Force | Unemployed |
| Less than High School | 22,214 (61.6%) | 81,658 (226.5%) |
| High School Diploma | 59,928 (76.0%) | 176,838 (224.3%) |
| College / Associate Degree | 56,966 (80.6%) | 126,282 (178.7%) |
| Bachelor's Degree or higher | 122,933 (88.4%) | 203,088 (146.1%) |
| Total | 258,827 (79.7%) | 544,620 (167.8%) |
Employment Occupations by Sex in Area Code 475
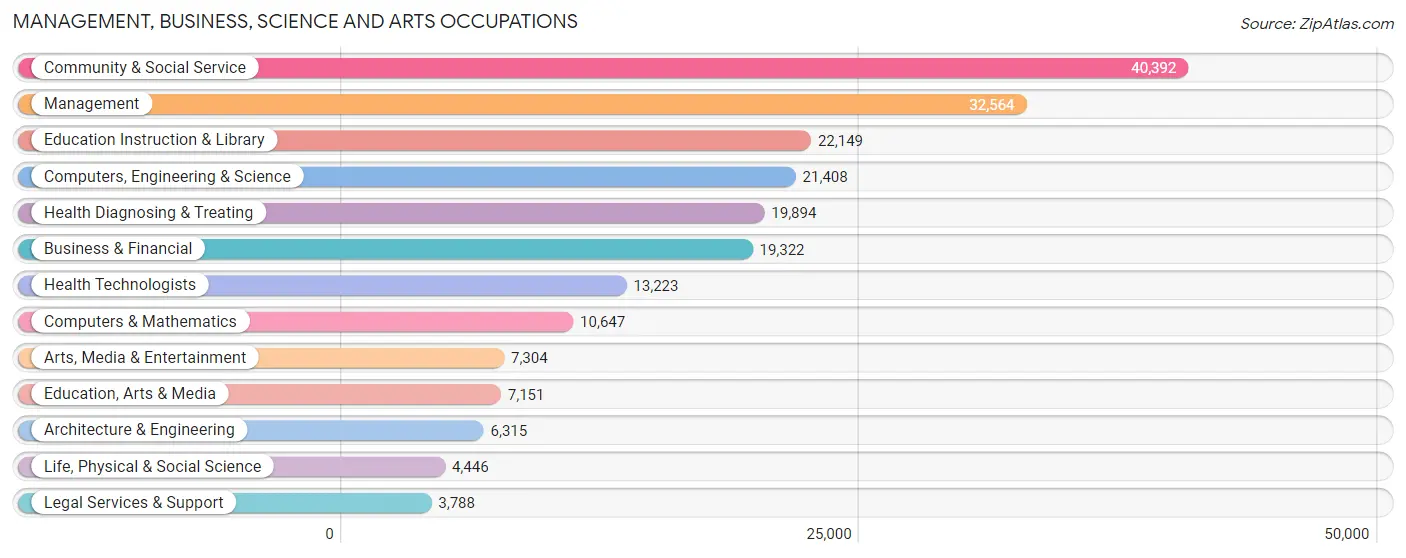
Management, Business, Science and Arts Occupations
The most common Management, Business, Science and Arts occupations in Area Code 475 are Community & Social Service (40,392 | 13.0%), Management (32,564 | 10.5%), Education Instruction & Library (22,149 | 7.1%), Computers, Engineering & Science (21,408 | 6.9%), and Health Diagnosing & Treating (19,894 | 6.4%).
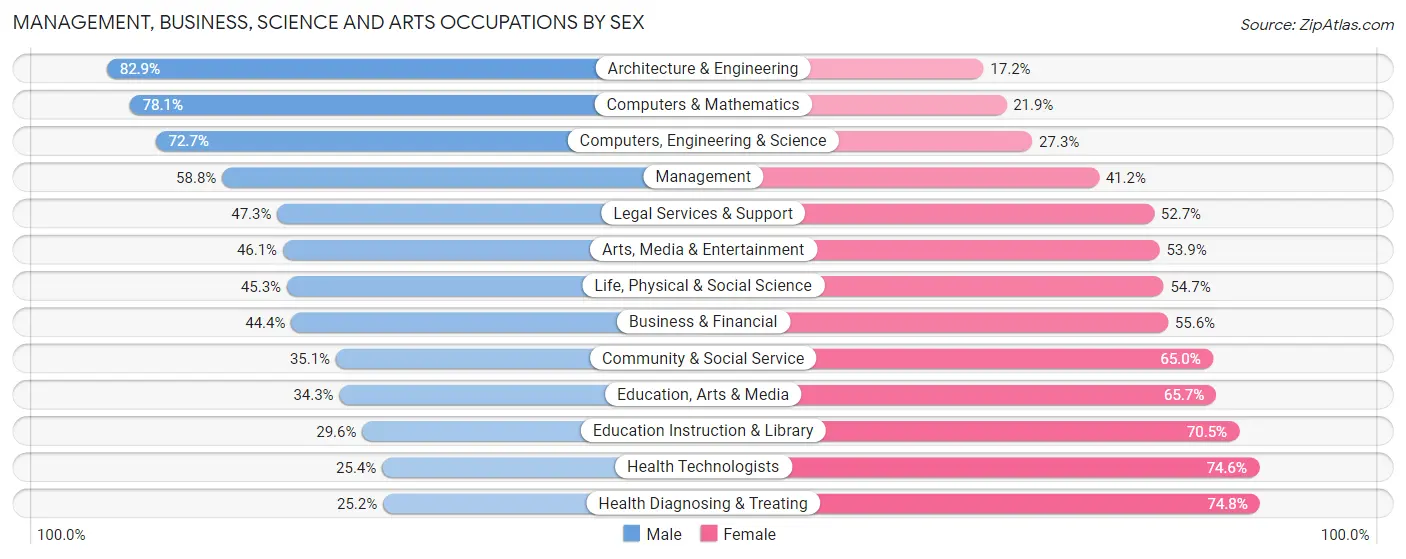
Management, Business, Science and Arts Occupations by Sex
Within the Management, Business, Science and Arts occupations in Area Code 475, the most male-oriented occupations are Architecture & Engineering (82.9%), Computers & Mathematics (78.1%), and Computers, Engineering & Science (72.7%), while the most female-oriented occupations are Health Diagnosing & Treating (74.8%), Health Technologists (74.6%), and Education Instruction & Library (70.5%).
| Occupation | Male | Female |
| Management | 19,146 (58.8%) | 13,418 (41.2%) |
| Business & Financial | 8,571 (44.4%) | 10,751 (55.6%) |
| Computers, Engineering & Science | 15,559 (72.7%) | 5,849 (27.3%) |
| Computers & Mathematics | 8,314 (78.1%) | 2,333 (21.9%) |
| Architecture & Engineering | 5,232 (82.9%) | 1,083 (17.2%) |
| Life, Physical & Social Science | 2,013 (45.3%) | 2,433 (54.7%) |
| Community & Social Service | 14,159 (35.0%) | 26,233 (64.9%) |
| Education, Arts & Media | 2,454 (34.3%) | 4,697 (65.7%) |
| Legal Services & Support | 1,791 (47.3%) | 1,997 (52.7%) |
| Education Instruction & Library | 6,546 (29.5%) | 15,603 (70.5%) |
| Arts, Media & Entertainment | 3,368 (46.1%) | 3,936 (53.9%) |
| Health Diagnosing & Treating | 5,020 (25.2%) | 14,874 (74.8%) |
| Health Technologists | 3,361 (25.4%) | 9,862 (74.6%) |
| Total (Category) | 62,455 (46.8%) | 71,125 (53.2%) |
| Total (Overall) | 159,802 (51.4%) | 151,000 (48.6%) |
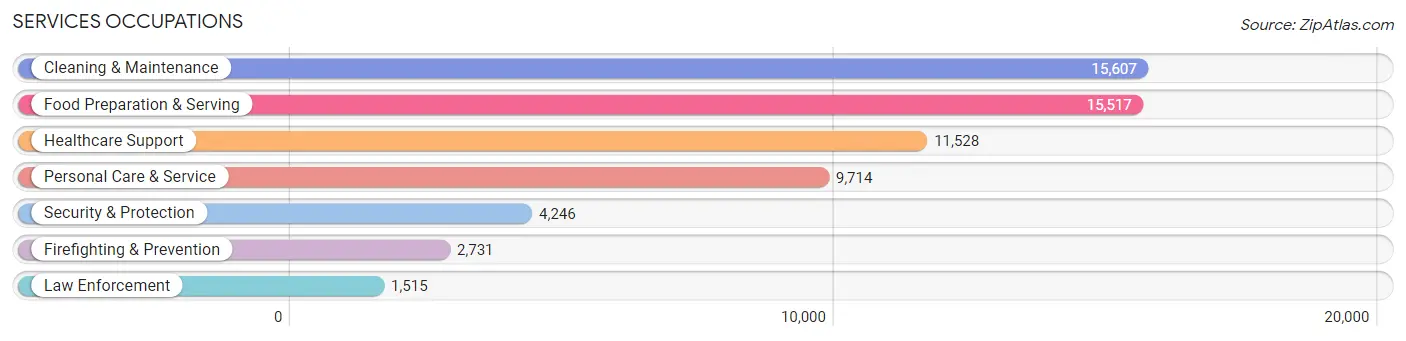
Services Occupations
The most common Services occupations in Area Code 475 are Cleaning & Maintenance (15,607 | 5.0%), Food Preparation & Serving (15,517 | 5.0%), Healthcare Support (11,528 | 3.7%), Personal Care & Service (9,714 | 3.1%), and Security & Protection (4,246 | 1.4%).
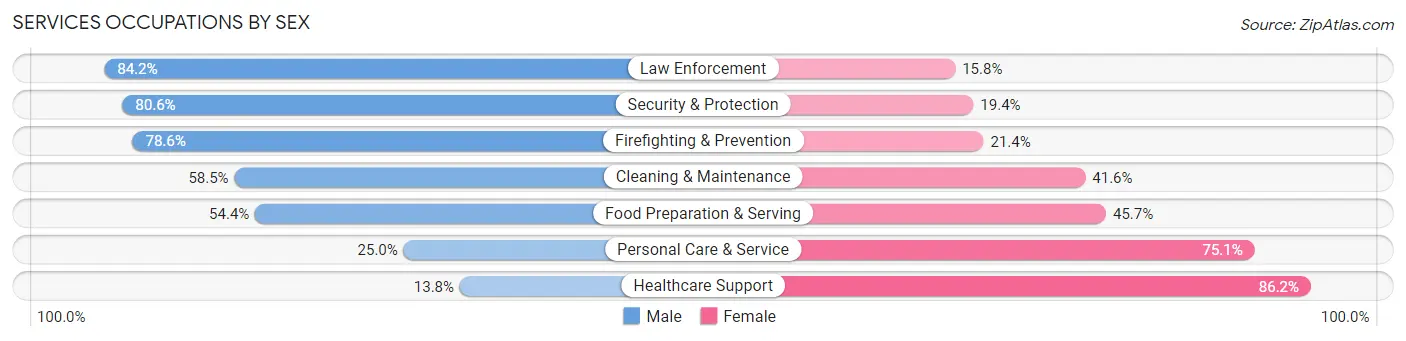
Services Occupations by Sex
Within the Services occupations in Area Code 475, the most male-oriented occupations are Law Enforcement (84.2%), Security & Protection (80.6%), and Firefighting & Prevention (78.6%), while the most female-oriented occupations are Healthcare Support (86.2%), Personal Care & Service (75.0%), and Food Preparation & Serving (45.7%).
| Occupation | Male | Female |
| Healthcare Support | 1,592 (13.8%) | 9,936 (86.2%) |
| Security & Protection | 3,423 (80.6%) | 823 (19.4%) |
| Firefighting & Prevention | 2,147 (78.6%) | 584 (21.4%) |
| Law Enforcement | 1,276 (84.2%) | 239 (15.8%) |
| Food Preparation & Serving | 8,433 (54.3%) | 7,084 (45.7%) |
| Cleaning & Maintenance | 9,122 (58.5%) | 6,485 (41.5%) |
| Personal Care & Service | 2,424 (24.9%) | 7,290 (75.0%) |
| Total (Category) | 24,994 (44.2%) | 31,618 (55.8%) |
| Total (Overall) | 159,802 (51.4%) | 151,000 (48.6%) |
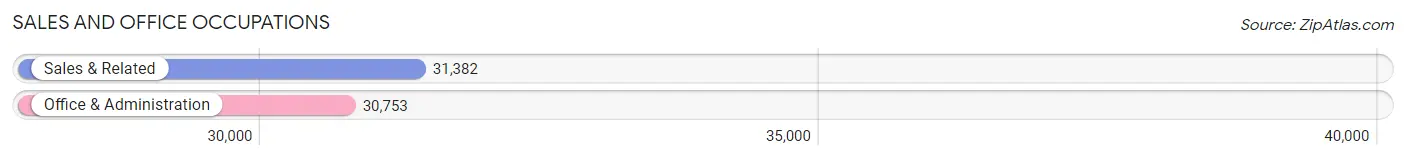
Sales and Office Occupations
The most common Sales and Office occupations in Area Code 475 are Sales & Related (31,382 | 10.1%), and Office & Administration (30,753 | 9.9%).
Sales and Office Occupations by Sex
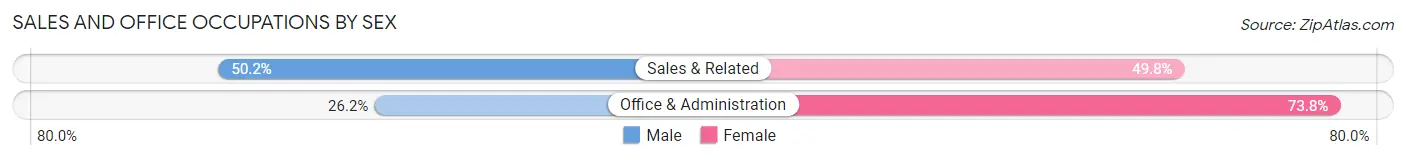
| Occupation | Male | Female |
| Sales & Related | 15,746 (50.2%) | 15,636 (49.8%) |
| Office & Administration | 8,062 (26.2%) | 22,691 (73.8%) |
| Total (Category) | 23,808 (38.3%) | 38,327 (61.7%) |
| Total (Overall) | 159,802 (51.4%) | 151,000 (48.6%) |
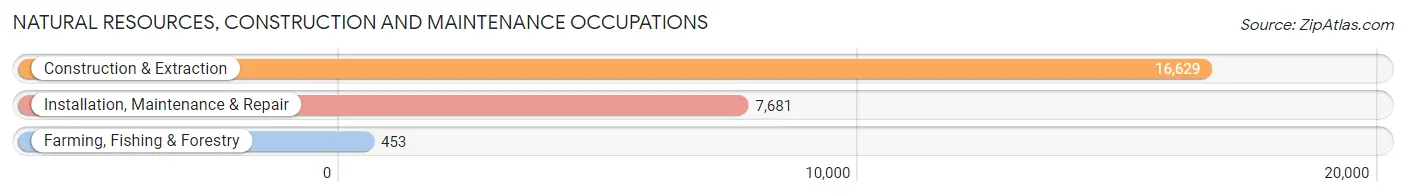
Natural Resources, Construction and Maintenance Occupations
The most common Natural Resources, Construction and Maintenance occupations in Area Code 475 are Construction & Extraction (16,629 | 5.3%), Installation, Maintenance & Repair (7,681 | 2.5%), and Farming, Fishing & Forestry (453 | 0.2%).
Natural Resources, Construction and Maintenance Occupations by Sex
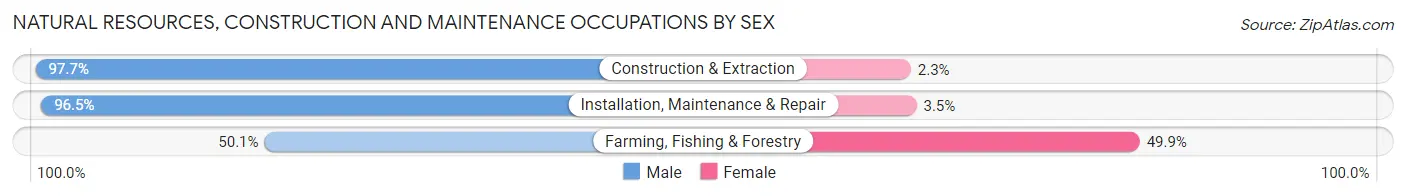
| Occupation | Male | Female |
| Farming, Fishing & Forestry | 227 (50.1%) | 226 (49.9%) |
| Construction & Extraction | 16,251 (97.7%) | 378 (2.3%) |
| Installation, Maintenance & Repair | 7,415 (96.5%) | 266 (3.5%) |
| Total (Category) | 23,893 (96.5%) | 870 (3.5%) |
| Total (Overall) | 159,802 (51.4%) | 151,000 (48.6%) |
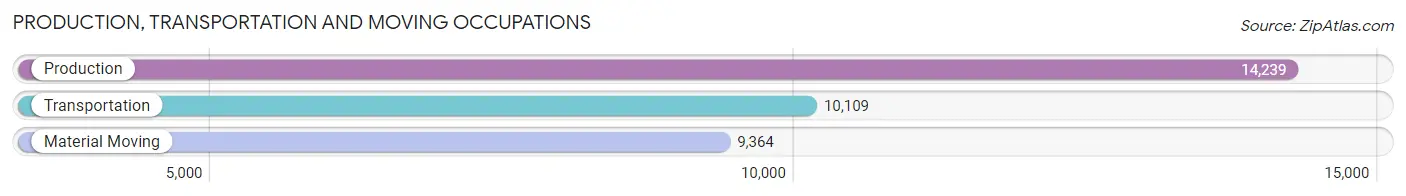
Production, Transportation and Moving Occupations
The most common Production, Transportation and Moving occupations in Area Code 475 are Production (14,239 | 4.6%), Transportation (10,109 | 3.3%), and Material Moving (9,364 | 3.0%).
Production, Transportation and Moving Occupations by Sex
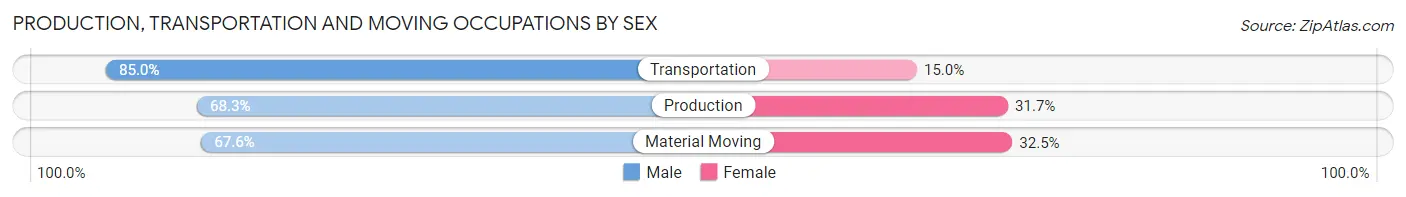
| Occupation | Male | Female |
| Production | 9,730 (68.3%) | 4,509 (31.7%) |
| Transportation | 8,597 (85.0%) | 1,512 (15.0%) |
| Material Moving | 6,325 (67.5%) | 3,039 (32.5%) |
| Total (Category) | 24,652 (73.1%) | 9,060 (26.9%) |
| Total (Overall) | 159,802 (51.4%) | 151,000 (48.6%) |
Employment Industries by Sex in Area Code 475
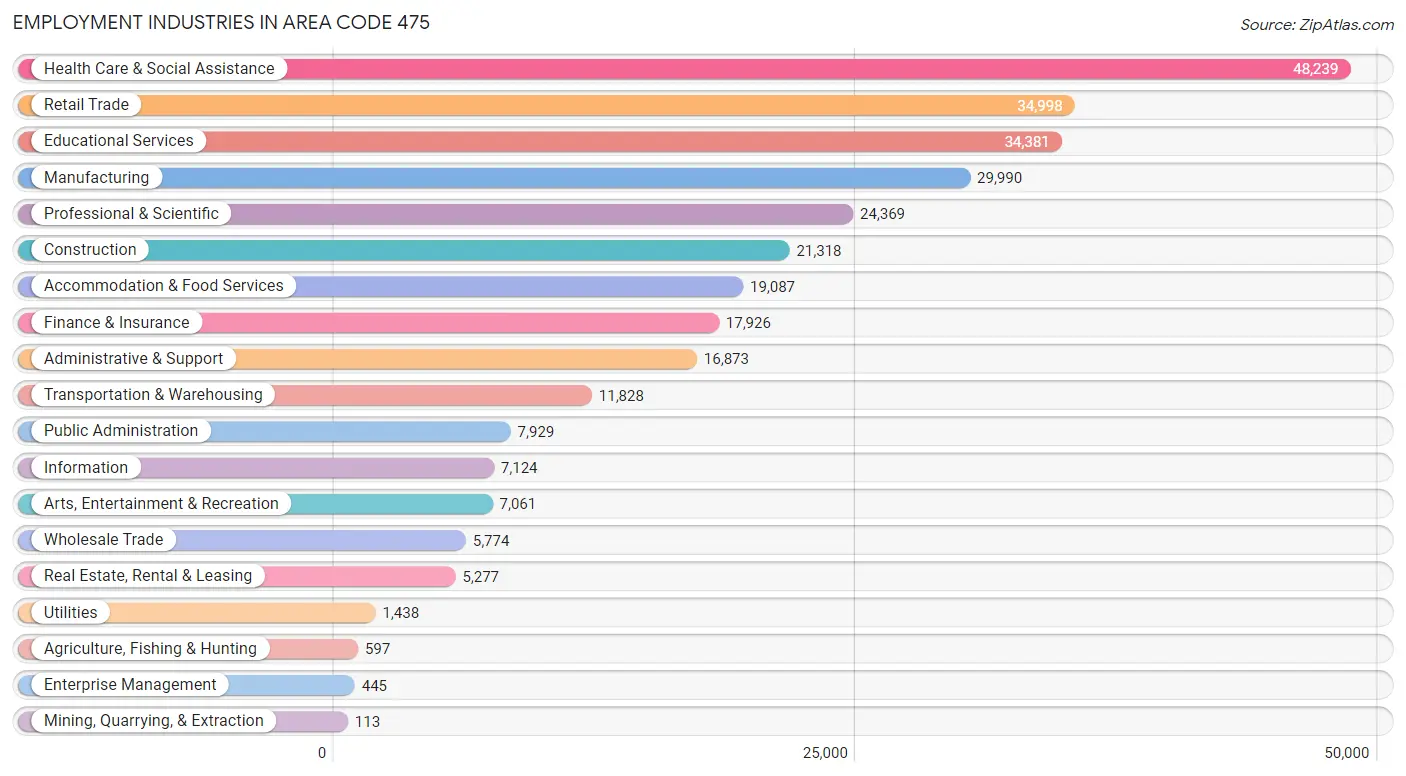
Employment Industries in Area Code 475
The major employment industries in Area Code 475 include Health Care & Social Assistance (48,239 | 15.5%), Retail Trade (34,998 | 11.3%), Educational Services (34,381 | 11.1%), Manufacturing (29,990 | 9.7%), and Professional & Scientific (24,369 | 7.8%).
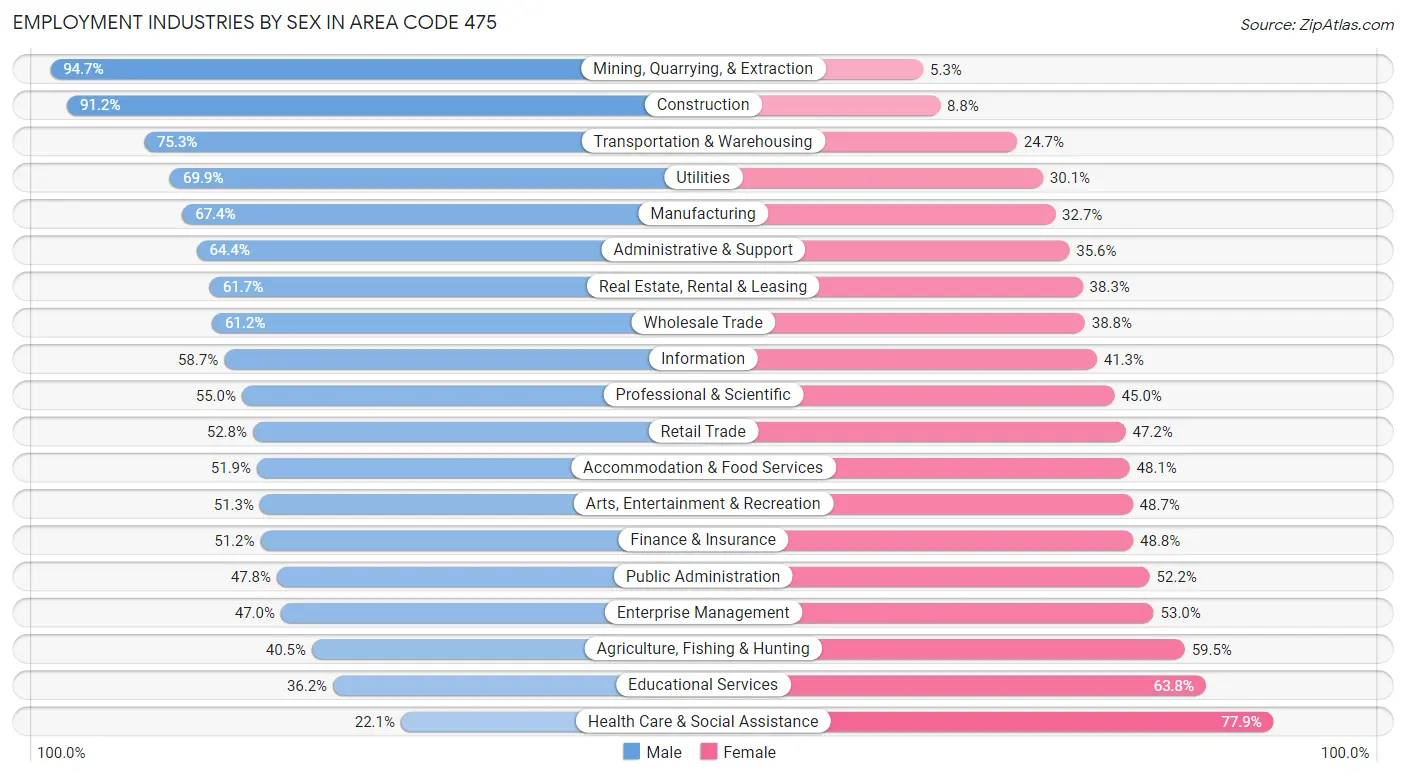
Employment Industries by Sex in Area Code 475
The Area Code 475 industries that see more men than women are Mining, Quarrying, & Extraction (94.7%), Construction (91.2%), and Transportation & Warehousing (75.3%), whereas the industries that tend to have a higher number of women are Health Care & Social Assistance (77.9%), Educational Services (63.8%), and Agriculture, Fishing & Hunting (59.5%).
| Industry | Male | Female |
| Agriculture, Fishing & Hunting | 242 (40.5%) | 355 (59.5%) |
| Mining, Quarrying, & Extraction | 107 (94.7%) | 6 (5.3%) |
| Construction | 19,443 (91.2%) | 1,875 (8.8%) |
| Manufacturing | 20,197 (67.3%) | 9,793 (32.7%) |
| Wholesale Trade | 3,534 (61.2%) | 2,240 (38.8%) |
| Retail Trade | 18,470 (52.8%) | 16,528 (47.2%) |
| Transportation & Warehousing | 8,905 (75.3%) | 2,923 (24.7%) |
| Utilities | 1,005 (69.9%) | 433 (30.1%) |
| Information | 4,184 (58.7%) | 2,940 (41.3%) |
| Finance & Insurance | 9,180 (51.2%) | 8,746 (48.8%) |
| Real Estate, Rental & Leasing | 3,254 (61.7%) | 2,023 (38.3%) |
| Professional & Scientific | 13,413 (55.0%) | 10,956 (45.0%) |
| Enterprise Management | 209 (47.0%) | 236 (53.0%) |
| Administrative & Support | 10,868 (64.4%) | 6,005 (35.6%) |
| Educational Services | 12,439 (36.2%) | 21,942 (63.8%) |
| Health Care & Social Assistance | 10,680 (22.1%) | 37,559 (77.9%) |
| Arts, Entertainment & Recreation | 3,623 (51.3%) | 3,438 (48.7%) |
| Accommodation & Food Services | 9,912 (51.9%) | 9,175 (48.1%) |
| Public Administration | 3,789 (47.8%) | 4,140 (52.2%) |
| Total | 159,802 (51.4%) | 151,000 (48.6%) |
Education in Area Code 475
School Enrollment in Area Code 475
The most common levels of schooling among the 159,361 students in Area Code 475 are college / undergraduate (40,204 | 25.2%), high school (32,038 | 20.1%), and middle school (28,057 | 17.6%).
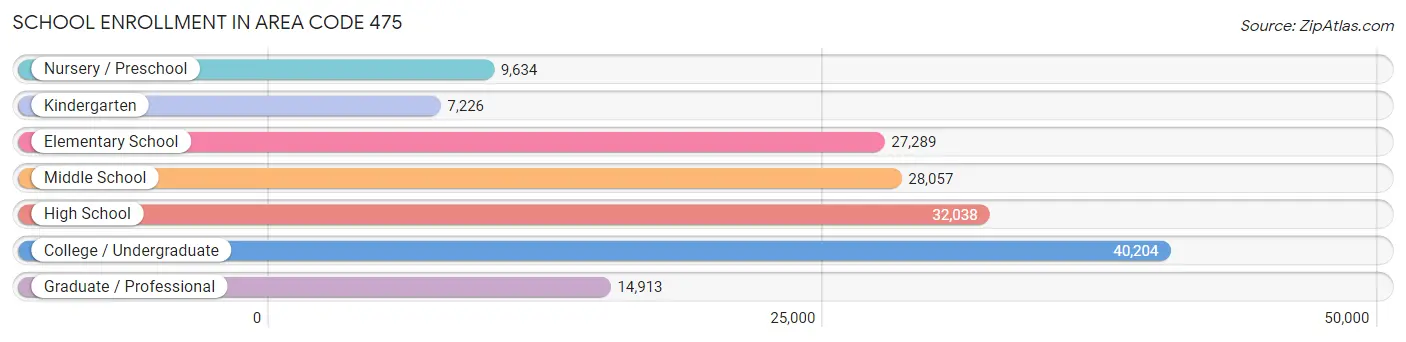
| School Level | # Students | % Students |
| Nursery / Preschool | 9,634 | 6.0% |
| Kindergarten | 7,226 | 4.5% |
| Elementary School | 27,289 | 17.1% |
| Middle School | 28,057 | 17.6% |
| High School | 32,038 | 20.1% |
| College / Undergraduate | 40,204 | 25.2% |
| Graduate / Professional | 14,913 | 9.4% |
| Total | 159,361 | 100.0% |
School Enrollment by Age by Funding Source in Area Code 475
Out of a total of 159,361 students who are enrolled in schools in Area Code 475, 44,435 (27.9%) attend a private institution, while the remaining 114,926 (72.1%) are enrolled in public schools. The age group of 25 to 34 year olds has the highest likelihood of being enrolled in private schools, with 7,388 (55.0% in the age bracket) enrolled. Conversely, the age group of 5 to 9 year old has the lowest likelihood of being enrolled in a private school, with 29,844 (89.6% in the age bracket) attending a public institution.
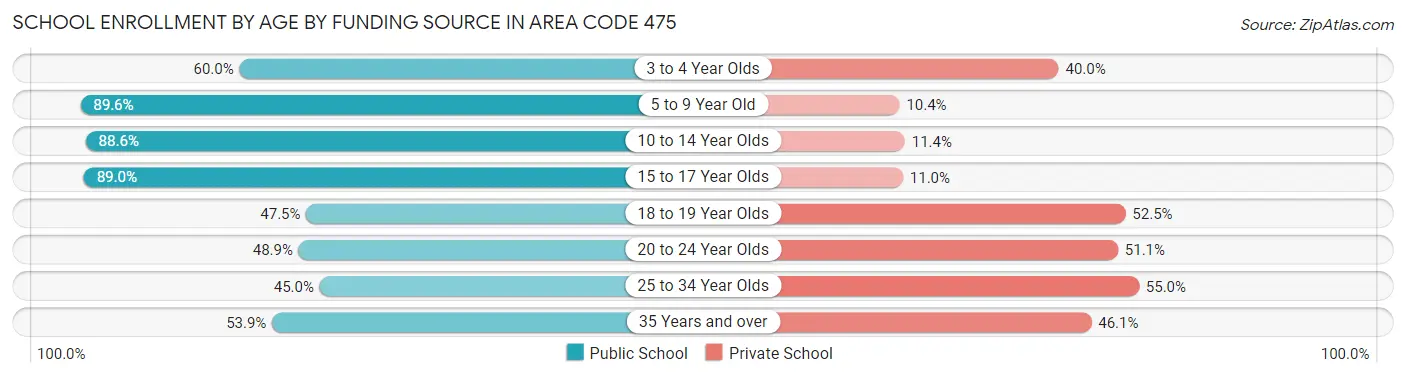
| Age Bracket | Public School | Private School |
| 3 to 4 Year Olds | 5,337 (60.0%) | 3,562 (40.0%) |
| 5 to 9 Year Old | 29,844 (89.6%) | 3,461 (10.4%) |
| 10 to 14 Year Olds | 30,587 (88.6%) | 3,927 (11.4%) |
| 15 to 17 Year Olds | 20,234 (89.0%) | 2,506 (11.0%) |
| 18 to 19 Year Olds | 8,022 (47.5%) | 8,860 (52.5%) |
| 20 to 24 Year Olds | 10,732 (48.9%) | 11,200 (51.1%) |
| 25 to 34 Year Olds | 6,050 (45.0%) | 7,388 (55.0%) |
| 35 Years and over | 4,122 (53.9%) | 3,529 (46.1%) |
| Total | 114,926 (72.1%) | 44,435 (27.9%) |
Educational Attainment by Field of Study in Area Code 475
Business (37,311 | 20.4%), social sciences (19,617 | 10.7%), science & technology (14,974 | 8.2%), education (14,431 | 7.9%), and engineering (12,137 | 6.6%) are the most common fields of study among 183,149 individuals in Area Code 475 who have obtained a bachelor's degree or higher.
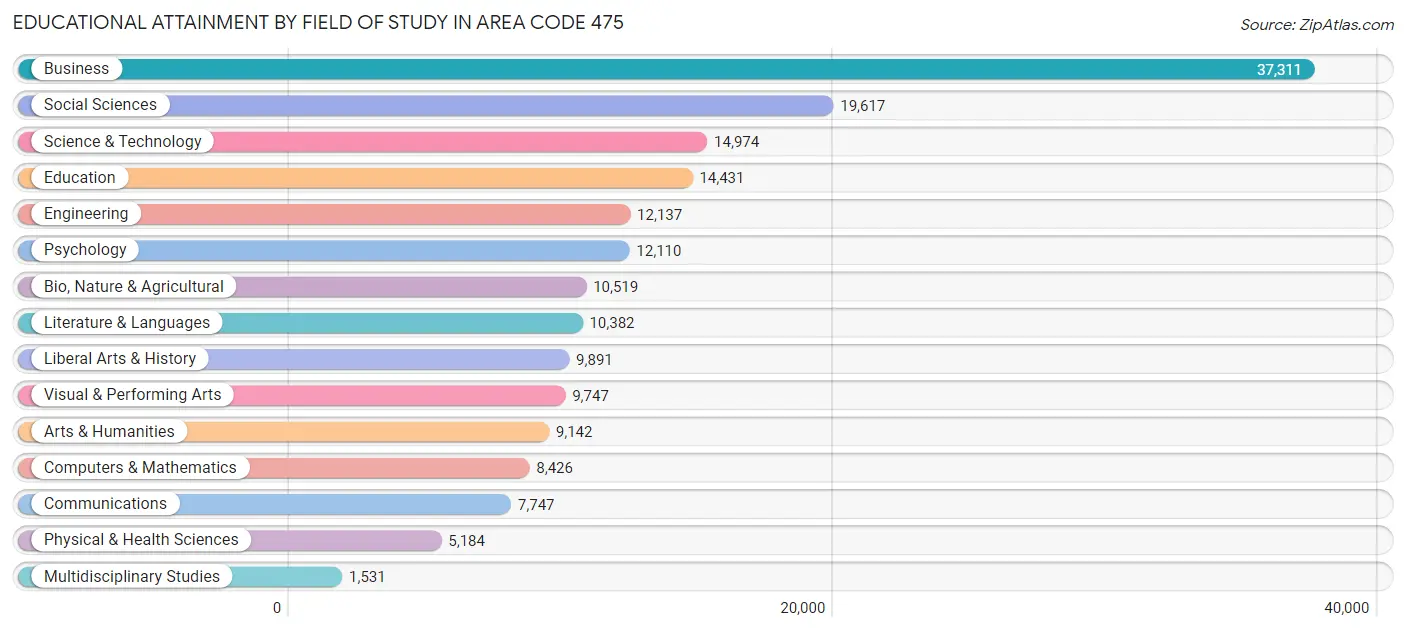
| Field of Study | # Graduates | % Graduates |
| Computers & Mathematics | 8,426 | 4.6% |
| Bio, Nature & Agricultural | 10,519 | 5.7% |
| Physical & Health Sciences | 5,184 | 2.8% |
| Psychology | 12,110 | 6.6% |
| Social Sciences | 19,617 | 10.7% |
| Engineering | 12,137 | 6.6% |
| Multidisciplinary Studies | 1,531 | 0.8% |
| Science & Technology | 14,974 | 8.2% |
| Business | 37,311 | 20.4% |
| Education | 14,431 | 7.9% |
| Literature & Languages | 10,382 | 5.7% |
| Liberal Arts & History | 9,891 | 5.4% |
| Visual & Performing Arts | 9,747 | 5.3% |
| Communications | 7,747 | 4.2% |
| Arts & Humanities | 9,142 | 5.0% |
| Total | 183,149 | 100.0% |
Transportation & Commute in Area Code 475
Vehicle Availability by Sex in Area Code 475
The most prevalent vehicle ownership categories in Area Code 475 are males with 2 vehicles (63,060, accounting for 40.9%) and females with 2 vehicles (55,599, making up 43.7%).
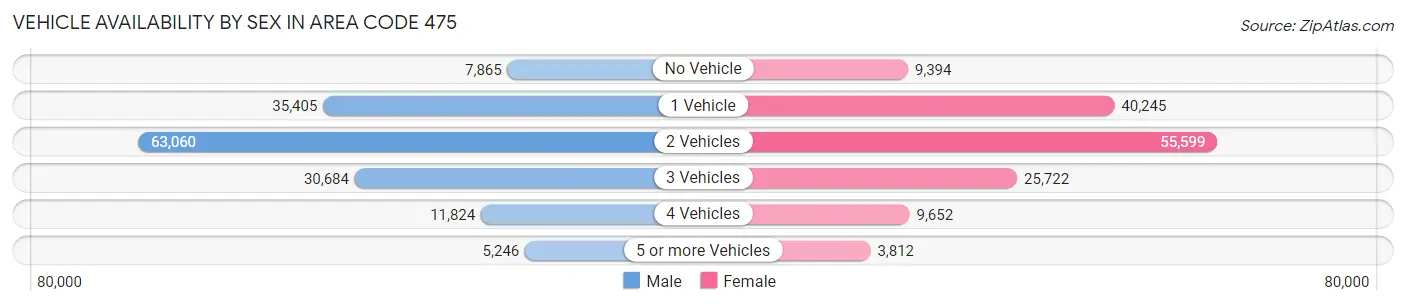
| Vehicles Available | Male | Female |
| No Vehicle | 7,865 (5.1%) | 9,394 (6.5%) |
| 1 Vehicle | 35,405 (23.0%) | 40,245 (27.9%) |
| 2 Vehicles | 63,060 (40.9%) | 55,599 (38.5%) |
| 3 Vehicles | 30,684 (19.9%) | 25,722 (17.8%) |
| 4 Vehicles | 11,824 (7.7%) | 9,652 (6.7%) |
| 5 or more Vehicles | 5,246 (3.4%) | 3,812 (2.6%) |
| Total | 154,084 (100.0%) | 144,424 (100.0%) |
Commute Time in Area Code 475
The most frequently occuring commute durations in Area Code 475 are 15 to 19 minutes (40,873 commuters, 15.3%), 10 to 14 minutes (40,709 commuters, 15.2%), and 20 to 24 minutes (36,515 commuters, 13.7%).
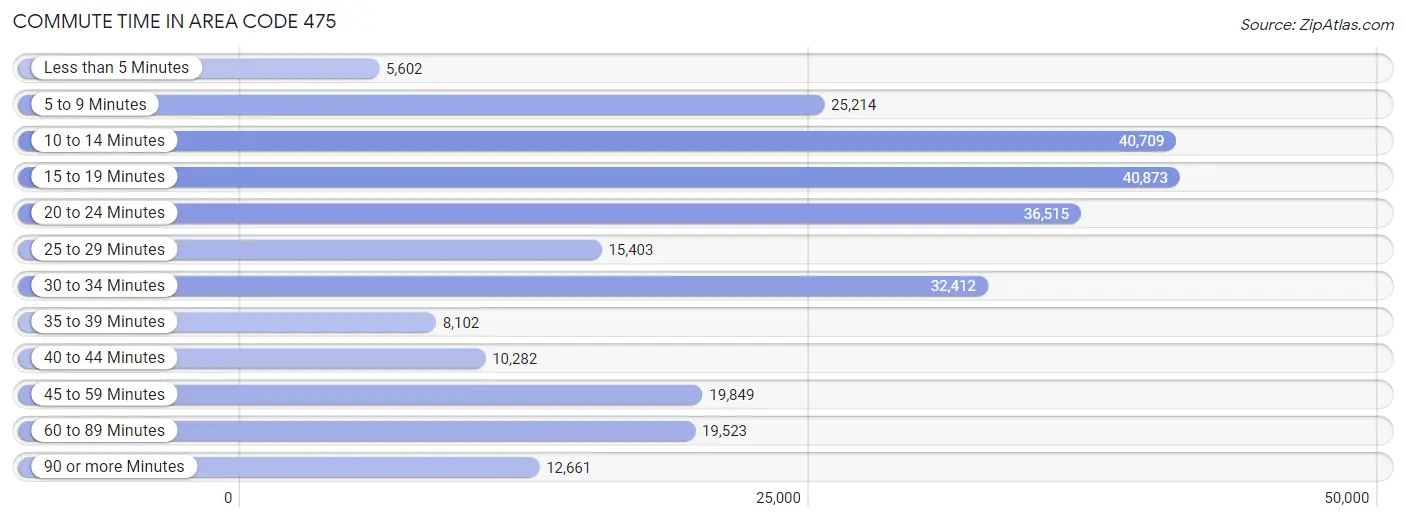
| Commute Time | # Commuters | % Commuters |
| Less than 5 Minutes | 5,602 | 2.1% |
| 5 to 9 Minutes | 25,214 | 9.4% |
| 10 to 14 Minutes | 40,709 | 15.2% |
| 15 to 19 Minutes | 40,873 | 15.3% |
| 20 to 24 Minutes | 36,515 | 13.7% |
| 25 to 29 Minutes | 15,403 | 5.8% |
| 30 to 34 Minutes | 32,412 | 12.1% |
| 35 to 39 Minutes | 8,102 | 3.0% |
| 40 to 44 Minutes | 10,282 | 3.8% |
| 45 to 59 Minutes | 19,849 | 7.4% |
| 60 to 89 Minutes | 19,523 | 7.3% |
| 90 or more Minutes | 12,661 | 4.7% |
Commute Time by Sex in Area Code 475
The most common commute times in Area Code 475 are 10 to 14 minutes (20,144 commuters, 14.5%) for males and 15 to 19 minutes (21,681 commuters, 16.9%) for females.
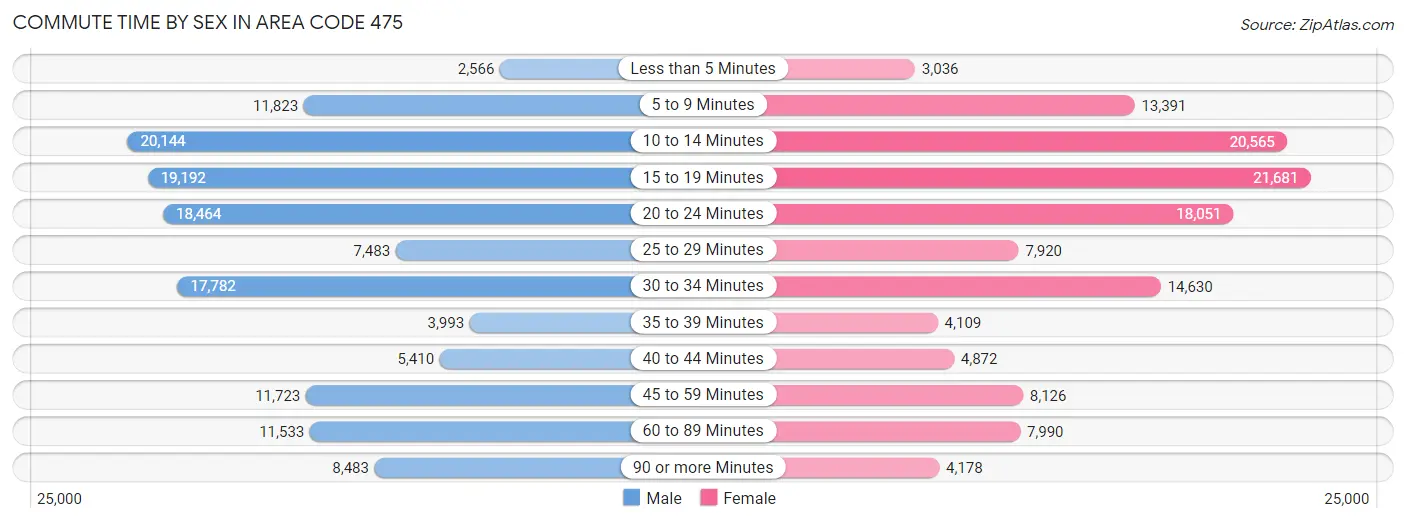
| Commute Time | Male | Female |
| Less than 5 Minutes | 2,566 (1.8%) | 3,036 (2.4%) |
| 5 to 9 Minutes | 11,823 (8.5%) | 13,391 (10.4%) |
| 10 to 14 Minutes | 20,144 (14.5%) | 20,565 (16.0%) |
| 15 to 19 Minutes | 19,192 (13.9%) | 21,681 (16.9%) |
| 20 to 24 Minutes | 18,464 (13.3%) | 18,051 (14.0%) |
| 25 to 29 Minutes | 7,483 (5.4%) | 7,920 (6.2%) |
| 30 to 34 Minutes | 17,782 (12.8%) | 14,630 (11.4%) |
| 35 to 39 Minutes | 3,993 (2.9%) | 4,109 (3.2%) |
| 40 to 44 Minutes | 5,410 (3.9%) | 4,872 (3.8%) |
| 45 to 59 Minutes | 11,723 (8.5%) | 8,126 (6.3%) |
| 60 to 89 Minutes | 11,533 (8.3%) | 7,990 (6.2%) |
| 90 or more Minutes | 8,483 (6.1%) | 4,178 (3.3%) |
Time of Departure to Work by Sex in Area Code 475
The most frequent times of departure to work in Area Code 475 are 7:00 AM to 7:29 AM (19,734, 14.2%) for males and 8:00 AM to 8:29 AM (19,586, 15.2%) for females.
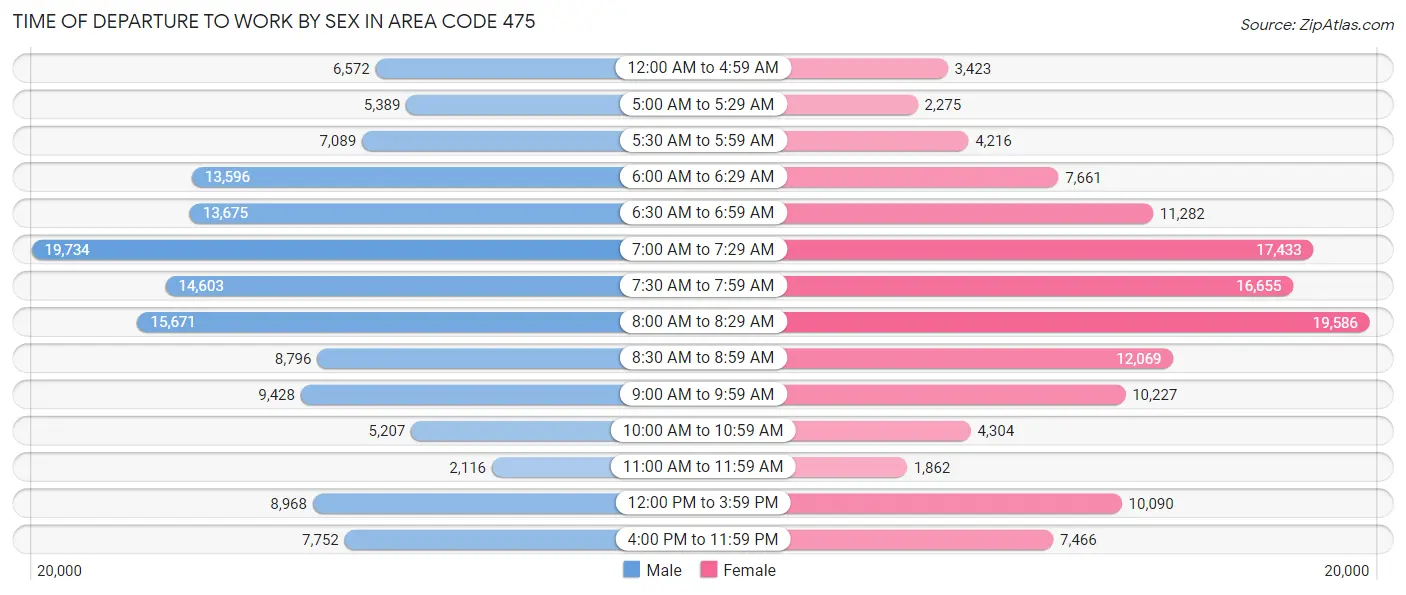
| Time of Departure | Male | Female |
| 12:00 AM to 4:59 AM | 6,572 (4.7%) | 3,423 (2.7%) |
| 5:00 AM to 5:29 AM | 5,389 (3.9%) | 2,275 (1.8%) |
| 5:30 AM to 5:59 AM | 7,089 (5.1%) | 4,216 (3.3%) |
| 6:00 AM to 6:29 AM | 13,596 (9.8%) | 7,661 (6.0%) |
| 6:30 AM to 6:59 AM | 13,675 (9.9%) | 11,282 (8.8%) |
| 7:00 AM to 7:29 AM | 19,734 (14.2%) | 17,433 (13.6%) |
| 7:30 AM to 7:59 AM | 14,603 (10.5%) | 16,655 (13.0%) |
| 8:00 AM to 8:29 AM | 15,671 (11.3%) | 19,586 (15.2%) |
| 8:30 AM to 8:59 AM | 8,796 (6.4%) | 12,069 (9.4%) |
| 9:00 AM to 9:59 AM | 9,428 (6.8%) | 10,227 (8.0%) |
| 10:00 AM to 10:59 AM | 5,207 (3.8%) | 4,304 (3.4%) |
| 11:00 AM to 11:59 AM | 2,116 (1.5%) | 1,862 (1.5%) |
| 12:00 PM to 3:59 PM | 8,968 (6.5%) | 10,090 (7.9%) |
| 4:00 PM to 11:59 PM | 7,752 (5.6%) | 7,466 (5.8%) |
| Total | 138,596 (100.0%) | 128,549 (100.0%) |
Housing Occupancy in Area Code 475
Occupancy by Ownership in Area Code 475
Of the total 230,713 dwellings in Area Code 475, owner-occupied units account for 121,880 (52.8%), while renter-occupied units make up 108,833 (47.2%).
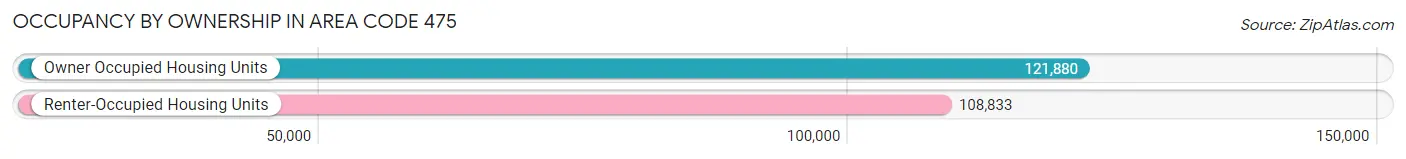
| Occupancy | # Housing Units | % Housing Units |
| Owner Occupied Housing Units | 121,880 | 52.8% |
| Renter-Occupied Housing Units | 108,833 | 47.2% |
| Total Occupied Housing Units | 230,713 | 100.0% |
Occupancy by Household Size in Area Code 475
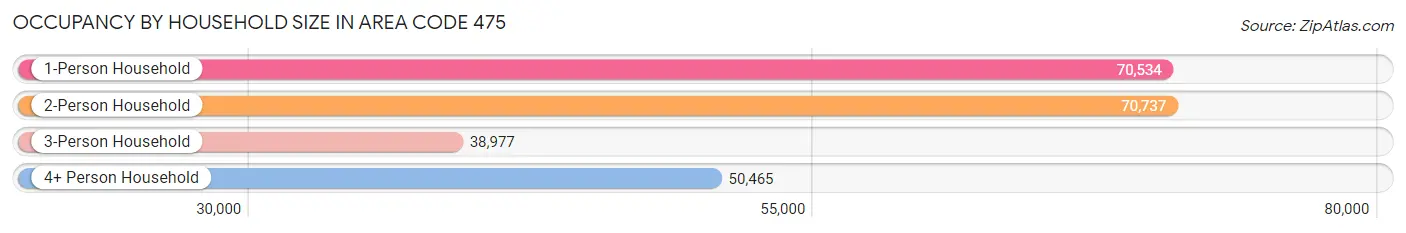
| Household Size | # Housing Units | % Housing Units |
| 1-Person Household | 70,534 | 30.6% |
| 2-Person Household | 70,737 | 30.7% |
| 3-Person Household | 38,977 | 16.9% |
| 4+ Person Household | 50,465 | 21.9% |
| Total Housing Units | 230,713 | 100.0% |
Occupancy by Ownership by Household Size in Area Code 475
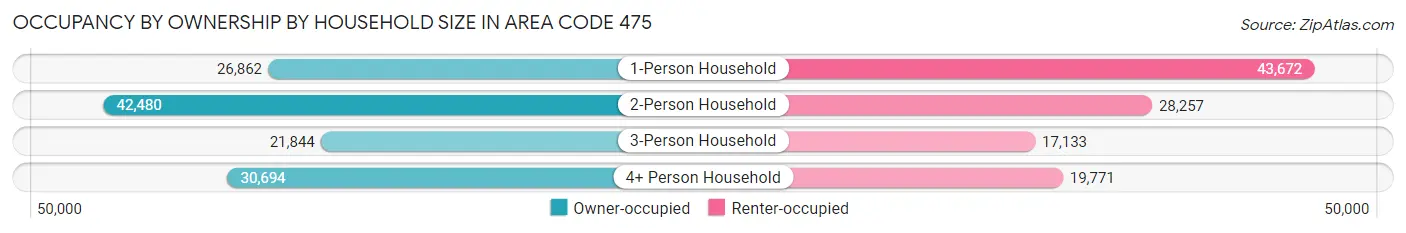
| Household Size | Owner-occupied | Renter-occupied |
| 1-Person Household | 26,862 (38.1%) | 43,672 (61.9%) |
| 2-Person Household | 42,480 (60.1%) | 28,257 (40.0%) |
| 3-Person Household | 21,844 (56.0%) | 17,133 (44.0%) |
| 4+ Person Household | 30,694 (60.8%) | 19,771 (39.2%) |
| Total Housing Units | 121,880 (52.8%) | 108,833 (47.2%) |
Occupancy by Educational Attainment in Area Code 475
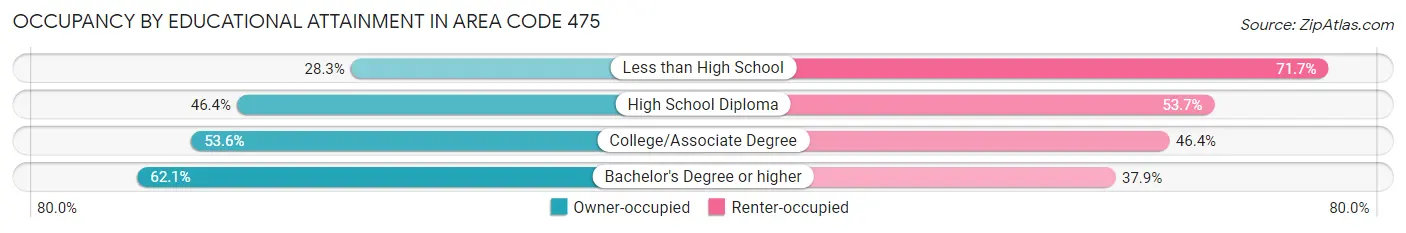
| Household Size | Owner-occupied | Renter-occupied |
| Less than High School | 7,004 (28.3%) | 17,758 (71.7%) |
| High School Diploma | 24,966 (46.4%) | 28,902 (53.6%) |
| College/Associate Degree | 28,515 (53.6%) | 24,719 (46.4%) |
| Bachelor's Degree or higher | 61,395 (62.1%) | 37,454 (37.9%) |
Occupancy by Age of Householder in Area Code 475
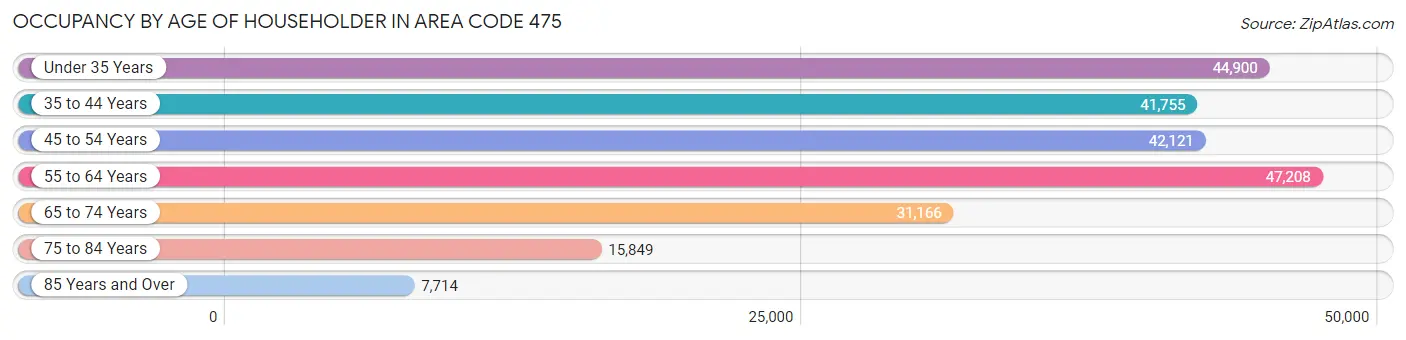
| Age Bracket | # Households | % Households |
| Under 35 Years | 44,900 | 19.5% |
| 35 to 44 Years | 41,755 | 18.1% |
| 45 to 54 Years | 42,121 | 18.3% |
| 55 to 64 Years | 47,208 | 20.5% |
| 65 to 74 Years | 31,166 | 13.5% |
| 75 to 84 Years | 15,849 | 6.9% |
| 85 Years and Over | 7,714 | 3.3% |
| Total | 230,713 | 100.0% |
Housing Finances in Area Code 475
Median Income by Occupancy in Area Code 475
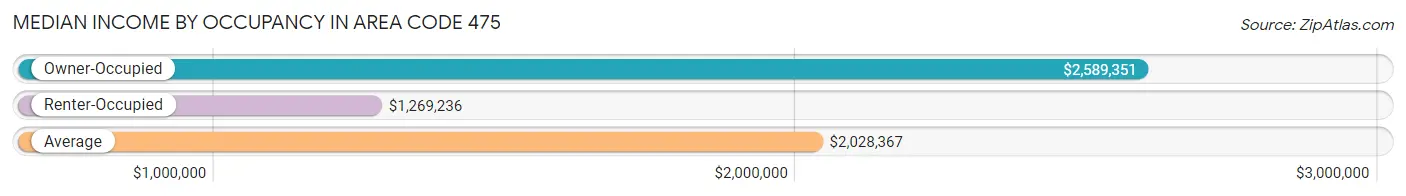
| Occupancy Type | # Households | Median Income |
| Owner-Occupied | 121,880 (52.8%) | $2,589,351 |
| Renter-Occupied | 108,833 (47.2%) | $1,269,236 |
| Average | 230,713 (100.0%) | $2,028,367 |
Occupancy by Householder Income Bracket in Area Code 475
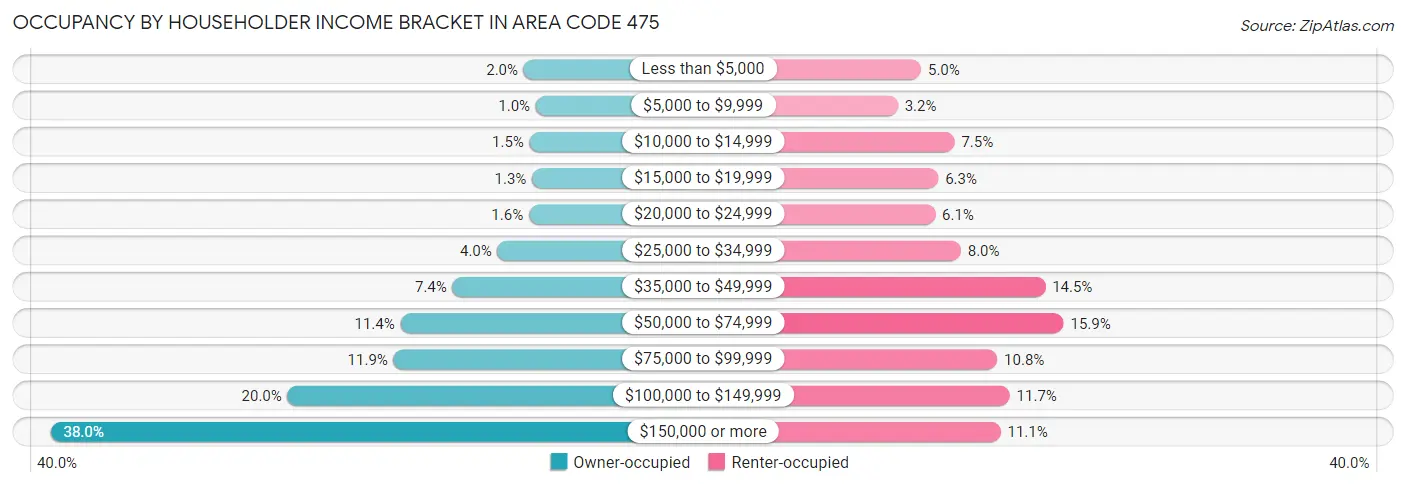
| Income Bracket | Owner-occupied | Renter-occupied |
| Less than $5,000 | 2,392 (2.0%) | 5,435 (5.0%) |
| $5,000 to $9,999 | 1,263 (1.0%) | 3,496 (3.2%) |
| $10,000 to $14,999 | 1,849 (1.5%) | 8,203 (7.5%) |
| $15,000 to $19,999 | 1,622 (1.3%) | 6,861 (6.3%) |
| $20,000 to $24,999 | 1,917 (1.6%) | 6,592 (6.1%) |
| $25,000 to $34,999 | 4,832 (4.0%) | 8,729 (8.0%) |
| $35,000 to $49,999 | 9,006 (7.4%) | 15,727 (14.4%) |
| $50,000 to $74,999 | 13,847 (11.4%) | 17,247 (15.9%) |
| $75,000 to $99,999 | 14,476 (11.9%) | 11,739 (10.8%) |
| $100,000 to $149,999 | 24,332 (20.0%) | 12,779 (11.7%) |
| $150,000 or more | 46,344 (38.0%) | 12,025 (11.1%) |
| Total | 121,880 (100.0%) | 108,833 (100.0%) |
Monthly Housing Cost Tiers in Area Code 475
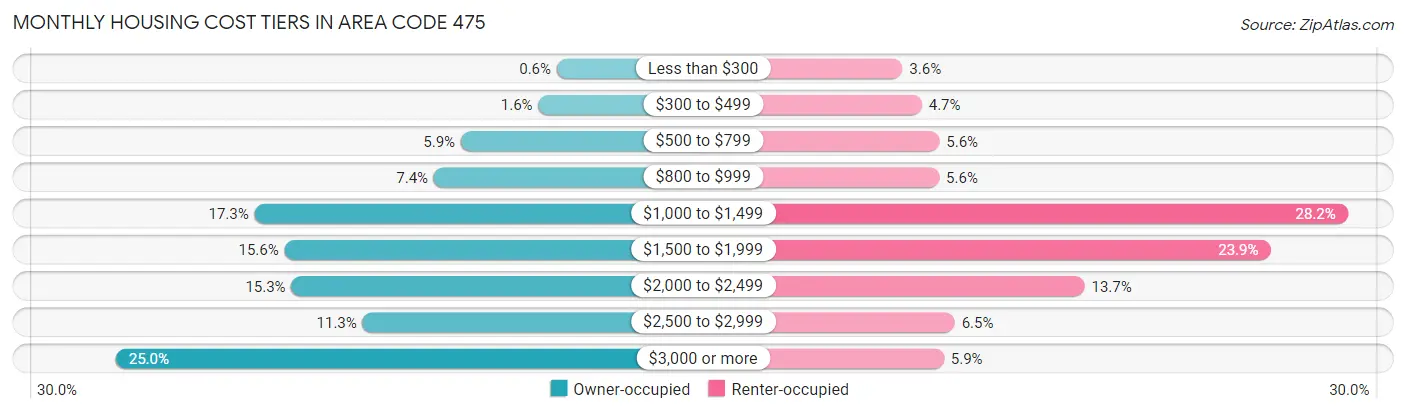
| Monthly Cost | Owner-occupied | Renter-occupied |
| Less than $300 | 737 (0.6%) | 3,909 (3.6%) |
| $300 to $499 | 1,976 (1.6%) | 5,077 (4.7%) |
| $500 to $799 | 7,190 (5.9%) | 6,132 (5.6%) |
| $800 to $999 | 9,001 (7.4%) | 6,119 (5.6%) |
| $1,000 to $1,499 | 21,086 (17.3%) | 30,666 (28.2%) |
| $1,500 to $1,999 | 19,062 (15.6%) | 26,024 (23.9%) |
| $2,000 to $2,499 | 18,594 (15.3%) | 14,857 (13.7%) |
| $2,500 to $2,999 | 13,811 (11.3%) | 7,054 (6.5%) |
| $3,000 or more | 30,423 (25.0%) | 6,395 (5.9%) |
| Total | 121,880 (100.0%) | 108,833 (100.0%) |
Physical Housing Characteristics in Area Code 475
Housing Structures in Area Code 475
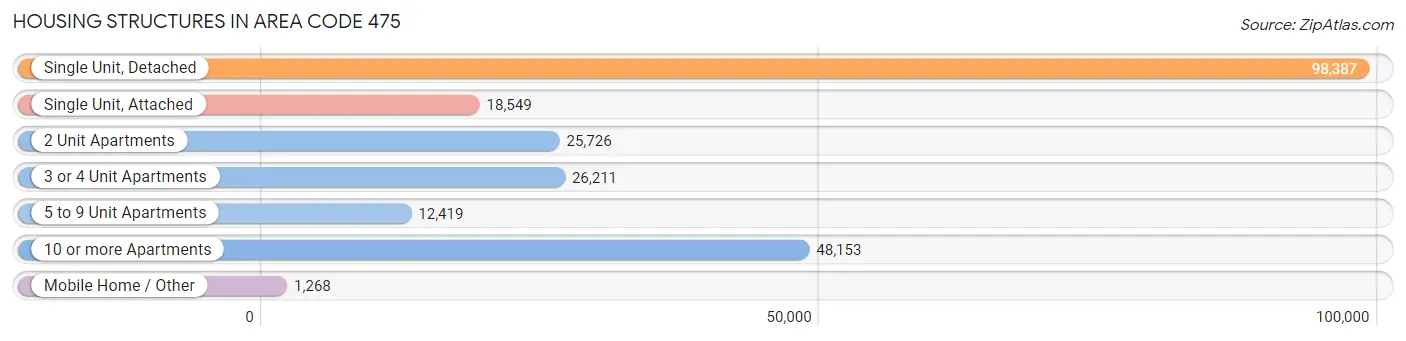
| Structure Type | # Housing Units | % Housing Units |
| Single Unit, Detached | 98,387 | 42.6% |
| Single Unit, Attached | 18,549 | 8.0% |
| 2 Unit Apartments | 25,726 | 11.2% |
| 3 or 4 Unit Apartments | 26,211 | 11.4% |
| 5 to 9 Unit Apartments | 12,419 | 5.4% |
| 10 or more Apartments | 48,153 | 20.9% |
| Mobile Home / Other | 1,268 | 0.5% |
| Total | 230,713 | 100.0% |
Housing Structures by Occupancy in Area Code 475
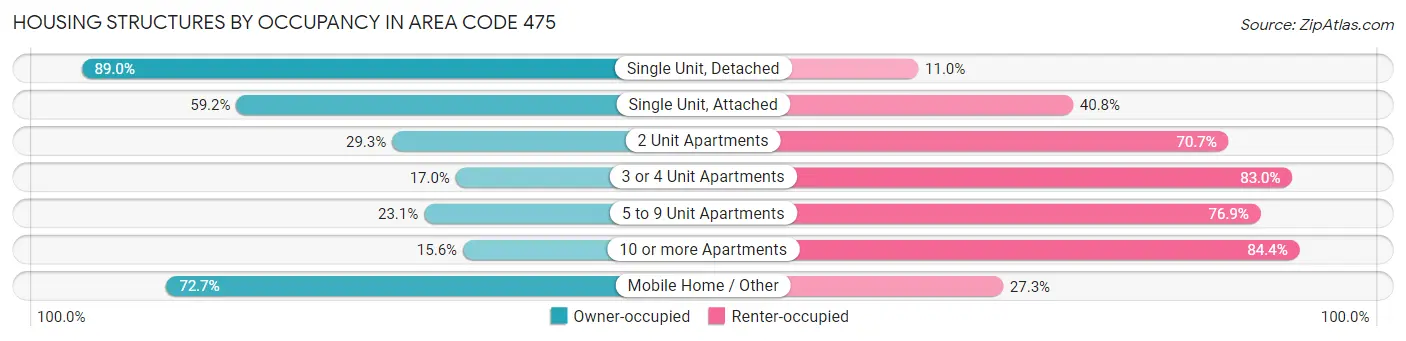
| Structure Type | Owner-occupied | Renter-occupied |
| Single Unit, Detached | 87,605 (89.0%) | 10,782 (11.0%) |
| Single Unit, Attached | 10,988 (59.2%) | 7,561 (40.8%) |
| 2 Unit Apartments | 7,528 (29.3%) | 18,198 (70.7%) |
| 3 or 4 Unit Apartments | 4,455 (17.0%) | 21,756 (83.0%) |
| 5 to 9 Unit Apartments | 2,867 (23.1%) | 9,552 (76.9%) |
| 10 or more Apartments | 7,515 (15.6%) | 40,638 (84.4%) |
| Mobile Home / Other | 922 (72.7%) | 346 (27.3%) |
| Total | 121,880 (52.8%) | 108,833 (47.2%) |
Housing Structures by Number of Rooms in Area Code 475
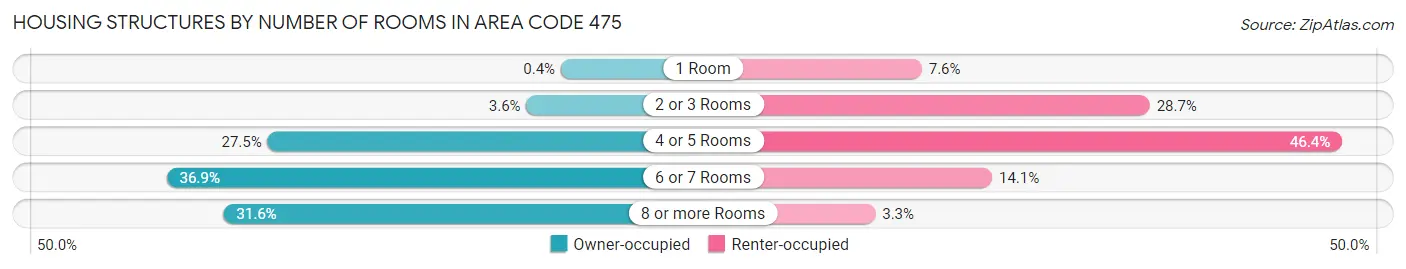
| Number of Rooms | Owner-occupied | Renter-occupied |
| 1 Room | 491 (0.4%) | 8,242 (7.6%) |
| 2 or 3 Rooms | 4,375 (3.6%) | 31,180 (28.6%) |
| 4 or 5 Rooms | 33,550 (27.5%) | 50,543 (46.4%) |
| 6 or 7 Rooms | 44,932 (36.9%) | 15,309 (14.1%) |
| 8 or more Rooms | 38,532 (31.6%) | 3,559 (3.3%) |
| Total | 121,880 (100.0%) | 108,833 (100.0%) |
Housing Structure by Heating Type in Area Code 475
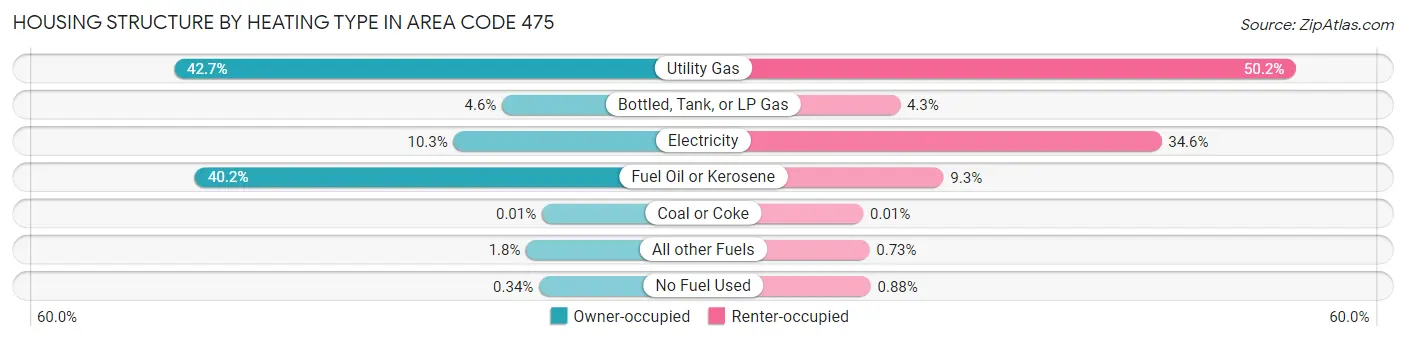
| Heating Type | Owner-occupied | Renter-occupied |
| Utility Gas | 52,004 (42.7%) | 54,645 (50.2%) |
| Bottled, Tank, or LP Gas | 5,643 (4.6%) | 4,654 (4.3%) |
| Electricity | 12,523 (10.3%) | 37,636 (34.6%) |
| Fuel Oil or Kerosene | 49,048 (40.2%) | 10,139 (9.3%) |
| Coal or Coke | 17 (0.0%) | 7 (0.0%) |
| All other Fuels | 2,230 (1.8%) | 792 (0.7%) |
| No Fuel Used | 415 (0.3%) | 960 (0.9%) |
| Total | 121,880 (100.0%) | 108,833 (100.0%) |
Household Vehicle Usage in Area Code 475
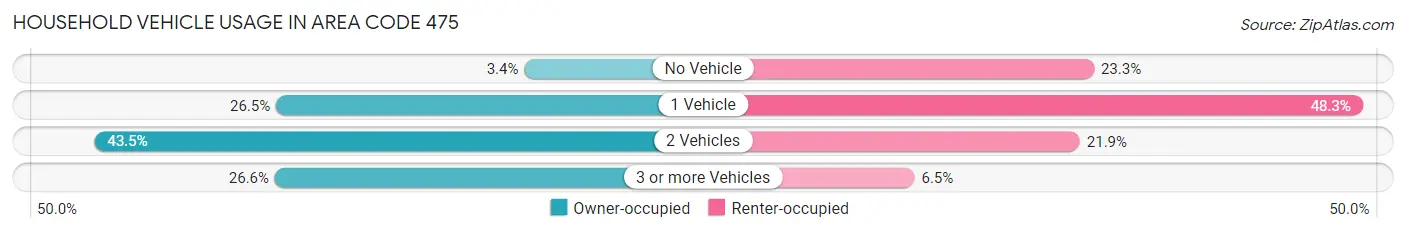
| Vehicles per Household | Owner-occupied | Renter-occupied |
| No Vehicle | 4,080 (3.4%) | 25,299 (23.3%) |
| 1 Vehicle | 32,330 (26.5%) | 52,597 (48.3%) |
| 2 Vehicles | 53,004 (43.5%) | 23,866 (21.9%) |
| 3 or more Vehicles | 32,466 (26.6%) | 7,071 (6.5%) |
| Total | 121,880 (100.0%) | 108,833 (100.0%) |
Real Estate & Mortgages in Area Code 475
Real Estate and Mortgage Overview in Area Code 475
| Characteristic | Without Mortgage | With Mortgage |
| Housing Units | 39,454 | 82,426 |
| Median Property Value | $7,792,400 | $8,392,700 |
| Median Household Income | $1,910,146 | $35,476 |
| Monthly Housing Costs | $25,261 | $29,459 |
| Real Estate Taxes | $151,257 | $1,073 |
Property Value by Mortgage Status in Area Code 475
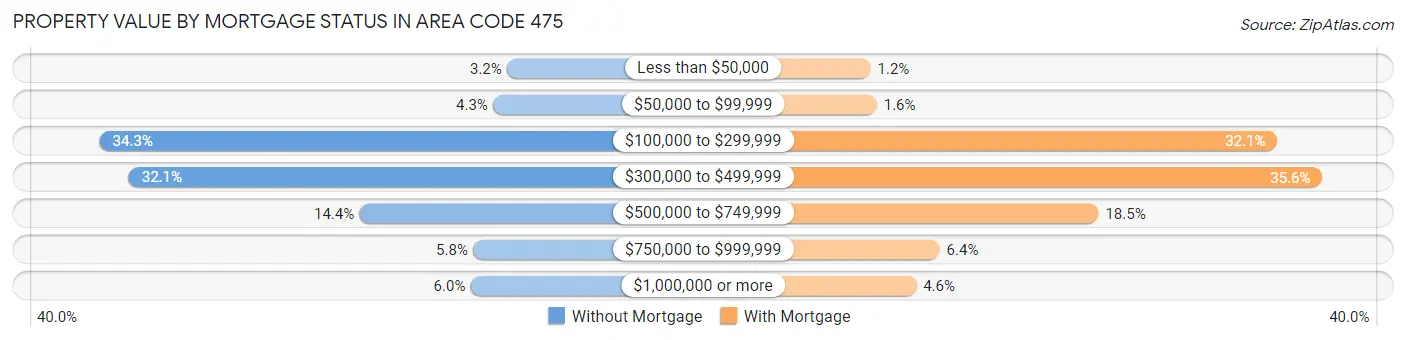
| Property Value | Without Mortgage | With Mortgage |
| Less than $50,000 | 1,262 (3.2%) | 950 (1.1%) |
| $50,000 to $99,999 | 1,681 (4.3%) | 1,334 (1.6%) |
| $100,000 to $299,999 | 13,527 (34.3%) | 26,489 (32.1%) |
| $300,000 to $499,999 | 12,648 (32.1%) | 29,309 (35.6%) |
| $500,000 to $749,999 | 5,699 (14.4%) | 15,256 (18.5%) |
| $750,000 to $999,999 | 2,281 (5.8%) | 5,284 (6.4%) |
| $1,000,000 or more | 2,356 (6.0%) | 3,804 (4.6%) |
| Total | 39,454 (100.0%) | 82,426 (100.0%) |
Household Income by Mortgage Status in Area Code 475
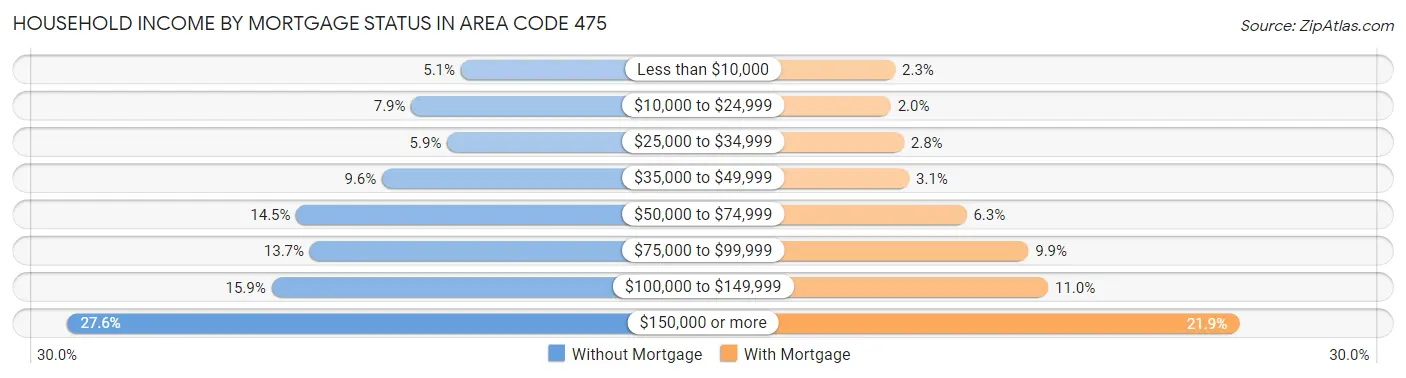
| Household Income | Without Mortgage | With Mortgage |
| Less than $10,000 | 2,000 (5.1%) | 1,862 (2.3%) |
| $10,000 to $24,999 | 3,115 (7.9%) | 1,655 (2.0%) |
| $25,000 to $34,999 | 2,310 (5.9%) | 2,273 (2.8%) |
| $35,000 to $49,999 | 3,777 (9.6%) | 2,522 (3.1%) |
| $50,000 to $74,999 | 5,708 (14.5%) | 5,229 (6.3%) |
| $75,000 to $99,999 | 5,406 (13.7%) | 8,139 (9.9%) |
| $100,000 to $149,999 | 6,270 (15.9%) | 9,070 (11.0%) |
| $150,000 or more | 10,868 (27.6%) | 18,062 (21.9%) |
| Total | 39,454 (100.0%) | 82,426 (100.0%) |
Property Value to Household Income Ratio in Area Code 475
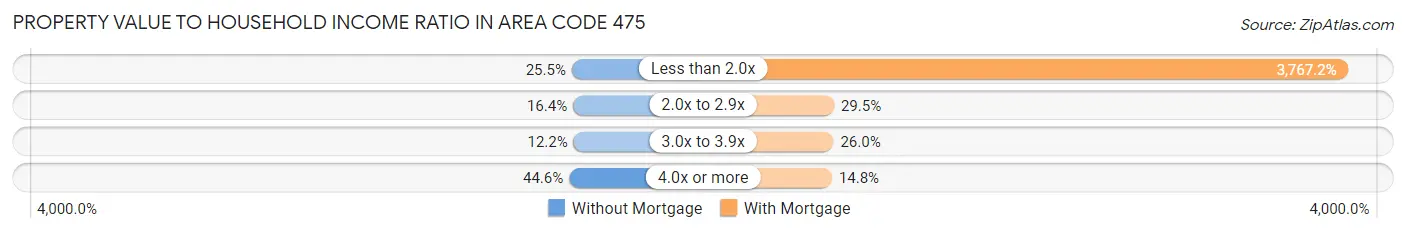
| Value-to-Income Ratio | Without Mortgage | With Mortgage |
| Less than 2.0x | 10,040 (25.5%) | 3,105,148 (3,767.2%) |
| 2.0x to 2.9x | 6,456 (16.4%) | 24,349 (29.5%) |
| 3.0x to 3.9x | 4,813 (12.2%) | 21,422 (26.0%) |
| 4.0x or more | 17,587 (44.6%) | 12,205 (14.8%) |
| Total | 39,454 (100.0%) | 82,426 (100.0%) |
Real Estate Taxes by Mortgage Status in Area Code 475
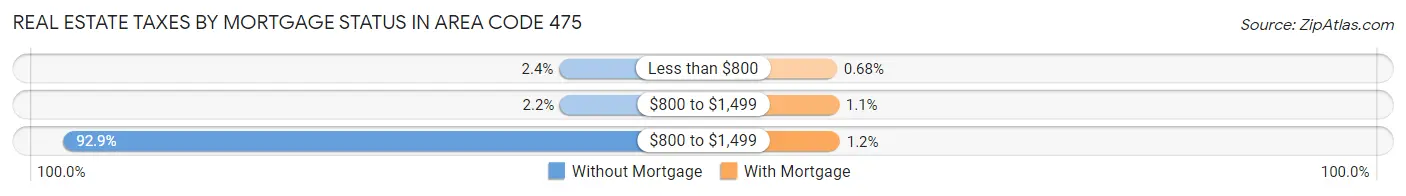
| Property Taxes | Without Mortgage | With Mortgage |
| Less than $800 | 931 (2.4%) | 561 (0.7%) |
| $800 to $1,499 | 859 (2.2%) | 873 (1.1%) |
| $800 to $1,499 | 36,666 (92.9%) | 1,017 (1.2%) |
| Total | 39,454 (100.0%) | 82,426 (100.0%) |
Health & Disability in Area Code 475
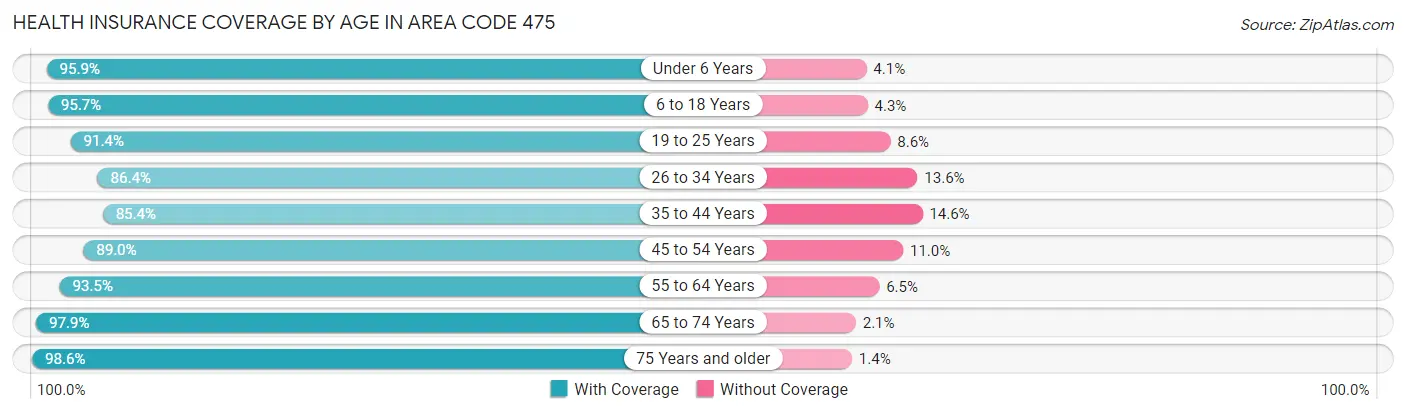
Health Insurance Coverage by Age in Area Code 475
| Age Bracket | With Coverage | Without Coverage |
| Under 6 Years | 39,222 (95.9%) | 1,686 (4.1%) |
| 6 to 18 Years | 91,533 (95.7%) | 4,152 (4.3%) |
| 19 to 25 Years | 60,655 (91.4%) | 5,702 (8.6%) |
| 26 to 34 Years | 68,405 (86.4%) | 10,798 (13.6%) |
| 35 to 44 Years | 66,550 (85.4%) | 11,350 (14.6%) |
| 45 to 54 Years | 67,680 (89.0%) | 8,330 (11.0%) |
| 55 to 64 Years | 74,117 (93.5%) | 5,157 (6.5%) |
| 65 to 74 Years | 48,450 (97.9%) | 1,057 (2.1%) |
| 75 Years and older | 35,335 (98.6%) | 510 (1.4%) |
| Total | 551,947 (91.9%) | 48,742 (8.1%) |
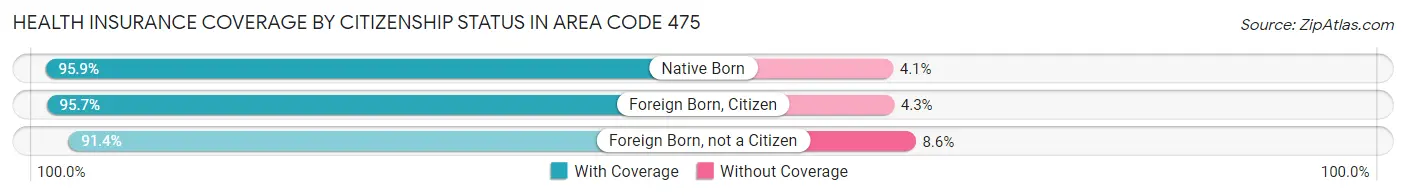
Health Insurance Coverage by Citizenship Status in Area Code 475
| Citizenship Status | With Coverage | Without Coverage |
| Native Born | 39,222 (95.9%) | 1,686 (4.1%) |
| Foreign Born, Citizen | 91,533 (95.7%) | 4,152 (4.3%) |
| Foreign Born, not a Citizen | 60,655 (91.4%) | 5,702 (8.6%) |
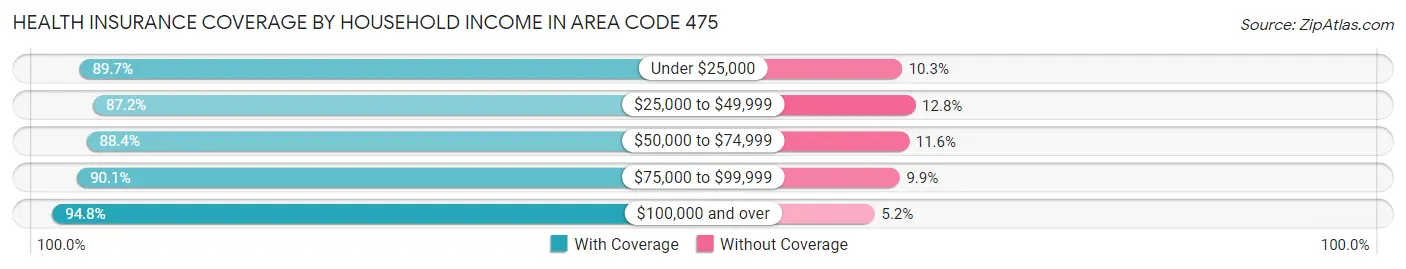
Health Insurance Coverage by Household Income in Area Code 475
| Household Income | With Coverage | Without Coverage |
| Under $25,000 | 62,441 (89.7%) | 7,163 (10.3%) |
| $25,000 to $49,999 | 72,003 (87.2%) | 10,574 (12.8%) |
| $50,000 to $74,999 | 65,692 (88.4%) | 8,627 (11.6%) |
| $75,000 to $99,999 | 59,865 (90.1%) | 6,558 (9.9%) |
| $100,000 and over | 276,527 (94.8%) | 15,163 (5.2%) |
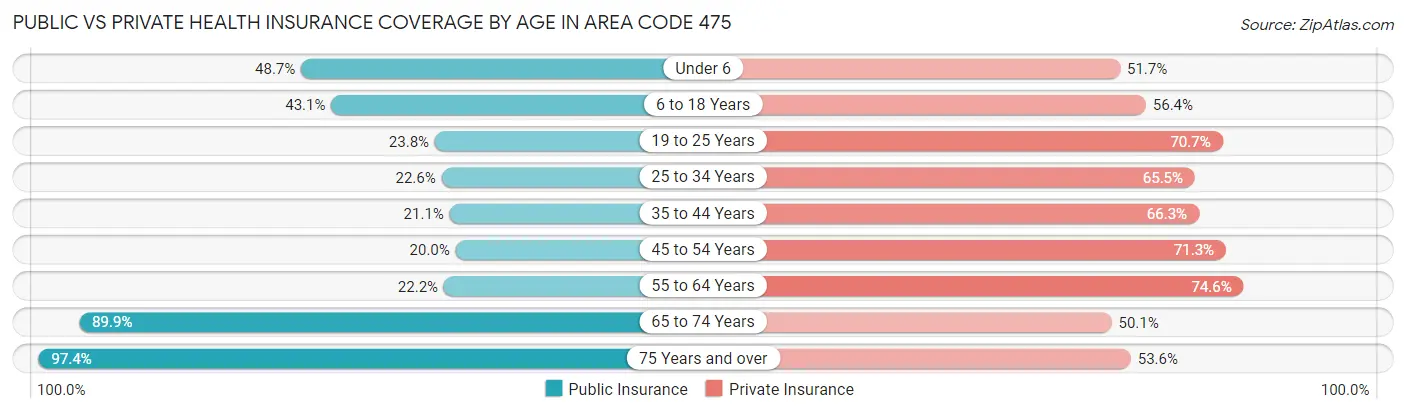
Public vs Private Health Insurance Coverage by Age in Area Code 475
| Age Bracket | Public Insurance | Private Insurance |
| Under 6 | 19,908 (48.7%) | 21,128 (51.6%) |
| 6 to 18 Years | 41,211 (43.1%) | 54,009 (56.4%) |
| 19 to 25 Years | 15,818 (23.8%) | 46,885 (70.7%) |
| 25 to 34 Years | 17,909 (22.6%) | 51,905 (65.5%) |
| 35 to 44 Years | 16,436 (21.1%) | 51,636 (66.3%) |
| 45 to 54 Years | 15,199 (20.0%) | 54,194 (71.3%) |
| 55 to 64 Years | 17,577 (22.2%) | 59,111 (74.6%) |
| 65 to 74 Years | 44,506 (89.9%) | 24,788 (50.1%) |
| 75 Years and over | 34,923 (97.4%) | 19,229 (53.6%) |
| Total | 223,487 (37.2%) | 382,885 (63.7%) |
Disability Status by Sex by Age in Area Code 475
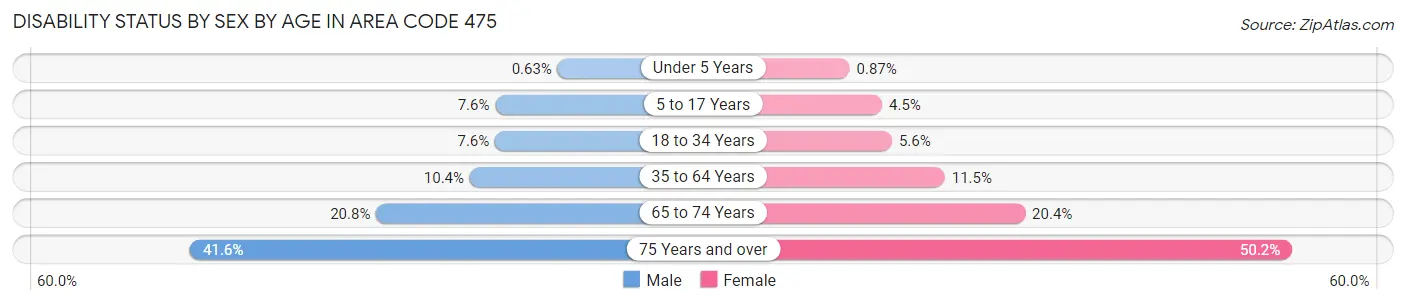
| Age Bracket | Male | Female |
| Under 5 Years | 110 (0.6%) | 144 (0.9%) |
| 5 to 17 Years | 3,506 (7.6%) | 2,100 (4.5%) |
| 18 to 34 Years | 5,848 (7.6%) | 4,367 (5.6%) |
| 35 to 64 Years | 11,888 (10.4%) | 13,652 (11.5%) |
| 65 to 74 Years | 4,965 (20.8%) | 5,245 (20.4%) |
| 75 Years and over | 5,771 (41.6%) | 11,015 (50.1%) |
Disability Class by Sex by Age in Area Code 475
Disability Class: Hearing Difficulty
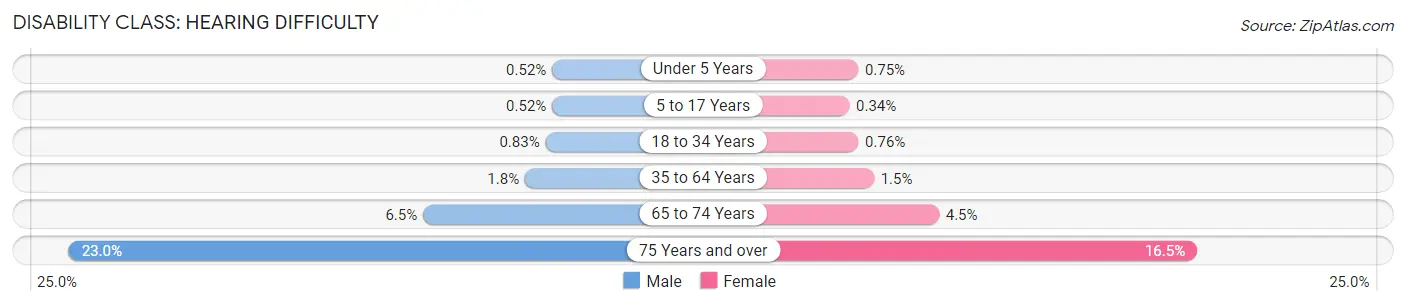
| Age Bracket | Male | Female |
| Under 5 Years | 91 (0.5%) | 124 (0.7%) |
| 5 to 17 Years | 242 (0.5%) | 158 (0.3%) |
| 18 to 34 Years | 638 (0.8%) | 594 (0.8%) |
| 35 to 64 Years | 2,036 (1.8%) | 1,767 (1.5%) |
| 65 to 74 Years | 1,550 (6.5%) | 1,155 (4.5%) |
| 75 Years and over | 3,185 (23.0%) | 3,619 (16.5%) |
Disability Class: Vision Difficulty
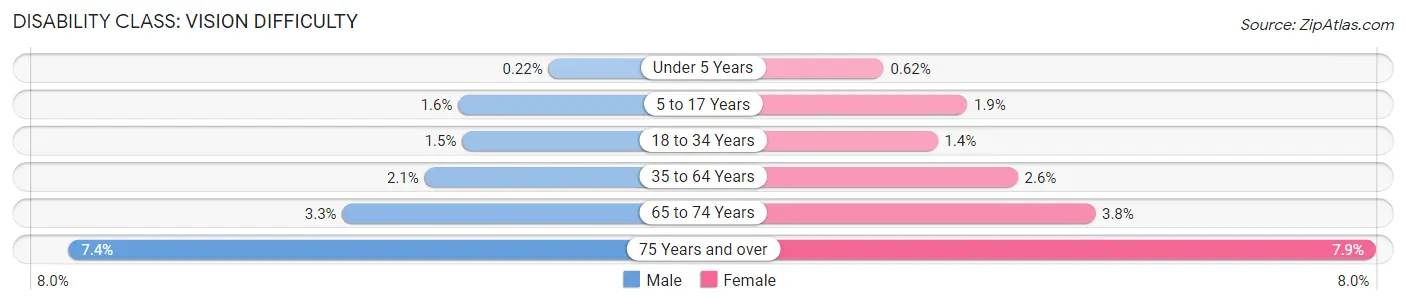
| Age Bracket | Male | Female |
| Under 5 Years | 38 (0.2%) | 103 (0.6%) |
| 5 to 17 Years | 722 (1.6%) | 871 (1.9%) |
| 18 to 34 Years | 1,151 (1.5%) | 1,107 (1.4%) |
| 35 to 64 Years | 2,352 (2.1%) | 3,104 (2.6%) |
| 65 to 74 Years | 782 (3.3%) | 965 (3.8%) |
| 75 Years and over | 1,020 (7.3%) | 1,742 (7.9%) |
Disability Class: Cognitive Difficulty
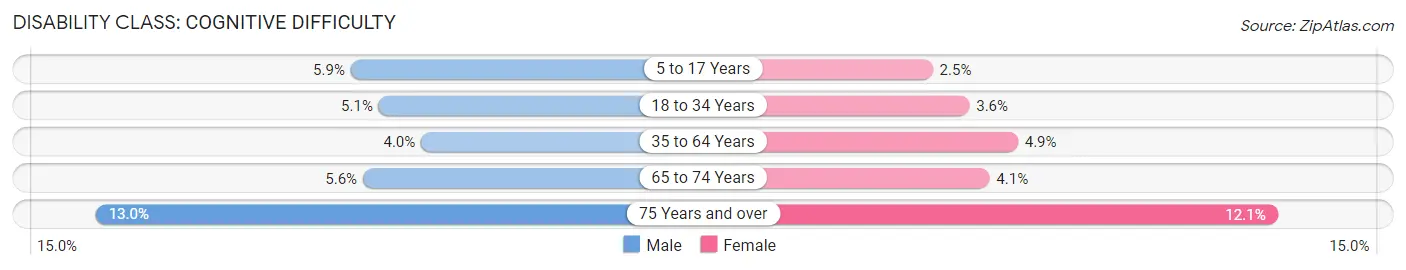
| Age Bracket | Male | Female |
| 5 to 17 Years | 2,738 (5.9%) | 1,186 (2.5%) |
| 18 to 34 Years | 3,956 (5.1%) | 2,774 (3.5%) |
| 35 to 64 Years | 4,518 (4.0%) | 5,833 (4.9%) |
| 65 to 74 Years | 1,329 (5.6%) | 1,055 (4.1%) |
| 75 Years and over | 1,807 (13.0%) | 2,665 (12.1%) |
Disability Class: Ambulatory Difficulty
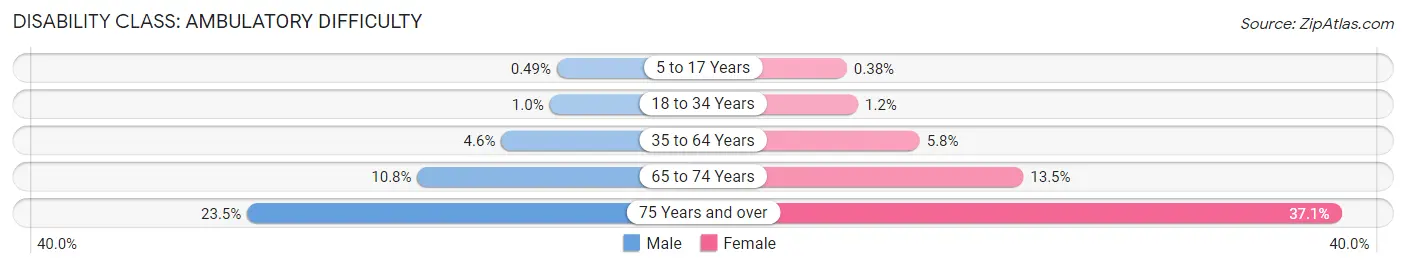
| Age Bracket | Male | Female |
| 5 to 17 Years | 228 (0.5%) | 179 (0.4%) |
| 18 to 34 Years | 790 (1.0%) | 942 (1.2%) |
| 35 to 64 Years | 5,268 (4.6%) | 6,890 (5.8%) |
| 65 to 74 Years | 2,581 (10.8%) | 3,463 (13.5%) |
| 75 Years and over | 3,259 (23.5%) | 8,145 (37.1%) |
Disability Class: Self-Care Difficulty
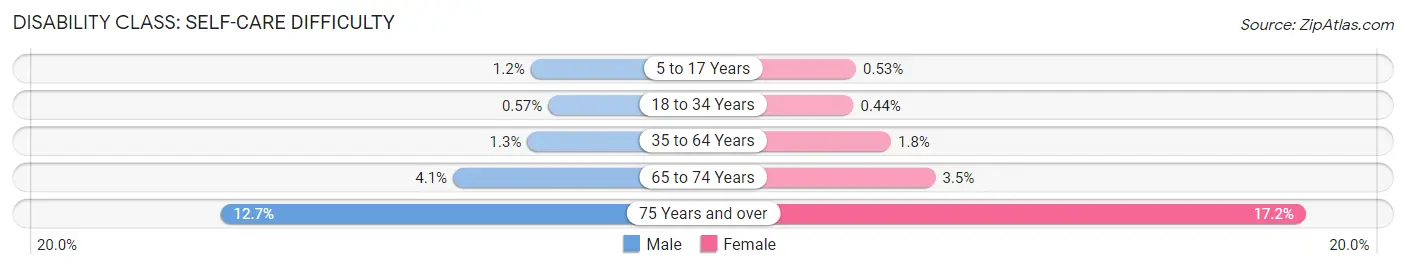
| Age Bracket | Male | Female |
| 5 to 17 Years | 565 (1.2%) | 248 (0.5%) |
| 18 to 34 Years | 438 (0.6%) | 345 (0.4%) |
| 35 to 64 Years | 1,532 (1.3%) | 2,174 (1.8%) |
| 65 to 74 Years | 977 (4.1%) | 894 (3.5%) |
| 75 Years and over | 1,765 (12.7%) | 3,782 (17.2%) |
Technology Access in Area Code 475
Computing Device Access in Area Code 475
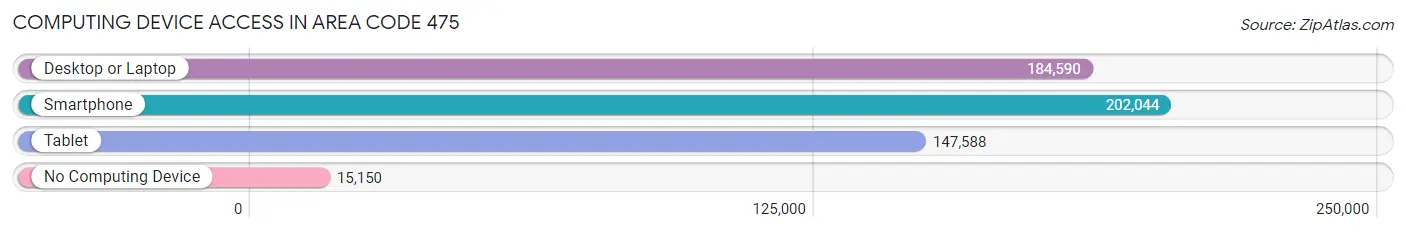
| Device Type | # Households | % Households |
| Desktop or Laptop | 184,590 | 80.0% |
| Smartphone | 202,044 | 87.6% |
| Tablet | 147,588 | 64.0% |
| No Computing Device | 15,150 | 6.6% |
| Total | 230,713 | 100.0% |
Internet Access in Area Code 475
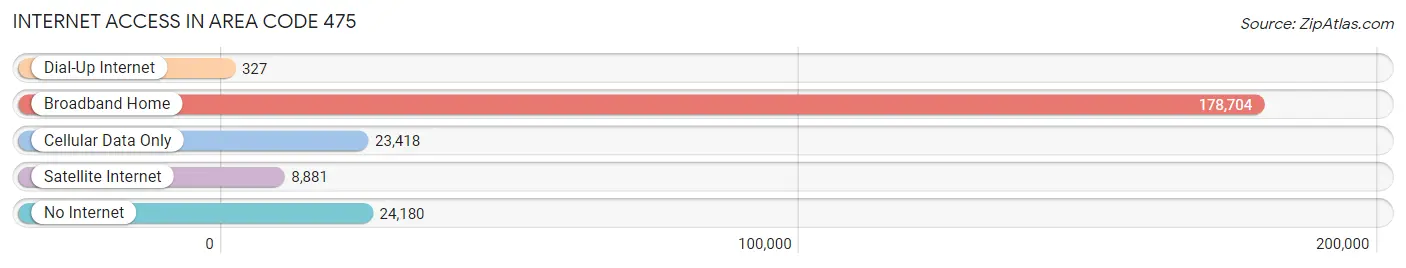
| Internet Type | # Households | % Households |
| Dial-Up Internet | 327 | 0.1% |
| Broadband Home | 178,704 | 77.5% |
| Cellular Data Only | 23,418 | 10.2% |
| Satellite Internet | 8,881 | 3.8% |
| No Internet | 24,180 | 10.5% |
| Total | 230,713 | 100.0% |
Area Code 475 Summary
Geography
Area code 475 is an overlay area code that covers the state of Connecticut. It was created in August 2014 to provide additional telephone numbers for the state.
Social
Area code 475 is a relatively new area code, and as such, it has not yet been widely adopted by the public. It is not yet widely recognized by businesses or individuals, and it is not yet widely used in social media or other forms of communication.
Economics
Area code 475 is not yet widely used in the business world, but it is expected to become more popular as businesses and individuals become more familiar with it. It is expected to provide additional economic opportunities for businesses in Connecticut, as well as providing additional telephone numbers for customers.
Demographics
Area code 475 is not yet widely used by the public, so there is not yet much data available on its demographics. However, it is expected that the area code will be used primarily by individuals and businesses in Connecticut.
Common Questions
What is Per Capita Income in Area Code 475?
Per Capita income in Area Code 475 is $44,687.
What is the Median Family Income in Area Code 475?
Median Family Income in Area Code 475 is $103,612.
What is the Median Household income in Area Code 475?
Median Household Income in Area Code 475 is $84,515.
What is Income or Wage Gap in Area Code 475?
Income or Wage Gap in Area Code 475 is 22.9%.
Women in Area Code 475 earn 77.1 cents for every dollar earned by a man.
What is Family Income Deficit in Area Code 475?
Family Income Deficit in Area Code 475 is $11,310.
Families that are below poverty line in Area Code 475 earn $11,310 less on average than the poverty threshold level.
What is Inequality or Gini Index in Area Code 475?
Inequality or Gini Index in Area Code 475 is 11.29.
What is the Total Population of Area Code 475?
Total Population of Area Code 475 is 606,991.
What is the Total Male Population of Area Code 475?
Total Male Population of Area Code 475 is 296,635.
What is the Total Female Population of Area Code 475?
Total Female Population of Area Code 475 is 310,356.
What is the Ratio of Males per 100 Females in Area Code 475?
There are 95.58 Males per 100 Females in Area Code 475.
What is the Ratio of Females per 100 Males in Area Code 475?
There are 104.63 Females per 100 Males in Area Code 475.
What is the Median Population Age in Area Code 475?
Median Population Age in Area Code 475 is 38.8 Years.
What is the Average Family Size in Area Code 475
Average Family Size in Area Code 475 is 3.1 People.
What is the Average Household Size in Area Code 475
Average Household Size in Area Code 475 is 2.5 People.
How Large is the Labor Force in Area Code 475?
There are 324,114 People in the Labor Forcein in Area Code 475.
What is the Percentage of People in the Labor Force in Area Code 475?
65.5% of People are in the Labor Force in Area Code 475.
What is the Unemployment Rate in Area Code 475?
Unemployment Rate in Area Code 475 is 7.9%.