Area Code 203 Map & Demographics
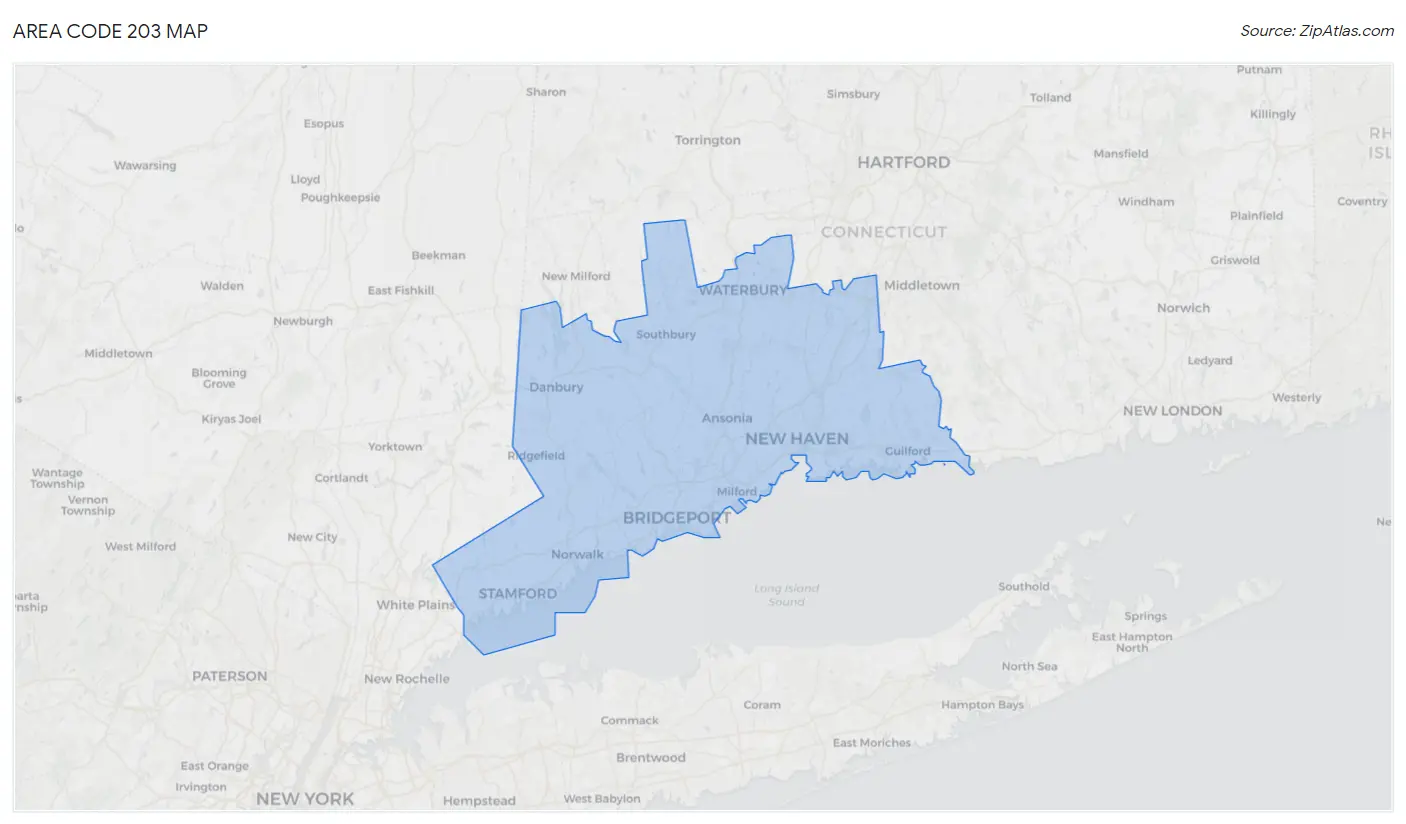
Area Code 203 Map
Area Code 203 Overview
$62,239
PER CAPITA INCOME
$137,981
AVG FAMILY INCOME
$117,780
AVG HOUSEHOLD INCOME
30.1%
WAGE / INCOME GAP [ % ]
69.9¢/ $1
WAGE / INCOME GAP [ $ ]
$11,144
FAMILY INCOME DEFICIT
40.48
INEQUALITY / GINI INDEX
1,834,539
TOTAL POPULATION
895,751
MALE POPULATION
938,788
FEMALE POPULATION
95.42
MALES / 100 FEMALES
104.80
FEMALES / 100 MALES
42.1
MEDIAN AGE
3.2
AVG FAMILY SIZE
2.6
AVG HOUSEHOLD SIZE
983,906
LABOR FORCE [ PEOPLE ]
65.9%
PERCENT IN LABOR FORCE
6.2%
UNEMPLOYMENT RATE
Income in Area Code 203
Income Overview in Area Code 203
Per Capita Income in Area Code 203 is $62,239, while median incomes of families and households are $137,981 and $117,780 respectively.
| Characteristic | Number | Measure |
| Per Capita Income | 1,834,539 | $62,239 |
| Median Family Income | 457,211 | $137,981 |
| Mean Family Income | 457,211 | $16,696,617 |
| Median Household Income | 698,702 | $117,780 |
| Mean Household Income | 698,702 | $14,404,019 |
| Income Deficit | 457,211 | $11,144 |
| Wage / Income Gap (%) | 1,834,539 | 30.14% |
| Wage / Income Gap ($) | 1,834,539 | 69.86¢ per $1 |
| Gini / Inequality Index | 1,834,539 | 40.48 |
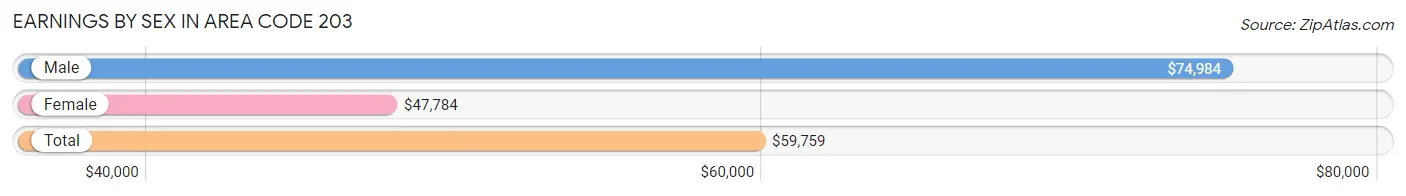
Earnings by Sex in Area Code 203
Average Earnings in Area Code 203 are $59,759, $74,984 for men and $47,784 for women, a difference of 36.3%.
| Sex | Number | Average Earnings |
| Male | 531,373 (51.7%) | $74,984 |
| Female | 496,636 (48.3%) | $47,784 |
| Total | 1,028,009 (100.0%) | $59,759 |
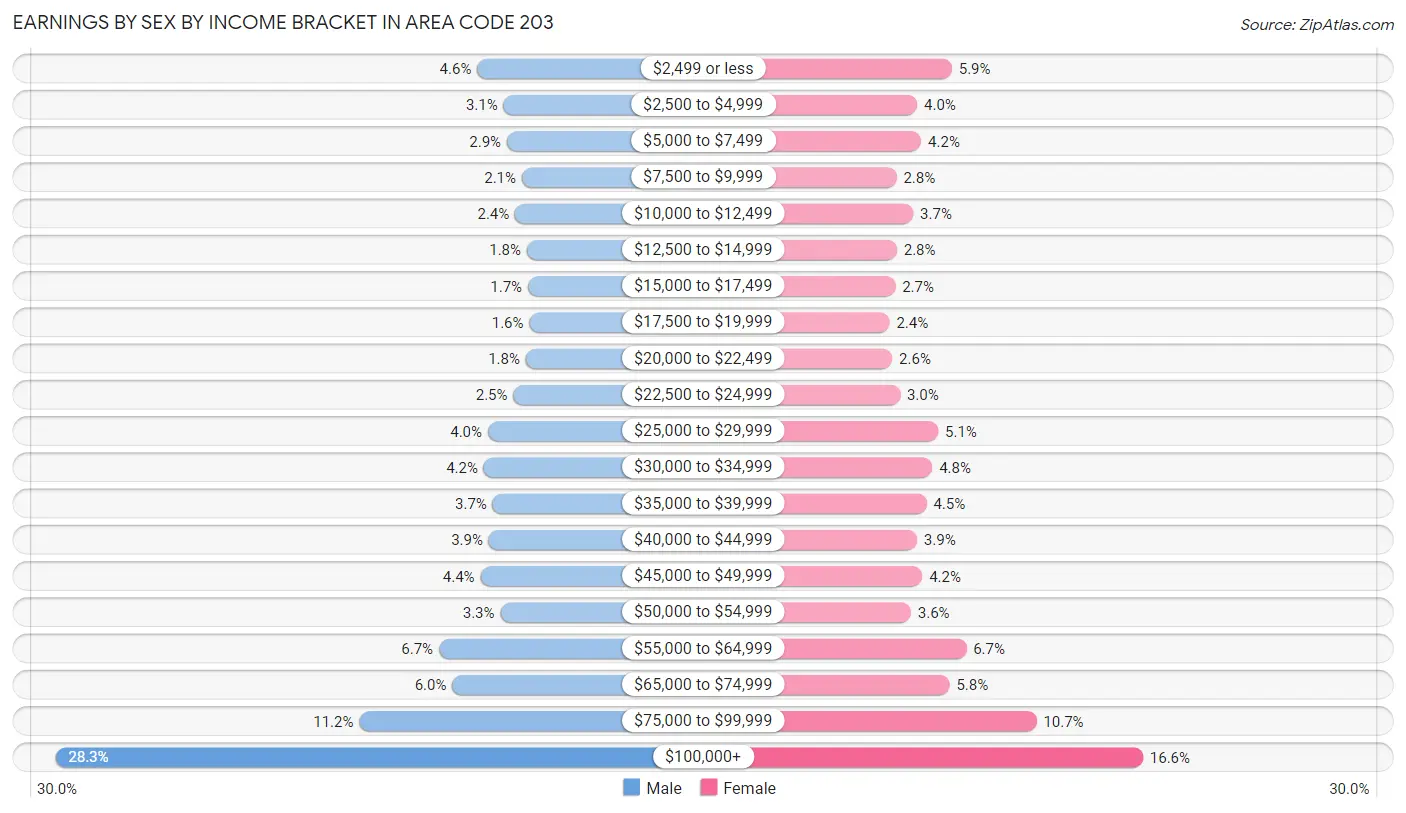
Earnings by Sex by Income Bracket in Area Code 203
The most common earnings brackets in Area Code 203 are $100,000+ for men (150,228 | 28.3%) and $100,000+ for women (82,627 | 16.6%).
| Income | Male | Female |
| $2,499 or less | 24,209 (4.6%) | 29,300 (5.9%) |
| $2,500 to $4,999 | 16,372 (3.1%) | 19,627 (4.0%) |
| $5,000 to $7,499 | 15,359 (2.9%) | 20,760 (4.2%) |
| $7,500 to $9,999 | 10,875 (2.1%) | 13,873 (2.8%) |
| $10,000 to $12,499 | 12,920 (2.4%) | 18,548 (3.7%) |
| $12,500 to $14,999 | 9,430 (1.8%) | 13,973 (2.8%) |
| $15,000 to $17,499 | 9,077 (1.7%) | 13,501 (2.7%) |
| $17,500 to $19,999 | 8,643 (1.6%) | 11,919 (2.4%) |
| $20,000 to $22,499 | 9,702 (1.8%) | 12,689 (2.5%) |
| $22,500 to $24,999 | 13,425 (2.5%) | 14,825 (3.0%) |
| $25,000 to $29,999 | 21,056 (4.0%) | 25,463 (5.1%) |
| $30,000 to $34,999 | 22,258 (4.2%) | 23,827 (4.8%) |
| $35,000 to $39,999 | 19,625 (3.7%) | 22,262 (4.5%) |
| $40,000 to $44,999 | 20,777 (3.9%) | 19,560 (3.9%) |
| $45,000 to $49,999 | 23,284 (4.4%) | 21,061 (4.2%) |
| $50,000 to $54,999 | 17,311 (3.3%) | 17,887 (3.6%) |
| $55,000 to $64,999 | 35,664 (6.7%) | 33,331 (6.7%) |
| $65,000 to $74,999 | 31,673 (6.0%) | 28,663 (5.8%) |
| $75,000 to $99,999 | 59,485 (11.2%) | 52,940 (10.7%) |
| $100,000+ | 150,228 (28.3%) | 82,627 (16.6%) |
| Total | 531,373 (100.0%) | 496,636 (100.0%) |
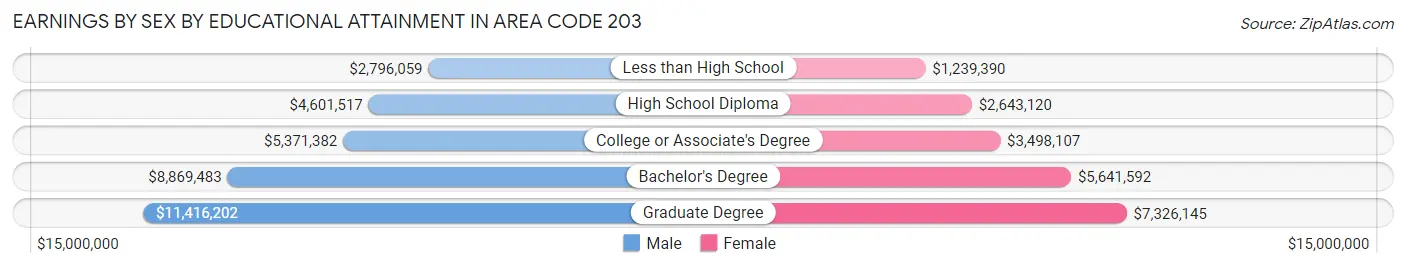
Earnings by Sex by Educational Attainment in Area Code 203
Average earnings in Area Code 203 are $7,649,486 for men and $4,959,723 for women, a difference of 35.2%. Men with an educational attainment of graduate degree enjoy the highest average annual earnings of $11,416,202, while those with less than high school education earn the least with $2,796,059. Women with an educational attainment of graduate degree earn the most with the average annual earnings of $7,326,145, while those with less than high school education have the smallest earnings of $1,239,390.
| Educational Attainment | Male Income | Female Income |
| Less than High School | $2,796,059 | $1,239,390 |
| High School Diploma | $4,601,517 | $2,643,120 |
| College or Associate's Degree | $5,371,382 | $3,498,107 |
| Bachelor's Degree | $8,869,483 | $5,641,592 |
| Graduate Degree | $11,416,202 | $7,326,145 |
| Total | $7,649,486 | $4,959,723 |
Family Income in Area Code 203
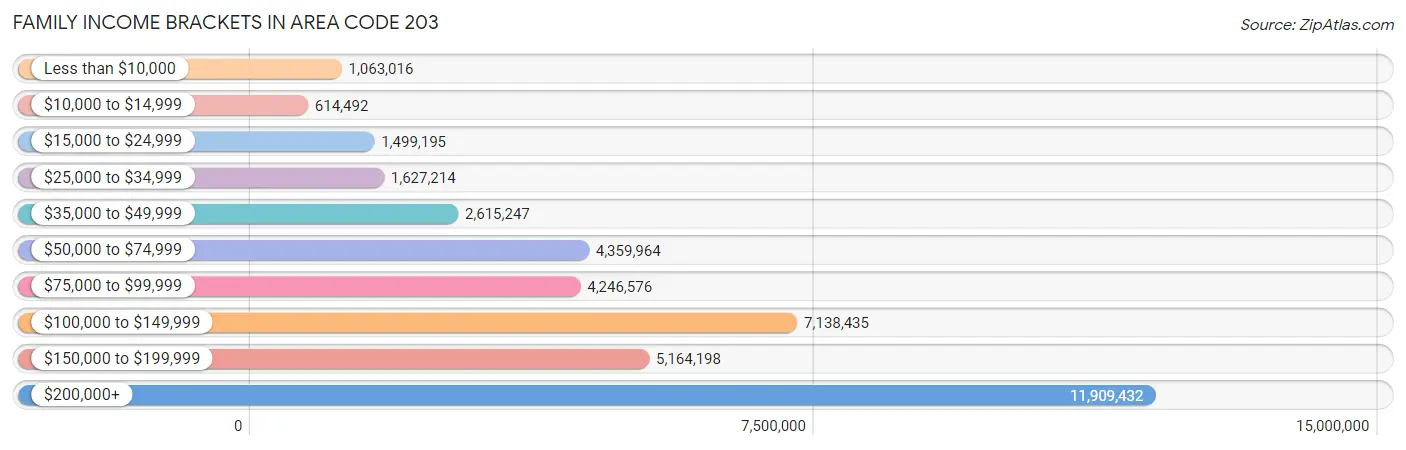
Family Income Brackets in Area Code 203
According to the Area Code 203 family income data, there are 11,909,432 families falling into the $200,000+ income range, which is the most common income bracket and makes up 2,604.8% of all families. Conversely, the $10,000 to $14,999 income bracket is the least frequent group with only 614,492 families (134.4%) belonging to this category.
| Income Bracket | # Families | % Families |
| Less than $10,000 | 1,063,016 | 232.5% |
| $10,000 to $14,999 | 614,492 | 134.4% |
| $15,000 to $24,999 | 1,499,195 | 327.9% |
| $25,000 to $34,999 | 1,627,214 | 355.9% |
| $35,000 to $49,999 | 2,615,247 | 572.0% |
| $50,000 to $74,999 | 4,359,964 | 953.6% |
| $75,000 to $99,999 | 4,246,576 | 928.8% |
| $100,000 to $149,999 | 7,138,435 | 1,561.3% |
| $150,000 to $199,999 | 5,164,198 | 1,129.5% |
| $200,000+ | 11,909,432 | 2,604.8% |
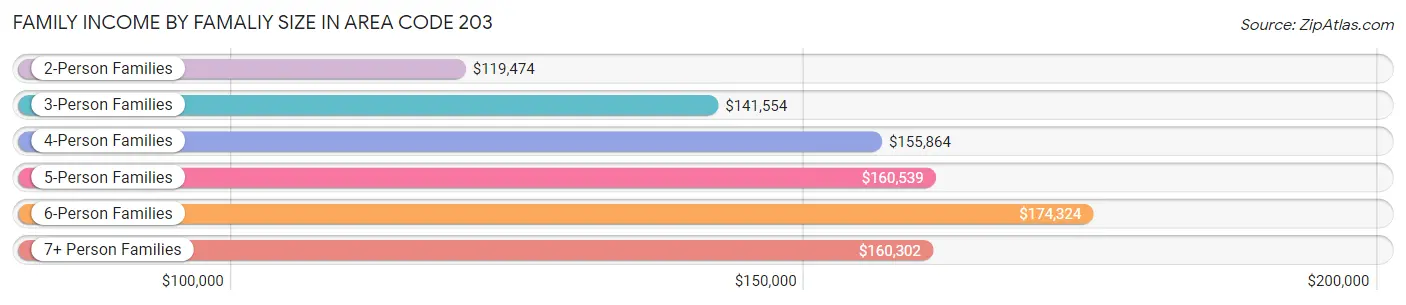
Family Income by Famaliy Size in Area Code 203
6-person families (10,256 | 2.2%) account for the highest median family income in Area Code 203 with $174,324 per family, while 2-person families (201,293 | 44.0%) have the highest median income of $59,737 per family member.
| Income Bracket | # Families | Median Income |
| 2-Person Families | 201,293 (44.0%) | $119,474 |
| 3-Person Families | 111,643 (24.4%) | $141,554 |
| 4-Person Families | 90,758 (19.9%) | $155,864 |
| 5-Person Families | 37,856 (8.3%) | $160,539 |
| 6-Person Families | 10,256 (2.2%) | $174,324 |
| 7+ Person Families | 5,405 (1.2%) | $160,302 |
| Total | 457,211 (100.0%) | $137,981 |
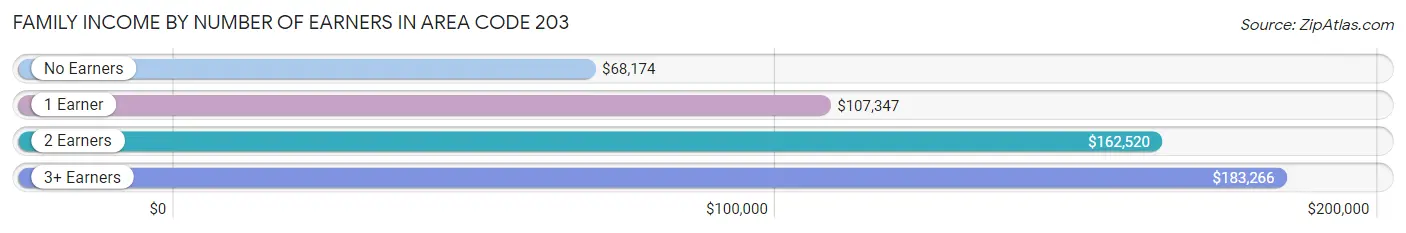
Family Income by Number of Earners in Area Code 203
The median family income in Area Code 203 is $137,981, with families comprising 3+ earners (64,039) having the highest median family income of $183,266, while families with no earners (53,710) have the lowest median family income of $68,174, accounting for 14.0% and 11.7% of families, respectively.
| Number of Earners | # Families | Median Income |
| No Earners | 53,710 (11.7%) | $68,174 |
| 1 Earner | 138,202 (30.2%) | $107,347 |
| 2 Earners | 201,260 (44.0%) | $162,520 |
| 3+ Earners | 64,039 (14.0%) | $183,266 |
| Total | 457,211 (100.0%) | $137,981 |
Household Income in Area Code 203
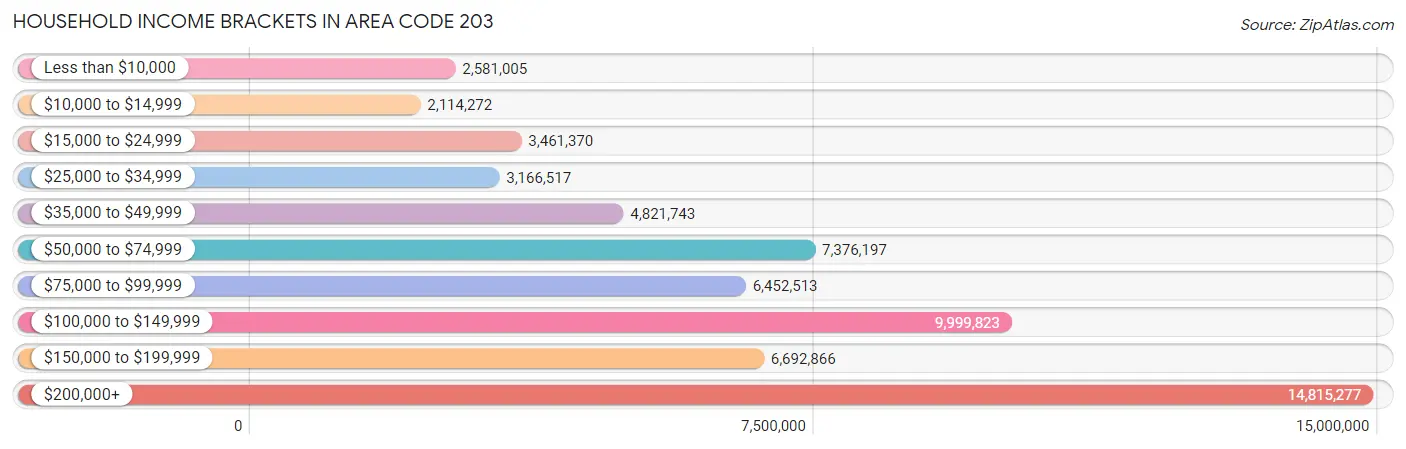
Household Income Brackets in Area Code 203
With 14,815,277 households falling in the category, the $200,000+ income range is the most frequent in Area Code 203, accounting for 2,120.4% of all households. In contrast, only 2,114,272 households (302.6%) fall into the $10,000 to $14,999 income bracket, making it the least populous group.
| Income Bracket | # Households | % Households |
| Less than $10,000 | 2,581,005 | 369.4% |
| $10,000 to $14,999 | 2,114,272 | 302.6% |
| $15,000 to $24,999 | 3,461,370 | 495.4% |
| $25,000 to $34,999 | 3,166,517 | 453.2% |
| $35,000 to $49,999 | 4,821,743 | 690.1% |
| $50,000 to $74,999 | 7,376,197 | 1,055.7% |
| $75,000 to $99,999 | 6,452,513 | 923.5% |
| $100,000 to $149,999 | 9,999,823 | 1,431.2% |
| $150,000 to $199,999 | 6,692,866 | 957.9% |
| $200,000+ | 14,815,277 | 2,120.4% |
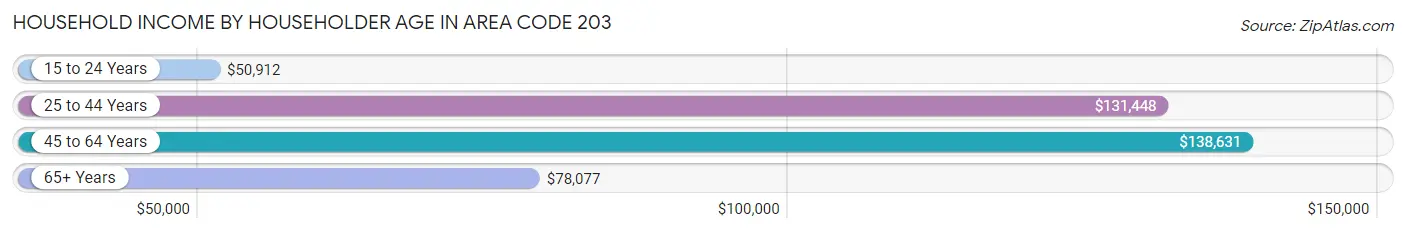
Household Income by Householder Age in Area Code 203
The median household income in Area Code 203 is $117,780, with the highest median household income of $138,631 found in the 45 to 64 years age bracket for the primary householder. A total of 286,717 households (41.0%) fall into this category. Meanwhile, the 15 to 24 years age bracket for the primary householder has the lowest median household income of $50,912, with 15,346 households (2.2%) in this group.
| Income Bracket | # Households | Median Income |
| 15 to 24 Years | 15,346 (2.2%) | $50,912 |
| 25 to 44 Years | 204,720 (29.3%) | $131,448 |
| 45 to 64 Years | 286,717 (41.0%) | $138,631 |
| 65+ Years | 191,919 (27.5%) | $78,077 |
| Total | 698,702 (100.0%) | $117,780 |
Poverty in Area Code 203
Income Below Poverty by Sex and Age in Area Code 203
With 9.3% poverty level for males and 11.6% for females among the residents of Area Code 203, 5 year old males and 18 to 24 year old females are the most vulnerable to poverty, with 1,986 males (17.9%) and 12,685 females (17.5%) in their respective age groups living below the poverty level.
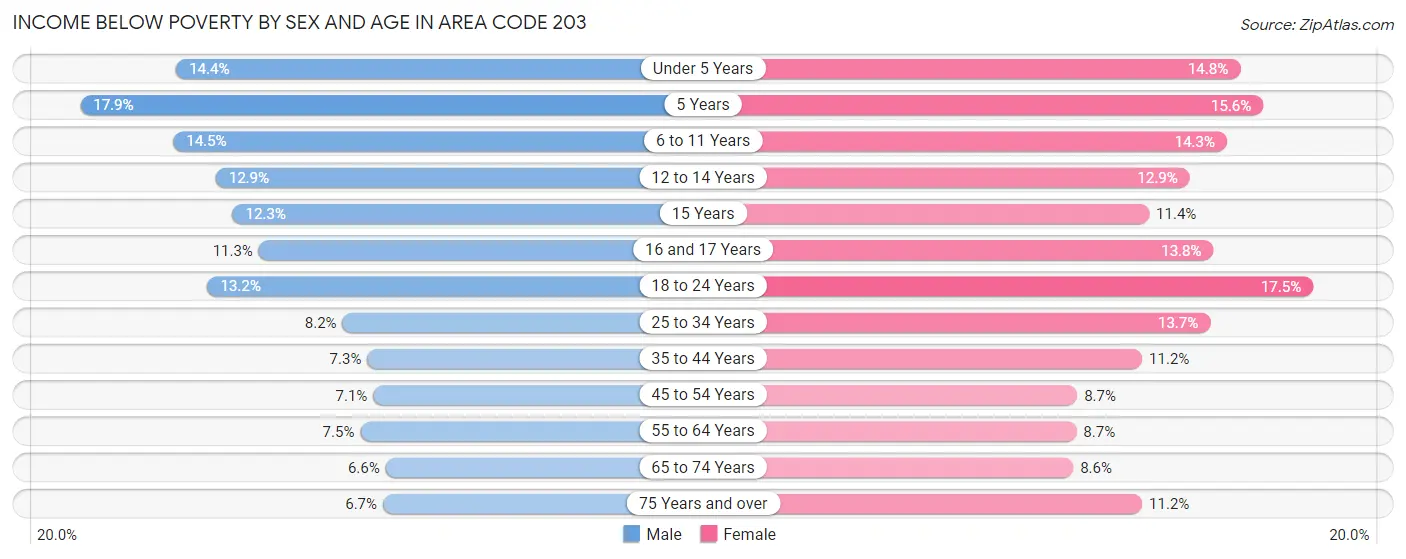
| Age Bracket | Male | Female |
| Under 5 Years | 6,930 (14.4%) | 6,733 (14.8%) |
| 5 Years | 1,986 (17.9%) | 1,532 (15.6%) |
| 6 to 11 Years | 9,157 (14.5%) | 8,780 (14.3%) |
| 12 to 14 Years | 4,725 (12.9%) | 4,460 (12.9%) |
| 15 Years | 1,567 (12.3%) | 1,496 (11.4%) |
| 16 and 17 Years | 2,786 (11.3%) | 3,159 (13.8%) |
| 18 to 24 Years | 9,980 (13.2%) | 12,685 (17.5%) |
| 25 to 34 Years | 9,131 (8.2%) | 15,175 (13.7%) |
| 35 to 44 Years | 8,044 (7.3%) | 12,878 (11.2%) |
| 45 to 54 Years | 8,438 (7.1%) | 11,060 (8.7%) |
| 55 to 64 Years | 9,600 (7.5%) | 11,716 (8.7%) |
| 65 to 74 Years | 5,392 (6.6%) | 8,011 (8.6%) |
| 75 Years and over | 3,471 (6.7%) | 8,264 (11.2%) |
| Total | 81,207 (9.3%) | 105,949 (11.6%) |
Income Above Poverty by Sex and Age in Area Code 203
According to the poverty statistics in Area Code 203, males aged 65 to 74 years and females aged 65 to 74 years are the age groups that are most secure financially, with 93.4% of males and 91.4% of females in these age groups living above the poverty line.
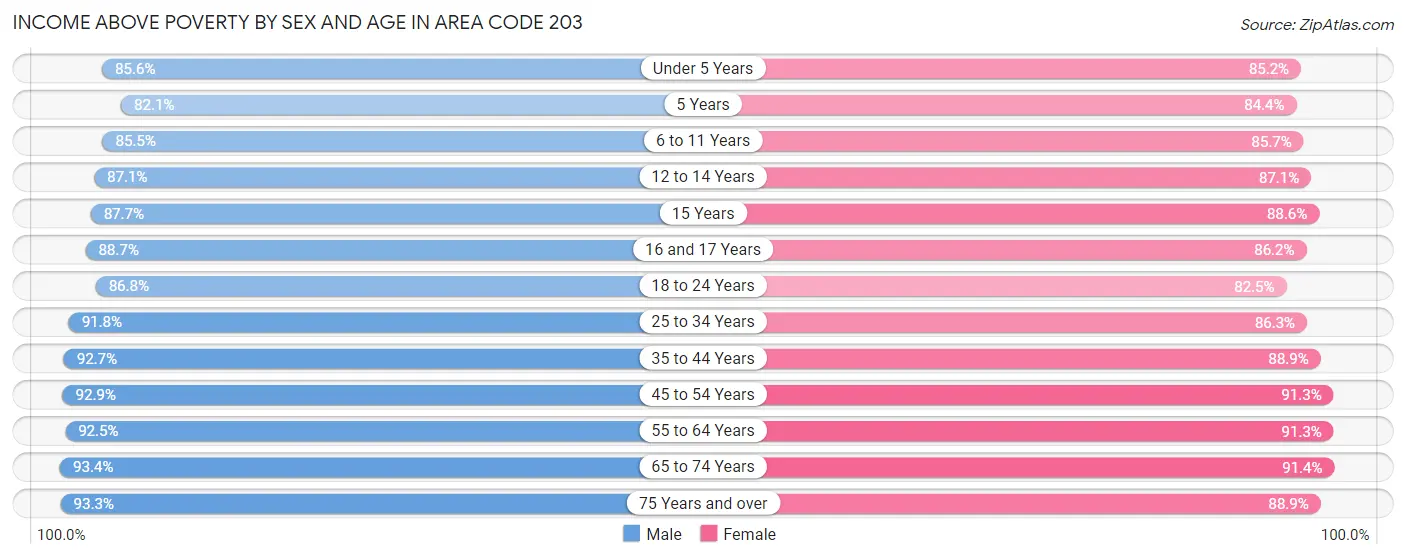
| Age Bracket | Male | Female |
| Under 5 Years | 41,309 (85.6%) | 38,811 (85.2%) |
| 5 Years | 9,091 (82.1%) | 8,261 (84.4%) |
| 6 to 11 Years | 54,089 (85.5%) | 52,666 (85.7%) |
| 12 to 14 Years | 31,910 (87.1%) | 30,093 (87.1%) |
| 15 Years | 11,190 (87.7%) | 11,617 (88.6%) |
| 16 and 17 Years | 21,852 (88.7%) | 19,755 (86.2%) |
| 18 to 24 Years | 65,597 (86.8%) | 59,856 (82.5%) |
| 25 to 34 Years | 102,252 (91.8%) | 95,814 (86.3%) |
| 35 to 44 Years | 102,467 (92.7%) | 102,648 (88.8%) |
| 45 to 54 Years | 111,009 (92.9%) | 115,440 (91.3%) |
| 55 to 64 Years | 117,705 (92.5%) | 122,743 (91.3%) |
| 65 to 74 Years | 76,359 (93.4%) | 85,279 (91.4%) |
| 75 Years and over | 48,299 (93.3%) | 65,881 (88.8%) |
| Total | 793,129 (90.7%) | 808,864 (88.4%) |
Income Below Poverty Among Married-Couple Families in Area Code 203
The poverty statistics for married-couple families in Area Code 203 show that 3.2% or 10,833 of the total 335,702 families live below the poverty line. Families with 5 or more children have the highest poverty rate of 19.0%, comprising of 211 families. On the other hand, families with no children have the lowest poverty rate of 2.5%, which includes 4,907 families.
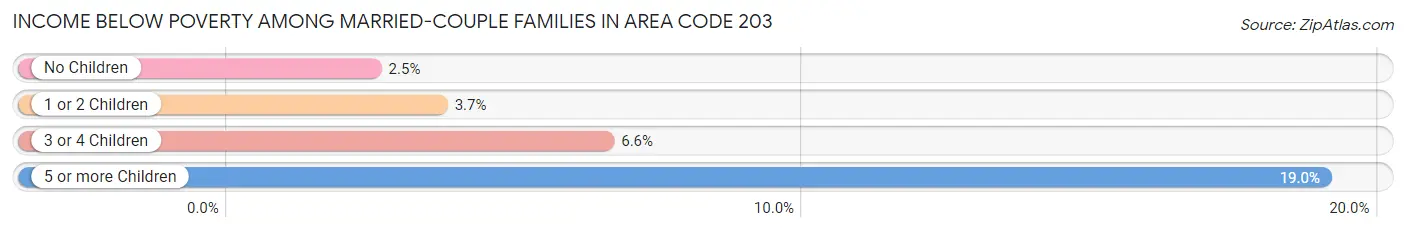
| Children | Above Poverty | Below Poverty |
| No Children | 191,090 (97.5%) | 4,907 (2.5%) |
| 1 or 2 Children | 111,764 (96.4%) | 4,235 (3.6%) |
| 3 or 4 Children | 21,118 (93.4%) | 1,480 (6.6%) |
| 5 or more Children | 897 (81.0%) | 211 (19.0%) |
| Total | 324,869 (96.8%) | 10,833 (3.2%) |
Income Below Poverty Among Single-Parent Households in Area Code 203
According to the poverty data in Area Code 203, 11.6% or 3,803 single-father households and 20.6% or 18,293 single-mother households are living below the poverty line. Among single-father households, those with 5 or more children have the highest poverty rate, with 73 households (36.1%) experiencing poverty. Likewise, among single-mother households, those with 5 or more children have the highest poverty rate, with 400 households (75.0%) falling below the poverty line.
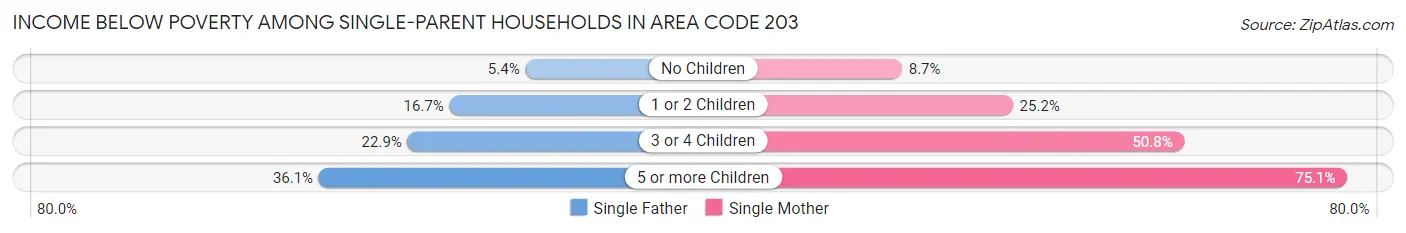
| Children | Single Father | Single Mother |
| No Children | 871 (5.4%) | 3,310 (8.7%) |
| 1 or 2 Children | 2,333 (16.7%) | 10,640 (25.2%) |
| 3 or 4 Children | 526 (22.9%) | 3,943 (50.8%) |
| 5 or more Children | 73 (36.1%) | 400 (75.0%) |
| Total | 3,803 (11.6%) | 18,293 (20.6%) |
Income Below Poverty Among Married-Couple vs Single-Parent Households in Area Code 203
The poverty data for Area Code 203 shows that 10,833 of the married-couple family households (3.2%) and 22,096 of the single-parent households (18.2%) are living below the poverty level. Within the married-couple family households, those with 5 or more children have the highest poverty rate, with 211 households (19.0%) falling below the poverty line. Among the single-parent households, those with 5 or more children have the highest poverty rate, with 473 household (64.3%) living below poverty.
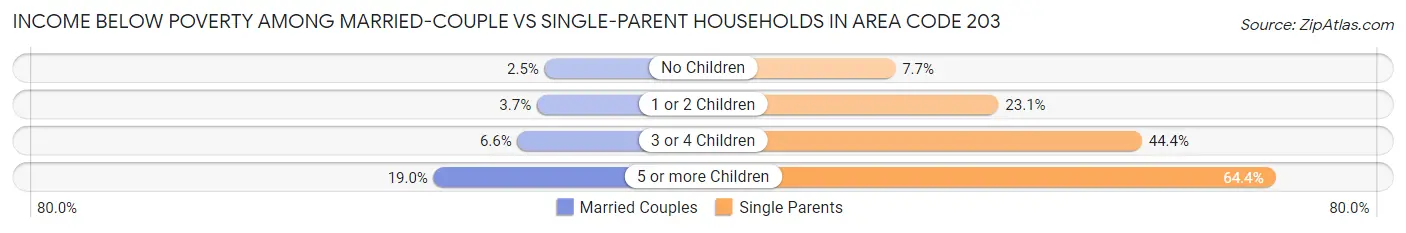
| Children | Married-Couple Families | Single-Parent Households |
| No Children | 4,907 (2.5%) | 4,181 (7.7%) |
| 1 or 2 Children | 4,235 (3.6%) | 12,973 (23.1%) |
| 3 or 4 Children | 1,480 (6.6%) | 4,469 (44.4%) |
| 5 or more Children | 211 (19.0%) | 473 (64.3%) |
| Total | 10,833 (3.2%) | 22,096 (18.2%) |
Race in Area Code 203
The most populous races in Area Code 203 are White / Caucasian (1,218,595 | 66.4%), Hispanic or Latino (365,389 | 19.9%), and Black / African American (223,313 | 12.2%).
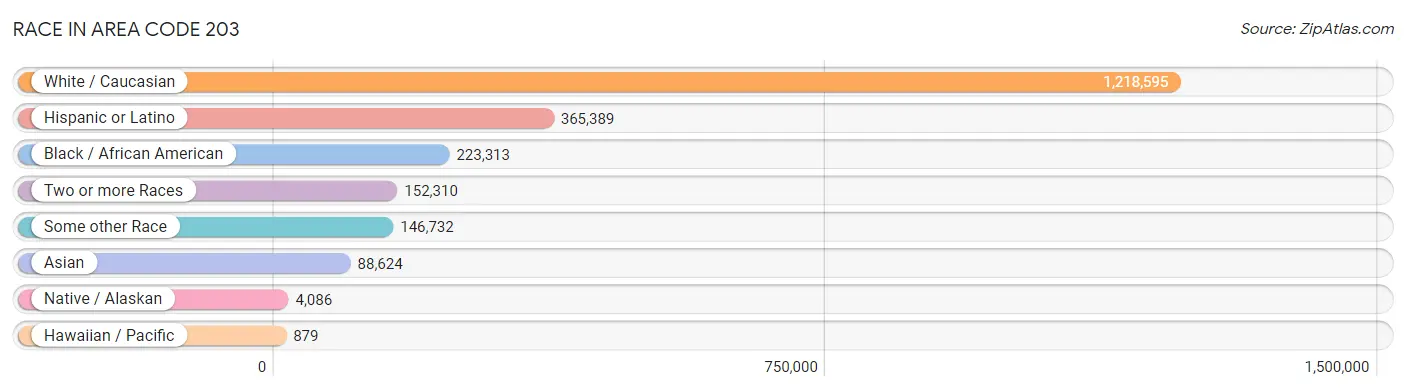
| Race | # Population | % Population |
| Asian | 88,624 | 4.8% |
| Black / African American | 223,313 | 12.2% |
| Hawaiian / Pacific | 879 | 0.1% |
| Hispanic or Latino | 365,389 | 19.9% |
| Native / Alaskan | 4,086 | 0.2% |
| White / Caucasian | 1,218,595 | 66.4% |
| Two or more Races | 152,310 | 8.3% |
| Some other Race | 146,732 | 8.0% |
| Total | 1,834,539 | 100.0% |
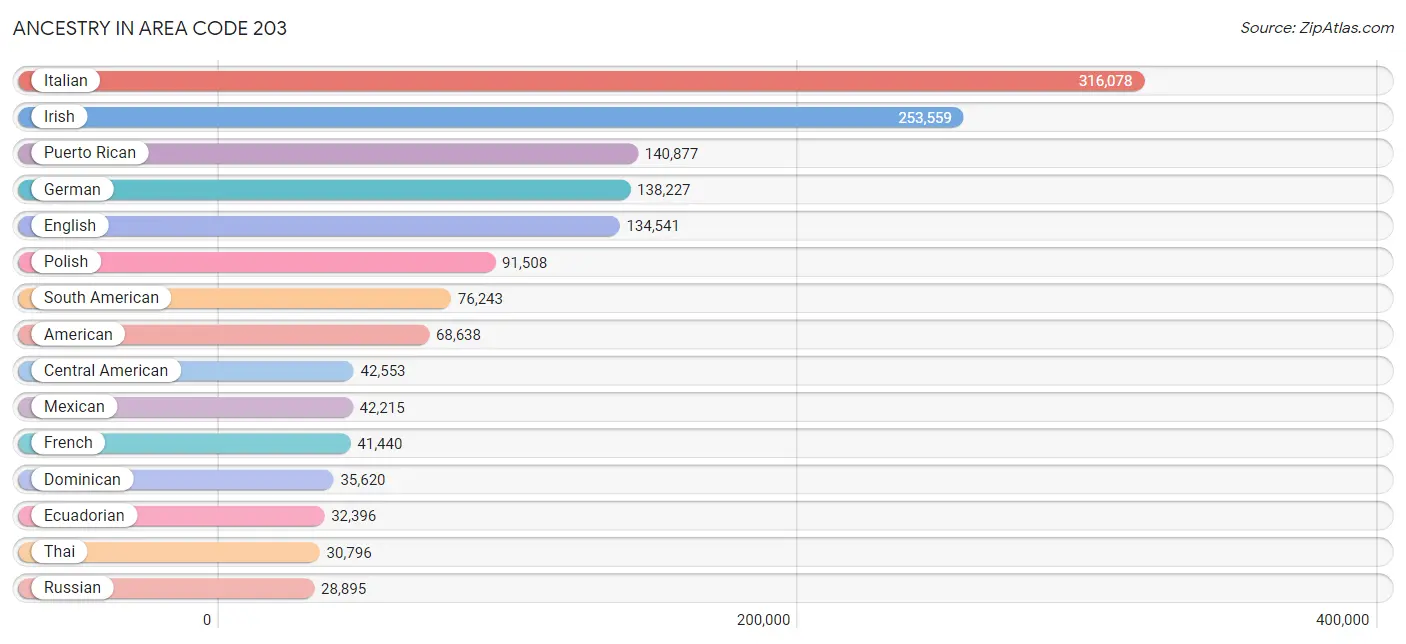
Ancestry in Area Code 203
The most populous ancestries reported in Area Code 203 are Italian (316,078 | 17.2%), Irish (253,559 | 13.8%), Puerto Rican (140,877 | 7.7%), German (138,227 | 7.5%), and English (134,541 | 7.3%), together accounting for 53.6% of all Area Code 203 residents.
| Ancestry | # Population | % Population |
| Afghan | 1,785 | 0.1% |
| African | 10,128 | 0.5% |
| Albanian | 6,962 | 0.4% |
| Alsatian | 68 | 0.0% |
| American | 68,638 | 3.7% |
| Apache | 19 | 0.0% |
| Arab | 15,569 | 0.9% |
| Argentinean | 4,075 | 0.2% |
| Armenian | 2,673 | 0.2% |
| Assyrian / Chaldean / Syriac | 30 | 0.0% |
| Australian | 1,034 | 0.1% |
| Austrian | 6,256 | 0.3% |
| Bahamian | 319 | 0.0% |
| Barbadian | 1,262 | 0.1% |
| Basque | 145 | 0.0% |
| Belgian | 1,062 | 0.1% |
| Belizean | 263 | 0.0% |
| Bermudan | 84 | 0.0% |
| Bhutanese | 3,611 | 0.2% |
| Blackfeet | 672 | 0.0% |
| Bolivian | 901 | 0.1% |
| Brazilian | 20,615 | 1.1% |
| British | 9,328 | 0.5% |
| British West Indian | 1,718 | 0.1% |
| Bulgarian | 800 | 0.0% |
| Burmese | 8,940 | 0.5% |
| Cajun | 27 | 0.0% |
| Cambodian | 269 | 0.0% |
| Canadian | 5,632 | 0.3% |
| Cape Verdean | 2,596 | 0.1% |
| Carpatho Rusyn | 159 | 0.0% |
| Celtic | 137 | 0.0% |
| Central American | 42,553 | 2.3% |
| Central American Indian | 2,681 | 0.2% |
| Cherokee | 2,520 | 0.1% |
| Cheyenne | 61 | 0.0% |
| Chilean | 2,421 | 0.1% |
| Chippewa | 90 | 0.0% |
| Choctaw | 154 | 0.0% |
| Colombian | 20,434 | 1.1% |
| Comanche | 19 | 0.0% |
| Costa Rican | 3,095 | 0.2% |
| Cree | 71 | 0.0% |
| Creek | 146 | 0.0% |
| Croatian | 2,383 | 0.1% |
| Cuban | 8,342 | 0.4% |
| Cypriot | 198 | 0.0% |
| Czech | 5,331 | 0.3% |
| Czechoslovakian | 1,904 | 0.1% |
| Danish | 4,875 | 0.3% |
| Delaware | 17 | 0.0% |
| Dominican | 35,620 | 1.9% |
| Dutch | 10,661 | 0.6% |
| Dutch West Indian | 83 | 0.0% |
| Eastern European | 12,654 | 0.7% |
| Ecuadorian | 32,396 | 1.8% |
| Egyptian | 1,312 | 0.1% |
| English | 134,541 | 7.3% |
| Estonian | 413 | 0.0% |
| Ethiopian | 548 | 0.0% |
| European | 18,630 | 1.0% |
| Fijian | 28 | 0.0% |
| Filipino | 1,388 | 0.1% |
| Finnish | 1,576 | 0.1% |
| French | 41,440 | 2.3% |
| French American Indian | 220 | 0.0% |
| French Canadian | 21,167 | 1.1% |
| German | 138,227 | 7.5% |
| German Russian | 9 | 0.0% |
| Ghanaian | 3,142 | 0.2% |
| Greek | 17,410 | 0.9% |
| Guamanian / Chamorro | 304 | 0.0% |
| Guatemalan | 22,171 | 1.2% |
| Guyanese | 1,891 | 0.1% |
| Haitian | 13,340 | 0.7% |
| Hmong | 15 | 0.0% |
| Honduran | 7,284 | 0.4% |
| Hungarian | 21,490 | 1.2% |
| Icelander | 238 | 0.0% |
| Indian (Asian) | 27,105 | 1.5% |
| Indonesian | 92 | 0.0% |
| Inupiat | 36 | 0.0% |
| Iranian | 1,596 | 0.1% |
| Iraqi | 292 | 0.0% |
| Irish | 253,559 | 13.8% |
| Iroquois | 142 | 0.0% |
| Israeli | 1,490 | 0.1% |
| Italian | 316,078 | 17.2% |
| Jamaican | 27,894 | 1.5% |
| Japanese | 2,926 | 0.2% |
| Jordanian | 330 | 0.0% |
| Kenyan | 185 | 0.0% |
| Korean | 10,332 | 0.6% |
| Laotian | 366 | 0.0% |
| Latvian | 1,337 | 0.1% |
| Lebanese | 5,090 | 0.3% |
| Liberian | 355 | 0.0% |
| Lithuanian | 11,653 | 0.6% |
| Lumbee | 118 | 0.0% |
| Luxembourger | 23 | 0.0% |
| Macedonian | 465 | 0.0% |
| Malaysian | 1,948 | 0.1% |
| Maltese | 155 | 0.0% |
| Mexican | 42,215 | 2.3% |
| Mexican American Indian | 901 | 0.1% |
| Mongolian | 273 | 0.0% |
| Moroccan | 1,868 | 0.1% |
| Native Hawaiian | 660 | 0.0% |
| Navajo | 217 | 0.0% |
| New Zealander | 153 | 0.0% |
| Nicaraguan | 1,563 | 0.1% |
| Nigerian | 2,278 | 0.1% |
| Northern European | 1,860 | 0.1% |
| Norwegian | 8,487 | 0.5% |
| Okinawan | 21 | 0.0% |
| Osage | 1 | 0.0% |
| Pakistani | 917 | 0.1% |
| Palestinian | 845 | 0.1% |
| Panamanian | 1,134 | 0.1% |
| Paraguayan | 485 | 0.0% |
| Pennsylvania German | 206 | 0.0% |
| Peruvian | 10,195 | 0.6% |
| Polish | 91,508 | 5.0% |
| Portuguese | 24,933 | 1.4% |
| Puerto Rican | 140,877 | 7.7% |
| Puget Sound Salish | 47 | 0.0% |
| Romanian | 5,187 | 0.3% |
| Russian | 28,895 | 1.6% |
| Salvadoran | 6,732 | 0.4% |
| Samoan | 273 | 0.0% |
| Scandinavian | 2,704 | 0.2% |
| Scotch-Irish | 7,168 | 0.4% |
| Scottish | 21,792 | 1.2% |
| Seminole | 88 | 0.0% |
| Senegalese | 347 | 0.0% |
| Serbian | 966 | 0.1% |
| Sierra Leonean | 78 | 0.0% |
| Sioux | 136 | 0.0% |
| Slavic | 1,153 | 0.1% |
| Slovak | 11,534 | 0.6% |
| Slovene | 747 | 0.0% |
| Somali | 7 | 0.0% |
| South African | 978 | 0.1% |
| South American | 76,243 | 4.2% |
| South American Indian | 665 | 0.0% |
| Spaniard | 4,128 | 0.2% |
| Spanish | 3,261 | 0.2% |
| Spanish American | 98 | 0.0% |
| Spanish American Indian | 33 | 0.0% |
| Sri Lankan | 6,380 | 0.4% |
| Subsaharan African | 23,718 | 1.3% |
| Sudanese | 239 | 0.0% |
| Swedish | 17,042 | 0.9% |
| Swiss | 3,538 | 0.2% |
| Syrian | 1,897 | 0.1% |
| Thai | 30,796 | 1.7% |
| Trinidadian and Tobagonian | 2,657 | 0.1% |
| Turkish | 2,719 | 0.2% |
| U.S. Virgin Islander | 256 | 0.0% |
| Ugandan | 295 | 0.0% |
| Ukrainian | 10,547 | 0.6% |
| Uruguayan | 1,464 | 0.1% |
| Venezuelan | 3,408 | 0.2% |
| Vietnamese | 1,627 | 0.1% |
| Welsh | 5,480 | 0.3% |
| West Indian | 3,386 | 0.2% |
| Yaqui | 30 | 0.0% |
| Yugoslavian | 1,168 | 0.1% |
| Zimbabwean | 89 | 0.0% | View All 169 Rows |
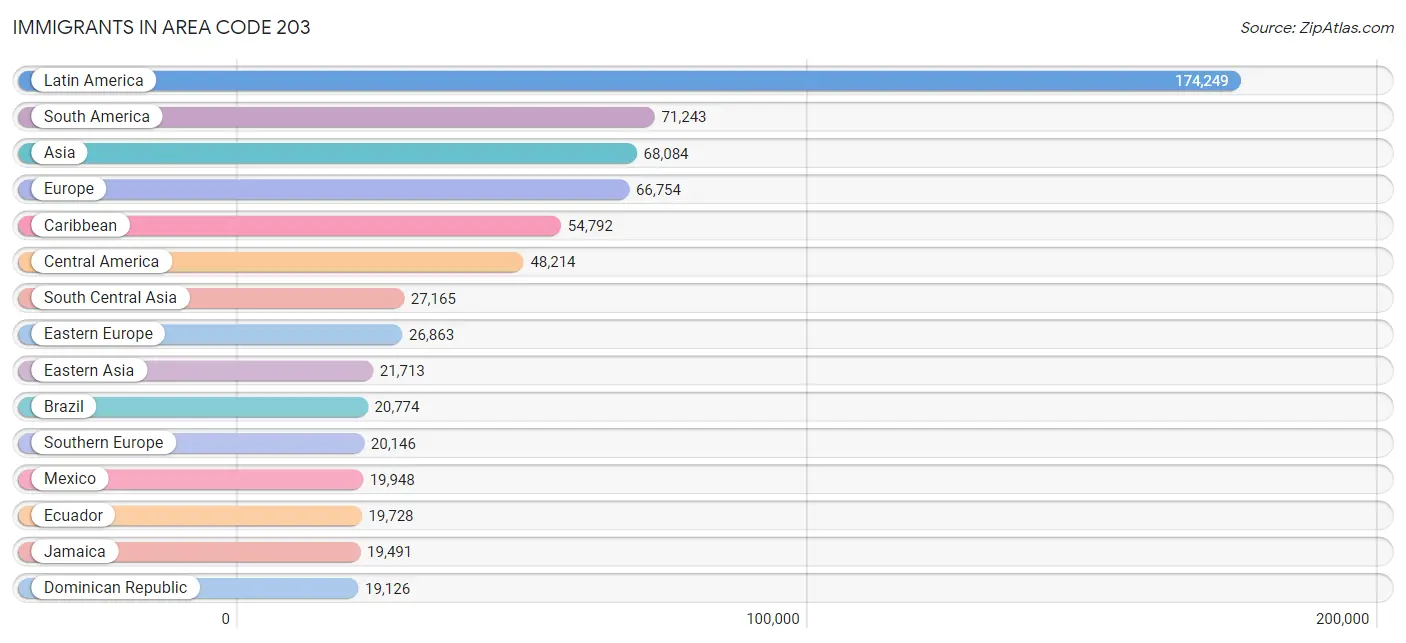
Immigrants in Area Code 203
The most numerous immigrant groups reported in Area Code 203 came from Latin America (174,249 | 9.5%), South America (71,243 | 3.9%), Asia (68,084 | 3.7%), Europe (66,754 | 3.6%), and Caribbean (54,792 | 3.0%), together accounting for 23.7% of all Area Code 203 residents.
| Immigration Origin | # Population | % Population |
| Afghanistan | 1,652 | 0.1% |
| Africa | 17,200 | 0.9% |
| Albania | 2,950 | 0.2% |
| Argentina | 2,649 | 0.1% |
| Armenia | 87 | 0.0% |
| Asia | 68,084 | 3.7% |
| Australia | 735 | 0.0% |
| Austria | 354 | 0.0% |
| Azores | 50 | 0.0% |
| Bahamas | 210 | 0.0% |
| Bangladesh | 1,993 | 0.1% |
| Barbados | 324 | 0.0% |
| Belarus | 378 | 0.0% |
| Belgium | 354 | 0.0% |
| Belize | 124 | 0.0% |
| Bolivia | 403 | 0.0% |
| Bosnia and Herzegovina | 375 | 0.0% |
| Brazil | 20,774 | 1.1% |
| Bulgaria | 661 | 0.0% |
| Cabo Verde | 949 | 0.1% |
| Cambodia | 811 | 0.0% |
| Cameroon | 127 | 0.0% |
| Canada | 6,492 | 0.4% |
| Caribbean | 54,792 | 3.0% |
| Central America | 48,214 | 2.6% |
| Chile | 1,759 | 0.1% |
| China | 15,855 | 0.9% |
| Colombia | 13,140 | 0.7% |
| Congo | 194 | 0.0% |
| Costa Rica | 2,245 | 0.1% |
| Croatia | 360 | 0.0% |
| Cuba | 1,915 | 0.1% |
| Czechoslovakia | 934 | 0.1% |
| Denmark | 655 | 0.0% |
| Dominica | 614 | 0.0% |
| Dominican Republic | 19,126 | 1.0% |
| Eastern Africa | 2,362 | 0.1% |
| Eastern Asia | 21,713 | 1.2% |
| Eastern Europe | 26,863 | 1.5% |
| Ecuador | 19,728 | 1.1% |
| Egypt | 1,165 | 0.1% |
| El Salvador | 4,037 | 0.2% |
| England | 3,614 | 0.2% |
| Eritrea | 11 | 0.0% |
| Ethiopia | 425 | 0.0% |
| Europe | 66,754 | 3.6% |
| France | 1,798 | 0.1% |
| Germany | 3,879 | 0.2% |
| Ghana | 2,896 | 0.2% |
| Greece | 3,157 | 0.2% |
| Grenada | 78 | 0.0% |
| Guatemala | 14,470 | 0.8% |
| Guyana | 2,148 | 0.1% |
| Haiti | 9,499 | 0.5% |
| Honduras | 5,492 | 0.3% |
| Hong Kong | 737 | 0.0% |
| Hungary | 1,170 | 0.1% |
| India | 17,740 | 1.0% |
| Indonesia | 378 | 0.0% |
| Iran | 1,094 | 0.1% |
| Iraq | 467 | 0.0% |
| Ireland | 1,907 | 0.1% |
| Israel | 1,039 | 0.1% |
| Italy | 9,154 | 0.5% |
| Jamaica | 19,491 | 1.1% |
| Japan | 1,365 | 0.1% |
| Jordan | 627 | 0.0% |
| Kazakhstan | 197 | 0.0% |
| Kenya | 445 | 0.0% |
| Korea | 4,300 | 0.2% |
| Kuwait | 71 | 0.0% |
| Laos | 856 | 0.1% |
| Latin America | 174,249 | 9.5% |
| Latvia | 337 | 0.0% |
| Lebanon | 905 | 0.1% |
| Liberia | 270 | 0.0% |
| Lithuania | 747 | 0.0% |
| Malaysia | 179 | 0.0% |
| Mexico | 19,948 | 1.1% |
| Middle Africa | 2,155 | 0.1% |
| Moldova | 272 | 0.0% |
| Morocco | 1,448 | 0.1% |
| Nepal | 425 | 0.0% |
| Netherlands | 701 | 0.0% |
| Nicaragua | 1,445 | 0.1% |
| Nigeria | 1,822 | 0.1% |
| North Macedonia | 942 | 0.1% |
| Northern Africa | 3,464 | 0.2% |
| Northern Europe | 12,007 | 0.6% |
| Norway | 196 | 0.0% |
| Oceania | 1,033 | 0.1% |
| Pakistan | 3,607 | 0.2% |
| Panama | 403 | 0.0% |
| Peru | 6,740 | 0.4% |
| Philippines | 5,528 | 0.3% |
| Poland | 6,794 | 0.4% |
| Portugal | 6,236 | 0.3% |
| Romania | 1,769 | 0.1% |
| Russia | 4,322 | 0.2% |
| Saudi Arabia | 438 | 0.0% |
| Scotland | 682 | 0.0% |
| Senegal | 179 | 0.0% |
| Serbia | 444 | 0.0% |
| Sierra Leone | 127 | 0.0% |
| Singapore | 183 | 0.0% |
| Somalia | 151 | 0.0% |
| South Africa | 1,602 | 0.1% |
| South America | 71,243 | 3.9% |
| South Central Asia | 27,165 | 1.5% |
| South Eastern Asia | 12,097 | 0.7% |
| Southern Europe | 20,146 | 1.1% |
| Spain | 1,570 | 0.1% |
| Sri Lanka | 354 | 0.0% |
| St. Vincent and the Grenadines | 153 | 0.0% |
| Sudan | 361 | 0.0% |
| Sweden | 443 | 0.0% |
| Switzerland | 454 | 0.0% |
| Syria | 1,252 | 0.1% |
| Taiwan | 1,588 | 0.1% |
| Thailand | 808 | 0.0% |
| Trinidad and Tobago | 1,959 | 0.1% |
| Turkey | 1,338 | 0.1% |
| Uganda | 395 | 0.0% |
| Ukraine | 2,836 | 0.2% |
| Uruguay | 885 | 0.1% |
| Uzbekistan | 63 | 0.0% |
| Venezuela | 2,674 | 0.2% |
| Vietnam | 3,235 | 0.2% |
| West Indies | 646 | 0.0% |
| Western Africa | 6,909 | 0.4% |
| Western Asia | 7,037 | 0.4% |
| Western Europe | 7,572 | 0.4% |
| Yemen | 25 | 0.0% |
| Zaire | 1,508 | 0.1% |
| Zimbabwe | 266 | 0.0% | View All 135 Rows |
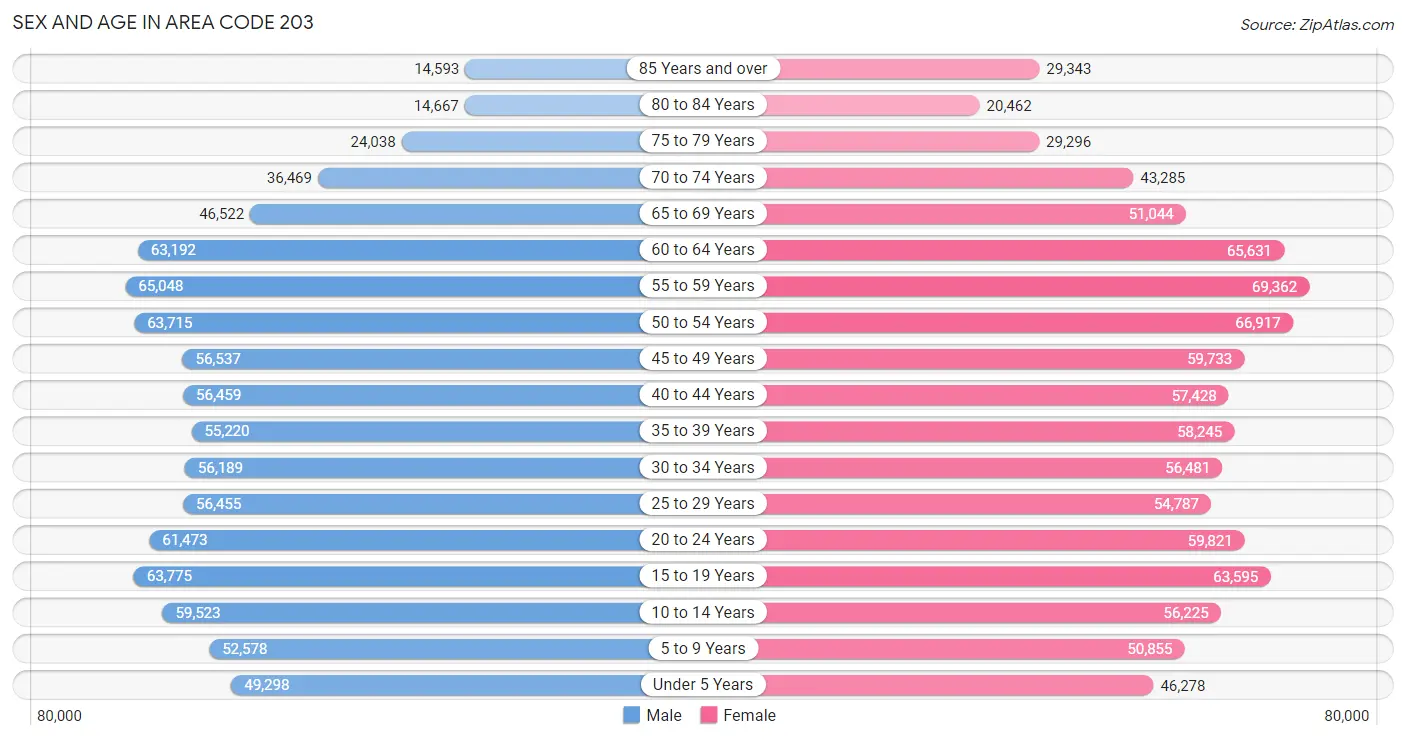
Sex and Age in Area Code 203
Sex and Age in Area Code 203
The most populous age groups in Area Code 203 are 55 to 59 Years (65,048 | 7.3%) for men and 55 to 59 Years (69,362 | 7.4%) for women.
| Age Bracket | Male | Female |
| Under 5 Years | 49,298 (5.5%) | 46,278 (4.9%) |
| 5 to 9 Years | 52,578 (5.9%) | 50,855 (5.4%) |
| 10 to 14 Years | 59,523 (6.7%) | 56,225 (6.0%) |
| 15 to 19 Years | 63,775 (7.1%) | 63,595 (6.8%) |
| 20 to 24 Years | 61,473 (6.9%) | 59,821 (6.4%) |
| 25 to 29 Years | 56,455 (6.3%) | 54,787 (5.8%) |
| 30 to 34 Years | 56,189 (6.3%) | 56,481 (6.0%) |
| 35 to 39 Years | 55,220 (6.2%) | 58,245 (6.2%) |
| 40 to 44 Years | 56,459 (6.3%) | 57,428 (6.1%) |
| 45 to 49 Years | 56,537 (6.3%) | 59,733 (6.4%) |
| 50 to 54 Years | 63,715 (7.1%) | 66,917 (7.1%) |
| 55 to 59 Years | 65,048 (7.3%) | 69,362 (7.4%) |
| 60 to 64 Years | 63,192 (7.0%) | 65,631 (7.0%) |
| 65 to 69 Years | 46,522 (5.2%) | 51,044 (5.4%) |
| 70 to 74 Years | 36,469 (4.1%) | 43,285 (4.6%) |
| 75 to 79 Years | 24,038 (2.7%) | 29,296 (3.1%) |
| 80 to 84 Years | 14,667 (1.6%) | 20,462 (2.2%) |
| 85 Years and over | 14,593 (1.6%) | 29,343 (3.1%) |
| Total | 895,751 (100.0%) | 938,788 (100.0%) |
Families and Households in Area Code 203
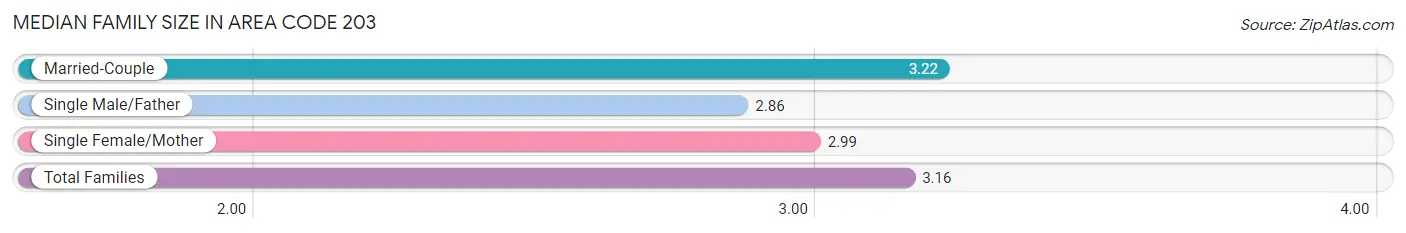
Median Family Size in Area Code 203
The median family size in Area Code 203 is 3.16 persons per family, with married-couple families (335,702 | 73.4%) accounting for the largest median family size of 3.22034 persons per family. On the other hand, single male/father families (32,739 | 7.2%) represent the smallest median family size with 2.86 persons per family.
| Family Type | # Families | Family Size |
| Married-Couple | 335,702 (73.4%) | 3.22 |
| Single Male/Father | 32,739 (7.2%) | 2.86 |
| Single Female/Mother | 88,770 (19.4%) | 2.99 |
| Total Families | 457,211 (100.0%) | 3.16 |
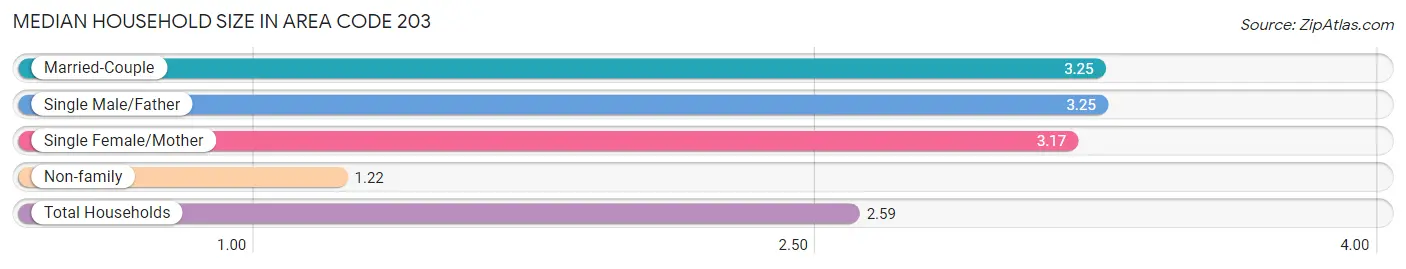
Median Household Size in Area Code 203
The median household size in Area Code 203 is 2.59 persons per household, with single male/father households (32,739 | 4.7%) accounting for the largest median household size of 3.25261 persons per household. non-family households (241,491 | 34.6%) represent the smallest median household size with 1.22 persons per household.
| Household Type | # Households | Household Size |
| Married-Couple | 335,702 (48.0%) | 3.25 |
| Single Male/Father | 32,739 (4.7%) | 3.25 |
| Single Female/Mother | 88,770 (12.7%) | 3.17 |
| Non-family | 241,491 (34.6%) | 1.22 |
| Total Households | 698,702 (100.0%) | 2.59 |
Household Size by Marriage Status in Area Code 203
Out of a total of 698,702 households in Area Code 203, 457,211 (65.4%) are family households, while 241,491 (34.6%) are nonfamily households. The most numerous type of family households are 2-person households, comprising 188,307, and the most common type of nonfamily households are 1-person households, comprising 198,731.
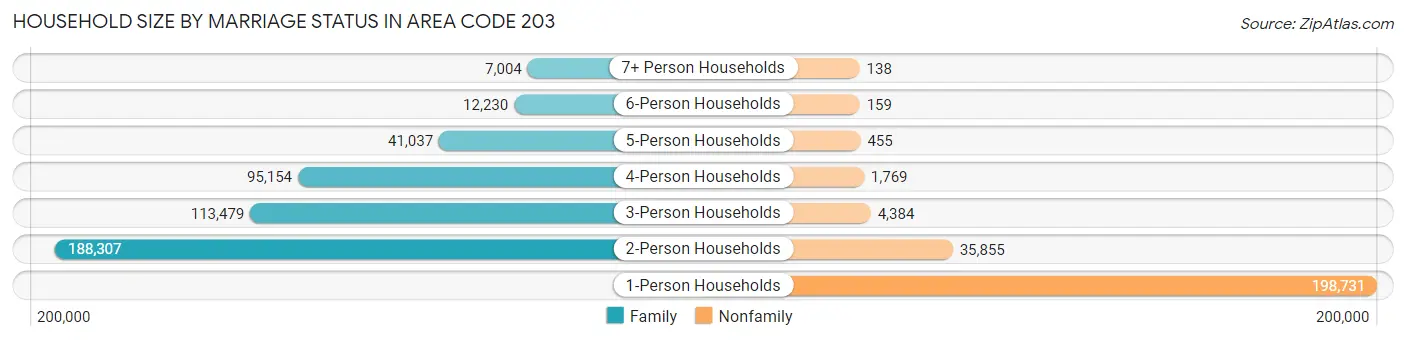
| Household Size | Family Households | Nonfamily Households |
| 1-Person Households | - | 198,731 (28.4%) |
| 2-Person Households | 188,307 (27.0%) | 35,855 (5.1%) |
| 3-Person Households | 113,479 (16.2%) | 4,384 (0.6%) |
| 4-Person Households | 95,154 (13.6%) | 1,769 (0.3%) |
| 5-Person Households | 41,037 (5.9%) | 455 (0.1%) |
| 6-Person Households | 12,230 (1.8%) | 159 (0.0%) |
| 7+ Person Households | 7,004 (1.0%) | 138 (0.0%) |
| Total | 457,211 (65.4%) | 241,491 (34.6%) |
Female Fertility in Area Code 203
Fertility by Age in Area Code 203
Average fertility rate in Area Code 203 is 44.6 births per 1,000 women. Women in the age bracket of 20 to 34 years have the highest fertility rate with 68.3 births per 1,000 women. Women in the age bracket of 20 to 34 years acount for 59.7% of all women with births.
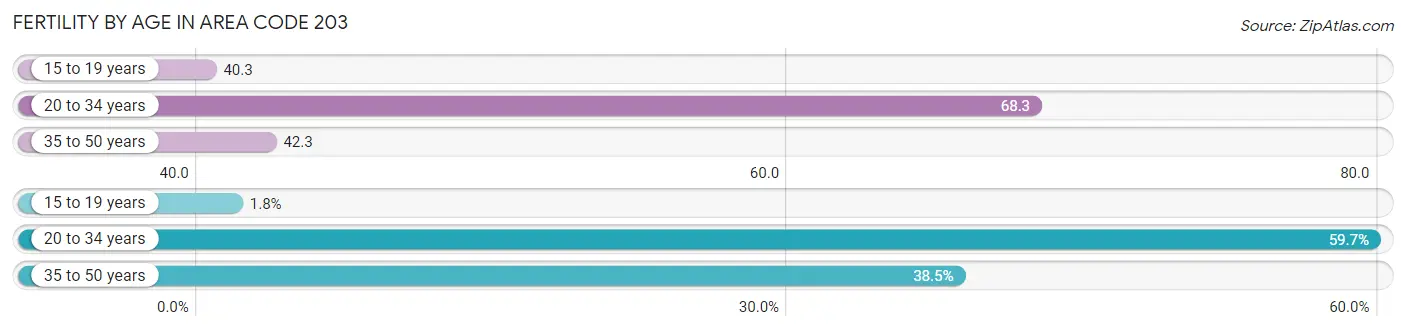
| Age Bracket | Women with Births | Births / 1,000 Women |
| 15 to 19 years | 322 (1.8%) | 40.3 |
| 20 to 34 years | 10,853 (59.7%) | 68.3 |
| 35 to 50 years | 7,007 (38.5%) | 42.3 |
| Total | 18,182 (100.0%) | 44.6 |
Fertility by Age by Marriage Status in Area Code 203
70.0% of women with births (18,182) in Area Code 203 are married. The highest percentage of unmarried women with births falls into 15 to 19 years age bracket with 100.0% of them unmarried at the time of birth, while the lowest percentage of unmarried women with births belong to 20 to 34 years age bracket with 37.1% of them unmarried.
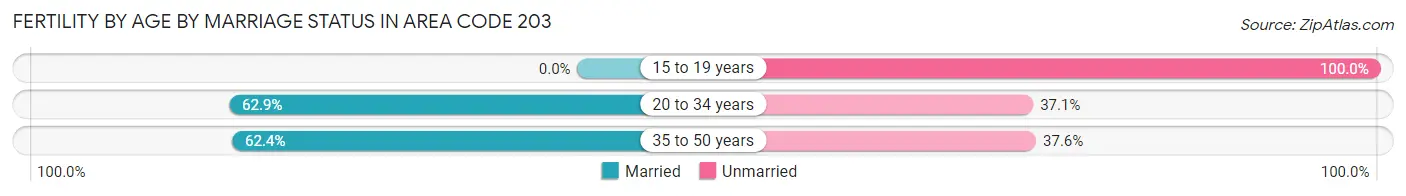
| Age Bracket | Married | Unmarried |
| 15 to 19 years | 0 (0.0%) | 322 (100.0%) |
| 20 to 34 years | 6,831 (62.9%) | 4,022 (37.1%) |
| 35 to 50 years | 4,373 (62.4%) | 2,634 (37.6%) |
| Total | 12,719 (70.0%) | 5,463 (30.0%) |
Fertility by Education in Area Code 203
Average fertility rate in Area Code 203 is 44.6 births per 1,000 women. Women with the education attainment of graduate degree have the highest fertility rate of 76.8 births per 1,000 women, while women with the education attainment of high school diploma have the lowest fertility at 45.6 births per 1,000 women. Women with the education attainment of bachelor's degree represent 28.3% of all women with births.
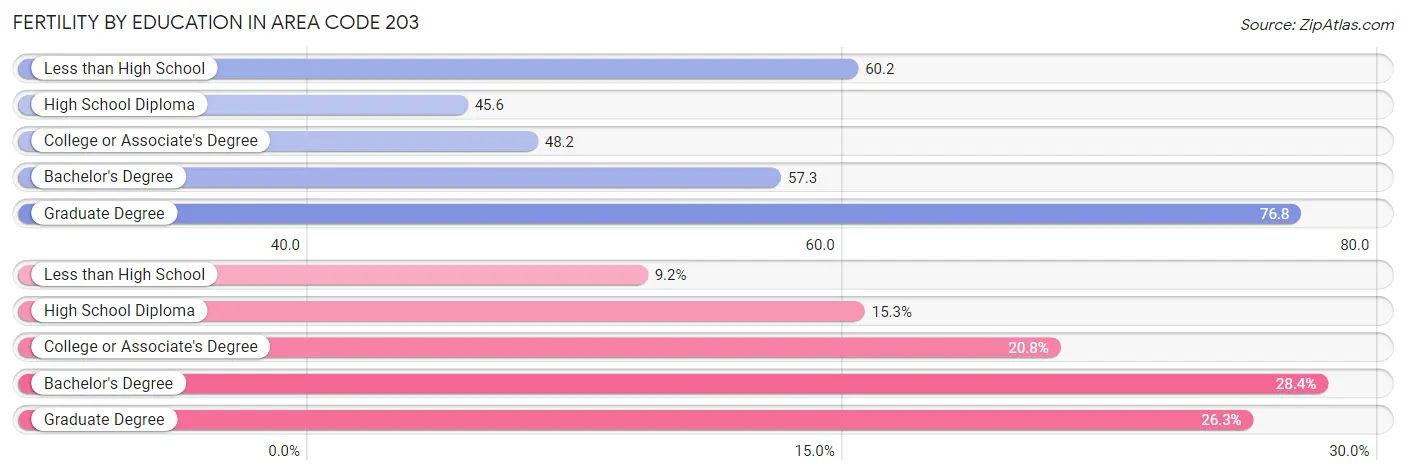
| Educational Attainment | Women with Births | Births / 1,000 Women |
| Less than High School | 1,679 (9.2%) | 60.2 |
| High School Diploma | 2,788 (15.3%) | 45.6 |
| College or Associate's Degree | 3,788 (20.8%) | 48.2 |
| Bachelor's Degree | 5,155 (28.3%) | 57.3 |
| Graduate Degree | 4,772 (26.3%) | 76.8 |
| Total | 18,182 (100.0%) | 44.6 |
Fertility by Education by Marriage Status in Area Code 203
30.0% of women with births in Area Code 203 are unmarried. Women with the educational attainment of graduate degree are most likely to be married with 69.0% of them married at childbirth, while women with the educational attainment of less than high school are least likely to be married with 70.0% of them unmarried at childbirth.
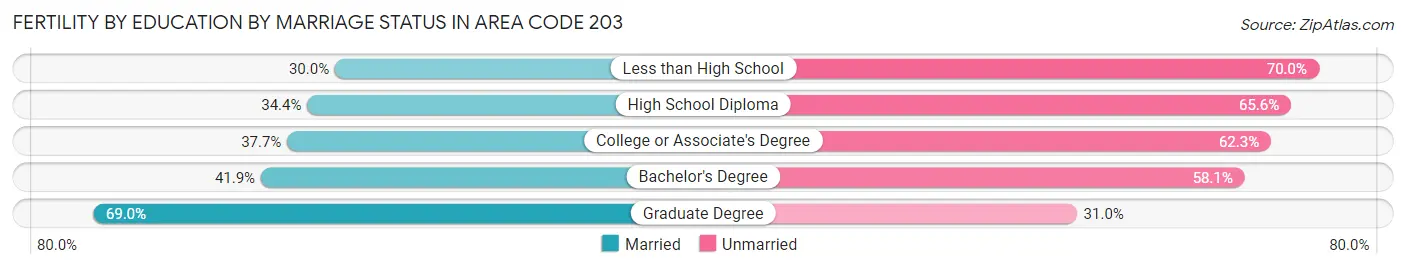
| Educational Attainment | Married | Unmarried |
| Less than High School | 503 (30.0%) | 1,176 (70.0%) |
| High School Diploma | 960 (34.4%) | 1,828 (65.6%) |
| College or Associate's Degree | 1,427 (37.7%) | 2,361 (62.3%) |
| Bachelor's Degree | 2,160 (41.9%) | 2,995 (58.1%) |
| Graduate Degree | 3,292 (69.0%) | 1,480 (31.0%) |
| Total | 12,719 (70.0%) | 5,463 (30.0%) |
Employment Characteristics in Area Code 203
Employment by Class of Employer in Area Code 203
Among the 907,605 employed individuals in Area Code 203, private company employees (604,080 | 66.6%), not-for-profit organizations (103,014 | 11.4%), and local government employees (62,698 | 6.9%) make up the most common classes of employment.
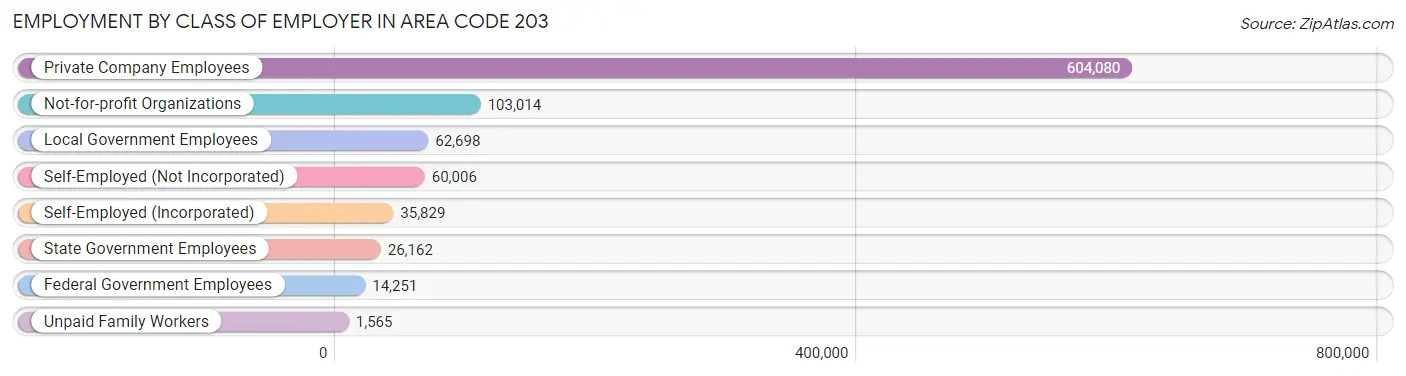
| Employer Class | # Employees | % Employees |
| Private Company Employees | 604,080 | 66.6% |
| Self-Employed (Incorporated) | 35,829 | 4.0% |
| Self-Employed (Not Incorporated) | 60,006 | 6.6% |
| Not-for-profit Organizations | 103,014 | 11.4% |
| Local Government Employees | 62,698 | 6.9% |
| State Government Employees | 26,162 | 2.9% |
| Federal Government Employees | 14,251 | 1.6% |
| Unpaid Family Workers | 1,565 | 0.2% |
| Total | 907,605 | 100.0% |
Employment Status by Age in Area Code 203
According to the labor force statistics for Area Code 203, out of the total population over 16 years of age (1,493,879), 65.9% or 983,869 individuals are in the labor force, with 6.2% or 61,197 of them unemployed. The age group with the highest labor force participation rate is 30 to 34 years, with 85.9% or 96,829 individuals in the labor force. Within the labor force, the 16 to 19 years age range has the highest percentage of unemployed individuals, with 1,272.7% or 452,878 of them being unemployed.
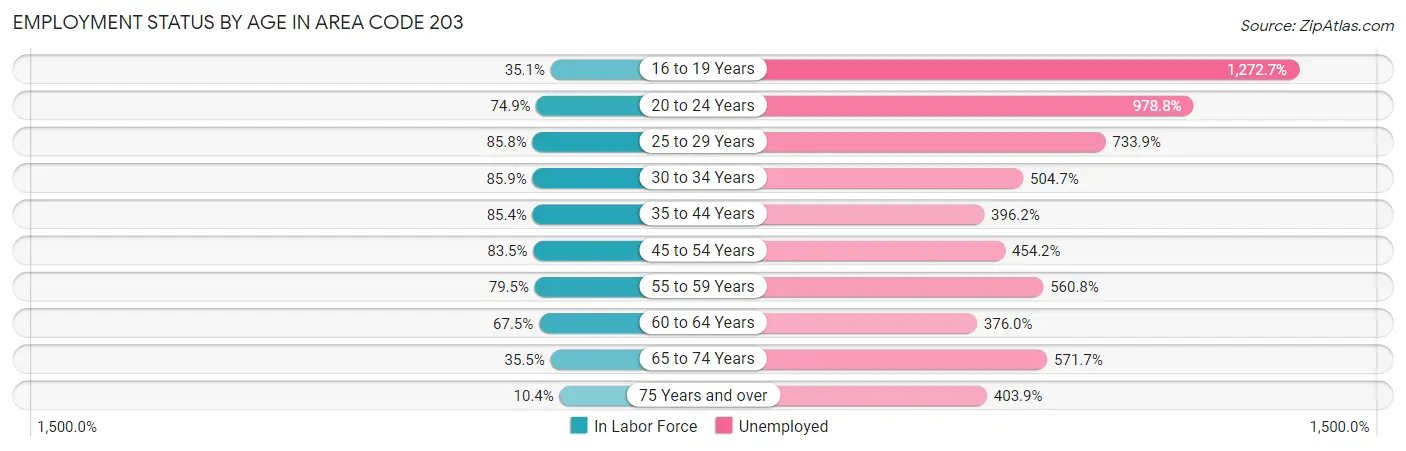
| Age Bracket | In Labor Force | Unemployed |
| 16 to 19 Years | 35,581 (35.1%) | 452,878 (1,272.7%) |
| 20 to 24 Years | 90,868 (74.9%) | 889,465 (978.8%) |
| 25 to 29 Years | 95,395 (85.8%) | 700,067 (733.9%) |
| 30 to 34 Years | 96,826 (85.9%) | 488,696 (504.7%) |
| 35 to 44 Years | 194,084 (85.4%) | 768,985 (396.2%) |
| 45 to 54 Years | 206,197 (83.5%) | 936,506 (454.2%) |
| 55 to 59 Years | 106,784 (79.4%) | 598,873 (560.8%) |
| 60 to 64 Years | 86,988 (67.5%) | 327,049 (376.0%) |
| 65 to 74 Years | 62,997 (35.5%) | 360,182 (571.7%) |
| 75 Years and over | 13,826 (10.4%) | 55,827 (403.9%) |
| Total | 983,906 (65.9%) | 61,212 (6.2%) |
Employment Status by Educational Attainment in Area Code 203
According to labor force statistics for Area Code 203, 81.7% of individuals (785,751) out of the total population between 25 and 64 years of age (961,399) are in the labor force, with 479.0% or 3,763,747 of them being unemployed. The group with the highest labor force participation rate are those with the educational attainment of bachelor's degree or higher, with 87.8% or 390,101 individuals in the labor force. Within the labor force, individuals with less than high school education have the highest percentage of unemployment, with 670.7% or 348,449 of them being unemployed.
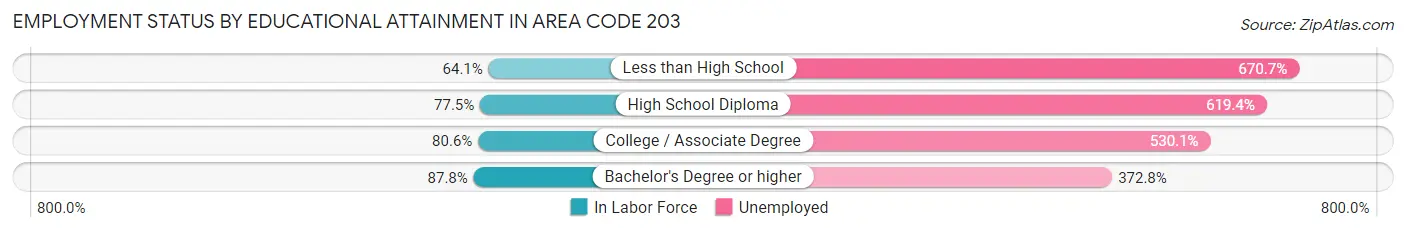
| Educational Attainment | In Labor Force | Unemployed |
| Less than High School | 51,950 (64.1%) | 543,938 (670.7%) |
| High School Diploma | 175,323 (77.5%) | 1,401,269 (619.4%) |
| College / Associate Degree | 169,100 (80.6%) | 1,112,219 (530.1%) |
| Bachelor's Degree or higher | 390,117 (87.8%) | 1,656,186 (372.8%) |
| Total | 785,736 (81.7%) | 4,605,101 (479.0%) |
Employment Occupations by Sex in Area Code 203
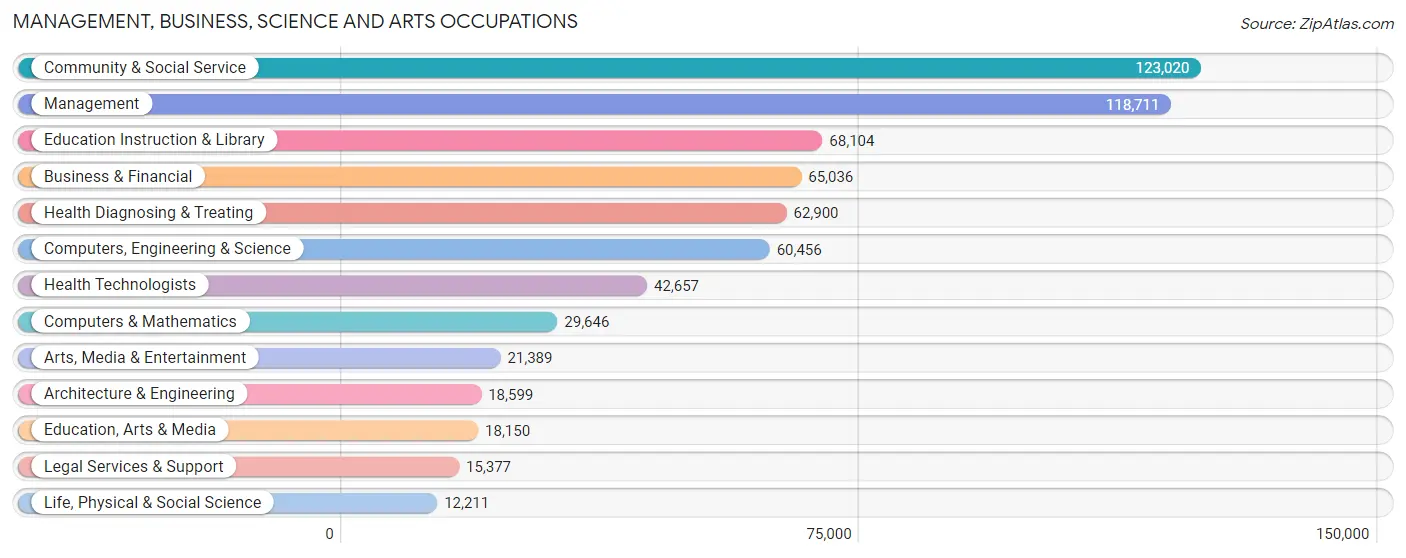
Management, Business, Science and Arts Occupations
The most common Management, Business, Science and Arts occupations in Area Code 203 are Community & Social Service (123,020 | 13.3%), Management (118,711 | 12.8%), Education Instruction & Library (68,104 | 7.3%), Business & Financial (65,036 | 7.0%), and Health Diagnosing & Treating (62,900 | 6.8%).
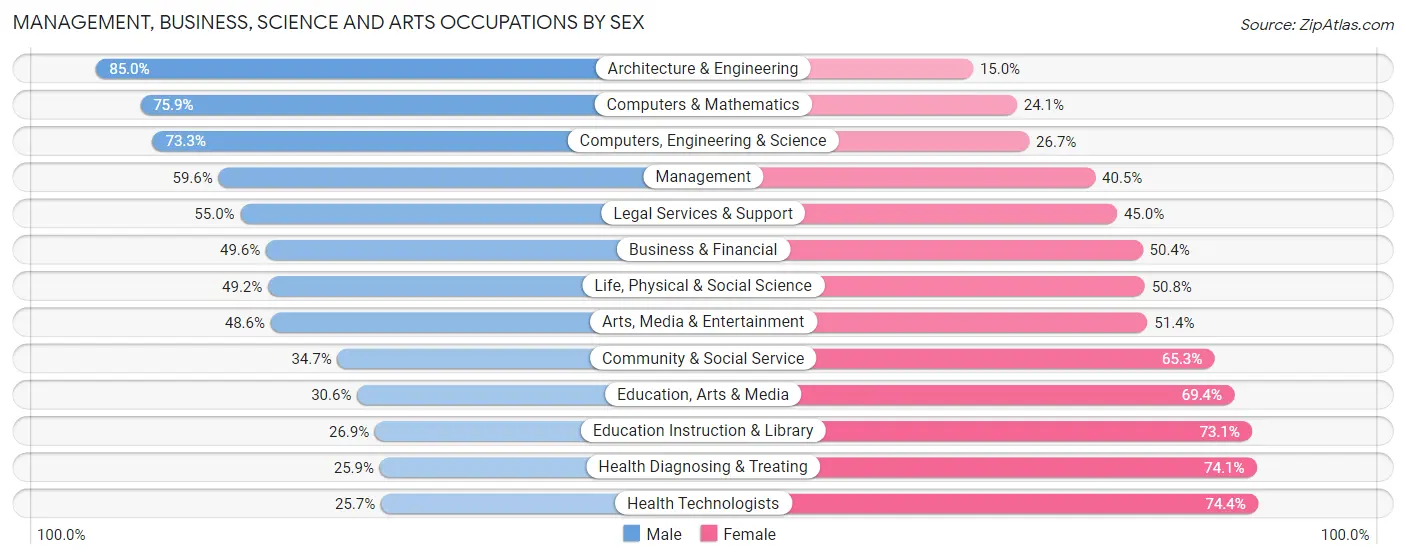
Management, Business, Science and Arts Occupations by Sex
Within the Management, Business, Science and Arts occupations in Area Code 203, the most male-oriented occupations are Architecture & Engineering (85.0%), Computers & Mathematics (75.9%), and Computers, Engineering & Science (73.3%), while the most female-oriented occupations are Health Technologists (74.4%), Health Diagnosing & Treating (74.1%), and Education Instruction & Library (73.1%).
| Occupation | Male | Female |
| Management | 70,690 (59.6%) | 48,021 (40.5%) |
| Business & Financial | 32,279 (49.6%) | 32,757 (50.4%) |
| Computers, Engineering & Science | 44,316 (73.3%) | 16,140 (26.7%) |
| Computers & Mathematics | 22,494 (75.9%) | 7,152 (24.1%) |
| Architecture & Engineering | 15,814 (85.0%) | 2,785 (15.0%) |
| Life, Physical & Social Science | 6,008 (49.2%) | 6,203 (50.8%) |
| Community & Social Service | 42,728 (34.7%) | 80,292 (65.3%) |
| Education, Arts & Media | 5,555 (30.6%) | 12,595 (69.4%) |
| Legal Services & Support | 8,454 (55.0%) | 6,923 (45.0%) |
| Education Instruction & Library | 18,316 (26.9%) | 49,788 (73.1%) |
| Arts, Media & Entertainment | 10,403 (48.6%) | 10,986 (51.4%) |
| Health Diagnosing & Treating | 16,300 (25.9%) | 46,600 (74.1%) |
| Health Technologists | 10,943 (25.7%) | 31,714 (74.4%) |
| Total (Category) | 206,313 (48.0%) | 223,810 (52.0%) |
| Total (Overall) | 479,704 (51.8%) | 446,353 (48.2%) |
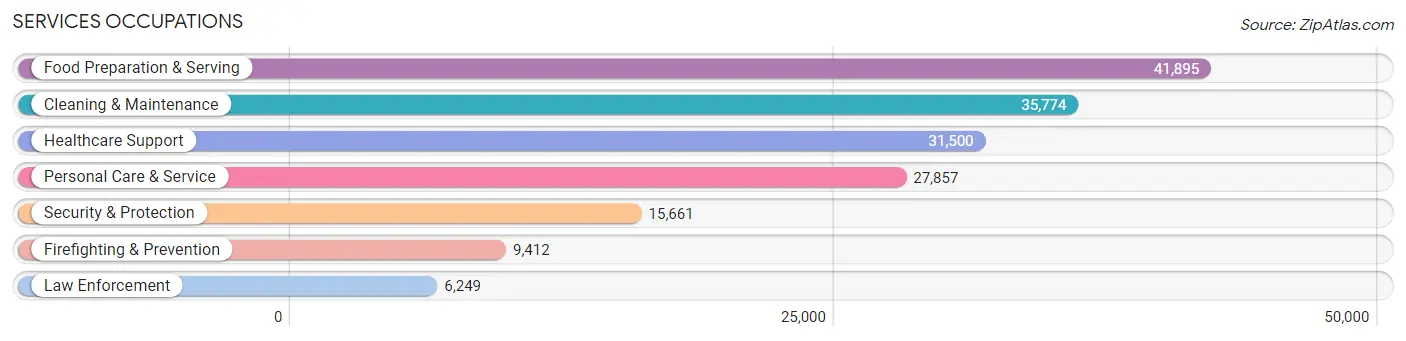
Services Occupations
The most common Services occupations in Area Code 203 are Food Preparation & Serving (41,895 | 4.5%), Cleaning & Maintenance (35,774 | 3.9%), Healthcare Support (31,500 | 3.4%), Personal Care & Service (27,857 | 3.0%), and Security & Protection (15,661 | 1.7%).
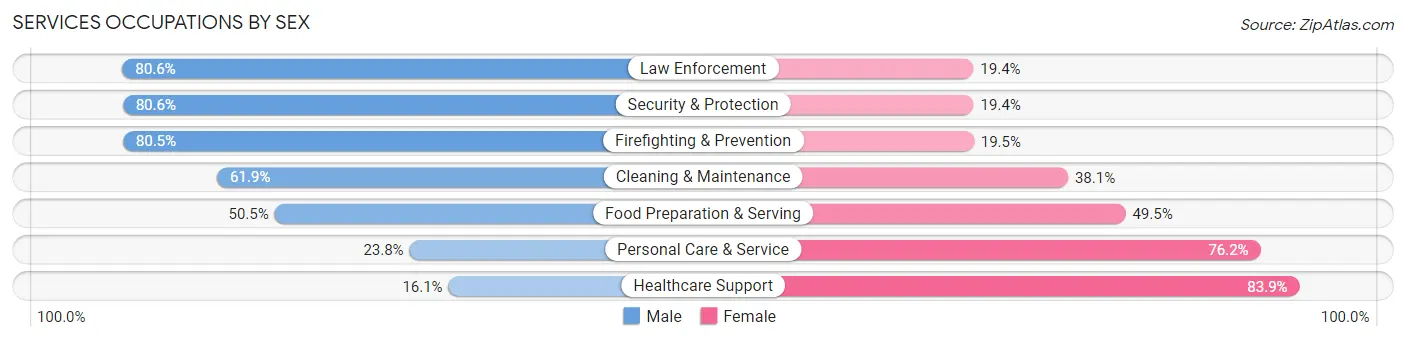
Services Occupations by Sex
Within the Services occupations in Area Code 203, the most male-oriented occupations are Law Enforcement (80.6%), Security & Protection (80.6%), and Firefighting & Prevention (80.5%), while the most female-oriented occupations are Healthcare Support (83.9%), Personal Care & Service (76.2%), and Food Preparation & Serving (49.5%).
| Occupation | Male | Female |
| Healthcare Support | 5,061 (16.1%) | 26,439 (83.9%) |
| Security & Protection | 12,618 (80.6%) | 3,043 (19.4%) |
| Firefighting & Prevention | 7,580 (80.5%) | 1,832 (19.5%) |
| Law Enforcement | 5,038 (80.6%) | 1,211 (19.4%) |
| Food Preparation & Serving | 21,163 (50.5%) | 20,732 (49.5%) |
| Cleaning & Maintenance | 22,140 (61.9%) | 13,634 (38.1%) |
| Personal Care & Service | 6,627 (23.8%) | 21,230 (76.2%) |
| Total (Category) | 67,609 (44.3%) | 85,078 (55.7%) |
| Total (Overall) | 479,704 (51.8%) | 446,353 (48.2%) |
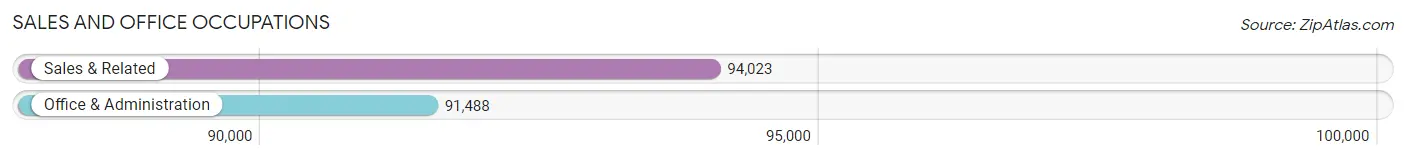
Sales and Office Occupations
The most common Sales and Office occupations in Area Code 203 are Sales & Related (94,023 | 10.2%), and Office & Administration (91,488 | 9.9%).
Sales and Office Occupations by Sex
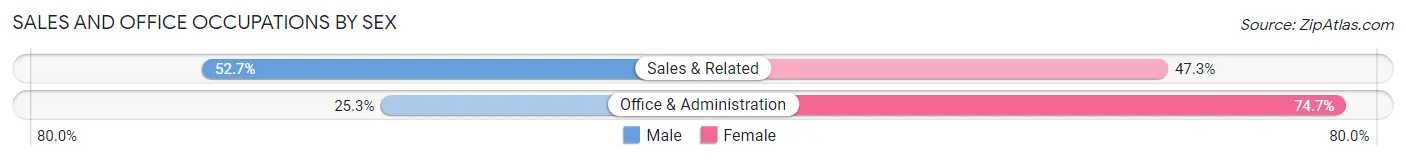
| Occupation | Male | Female |
| Sales & Related | 49,550 (52.7%) | 44,473 (47.3%) |
| Office & Administration | 23,134 (25.3%) | 68,354 (74.7%) |
| Total (Category) | 72,684 (39.2%) | 112,827 (60.8%) |
| Total (Overall) | 479,704 (51.8%) | 446,353 (48.2%) |
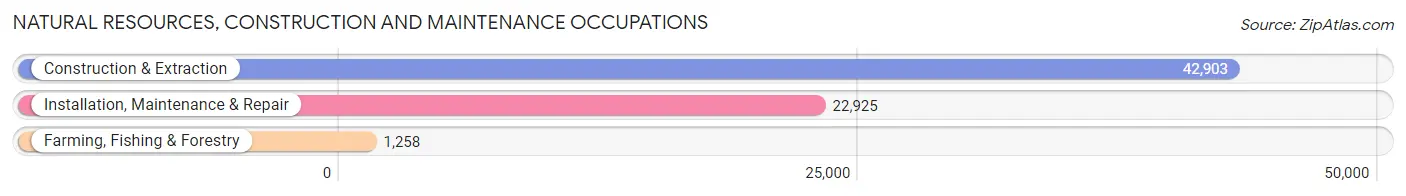
Natural Resources, Construction and Maintenance Occupations
The most common Natural Resources, Construction and Maintenance occupations in Area Code 203 are Construction & Extraction (42,903 | 4.6%), Installation, Maintenance & Repair (22,925 | 2.5%), and Farming, Fishing & Forestry (1,258 | 0.1%).
Natural Resources, Construction and Maintenance Occupations by Sex
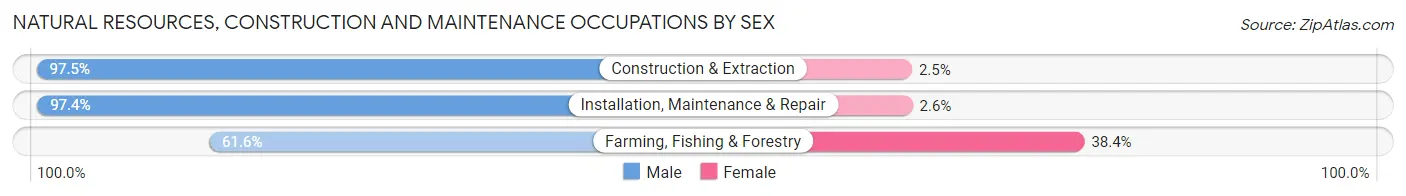
| Occupation | Male | Female |
| Farming, Fishing & Forestry | 775 (61.6%) | 483 (38.4%) |
| Construction & Extraction | 41,830 (97.5%) | 1,073 (2.5%) |
| Installation, Maintenance & Repair | 22,320 (97.4%) | 605 (2.6%) |
| Total (Category) | 64,925 (96.8%) | 2,161 (3.2%) |
| Total (Overall) | 479,704 (51.8%) | 446,353 (48.2%) |
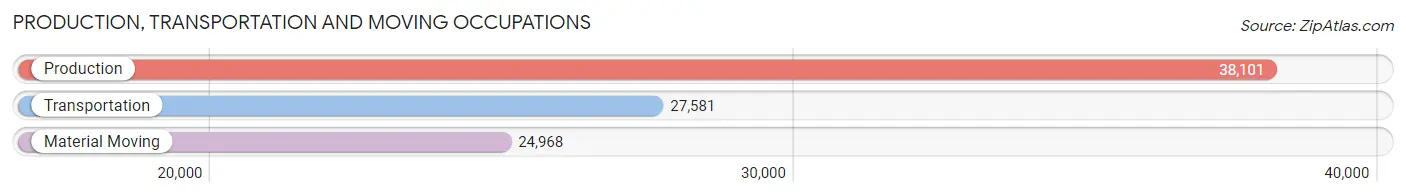
Production, Transportation and Moving Occupations
The most common Production, Transportation and Moving occupations in Area Code 203 are Production (38,101 | 4.1%), Transportation (27,581 | 3.0%), and Material Moving (24,968 | 2.7%).
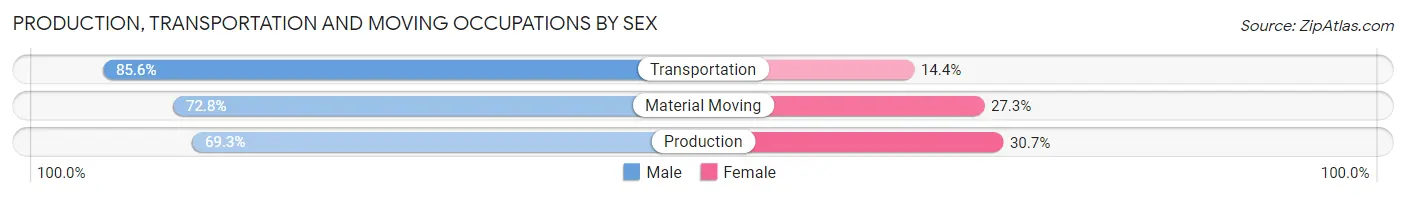
Production, Transportation and Moving Occupations by Sex
| Occupation | Male | Female |
| Production | 26,396 (69.3%) | 11,705 (30.7%) |
| Transportation | 23,612 (85.6%) | 3,969 (14.4%) |
| Material Moving | 18,165 (72.8%) | 6,803 (27.3%) |
| Total (Category) | 68,173 (75.2%) | 22,477 (24.8%) |
| Total (Overall) | 479,704 (51.8%) | 446,353 (48.2%) |
Employment Industries by Sex in Area Code 203
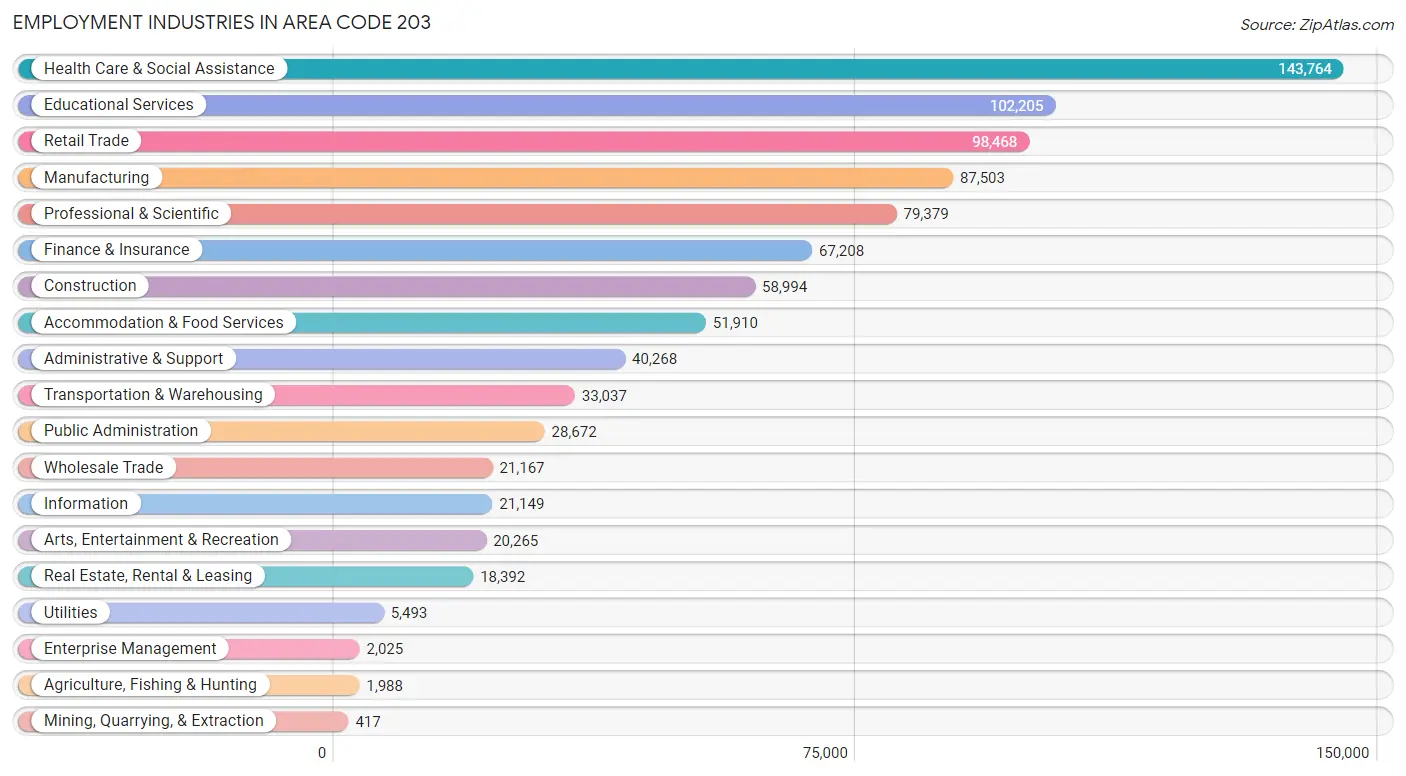
Employment Industries in Area Code 203
The major employment industries in Area Code 203 include Health Care & Social Assistance (143,764 | 15.5%), Educational Services (102,205 | 11.0%), Retail Trade (98,468 | 10.6%), Manufacturing (87,503 | 9.5%), and Professional & Scientific (79,379 | 8.6%).
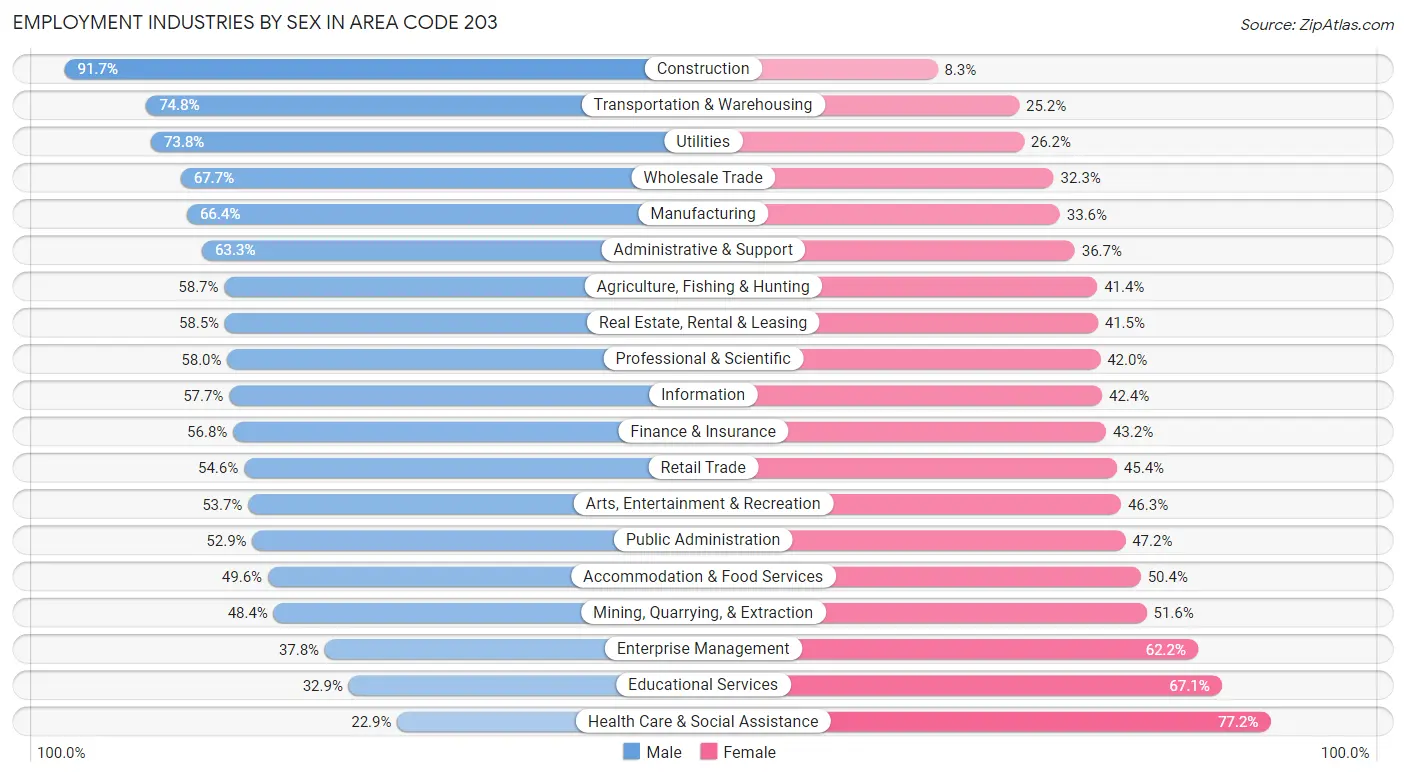
Employment Industries by Sex in Area Code 203
The Area Code 203 industries that see more men than women are Construction (91.7%), Transportation & Warehousing (74.8%), and Utilities (73.8%), whereas the industries that tend to have a higher number of women are Health Care & Social Assistance (77.1%), Educational Services (67.1%), and Enterprise Management (62.2%).
| Industry | Male | Female |
| Agriculture, Fishing & Hunting | 1,166 (58.7%) | 822 (41.3%) |
| Mining, Quarrying, & Extraction | 202 (48.4%) | 215 (51.6%) |
| Construction | 54,111 (91.7%) | 4,883 (8.3%) |
| Manufacturing | 58,088 (66.4%) | 29,415 (33.6%) |
| Wholesale Trade | 14,321 (67.7%) | 6,846 (32.3%) |
| Retail Trade | 53,730 (54.6%) | 44,738 (45.4%) |
| Transportation & Warehousing | 24,719 (74.8%) | 8,318 (25.2%) |
| Utilities | 4,056 (73.8%) | 1,437 (26.2%) |
| Information | 12,193 (57.7%) | 8,956 (42.3%) |
| Finance & Insurance | 38,192 (56.8%) | 29,016 (43.2%) |
| Real Estate, Rental & Leasing | 10,764 (58.5%) | 7,628 (41.5%) |
| Professional & Scientific | 46,066 (58.0%) | 33,313 (42.0%) |
| Enterprise Management | 766 (37.8%) | 1,259 (62.2%) |
| Administrative & Support | 25,481 (63.3%) | 14,787 (36.7%) |
| Educational Services | 33,640 (32.9%) | 68,565 (67.1%) |
| Health Care & Social Assistance | 32,847 (22.9%) | 110,917 (77.1%) |
| Arts, Entertainment & Recreation | 10,886 (53.7%) | 9,379 (46.3%) |
| Accommodation & Food Services | 25,766 (49.6%) | 26,144 (50.4%) |
| Public Administration | 15,154 (52.8%) | 13,518 (47.1%) |
| Total | 479,704 (51.8%) | 446,353 (48.2%) |
Education in Area Code 203
School Enrollment in Area Code 203
The most common levels of schooling among the 464,898 students in Area Code 203 are college / undergraduate (105,377 | 22.7%), high school (101,088 | 21.7%), and middle school (92,099 | 19.8%).
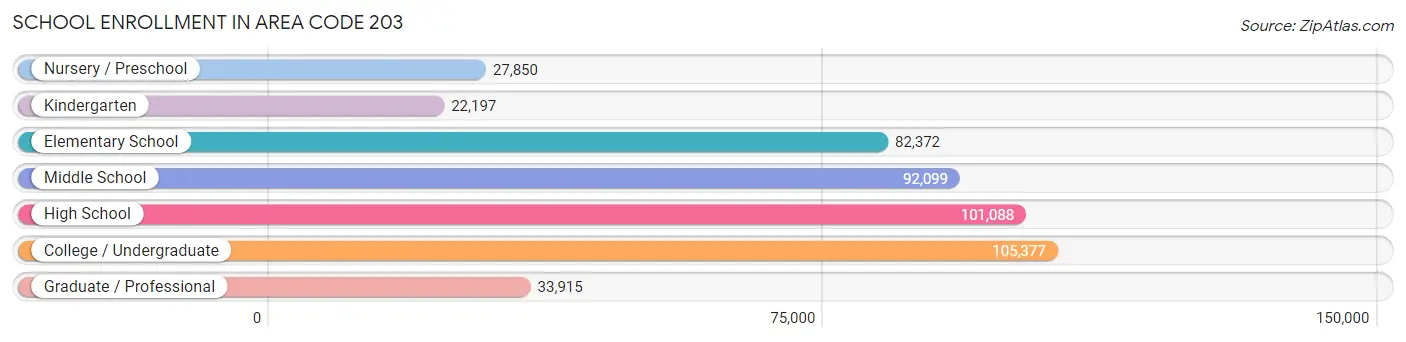
| School Level | # Students | % Students |
| Nursery / Preschool | 27,850 | 6.0% |
| Kindergarten | 22,197 | 4.8% |
| Elementary School | 82,372 | 17.7% |
| Middle School | 92,099 | 19.8% |
| High School | 101,088 | 21.7% |
| College / Undergraduate | 105,377 | 22.7% |
| Graduate / Professional | 33,915 | 7.3% |
| Total | 464,898 | 100.0% |
School Enrollment by Age by Funding Source in Area Code 203
Out of a total of 464,898 students who are enrolled in schools in Area Code 203, 116,613 (25.1%) attend a private institution, while the remaining 348,285 (74.9%) are enrolled in public schools. The age group of 25 to 34 year olds has the highest likelihood of being enrolled in private schools, with 13,723 (48.7% in the age bracket) enrolled. Conversely, the age group of 5 to 9 year old has the lowest likelihood of being enrolled in a private school, with 89,238 (89.2% in the age bracket) attending a public institution.
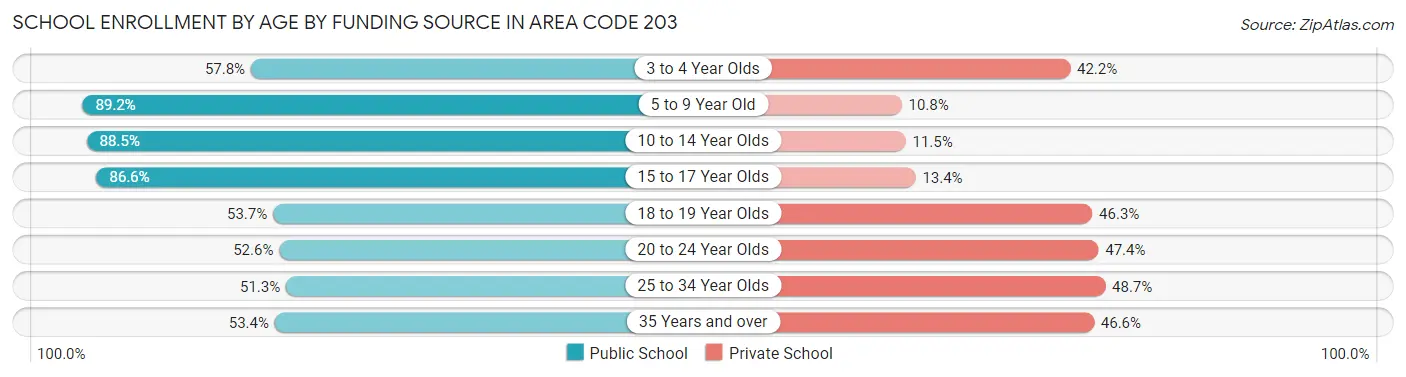
| Age Bracket | Public School | Private School |
| 3 to 4 Year Olds | 14,569 (57.8%) | 10,621 (42.2%) |
| 5 to 9 Year Old | 89,238 (89.2%) | 10,783 (10.8%) |
| 10 to 14 Year Olds | 100,845 (88.5%) | 13,144 (11.5%) |
| 15 to 17 Year Olds | 62,757 (86.6%) | 9,689 (13.4%) |
| 18 to 19 Year Olds | 23,693 (53.7%) | 20,410 (46.3%) |
| 20 to 24 Year Olds | 30,469 (52.6%) | 27,493 (47.4%) |
| 25 to 34 Year Olds | 14,455 (51.3%) | 13,723 (48.7%) |
| 35 Years and over | 12,286 (53.4%) | 10,723 (46.6%) |
| Total | 348,285 (74.9%) | 116,613 (25.1%) |
Educational Attainment by Field of Study in Area Code 203
Business (123,967 | 20.5%), social sciences (66,052 | 10.9%), education (51,979 | 8.6%), science & technology (48,886 | 8.1%), and literature & languages (38,672 | 6.4%) are the most common fields of study among 605,222 individuals in Area Code 203 who have obtained a bachelor's degree or higher.
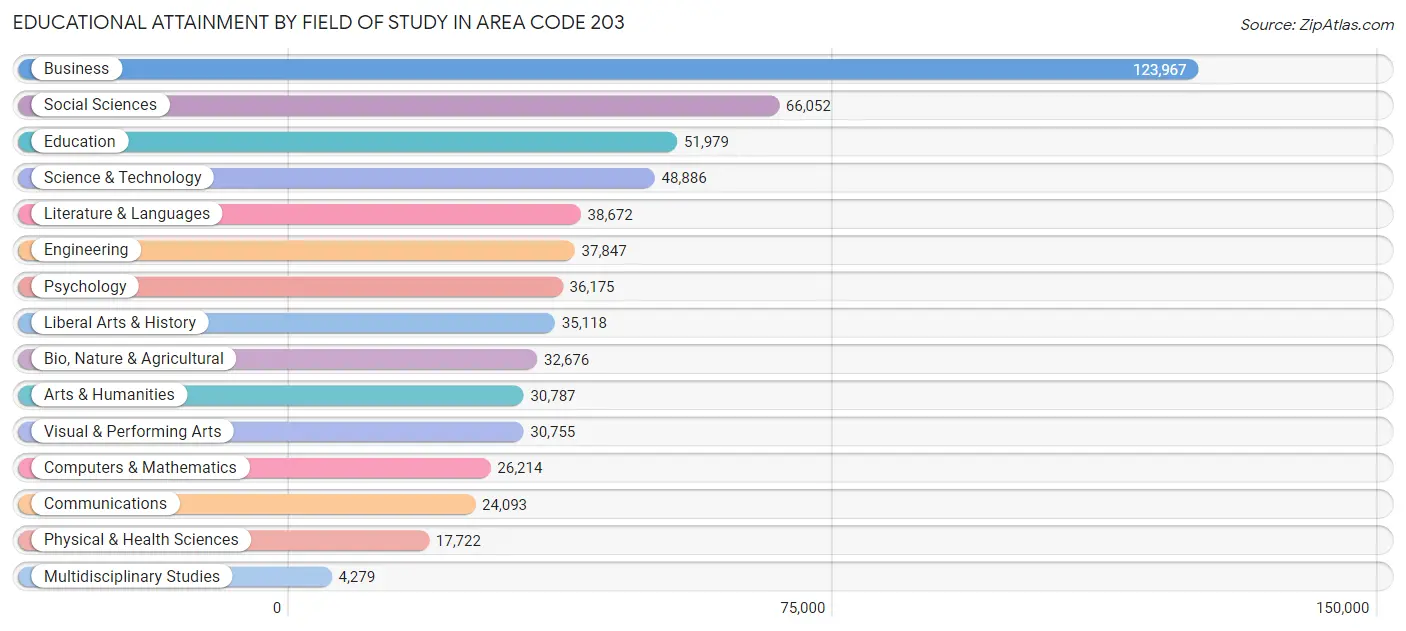
| Field of Study | # Graduates | % Graduates |
| Computers & Mathematics | 26,214 | 4.3% |
| Bio, Nature & Agricultural | 32,676 | 5.4% |
| Physical & Health Sciences | 17,722 | 2.9% |
| Psychology | 36,175 | 6.0% |
| Social Sciences | 66,052 | 10.9% |
| Engineering | 37,847 | 6.2% |
| Multidisciplinary Studies | 4,279 | 0.7% |
| Science & Technology | 48,886 | 8.1% |
| Business | 123,967 | 20.5% |
| Education | 51,979 | 8.6% |
| Literature & Languages | 38,672 | 6.4% |
| Liberal Arts & History | 35,118 | 5.8% |
| Visual & Performing Arts | 30,755 | 5.1% |
| Communications | 24,093 | 4.0% |
| Arts & Humanities | 30,787 | 5.1% |
| Total | 605,222 | 100.0% |
Transportation & Commute in Area Code 203
Vehicle Availability by Sex in Area Code 203
The most prevalent vehicle ownership categories in Area Code 203 are males with 2 vehicles (203,497, accounting for 43.6%) and females with 2 vehicles (173,157, making up 47.4%).
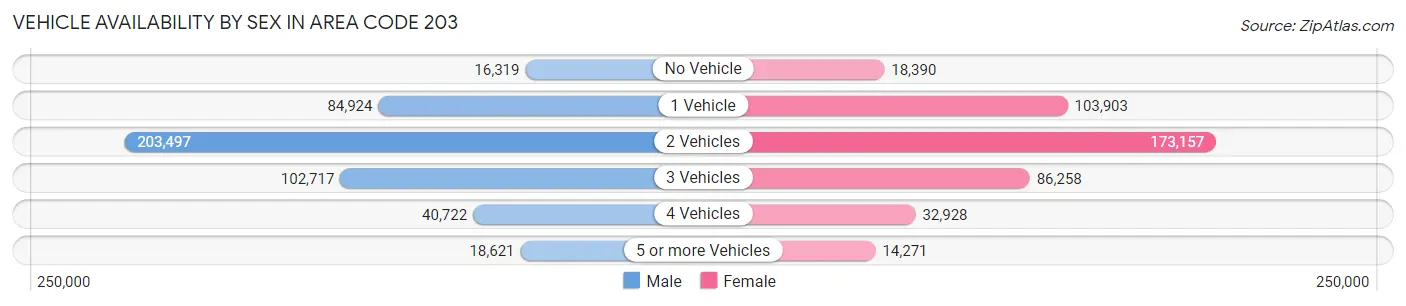
| Vehicles Available | Male | Female |
| No Vehicle | 16,319 (3.5%) | 18,390 (4.3%) |
| 1 Vehicle | 84,924 (18.2%) | 103,903 (24.2%) |
| 2 Vehicles | 203,497 (43.6%) | 173,157 (40.4%) |
| 3 Vehicles | 102,717 (22.0%) | 86,258 (20.1%) |
| 4 Vehicles | 40,722 (8.7%) | 32,928 (7.7%) |
| 5 or more Vehicles | 18,621 (4.0%) | 14,271 (3.3%) |
| Total | 466,800 (100.0%) | 428,907 (100.0%) |
Commute Time in Area Code 203
The most frequently occuring commute durations in Area Code 203 are 15 to 19 minutes (125,119 commuters, 15.9%), 20 to 24 minutes (115,692 commuters, 14.7%), and 10 to 14 minutes (114,809 commuters, 14.5%).
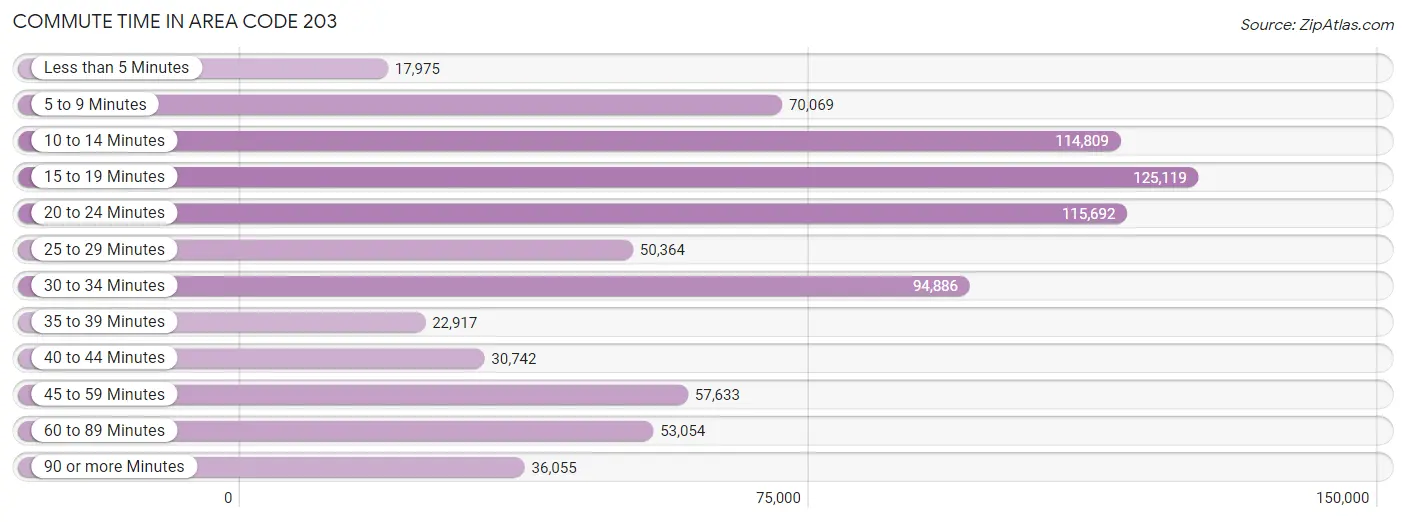
| Commute Time | # Commuters | % Commuters |
| Less than 5 Minutes | 17,975 | 2.3% |
| 5 to 9 Minutes | 70,069 | 8.9% |
| 10 to 14 Minutes | 114,809 | 14.5% |
| 15 to 19 Minutes | 125,119 | 15.9% |
| 20 to 24 Minutes | 115,692 | 14.7% |
| 25 to 29 Minutes | 50,364 | 6.4% |
| 30 to 34 Minutes | 94,886 | 12.0% |
| 35 to 39 Minutes | 22,917 | 2.9% |
| 40 to 44 Minutes | 30,742 | 3.9% |
| 45 to 59 Minutes | 57,633 | 7.3% |
| 60 to 89 Minutes | 53,054 | 6.7% |
| 90 or more Minutes | 36,055 | 4.6% |
Commute Time by Sex in Area Code 203
The most common commute times in Area Code 203 are 15 to 19 minutes (60,361 commuters, 14.6%) for males and 15 to 19 minutes (64,758 commuters, 17.2%) for females.
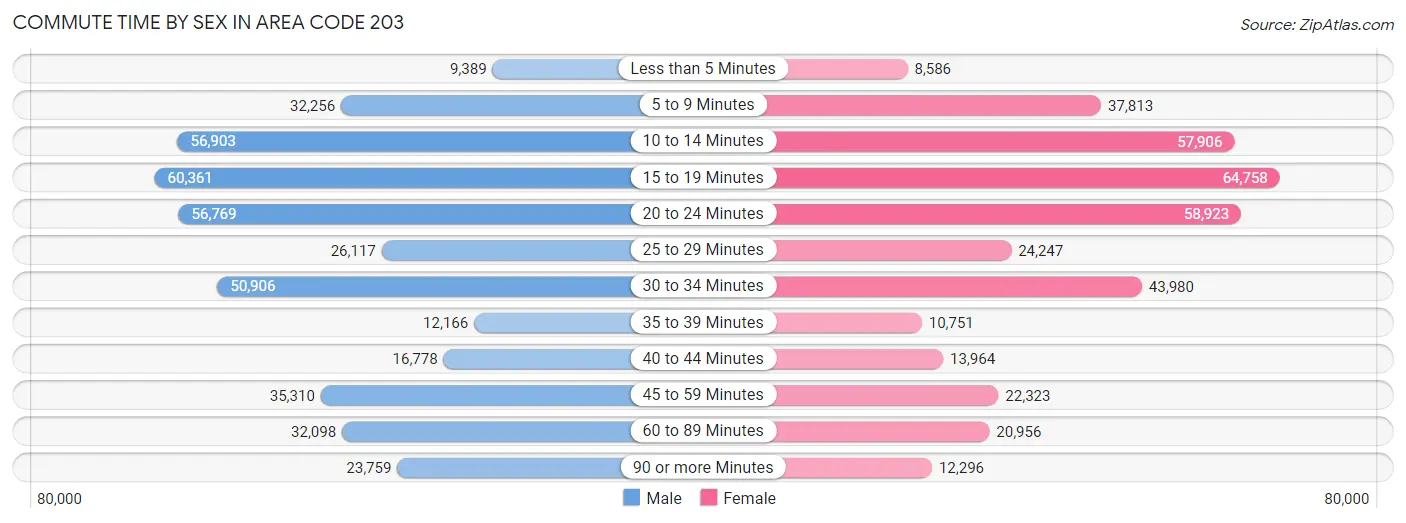
| Commute Time | Male | Female |
| Less than 5 Minutes | 9,389 (2.3%) | 8,586 (2.3%) |
| 5 to 9 Minutes | 32,256 (7.8%) | 37,813 (10.0%) |
| 10 to 14 Minutes | 56,903 (13.8%) | 57,906 (15.4%) |
| 15 to 19 Minutes | 60,361 (14.6%) | 64,758 (17.2%) |
| 20 to 24 Minutes | 56,769 (13.8%) | 58,923 (15.7%) |
| 25 to 29 Minutes | 26,117 (6.3%) | 24,247 (6.4%) |
| 30 to 34 Minutes | 50,906 (12.3%) | 43,980 (11.7%) |
| 35 to 39 Minutes | 12,166 (2.9%) | 10,751 (2.9%) |
| 40 to 44 Minutes | 16,778 (4.1%) | 13,964 (3.7%) |
| 45 to 59 Minutes | 35,310 (8.6%) | 22,323 (5.9%) |
| 60 to 89 Minutes | 32,098 (7.8%) | 20,956 (5.6%) |
| 90 or more Minutes | 23,759 (5.8%) | 12,296 (3.3%) |
Time of Departure to Work by Sex in Area Code 203
The most frequent times of departure to work in Area Code 203 are 7:00 AM to 7:29 AM (59,730, 14.5%) for males and 8:00 AM to 8:29 AM (59,200, 15.7%) for females.
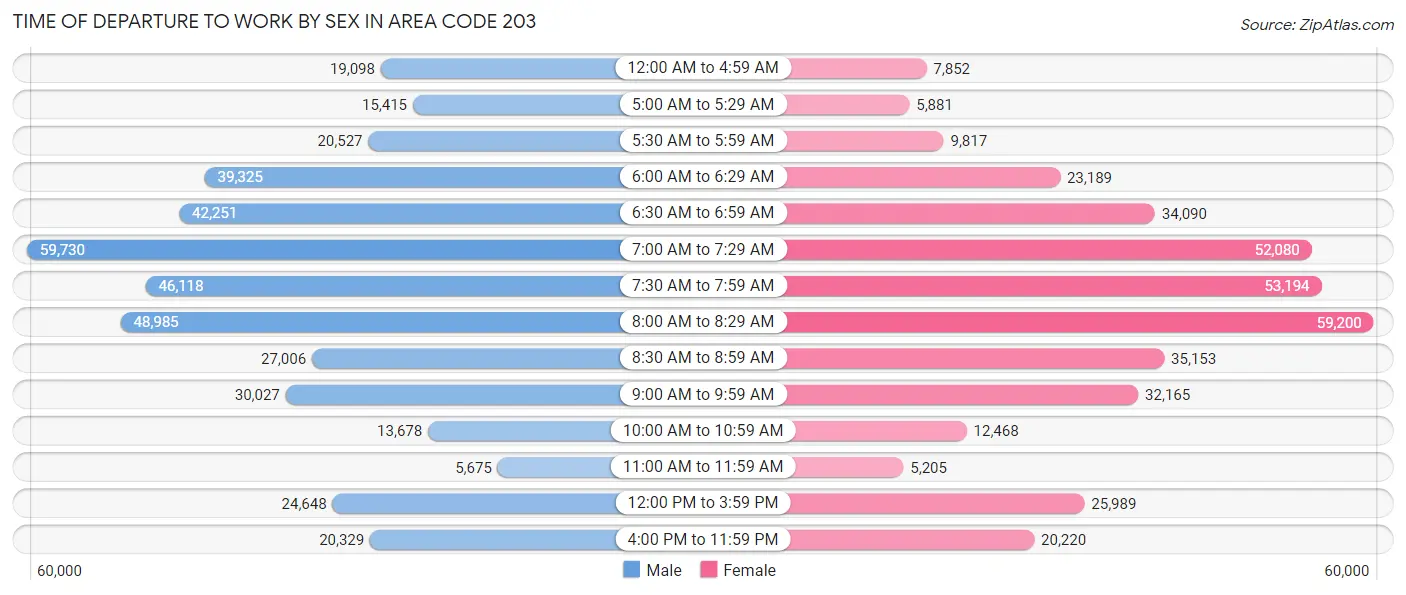
| Time of Departure | Male | Female |
| 12:00 AM to 4:59 AM | 19,098 (4.6%) | 7,852 (2.1%) |
| 5:00 AM to 5:29 AM | 15,415 (3.7%) | 5,881 (1.6%) |
| 5:30 AM to 5:59 AM | 20,527 (5.0%) | 9,817 (2.6%) |
| 6:00 AM to 6:29 AM | 39,325 (9.5%) | 23,189 (6.2%) |
| 6:30 AM to 6:59 AM | 42,251 (10.2%) | 34,090 (9.0%) |
| 7:00 AM to 7:29 AM | 59,730 (14.5%) | 52,080 (13.8%) |
| 7:30 AM to 7:59 AM | 46,118 (11.2%) | 53,194 (14.1%) |
| 8:00 AM to 8:29 AM | 48,985 (11.9%) | 59,200 (15.7%) |
| 8:30 AM to 8:59 AM | 27,006 (6.5%) | 35,153 (9.3%) |
| 9:00 AM to 9:59 AM | 30,027 (7.3%) | 32,165 (8.5%) |
| 10:00 AM to 10:59 AM | 13,678 (3.3%) | 12,468 (3.3%) |
| 11:00 AM to 11:59 AM | 5,675 (1.4%) | 5,205 (1.4%) |
| 12:00 PM to 3:59 PM | 24,648 (6.0%) | 25,989 (6.9%) |
| 4:00 PM to 11:59 PM | 20,329 (4.9%) | 20,220 (5.4%) |
| Total | 412,812 (100.0%) | 376,503 (100.0%) |
Housing Occupancy in Area Code 203
Occupancy by Ownership in Area Code 203
Of the total 698,702 dwellings in Area Code 203, owner-occupied units account for 448,703 (64.2%), while renter-occupied units make up 249,999 (35.8%).
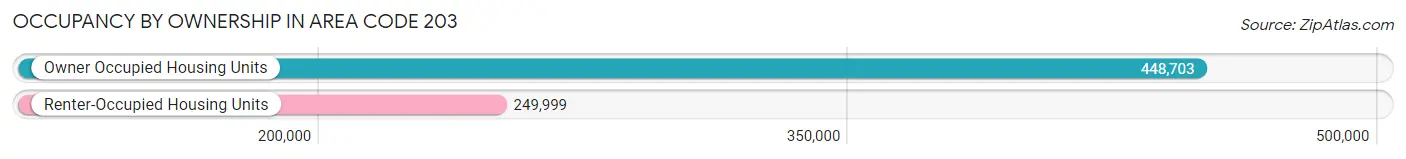
| Occupancy | # Housing Units | % Housing Units |
| Owner Occupied Housing Units | 448,703 | 64.2% |
| Renter-Occupied Housing Units | 249,999 | 35.8% |
| Total Occupied Housing Units | 698,702 | 100.0% |
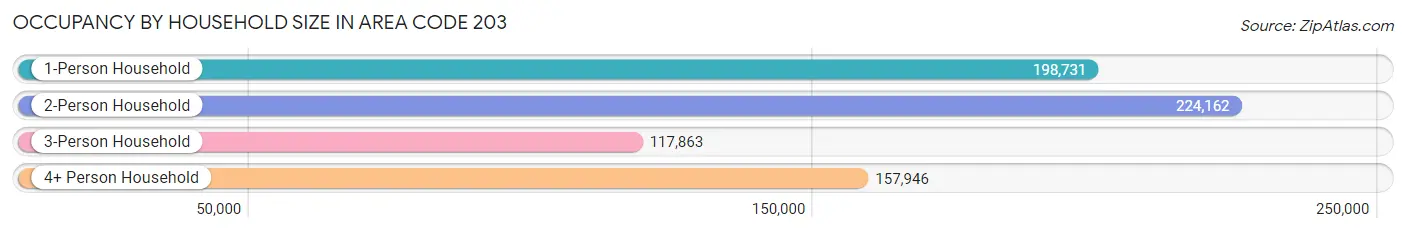
Occupancy by Household Size in Area Code 203
| Household Size | # Housing Units | % Housing Units |
| 1-Person Household | 198,731 | 28.4% |
| 2-Person Household | 224,162 | 32.1% |
| 3-Person Household | 117,863 | 16.9% |
| 4+ Person Household | 157,946 | 22.6% |
| Total Housing Units | 698,702 | 100.0% |
Occupancy by Ownership by Household Size in Area Code 203
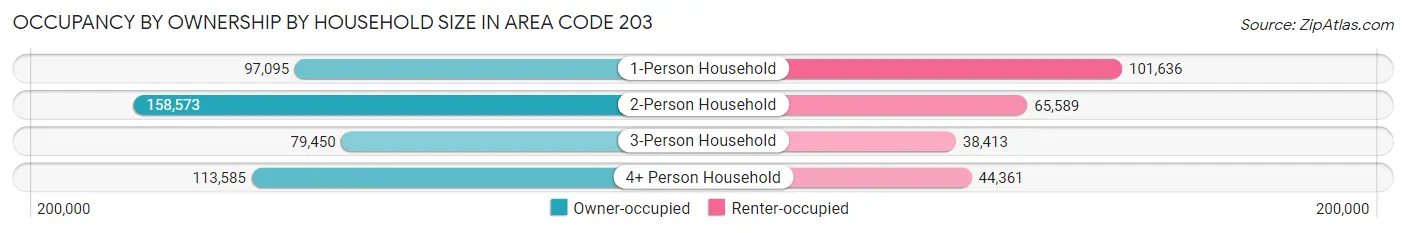
| Household Size | Owner-occupied | Renter-occupied |
| 1-Person Household | 97,095 (48.9%) | 101,636 (51.1%) |
| 2-Person Household | 158,573 (70.7%) | 65,589 (29.3%) |
| 3-Person Household | 79,450 (67.4%) | 38,413 (32.6%) |
| 4+ Person Household | 113,585 (71.9%) | 44,361 (28.1%) |
| Total Housing Units | 448,703 (64.2%) | 249,999 (35.8%) |
Occupancy by Educational Attainment in Area Code 203
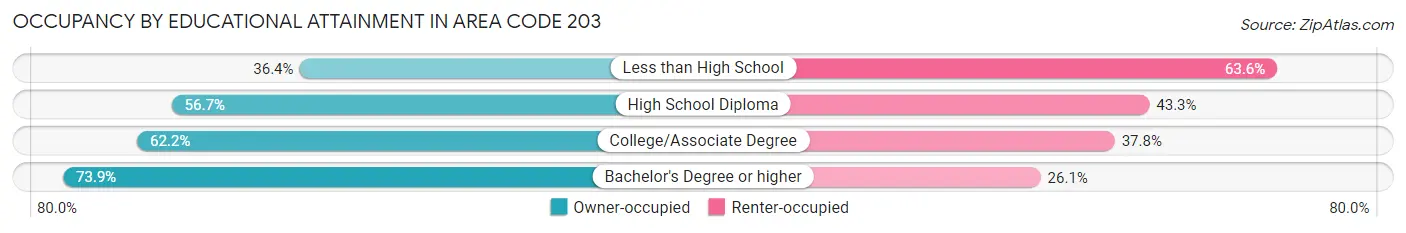
| Household Size | Owner-occupied | Renter-occupied |
| Less than High School | 21,418 (36.4%) | 37,383 (63.6%) |
| High School Diploma | 88,912 (56.7%) | 67,990 (43.3%) |
| College/Associate Degree | 98,563 (62.2%) | 59,995 (37.8%) |
| Bachelor's Degree or higher | 239,810 (73.9%) | 84,631 (26.1%) |
Occupancy by Age of Householder in Area Code 203
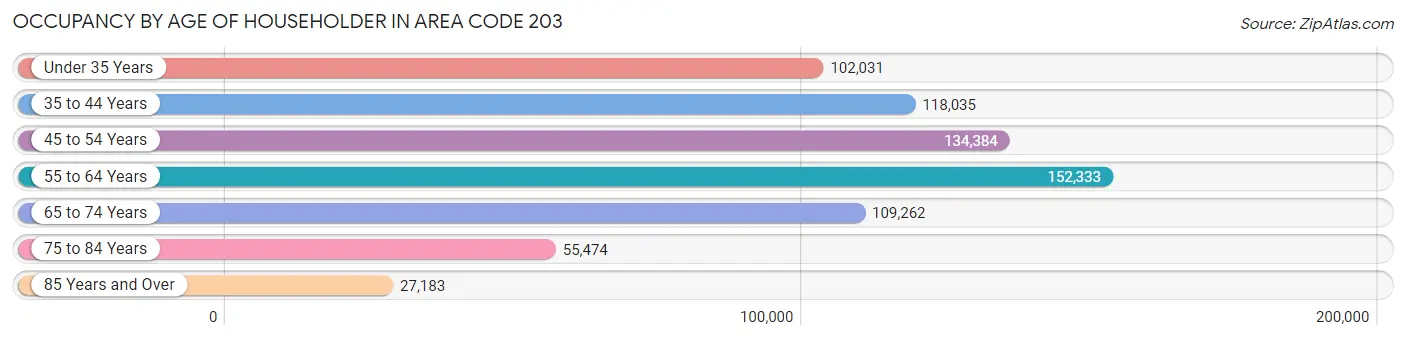
| Age Bracket | # Households | % Households |
| Under 35 Years | 102,031 | 14.6% |
| 35 to 44 Years | 118,035 | 16.9% |
| 45 to 54 Years | 134,384 | 19.2% |
| 55 to 64 Years | 152,333 | 21.8% |
| 65 to 74 Years | 109,262 | 15.6% |
| 75 to 84 Years | 55,474 | 7.9% |
| 85 Years and Over | 27,183 | 3.9% |
| Total | 698,702 | 100.0% |
Housing Finances in Area Code 203
Median Income by Occupancy in Area Code 203
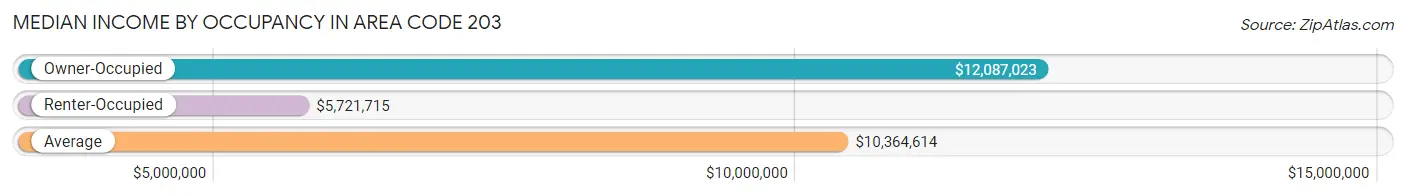
| Occupancy Type | # Households | Median Income |
| Owner-Occupied | 448,703 (64.2%) | $12,087,023 |
| Renter-Occupied | 249,999 (35.8%) | $5,721,715 |
| Average | 698,702 (100.0%) | $10,364,614 |
Occupancy by Householder Income Bracket in Area Code 203
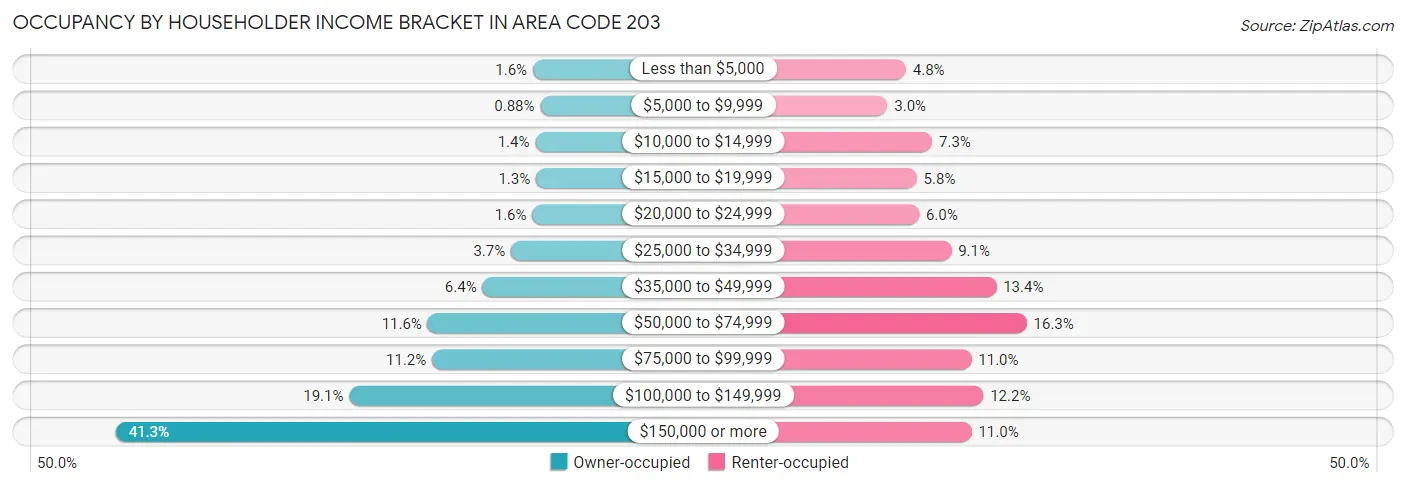
| Income Bracket | Owner-occupied | Renter-occupied |
| Less than $5,000 | 7,132 (1.6%) | 11,981 (4.8%) |
| $5,000 to $9,999 | 3,931 (0.9%) | 7,573 (3.0%) |
| $10,000 to $14,999 | 6,086 (1.4%) | 18,225 (7.3%) |
| $15,000 to $19,999 | 5,809 (1.3%) | 14,562 (5.8%) |
| $20,000 to $24,999 | 7,338 (1.6%) | 15,092 (6.0%) |
| $25,000 to $34,999 | 16,467 (3.7%) | 22,770 (9.1%) |
| $35,000 to $49,999 | 28,686 (6.4%) | 33,495 (13.4%) |
| $50,000 to $74,999 | 52,089 (11.6%) | 40,734 (16.3%) |
| $75,000 to $99,999 | 50,209 (11.2%) | 27,575 (11.0%) |
| $100,000 to $149,999 | 85,595 (19.1%) | 30,390 (12.2%) |
| $150,000 or more | 185,361 (41.3%) | 27,602 (11.0%) |
| Total | 448,703 (100.0%) | 249,999 (100.0%) |
Monthly Housing Cost Tiers in Area Code 203
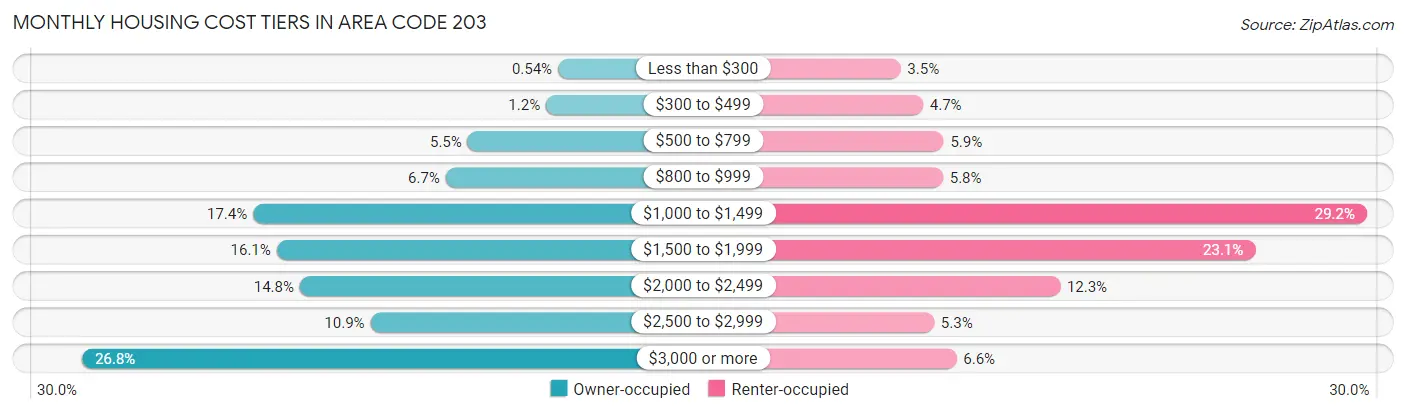
| Monthly Cost | Owner-occupied | Renter-occupied |
| Less than $300 | 2,444 (0.5%) | 8,706 (3.5%) |
| $300 to $499 | 5,363 (1.2%) | 11,789 (4.7%) |
| $500 to $799 | 24,810 (5.5%) | 14,655 (5.9%) |
| $800 to $999 | 30,262 (6.7%) | 14,552 (5.8%) |
| $1,000 to $1,499 | 77,969 (17.4%) | 73,095 (29.2%) |
| $1,500 to $1,999 | 72,134 (16.1%) | 57,680 (23.1%) |
| $2,000 to $2,499 | 66,398 (14.8%) | 30,732 (12.3%) |
| $2,500 to $2,999 | 48,919 (10.9%) | 13,330 (5.3%) |
| $3,000 or more | 120,404 (26.8%) | 16,426 (6.6%) |
| Total | 448,703 (100.0%) | 249,999 (100.0%) |
Physical Housing Characteristics in Area Code 203
Housing Structures in Area Code 203
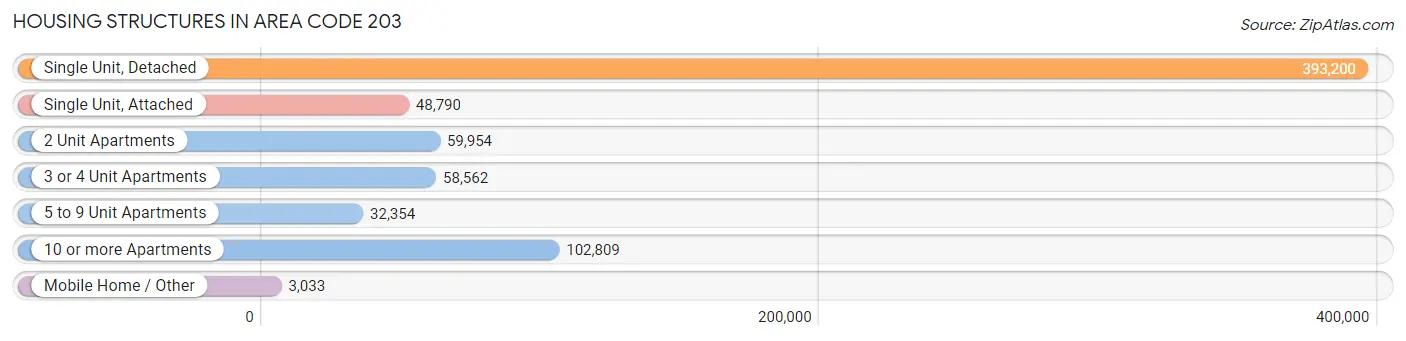
| Structure Type | # Housing Units | % Housing Units |
| Single Unit, Detached | 393,200 | 56.3% |
| Single Unit, Attached | 48,790 | 7.0% |
| 2 Unit Apartments | 59,954 | 8.6% |
| 3 or 4 Unit Apartments | 58,562 | 8.4% |
| 5 to 9 Unit Apartments | 32,354 | 4.6% |
| 10 or more Apartments | 102,809 | 14.7% |
| Mobile Home / Other | 3,033 | 0.4% |
| Total | 698,702 | 100.0% |
Housing Structures by Occupancy in Area Code 203
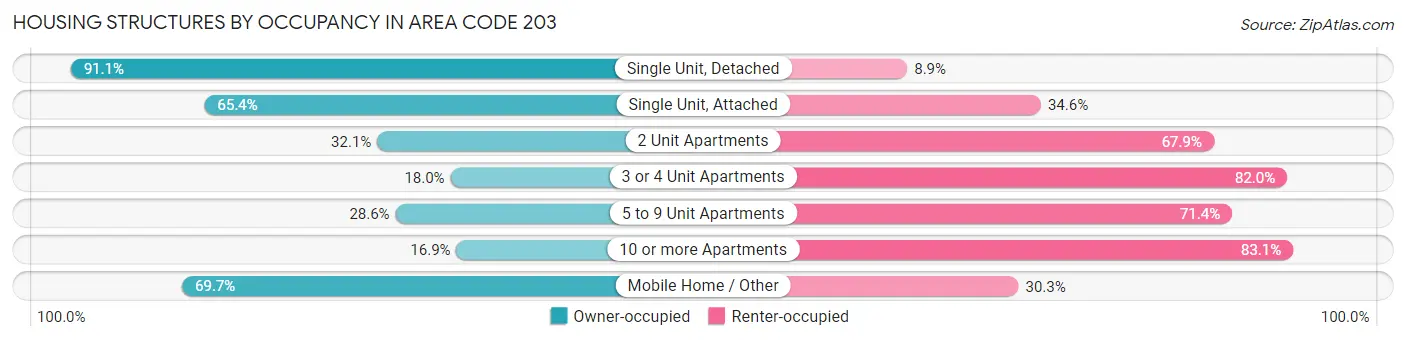
| Structure Type | Owner-occupied | Renter-occupied |
| Single Unit, Detached | 358,294 (91.1%) | 34,906 (8.9%) |
| Single Unit, Attached | 31,899 (65.4%) | 16,891 (34.6%) |
| 2 Unit Apartments | 19,260 (32.1%) | 40,694 (67.9%) |
| 3 or 4 Unit Apartments | 10,547 (18.0%) | 48,015 (82.0%) |
| 5 to 9 Unit Apartments | 9,254 (28.6%) | 23,100 (71.4%) |
| 10 or more Apartments | 17,335 (16.9%) | 85,474 (83.1%) |
| Mobile Home / Other | 2,114 (69.7%) | 919 (30.3%) |
| Total | 448,703 (64.2%) | 249,999 (35.8%) |
Housing Structures by Number of Rooms in Area Code 203
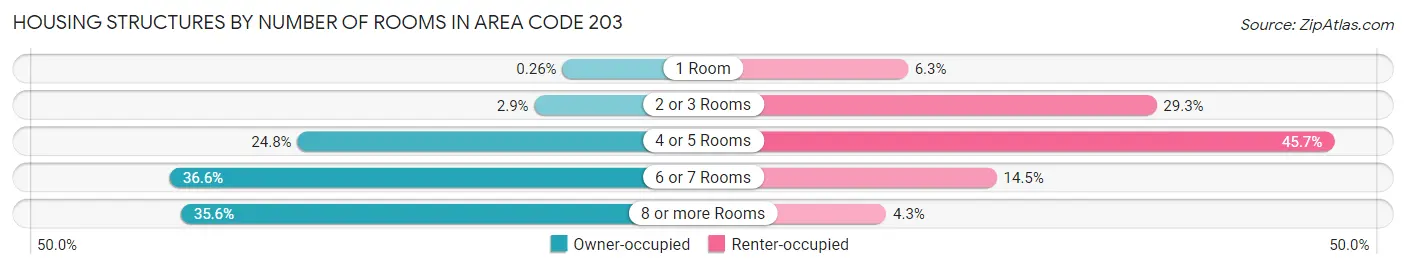
| Number of Rooms | Owner-occupied | Renter-occupied |
| 1 Room | 1,171 (0.3%) | 15,669 (6.3%) |
| 2 or 3 Rooms | 12,797 (2.9%) | 73,180 (29.3%) |
| 4 or 5 Rooms | 111,165 (24.8%) | 114,254 (45.7%) |
| 6 or 7 Rooms | 164,052 (36.6%) | 36,229 (14.5%) |
| 8 or more Rooms | 159,518 (35.5%) | 10,667 (4.3%) |
| Total | 448,703 (100.0%) | 249,999 (100.0%) |
Housing Structure by Heating Type in Area Code 203
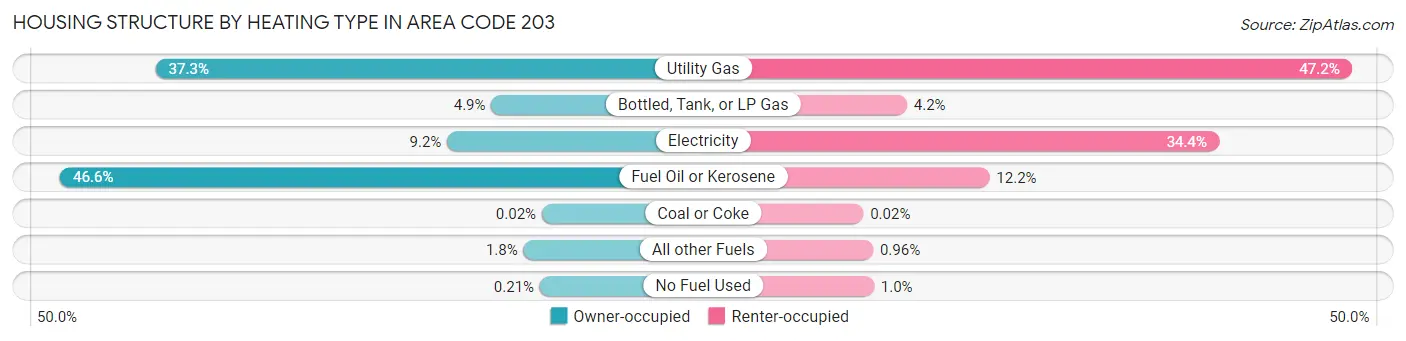
| Heating Type | Owner-occupied | Renter-occupied |
| Utility Gas | 167,524 (37.3%) | 117,968 (47.2%) |
| Bottled, Tank, or LP Gas | 21,984 (4.9%) | 10,579 (4.2%) |
| Electricity | 41,161 (9.2%) | 85,891 (34.4%) |
| Fuel Oil or Kerosene | 208,966 (46.6%) | 30,533 (12.2%) |
| Coal or Coke | 85 (0.0%) | 40 (0.0%) |
| All other Fuels | 8,051 (1.8%) | 2,398 (1.0%) |
| No Fuel Used | 932 (0.2%) | 2,590 (1.0%) |
| Total | 448,703 (100.0%) | 249,999 (100.0%) |
Household Vehicle Usage in Area Code 203
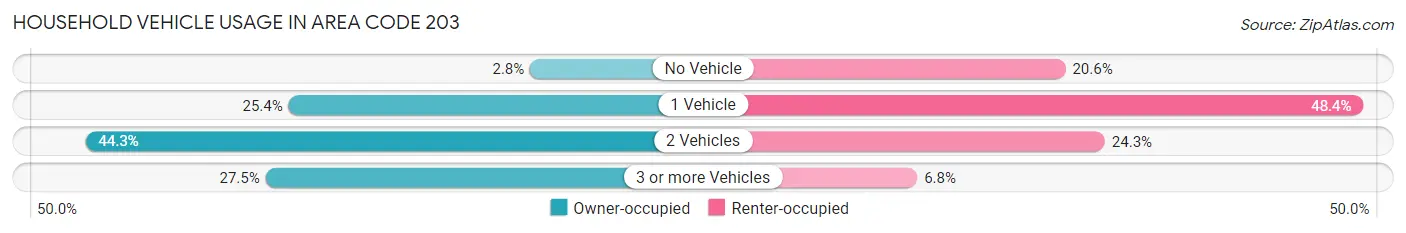
| Vehicles per Household | Owner-occupied | Renter-occupied |
| No Vehicle | 12,606 (2.8%) | 51,485 (20.6%) |
| 1 Vehicle | 113,798 (25.4%) | 120,975 (48.4%) |
| 2 Vehicles | 198,866 (44.3%) | 60,668 (24.3%) |
| 3 or more Vehicles | 123,433 (27.5%) | 16,871 (6.8%) |
| Total | 448,703 (100.0%) | 249,999 (100.0%) |
Real Estate & Mortgages in Area Code 203
Real Estate and Mortgage Overview in Area Code 203
| Characteristic | Without Mortgage | With Mortgage |
| Housing Units | 149,002 | 299,701 |
| Median Property Value | $42,285,500 | $45,288,000 |
| Median Household Income | $8,963,792 | $140,461 |
| Monthly Housing Costs | $102,480 | $114,044 |
| Real Estate Taxes | $638,112 | $3,165 |
Property Value by Mortgage Status in Area Code 203
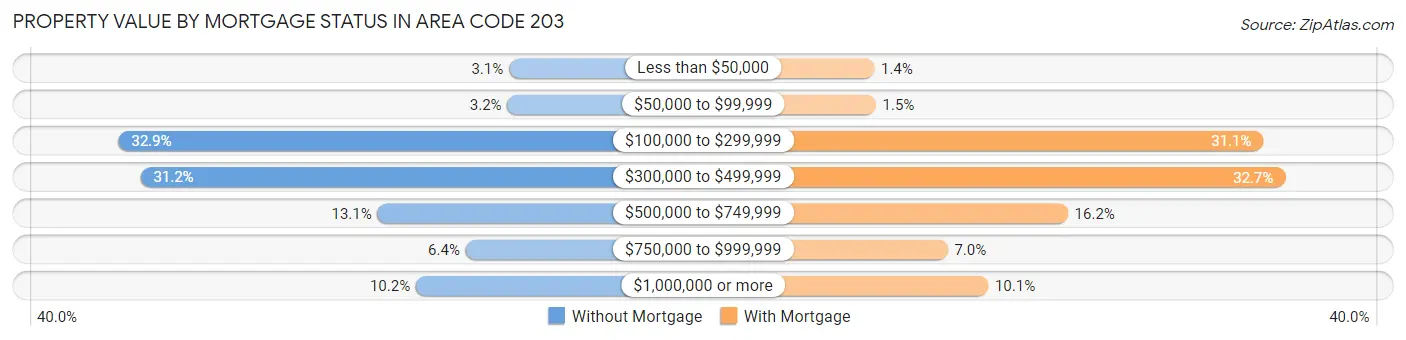
| Property Value | Without Mortgage | With Mortgage |
| Less than $50,000 | 4,604 (3.1%) | 4,237 (1.4%) |
| $50,000 to $99,999 | 4,778 (3.2%) | 4,578 (1.5%) |
| $100,000 to $299,999 | 48,960 (32.9%) | 93,107 (31.1%) |
| $300,000 to $499,999 | 46,442 (31.2%) | 98,117 (32.7%) |
| $500,000 to $749,999 | 19,539 (13.1%) | 48,436 (16.2%) |
| $750,000 to $999,999 | 9,516 (6.4%) | 20,991 (7.0%) |
| $1,000,000 or more | 15,163 (10.2%) | 30,235 (10.1%) |
| Total | 149,002 (100.0%) | 299,701 (100.0%) |
Household Income by Mortgage Status in Area Code 203
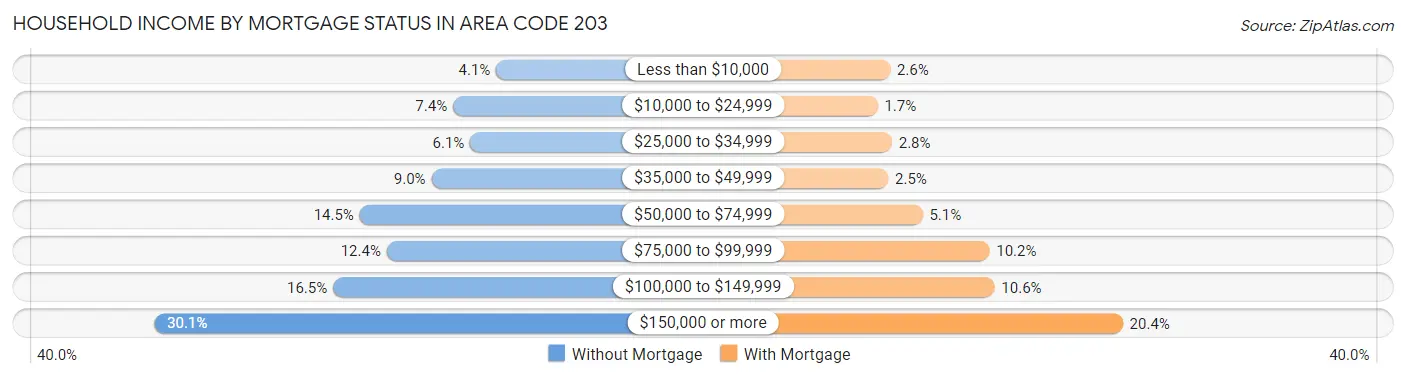
| Household Income | Without Mortgage | With Mortgage |
| Less than $10,000 | 6,065 (4.1%) | 7,856 (2.6%) |
| $10,000 to $24,999 | 10,971 (7.4%) | 4,998 (1.7%) |
| $25,000 to $34,999 | 9,022 (6.0%) | 8,262 (2.8%) |
| $35,000 to $49,999 | 13,406 (9.0%) | 7,445 (2.5%) |
| $50,000 to $74,999 | 21,560 (14.5%) | 15,280 (5.1%) |
| $75,000 to $99,999 | 18,486 (12.4%) | 30,529 (10.2%) |
| $100,000 to $149,999 | 24,592 (16.5%) | 31,723 (10.6%) |
| $150,000 or more | 44,900 (30.1%) | 61,003 (20.3%) |
| Total | 149,002 (100.0%) | 299,701 (100.0%) |
Property Value to Household Income Ratio in Area Code 203
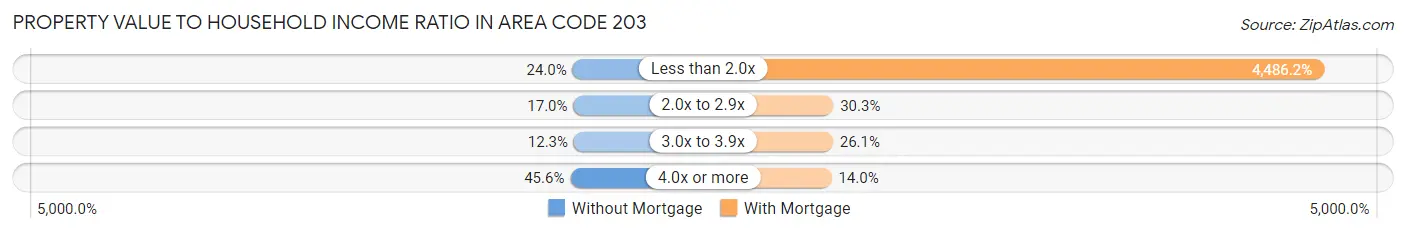
| Value-to-Income Ratio | Without Mortgage | With Mortgage |
| Less than 2.0x | 35,752 (24.0%) | 13,445,067 (4,486.2%) |
| 2.0x to 2.9x | 25,309 (17.0%) | 90,681 (30.3%) |
| 3.0x to 3.9x | 18,271 (12.3%) | 78,149 (26.1%) |
| 4.0x or more | 67,888 (45.6%) | 42,022 (14.0%) |
| Total | 149,002 (100.0%) | 299,701 (100.0%) |
Real Estate Taxes by Mortgage Status in Area Code 203
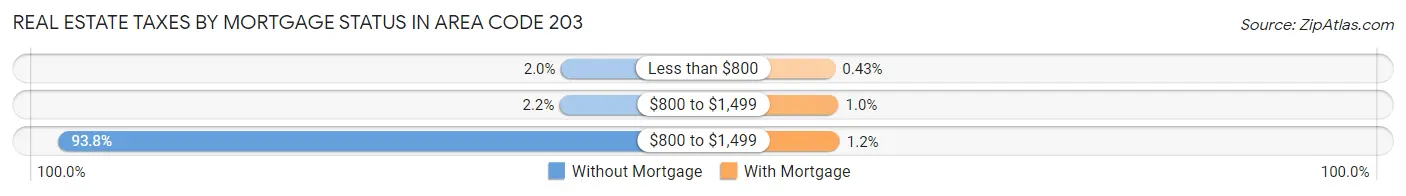
| Property Taxes | Without Mortgage | With Mortgage |
| Less than $800 | 2,926 (2.0%) | 1,278 (0.4%) |
| $800 to $1,499 | 3,267 (2.2%) | 3,015 (1.0%) |
| $800 to $1,499 | 139,753 (93.8%) | 3,714 (1.2%) |
| Total | 149,002 (100.0%) | 299,701 (100.0%) |
Health & Disability in Area Code 203
Health Insurance Coverage by Age in Area Code 203
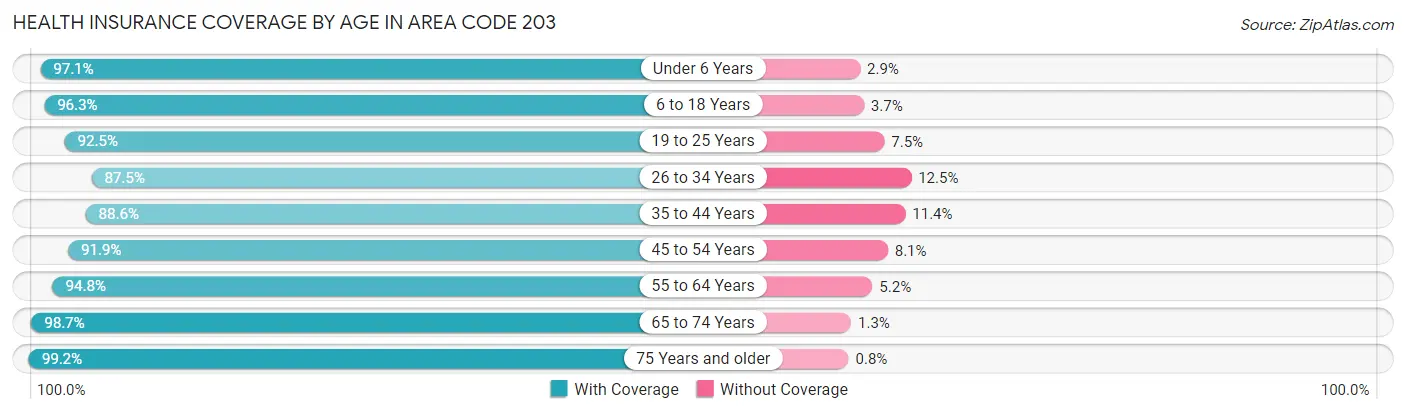
| Age Bracket | With Coverage | Without Coverage |
| Under 6 Years | 113,174 (97.1%) | 3,423 (2.9%) |
| 6 to 18 Years | 287,492 (96.3%) | 10,917 (3.7%) |
| 19 to 25 Years | 155,925 (92.5%) | 12,592 (7.5%) |
| 26 to 34 Years | 175,800 (87.5%) | 25,070 (12.5%) |
| 35 to 44 Years | 200,015 (88.6%) | 25,703 (11.4%) |
| 45 to 54 Years | 225,961 (91.9%) | 19,938 (8.1%) |
| 55 to 64 Years | 247,917 (94.8%) | 13,719 (5.2%) |
| 65 to 74 Years | 172,820 (98.7%) | 2,221 (1.3%) |
| 75 Years and older | 124,910 (99.2%) | 1,005 (0.8%) |
| Total | 1,704,014 (93.7%) | 114,588 (6.3%) |
Health Insurance Coverage by Citizenship Status in Area Code 203
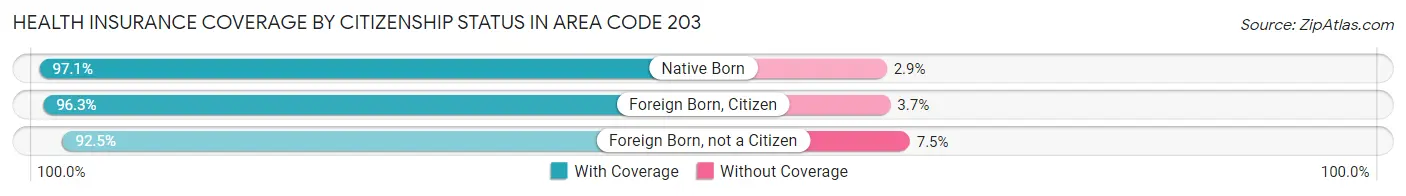
| Citizenship Status | With Coverage | Without Coverage |
| Native Born | 113,174 (97.1%) | 3,423 (2.9%) |
| Foreign Born, Citizen | 287,492 (96.3%) | 10,917 (3.7%) |
| Foreign Born, not a Citizen | 155,925 (92.5%) | 12,592 (7.5%) |
Health Insurance Coverage by Household Income in Area Code 203
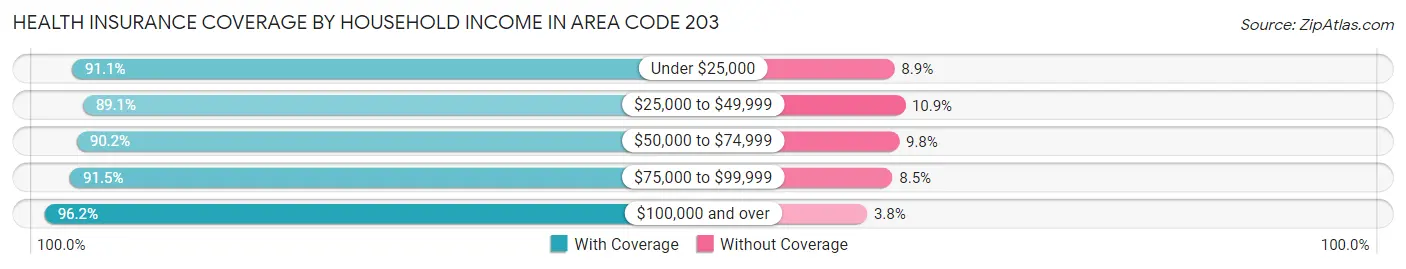
| Household Income | With Coverage | Without Coverage |
| Under $25,000 | 153,241 (91.1%) | 15,005 (8.9%) |
| $25,000 to $49,999 | 187,337 (89.1%) | 22,902 (10.9%) |
| $50,000 to $74,999 | 193,853 (90.2%) | 21,043 (9.8%) |
| $75,000 to $99,999 | 176,786 (91.5%) | 16,480 (8.5%) |
| $100,000 and over | 961,197 (96.2%) | 37,776 (3.8%) |
Public vs Private Health Insurance Coverage by Age in Area Code 203
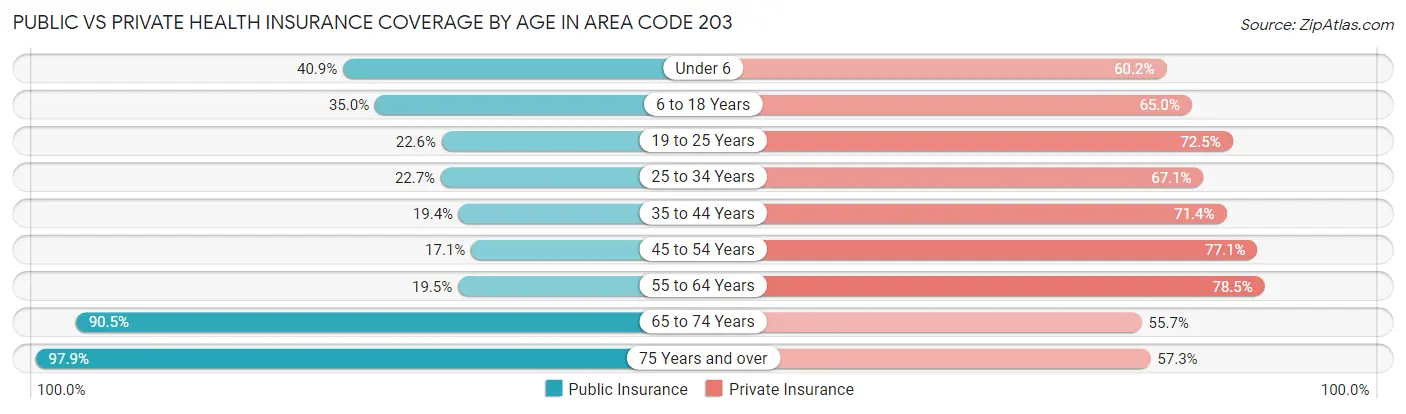
| Age Bracket | Public Insurance | Private Insurance |
| Under 6 | 47,676 (40.9%) | 70,204 (60.2%) |
| 6 to 18 Years | 104,314 (35.0%) | 193,813 (64.9%) |
| 19 to 25 Years | 38,032 (22.6%) | 122,194 (72.5%) |
| 25 to 34 Years | 45,641 (22.7%) | 134,819 (67.1%) |
| 35 to 44 Years | 43,761 (19.4%) | 161,101 (71.4%) |
| 45 to 54 Years | 42,065 (17.1%) | 189,690 (77.1%) |
| 55 to 64 Years | 51,101 (19.5%) | 205,344 (78.5%) |
| 65 to 74 Years | 158,421 (90.5%) | 97,433 (55.7%) |
| 75 Years and over | 123,326 (97.9%) | 72,126 (57.3%) |
| Total | 654,337 (36.0%) | 1,246,724 (68.5%) |
Disability Status by Sex by Age in Area Code 203
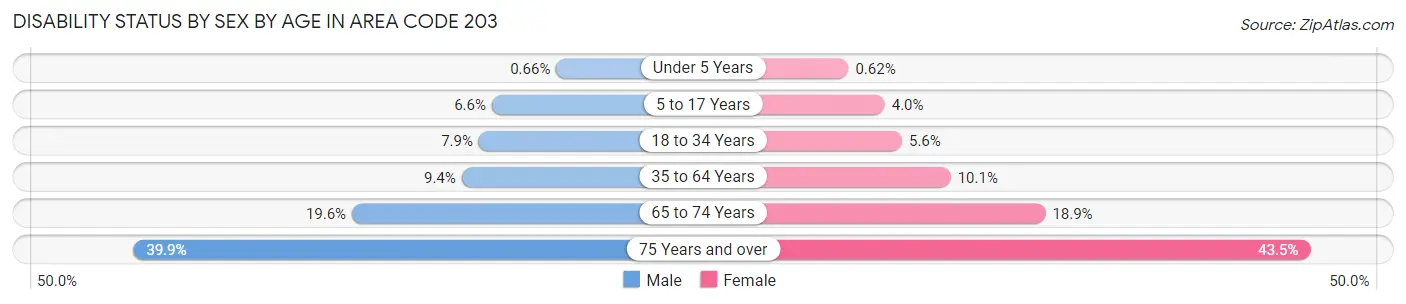
| Age Bracket | Male | Female |
| Under 5 Years | 325 (0.7%) | 286 (0.6%) |
| 5 to 17 Years | 9,928 (6.6%) | 5,720 (4.0%) |
| 18 to 34 Years | 15,523 (7.9%) | 11,078 (5.6%) |
| 35 to 64 Years | 33,670 (9.4%) | 38,068 (10.1%) |
| 65 to 74 Years | 16,040 (19.6%) | 17,630 (18.9%) |
| 75 Years and over | 20,663 (39.9%) | 32,238 (43.5%) |
Disability Class by Sex by Age in Area Code 203
Disability Class: Hearing Difficulty
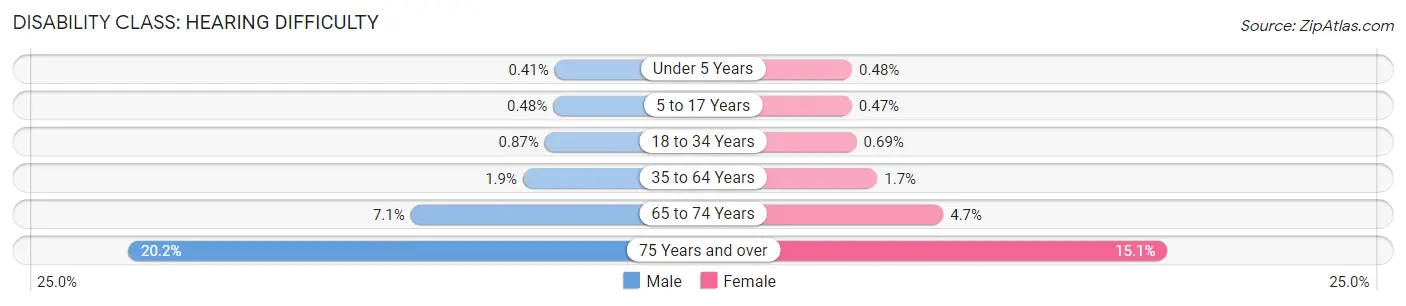
| Age Bracket | Male | Female |
| Under 5 Years | 201 (0.4%) | 220 (0.5%) |
| 5 to 17 Years | 725 (0.5%) | 668 (0.5%) |
| 18 to 34 Years | 1,711 (0.9%) | 1,370 (0.7%) |
| 35 to 64 Years | 6,699 (1.9%) | 6,212 (1.7%) |
| 65 to 74 Years | 5,795 (7.1%) | 4,391 (4.7%) |
| 75 Years and over | 10,457 (20.2%) | 11,194 (15.1%) |
Disability Class: Vision Difficulty
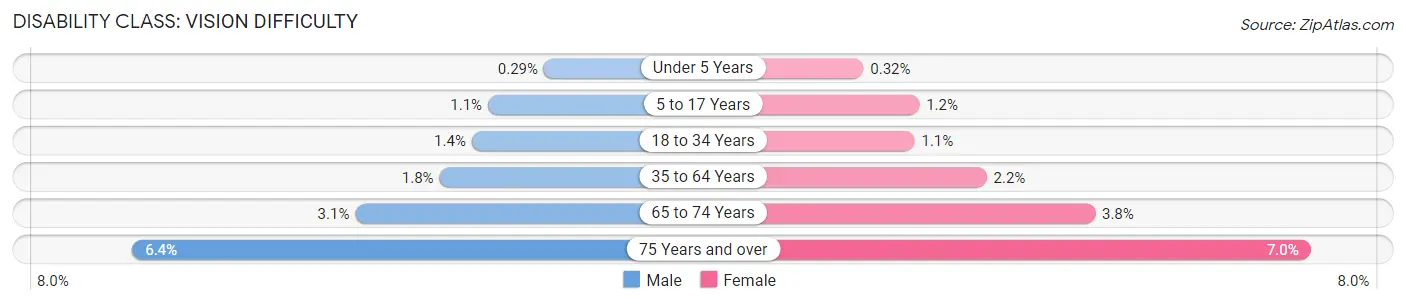
| Age Bracket | Male | Female |
| Under 5 Years | 143 (0.3%) | 150 (0.3%) |
| 5 to 17 Years | 1,670 (1.1%) | 1,649 (1.1%) |
| 18 to 34 Years | 2,696 (1.4%) | 2,142 (1.1%) |
| 35 to 64 Years | 6,562 (1.8%) | 8,089 (2.1%) |
| 65 to 74 Years | 2,527 (3.1%) | 3,510 (3.8%) |
| 75 Years and over | 3,311 (6.4%) | 5,159 (7.0%) |
Disability Class: Cognitive Difficulty
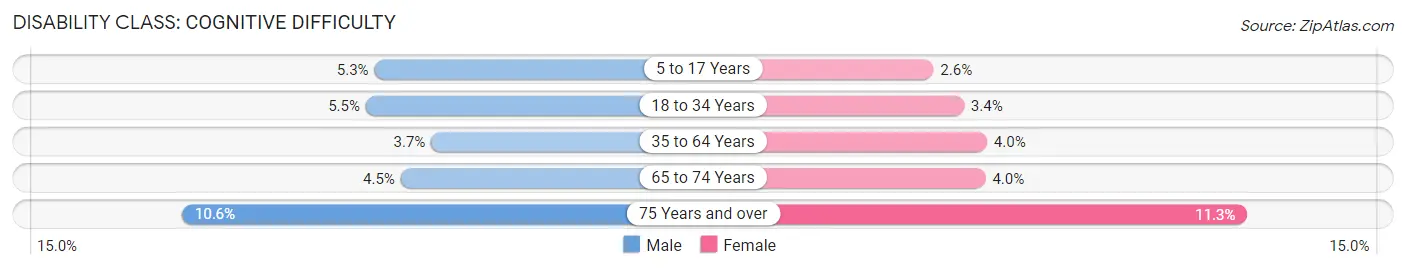
| Age Bracket | Male | Female |
| 5 to 17 Years | 7,862 (5.3%) | 3,659 (2.5%) |
| 18 to 34 Years | 10,882 (5.5%) | 6,733 (3.4%) |
| 35 to 64 Years | 13,115 (3.7%) | 15,198 (4.0%) |
| 65 to 74 Years | 3,700 (4.5%) | 3,736 (4.0%) |
| 75 Years and over | 5,499 (10.6%) | 8,369 (11.3%) |
Disability Class: Ambulatory Difficulty
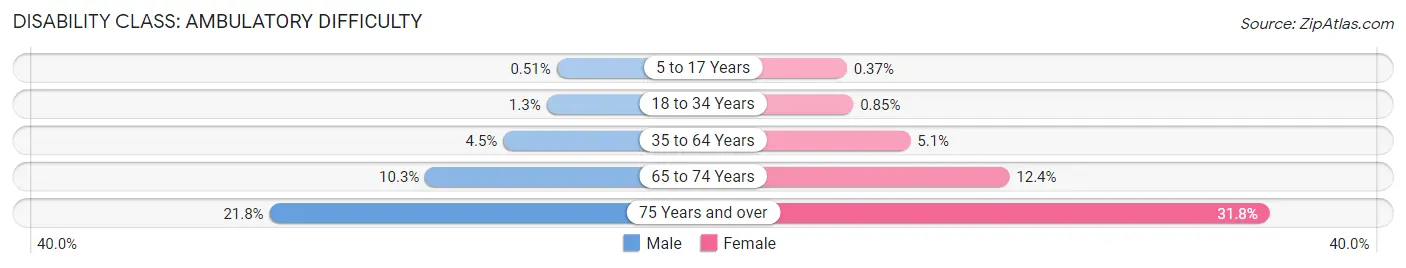
| Age Bracket | Male | Female |
| 5 to 17 Years | 757 (0.5%) | 532 (0.4%) |
| 18 to 34 Years | 2,475 (1.3%) | 1,694 (0.9%) |
| 35 to 64 Years | 15,964 (4.5%) | 19,151 (5.1%) |
| 65 to 74 Years | 8,387 (10.3%) | 11,607 (12.4%) |
| 75 Years and over | 11,295 (21.8%) | 23,546 (31.8%) |
Disability Class: Self-Care Difficulty
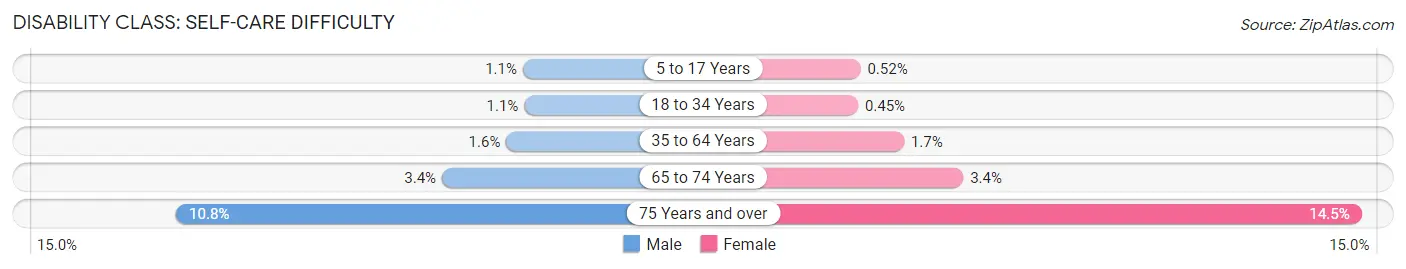
| Age Bracket | Male | Female |
| 5 to 17 Years | 1,690 (1.1%) | 752 (0.5%) |
| 18 to 34 Years | 2,151 (1.1%) | 891 (0.4%) |
| 35 to 64 Years | 5,676 (1.6%) | 6,524 (1.7%) |
| 65 to 74 Years | 2,760 (3.4%) | 3,154 (3.4%) |
| 75 Years and over | 5,581 (10.8%) | 10,727 (14.5%) |
Technology Access in Area Code 203
Computing Device Access in Area Code 203
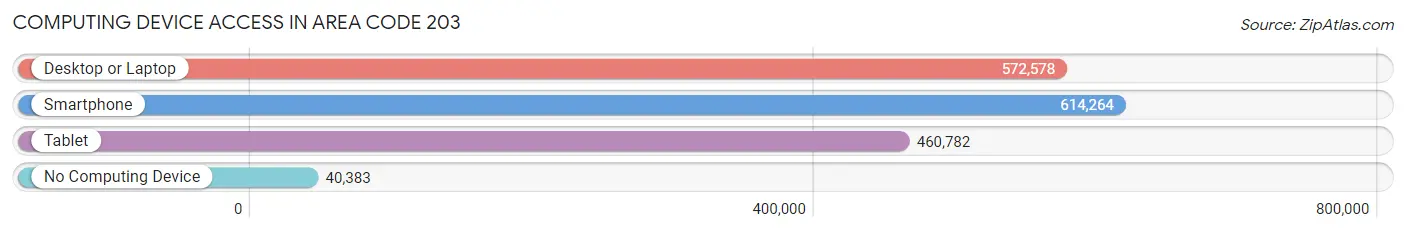
| Device Type | # Households | % Households |
| Desktop or Laptop | 572,578 | 82.0% |
| Smartphone | 614,264 | 87.9% |
| Tablet | 460,782 | 65.9% |
| No Computing Device | 40,383 | 5.8% |
| Total | 698,702 | 100.0% |
Internet Access in Area Code 203
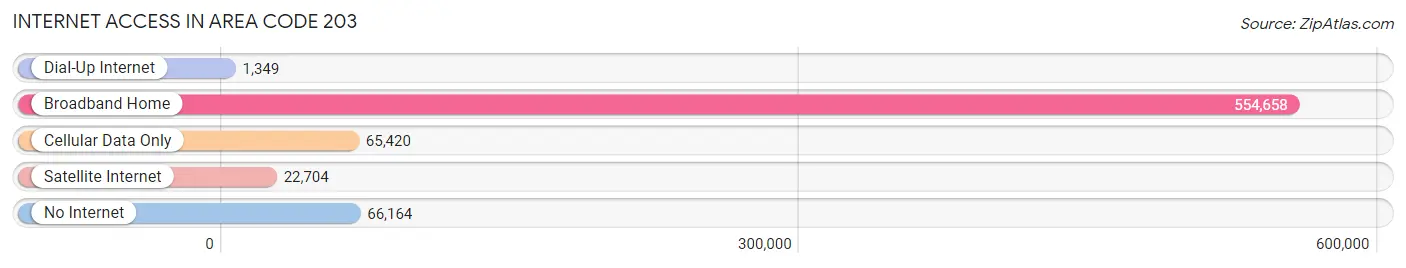
| Internet Type | # Households | % Households |
| Dial-Up Internet | 1,349 | 0.2% |
| Broadband Home | 554,658 | 79.4% |
| Cellular Data Only | 65,420 | 9.4% |
| Satellite Internet | 22,704 | 3.3% |
| No Internet | 66,164 | 9.5% |
| Total | 698,702 | 100.0% |
Area Code 203 Summary
Area code 203 is a telephone area code that serves the southwestern region of the state of Connecticut in the United States. The area code encompasses a diverse range of geographic, social, economic, and demographic characteristics.
Geographically, area code 203 includes portions of Fairfield, New Haven, and Litchfield counties. The region is located in the southwestern part of Connecticut, which is bordered by Long Island Sound to the south and the state of New York to the west. The region is known for its diverse landscape, including urban, suburban, and rural areas, as well as its proximity to New York City.
Socially, the region served by area code 203 is a diverse one, with a mix of ethnicities and cultures. The population is generally highly educated, with a large number of professionals and students. The region is home to several universities and colleges, including Yale University, Fairfield University, and Quinnipiac University. The area also has a vibrant arts and culture scene, with several theaters, museums, and galleries.
Economically, the region served by area code 203 is one of the most prosperous in Connecticut. The region is home to several large corporations, including General Electric, Sikorsky Aircraft, and Purdue Pharma. The area is also known for its strong healthcare and financial services sectors. The region has a relatively high median household income of approximately $88,000.
Demographically, the region served by area code 203 is diverse, with a mix of ethnicities and cultures. The largest ethnic group is White, followed by Hispanic/Latino, Black/African American, and Asian/Pacific Islander. The region has a relatively low number of foreign-born residents, with immigrants making up approximately 13% of the population. The area is known for its diversity and acceptance of different cultures and religions.
In conclusion, area code 203 serves a diverse and prosperous region of southwestern Connecticut, with a mix of urban, suburban, and rural areas. The region is known for its highly educated population, strong economy, and diverse culture.
Common Questions
What is Per Capita Income in Area Code 203?
Per Capita income in Area Code 203 is $62,239.
What is the Median Family Income in Area Code 203?
Median Family Income in Area Code 203 is $137,981.
What is the Median Household income in Area Code 203?
Median Household Income in Area Code 203 is $117,780.
What is Income or Wage Gap in Area Code 203?
Income or Wage Gap in Area Code 203 is 30.1%.
Women in Area Code 203 earn 69.9 cents for every dollar earned by a man.
What is Family Income Deficit in Area Code 203?
Family Income Deficit in Area Code 203 is $11,144.
Families that are below poverty line in Area Code 203 earn $11,144 less on average than the poverty threshold level.
What is Inequality or Gini Index in Area Code 203?
Inequality or Gini Index in Area Code 203 is 40.48.
What is the Total Population of Area Code 203?
Total Population of Area Code 203 is 1,834,539.
What is the Total Male Population of Area Code 203?
Total Male Population of Area Code 203 is 895,751.
What is the Total Female Population of Area Code 203?
Total Female Population of Area Code 203 is 938,788.
What is the Ratio of Males per 100 Females in Area Code 203?
There are 95.42 Males per 100 Females in Area Code 203.
What is the Ratio of Females per 100 Males in Area Code 203?
There are 104.80 Females per 100 Males in Area Code 203.
What is the Median Population Age in Area Code 203?
Median Population Age in Area Code 203 is 42.1 Years.
What is the Average Family Size in Area Code 203
Average Family Size in Area Code 203 is 3.2 People.
What is the Average Household Size in Area Code 203
Average Household Size in Area Code 203 is 2.6 People.
How Large is the Labor Force in Area Code 203?
There are 983,906 People in the Labor Forcein in Area Code 203.
What is the Percentage of People in the Labor Force in Area Code 203?
65.9% of People are in the Labor Force in Area Code 203.
What is the Unemployment Rate in Area Code 203?
Unemployment Rate in Area Code 203 is 6.2%.