Moundsville, WV Map & Demographics
Moundsville Map
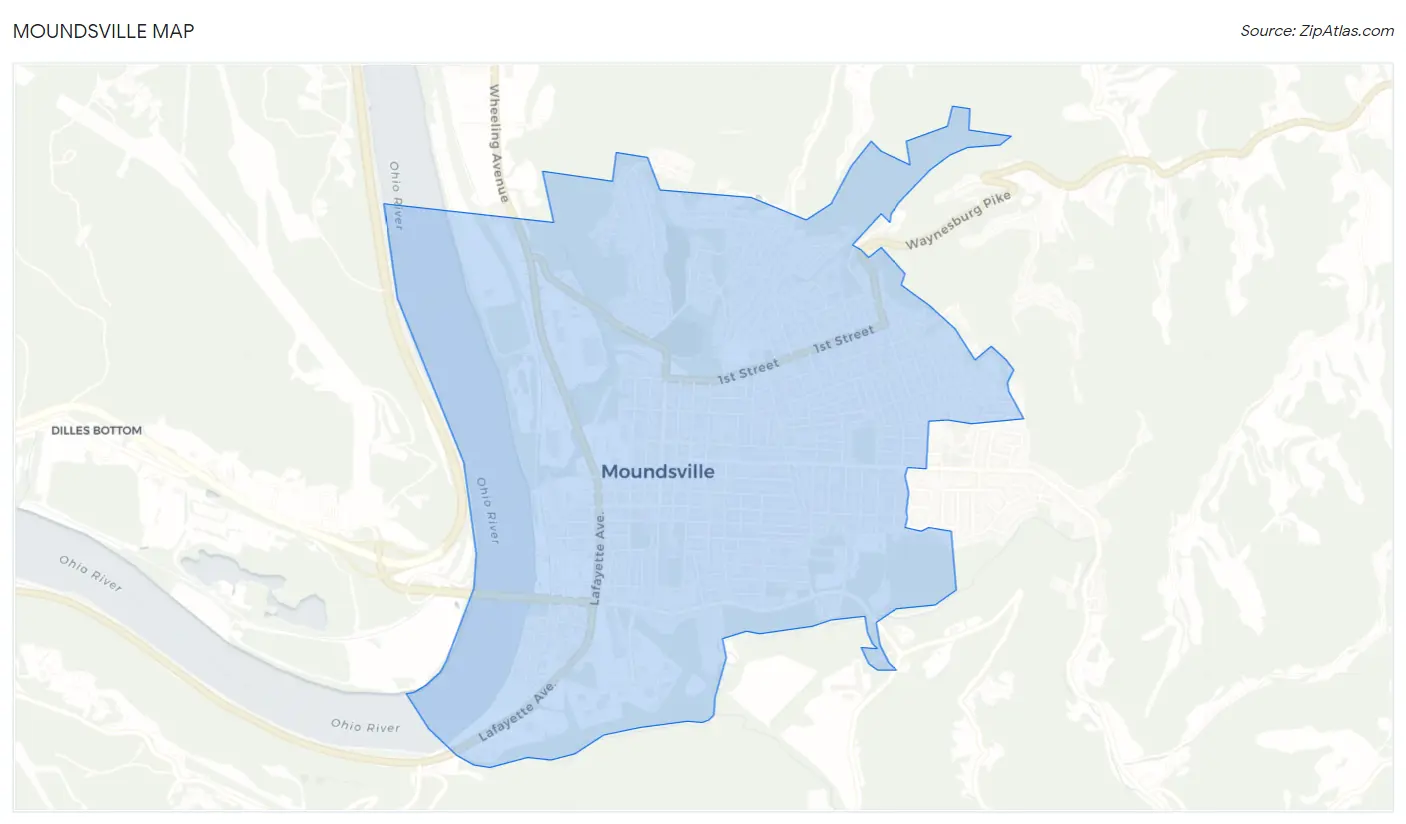
Moundsville Overview
$33,357
PER CAPITA INCOME
$68,750
AVG FAMILY INCOME
$46,070
AVG HOUSEHOLD INCOME
55.4%
WAGE / INCOME GAP [ % ]
44.6¢/ $1
WAGE / INCOME GAP [ $ ]
0.54
INEQUALITY / GINI INDEX
8,056
TOTAL POPULATION
3,757
MALE POPULATION
4,299
FEMALE POPULATION
87.39
MALES / 100 FEMALES
114.43
FEMALES / 100 MALES
47.2
MEDIAN AGE
3.0
AVG FAMILY SIZE
2.2
AVG HOUSEHOLD SIZE
3,716
LABOR FORCE [ PEOPLE ]
52.3%
PERCENT IN LABOR FORCE
5.5%
UNEMPLOYMENT RATE
Moundsville Zip Codes
Moundsville Area Codes
Income in Moundsville
Income Overview in Moundsville
Per Capita Income in Moundsville is $33,357, while median incomes of families and households are $68,750 and $46,070 respectively.
| Characteristic | Number | Measure |
| Per Capita Income | 8,056 | $33,357 |
| Median Family Income | 2,053 | $68,750 |
| Mean Family Income | 2,053 | $97,441 |
| Median Household Income | 3,507 | $46,070 |
| Mean Household Income | 3,507 | $73,101 |
| Income Deficit | 2,053 | $0 |
| Wage / Income Gap (%) | 8,056 | 55.44% |
| Wage / Income Gap ($) | 8,056 | 44.56¢ per $1 |
| Gini / Inequality Index | 8,056 | 0.54 |
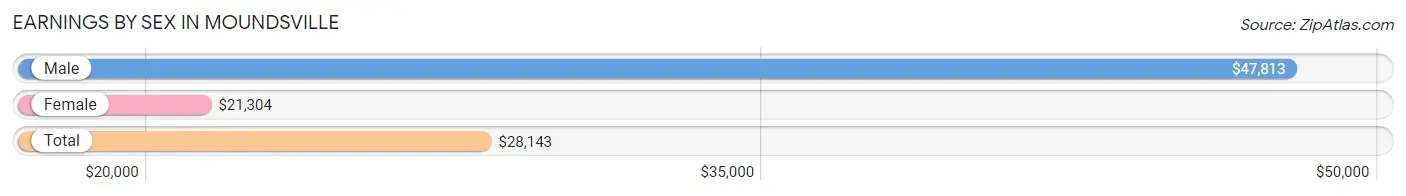
Earnings by Sex in Moundsville
Average Earnings in Moundsville are $28,143, $47,813 for men and $21,304 for women, a difference of 55.4%.
| Sex | Number | Average Earnings |
| Male | 1,908 (49.0%) | $47,813 |
| Female | 1,987 (51.0%) | $21,304 |
| Total | 3,895 (100.0%) | $28,143 |
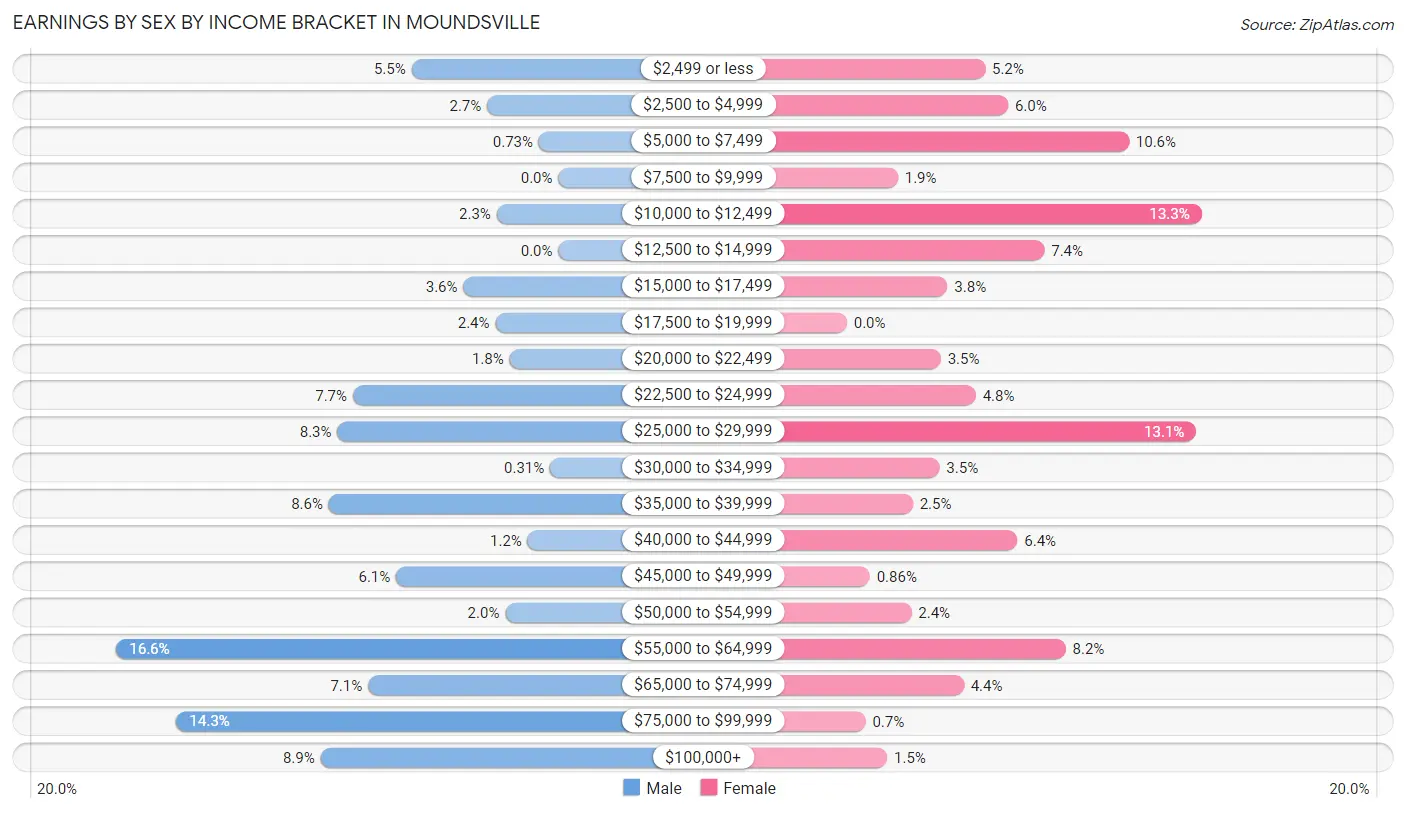
Earnings by Sex by Income Bracket in Moundsville
The most common earnings brackets in Moundsville are $55,000 to $64,999 for men (316 | 16.6%) and $10,000 to $12,499 for women (264 | 13.3%).
| Income | Male | Female |
| $2,499 or less | 105 (5.5%) | 103 (5.2%) |
| $2,500 to $4,999 | 51 (2.7%) | 120 (6.0%) |
| $5,000 to $7,499 | 14 (0.7%) | 210 (10.6%) |
| $7,500 to $9,999 | 0 (0.0%) | 38 (1.9%) |
| $10,000 to $12,499 | 44 (2.3%) | 264 (13.3%) |
| $12,500 to $14,999 | 0 (0.0%) | 147 (7.4%) |
| $15,000 to $17,499 | 68 (3.6%) | 75 (3.8%) |
| $17,500 to $19,999 | 45 (2.4%) | 0 (0.0%) |
| $20,000 to $22,499 | 35 (1.8%) | 70 (3.5%) |
| $22,500 to $24,999 | 147 (7.7%) | 96 (4.8%) |
| $25,000 to $29,999 | 158 (8.3%) | 260 (13.1%) |
| $30,000 to $34,999 | 6 (0.3%) | 69 (3.5%) |
| $35,000 to $39,999 | 164 (8.6%) | 49 (2.5%) |
| $40,000 to $44,999 | 22 (1.1%) | 127 (6.4%) |
| $45,000 to $49,999 | 116 (6.1%) | 17 (0.9%) |
| $50,000 to $54,999 | 38 (2.0%) | 48 (2.4%) |
| $55,000 to $64,999 | 316 (16.6%) | 163 (8.2%) |
| $65,000 to $74,999 | 136 (7.1%) | 87 (4.4%) |
| $75,000 to $99,999 | 273 (14.3%) | 14 (0.7%) |
| $100,000+ | 170 (8.9%) | 30 (1.5%) |
| Total | 1,908 (100.0%) | 1,987 (100.0%) |
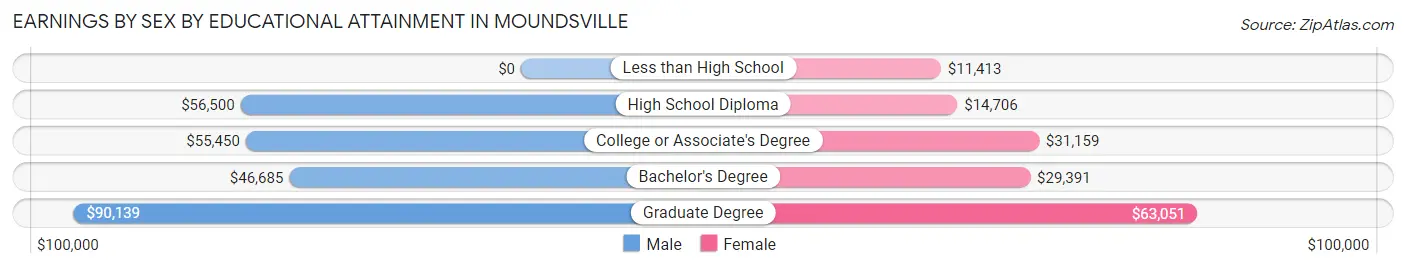
Earnings by Sex by Educational Attainment in Moundsville
Average earnings in Moundsville are $55,255 for men and $25,140 for women, a difference of 54.5%. Men with an educational attainment of graduate degree enjoy the highest average annual earnings of $90,139, while those with bachelor's degree education earn the least with $46,685. Women with an educational attainment of graduate degree earn the most with the average annual earnings of $63,051, while those with less than high school education have the smallest earnings of $11,413.
| Educational Attainment | Male Income | Female Income |
| Less than High School | - | - |
| High School Diploma | $56,500 | $14,706 |
| College or Associate's Degree | $55,450 | $31,159 |
| Bachelor's Degree | $46,685 | $29,391 |
| Graduate Degree | $90,139 | $63,051 |
| Total | $55,255 | $25,140 |
Family Income in Moundsville
Family Income Brackets in Moundsville
According to the Moundsville family income data, there are 540 families falling into the $50,000 to $74,999 income range, which is the most common income bracket and makes up 26.3% of all families. Conversely, the $10,000 to $14,999 income bracket is the least frequent group with only 68 families (3.3%) belonging to this category.
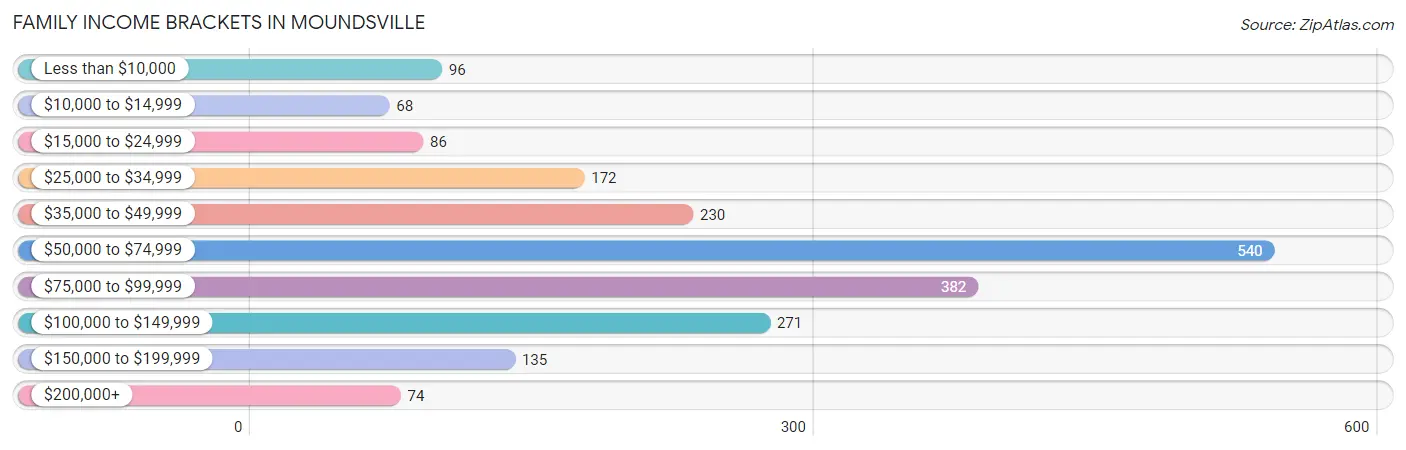
| Income Bracket | # Families | % Families |
| Less than $10,000 | 96 | 4.7% |
| $10,000 to $14,999 | 68 | 3.3% |
| $15,000 to $24,999 | 86 | 4.2% |
| $25,000 to $34,999 | 172 | 8.4% |
| $35,000 to $49,999 | 230 | 11.2% |
| $50,000 to $74,999 | 540 | 26.3% |
| $75,000 to $99,999 | 382 | 18.6% |
| $100,000 to $149,999 | 271 | 13.2% |
| $150,000 to $199,999 | 135 | 6.6% |
| $200,000+ | 74 | 3.6% |
Family Income by Famaliy Size in Moundsville
4-person families (220 | 10.7%) account for the highest median family income in Moundsville with $130,294 per family, while 2-person families (1,252 | 61.0%) have the highest median income of $32,787 per family member.
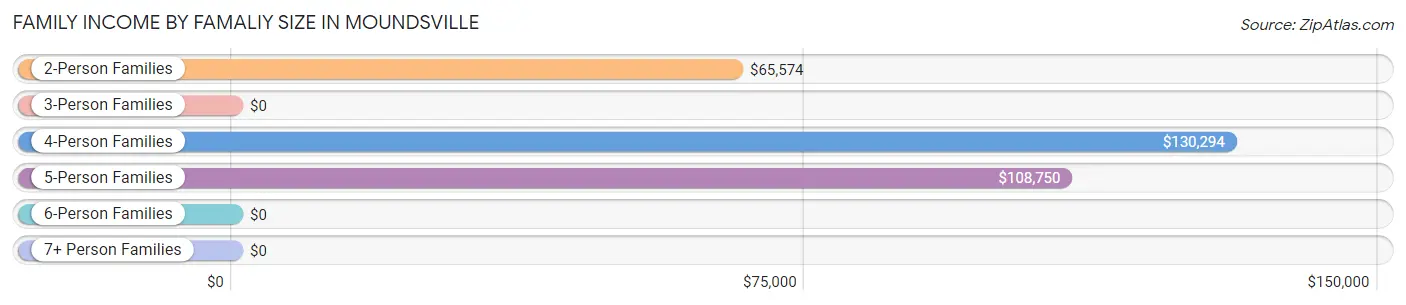
| Income Bracket | # Families | Median Income |
| 2-Person Families | 1,252 (61.0%) | $65,574 |
| 3-Person Families | 366 (17.8%) | $0 |
| 4-Person Families | 220 (10.7%) | $130,294 |
| 5-Person Families | 114 (5.6%) | $108,750 |
| 6-Person Families | 82 (4.0%) | $0 |
| 7+ Person Families | 19 (0.9%) | $0 |
| Total | 2,053 (100.0%) | $68,750 |
Family Income by Number of Earners in Moundsville
The median family income in Moundsville is $68,750, with families comprising 3+ earners (268) having the highest median family income of $144,700, while families with 1 earner (578) have the lowest median family income of $46,500, accounting for 13.1% and 28.1% of families, respectively.
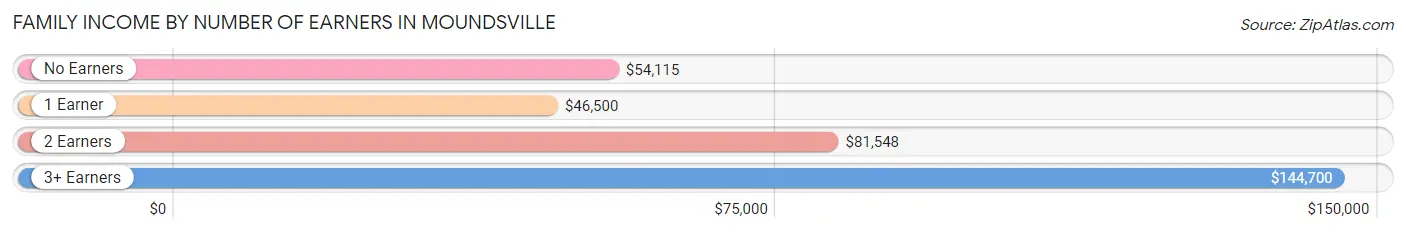
| Number of Earners | # Families | Median Income |
| No Earners | 533 (26.0%) | $54,115 |
| 1 Earner | 578 (28.1%) | $46,500 |
| 2 Earners | 674 (32.8%) | $81,548 |
| 3+ Earners | 268 (13.1%) | $144,700 |
| Total | 2,053 (100.0%) | $68,750 |
Household Income in Moundsville
Household Income Brackets in Moundsville
With 659 households falling in the category, the $50,000 to $74,999 income range is the most frequent in Moundsville, accounting for 18.8% of all households. In contrast, only 95 households (2.7%) fall into the $200,000+ income bracket, making it the least populous group.
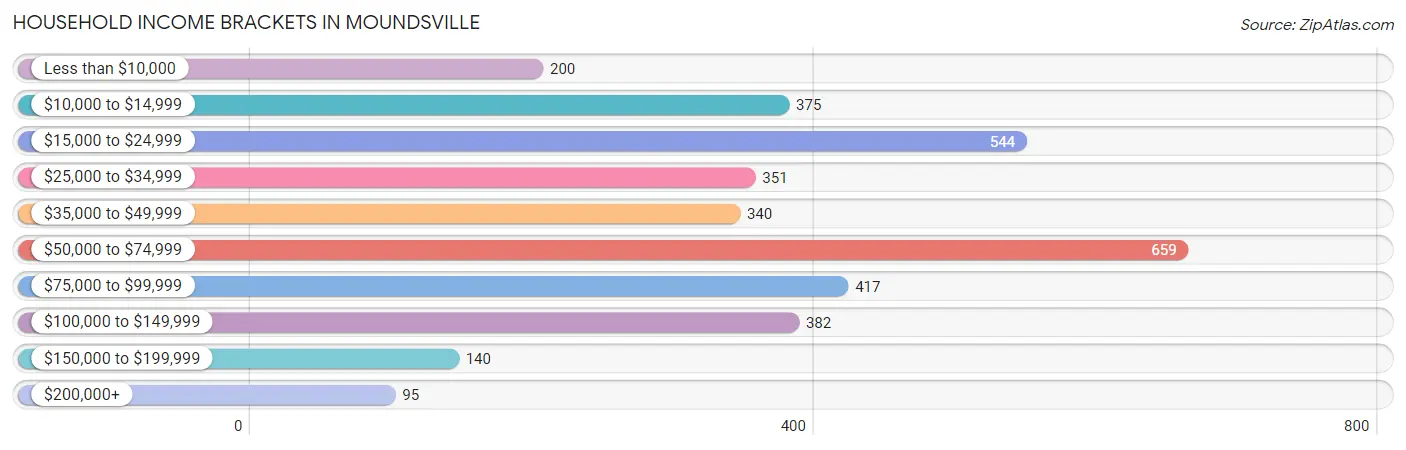
| Income Bracket | # Households | % Households |
| Less than $10,000 | 200 | 5.7% |
| $10,000 to $14,999 | 375 | 10.7% |
| $15,000 to $24,999 | 544 | 15.5% |
| $25,000 to $34,999 | 351 | 10.0% |
| $35,000 to $49,999 | 340 | 9.7% |
| $50,000 to $74,999 | 659 | 18.8% |
| $75,000 to $99,999 | 417 | 11.9% |
| $100,000 to $149,999 | 382 | 10.9% |
| $150,000 to $199,999 | 140 | 4.0% |
| $200,000+ | 95 | 2.7% |
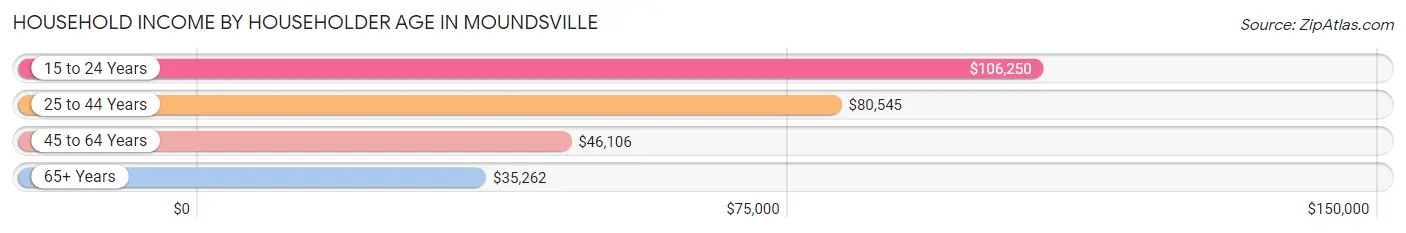
Household Income by Householder Age in Moundsville
The median household income in Moundsville is $46,070, with the highest median household income of $106,250 found in the 15 to 24 years age bracket for the primary householder. A total of 35 households (1.0%) fall into this category. Meanwhile, the 65+ years age bracket for the primary householder has the lowest median household income of $35,262, with 1,269 households (36.2%) in this group.
| Income Bracket | # Households | Median Income |
| 15 to 24 Years | 35 (1.0%) | $106,250 |
| 25 to 44 Years | 871 (24.8%) | $80,545 |
| 45 to 64 Years | 1,332 (38.0%) | $46,106 |
| 65+ Years | 1,269 (36.2%) | $35,262 |
| Total | 3,507 (100.0%) | $46,070 |
Poverty in Moundsville
Income Below Poverty by Sex and Age in Moundsville
With 16.9% poverty level for males and 19.5% for females among the residents of Moundsville, 12 to 14 year old males and 18 to 24 year old females are the most vulnerable to poverty, with 37 males (39.4%) and 148 females (58.7%) in their respective age groups living below the poverty level.
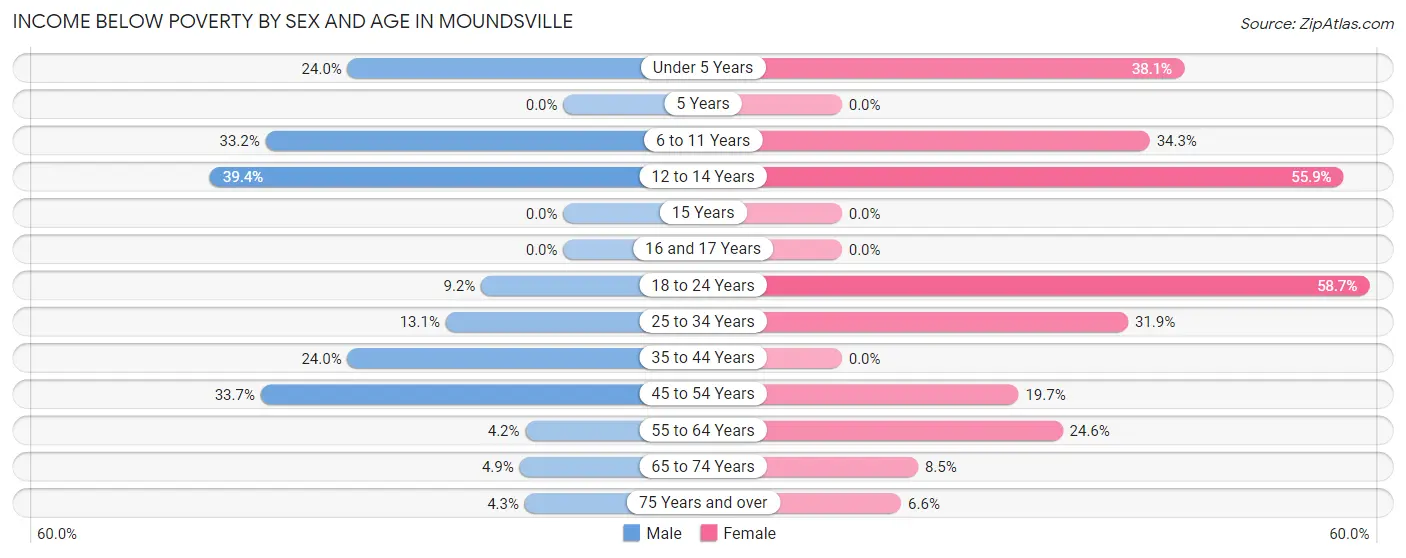
| Age Bracket | Male | Female |
| Under 5 Years | 55 (24.0%) | 48 (38.1%) |
| 5 Years | 0 (0.0%) | 0 (0.0%) |
| 6 to 11 Years | 66 (33.2%) | 24 (34.3%) |
| 12 to 14 Years | 37 (39.4%) | 62 (55.9%) |
| 15 Years | 0 (0.0%) | 0 (0.0%) |
| 16 and 17 Years | 0 (0.0%) | 0 (0.0%) |
| 18 to 24 Years | 23 (9.2%) | 148 (58.7%) |
| 25 to 34 Years | 60 (13.1%) | 205 (31.9%) |
| 35 to 44 Years | 144 (24.0%) | 0 (0.0%) |
| 45 to 54 Years | 185 (33.7%) | 123 (19.7%) |
| 55 to 64 Years | 25 (4.2%) | 120 (24.6%) |
| 65 to 74 Years | 18 (4.9%) | 63 (8.5%) |
| 75 Years and over | 13 (4.3%) | 24 (6.6%) |
| Total | 626 (16.9%) | 817 (19.5%) |
Income Above Poverty by Sex and Age in Moundsville
According to the poverty statistics in Moundsville, males aged 15 years and females aged 5 years are the age groups that are most secure financially, with 100.0% of males and 100.0% of females in these age groups living above the poverty line.
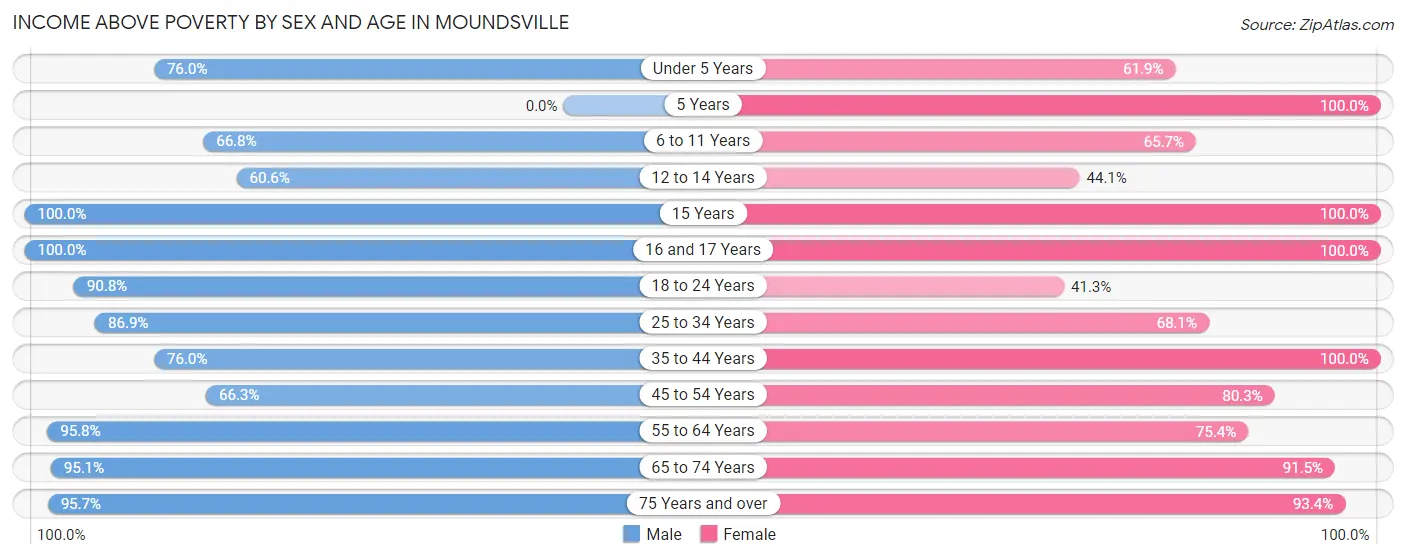
| Age Bracket | Male | Female |
| Under 5 Years | 174 (76.0%) | 78 (61.9%) |
| 5 Years | 0 (0.0%) | 51 (100.0%) |
| 6 to 11 Years | 133 (66.8%) | 46 (65.7%) |
| 12 to 14 Years | 57 (60.6%) | 49 (44.1%) |
| 15 Years | 30 (100.0%) | 40 (100.0%) |
| 16 and 17 Years | 39 (100.0%) | 175 (100.0%) |
| 18 to 24 Years | 228 (90.8%) | 104 (41.3%) |
| 25 to 34 Years | 398 (86.9%) | 438 (68.1%) |
| 35 to 44 Years | 455 (76.0%) | 509 (100.0%) |
| 45 to 54 Years | 364 (66.3%) | 502 (80.3%) |
| 55 to 64 Years | 566 (95.8%) | 368 (75.4%) |
| 65 to 74 Years | 351 (95.1%) | 680 (91.5%) |
| 75 Years and over | 290 (95.7%) | 339 (93.4%) |
| Total | 3,085 (83.1%) | 3,379 (80.5%) |
Income Below Poverty Among Married-Couple Families in Moundsville
The poverty statistics for married-couple families in Moundsville show that 3.6% or 53 of the total 1,462 families live below the poverty line. Families with 5 or more children have the highest poverty rate of 100.0%, comprising of 19 families. On the other hand, families with 1 or 2 children have the lowest poverty rate of 0.0%, which includes 0 families.
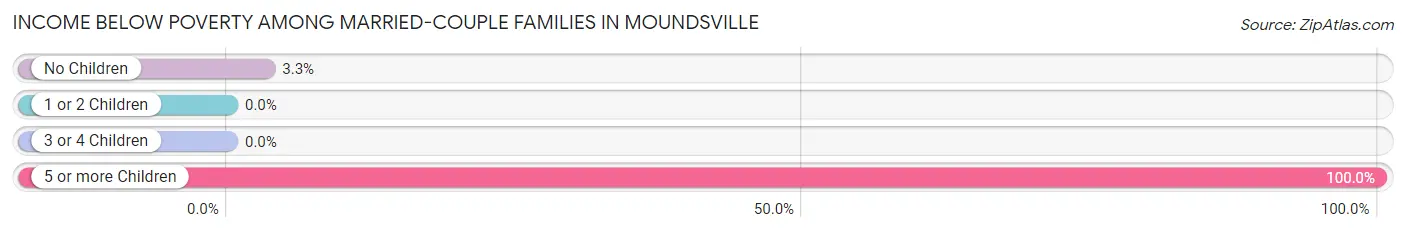
| Children | Above Poverty | Below Poverty |
| No Children | 1,011 (96.8%) | 34 (3.3%) |
| 1 or 2 Children | 321 (100.0%) | 0 (0.0%) |
| 3 or 4 Children | 77 (100.0%) | 0 (0.0%) |
| 5 or more Children | 0 (0.0%) | 19 (100.0%) |
| Total | 1,409 (96.4%) | 53 (3.6%) |
Income Below Poverty Among Single-Parent Households in Moundsville
According to the poverty data in Moundsville, 14.5% or 16 single-father households and 36.2% or 174 single-mother households are living below the poverty line. Among single-father households, those with 1 or 2 children have the highest poverty rate, with 16 households (84.2%) experiencing poverty. Likewise, among single-mother households, those with 1 or 2 children have the highest poverty rate, with 123 households (39.1%) falling below the poverty line.
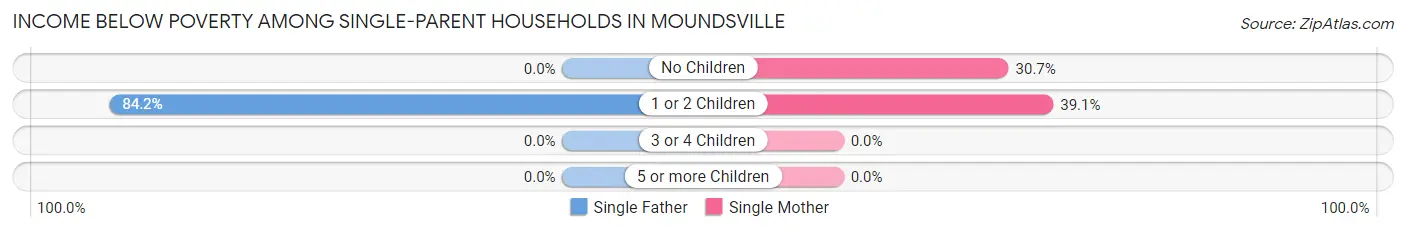
| Children | Single Father | Single Mother |
| No Children | 0 (0.0%) | 51 (30.7%) |
| 1 or 2 Children | 16 (84.2%) | 123 (39.1%) |
| 3 or 4 Children | 0 (0.0%) | 0 (0.0%) |
| 5 or more Children | 0 (0.0%) | 0 (0.0%) |
| Total | 16 (14.5%) | 174 (36.2%) |
Income Below Poverty Among Married-Couple vs Single-Parent Households in Moundsville
The poverty data for Moundsville shows that 53 of the married-couple family households (3.6%) and 190 of the single-parent households (32.2%) are living below the poverty level. Within the married-couple family households, those with 5 or more children have the highest poverty rate, with 19 households (100.0%) falling below the poverty line. Among the single-parent households, those with 1 or 2 children have the highest poverty rate, with 139 household (41.6%) living below poverty.
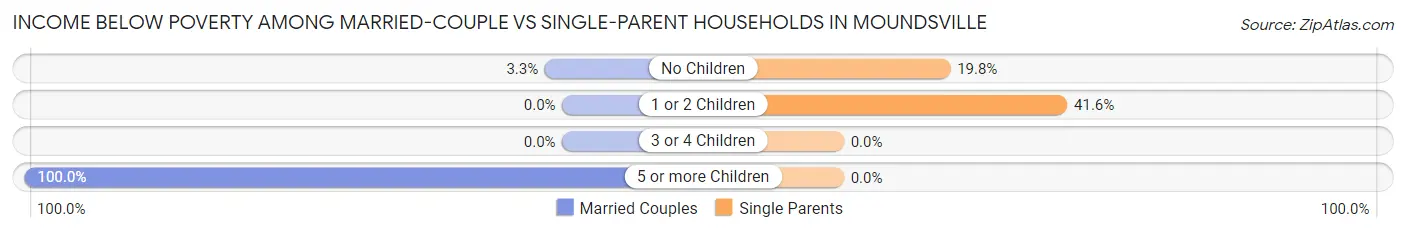
| Children | Married-Couple Families | Single-Parent Households |
| No Children | 34 (3.3%) | 51 (19.8%) |
| 1 or 2 Children | 0 (0.0%) | 139 (41.6%) |
| 3 or 4 Children | 0 (0.0%) | 0 (0.0%) |
| 5 or more Children | 19 (100.0%) | 0 (0.0%) |
| Total | 53 (3.6%) | 190 (32.2%) |
Race in Moundsville
The most populous races in Moundsville are White / Caucasian (7,565 | 93.9%), Two or more Races (307 | 3.8%), and Some other Race (162 | 2.0%).
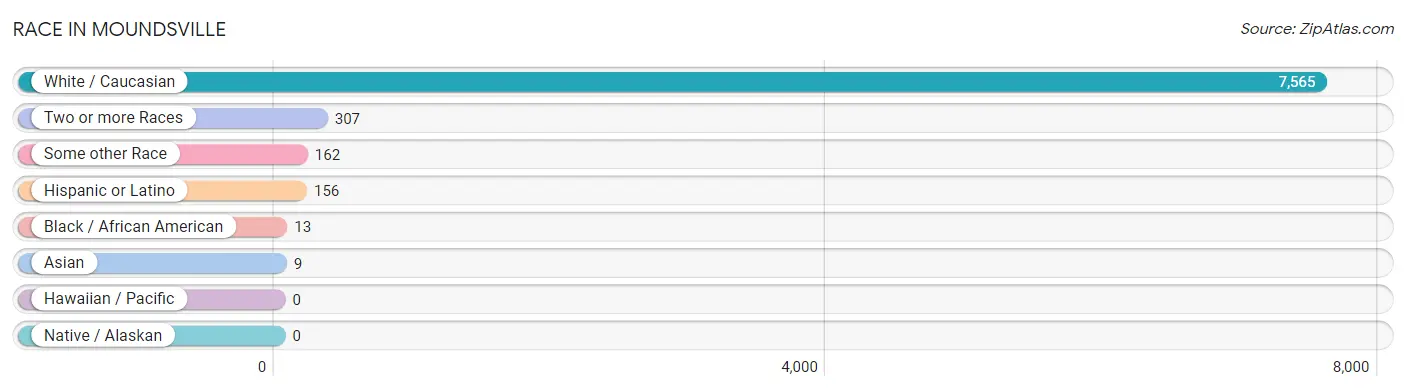
| Race | # Population | % Population |
| Asian | 9 | 0.1% |
| Black / African American | 13 | 0.2% |
| Hawaiian / Pacific | 0 | 0.0% |
| Hispanic or Latino | 156 | 1.9% |
| Native / Alaskan | 0 | 0.0% |
| White / Caucasian | 7,565 | 93.9% |
| Two or more Races | 307 | 3.8% |
| Some other Race | 162 | 2.0% |
| Total | 8,056 | 100.0% |
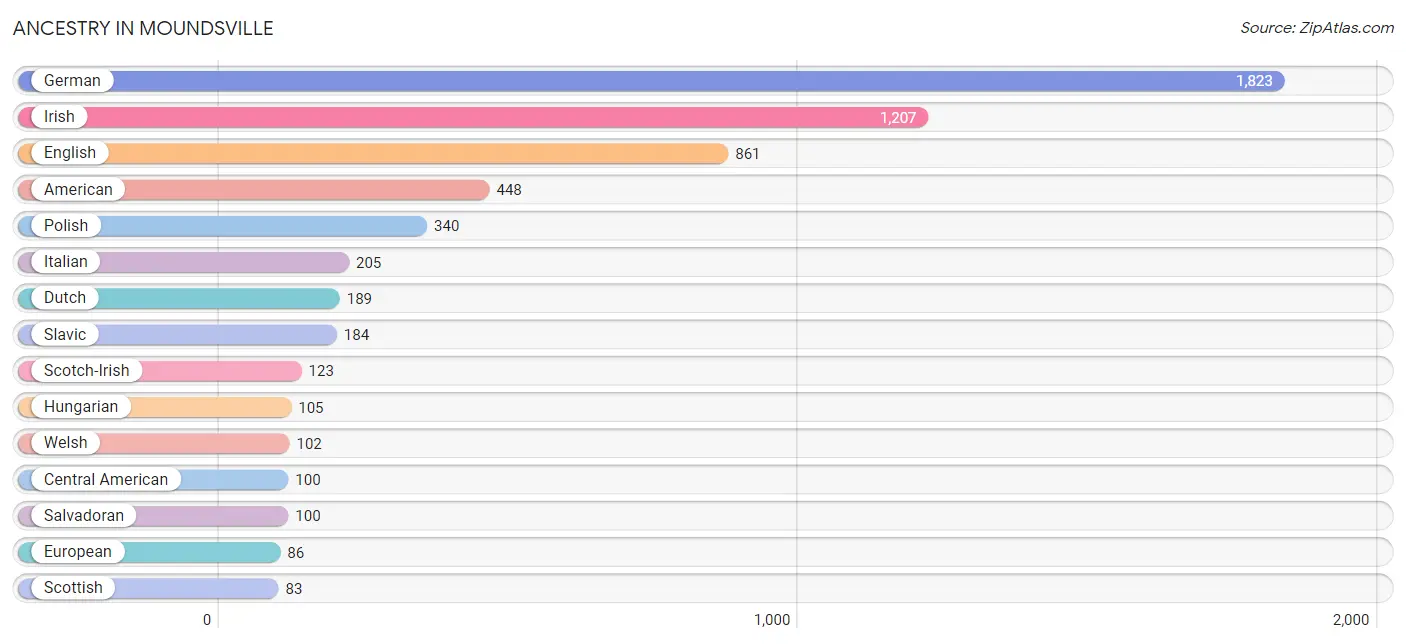
Ancestry in Moundsville
The most populous ancestries reported in Moundsville are German (1,823 | 22.6%), Irish (1,207 | 15.0%), English (861 | 10.7%), American (448 | 5.6%), and Polish (340 | 4.2%), together accounting for 58.1% of all Moundsville residents.
| Ancestry | # Population | % Population |
| American | 448 | 5.6% |
| Arab | 10 | 0.1% |
| Austrian | 30 | 0.4% |
| British | 50 | 0.6% |
| Central American | 100 | 1.2% |
| Cherokee | 3 | 0.0% |
| Crow | 11 | 0.1% |
| Cuban | 5 | 0.1% |
| Czechoslovakian | 21 | 0.3% |
| Dutch | 189 | 2.4% |
| Eastern European | 16 | 0.2% |
| English | 861 | 10.7% |
| European | 86 | 1.1% |
| French | 14 | 0.2% |
| French Canadian | 12 | 0.2% |
| German | 1,823 | 22.6% |
| Greek | 2 | 0.0% |
| Hungarian | 105 | 1.3% |
| Indian (Asian) | 5 | 0.1% |
| Irish | 1,207 | 15.0% |
| Italian | 205 | 2.5% |
| Korean | 5 | 0.1% |
| Lebanese | 10 | 0.1% |
| Mexican | 2 | 0.0% |
| Northern European | 27 | 0.3% |
| Polish | 340 | 4.2% |
| Puerto Rican | 4 | 0.1% |
| Russian | 24 | 0.3% |
| Salvadoran | 100 | 1.2% |
| Scandinavian | 30 | 0.4% |
| Scotch-Irish | 123 | 1.5% |
| Scottish | 83 | 1.0% |
| Serbian | 12 | 0.2% |
| Slavic | 184 | 2.3% |
| Spaniard | 36 | 0.4% |
| Spanish | 5 | 0.1% |
| Swedish | 4 | 0.1% |
| Swiss | 5 | 0.1% |
| Thai | 16 | 0.2% |
| Welsh | 102 | 1.3% | View All 40 Rows |
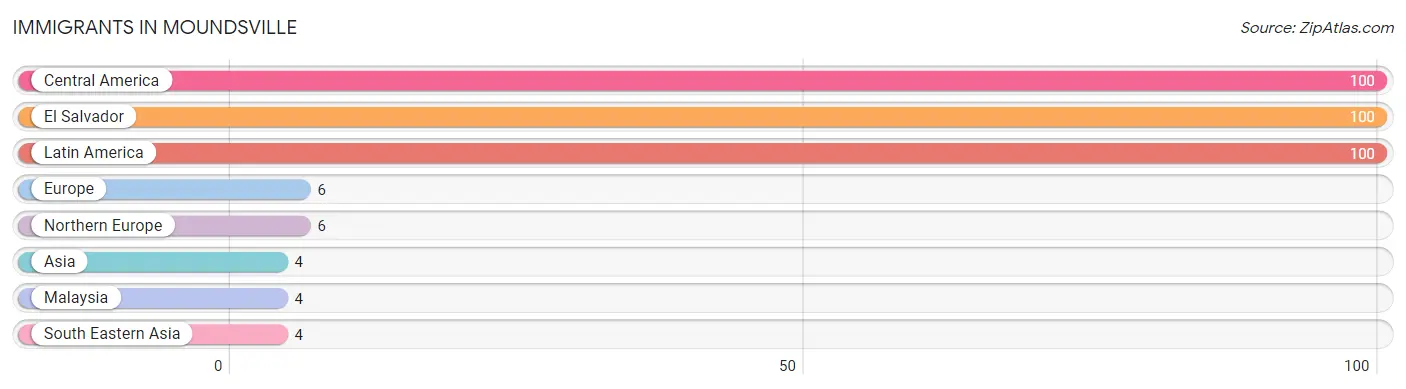
Immigrants in Moundsville
The most numerous immigrant groups reported in Moundsville came from Central America (100 | 1.2%), El Salvador (100 | 1.2%), Latin America (100 | 1.2%), Europe (6 | 0.1%), and Northern Europe (6 | 0.1%), together accounting for 3.9% of all Moundsville residents.
| Immigration Origin | # Population | % Population |
| Asia | 4 | 0.1% |
| Central America | 100 | 1.2% |
| El Salvador | 100 | 1.2% |
| Europe | 6 | 0.1% |
| Latin America | 100 | 1.2% |
| Malaysia | 4 | 0.1% |
| Northern Europe | 6 | 0.1% |
| South Eastern Asia | 4 | 0.1% | View All 8 Rows |
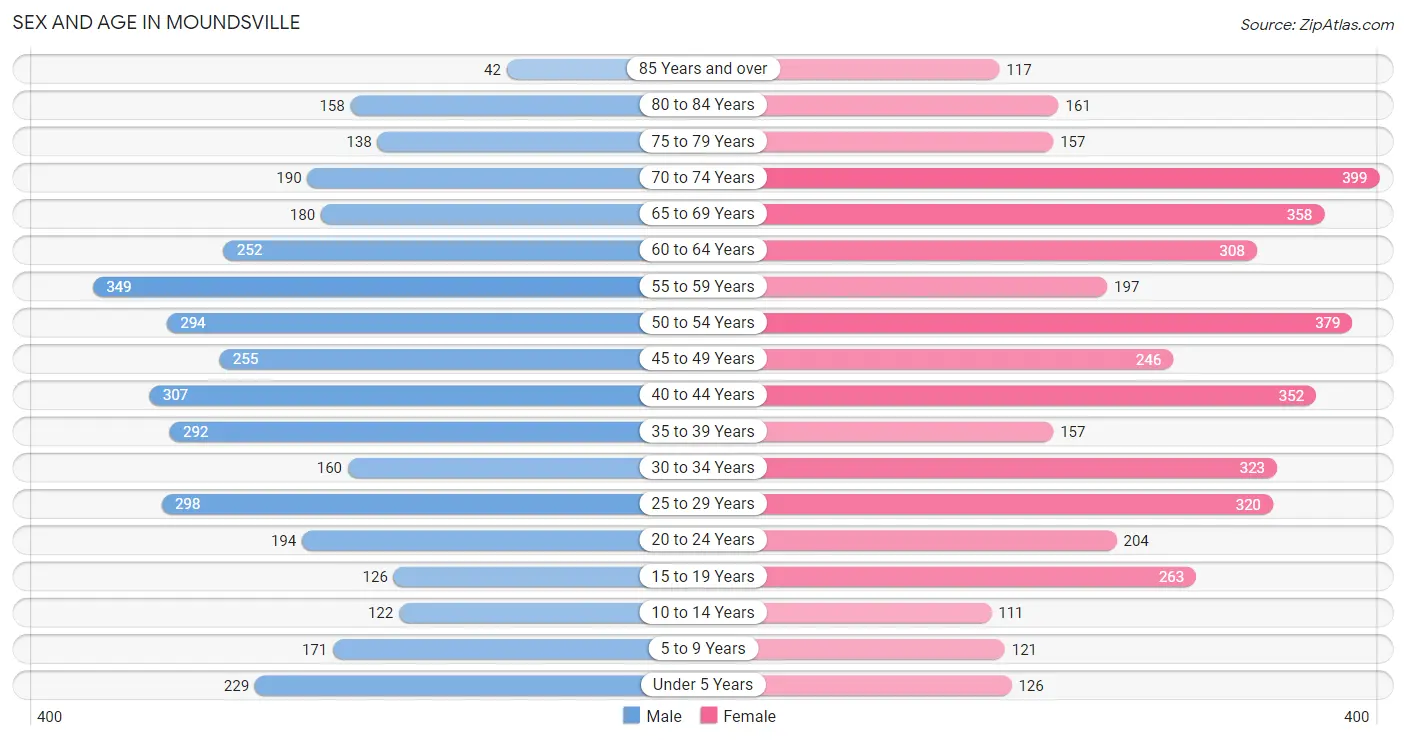
Sex and Age in Moundsville
Sex and Age in Moundsville
The most populous age groups in Moundsville are 55 to 59 Years (349 | 9.3%) for men and 70 to 74 Years (399 | 9.3%) for women.
| Age Bracket | Male | Female |
| Under 5 Years | 229 (6.1%) | 126 (2.9%) |
| 5 to 9 Years | 171 (4.5%) | 121 (2.8%) |
| 10 to 14 Years | 122 (3.3%) | 111 (2.6%) |
| 15 to 19 Years | 126 (3.4%) | 263 (6.1%) |
| 20 to 24 Years | 194 (5.2%) | 204 (4.8%) |
| 25 to 29 Years | 298 (7.9%) | 320 (7.4%) |
| 30 to 34 Years | 160 (4.3%) | 323 (7.5%) |
| 35 to 39 Years | 292 (7.8%) | 157 (3.6%) |
| 40 to 44 Years | 307 (8.2%) | 352 (8.2%) |
| 45 to 49 Years | 255 (6.8%) | 246 (5.7%) |
| 50 to 54 Years | 294 (7.8%) | 379 (8.8%) |
| 55 to 59 Years | 349 (9.3%) | 197 (4.6%) |
| 60 to 64 Years | 252 (6.7%) | 308 (7.2%) |
| 65 to 69 Years | 180 (4.8%) | 358 (8.3%) |
| 70 to 74 Years | 190 (5.1%) | 399 (9.3%) |
| 75 to 79 Years | 138 (3.7%) | 157 (3.6%) |
| 80 to 84 Years | 158 (4.2%) | 161 (3.7%) |
| 85 Years and over | 42 (1.1%) | 117 (2.7%) |
| Total | 3,757 (100.0%) | 4,299 (100.0%) |
Families and Households in Moundsville
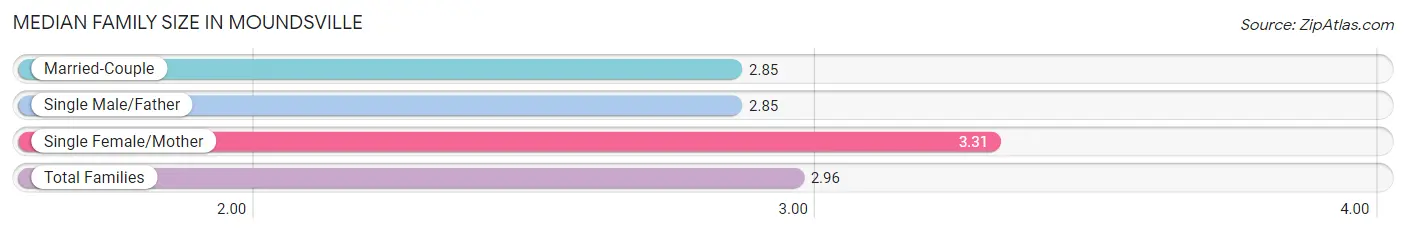
Median Family Size in Moundsville
The median family size in Moundsville is 2.96 persons per family, with single female/mother families (481 | 23.4%) accounting for the largest median family size of 3.31 persons per family. On the other hand, married-couple families (1,462 | 71.2%) represent the smallest median family size with 2.85 persons per family.
| Family Type | # Families | Family Size |
| Married-Couple | 1,462 (71.2%) | 2.85 |
| Single Male/Father | 110 (5.4%) | 2.85 |
| Single Female/Mother | 481 (23.4%) | 3.31 |
| Total Families | 2,053 (100.0%) | 2.96 |
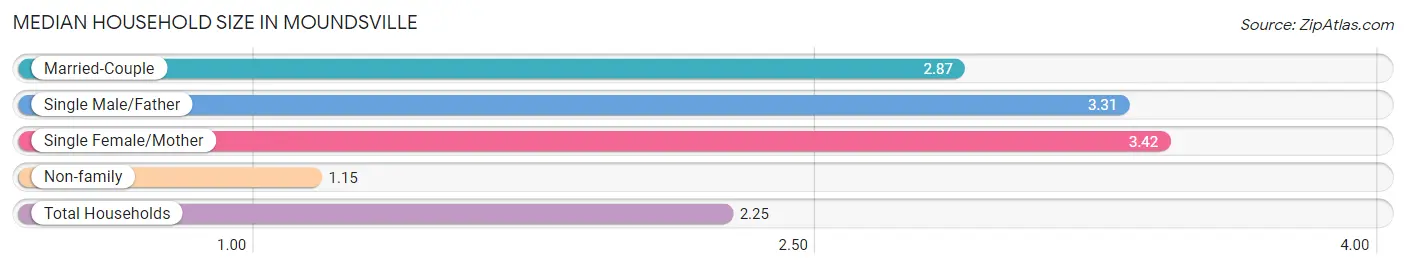
Median Household Size in Moundsville
The median household size in Moundsville is 2.25 persons per household, with single female/mother households (481 | 13.7%) accounting for the largest median household size of 3.42 persons per household. non-family households (1,454 | 41.5%) represent the smallest median household size with 1.15 persons per household.
| Household Type | # Households | Household Size |
| Married-Couple | 1,462 (41.7%) | 2.87 |
| Single Male/Father | 110 (3.1%) | 3.31 |
| Single Female/Mother | 481 (13.7%) | 3.42 |
| Non-family | 1,454 (41.5%) | 1.15 |
| Total Households | 3,507 (100.0%) | 2.25 |
Household Size by Marriage Status in Moundsville
Out of a total of 3,507 households in Moundsville, 2,053 (58.5%) are family households, while 1,454 (41.5%) are nonfamily households. The most numerous type of family households are 2-person households, comprising 1,203, and the most common type of nonfamily households are 1-person households, comprising 1,266.
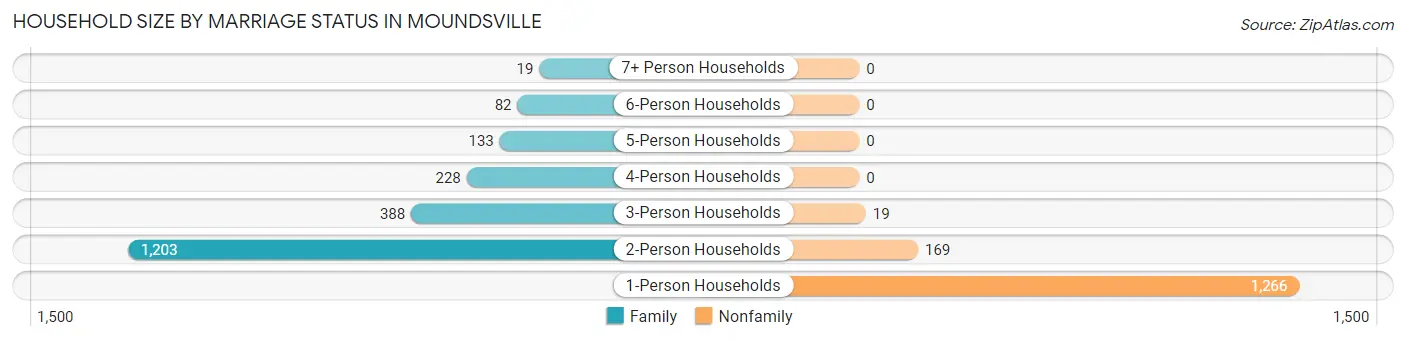
| Household Size | Family Households | Nonfamily Households |
| 1-Person Households | - | 1,266 (36.1%) |
| 2-Person Households | 1,203 (34.3%) | 169 (4.8%) |
| 3-Person Households | 388 (11.1%) | 19 (0.5%) |
| 4-Person Households | 228 (6.5%) | 0 (0.0%) |
| 5-Person Households | 133 (3.8%) | 0 (0.0%) |
| 6-Person Households | 82 (2.3%) | 0 (0.0%) |
| 7+ Person Households | 19 (0.5%) | 0 (0.0%) |
| Total | 2,053 (58.5%) | 1,454 (41.5%) |
Female Fertility in Moundsville
Fertility by Age in Moundsville
Average fertility rate in Moundsville is 19.0 births per 1,000 women. Women in the age bracket of 35 to 50 years have the highest fertility rate with 29.0 births per 1,000 women. Women in the age bracket of 35 to 50 years acount for 62.2% of all women with births.
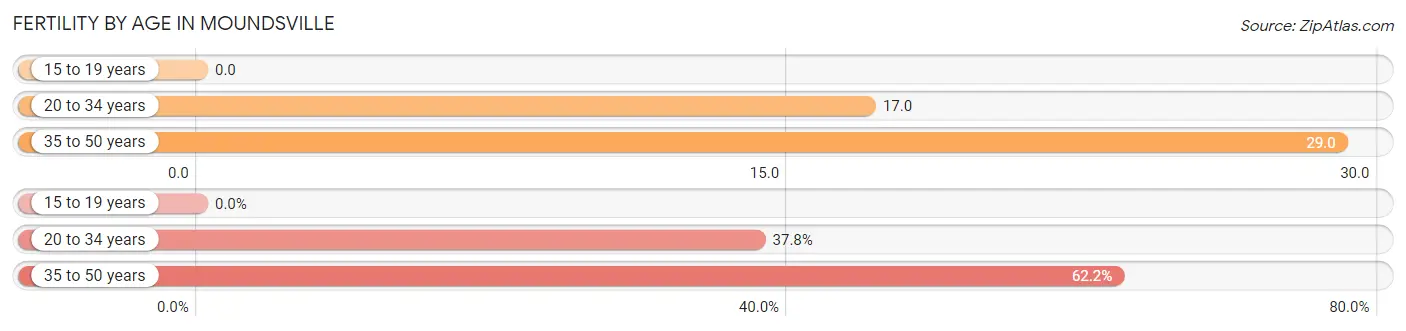
| Age Bracket | Women with Births | Births / 1,000 Women |
| 15 to 19 years | 0 (0.0%) | 0.0 |
| 20 to 34 years | 14 (37.8%) | 17.0 |
| 35 to 50 years | 23 (62.2%) | 29.0 |
| Total | 37 (100.0%) | 19.0 |
Fertility by Age by Marriage Status in Moundsville
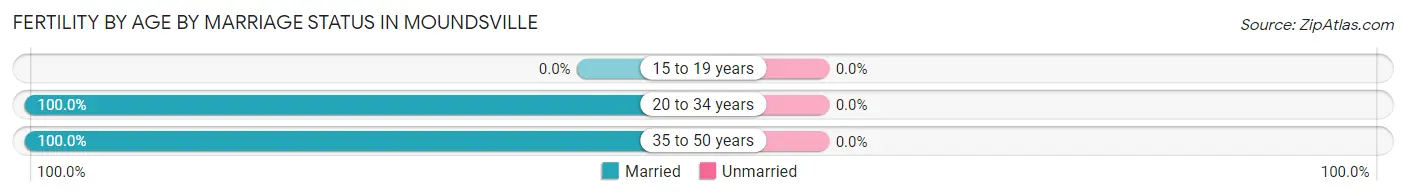
| Age Bracket | Married | Unmarried |
| 15 to 19 years | 0 (0.0%) | 0 (0.0%) |
| 20 to 34 years | 14 (100.0%) | 0 (0.0%) |
| 35 to 50 years | 23 (100.0%) | 0 (0.0%) |
| Total | 37 (100.0%) | 0 (0.0%) |
Fertility by Education in Moundsville
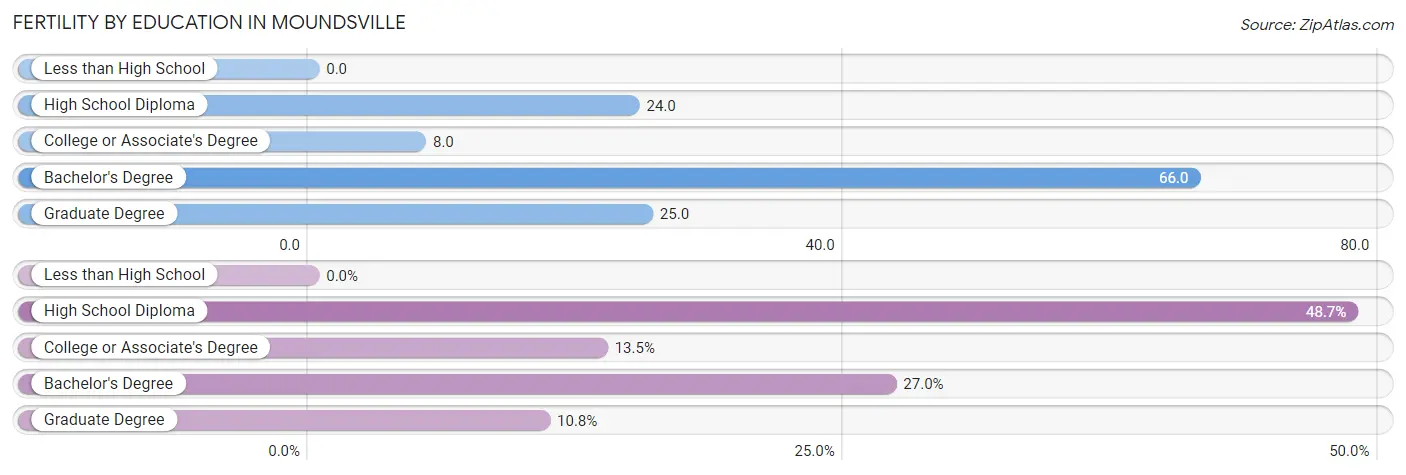
| Educational Attainment | Women with Births | Births / 1,000 Women |
| Less than High School | 0 (0.0%) | 0.0 |
| High School Diploma | 18 (48.6%) | 24.0 |
| College or Associate's Degree | 5 (13.5%) | 8.0 |
| Bachelor's Degree | 10 (27.0%) | 66.0 |
| Graduate Degree | 4 (10.8%) | 25.0 |
| Total | 37 (100.0%) | 19.0 |
Fertility by Education by Marriage Status in Moundsville
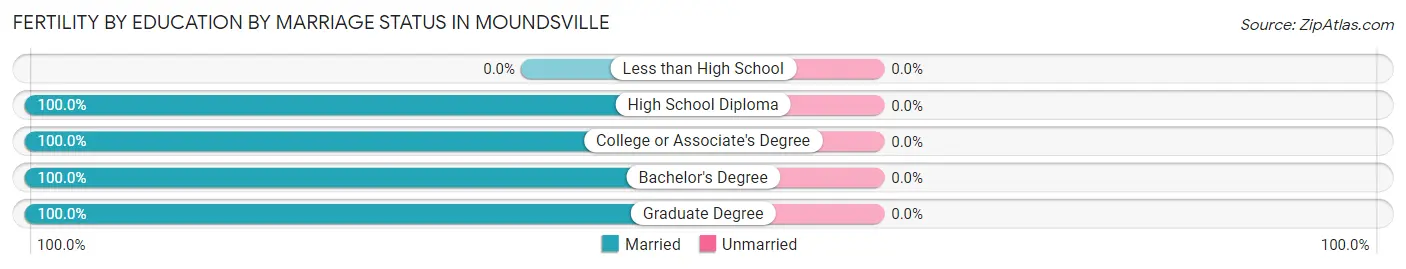
| Educational Attainment | Married | Unmarried |
| Less than High School | 0 (0.0%) | 0 (0.0%) |
| High School Diploma | 18 (100.0%) | 0 (0.0%) |
| College or Associate's Degree | 5 (100.0%) | 0 (0.0%) |
| Bachelor's Degree | 10 (100.0%) | 0 (0.0%) |
| Graduate Degree | 4 (100.0%) | 0 (0.0%) |
| Total | 37 (100.0%) | 0 (0.0%) |
Employment Characteristics in Moundsville
Employment by Class of Employer in Moundsville
Among the 3,454 employed individuals in Moundsville, private company employees (2,717 | 78.7%), local government employees (308 | 8.9%), and not-for-profit organizations (156 | 4.5%) make up the most common classes of employment.
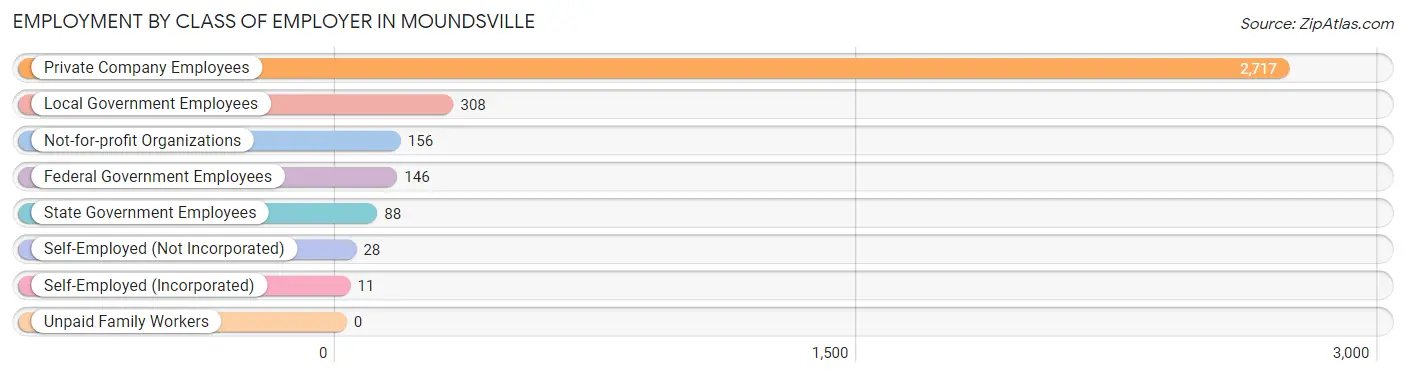
| Employer Class | # Employees | % Employees |
| Private Company Employees | 2,717 | 78.7% |
| Self-Employed (Incorporated) | 11 | 0.3% |
| Self-Employed (Not Incorporated) | 28 | 0.8% |
| Not-for-profit Organizations | 156 | 4.5% |
| Local Government Employees | 308 | 8.9% |
| State Government Employees | 88 | 2.5% |
| Federal Government Employees | 146 | 4.2% |
| Unpaid Family Workers | 0 | 0.0% |
| Total | 3,454 | 100.0% |
Employment Status by Age in Moundsville
According to the labor force statistics for Moundsville, out of the total population over 16 years of age (7,106), 52.3% or 3,716 individuals are in the labor force, with 5.5% or 204 of them unemployed. The age group with the highest labor force participation rate is 35 to 44 years, with 78.8% or 873 individuals in the labor force. Within the labor force, the 20 to 24 years age range has the highest percentage of unemployed individuals, with 16.7% or 41 of them being unemployed.
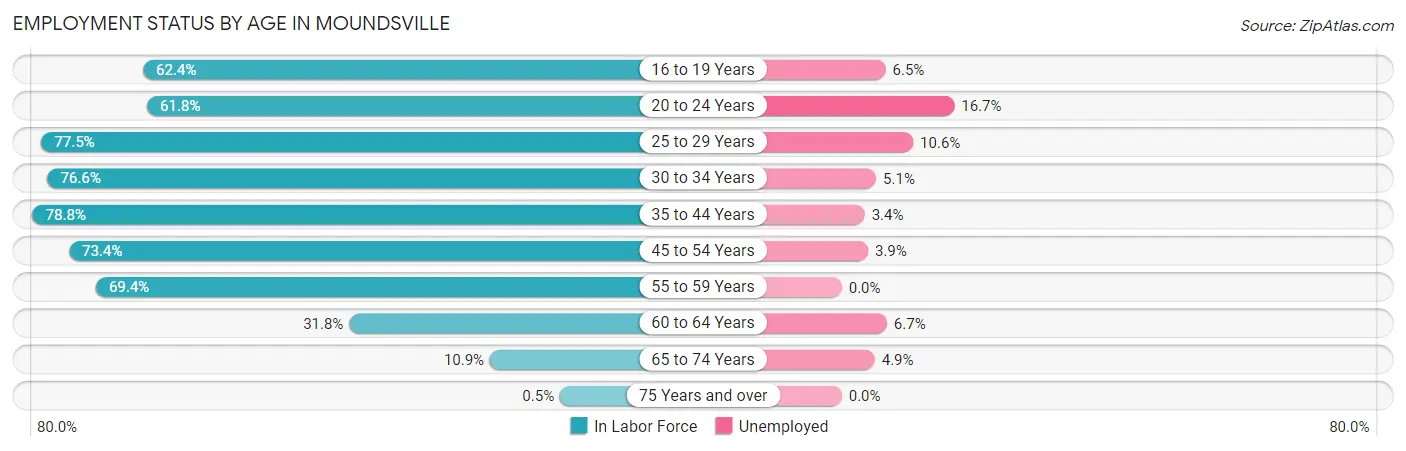
| Age Bracket | In Labor Force | Unemployed |
| 16 to 19 Years | 199 (62.4%) | 13 (6.5%) |
| 20 to 24 Years | 246 (61.8%) | 41 (16.7%) |
| 25 to 29 Years | 479 (77.5%) | 51 (10.6%) |
| 30 to 34 Years | 370 (76.6%) | 19 (5.1%) |
| 35 to 44 Years | 873 (78.8%) | 30 (3.4%) |
| 45 to 54 Years | 862 (73.4%) | 34 (3.9%) |
| 55 to 59 Years | 379 (69.4%) | 0 (0.0%) |
| 60 to 64 Years | 178 (31.8%) | 12 (6.7%) |
| 65 to 74 Years | 123 (10.9%) | 6 (4.9%) |
| 75 Years and over | 4 (0.5%) | 0 (0.0%) |
| Total | 3,716 (52.3%) | 204 (5.5%) |
Employment Status by Educational Attainment in Moundsville
According to labor force statistics for Moundsville, 70.0% of individuals (3,142) out of the total population between 25 and 64 years of age (4,489) are in the labor force, with 4.6% or 145 of them being unemployed. The group with the highest labor force participation rate are those with the educational attainment of bachelor's degree or higher, with 92.4% or 587 individuals in the labor force. Within the labor force, individuals with bachelor's degree or higher education have the highest percentage of unemployment, with 8.7% or 51 of them being unemployed.
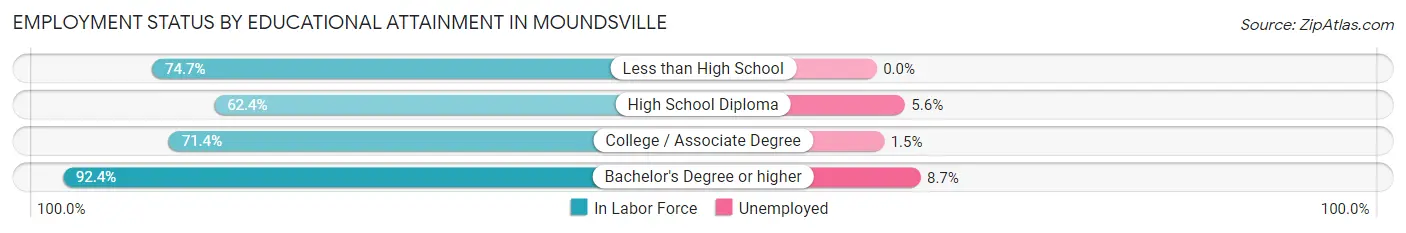
| Educational Attainment | In Labor Force | Unemployed |
| Less than High School | 189 (74.7%) | 0 (0.0%) |
| High School Diploma | 1,436 (62.4%) | 129 (5.6%) |
| College / Associate Degree | 927 (71.4%) | 19 (1.5%) |
| Bachelor's Degree or higher | 587 (92.4%) | 55 (8.7%) |
| Total | 3,142 (70.0%) | 206 (4.6%) |
Employment Occupations by Sex in Moundsville
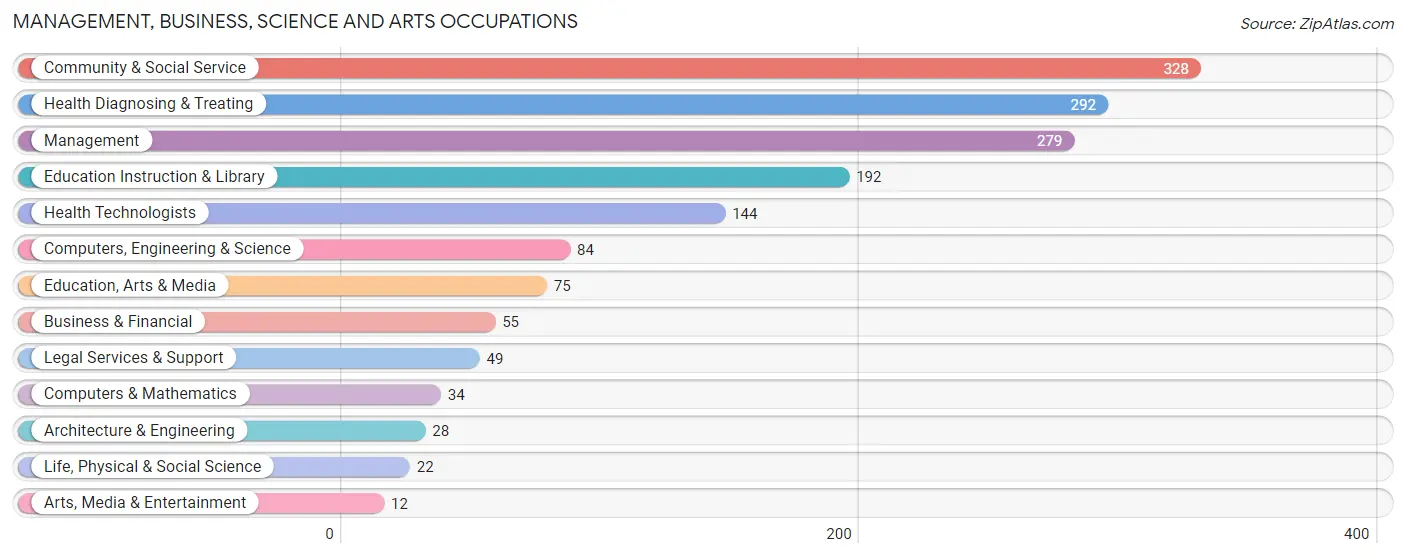
Management, Business, Science and Arts Occupations
The most common Management, Business, Science and Arts occupations in Moundsville are Community & Social Service (328 | 9.3%), Health Diagnosing & Treating (292 | 8.3%), Management (279 | 8.0%), Education Instruction & Library (192 | 5.5%), and Health Technologists (144 | 4.1%).
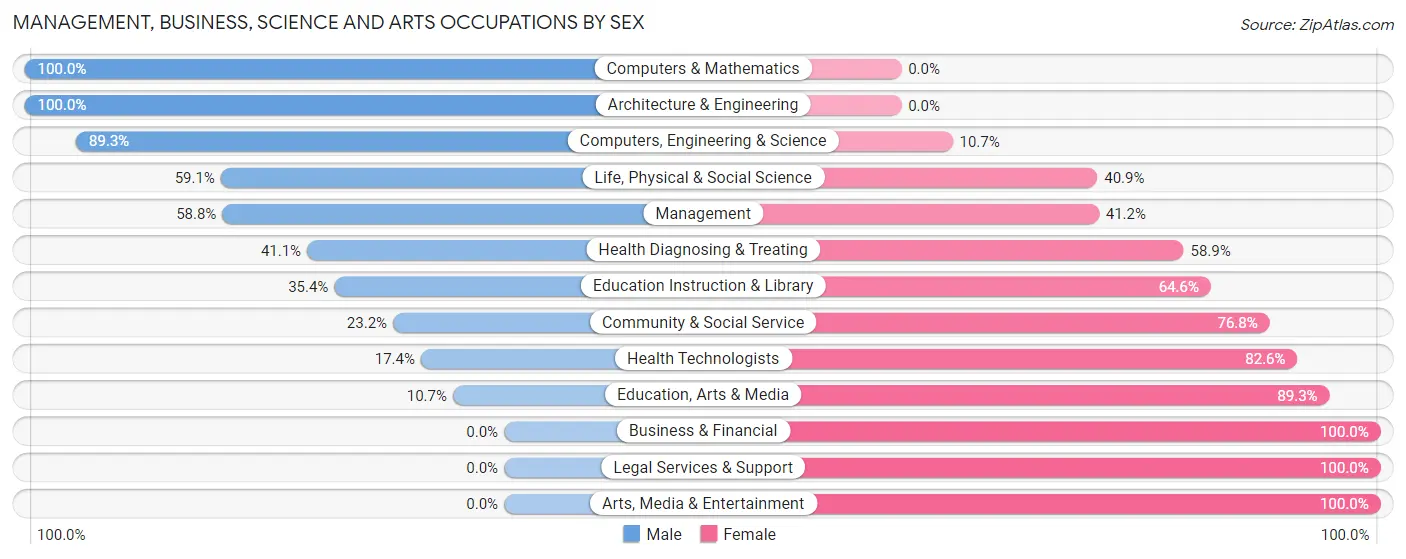
Management, Business, Science and Arts Occupations by Sex
Within the Management, Business, Science and Arts occupations in Moundsville, the most male-oriented occupations are Computers & Mathematics (100.0%), Architecture & Engineering (100.0%), and Computers, Engineering & Science (89.3%), while the most female-oriented occupations are Business & Financial (100.0%), Legal Services & Support (100.0%), and Arts, Media & Entertainment (100.0%).
| Occupation | Male | Female |
| Management | 164 (58.8%) | 115 (41.2%) |
| Business & Financial | 0 (0.0%) | 55 (100.0%) |
| Computers, Engineering & Science | 75 (89.3%) | 9 (10.7%) |
| Computers & Mathematics | 34 (100.0%) | 0 (0.0%) |
| Architecture & Engineering | 28 (100.0%) | 0 (0.0%) |
| Life, Physical & Social Science | 13 (59.1%) | 9 (40.9%) |
| Community & Social Service | 76 (23.2%) | 252 (76.8%) |
| Education, Arts & Media | 8 (10.7%) | 67 (89.3%) |
| Legal Services & Support | 0 (0.0%) | 49 (100.0%) |
| Education Instruction & Library | 68 (35.4%) | 124 (64.6%) |
| Arts, Media & Entertainment | 0 (0.0%) | 12 (100.0%) |
| Health Diagnosing & Treating | 120 (41.1%) | 172 (58.9%) |
| Health Technologists | 25 (17.4%) | 119 (82.6%) |
| Total (Category) | 435 (41.9%) | 603 (58.1%) |
| Total (Overall) | 1,753 (50.0%) | 1,754 (50.0%) |
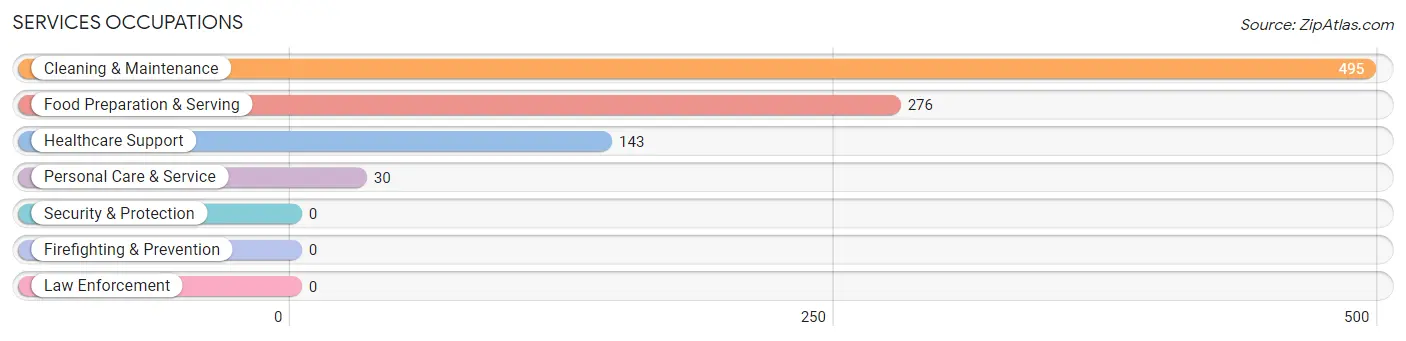
Services Occupations
The most common Services occupations in Moundsville are Cleaning & Maintenance (495 | 14.1%), Food Preparation & Serving (276 | 7.9%), Healthcare Support (143 | 4.1%), and Personal Care & Service (30 | 0.9%).
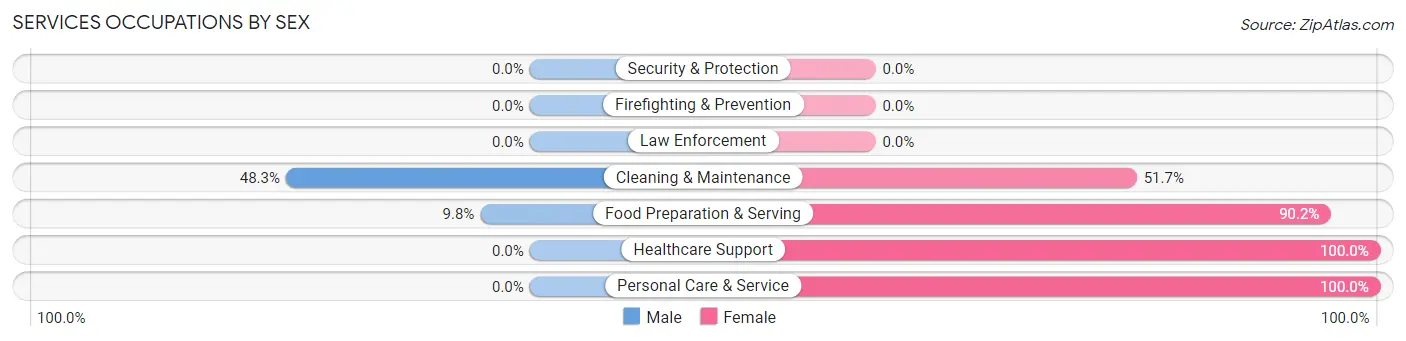
Services Occupations by Sex
Within the Services occupations in Moundsville, the most male-oriented occupations are Cleaning & Maintenance (48.3%), and Food Preparation & Serving (9.8%), while the most female-oriented occupations are Healthcare Support (100.0%), Personal Care & Service (100.0%), and Food Preparation & Serving (90.2%).
| Occupation | Male | Female |
| Healthcare Support | 0 (0.0%) | 143 (100.0%) |
| Security & Protection | 0 (0.0%) | 0 (0.0%) |
| Firefighting & Prevention | 0 (0.0%) | 0 (0.0%) |
| Law Enforcement | 0 (0.0%) | 0 (0.0%) |
| Food Preparation & Serving | 27 (9.8%) | 249 (90.2%) |
| Cleaning & Maintenance | 239 (48.3%) | 256 (51.7%) |
| Personal Care & Service | 0 (0.0%) | 30 (100.0%) |
| Total (Category) | 266 (28.2%) | 678 (71.8%) |
| Total (Overall) | 1,753 (50.0%) | 1,754 (50.0%) |
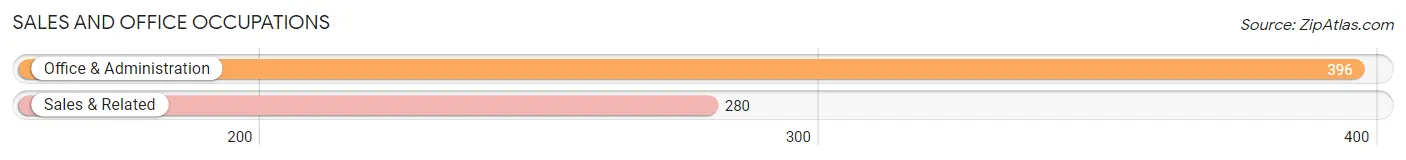
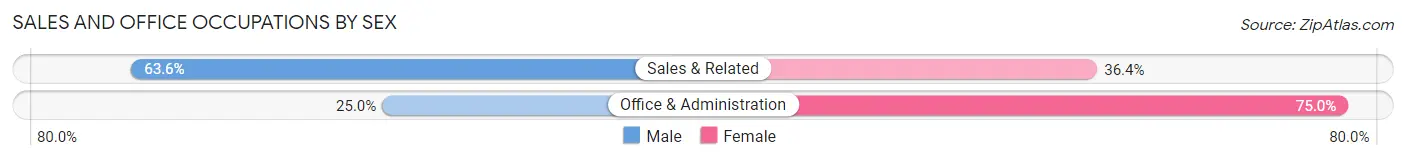
Sales and Office Occupations
The most common Sales and Office occupations in Moundsville are Office & Administration (396 | 11.3%), and Sales & Related (280 | 8.0%).
Sales and Office Occupations by Sex
| Occupation | Male | Female |
| Sales & Related | 178 (63.6%) | 102 (36.4%) |
| Office & Administration | 99 (25.0%) | 297 (75.0%) |
| Total (Category) | 277 (41.0%) | 399 (59.0%) |
| Total (Overall) | 1,753 (50.0%) | 1,754 (50.0%) |
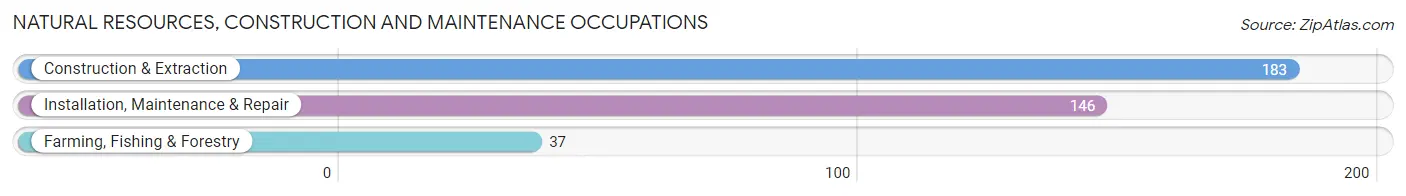
Natural Resources, Construction and Maintenance Occupations
The most common Natural Resources, Construction and Maintenance occupations in Moundsville are Construction & Extraction (183 | 5.2%), Installation, Maintenance & Repair (146 | 4.2%), and Farming, Fishing & Forestry (37 | 1.1%).
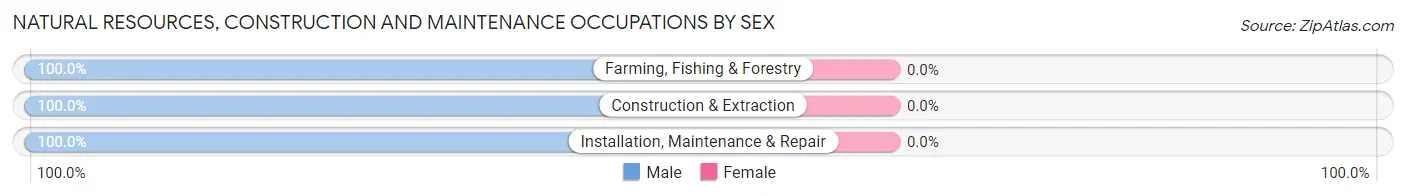
Natural Resources, Construction and Maintenance Occupations by Sex
| Occupation | Male | Female |
| Farming, Fishing & Forestry | 37 (100.0%) | 0 (0.0%) |
| Construction & Extraction | 183 (100.0%) | 0 (0.0%) |
| Installation, Maintenance & Repair | 146 (100.0%) | 0 (0.0%) |
| Total (Category) | 366 (100.0%) | 0 (0.0%) |
| Total (Overall) | 1,753 (50.0%) | 1,754 (50.0%) |
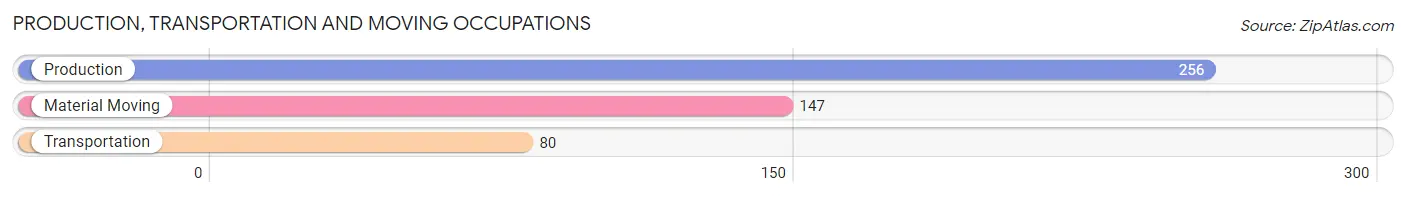
Production, Transportation and Moving Occupations
The most common Production, Transportation and Moving occupations in Moundsville are Production (256 | 7.3%), Material Moving (147 | 4.2%), and Transportation (80 | 2.3%).
Production, Transportation and Moving Occupations by Sex
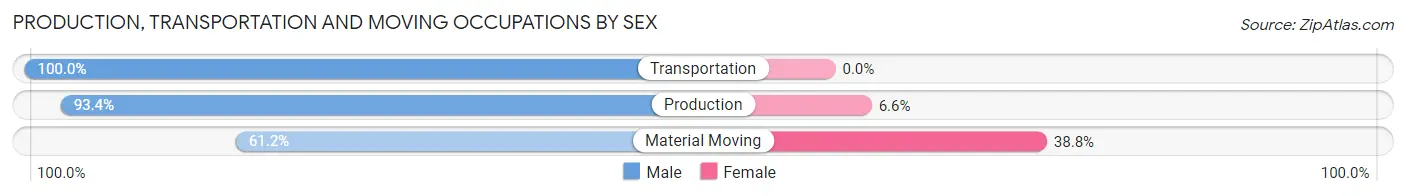
| Occupation | Male | Female |
| Production | 239 (93.4%) | 17 (6.6%) |
| Transportation | 80 (100.0%) | 0 (0.0%) |
| Material Moving | 90 (61.2%) | 57 (38.8%) |
| Total (Category) | 409 (84.7%) | 74 (15.3%) |
| Total (Overall) | 1,753 (50.0%) | 1,754 (50.0%) |
Employment Industries by Sex in Moundsville
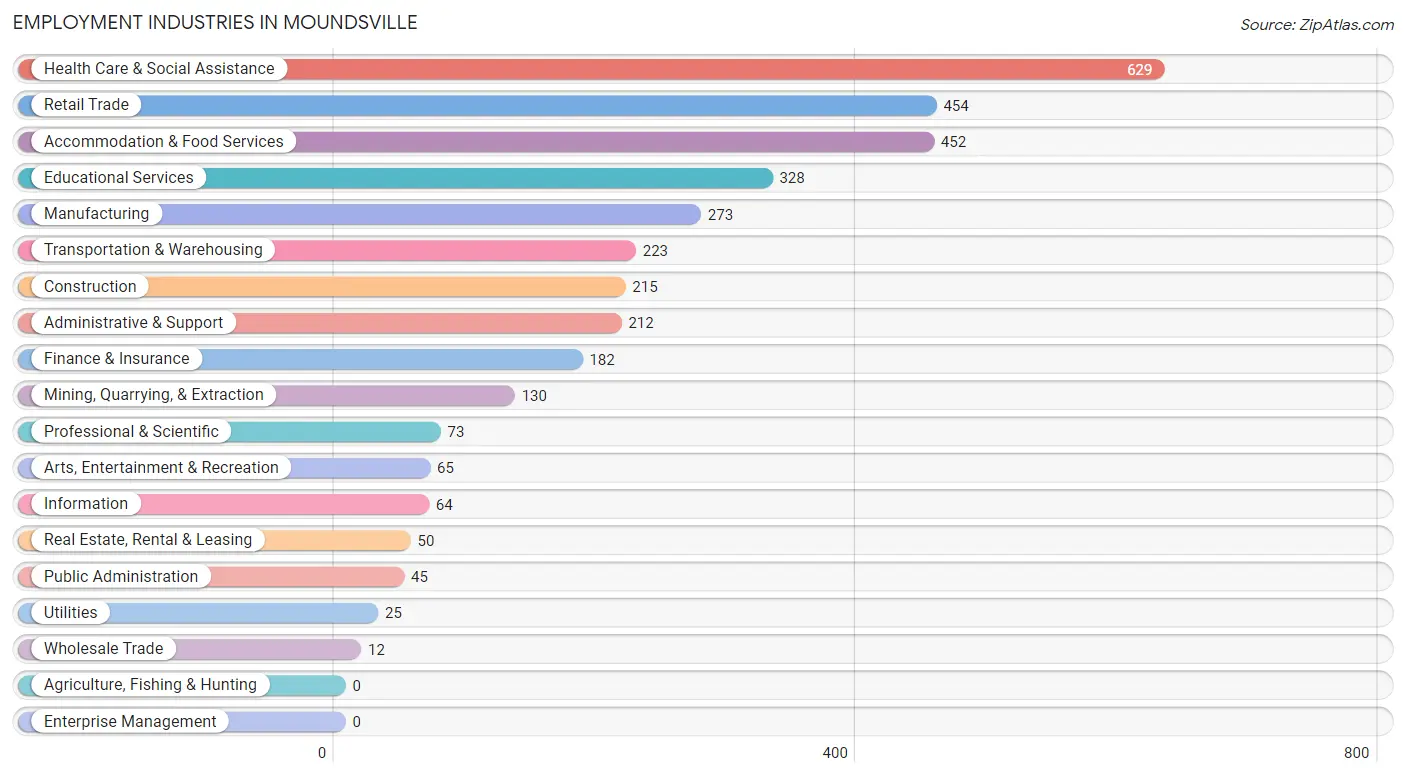
Employment Industries in Moundsville
The major employment industries in Moundsville include Health Care & Social Assistance (629 | 17.9%), Retail Trade (454 | 13.0%), Accommodation & Food Services (452 | 12.9%), Educational Services (328 | 9.3%), and Manufacturing (273 | 7.8%).
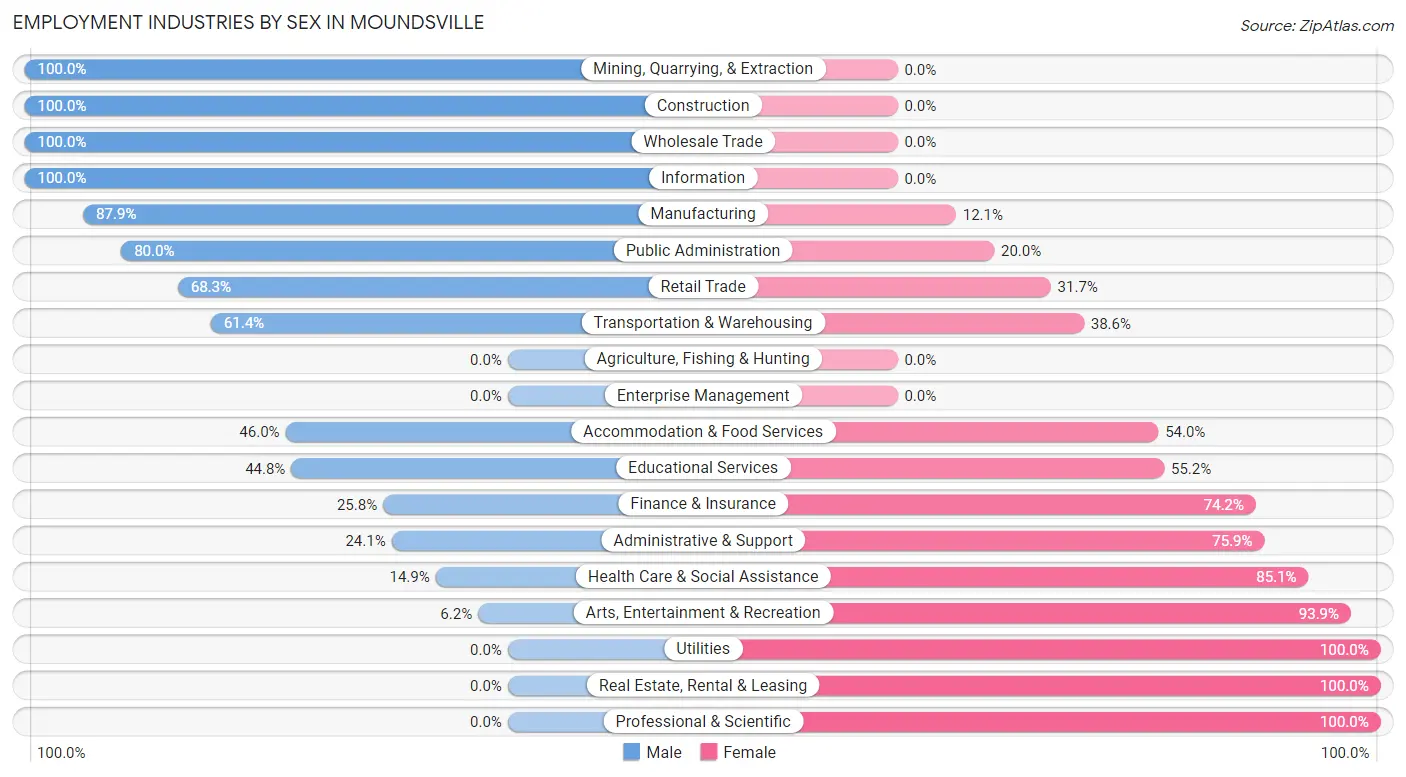
Employment Industries by Sex in Moundsville
The Moundsville industries that see more men than women are Mining, Quarrying, & Extraction (100.0%), Construction (100.0%), and Wholesale Trade (100.0%), whereas the industries that tend to have a higher number of women are Utilities (100.0%), Real Estate, Rental & Leasing (100.0%), and Professional & Scientific (100.0%).
| Industry | Male | Female |
| Agriculture, Fishing & Hunting | 0 (0.0%) | 0 (0.0%) |
| Mining, Quarrying, & Extraction | 130 (100.0%) | 0 (0.0%) |
| Construction | 215 (100.0%) | 0 (0.0%) |
| Manufacturing | 240 (87.9%) | 33 (12.1%) |
| Wholesale Trade | 12 (100.0%) | 0 (0.0%) |
| Retail Trade | 310 (68.3%) | 144 (31.7%) |
| Transportation & Warehousing | 137 (61.4%) | 86 (38.6%) |
| Utilities | 0 (0.0%) | 25 (100.0%) |
| Information | 64 (100.0%) | 0 (0.0%) |
| Finance & Insurance | 47 (25.8%) | 135 (74.2%) |
| Real Estate, Rental & Leasing | 0 (0.0%) | 50 (100.0%) |
| Professional & Scientific | 0 (0.0%) | 73 (100.0%) |
| Enterprise Management | 0 (0.0%) | 0 (0.0%) |
| Administrative & Support | 51 (24.1%) | 161 (75.9%) |
| Educational Services | 147 (44.8%) | 181 (55.2%) |
| Health Care & Social Assistance | 94 (14.9%) | 535 (85.1%) |
| Arts, Entertainment & Recreation | 4 (6.1%) | 61 (93.9%) |
| Accommodation & Food Services | 208 (46.0%) | 244 (54.0%) |
| Public Administration | 36 (80.0%) | 9 (20.0%) |
| Total | 1,753 (50.0%) | 1,754 (50.0%) |
Education in Moundsville
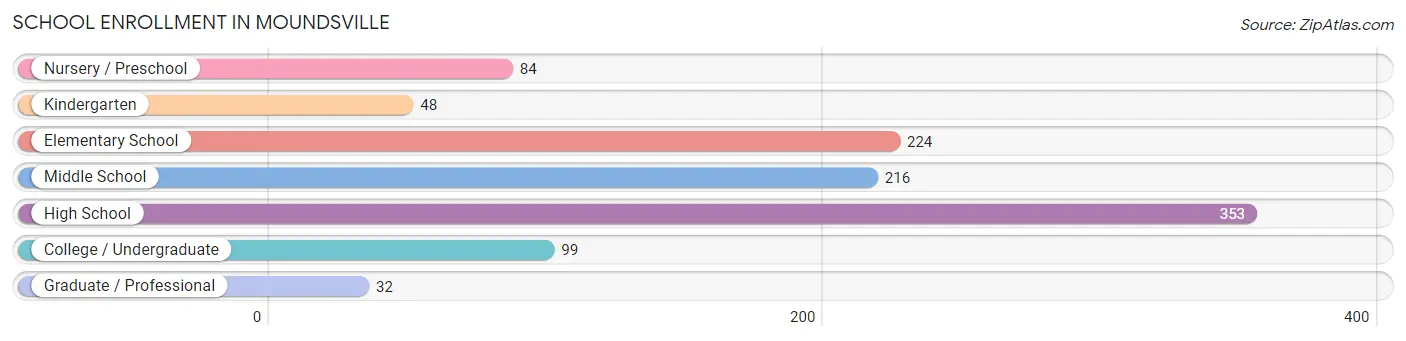
School Enrollment in Moundsville
The most common levels of schooling among the 1,056 students in Moundsville are high school (353 | 33.4%), elementary school (224 | 21.2%), and middle school (216 | 20.4%).
| School Level | # Students | % Students |
| Nursery / Preschool | 84 | 8.0% |
| Kindergarten | 48 | 4.5% |
| Elementary School | 224 | 21.2% |
| Middle School | 216 | 20.4% |
| High School | 353 | 33.4% |
| College / Undergraduate | 99 | 9.4% |
| Graduate / Professional | 32 | 3.0% |
| Total | 1,056 | 100.0% |
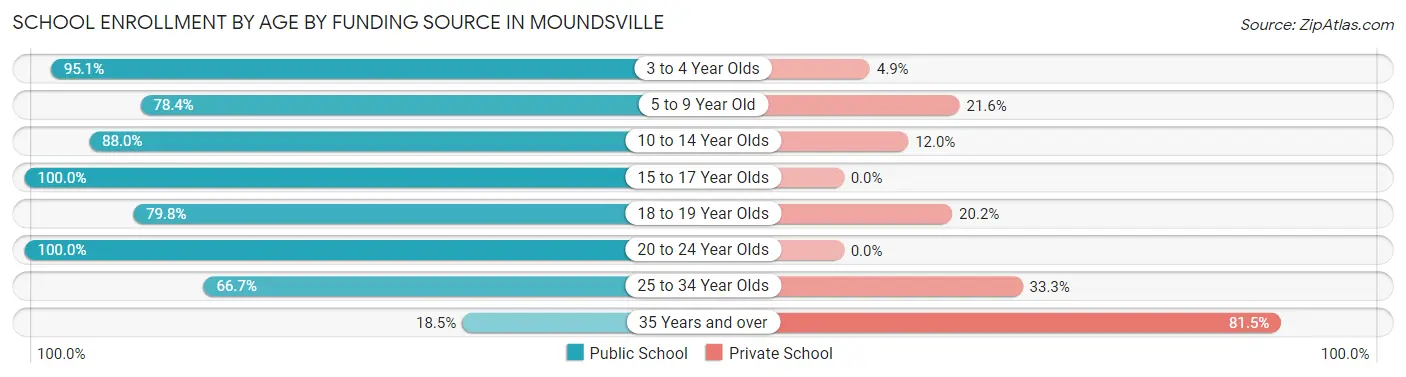
School Enrollment by Age by Funding Source in Moundsville
Out of a total of 1,056 students who are enrolled in schools in Moundsville, 146 (13.8%) attend a private institution, while the remaining 910 (86.2%) are enrolled in public schools. The age group of 35 years and over has the highest likelihood of being enrolled in private schools, with 22 (81.5% in the age bracket) enrolled. Conversely, the age group of 15 to 17 year olds has the lowest likelihood of being enrolled in a private school, with 284 (100.0% in the age bracket) attending a public institution.
| Age Bracket | Public School | Private School |
| 3 to 4 Year Olds | 39 (95.1%) | 2 (4.9%) |
| 5 to 9 Year Old | 229 (78.4%) | 63 (21.6%) |
| 10 to 14 Year Olds | 205 (88.0%) | 28 (12.0%) |
| 15 to 17 Year Olds | 284 (100.0%) | 0 (0.0%) |
| 18 to 19 Year Olds | 75 (79.8%) | 19 (20.2%) |
| 20 to 24 Year Olds | 49 (100.0%) | 0 (0.0%) |
| 25 to 34 Year Olds | 24 (66.7%) | 12 (33.3%) |
| 35 Years and over | 5 (18.5%) | 22 (81.5%) |
| Total | 910 (86.2%) | 146 (13.8%) |
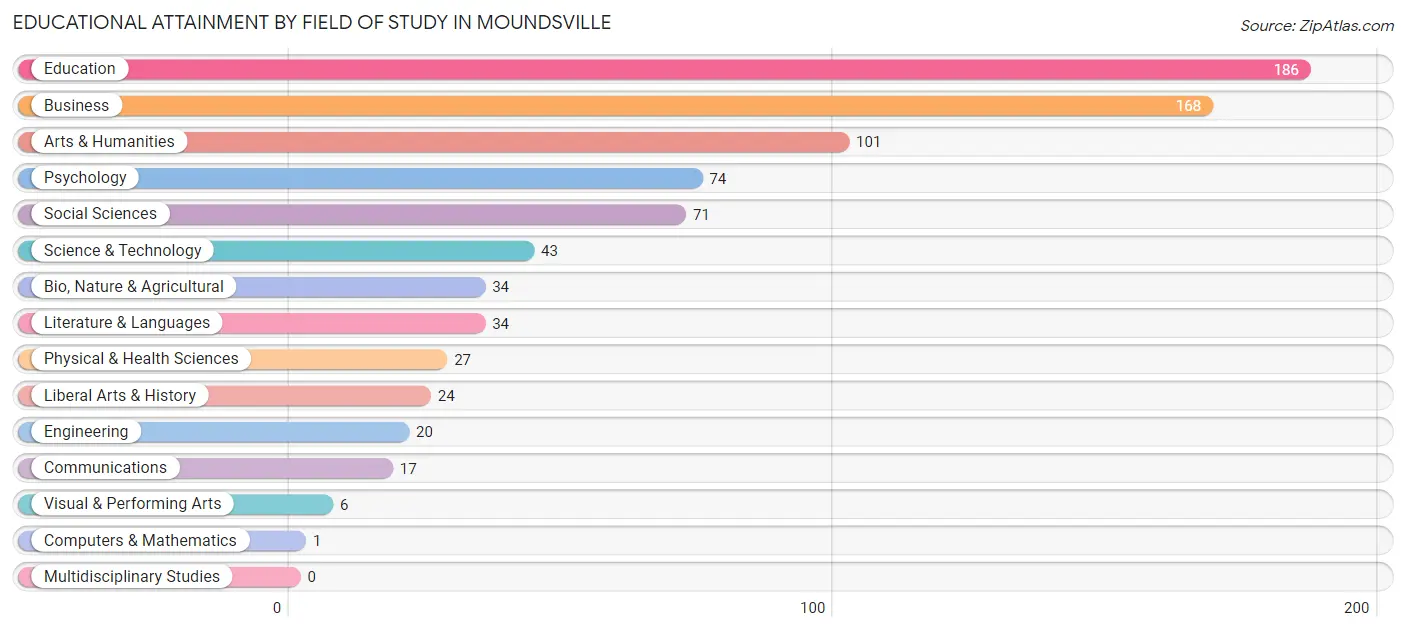
Educational Attainment by Field of Study in Moundsville
Education (186 | 23.1%), business (168 | 20.8%), arts & humanities (101 | 12.5%), psychology (74 | 9.2%), and social sciences (71 | 8.8%) are the most common fields of study among 806 individuals in Moundsville who have obtained a bachelor's degree or higher.
| Field of Study | # Graduates | % Graduates |
| Computers & Mathematics | 1 | 0.1% |
| Bio, Nature & Agricultural | 34 | 4.2% |
| Physical & Health Sciences | 27 | 3.4% |
| Psychology | 74 | 9.2% |
| Social Sciences | 71 | 8.8% |
| Engineering | 20 | 2.5% |
| Multidisciplinary Studies | 0 | 0.0% |
| Science & Technology | 43 | 5.3% |
| Business | 168 | 20.8% |
| Education | 186 | 23.1% |
| Literature & Languages | 34 | 4.2% |
| Liberal Arts & History | 24 | 3.0% |
| Visual & Performing Arts | 6 | 0.7% |
| Communications | 17 | 2.1% |
| Arts & Humanities | 101 | 12.5% |
| Total | 806 | 100.0% |
Transportation & Commute in Moundsville
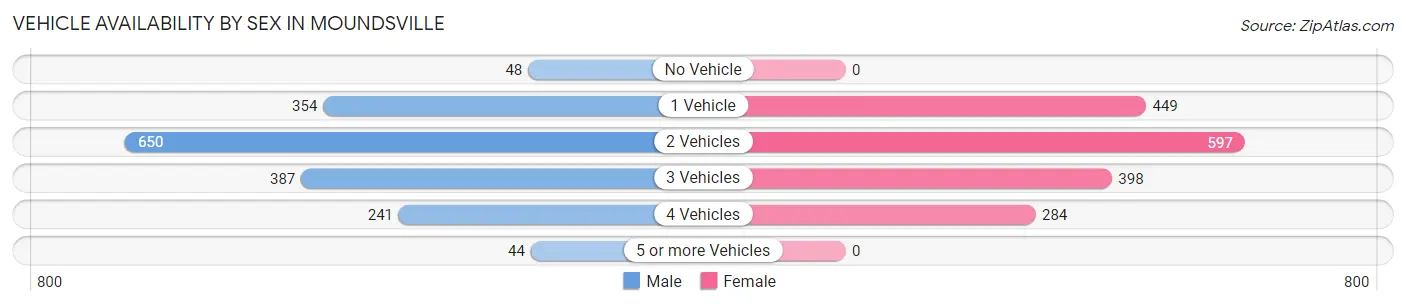
Vehicle Availability by Sex in Moundsville
The most prevalent vehicle ownership categories in Moundsville are males with 2 vehicles (650, accounting for 37.7%) and females with 2 vehicles (597, making up 37.6%).
| Vehicles Available | Male | Female |
| No Vehicle | 48 (2.8%) | 0 (0.0%) |
| 1 Vehicle | 354 (20.5%) | 449 (26.0%) |
| 2 Vehicles | 650 (37.7%) | 597 (34.5%) |
| 3 Vehicles | 387 (22.5%) | 398 (23.0%) |
| 4 Vehicles | 241 (14.0%) | 284 (16.4%) |
| 5 or more Vehicles | 44 (2.5%) | 0 (0.0%) |
| Total | 1,724 (100.0%) | 1,728 (100.0%) |
Commute Time in Moundsville
The most frequently occuring commute durations in Moundsville are 5 to 9 minutes (710 commuters, 20.9%), 30 to 34 minutes (534 commuters, 15.7%), and 20 to 24 minutes (494 commuters, 14.5%).
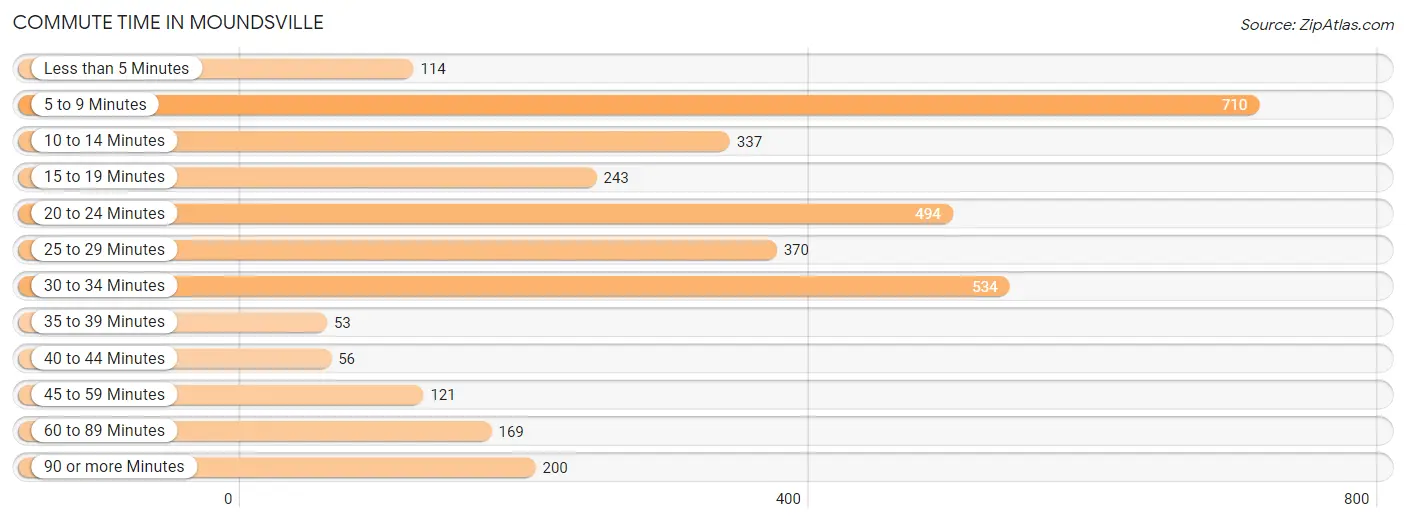
| Commute Time | # Commuters | % Commuters |
| Less than 5 Minutes | 114 | 3.4% |
| 5 to 9 Minutes | 710 | 20.9% |
| 10 to 14 Minutes | 337 | 9.9% |
| 15 to 19 Minutes | 243 | 7.1% |
| 20 to 24 Minutes | 494 | 14.5% |
| 25 to 29 Minutes | 370 | 10.9% |
| 30 to 34 Minutes | 534 | 15.7% |
| 35 to 39 Minutes | 53 | 1.6% |
| 40 to 44 Minutes | 56 | 1.7% |
| 45 to 59 Minutes | 121 | 3.6% |
| 60 to 89 Minutes | 169 | 5.0% |
| 90 or more Minutes | 200 | 5.9% |
Commute Time by Sex in Moundsville
The most common commute times in Moundsville are 20 to 24 minutes (336 commuters, 19.5%) for males and 5 to 9 minutes (391 commuters, 23.3%) for females.
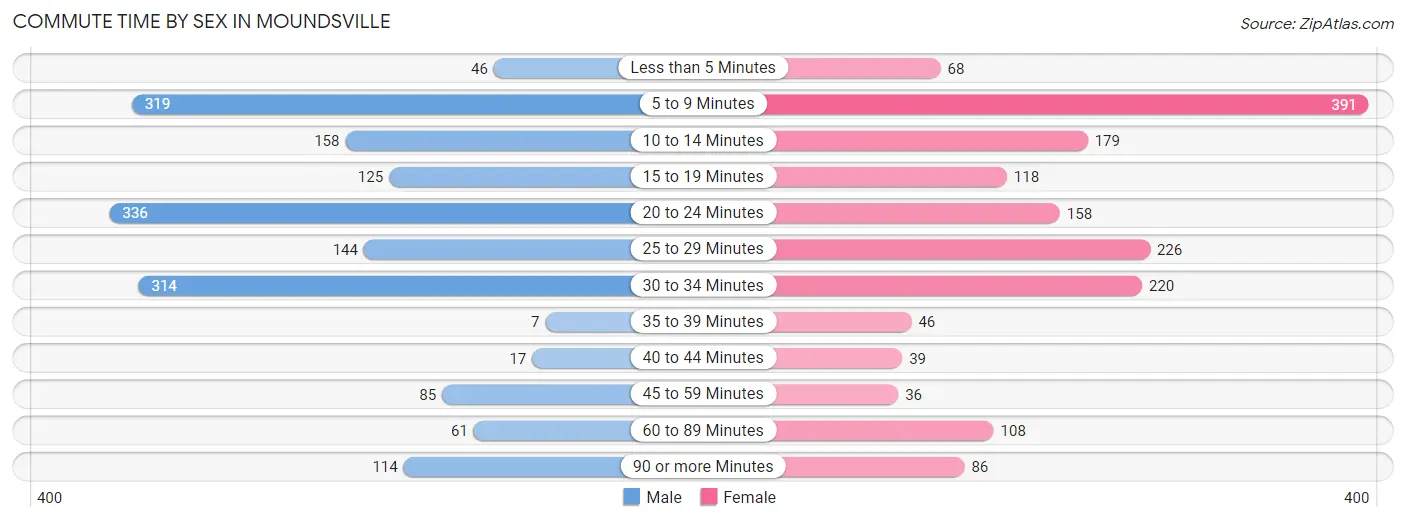
| Commute Time | Male | Female |
| Less than 5 Minutes | 46 (2.7%) | 68 (4.1%) |
| 5 to 9 Minutes | 319 (18.5%) | 391 (23.3%) |
| 10 to 14 Minutes | 158 (9.1%) | 179 (10.7%) |
| 15 to 19 Minutes | 125 (7.2%) | 118 (7.0%) |
| 20 to 24 Minutes | 336 (19.5%) | 158 (9.4%) |
| 25 to 29 Minutes | 144 (8.3%) | 226 (13.5%) |
| 30 to 34 Minutes | 314 (18.2%) | 220 (13.1%) |
| 35 to 39 Minutes | 7 (0.4%) | 46 (2.8%) |
| 40 to 44 Minutes | 17 (1.0%) | 39 (2.3%) |
| 45 to 59 Minutes | 85 (4.9%) | 36 (2.1%) |
| 60 to 89 Minutes | 61 (3.5%) | 108 (6.5%) |
| 90 or more Minutes | 114 (6.6%) | 86 (5.1%) |
Time of Departure to Work by Sex in Moundsville
The most frequent times of departure to work in Moundsville are 12:00 PM to 3:59 PM (334, 19.4%) for males and 4:00 PM to 11:59 PM (281, 16.8%) for females.
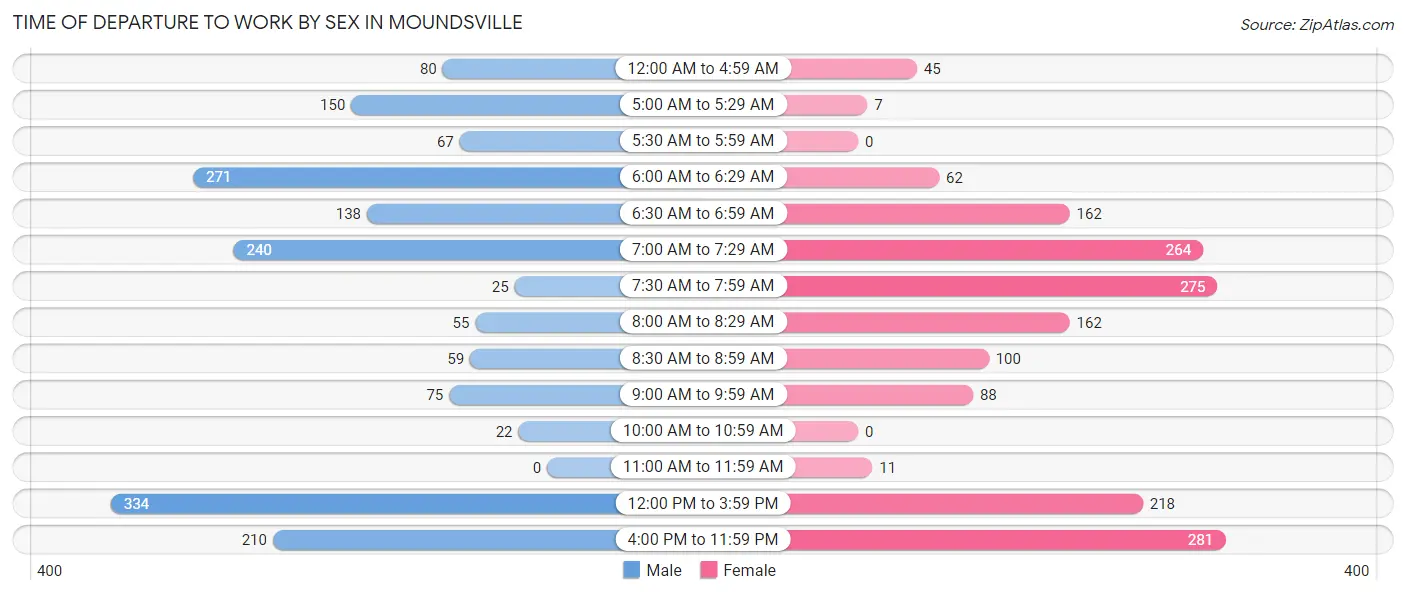
| Time of Departure | Male | Female |
| 12:00 AM to 4:59 AM | 80 (4.6%) | 45 (2.7%) |
| 5:00 AM to 5:29 AM | 150 (8.7%) | 7 (0.4%) |
| 5:30 AM to 5:59 AM | 67 (3.9%) | 0 (0.0%) |
| 6:00 AM to 6:29 AM | 271 (15.7%) | 62 (3.7%) |
| 6:30 AM to 6:59 AM | 138 (8.0%) | 162 (9.7%) |
| 7:00 AM to 7:29 AM | 240 (13.9%) | 264 (15.8%) |
| 7:30 AM to 7:59 AM | 25 (1.5%) | 275 (16.4%) |
| 8:00 AM to 8:29 AM | 55 (3.2%) | 162 (9.7%) |
| 8:30 AM to 8:59 AM | 59 (3.4%) | 100 (6.0%) |
| 9:00 AM to 9:59 AM | 75 (4.3%) | 88 (5.2%) |
| 10:00 AM to 10:59 AM | 22 (1.3%) | 0 (0.0%) |
| 11:00 AM to 11:59 AM | 0 (0.0%) | 11 (0.7%) |
| 12:00 PM to 3:59 PM | 334 (19.4%) | 218 (13.0%) |
| 4:00 PM to 11:59 PM | 210 (12.2%) | 281 (16.8%) |
| Total | 1,726 (100.0%) | 1,675 (100.0%) |
Housing Occupancy in Moundsville
Occupancy by Ownership in Moundsville
Of the total 3,507 dwellings in Moundsville, owner-occupied units account for 2,545 (72.6%), while renter-occupied units make up 962 (27.4%).
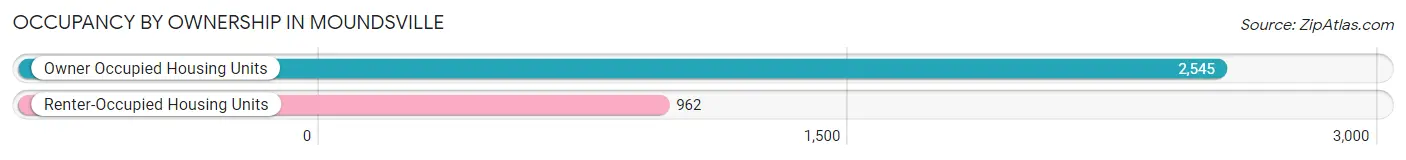
| Occupancy | # Housing Units | % Housing Units |
| Owner Occupied Housing Units | 2,545 | 72.6% |
| Renter-Occupied Housing Units | 962 | 27.4% |
| Total Occupied Housing Units | 3,507 | 100.0% |
Occupancy by Household Size in Moundsville
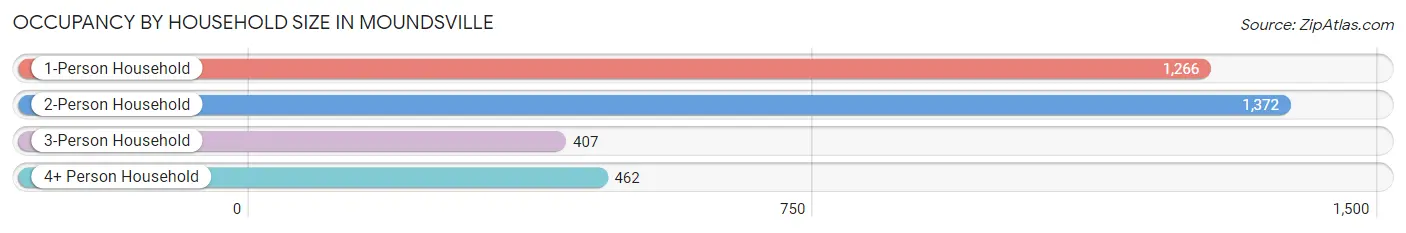
| Household Size | # Housing Units | % Housing Units |
| 1-Person Household | 1,266 | 36.1% |
| 2-Person Household | 1,372 | 39.1% |
| 3-Person Household | 407 | 11.6% |
| 4+ Person Household | 462 | 13.2% |
| Total Housing Units | 3,507 | 100.0% |
Occupancy by Ownership by Household Size in Moundsville
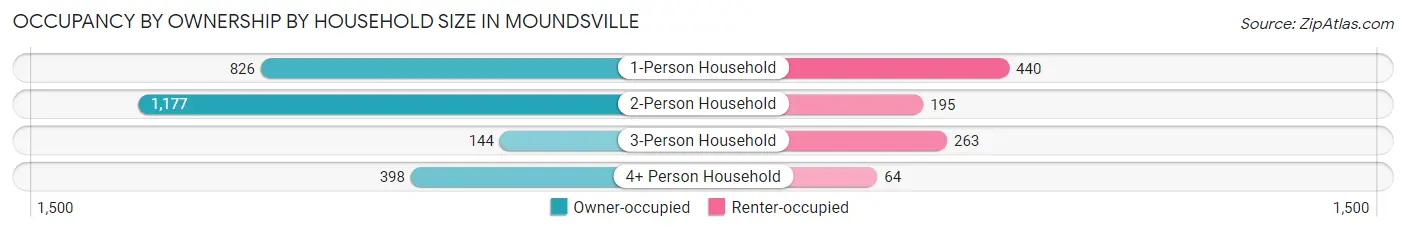
| Household Size | Owner-occupied | Renter-occupied |
| 1-Person Household | 826 (65.2%) | 440 (34.8%) |
| 2-Person Household | 1,177 (85.8%) | 195 (14.2%) |
| 3-Person Household | 144 (35.4%) | 263 (64.6%) |
| 4+ Person Household | 398 (86.2%) | 64 (13.9%) |
| Total Housing Units | 2,545 (72.6%) | 962 (27.4%) |
Occupancy by Educational Attainment in Moundsville
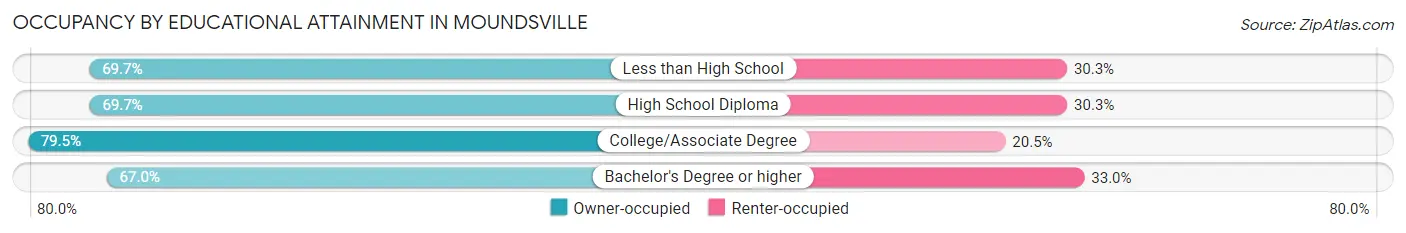
| Household Size | Owner-occupied | Renter-occupied |
| Less than High School | 159 (69.7%) | 69 (30.3%) |
| High School Diploma | 1,289 (69.7%) | 560 (30.3%) |
| College/Associate Degree | 884 (79.5%) | 228 (20.5%) |
| Bachelor's Degree or higher | 213 (67.0%) | 105 (33.0%) |
Occupancy by Age of Householder in Moundsville
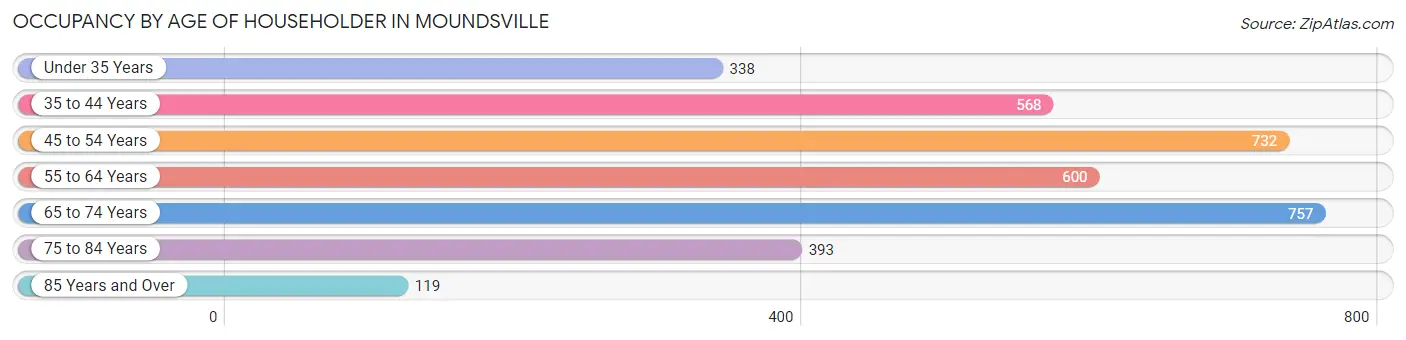
| Age Bracket | # Households | % Households |
| Under 35 Years | 338 | 9.6% |
| 35 to 44 Years | 568 | 16.2% |
| 45 to 54 Years | 732 | 20.9% |
| 55 to 64 Years | 600 | 17.1% |
| 65 to 74 Years | 757 | 21.6% |
| 75 to 84 Years | 393 | 11.2% |
| 85 Years and Over | 119 | 3.4% |
| Total | 3,507 | 100.0% |
Housing Finances in Moundsville
Median Income by Occupancy in Moundsville
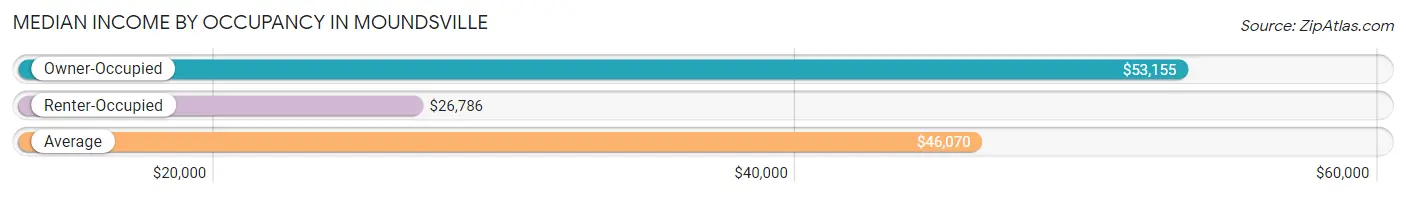
| Occupancy Type | # Households | Median Income |
| Owner-Occupied | 2,545 (72.6%) | $53,155 |
| Renter-Occupied | 962 (27.4%) | $26,786 |
| Average | 3,507 (100.0%) | $46,070 |
Occupancy by Householder Income Bracket in Moundsville
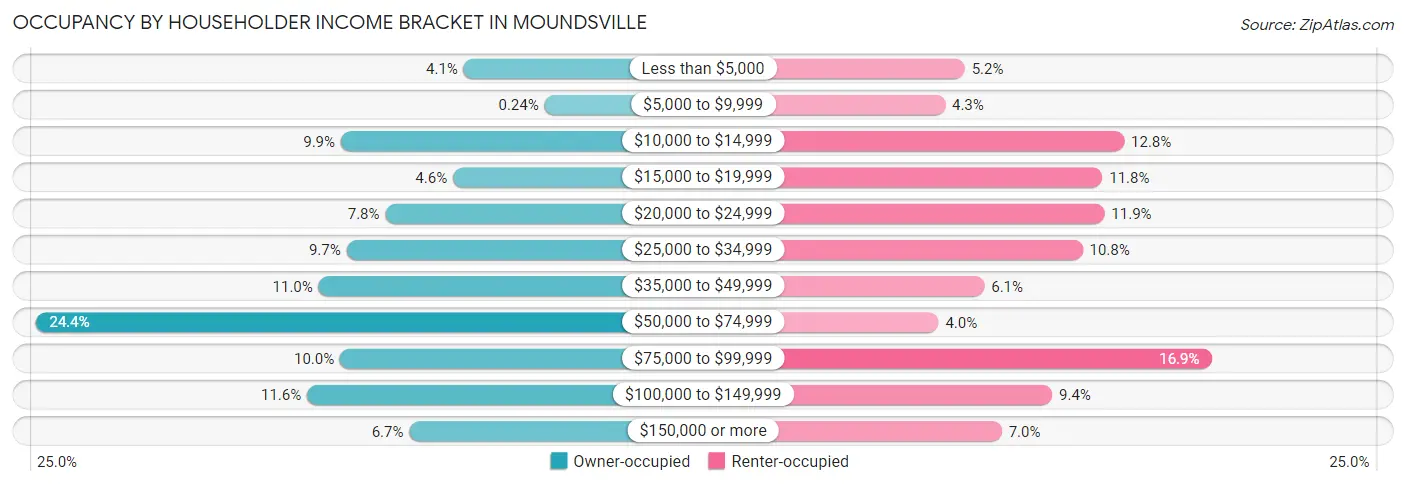
| Income Bracket | Owner-occupied | Renter-occupied |
| Less than $5,000 | 104 (4.1%) | 50 (5.2%) |
| $5,000 to $9,999 | 6 (0.2%) | 41 (4.3%) |
| $10,000 to $14,999 | 253 (9.9%) | 123 (12.8%) |
| $15,000 to $19,999 | 117 (4.6%) | 113 (11.7%) |
| $20,000 to $24,999 | 199 (7.8%) | 114 (11.8%) |
| $25,000 to $34,999 | 246 (9.7%) | 104 (10.8%) |
| $35,000 to $49,999 | 280 (11.0%) | 59 (6.1%) |
| $50,000 to $74,999 | 622 (24.4%) | 38 (4.0%) |
| $75,000 to $99,999 | 254 (10.0%) | 163 (16.9%) |
| $100,000 to $149,999 | 294 (11.6%) | 90 (9.4%) |
| $150,000 or more | 170 (6.7%) | 67 (7.0%) |
| Total | 2,545 (100.0%) | 962 (100.0%) |
Monthly Housing Cost Tiers in Moundsville
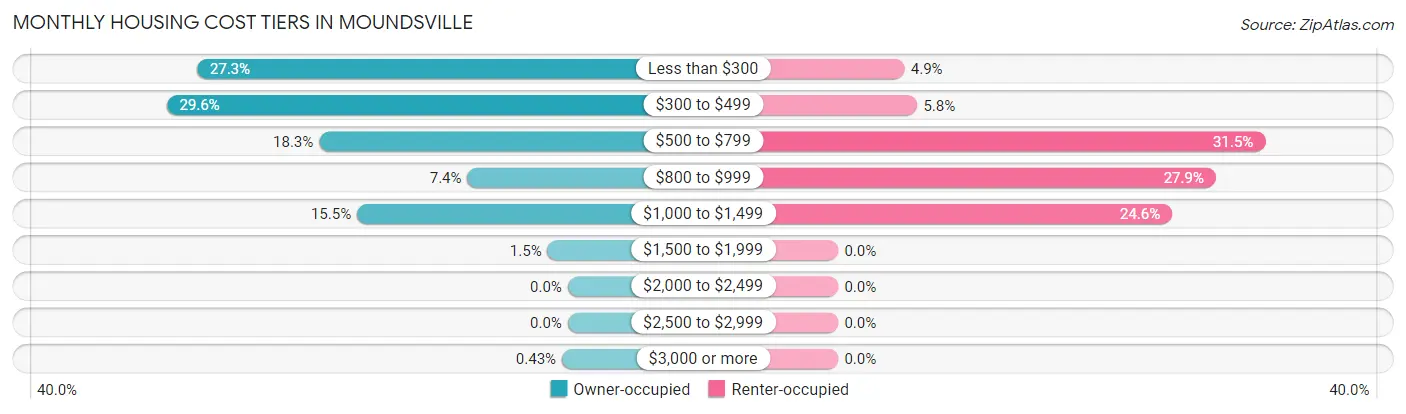
| Monthly Cost | Owner-occupied | Renter-occupied |
| Less than $300 | 695 (27.3%) | 47 (4.9%) |
| $300 to $499 | 752 (29.5%) | 56 (5.8%) |
| $500 to $799 | 466 (18.3%) | 303 (31.5%) |
| $800 to $999 | 188 (7.4%) | 268 (27.9%) |
| $1,000 to $1,499 | 395 (15.5%) | 237 (24.6%) |
| $1,500 to $1,999 | 38 (1.5%) | 0 (0.0%) |
| $2,000 to $2,499 | 0 (0.0%) | 0 (0.0%) |
| $2,500 to $2,999 | 0 (0.0%) | 0 (0.0%) |
| $3,000 or more | 11 (0.4%) | 0 (0.0%) |
| Total | 2,545 (100.0%) | 962 (100.0%) |
Physical Housing Characteristics in Moundsville
Housing Structures in Moundsville
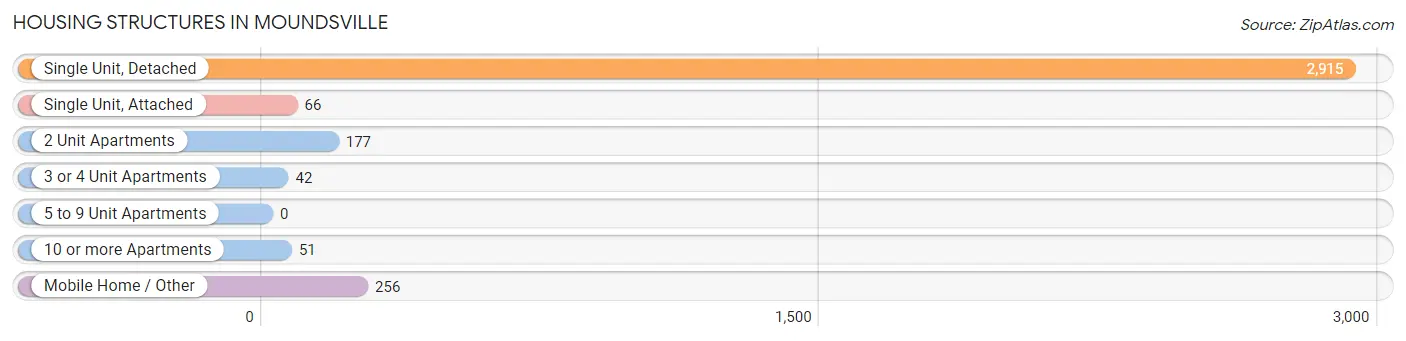
| Structure Type | # Housing Units | % Housing Units |
| Single Unit, Detached | 2,915 | 83.1% |
| Single Unit, Attached | 66 | 1.9% |
| 2 Unit Apartments | 177 | 5.1% |
| 3 or 4 Unit Apartments | 42 | 1.2% |
| 5 to 9 Unit Apartments | 0 | 0.0% |
| 10 or more Apartments | 51 | 1.5% |
| Mobile Home / Other | 256 | 7.3% |
| Total | 3,507 | 100.0% |
Housing Structures by Occupancy in Moundsville
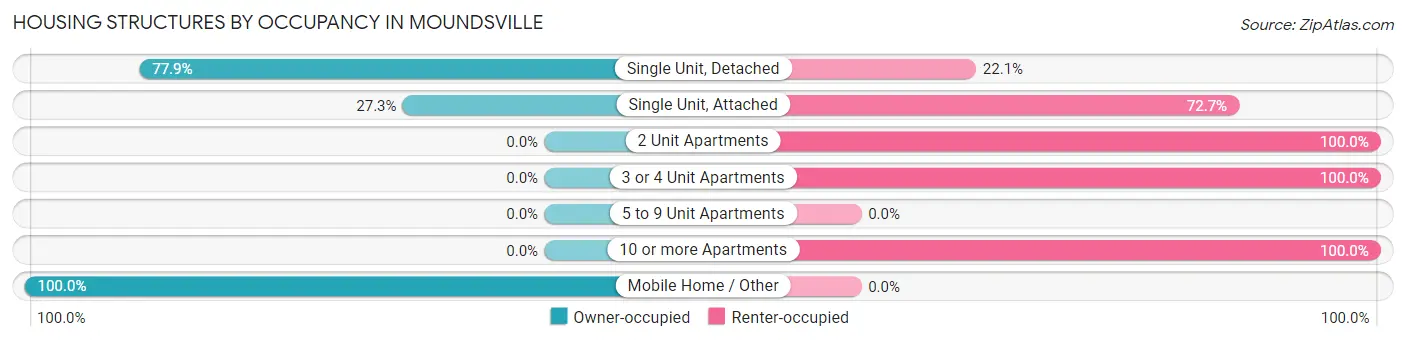
| Structure Type | Owner-occupied | Renter-occupied |
| Single Unit, Detached | 2,271 (77.9%) | 644 (22.1%) |
| Single Unit, Attached | 18 (27.3%) | 48 (72.7%) |
| 2 Unit Apartments | 0 (0.0%) | 177 (100.0%) |
| 3 or 4 Unit Apartments | 0 (0.0%) | 42 (100.0%) |
| 5 to 9 Unit Apartments | 0 (0.0%) | 0 (0.0%) |
| 10 or more Apartments | 0 (0.0%) | 51 (100.0%) |
| Mobile Home / Other | 256 (100.0%) | 0 (0.0%) |
| Total | 2,545 (72.6%) | 962 (27.4%) |
Housing Structures by Number of Rooms in Moundsville
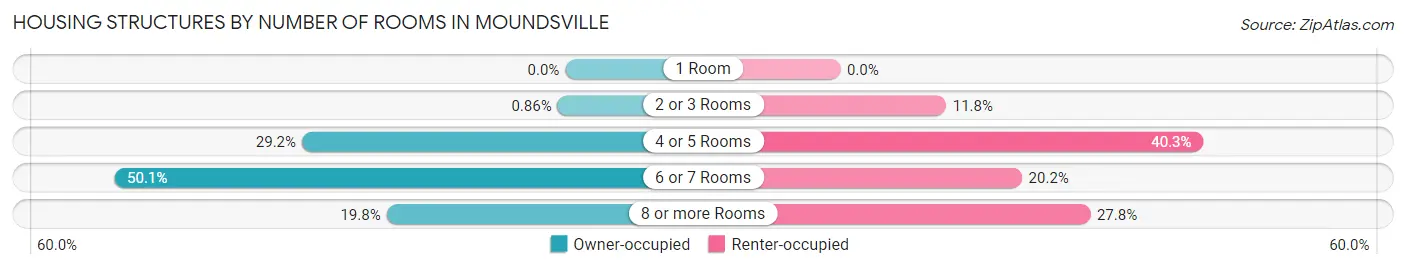
| Number of Rooms | Owner-occupied | Renter-occupied |
| 1 Room | 0 (0.0%) | 0 (0.0%) |
| 2 or 3 Rooms | 22 (0.9%) | 113 (11.7%) |
| 4 or 5 Rooms | 744 (29.2%) | 388 (40.3%) |
| 6 or 7 Rooms | 1,274 (50.1%) | 194 (20.2%) |
| 8 or more Rooms | 505 (19.8%) | 267 (27.8%) |
| Total | 2,545 (100.0%) | 962 (100.0%) |
Housing Structure by Heating Type in Moundsville
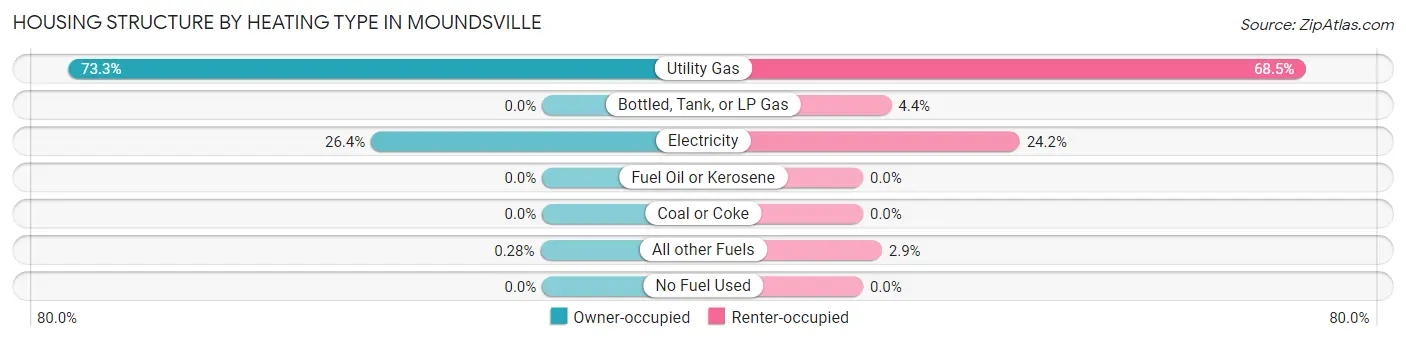
| Heating Type | Owner-occupied | Renter-occupied |
| Utility Gas | 1,865 (73.3%) | 659 (68.5%) |
| Bottled, Tank, or LP Gas | 0 (0.0%) | 42 (4.4%) |
| Electricity | 673 (26.4%) | 233 (24.2%) |
| Fuel Oil or Kerosene | 0 (0.0%) | 0 (0.0%) |
| Coal or Coke | 0 (0.0%) | 0 (0.0%) |
| All other Fuels | 7 (0.3%) | 28 (2.9%) |
| No Fuel Used | 0 (0.0%) | 0 (0.0%) |
| Total | 2,545 (100.0%) | 962 (100.0%) |
Household Vehicle Usage in Moundsville
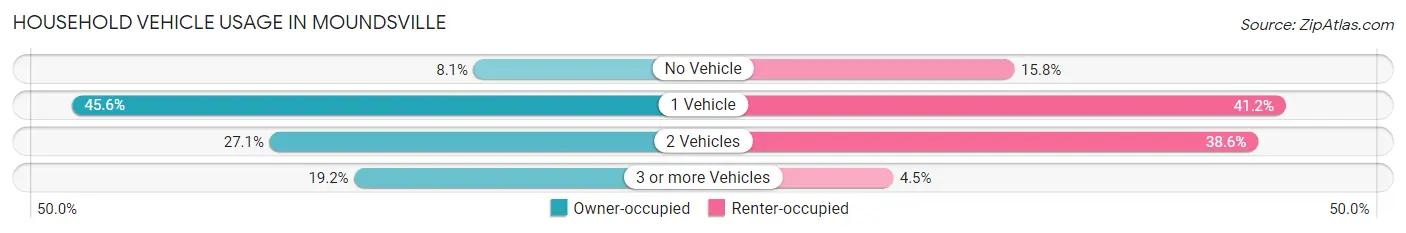
| Vehicles per Household | Owner-occupied | Renter-occupied |
| No Vehicle | 205 (8.1%) | 152 (15.8%) |
| 1 Vehicle | 1,161 (45.6%) | 396 (41.2%) |
| 2 Vehicles | 690 (27.1%) | 371 (38.6%) |
| 3 or more Vehicles | 489 (19.2%) | 43 (4.5%) |
| Total | 2,545 (100.0%) | 962 (100.0%) |
Real Estate & Mortgages in Moundsville
Real Estate and Mortgage Overview in Moundsville
| Characteristic | Without Mortgage | With Mortgage |
| Housing Units | 1,687 | 858 |
| Median Property Value | $74,200 | $108,000 |
| Median Household Income | $35,746 | $137 |
| Monthly Housing Costs | $356 | $11 |
| Real Estate Taxes | $303 | $13 |
Property Value by Mortgage Status in Moundsville
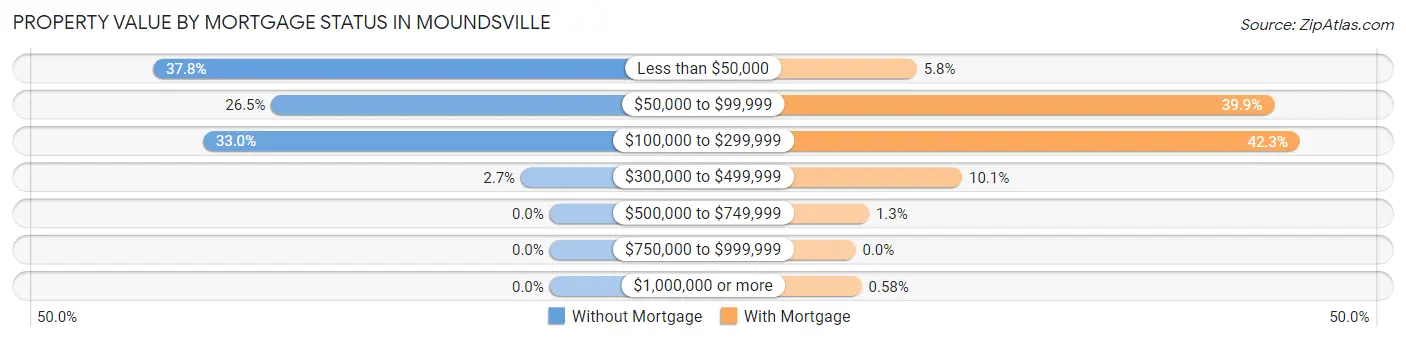
| Property Value | Without Mortgage | With Mortgage |
| Less than $50,000 | 637 (37.8%) | 50 (5.8%) |
| $50,000 to $99,999 | 447 (26.5%) | 342 (39.9%) |
| $100,000 to $299,999 | 557 (33.0%) | 363 (42.3%) |
| $300,000 to $499,999 | 46 (2.7%) | 87 (10.1%) |
| $500,000 to $749,999 | 0 (0.0%) | 11 (1.3%) |
| $750,000 to $999,999 | 0 (0.0%) | 0 (0.0%) |
| $1,000,000 or more | 0 (0.0%) | 5 (0.6%) |
| Total | 1,687 (100.0%) | 858 (100.0%) |
Household Income by Mortgage Status in Moundsville
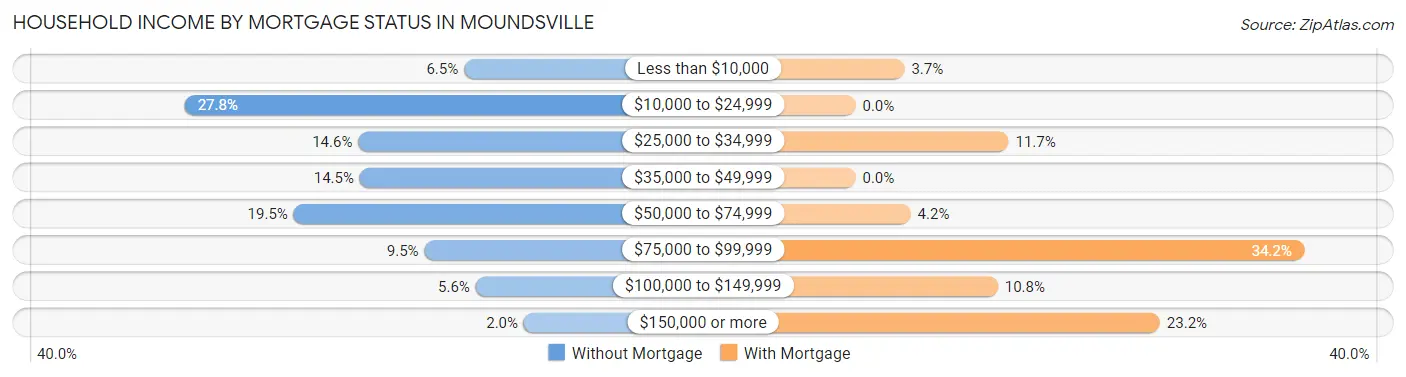
| Household Income | Without Mortgage | With Mortgage |
| Less than $10,000 | 110 (6.5%) | 32 (3.7%) |
| $10,000 to $24,999 | 469 (27.8%) | 0 (0.0%) |
| $25,000 to $34,999 | 246 (14.6%) | 100 (11.7%) |
| $35,000 to $49,999 | 244 (14.5%) | 0 (0.0%) |
| $50,000 to $74,999 | 329 (19.5%) | 36 (4.2%) |
| $75,000 to $99,999 | 161 (9.5%) | 293 (34.2%) |
| $100,000 to $149,999 | 95 (5.6%) | 93 (10.8%) |
| $150,000 or more | 33 (2.0%) | 199 (23.2%) |
| Total | 1,687 (100.0%) | 858 (100.0%) |
Property Value to Household Income Ratio in Moundsville
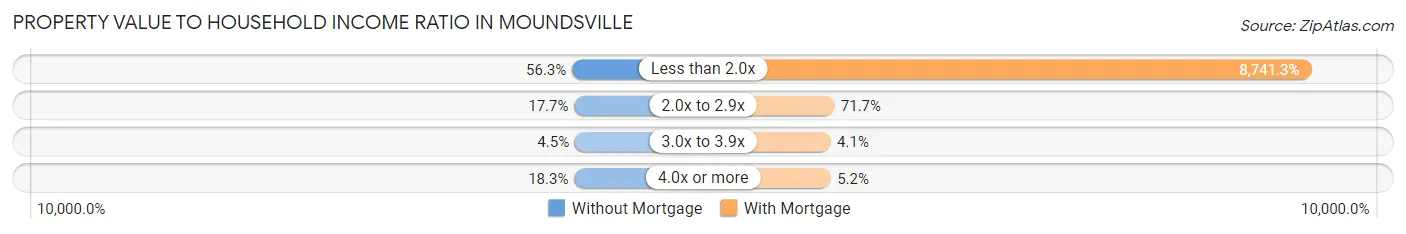
| Value-to-Income Ratio | Without Mortgage | With Mortgage |
| Less than 2.0x | 949 (56.2%) | 75,000 (8,741.3%) |
| 2.0x to 2.9x | 299 (17.7%) | 615 (71.7%) |
| 3.0x to 3.9x | 76 (4.5%) | 35 (4.1%) |
| 4.0x or more | 309 (18.3%) | 45 (5.2%) |
| Total | 1,687 (100.0%) | 858 (100.0%) |
Real Estate Taxes by Mortgage Status in Moundsville
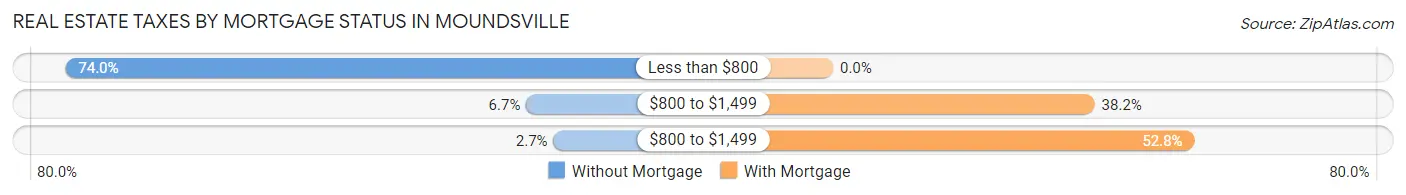
| Property Taxes | Without Mortgage | With Mortgage |
| Less than $800 | 1,249 (74.0%) | 0 (0.0%) |
| $800 to $1,499 | 113 (6.7%) | 328 (38.2%) |
| $800 to $1,499 | 46 (2.7%) | 453 (52.8%) |
| Total | 1,687 (100.0%) | 858 (100.0%) |
Health & Disability in Moundsville
Health Insurance Coverage by Age in Moundsville
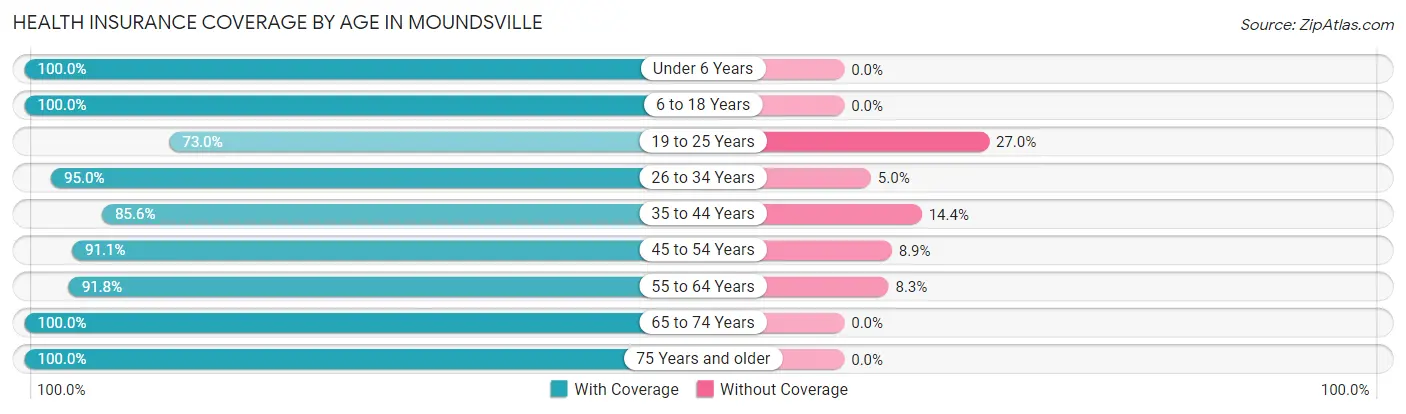
| Age Bracket | With Coverage | Without Coverage |
| Under 6 Years | 406 (100.0%) | 0 (0.0%) |
| 6 to 18 Years | 805 (100.0%) | 0 (0.0%) |
| 19 to 25 Years | 430 (73.0%) | 159 (27.0%) |
| 26 to 34 Years | 920 (95.0%) | 48 (5.0%) |
| 35 to 44 Years | 948 (85.6%) | 160 (14.4%) |
| 45 to 54 Years | 1,070 (91.1%) | 104 (8.9%) |
| 55 to 64 Years | 990 (91.7%) | 89 (8.3%) |
| 65 to 74 Years | 1,112 (100.0%) | 0 (0.0%) |
| 75 Years and older | 666 (100.0%) | 0 (0.0%) |
| Total | 7,347 (92.9%) | 560 (7.1%) |
Health Insurance Coverage by Citizenship Status in Moundsville
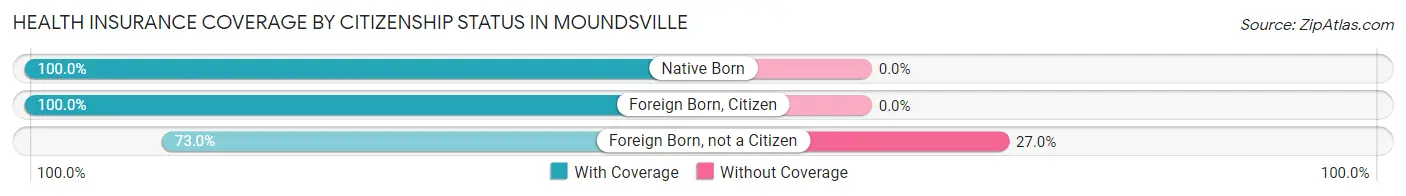
| Citizenship Status | With Coverage | Without Coverage |
| Native Born | 406 (100.0%) | 0 (0.0%) |
| Foreign Born, Citizen | 805 (100.0%) | 0 (0.0%) |
| Foreign Born, not a Citizen | 430 (73.0%) | 159 (27.0%) |
Health Insurance Coverage by Household Income in Moundsville
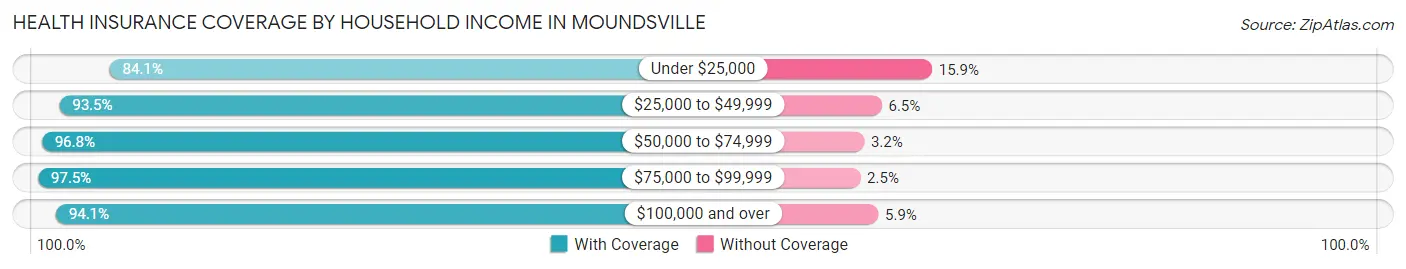
| Household Income | With Coverage | Without Coverage |
| Under $25,000 | 1,437 (84.1%) | 272 (15.9%) |
| $25,000 to $49,999 | 1,307 (93.5%) | 91 (6.5%) |
| $50,000 to $74,999 | 1,501 (96.8%) | 50 (3.2%) |
| $75,000 to $99,999 | 1,209 (97.5%) | 31 (2.5%) |
| $100,000 and over | 1,863 (94.1%) | 116 (5.9%) |
Public vs Private Health Insurance Coverage by Age in Moundsville
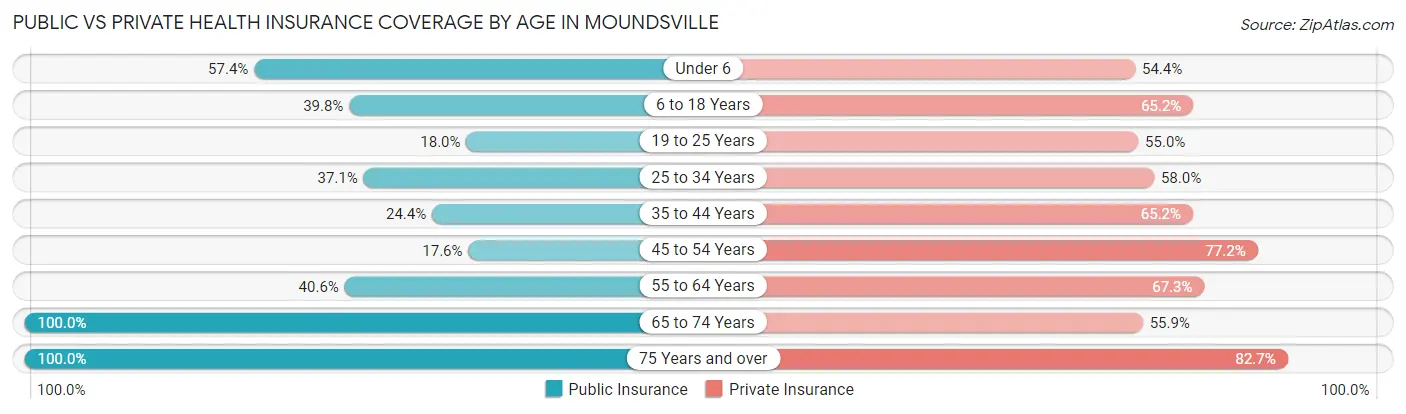
| Age Bracket | Public Insurance | Private Insurance |
| Under 6 | 233 (57.4%) | 221 (54.4%) |
| 6 to 18 Years | 320 (39.8%) | 525 (65.2%) |
| 19 to 25 Years | 106 (18.0%) | 324 (55.0%) |
| 25 to 34 Years | 359 (37.1%) | 561 (58.0%) |
| 35 to 44 Years | 270 (24.4%) | 722 (65.2%) |
| 45 to 54 Years | 207 (17.6%) | 906 (77.2%) |
| 55 to 64 Years | 438 (40.6%) | 726 (67.3%) |
| 65 to 74 Years | 1,112 (100.0%) | 621 (55.8%) |
| 75 Years and over | 666 (100.0%) | 551 (82.7%) |
| Total | 3,711 (46.9%) | 5,157 (65.2%) |
Disability Status by Sex by Age in Moundsville
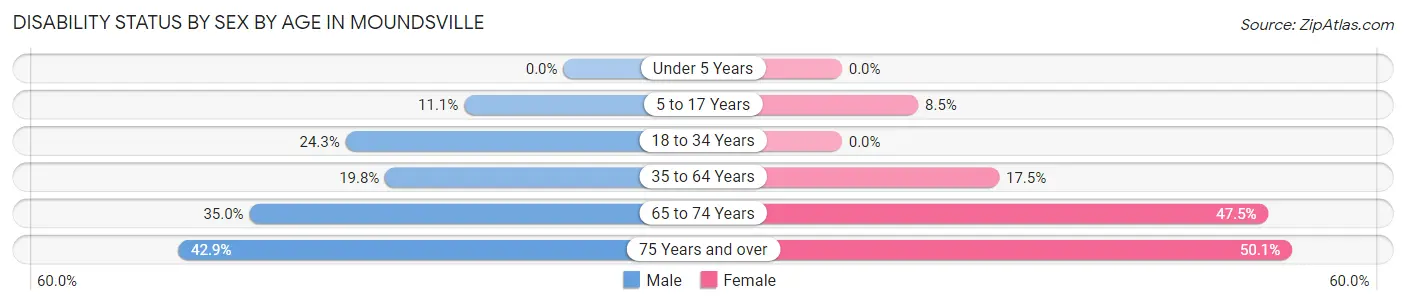
| Age Bracket | Male | Female |
| Under 5 Years | 0 (0.0%) | 0 (0.0%) |
| 5 to 17 Years | 40 (11.1%) | 38 (8.5%) |
| 18 to 34 Years | 172 (24.3%) | 0 (0.0%) |
| 35 to 64 Years | 345 (19.8%) | 284 (17.5%) |
| 65 to 74 Years | 129 (35.0%) | 353 (47.5%) |
| 75 Years and over | 130 (42.9%) | 182 (50.1%) |
Disability Class by Sex by Age in Moundsville
Disability Class: Hearing Difficulty
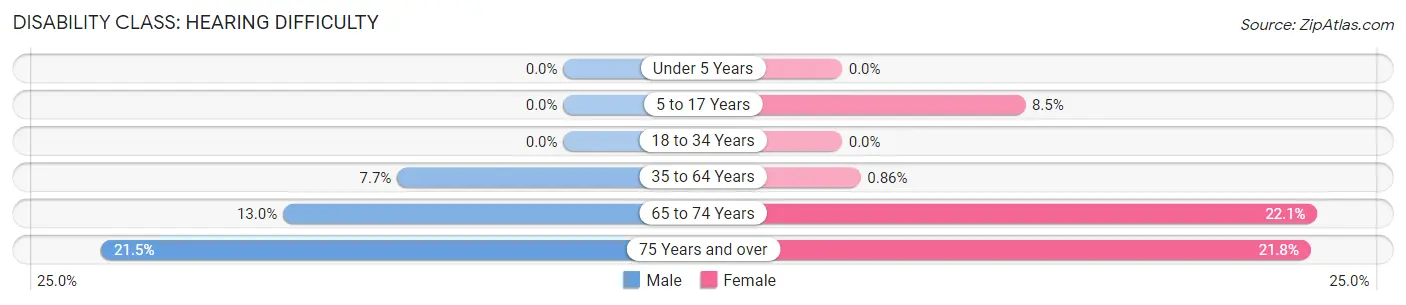
| Age Bracket | Male | Female |
| Under 5 Years | 0 (0.0%) | 0 (0.0%) |
| 5 to 17 Years | 0 (0.0%) | 38 (8.5%) |
| 18 to 34 Years | 0 (0.0%) | 0 (0.0%) |
| 35 to 64 Years | 134 (7.7%) | 14 (0.9%) |
| 65 to 74 Years | 48 (13.0%) | 164 (22.1%) |
| 75 Years and over | 65 (21.4%) | 79 (21.8%) |
Disability Class: Vision Difficulty
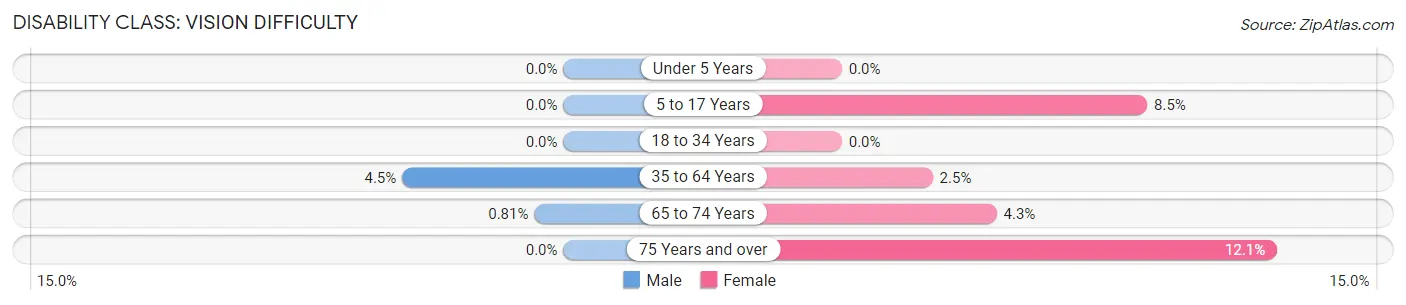
| Age Bracket | Male | Female |
| Under 5 Years | 0 (0.0%) | 0 (0.0%) |
| 5 to 17 Years | 0 (0.0%) | 38 (8.5%) |
| 18 to 34 Years | 0 (0.0%) | 0 (0.0%) |
| 35 to 64 Years | 78 (4.5%) | 41 (2.5%) |
| 65 to 74 Years | 3 (0.8%) | 32 (4.3%) |
| 75 Years and over | 0 (0.0%) | 44 (12.1%) |
Disability Class: Cognitive Difficulty
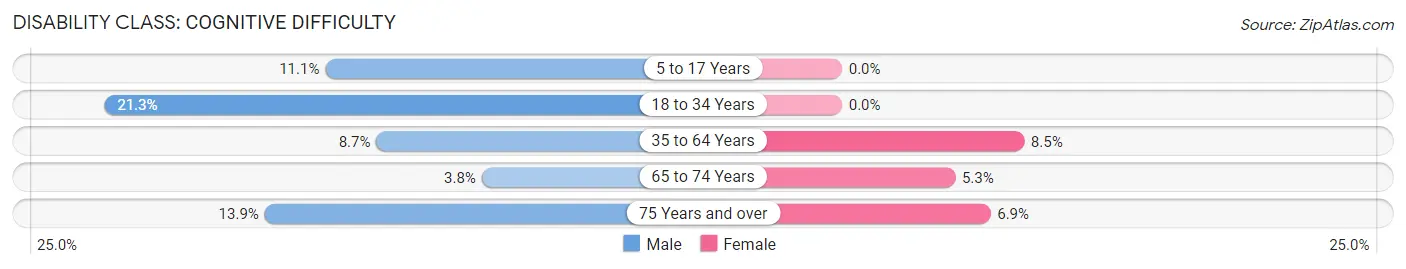
| Age Bracket | Male | Female |
| 5 to 17 Years | 40 (11.1%) | 0 (0.0%) |
| 18 to 34 Years | 151 (21.3%) | 0 (0.0%) |
| 35 to 64 Years | 151 (8.7%) | 137 (8.5%) |
| 65 to 74 Years | 14 (3.8%) | 39 (5.2%) |
| 75 Years and over | 42 (13.9%) | 25 (6.9%) |
Disability Class: Ambulatory Difficulty
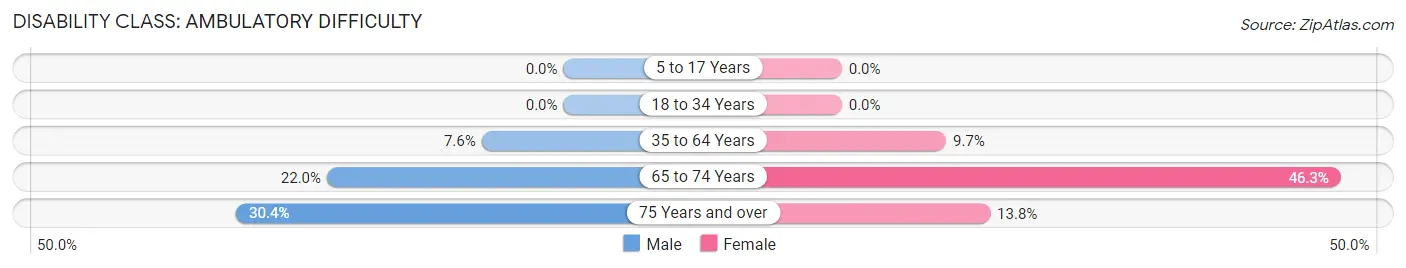
| Age Bracket | Male | Female |
| 5 to 17 Years | 0 (0.0%) | 0 (0.0%) |
| 18 to 34 Years | 0 (0.0%) | 0 (0.0%) |
| 35 to 64 Years | 132 (7.6%) | 157 (9.7%) |
| 65 to 74 Years | 81 (22.0%) | 344 (46.3%) |
| 75 Years and over | 92 (30.4%) | 50 (13.8%) |
Disability Class: Self-Care Difficulty
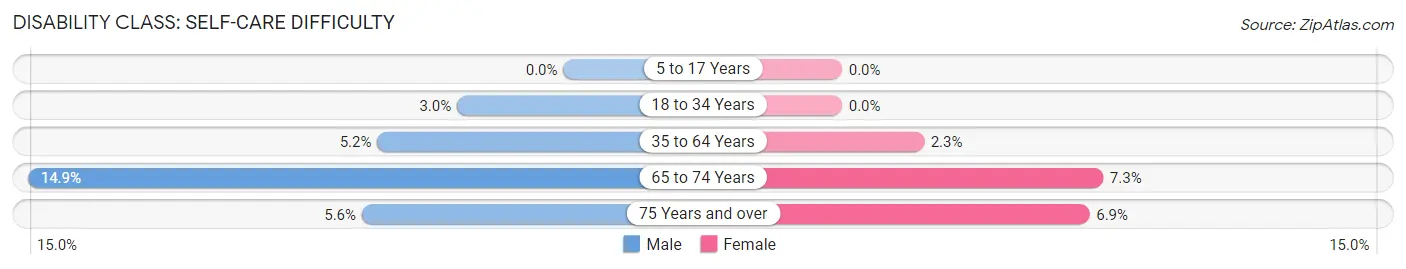
| Age Bracket | Male | Female |
| 5 to 17 Years | 0 (0.0%) | 0 (0.0%) |
| 18 to 34 Years | 21 (3.0%) | 0 (0.0%) |
| 35 to 64 Years | 90 (5.2%) | 37 (2.3%) |
| 65 to 74 Years | 55 (14.9%) | 54 (7.3%) |
| 75 Years and over | 17 (5.6%) | 25 (6.9%) |
Technology Access in Moundsville
Computing Device Access in Moundsville
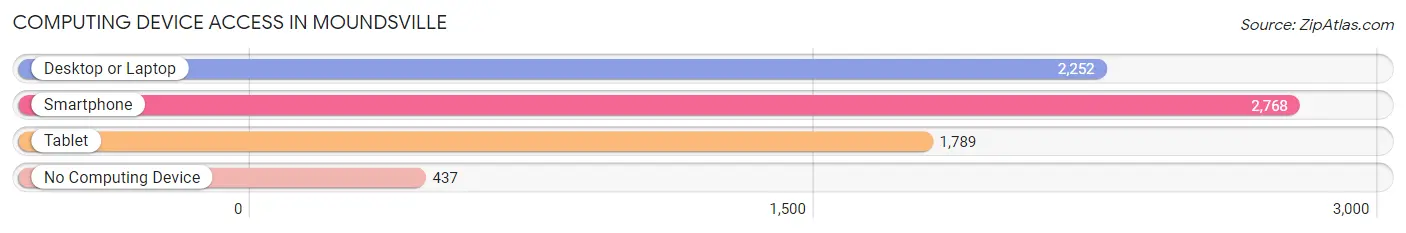
| Device Type | # Households | % Households |
| Desktop or Laptop | 2,252 | 64.2% |
| Smartphone | 2,768 | 78.9% |
| Tablet | 1,789 | 51.0% |
| No Computing Device | 437 | 12.5% |
| Total | 3,507 | 100.0% |
Internet Access in Moundsville
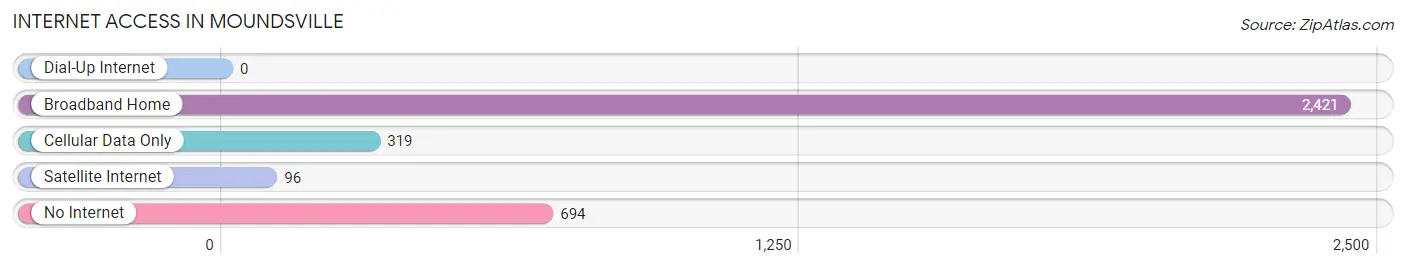
| Internet Type | # Households | % Households |
| Dial-Up Internet | 0 | 0.0% |
| Broadband Home | 2,421 | 69.0% |
| Cellular Data Only | 319 | 9.1% |
| Satellite Internet | 96 | 2.7% |
| No Internet | 694 | 19.8% |
| Total | 3,507 | 100.0% |
Moundsville Summary
Moundsville is a city located in Marshall County, West Virginia, United States. It is the county seat of Marshall County and is located along the Ohio River. The population was 8,329 at the 2010 census.
History
Moundsville was founded in 1771 by John Simpson, a surveyor for the Virginia Colony. The town was named after the nearby Grave Creek Mound, a Native American burial mound built by the Adena culture. The mound is the largest conical burial mound in the United States and is listed on the National Register of Historic Places.
The town was incorporated in 1839 and became the county seat of Marshall County in 1845. During the Civil War, Moundsville was a major supply center for the Confederate Army. After the war, the town experienced a period of growth and prosperity.
Geography
Moundsville is located at 39°51'25" North, 80°45'45" West (39.856944, -80.762500). According to the United States Census Bureau, the city has a total area of 4.2 square miles (10.8 km2), of which 4.1 square miles (10.6 km2) is land and 0.1 square miles (0.2 km2) is water.
Economy
Moundsville is home to several industries, including manufacturing, retail, and healthcare. The city is home to the Moundsville Power Station, a coal-fired power plant owned by American Electric Power. The plant is the largest employer in the city, with over 500 employees.
The city is also home to several retail stores, including Walmart, Kmart, and Lowe's. The city also has several restaurants, including McDonald's, Burger King, and Pizza Hut.
Demographics
As of the census of 2010, there were 8,329 people, 3,541 households, and 2,092 families residing in the city. The population density was 2,037.3 people per square mile (788.3/km2). There were 3,945 housing units at an average density of 962.3 per square mile (371.2/km2). The racial makeup of the city was 97.2% White, 0.7% African American, 0.2% Native American, 0.3% Asian, 0.2% from other races, and 1.4% from two or more races. Hispanic or Latino of any race were 0.7% of the population.
There were 3,541 households, out of which 25.3% had children under the age of 18 living with them, 41.2% were married couples living together, 14.2% had a female householder with no husband present, and 39.7% were non-families. 34.2% of all households were made up of individuals, and 15.2% had someone living alone who was 65 years of age or older. The average household size was 2.26 and the average family size was 2.88.
In the city, the population was spread out, with 22.2% under the age of 18, 8.2% from 18 to 24, 25.7% from 25 to 44, 24.3% from 45 to 64, and 19.6% who were 65 years of age or older. The median age was 40 years. For every 100 females, there were 87.2 males. For every 100 females age 18 and over, there were 82.7 males.
The median income for a household in the city was $27,917, and the median income for a family was $35,938. Males had a median income of $30,917 versus $20,938 for females. The per capita income for the city was $15,938. About 13.2% of families and 16.7% of the population were below the poverty line, including 24.2% of those under age 18 and 11.2% of those age 65 or over.
Common Questions
What is Per Capita Income in Moundsville?
Per Capita income in Moundsville is $33,357.
What is the Median Family Income in Moundsville?
Median Family Income in Moundsville is $68,750.
What is the Median Household income in Moundsville?
Median Household Income in Moundsville is $46,070.
What is Income or Wage Gap in Moundsville?
Income or Wage Gap in Moundsville is 55.4%.
Women in Moundsville earn 44.6 cents for every dollar earned by a man.
What is Inequality or Gini Index in Moundsville?
Inequality or Gini Index in Moundsville is 0.54.
What is the Total Population of Moundsville?
Total Population of Moundsville is 8,056.
What is the Total Male Population of Moundsville?
Total Male Population of Moundsville is 3,757.
What is the Total Female Population of Moundsville?
Total Female Population of Moundsville is 4,299.
What is the Ratio of Males per 100 Females in Moundsville?
There are 87.39 Males per 100 Females in Moundsville.
What is the Ratio of Females per 100 Males in Moundsville?
There are 114.43 Females per 100 Males in Moundsville.
What is the Median Population Age in Moundsville?
Median Population Age in Moundsville is 47.2 Years.
What is the Average Family Size in Moundsville
Average Family Size in Moundsville is 3.0 People.
What is the Average Household Size in Moundsville
Average Household Size in Moundsville is 2.2 People.
How Large is the Labor Force in Moundsville?
There are 3,716 People in the Labor Forcein in Moundsville.
What is the Percentage of People in the Labor Force in Moundsville?
52.3% of People are in the Labor Force in Moundsville.
What is the Unemployment Rate in Moundsville?
Unemployment Rate in Moundsville is 5.5%.