Vienna, WV Map & Demographics
Vienna Map
Vienna Overview
$37,744
PER CAPITA INCOME
$85,721
AVG FAMILY INCOME
$62,979
AVG HOUSEHOLD INCOME
30.1%
WAGE / INCOME GAP [ % ]
69.9¢/ $1
WAGE / INCOME GAP [ $ ]
0.49
INEQUALITY / GINI INDEX
10,642
TOTAL POPULATION
4,705
MALE POPULATION
5,937
FEMALE POPULATION
79.25
MALES / 100 FEMALES
126.18
FEMALES / 100 MALES
42.4
MEDIAN AGE
3.1
AVG FAMILY SIZE
2.4
AVG HOUSEHOLD SIZE
5,152
LABOR FORCE [ PEOPLE ]
60.4%
PERCENT IN LABOR FORCE
5.8%
UNEMPLOYMENT RATE
Vienna Zip Codes
Income in Vienna
Income Overview in Vienna
Per Capita Income in Vienna is $37,744, while median incomes of families and households are $85,721 and $62,979 respectively.
| Characteristic | Number | Measure |
| Per Capita Income | 10,642 | $37,744 |
| Median Family Income | 2,625 | $85,721 |
| Mean Family Income | 2,625 | $115,693 |
| Median Household Income | 4,485 | $62,979 |
| Mean Household Income | 4,485 | $86,584 |
| Income Deficit | 2,625 | $0 |
| Wage / Income Gap (%) | 10,642 | 30.14% |
| Wage / Income Gap ($) | 10,642 | 69.86¢ per $1 |
| Gini / Inequality Index | 10,642 | 0.49 |
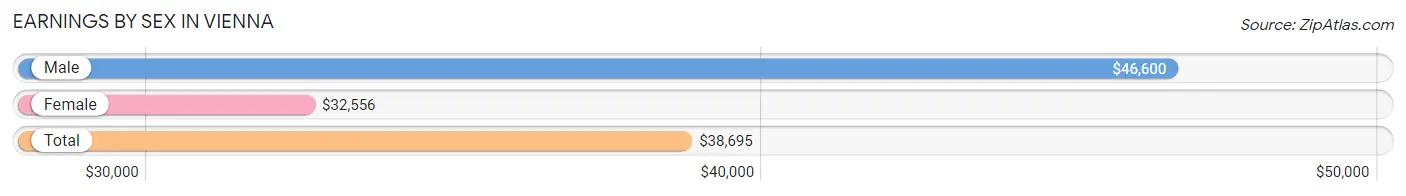
Earnings by Sex in Vienna
Average Earnings in Vienna are $38,695, $46,600 for men and $32,556 for women, a difference of 30.1%.
| Sex | Number | Average Earnings |
| Male | 2,726 (50.9%) | $46,600 |
| Female | 2,625 (49.1%) | $32,556 |
| Total | 5,351 (100.0%) | $38,695 |
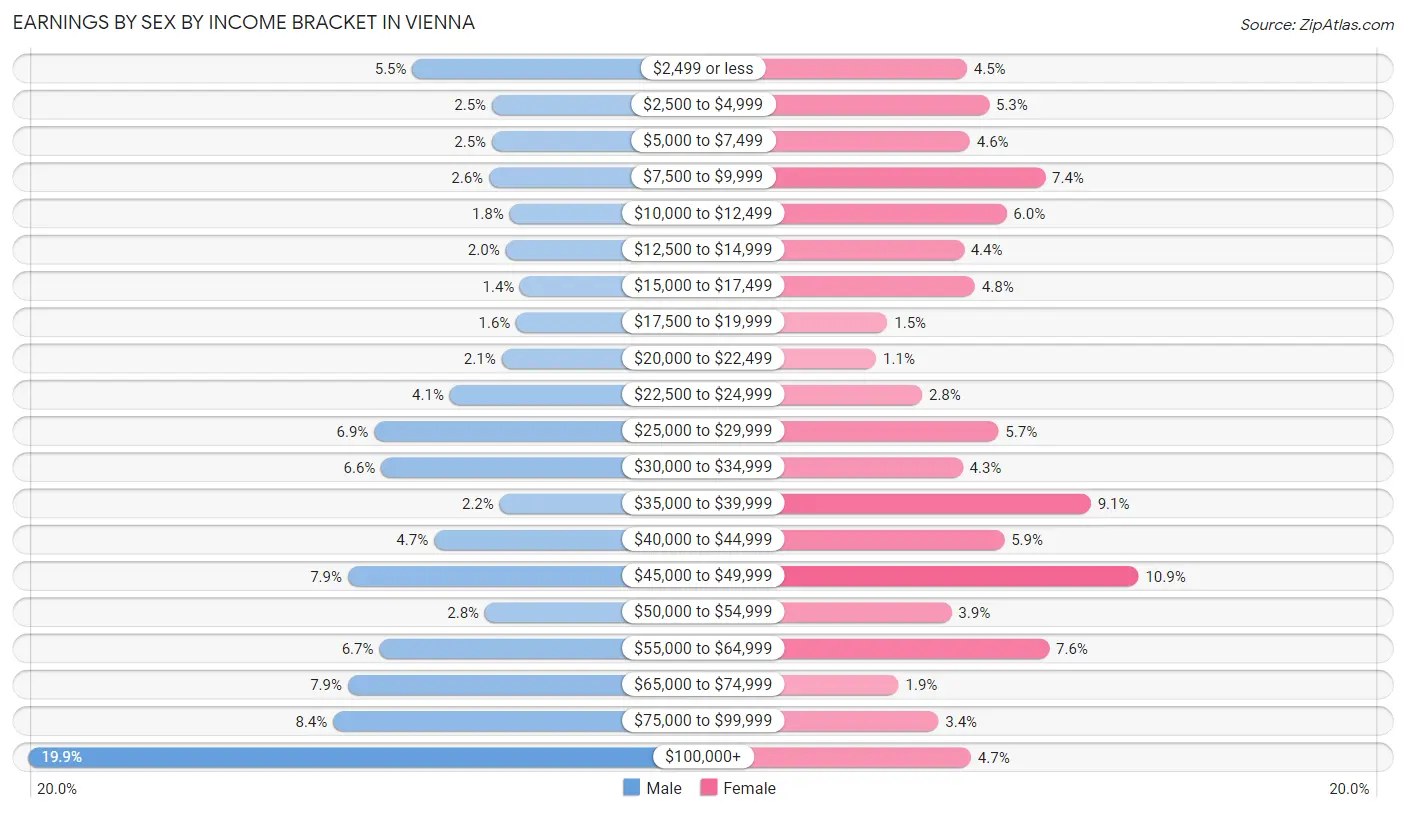
Earnings by Sex by Income Bracket in Vienna
The most common earnings brackets in Vienna are $100,000+ for men (541 | 19.9%) and $45,000 to $49,999 for women (287 | 10.9%).
| Income | Male | Female |
| $2,499 or less | 149 (5.5%) | 118 (4.5%) |
| $2,500 to $4,999 | 68 (2.5%) | 140 (5.3%) |
| $5,000 to $7,499 | 68 (2.5%) | 121 (4.6%) |
| $7,500 to $9,999 | 71 (2.6%) | 195 (7.4%) |
| $10,000 to $12,499 | 50 (1.8%) | 157 (6.0%) |
| $12,500 to $14,999 | 54 (2.0%) | 115 (4.4%) |
| $15,000 to $17,499 | 39 (1.4%) | 126 (4.8%) |
| $17,500 to $19,999 | 43 (1.6%) | 40 (1.5%) |
| $20,000 to $22,499 | 58 (2.1%) | 29 (1.1%) |
| $22,500 to $24,999 | 111 (4.1%) | 74 (2.8%) |
| $25,000 to $29,999 | 188 (6.9%) | 149 (5.7%) |
| $30,000 to $34,999 | 181 (6.6%) | 114 (4.3%) |
| $35,000 to $39,999 | 60 (2.2%) | 240 (9.1%) |
| $40,000 to $44,999 | 127 (4.7%) | 155 (5.9%) |
| $45,000 to $49,999 | 215 (7.9%) | 287 (10.9%) |
| $50,000 to $54,999 | 75 (2.8%) | 103 (3.9%) |
| $55,000 to $64,999 | 183 (6.7%) | 199 (7.6%) |
| $65,000 to $74,999 | 215 (7.9%) | 51 (1.9%) |
| $75,000 to $99,999 | 230 (8.4%) | 90 (3.4%) |
| $100,000+ | 541 (19.9%) | 122 (4.6%) |
| Total | 2,726 (100.0%) | 2,625 (100.0%) |
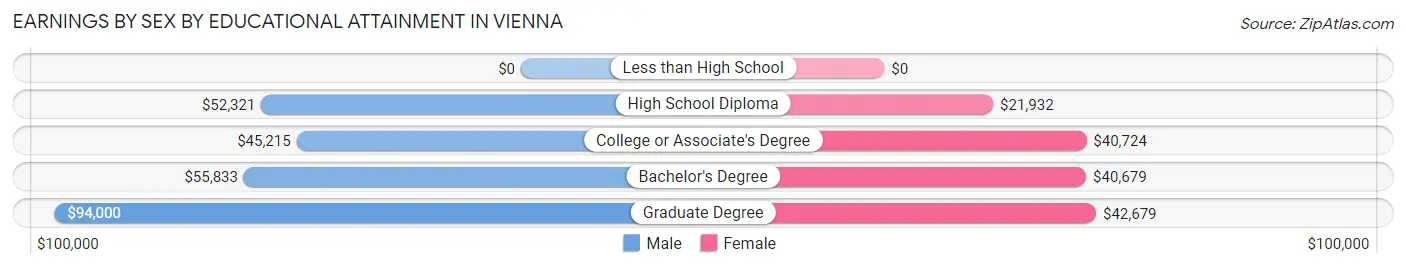
Earnings by Sex by Educational Attainment in Vienna
Average earnings in Vienna are $52,955 for men and $38,500 for women, a difference of 27.3%. Men with an educational attainment of graduate degree enjoy the highest average annual earnings of $94,000, while those with college or associate's degree education earn the least with $45,215. Women with an educational attainment of graduate degree earn the most with the average annual earnings of $42,679, while those with high school diploma education have the smallest earnings of $21,932.
| Educational Attainment | Male Income | Female Income |
| Less than High School | - | - |
| High School Diploma | $52,321 | $21,932 |
| College or Associate's Degree | $45,215 | $40,724 |
| Bachelor's Degree | $55,833 | $40,679 |
| Graduate Degree | $94,000 | $42,679 |
| Total | $52,955 | $38,500 |
Family Income in Vienna
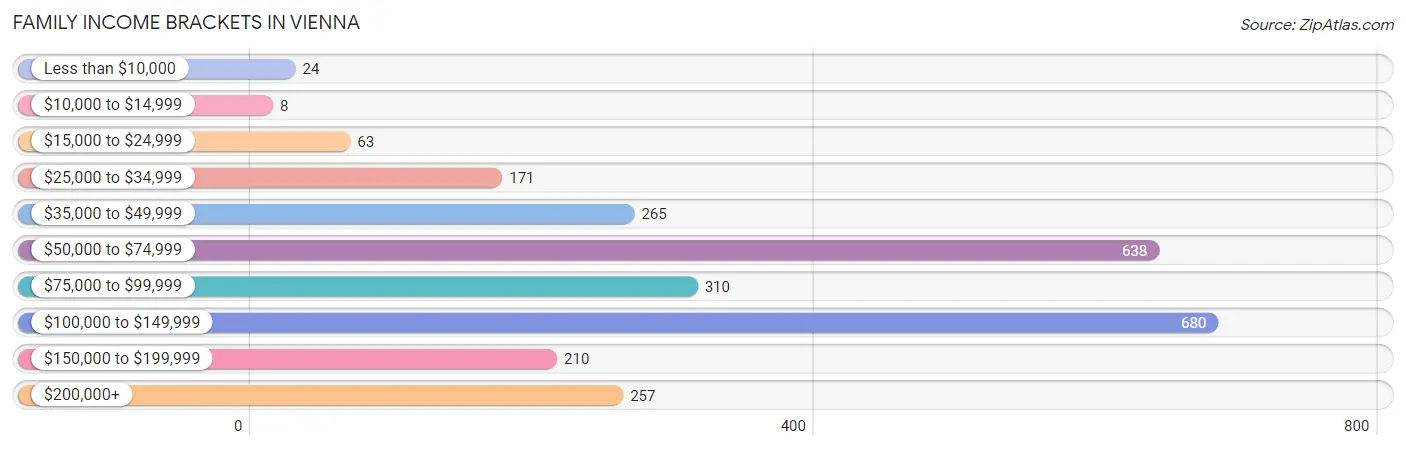
Family Income Brackets in Vienna
According to the Vienna family income data, there are 680 families falling into the $100,000 to $149,999 income range, which is the most common income bracket and makes up 25.9% of all families. Conversely, the $10,000 to $14,999 income bracket is the least frequent group with only 8 families (0.3%) belonging to this category.
| Income Bracket | # Families | % Families |
| Less than $10,000 | 24 | 0.9% |
| $10,000 to $14,999 | 8 | 0.3% |
| $15,000 to $24,999 | 63 | 2.4% |
| $25,000 to $34,999 | 171 | 6.5% |
| $35,000 to $49,999 | 265 | 10.1% |
| $50,000 to $74,999 | 638 | 24.3% |
| $75,000 to $99,999 | 310 | 11.8% |
| $100,000 to $149,999 | 680 | 25.9% |
| $150,000 to $199,999 | 210 | 8.0% |
| $200,000+ | 257 | 9.8% |
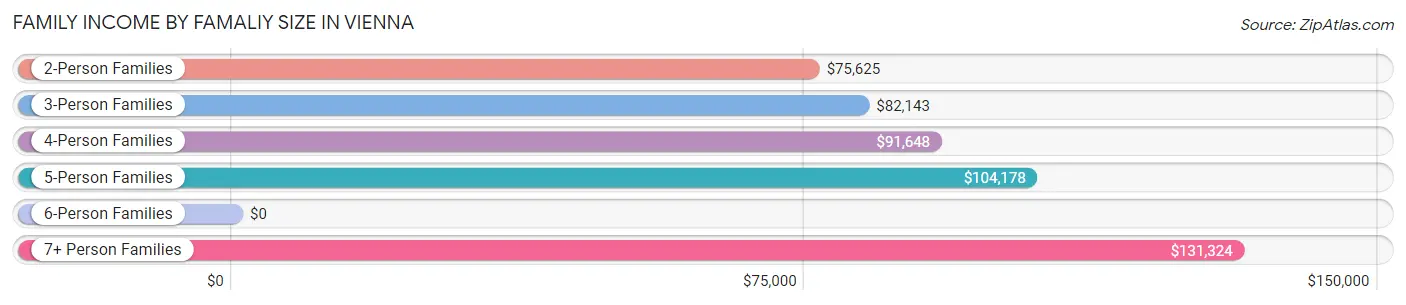
Family Income by Famaliy Size in Vienna
7+ person families (32 | 1.2%) account for the highest median family income in Vienna with $131,324 per family, while 2-person families (1,469 | 56.0%) have the highest median income of $37,812 per family member.
| Income Bracket | # Families | Median Income |
| 2-Person Families | 1,469 (56.0%) | $75,625 |
| 3-Person Families | 542 (20.6%) | $82,143 |
| 4-Person Families | 317 (12.1%) | $91,648 |
| 5-Person Families | 172 (6.6%) | $104,178 |
| 6-Person Families | 93 (3.5%) | $0 |
| 7+ Person Families | 32 (1.2%) | $131,324 |
| Total | 2,625 (100.0%) | $85,721 |
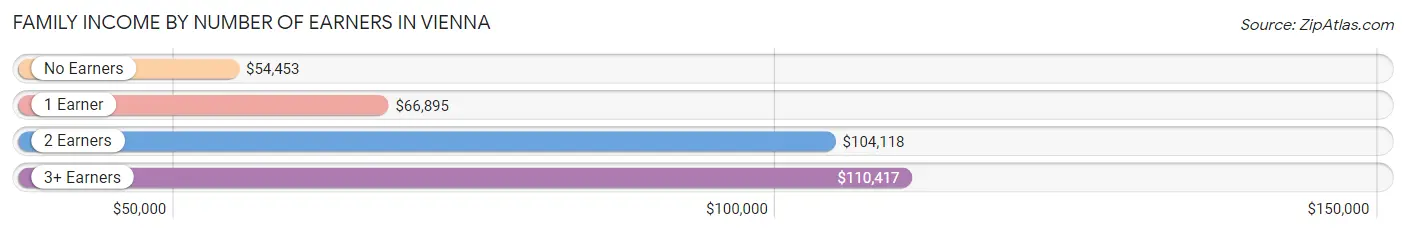
Family Income by Number of Earners in Vienna
The median family income in Vienna is $85,721, with families comprising 3+ earners (174) having the highest median family income of $110,417, while families with no earners (432) have the lowest median family income of $54,453, accounting for 6.6% and 16.5% of families, respectively.
| Number of Earners | # Families | Median Income |
| No Earners | 432 (16.5%) | $54,453 |
| 1 Earner | 651 (24.8%) | $66,895 |
| 2 Earners | 1,368 (52.1%) | $104,118 |
| 3+ Earners | 174 (6.6%) | $110,417 |
| Total | 2,625 (100.0%) | $85,721 |
Household Income in Vienna
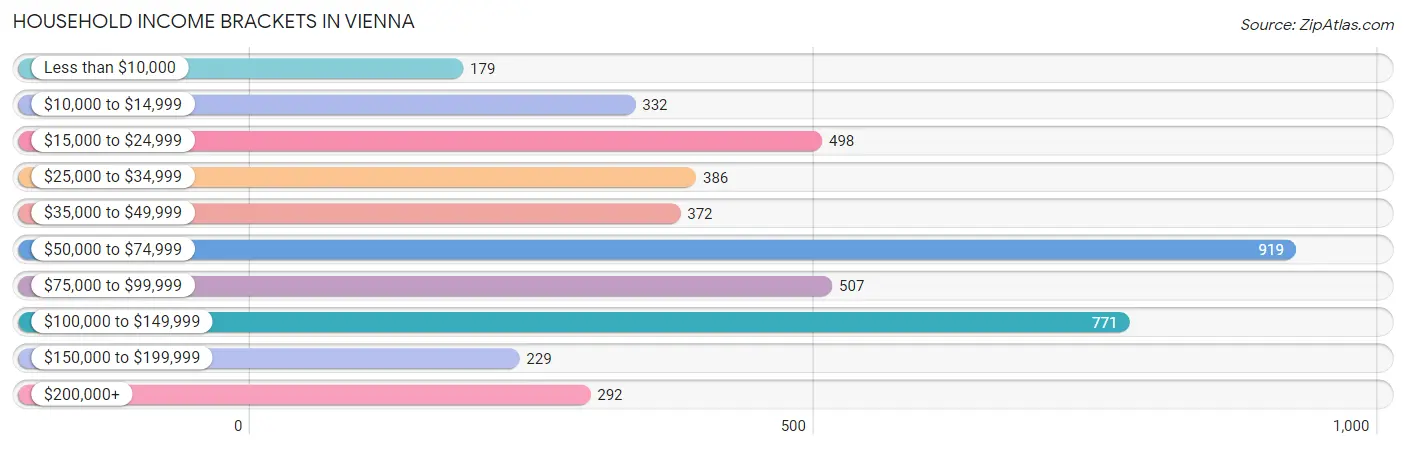
Household Income Brackets in Vienna
With 919 households falling in the category, the $50,000 to $74,999 income range is the most frequent in Vienna, accounting for 20.5% of all households. In contrast, only 179 households (4.0%) fall into the less than $10,000 income bracket, making it the least populous group.
| Income Bracket | # Households | % Households |
| Less than $10,000 | 179 | 4.0% |
| $10,000 to $14,999 | 332 | 7.4% |
| $15,000 to $24,999 | 498 | 11.1% |
| $25,000 to $34,999 | 386 | 8.6% |
| $35,000 to $49,999 | 372 | 8.3% |
| $50,000 to $74,999 | 919 | 20.5% |
| $75,000 to $99,999 | 507 | 11.3% |
| $100,000 to $149,999 | 771 | 17.2% |
| $150,000 to $199,999 | 229 | 5.1% |
| $200,000+ | 292 | 6.5% |
Household Income by Householder Age in Vienna
The median household income in Vienna is $62,979, with the highest median household income of $87,083 found in the 15 to 24 years age bracket for the primary householder. A total of 148 households (3.3%) fall into this category. Meanwhile, the 65+ years age bracket for the primary householder has the lowest median household income of $44,279, with 1,647 households (36.7%) in this group.
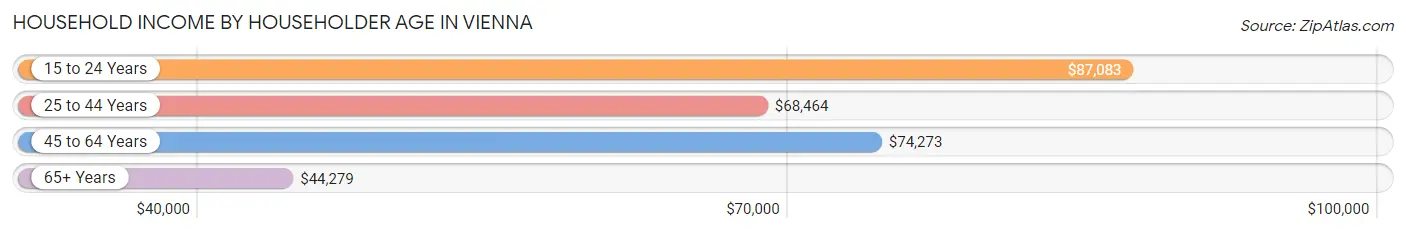
| Income Bracket | # Households | Median Income |
| 15 to 24 Years | 148 (3.3%) | $87,083 |
| 25 to 44 Years | 1,080 (24.1%) | $68,464 |
| 45 to 64 Years | 1,610 (35.9%) | $74,273 |
| 65+ Years | 1,647 (36.7%) | $44,279 |
| Total | 4,485 (100.0%) | $62,979 |
Poverty in Vienna
Income Below Poverty by Sex and Age in Vienna
With 7.7% poverty level for males and 9.9% for females among the residents of Vienna, 25 to 34 year old males and 25 to 34 year old females are the most vulnerable to poverty, with 125 males (19.5%) and 140 females (29.7%) in their respective age groups living below the poverty level.
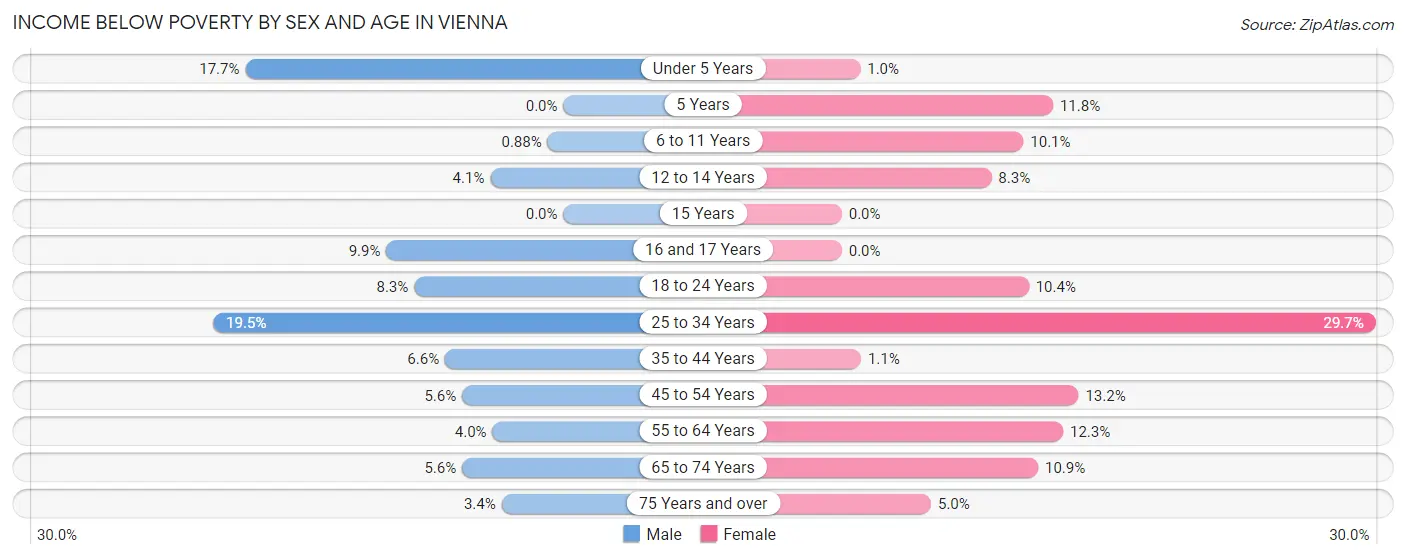
| Age Bracket | Male | Female |
| Under 5 Years | 31 (17.7%) | 5 (1.0%) |
| 5 Years | 0 (0.0%) | 10 (11.8%) |
| 6 to 11 Years | 2 (0.9%) | 45 (10.1%) |
| 12 to 14 Years | 9 (4.1%) | 20 (8.3%) |
| 15 Years | 0 (0.0%) | 0 (0.0%) |
| 16 and 17 Years | 14 (9.9%) | 0 (0.0%) |
| 18 to 24 Years | 33 (8.3%) | 51 (10.4%) |
| 25 to 34 Years | 125 (19.5%) | 140 (29.7%) |
| 35 to 44 Years | 39 (6.6%) | 6 (1.1%) |
| 45 to 54 Years | 36 (5.6%) | 95 (13.2%) |
| 55 to 64 Years | 22 (4.0%) | 88 (12.3%) |
| 65 to 74 Years | 37 (5.6%) | 85 (10.9%) |
| 75 Years and over | 10 (3.4%) | 32 (5.0%) |
| Total | 358 (7.7%) | 577 (9.9%) |
Income Above Poverty by Sex and Age in Vienna
According to the poverty statistics in Vienna, males aged 5 years and females aged 15 years are the age groups that are most secure financially, with 100.0% of males and 100.0% of females in these age groups living above the poverty line.
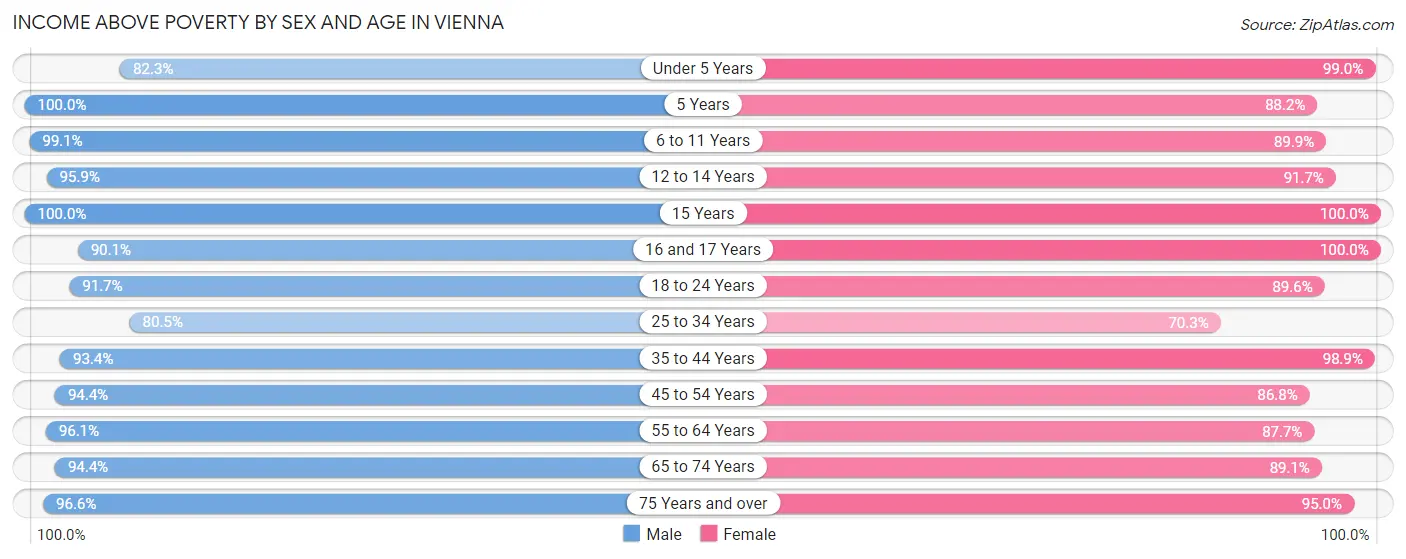
| Age Bracket | Male | Female |
| Under 5 Years | 144 (82.3%) | 481 (99.0%) |
| 5 Years | 47 (100.0%) | 75 (88.2%) |
| 6 to 11 Years | 226 (99.1%) | 400 (89.9%) |
| 12 to 14 Years | 212 (95.9%) | 220 (91.7%) |
| 15 Years | 52 (100.0%) | 68 (100.0%) |
| 16 and 17 Years | 128 (90.1%) | 136 (100.0%) |
| 18 to 24 Years | 364 (91.7%) | 439 (89.6%) |
| 25 to 34 Years | 516 (80.5%) | 331 (70.3%) |
| 35 to 44 Years | 553 (93.4%) | 554 (98.9%) |
| 45 to 54 Years | 602 (94.4%) | 626 (86.8%) |
| 55 to 64 Years | 535 (96.1%) | 626 (87.7%) |
| 65 to 74 Years | 619 (94.4%) | 693 (89.1%) |
| 75 Years and over | 281 (96.6%) | 612 (95.0%) |
| Total | 4,279 (92.3%) | 5,261 (90.1%) |
Income Below Poverty Among Married-Couple Families in Vienna
The poverty statistics for married-couple families in Vienna show that 0.6% or 13 of the total 2,189 families live below the poverty line. Families with 3 or 4 children have the highest poverty rate of 2.9%, comprising of 7 families. On the other hand, families with 1 or 2 children have the lowest poverty rate of 0.0%, which includes 0 families.
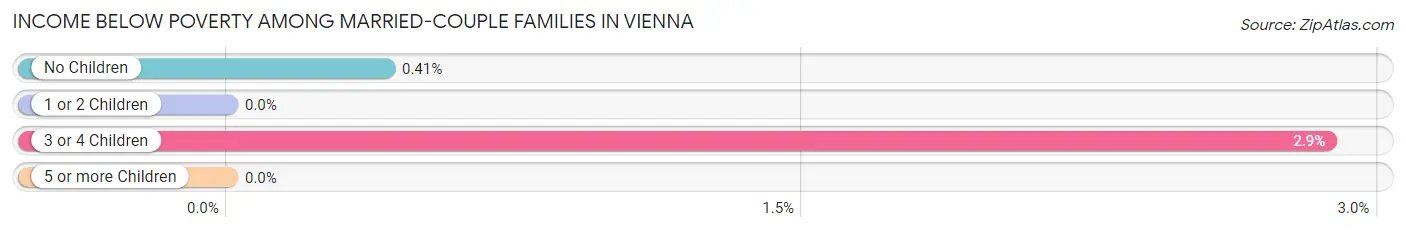
| Children | Above Poverty | Below Poverty |
| No Children | 1,452 (99.6%) | 6 (0.4%) |
| 1 or 2 Children | 487 (100.0%) | 0 (0.0%) |
| 3 or 4 Children | 237 (97.1%) | 7 (2.9%) |
| 5 or more Children | 0 (0.0%) | 0 (0.0%) |
| Total | 2,176 (99.4%) | 13 (0.6%) |
Income Below Poverty Among Single-Parent Households in Vienna
According to the poverty data in Vienna, 4.6% or 6 single-father households and 14.7% or 45 single-mother households are living below the poverty line. Among single-father households, those with 1 or 2 children have the highest poverty rate, with 6 households (19.4%) experiencing poverty. Likewise, among single-mother households, those with 1 or 2 children have the highest poverty rate, with 43 households (24.6%) falling below the poverty line.
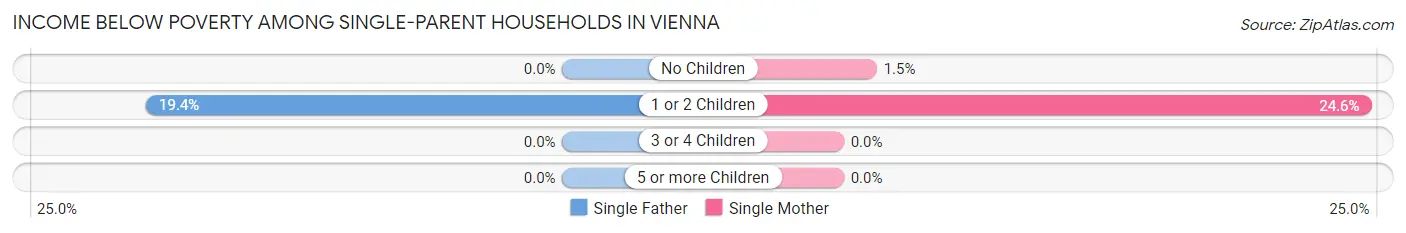
| Children | Single Father | Single Mother |
| No Children | 0 (0.0%) | 2 (1.5%) |
| 1 or 2 Children | 6 (19.4%) | 43 (24.6%) |
| 3 or 4 Children | 0 (0.0%) | 0 (0.0%) |
| 5 or more Children | 0 (0.0%) | 0 (0.0%) |
| Total | 6 (4.6%) | 45 (14.7%) |
Income Below Poverty Among Married-Couple vs Single-Parent Households in Vienna
The poverty data for Vienna shows that 13 of the married-couple family households (0.6%) and 51 of the single-parent households (11.7%) are living below the poverty level. Within the married-couple family households, those with 3 or 4 children have the highest poverty rate, with 7 households (2.9%) falling below the poverty line. Among the single-parent households, those with 1 or 2 children have the highest poverty rate, with 49 household (23.8%) living below poverty.
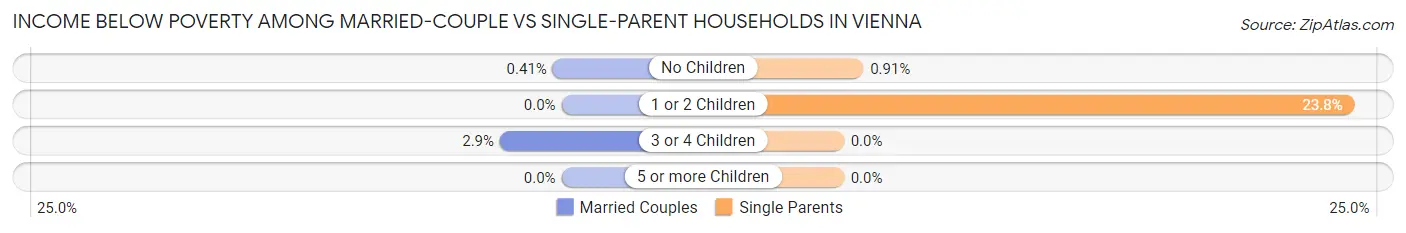
| Children | Married-Couple Families | Single-Parent Households |
| No Children | 6 (0.4%) | 2 (0.9%) |
| 1 or 2 Children | 0 (0.0%) | 49 (23.8%) |
| 3 or 4 Children | 7 (2.9%) | 0 (0.0%) |
| 5 or more Children | 0 (0.0%) | 0 (0.0%) |
| Total | 13 (0.6%) | 51 (11.7%) |
Race in Vienna
The most populous races in Vienna are White / Caucasian (9,764 | 91.7%), Two or more Races (477 | 4.5%), and Asian (190 | 1.8%).
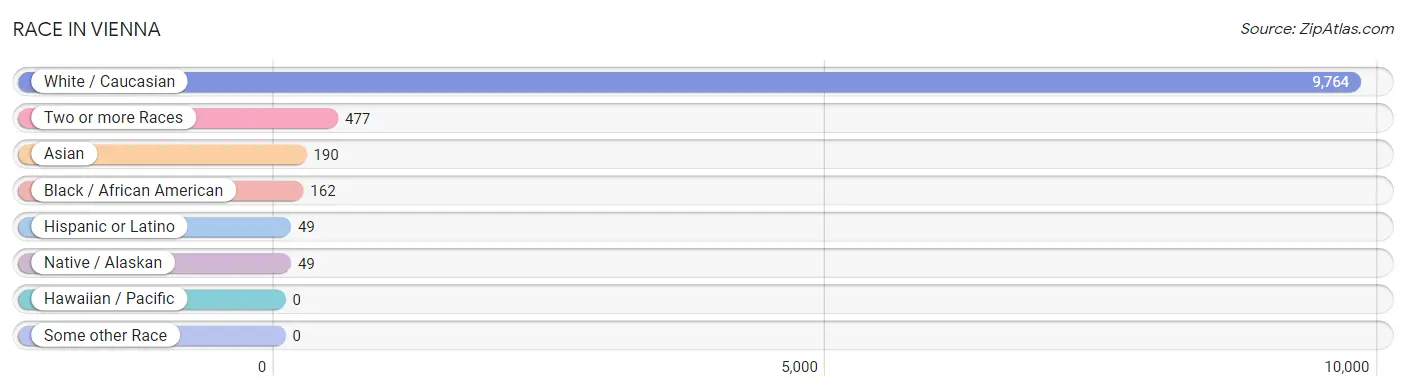
| Race | # Population | % Population |
| Asian | 190 | 1.8% |
| Black / African American | 162 | 1.5% |
| Hawaiian / Pacific | 0 | 0.0% |
| Hispanic or Latino | 49 | 0.5% |
| Native / Alaskan | 49 | 0.5% |
| White / Caucasian | 9,764 | 91.7% |
| Two or more Races | 477 | 4.5% |
| Some other Race | 0 | 0.0% |
| Total | 10,642 | 100.0% |
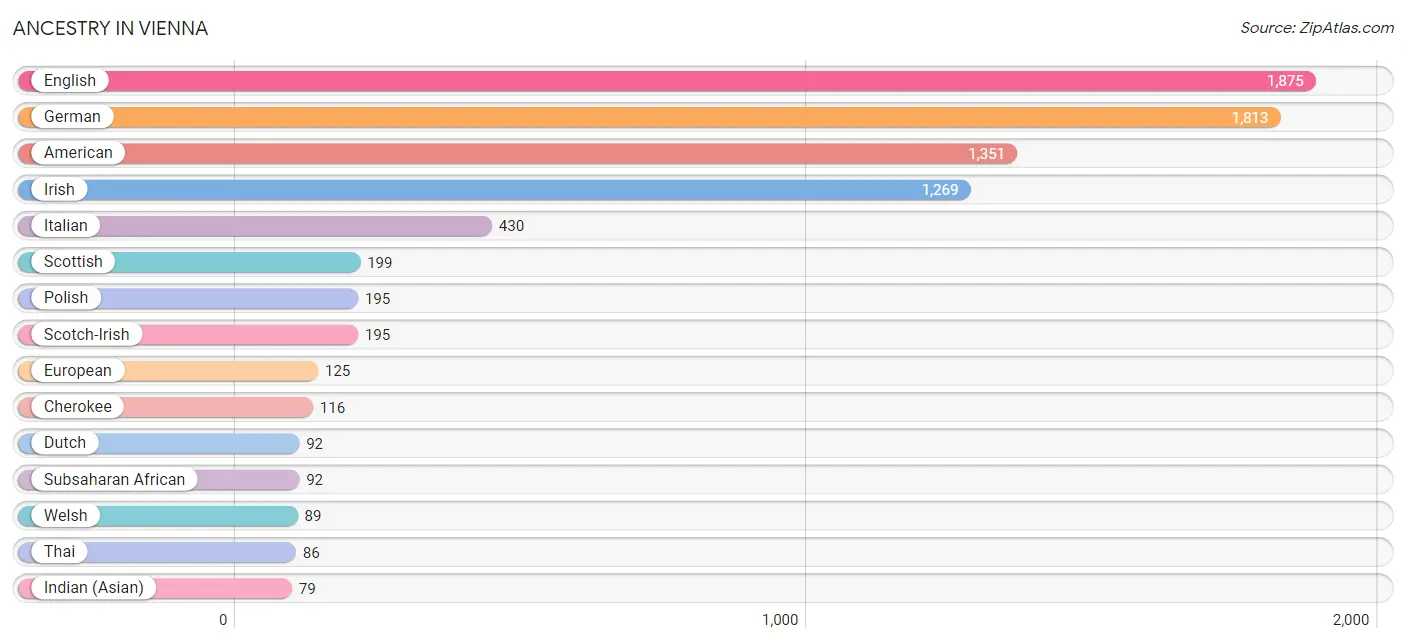
Ancestry in Vienna
The most populous ancestries reported in Vienna are English (1,875 | 17.6%), German (1,813 | 17.0%), American (1,351 | 12.7%), Irish (1,269 | 11.9%), and Italian (430 | 4.0%), together accounting for 63.3% of all Vienna residents.
| Ancestry | # Population | % Population |
| African | 20 | 0.2% |
| American | 1,351 | 12.7% |
| Arab | 41 | 0.4% |
| Belgian | 9 | 0.1% |
| British | 20 | 0.2% |
| Burmese | 23 | 0.2% |
| Canadian | 6 | 0.1% |
| Cherokee | 116 | 1.1% |
| Colombian | 12 | 0.1% |
| Croatian | 13 | 0.1% |
| Danish | 6 | 0.1% |
| Dutch | 92 | 0.9% |
| Eastern European | 5 | 0.1% |
| English | 1,875 | 17.6% |
| European | 125 | 1.2% |
| French | 71 | 0.7% |
| German | 1,813 | 17.0% |
| Greek | 35 | 0.3% |
| Hungarian | 45 | 0.4% |
| Indian (Asian) | 79 | 0.7% |
| Irish | 1,269 | 11.9% |
| Italian | 430 | 4.0% |
| Korean | 77 | 0.7% |
| Mexican | 6 | 0.1% |
| Moroccan | 20 | 0.2% |
| Nigerian | 68 | 0.6% |
| Northern European | 24 | 0.2% |
| Norwegian | 33 | 0.3% |
| Polish | 195 | 1.8% |
| Puerto Rican | 11 | 0.1% |
| Romanian | 8 | 0.1% |
| Scandinavian | 8 | 0.1% |
| Scotch-Irish | 195 | 1.8% |
| Scottish | 199 | 1.9% |
| Serbian | 23 | 0.2% |
| Slavic | 37 | 0.4% |
| Slovene | 6 | 0.1% |
| South American | 12 | 0.1% |
| Sri Lankan | 42 | 0.4% |
| Subsaharan African | 92 | 0.9% |
| Swedish | 29 | 0.3% |
| Swiss | 19 | 0.2% |
| Syrian | 7 | 0.1% |
| Thai | 86 | 0.8% |
| Ukrainian | 15 | 0.1% |
| Welsh | 89 | 0.8% | View All 46 Rows |
Immigrants in Vienna
The most numerous immigrant groups reported in Vienna came from Asia (201 | 1.9%), South Eastern Asia (82 | 0.8%), India (71 | 0.7%), South Central Asia (71 | 0.7%), and Eastern Asia (48 | 0.4%), together accounting for 4.4% of all Vienna residents.
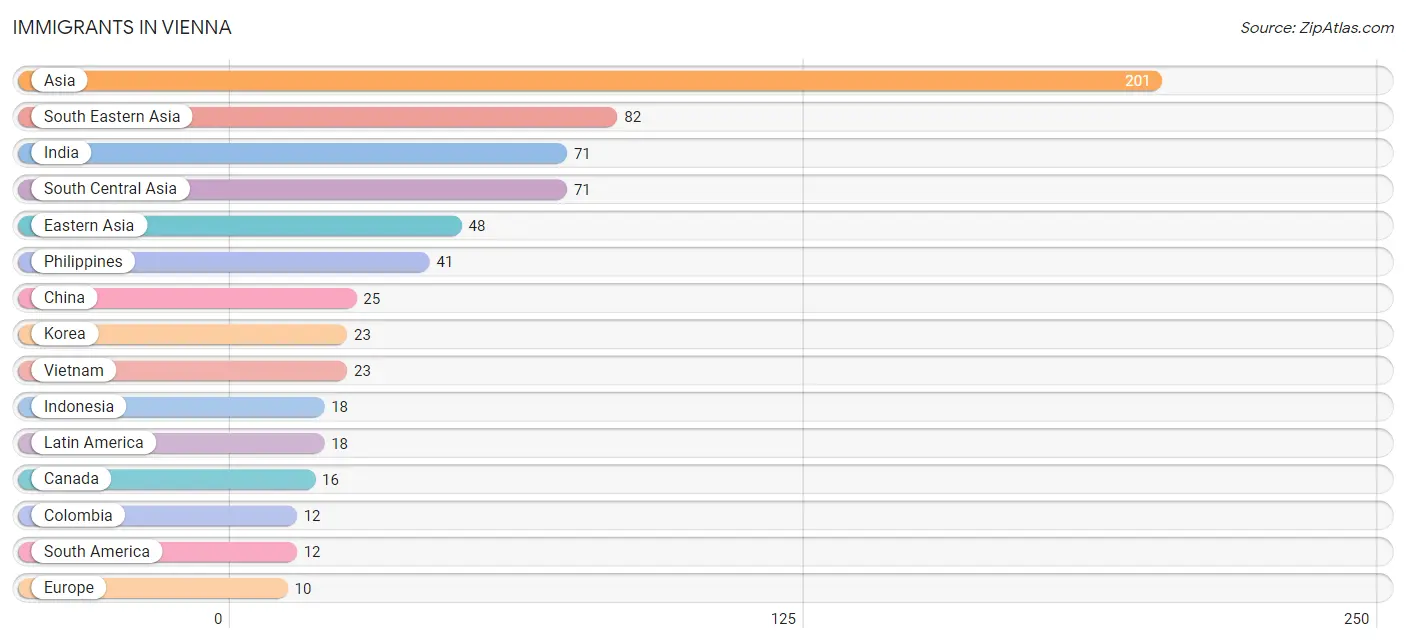
| Immigration Origin | # Population | % Population |
| Africa | 9 | 0.1% |
| Asia | 201 | 1.9% |
| Canada | 16 | 0.2% |
| Central America | 6 | 0.1% |
| China | 25 | 0.2% |
| Colombia | 12 | 0.1% |
| Eastern Asia | 48 | 0.4% |
| Europe | 10 | 0.1% |
| France | 4 | 0.0% |
| Germany | 6 | 0.1% |
| India | 71 | 0.7% |
| Indonesia | 18 | 0.2% |
| Korea | 23 | 0.2% |
| Latin America | 18 | 0.2% |
| Mexico | 6 | 0.1% |
| Morocco | 9 | 0.1% |
| Northern Africa | 9 | 0.1% |
| Philippines | 41 | 0.4% |
| South America | 12 | 0.1% |
| South Central Asia | 71 | 0.7% |
| South Eastern Asia | 82 | 0.8% |
| Vietnam | 23 | 0.2% |
| Western Europe | 10 | 0.1% | View All 23 Rows |
Sex and Age in Vienna
Sex and Age in Vienna
The most populous age groups in Vienna are 65 to 69 Years (387 | 8.2%) for men and 65 to 69 Years (539 | 9.1%) for women.
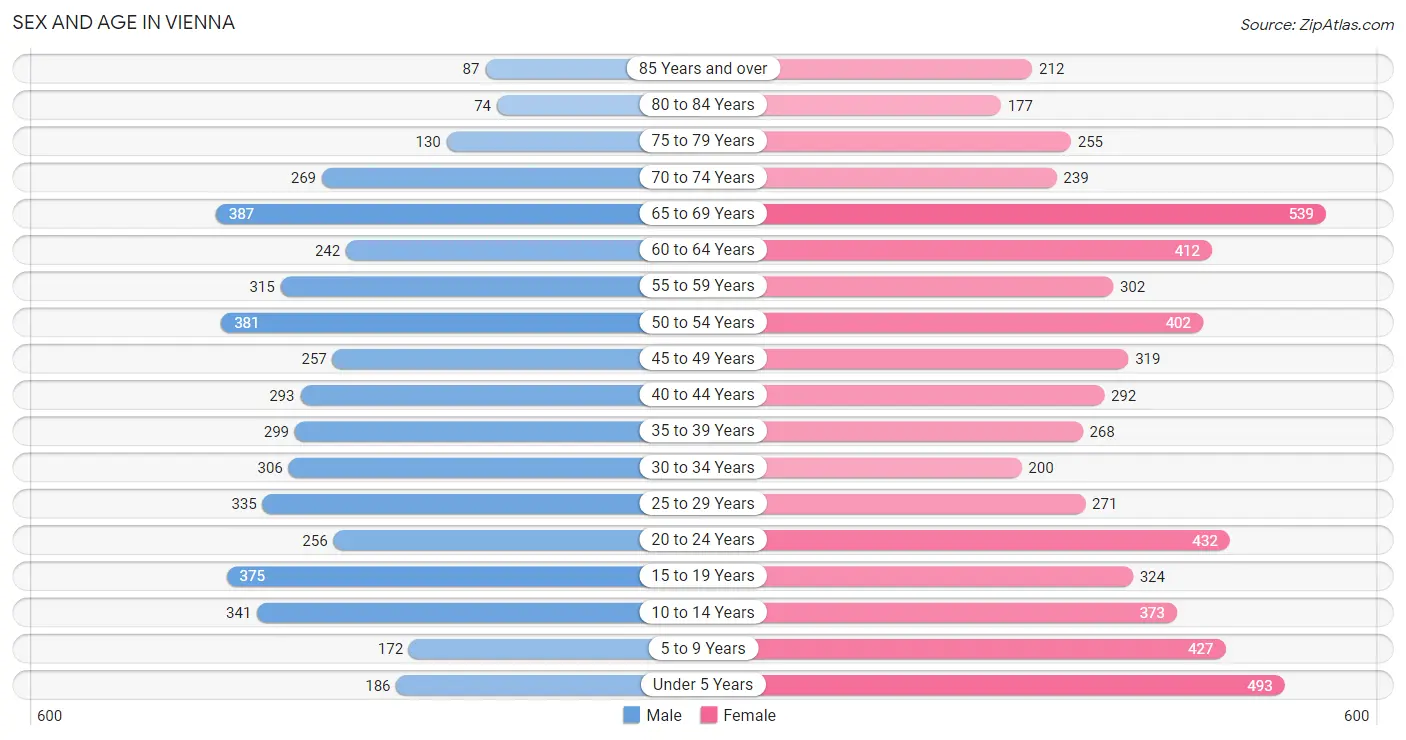
| Age Bracket | Male | Female |
| Under 5 Years | 186 (4.0%) | 493 (8.3%) |
| 5 to 9 Years | 172 (3.7%) | 427 (7.2%) |
| 10 to 14 Years | 341 (7.2%) | 373 (6.3%) |
| 15 to 19 Years | 375 (8.0%) | 324 (5.5%) |
| 20 to 24 Years | 256 (5.4%) | 432 (7.3%) |
| 25 to 29 Years | 335 (7.1%) | 271 (4.6%) |
| 30 to 34 Years | 306 (6.5%) | 200 (3.4%) |
| 35 to 39 Years | 299 (6.4%) | 268 (4.5%) |
| 40 to 44 Years | 293 (6.2%) | 292 (4.9%) |
| 45 to 49 Years | 257 (5.5%) | 319 (5.4%) |
| 50 to 54 Years | 381 (8.1%) | 402 (6.8%) |
| 55 to 59 Years | 315 (6.7%) | 302 (5.1%) |
| 60 to 64 Years | 242 (5.1%) | 412 (6.9%) |
| 65 to 69 Years | 387 (8.2%) | 539 (9.1%) |
| 70 to 74 Years | 269 (5.7%) | 239 (4.0%) |
| 75 to 79 Years | 130 (2.8%) | 255 (4.3%) |
| 80 to 84 Years | 74 (1.6%) | 177 (3.0%) |
| 85 Years and over | 87 (1.8%) | 212 (3.6%) |
| Total | 4,705 (100.0%) | 5,937 (100.0%) |
Families and Households in Vienna
Median Family Size in Vienna
The median family size in Vienna is 3.14 persons per family, with single male/father families (131 | 5.0%) accounting for the largest median family size of 3.17 persons per family. On the other hand, single female/mother families (305 | 11.6%) represent the smallest median family size with 3.10 persons per family.
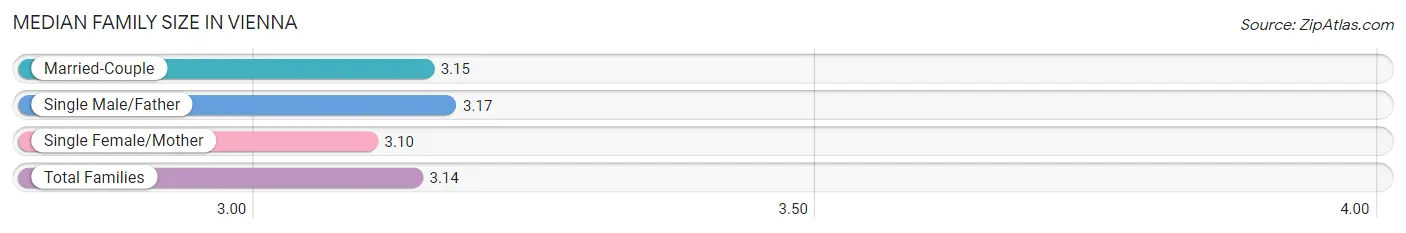
| Family Type | # Families | Family Size |
| Married-Couple | 2,189 (83.4%) | 3.15 |
| Single Male/Father | 131 (5.0%) | 3.17 |
| Single Female/Mother | 305 (11.6%) | 3.10 |
| Total Families | 2,625 (100.0%) | 3.14 |
Median Household Size in Vienna
The median household size in Vienna is 2.35 persons per household, with single male/father households (131 | 2.9%) accounting for the largest median household size of 3.39 persons per household. non-family households (1,860 | 41.5%) represent the smallest median household size with 1.14 persons per household.
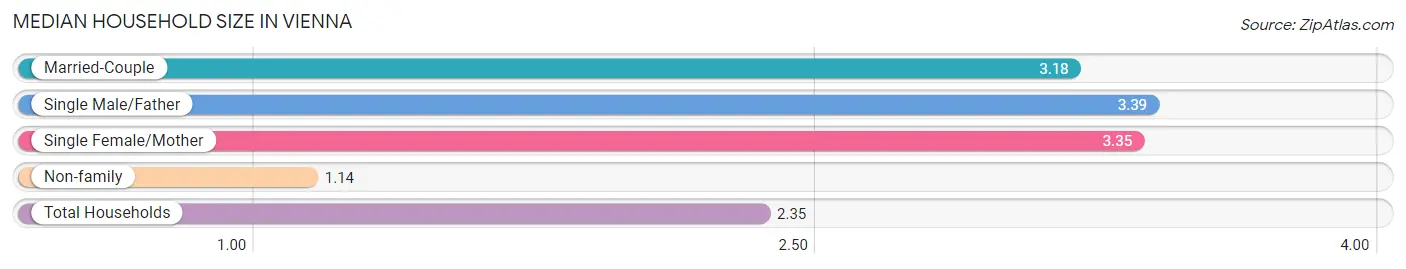
| Household Type | # Households | Household Size |
| Married-Couple | 2,189 (48.8%) | 3.18 |
| Single Male/Father | 131 (2.9%) | 3.39 |
| Single Female/Mother | 305 (6.8%) | 3.35 |
| Non-family | 1,860 (41.5%) | 1.14 |
| Total Households | 4,485 (100.0%) | 2.35 |
Household Size by Marriage Status in Vienna
Out of a total of 4,485 households in Vienna, 2,625 (58.5%) are family households, while 1,860 (41.5%) are nonfamily households. The most numerous type of family households are 2-person households, comprising 1,417, and the most common type of nonfamily households are 1-person households, comprising 1,614.
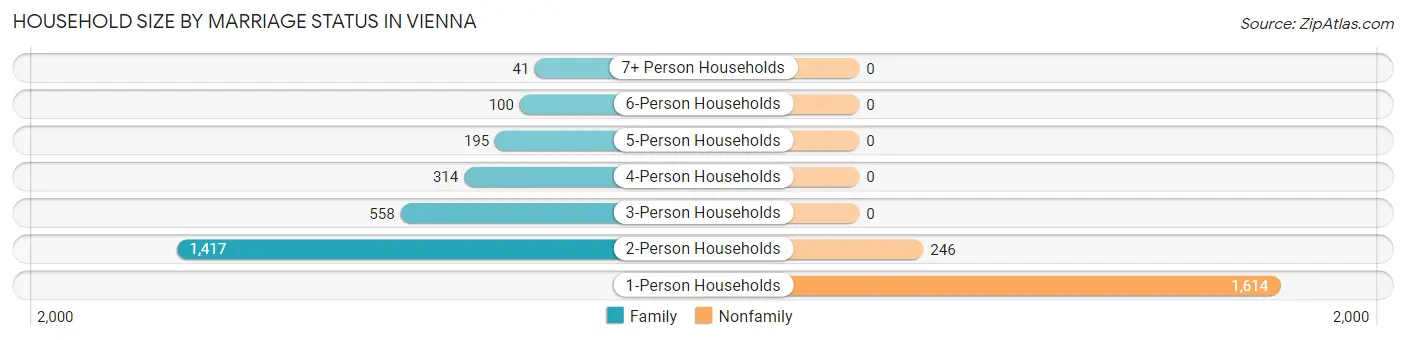
| Household Size | Family Households | Nonfamily Households |
| 1-Person Households | - | 1,614 (36.0%) |
| 2-Person Households | 1,417 (31.6%) | 246 (5.5%) |
| 3-Person Households | 558 (12.4%) | 0 (0.0%) |
| 4-Person Households | 314 (7.0%) | 0 (0.0%) |
| 5-Person Households | 195 (4.3%) | 0 (0.0%) |
| 6-Person Households | 100 (2.2%) | 0 (0.0%) |
| 7+ Person Households | 41 (0.9%) | 0 (0.0%) |
| Total | 2,625 (58.5%) | 1,860 (41.5%) |
Female Fertility in Vienna
Fertility by Age in Vienna
Average fertility rate in Vienna is 107.0 births per 1,000 women. Women in the age bracket of 20 to 34 years have the highest fertility rate with 207.0 births per 1,000 women. Women in the age bracket of 20 to 34 years acount for 80.3% of all women with births.
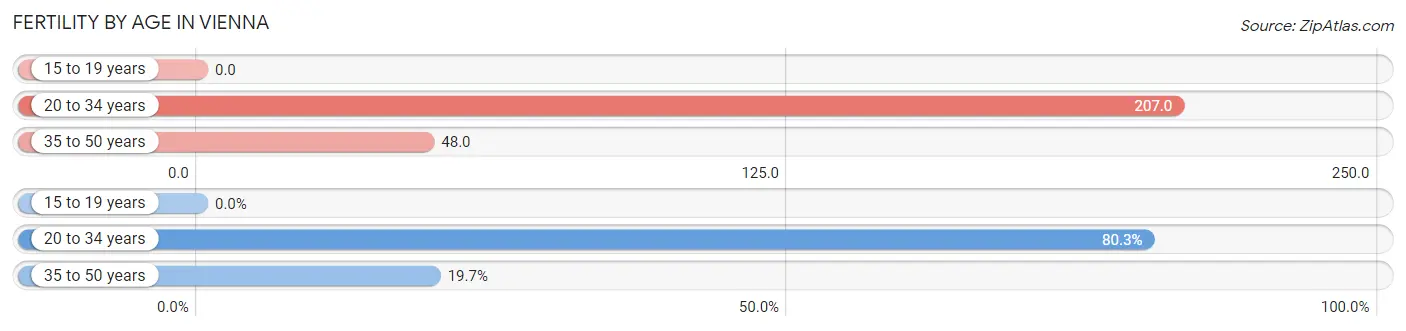
| Age Bracket | Women with Births | Births / 1,000 Women |
| 15 to 19 years | 0 (0.0%) | 0.0 |
| 20 to 34 years | 187 (80.3%) | 207.0 |
| 35 to 50 years | 46 (19.7%) | 48.0 |
| Total | 233 (100.0%) | 107.0 |
Fertility by Age by Marriage Status in Vienna
71.7% of women with births (233) in Vienna are married. The highest percentage of unmarried women with births falls into 20 to 34 years age bracket with 35.3% of them unmarried at the time of birth, while the lowest percentage of unmarried women with births belong to 35 to 50 years age bracket with 0.0% of them unmarried.
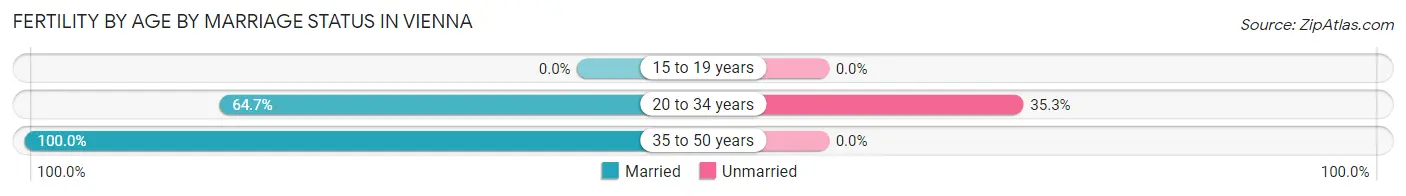
| Age Bracket | Married | Unmarried |
| 15 to 19 years | 0 (0.0%) | 0 (0.0%) |
| 20 to 34 years | 121 (64.7%) | 66 (35.3%) |
| 35 to 50 years | 46 (100.0%) | 0 (0.0%) |
| Total | 167 (71.7%) | 66 (28.3%) |
Fertility by Education in Vienna
Average fertility rate in Vienna is 107.0 births per 1,000 women. Women with the education attainment of college or associate's degree have the highest fertility rate of 179.0 births per 1,000 women, while women with the education attainment of less than high school have the lowest fertility at 30.0 births per 1,000 women. Women with the education attainment of college or associate's degree represent 70.0% of all women with births.
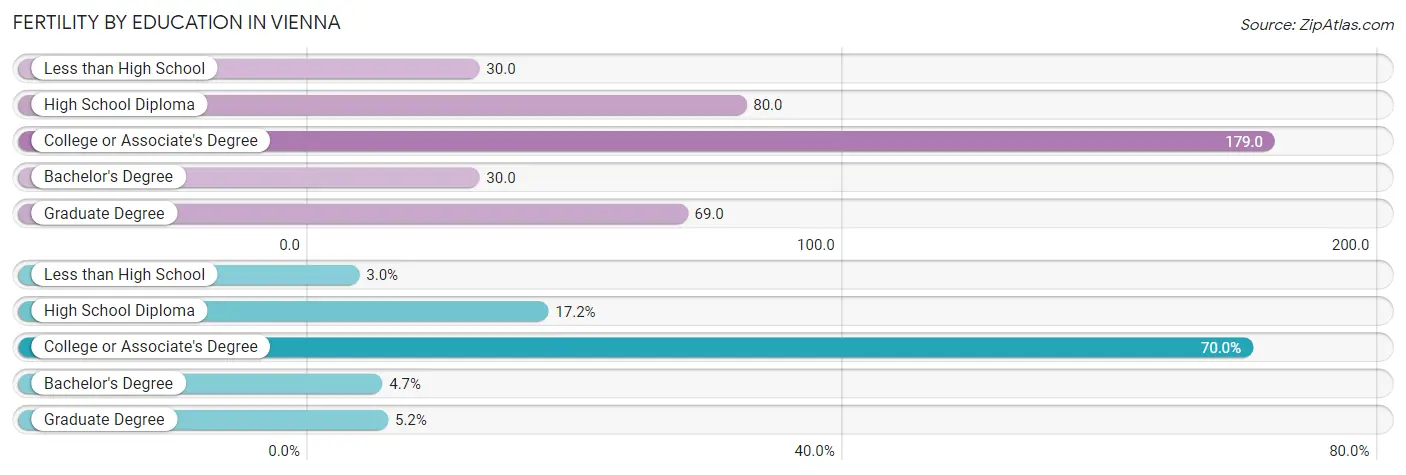
| Educational Attainment | Women with Births | Births / 1,000 Women |
| Less than High School | 7 (3.0%) | 30.0 |
| High School Diploma | 40 (17.2%) | 80.0 |
| College or Associate's Degree | 163 (70.0%) | 179.0 |
| Bachelor's Degree | 11 (4.7%) | 30.0 |
| Graduate Degree | 12 (5.1%) | 69.0 |
| Total | 233 (100.0%) | 107.0 |
Fertility by Education by Marriage Status in Vienna
28.3% of women with births in Vienna are unmarried. Women with the educational attainment of high school diploma are most likely to be married with 100.0% of them married at childbirth, while women with the educational attainment of less than high school are least likely to be married with 100.0% of them unmarried at childbirth.
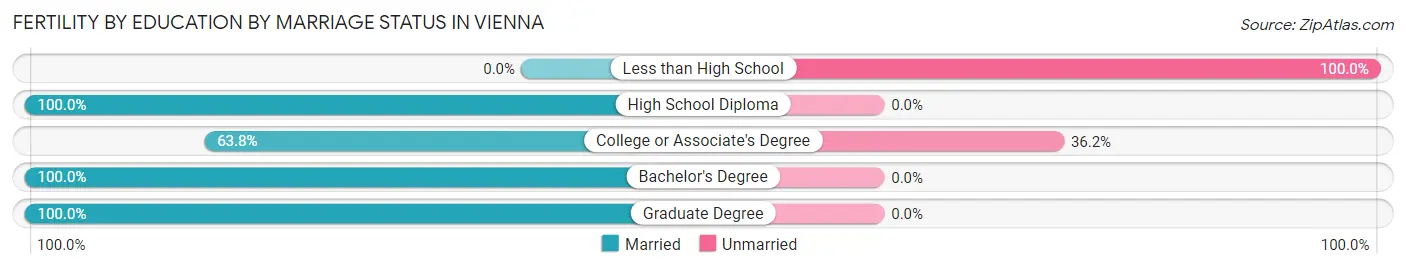
| Educational Attainment | Married | Unmarried |
| Less than High School | 0 (0.0%) | 7 (100.0%) |
| High School Diploma | 40 (100.0%) | 0 (0.0%) |
| College or Associate's Degree | 104 (63.8%) | 59 (36.2%) |
| Bachelor's Degree | 11 (100.0%) | 0 (0.0%) |
| Graduate Degree | 12 (100.0%) | 0 (0.0%) |
| Total | 167 (71.7%) | 66 (28.3%) |
Employment Characteristics in Vienna
Employment by Class of Employer in Vienna
Among the 4,830 employed individuals in Vienna, private company employees (3,184 | 65.9%), not-for-profit organizations (542 | 11.2%), and local government employees (266 | 5.5%) make up the most common classes of employment.
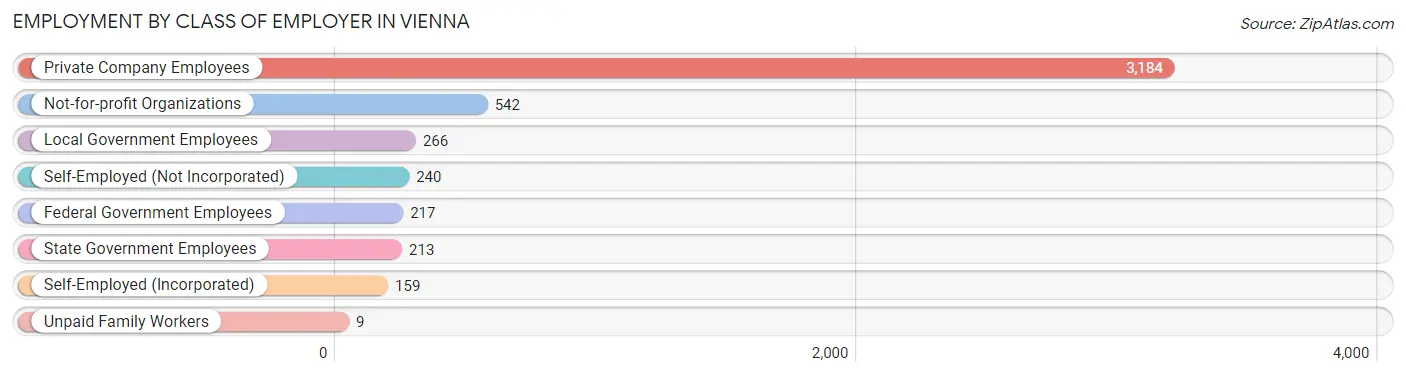
| Employer Class | # Employees | % Employees |
| Private Company Employees | 3,184 | 65.9% |
| Self-Employed (Incorporated) | 159 | 3.3% |
| Self-Employed (Not Incorporated) | 240 | 5.0% |
| Not-for-profit Organizations | 542 | 11.2% |
| Local Government Employees | 266 | 5.5% |
| State Government Employees | 213 | 4.4% |
| Federal Government Employees | 217 | 4.5% |
| Unpaid Family Workers | 9 | 0.2% |
| Total | 4,830 | 100.0% |
Employment Status by Age in Vienna
According to the labor force statistics for Vienna, out of the total population over 16 years of age (8,530), 60.4% or 5,152 individuals are in the labor force, with 5.8% or 299 of them unemployed. The age group with the highest labor force participation rate is 30 to 34 years, with 91.9% or 465 individuals in the labor force. Within the labor force, the 16 to 19 years age range has the highest percentage of unemployed individuals, with 19.1% or 34 of them being unemployed.
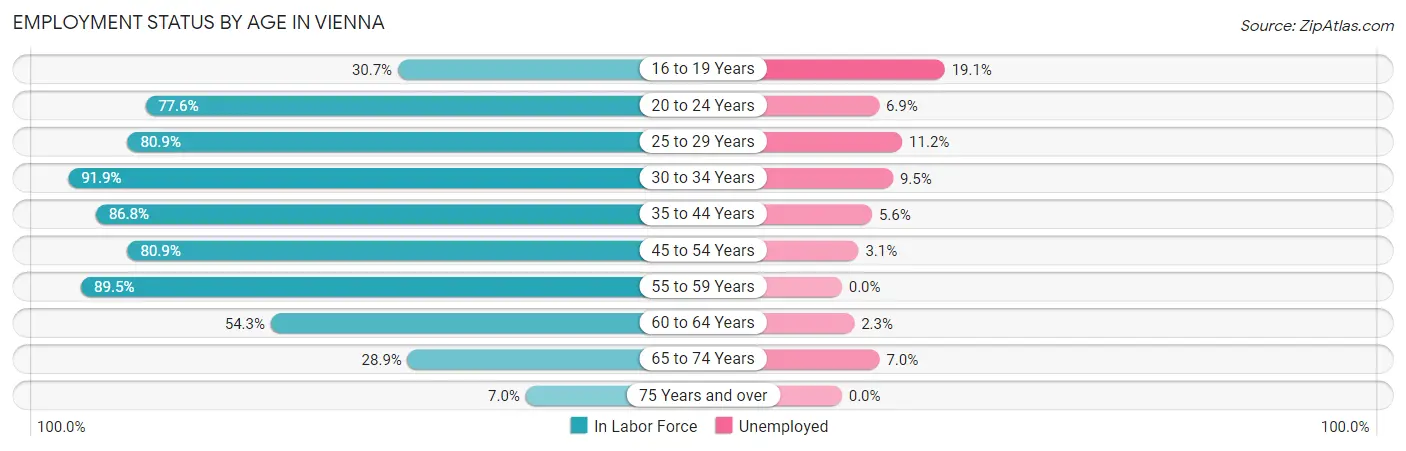
| Age Bracket | In Labor Force | Unemployed |
| 16 to 19 Years | 178 (30.7%) | 34 (19.1%) |
| 20 to 24 Years | 534 (77.6%) | 37 (6.9%) |
| 25 to 29 Years | 490 (80.9%) | 55 (11.2%) |
| 30 to 34 Years | 465 (91.9%) | 44 (9.5%) |
| 35 to 44 Years | 1,000 (86.8%) | 56 (5.6%) |
| 45 to 54 Years | 1,099 (80.9%) | 34 (3.1%) |
| 55 to 59 Years | 552 (89.5%) | 0 (0.0%) |
| 60 to 64 Years | 355 (54.3%) | 8 (2.3%) |
| 65 to 74 Years | 414 (28.9%) | 29 (7.0%) |
| 75 Years and over | 65 (7.0%) | 0 (0.0%) |
| Total | 5,152 (60.4%) | 299 (5.8%) |
Employment Status by Educational Attainment in Vienna
According to labor force statistics for Vienna, 80.9% of individuals (3,959) out of the total population between 25 and 64 years of age (4,894) are in the labor force, with 5.0% or 198 of them being unemployed. The group with the highest labor force participation rate are those with the educational attainment of bachelor's degree or higher, with 87.2% or 1,323 individuals in the labor force. Within the labor force, individuals with high school diploma education have the highest percentage of unemployment, with 11.0% or 107 of them being unemployed.
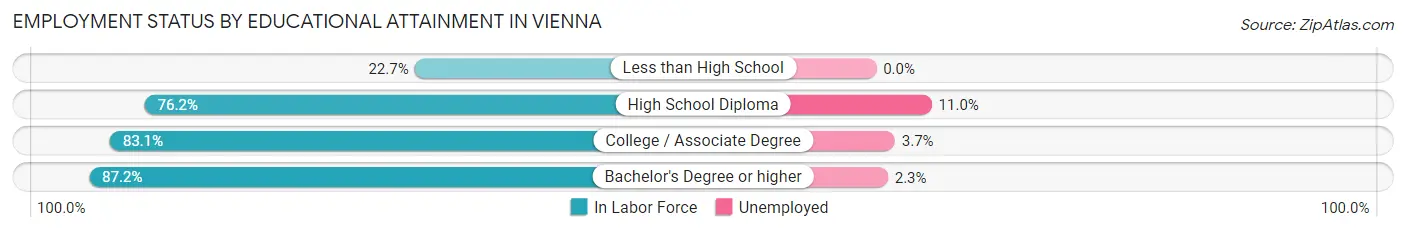
| Educational Attainment | In Labor Force | Unemployed |
| Less than High School | 30 (22.7%) | 0 (0.0%) |
| High School Diploma | 972 (76.2%) | 140 (11.0%) |
| College / Associate Degree | 1,637 (83.1%) | 73 (3.7%) |
| Bachelor's Degree or higher | 1,323 (87.2%) | 35 (2.3%) |
| Total | 3,959 (80.9%) | 245 (5.0%) |
Employment Occupations by Sex in Vienna
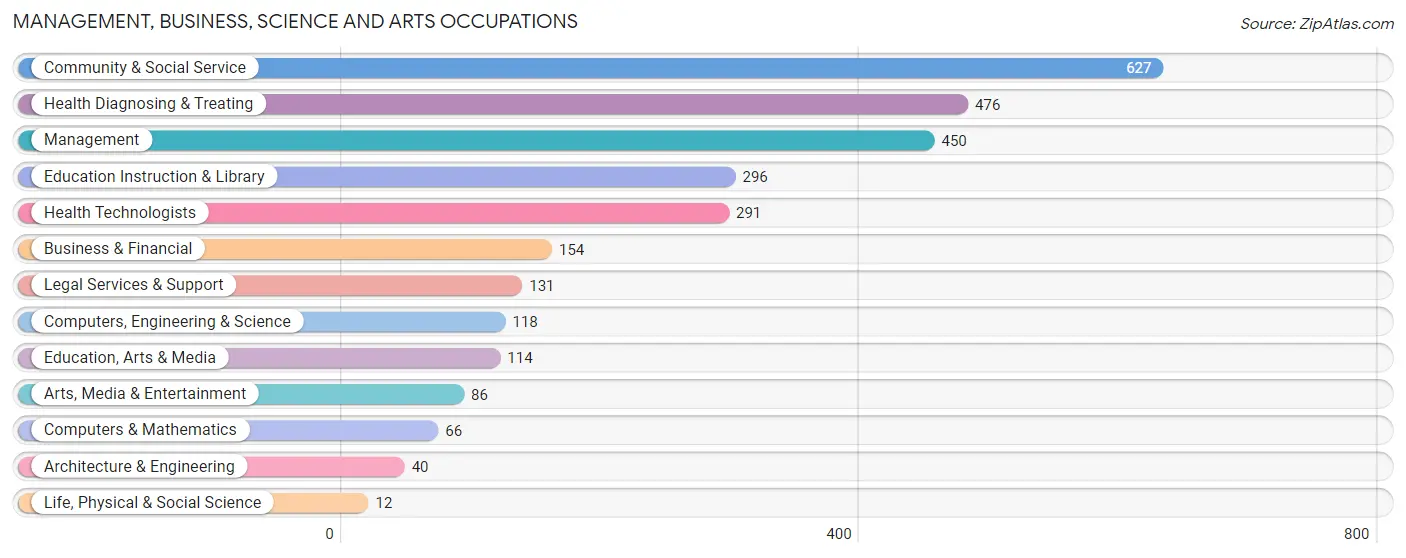
Management, Business, Science and Arts Occupations
The most common Management, Business, Science and Arts occupations in Vienna are Community & Social Service (627 | 12.9%), Health Diagnosing & Treating (476 | 9.8%), Management (450 | 9.3%), Education Instruction & Library (296 | 6.1%), and Health Technologists (291 | 6.0%).
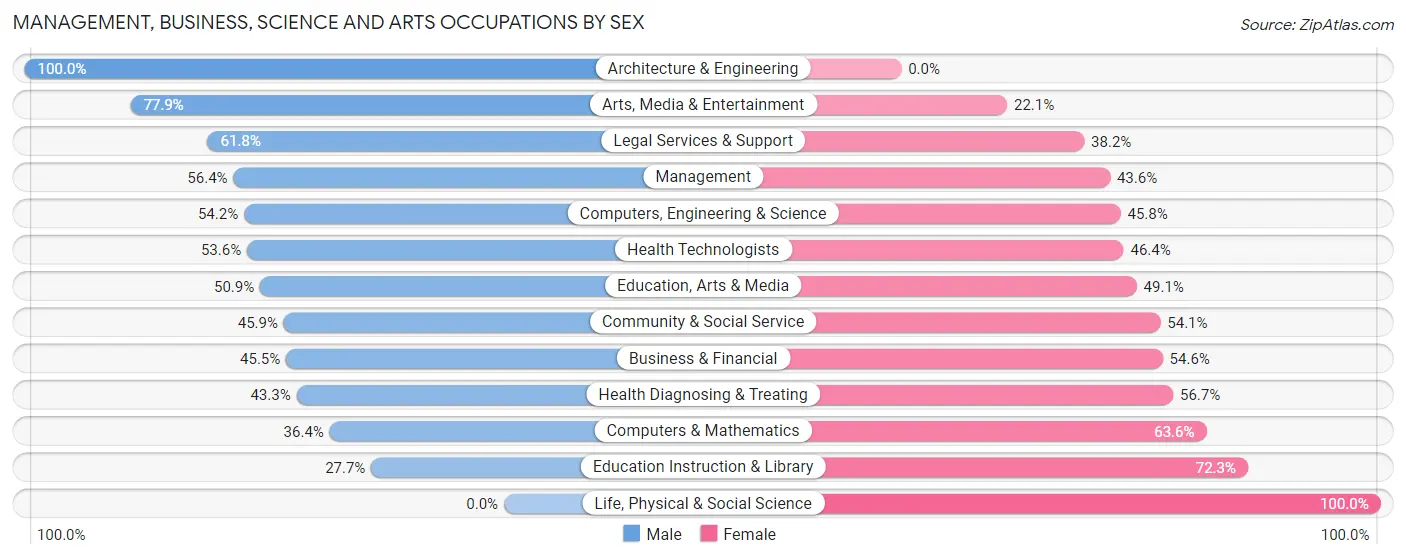
Management, Business, Science and Arts Occupations by Sex
Within the Management, Business, Science and Arts occupations in Vienna, the most male-oriented occupations are Architecture & Engineering (100.0%), Arts, Media & Entertainment (77.9%), and Legal Services & Support (61.8%), while the most female-oriented occupations are Life, Physical & Social Science (100.0%), Education Instruction & Library (72.3%), and Computers & Mathematics (63.6%).
| Occupation | Male | Female |
| Management | 254 (56.4%) | 196 (43.6%) |
| Business & Financial | 70 (45.5%) | 84 (54.5%) |
| Computers, Engineering & Science | 64 (54.2%) | 54 (45.8%) |
| Computers & Mathematics | 24 (36.4%) | 42 (63.6%) |
| Architecture & Engineering | 40 (100.0%) | 0 (0.0%) |
| Life, Physical & Social Science | 0 (0.0%) | 12 (100.0%) |
| Community & Social Service | 288 (45.9%) | 339 (54.1%) |
| Education, Arts & Media | 58 (50.9%) | 56 (49.1%) |
| Legal Services & Support | 81 (61.8%) | 50 (38.2%) |
| Education Instruction & Library | 82 (27.7%) | 214 (72.3%) |
| Arts, Media & Entertainment | 67 (77.9%) | 19 (22.1%) |
| Health Diagnosing & Treating | 206 (43.3%) | 270 (56.7%) |
| Health Technologists | 156 (53.6%) | 135 (46.4%) |
| Total (Category) | 882 (48.3%) | 943 (51.7%) |
| Total (Overall) | 2,440 (50.3%) | 2,415 (49.7%) |
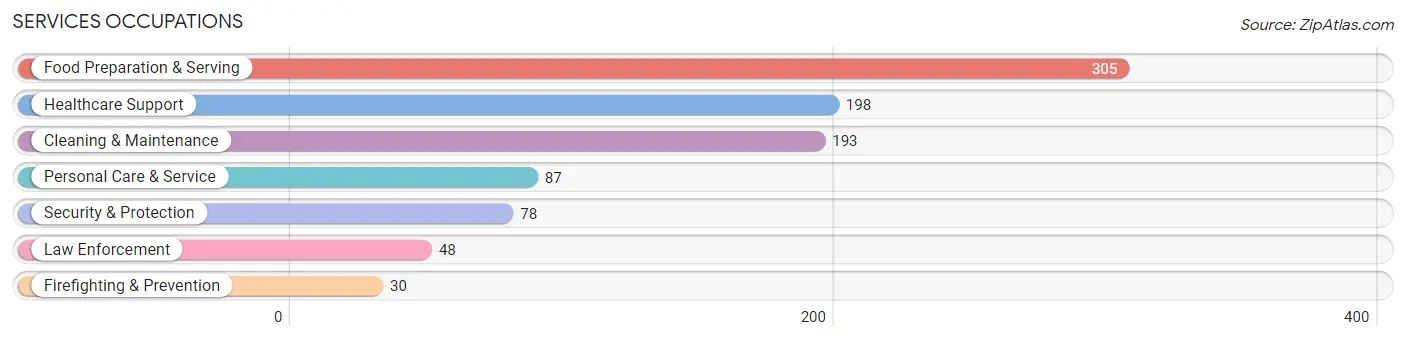
Services Occupations
The most common Services occupations in Vienna are Food Preparation & Serving (305 | 6.3%), Healthcare Support (198 | 4.1%), Cleaning & Maintenance (193 | 4.0%), Personal Care & Service (87 | 1.8%), and Security & Protection (78 | 1.6%).
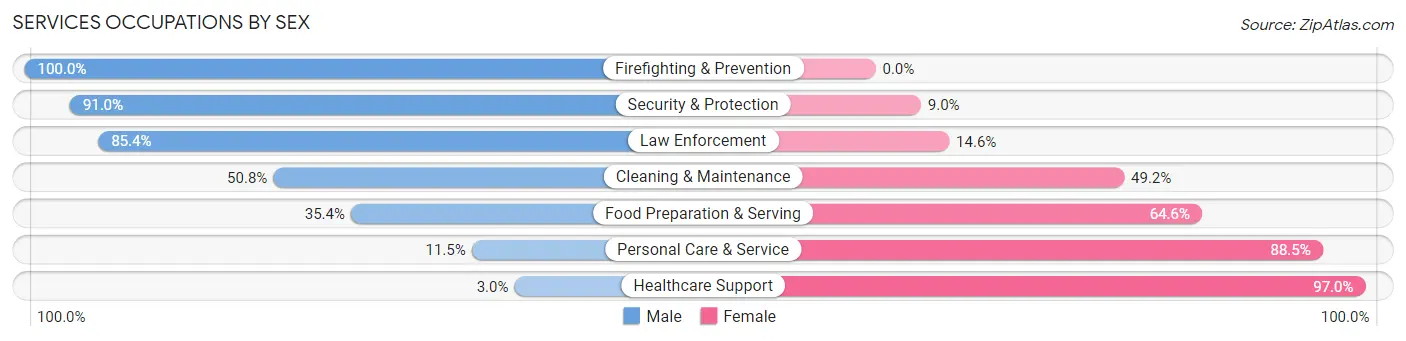
Services Occupations by Sex
Within the Services occupations in Vienna, the most male-oriented occupations are Firefighting & Prevention (100.0%), Security & Protection (91.0%), and Law Enforcement (85.4%), while the most female-oriented occupations are Healthcare Support (97.0%), Personal Care & Service (88.5%), and Food Preparation & Serving (64.6%).
| Occupation | Male | Female |
| Healthcare Support | 6 (3.0%) | 192 (97.0%) |
| Security & Protection | 71 (91.0%) | 7 (9.0%) |
| Firefighting & Prevention | 30 (100.0%) | 0 (0.0%) |
| Law Enforcement | 41 (85.4%) | 7 (14.6%) |
| Food Preparation & Serving | 108 (35.4%) | 197 (64.6%) |
| Cleaning & Maintenance | 98 (50.8%) | 95 (49.2%) |
| Personal Care & Service | 10 (11.5%) | 77 (88.5%) |
| Total (Category) | 293 (34.0%) | 568 (66.0%) |
| Total (Overall) | 2,440 (50.3%) | 2,415 (49.7%) |
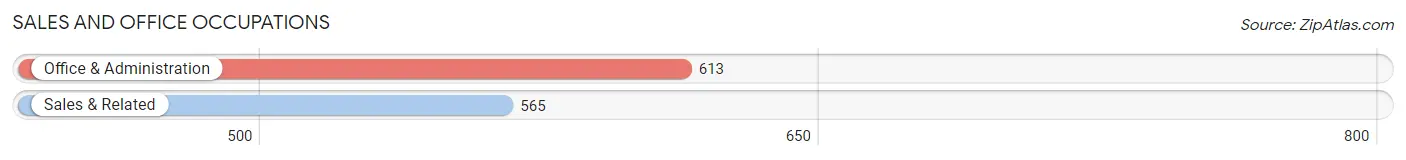
Sales and Office Occupations
The most common Sales and Office occupations in Vienna are Office & Administration (613 | 12.6%), and Sales & Related (565 | 11.6%).
Sales and Office Occupations by Sex
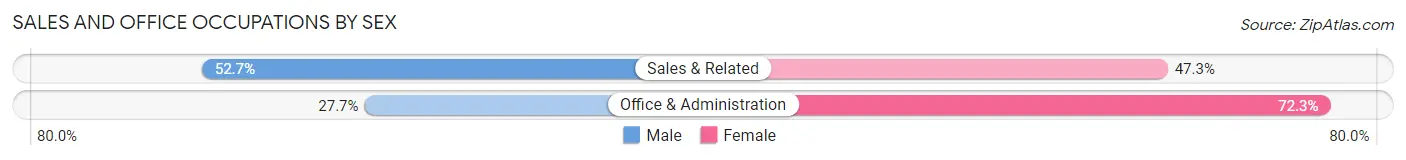
| Occupation | Male | Female |
| Sales & Related | 298 (52.7%) | 267 (47.3%) |
| Office & Administration | 170 (27.7%) | 443 (72.3%) |
| Total (Category) | 468 (39.7%) | 710 (60.3%) |
| Total (Overall) | 2,440 (50.3%) | 2,415 (49.7%) |
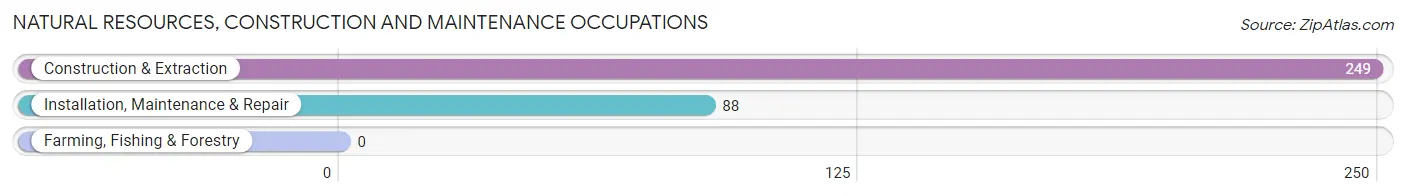
Natural Resources, Construction and Maintenance Occupations
The most common Natural Resources, Construction and Maintenance occupations in Vienna are Construction & Extraction (249 | 5.1%), and Installation, Maintenance & Repair (88 | 1.8%).
Natural Resources, Construction and Maintenance Occupations by Sex
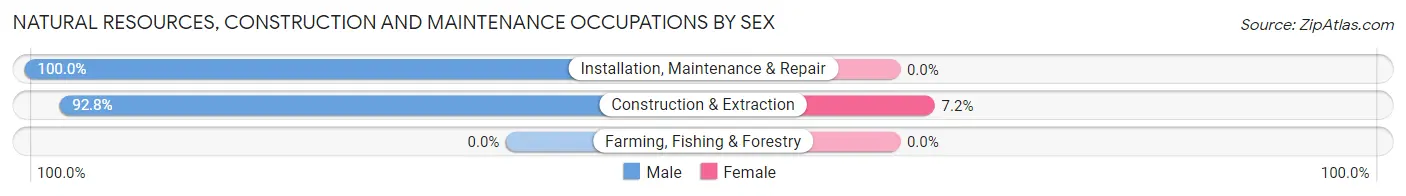
| Occupation | Male | Female |
| Farming, Fishing & Forestry | 0 (0.0%) | 0 (0.0%) |
| Construction & Extraction | 231 (92.8%) | 18 (7.2%) |
| Installation, Maintenance & Repair | 88 (100.0%) | 0 (0.0%) |
| Total (Category) | 319 (94.7%) | 18 (5.3%) |
| Total (Overall) | 2,440 (50.3%) | 2,415 (49.7%) |
Production, Transportation and Moving Occupations
The most common Production, Transportation and Moving occupations in Vienna are Transportation (233 | 4.8%), Material Moving (233 | 4.8%), and Production (188 | 3.9%).
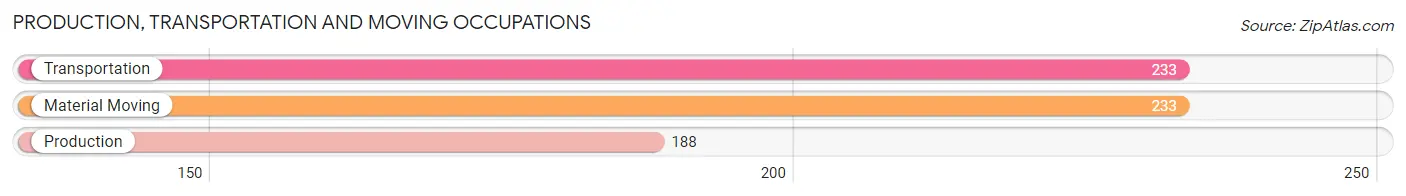
Production, Transportation and Moving Occupations by Sex
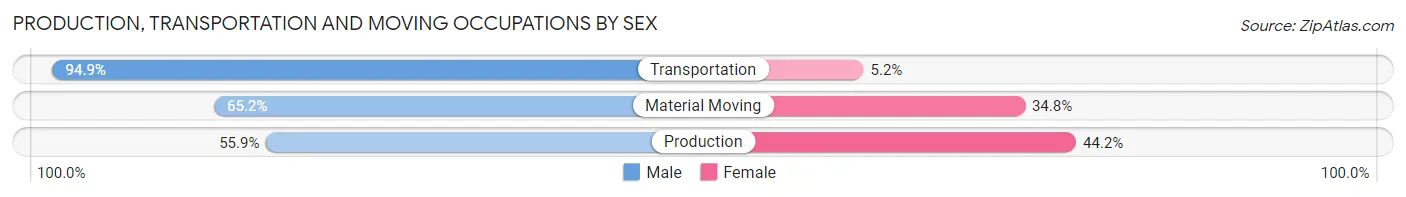
| Occupation | Male | Female |
| Production | 105 (55.8%) | 83 (44.2%) |
| Transportation | 221 (94.9%) | 12 (5.1%) |
| Material Moving | 152 (65.2%) | 81 (34.8%) |
| Total (Category) | 478 (73.1%) | 176 (26.9%) |
| Total (Overall) | 2,440 (50.3%) | 2,415 (49.7%) |
Employment Industries by Sex in Vienna
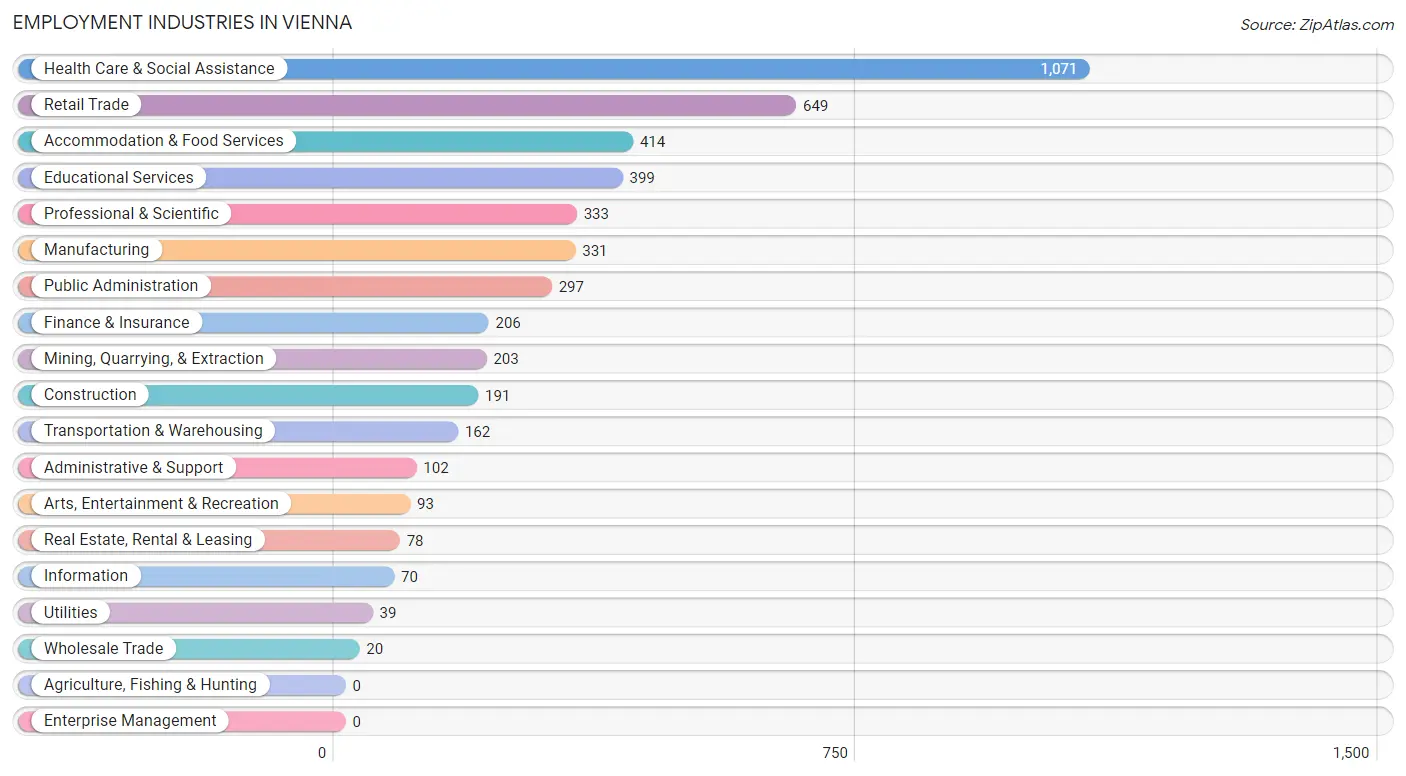
Employment Industries in Vienna
The major employment industries in Vienna include Health Care & Social Assistance (1,071 | 22.1%), Retail Trade (649 | 13.4%), Accommodation & Food Services (414 | 8.5%), Educational Services (399 | 8.2%), and Professional & Scientific (333 | 6.9%).
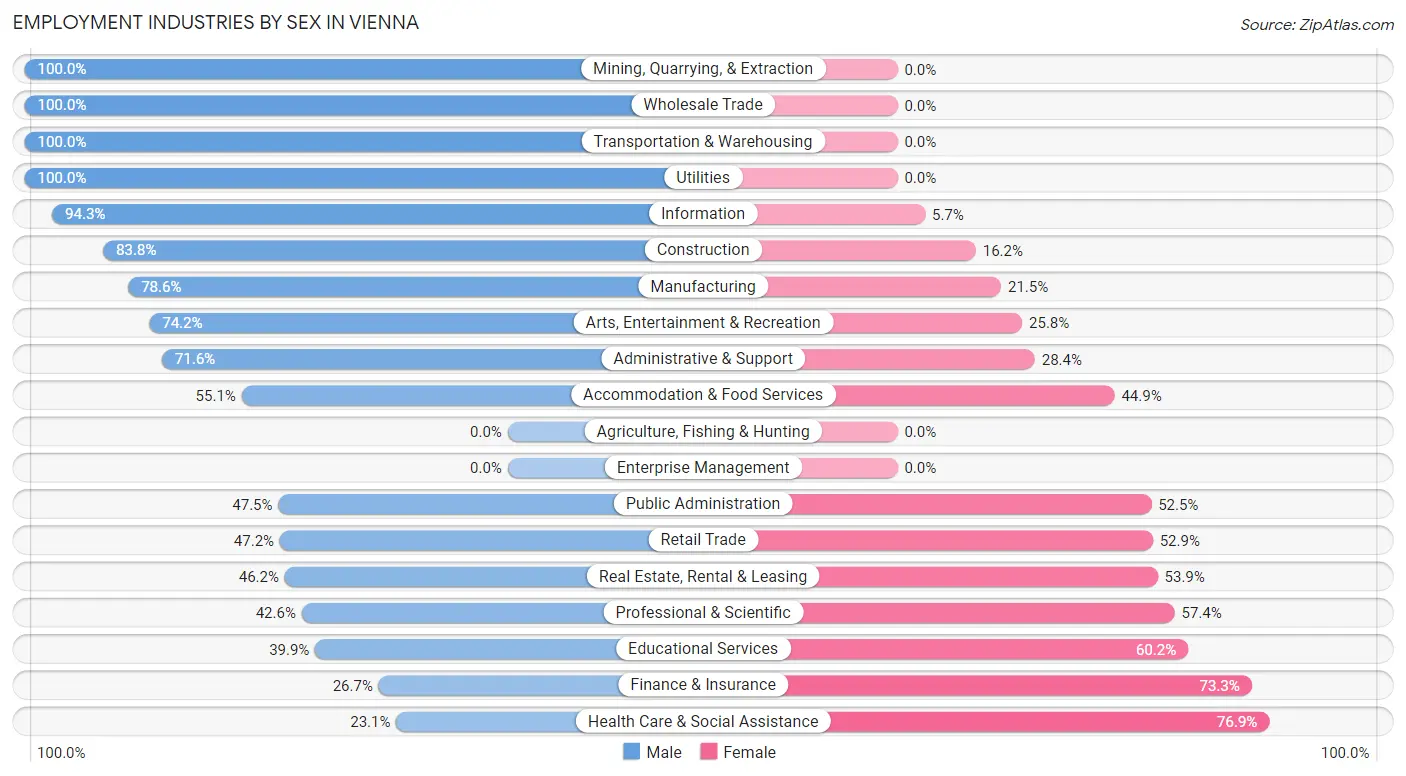
Employment Industries by Sex in Vienna
The Vienna industries that see more men than women are Mining, Quarrying, & Extraction (100.0%), Wholesale Trade (100.0%), and Transportation & Warehousing (100.0%), whereas the industries that tend to have a higher number of women are Health Care & Social Assistance (76.9%), Finance & Insurance (73.3%), and Educational Services (60.2%).
| Industry | Male | Female |
| Agriculture, Fishing & Hunting | 0 (0.0%) | 0 (0.0%) |
| Mining, Quarrying, & Extraction | 203 (100.0%) | 0 (0.0%) |
| Construction | 160 (83.8%) | 31 (16.2%) |
| Manufacturing | 260 (78.5%) | 71 (21.4%) |
| Wholesale Trade | 20 (100.0%) | 0 (0.0%) |
| Retail Trade | 306 (47.1%) | 343 (52.8%) |
| Transportation & Warehousing | 162 (100.0%) | 0 (0.0%) |
| Utilities | 39 (100.0%) | 0 (0.0%) |
| Information | 66 (94.3%) | 4 (5.7%) |
| Finance & Insurance | 55 (26.7%) | 151 (73.3%) |
| Real Estate, Rental & Leasing | 36 (46.2%) | 42 (53.8%) |
| Professional & Scientific | 142 (42.6%) | 191 (57.4%) |
| Enterprise Management | 0 (0.0%) | 0 (0.0%) |
| Administrative & Support | 73 (71.6%) | 29 (28.4%) |
| Educational Services | 159 (39.9%) | 240 (60.2%) |
| Health Care & Social Assistance | 247 (23.1%) | 824 (76.9%) |
| Arts, Entertainment & Recreation | 69 (74.2%) | 24 (25.8%) |
| Accommodation & Food Services | 228 (55.1%) | 186 (44.9%) |
| Public Administration | 141 (47.5%) | 156 (52.5%) |
| Total | 2,440 (50.3%) | 2,415 (49.7%) |
Education in Vienna
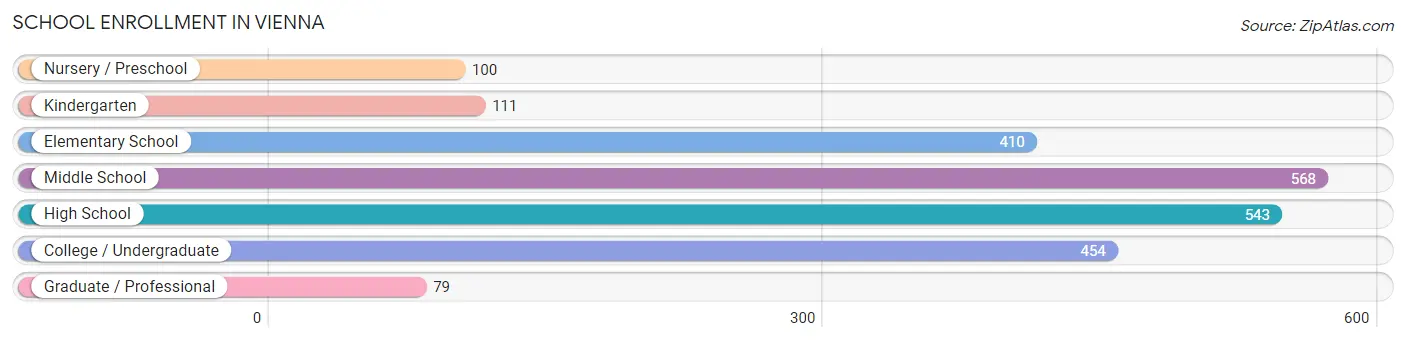
School Enrollment in Vienna
The most common levels of schooling among the 2,265 students in Vienna are middle school (568 | 25.1%), high school (543 | 24.0%), and college / undergraduate (454 | 20.0%).
| School Level | # Students | % Students |
| Nursery / Preschool | 100 | 4.4% |
| Kindergarten | 111 | 4.9% |
| Elementary School | 410 | 18.1% |
| Middle School | 568 | 25.1% |
| High School | 543 | 24.0% |
| College / Undergraduate | 454 | 20.0% |
| Graduate / Professional | 79 | 3.5% |
| Total | 2,265 | 100.0% |
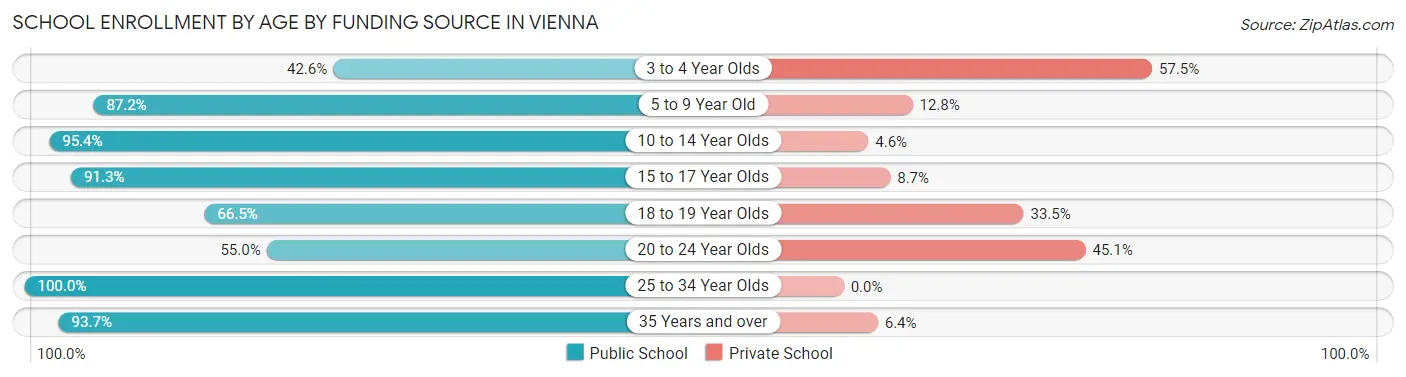
School Enrollment by Age by Funding Source in Vienna
Out of a total of 2,265 students who are enrolled in schools in Vienna, 317 (14.0%) attend a private institution, while the remaining 1,948 (86.0%) are enrolled in public schools. The age group of 3 to 4 year olds has the highest likelihood of being enrolled in private schools, with 27 (57.5% in the age bracket) enrolled. Conversely, the age group of 25 to 34 year olds has the lowest likelihood of being enrolled in a private school, with 152 (100.0% in the age bracket) attending a public institution.
| Age Bracket | Public School | Private School |
| 3 to 4 Year Olds | 20 (42.5%) | 27 (57.5%) |
| 5 to 9 Year Old | 496 (87.2%) | 73 (12.8%) |
| 10 to 14 Year Olds | 622 (95.4%) | 30 (4.6%) |
| 15 to 17 Year Olds | 368 (91.3%) | 35 (8.7%) |
| 18 to 19 Year Olds | 131 (66.5%) | 66 (33.5%) |
| 20 to 24 Year Olds | 100 (54.9%) | 82 (45.1%) |
| 25 to 34 Year Olds | 152 (100.0%) | 0 (0.0%) |
| 35 Years and over | 59 (93.6%) | 4 (6.4%) |
| Total | 1,948 (86.0%) | 317 (14.0%) |
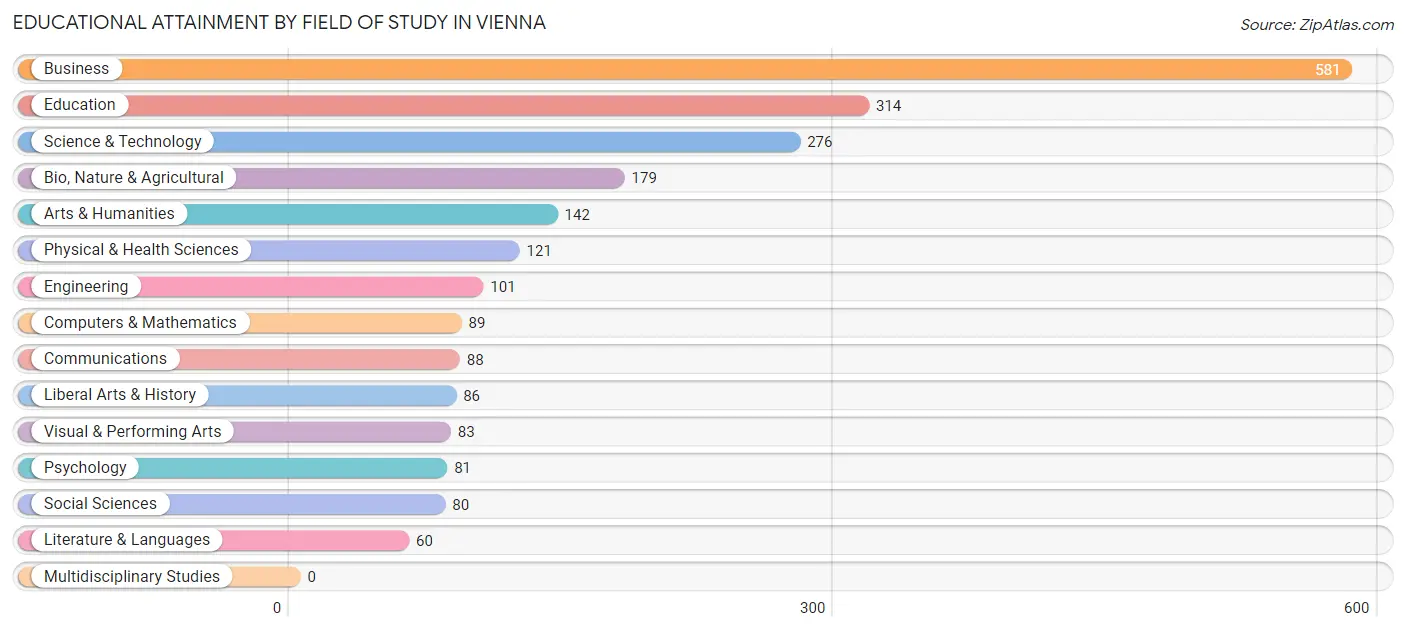
Educational Attainment by Field of Study in Vienna
Business (581 | 25.5%), education (314 | 13.8%), science & technology (276 | 12.1%), bio, nature & agricultural (179 | 7.9%), and arts & humanities (142 | 6.2%) are the most common fields of study among 2,281 individuals in Vienna who have obtained a bachelor's degree or higher.
| Field of Study | # Graduates | % Graduates |
| Computers & Mathematics | 89 | 3.9% |
| Bio, Nature & Agricultural | 179 | 7.9% |
| Physical & Health Sciences | 121 | 5.3% |
| Psychology | 81 | 3.5% |
| Social Sciences | 80 | 3.5% |
| Engineering | 101 | 4.4% |
| Multidisciplinary Studies | 0 | 0.0% |
| Science & Technology | 276 | 12.1% |
| Business | 581 | 25.5% |
| Education | 314 | 13.8% |
| Literature & Languages | 60 | 2.6% |
| Liberal Arts & History | 86 | 3.8% |
| Visual & Performing Arts | 83 | 3.6% |
| Communications | 88 | 3.9% |
| Arts & Humanities | 142 | 6.2% |
| Total | 2,281 | 100.0% |
Transportation & Commute in Vienna
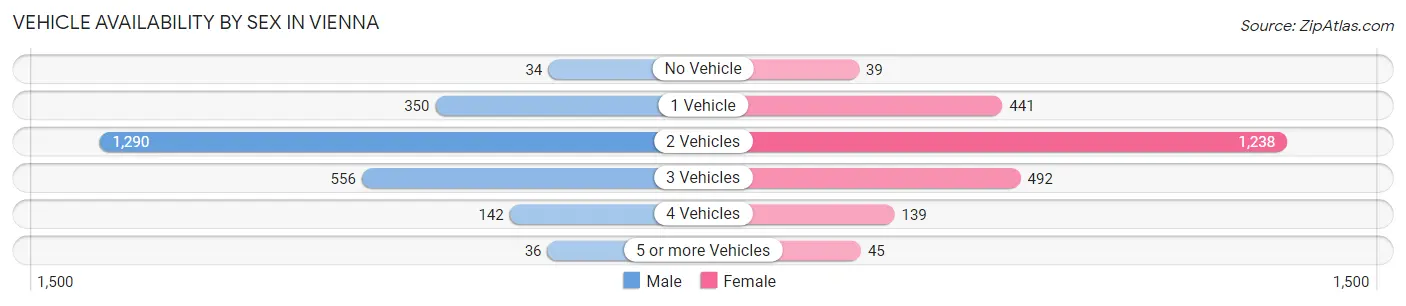
Vehicle Availability by Sex in Vienna
The most prevalent vehicle ownership categories in Vienna are males with 2 vehicles (1,290, accounting for 53.6%) and females with 2 vehicles (1,238, making up 53.9%).
| Vehicles Available | Male | Female |
| No Vehicle | 34 (1.4%) | 39 (1.6%) |
| 1 Vehicle | 350 (14.5%) | 441 (18.4%) |
| 2 Vehicles | 1,290 (53.6%) | 1,238 (51.7%) |
| 3 Vehicles | 556 (23.1%) | 492 (20.5%) |
| 4 Vehicles | 142 (5.9%) | 139 (5.8%) |
| 5 or more Vehicles | 36 (1.5%) | 45 (1.9%) |
| Total | 2,408 (100.0%) | 2,394 (100.0%) |
Commute Time in Vienna
The most frequently occuring commute durations in Vienna are 10 to 14 minutes (1,079 commuters, 23.7%), 20 to 24 minutes (1,075 commuters, 23.6%), and 15 to 19 minutes (1,055 commuters, 23.2%).
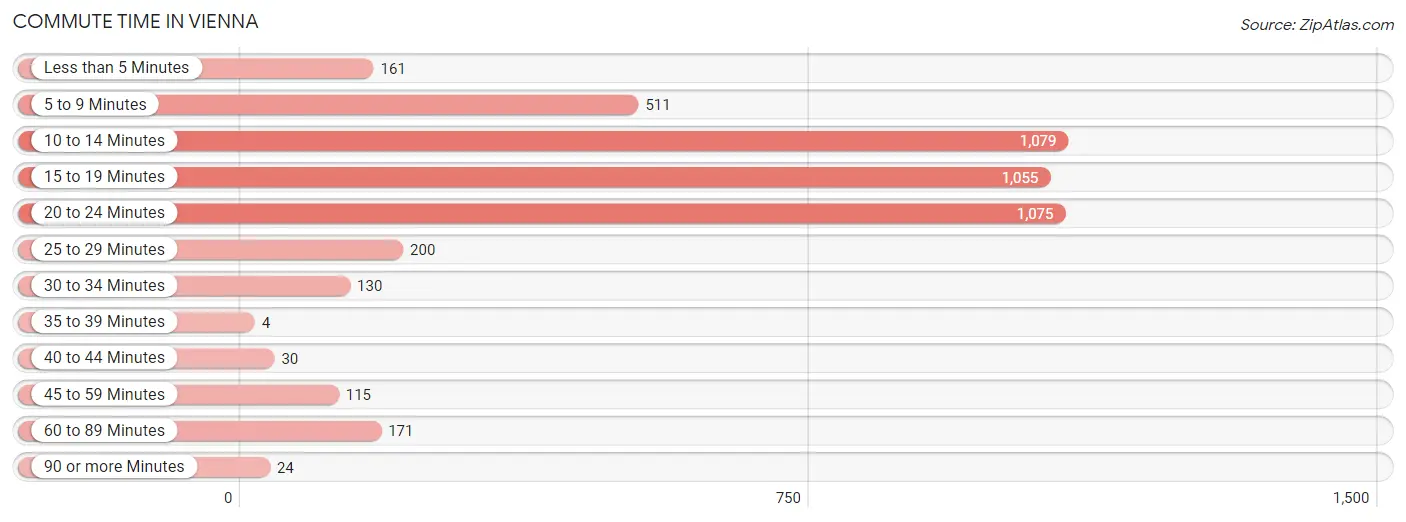
| Commute Time | # Commuters | % Commuters |
| Less than 5 Minutes | 161 | 3.5% |
| 5 to 9 Minutes | 511 | 11.2% |
| 10 to 14 Minutes | 1,079 | 23.7% |
| 15 to 19 Minutes | 1,055 | 23.2% |
| 20 to 24 Minutes | 1,075 | 23.6% |
| 25 to 29 Minutes | 200 | 4.4% |
| 30 to 34 Minutes | 130 | 2.9% |
| 35 to 39 Minutes | 4 | 0.1% |
| 40 to 44 Minutes | 30 | 0.7% |
| 45 to 59 Minutes | 115 | 2.5% |
| 60 to 89 Minutes | 171 | 3.7% |
| 90 or more Minutes | 24 | 0.5% |
Commute Time by Sex in Vienna
The most common commute times in Vienna are 20 to 24 minutes (702 commuters, 30.2%) for males and 10 to 14 minutes (733 commuters, 32.9%) for females.
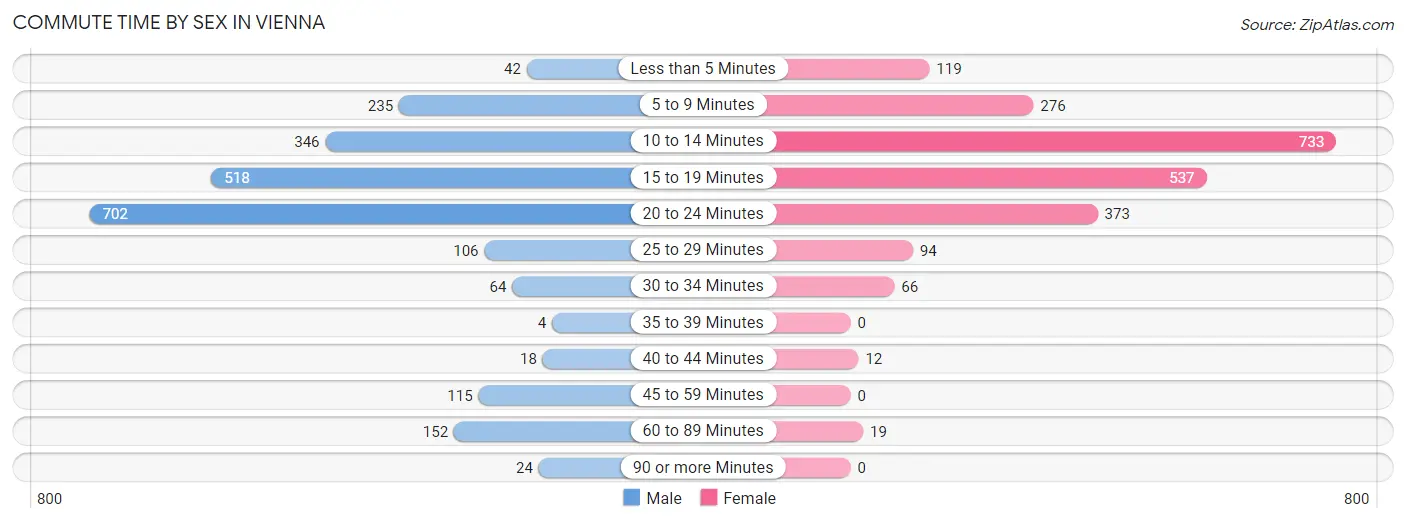
| Commute Time | Male | Female |
| Less than 5 Minutes | 42 (1.8%) | 119 (5.3%) |
| 5 to 9 Minutes | 235 (10.1%) | 276 (12.4%) |
| 10 to 14 Minutes | 346 (14.9%) | 733 (32.9%) |
| 15 to 19 Minutes | 518 (22.3%) | 537 (24.1%) |
| 20 to 24 Minutes | 702 (30.2%) | 373 (16.7%) |
| 25 to 29 Minutes | 106 (4.6%) | 94 (4.2%) |
| 30 to 34 Minutes | 64 (2.8%) | 66 (3.0%) |
| 35 to 39 Minutes | 4 (0.2%) | 0 (0.0%) |
| 40 to 44 Minutes | 18 (0.8%) | 12 (0.5%) |
| 45 to 59 Minutes | 115 (4.9%) | 0 (0.0%) |
| 60 to 89 Minutes | 152 (6.5%) | 19 (0.9%) |
| 90 or more Minutes | 24 (1.0%) | 0 (0.0%) |
Time of Departure to Work by Sex in Vienna
The most frequent times of departure to work in Vienna are 8:00 AM to 8:29 AM (313, 13.5%) for males and 7:30 AM to 7:59 AM (635, 28.5%) for females.
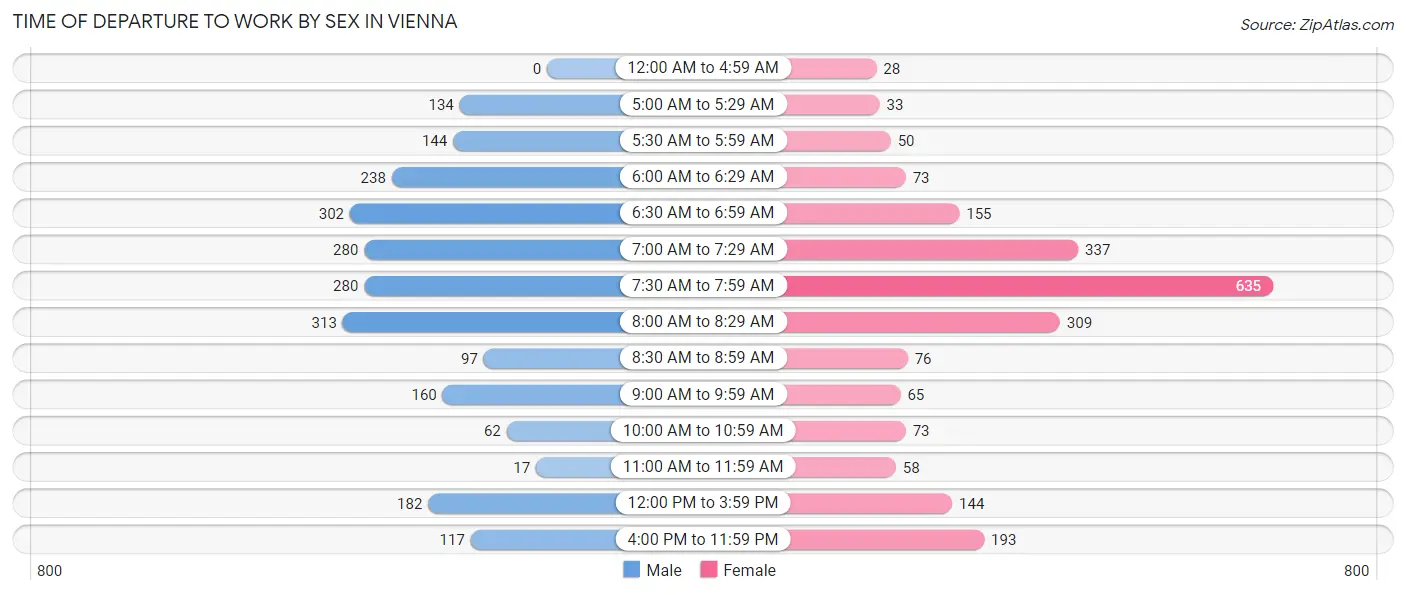
| Time of Departure | Male | Female |
| 12:00 AM to 4:59 AM | 0 (0.0%) | 28 (1.3%) |
| 5:00 AM to 5:29 AM | 134 (5.8%) | 33 (1.5%) |
| 5:30 AM to 5:59 AM | 144 (6.2%) | 50 (2.2%) |
| 6:00 AM to 6:29 AM | 238 (10.2%) | 73 (3.3%) |
| 6:30 AM to 6:59 AM | 302 (13.0%) | 155 (7.0%) |
| 7:00 AM to 7:29 AM | 280 (12.0%) | 337 (15.1%) |
| 7:30 AM to 7:59 AM | 280 (12.0%) | 635 (28.5%) |
| 8:00 AM to 8:29 AM | 313 (13.5%) | 309 (13.9%) |
| 8:30 AM to 8:59 AM | 97 (4.2%) | 76 (3.4%) |
| 9:00 AM to 9:59 AM | 160 (6.9%) | 65 (2.9%) |
| 10:00 AM to 10:59 AM | 62 (2.7%) | 73 (3.3%) |
| 11:00 AM to 11:59 AM | 17 (0.7%) | 58 (2.6%) |
| 12:00 PM to 3:59 PM | 182 (7.8%) | 144 (6.5%) |
| 4:00 PM to 11:59 PM | 117 (5.0%) | 193 (8.7%) |
| Total | 2,326 (100.0%) | 2,229 (100.0%) |
Housing Occupancy in Vienna
Occupancy by Ownership in Vienna
Of the total 4,485 dwellings in Vienna, owner-occupied units account for 3,500 (78.0%), while renter-occupied units make up 985 (22.0%).
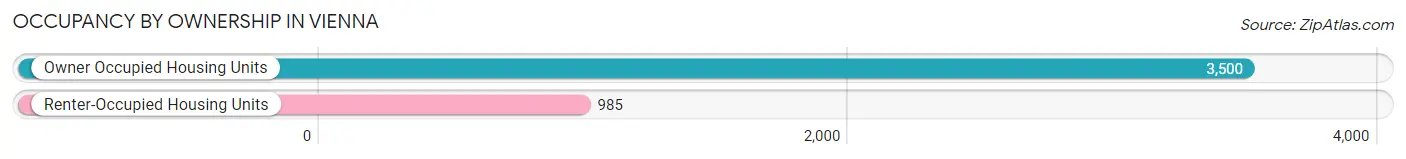
| Occupancy | # Housing Units | % Housing Units |
| Owner Occupied Housing Units | 3,500 | 78.0% |
| Renter-Occupied Housing Units | 985 | 22.0% |
| Total Occupied Housing Units | 4,485 | 100.0% |
Occupancy by Household Size in Vienna
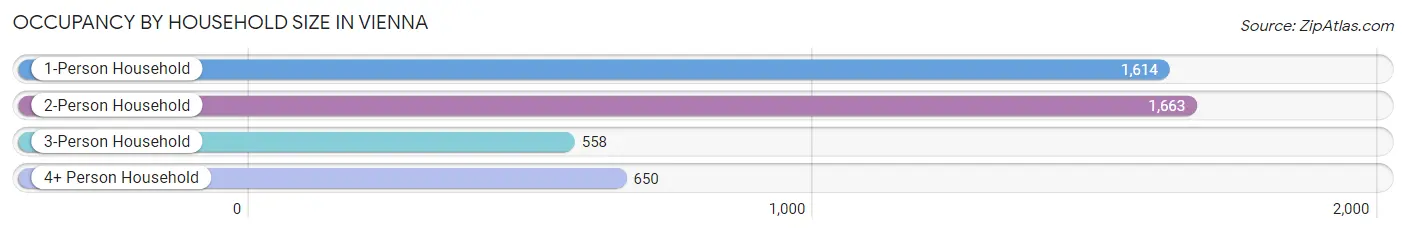
| Household Size | # Housing Units | % Housing Units |
| 1-Person Household | 1,614 | 36.0% |
| 2-Person Household | 1,663 | 37.1% |
| 3-Person Household | 558 | 12.4% |
| 4+ Person Household | 650 | 14.5% |
| Total Housing Units | 4,485 | 100.0% |
Occupancy by Ownership by Household Size in Vienna
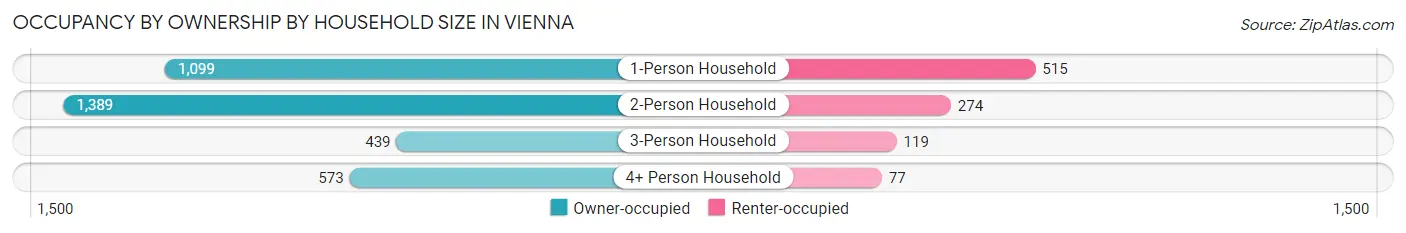
| Household Size | Owner-occupied | Renter-occupied |
| 1-Person Household | 1,099 (68.1%) | 515 (31.9%) |
| 2-Person Household | 1,389 (83.5%) | 274 (16.5%) |
| 3-Person Household | 439 (78.7%) | 119 (21.3%) |
| 4+ Person Household | 573 (88.1%) | 77 (11.8%) |
| Total Housing Units | 3,500 (78.0%) | 985 (22.0%) |
Occupancy by Educational Attainment in Vienna
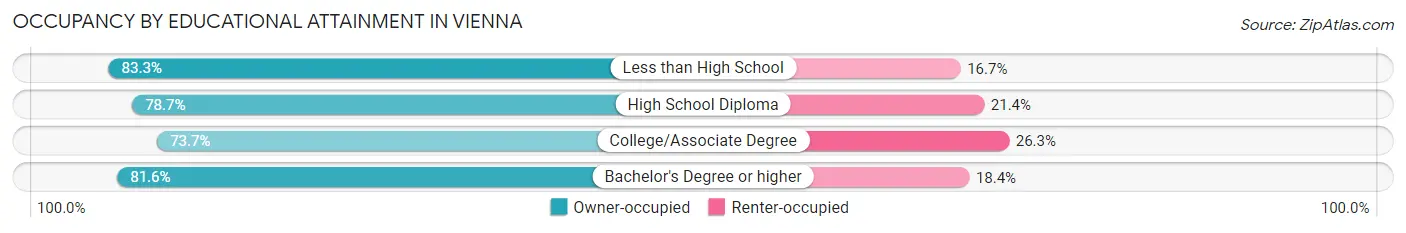
| Household Size | Owner-occupied | Renter-occupied |
| Less than High School | 165 (83.3%) | 33 (16.7%) |
| High School Diploma | 1,039 (78.6%) | 282 (21.3%) |
| College/Associate Degree | 1,160 (73.7%) | 414 (26.3%) |
| Bachelor's Degree or higher | 1,136 (81.6%) | 256 (18.4%) |
Occupancy by Age of Householder in Vienna
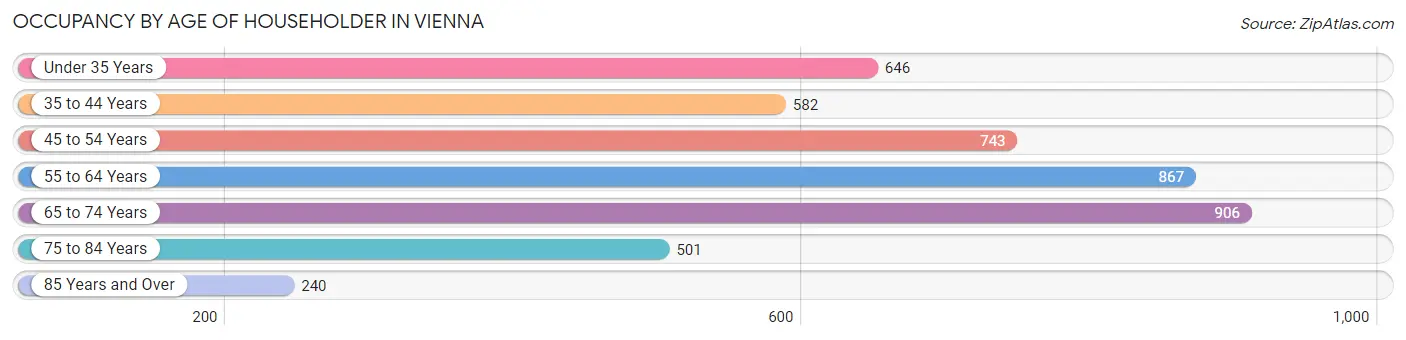
| Age Bracket | # Households | % Households |
| Under 35 Years | 646 | 14.4% |
| 35 to 44 Years | 582 | 13.0% |
| 45 to 54 Years | 743 | 16.6% |
| 55 to 64 Years | 867 | 19.3% |
| 65 to 74 Years | 906 | 20.2% |
| 75 to 84 Years | 501 | 11.2% |
| 85 Years and Over | 240 | 5.3% |
| Total | 4,485 | 100.0% |
Housing Finances in Vienna
Median Income by Occupancy in Vienna
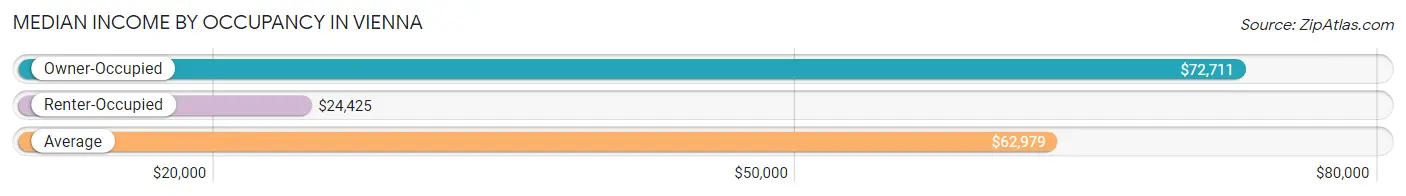
| Occupancy Type | # Households | Median Income |
| Owner-Occupied | 3,500 (78.0%) | $72,711 |
| Renter-Occupied | 985 (22.0%) | $24,425 |
| Average | 4,485 (100.0%) | $62,979 |
Occupancy by Householder Income Bracket in Vienna
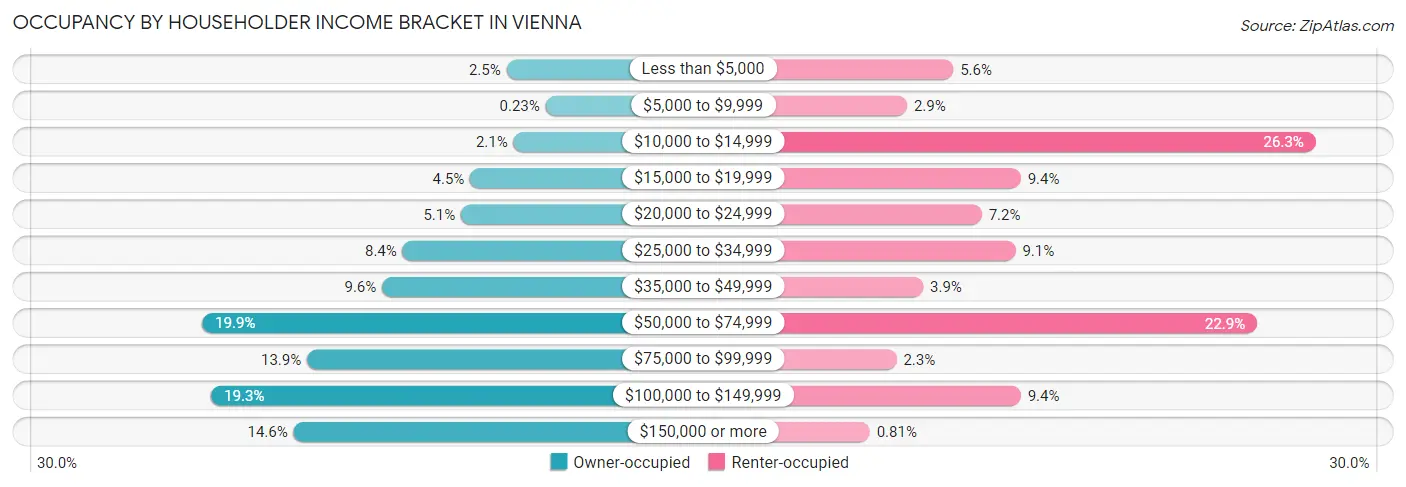
| Income Bracket | Owner-occupied | Renter-occupied |
| Less than $5,000 | 86 (2.5%) | 55 (5.6%) |
| $5,000 to $9,999 | 8 (0.2%) | 29 (2.9%) |
| $10,000 to $14,999 | 72 (2.1%) | 259 (26.3%) |
| $15,000 to $19,999 | 159 (4.5%) | 93 (9.4%) |
| $20,000 to $24,999 | 177 (5.1%) | 71 (7.2%) |
| $25,000 to $34,999 | 294 (8.4%) | 90 (9.1%) |
| $35,000 to $49,999 | 335 (9.6%) | 38 (3.9%) |
| $50,000 to $74,999 | 695 (19.9%) | 226 (22.9%) |
| $75,000 to $99,999 | 485 (13.9%) | 23 (2.3%) |
| $100,000 to $149,999 | 677 (19.3%) | 93 (9.4%) |
| $150,000 or more | 512 (14.6%) | 8 (0.8%) |
| Total | 3,500 (100.0%) | 985 (100.0%) |
Monthly Housing Cost Tiers in Vienna
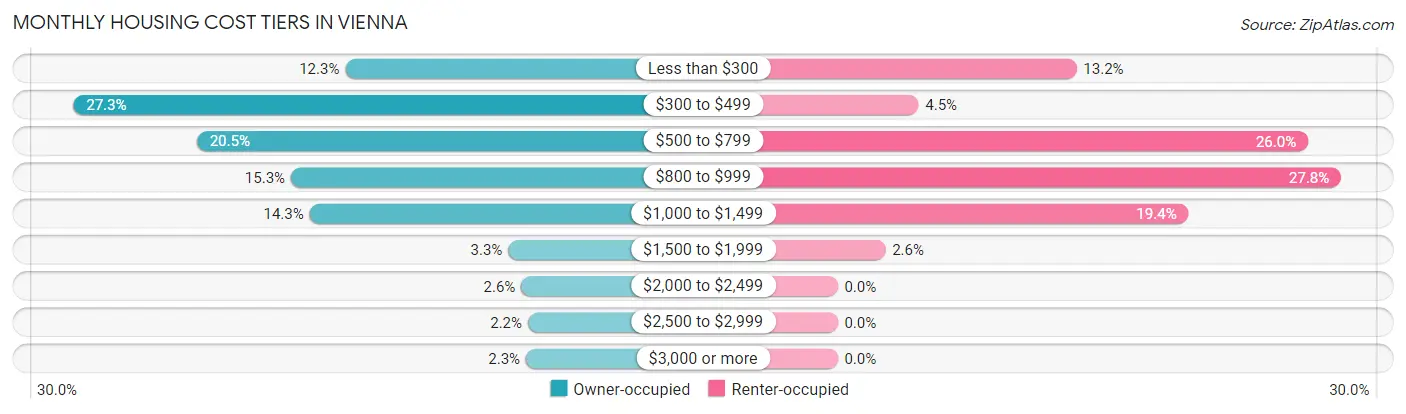
| Monthly Cost | Owner-occupied | Renter-occupied |
| Less than $300 | 430 (12.3%) | 130 (13.2%) |
| $300 to $499 | 956 (27.3%) | 44 (4.5%) |
| $500 to $799 | 717 (20.5%) | 256 (26.0%) |
| $800 to $999 | 535 (15.3%) | 274 (27.8%) |
| $1,000 to $1,499 | 499 (14.3%) | 191 (19.4%) |
| $1,500 to $1,999 | 115 (3.3%) | 26 (2.6%) |
| $2,000 to $2,499 | 90 (2.6%) | 0 (0.0%) |
| $2,500 to $2,999 | 77 (2.2%) | 0 (0.0%) |
| $3,000 or more | 81 (2.3%) | 0 (0.0%) |
| Total | 3,500 (100.0%) | 985 (100.0%) |
Physical Housing Characteristics in Vienna
Housing Structures in Vienna
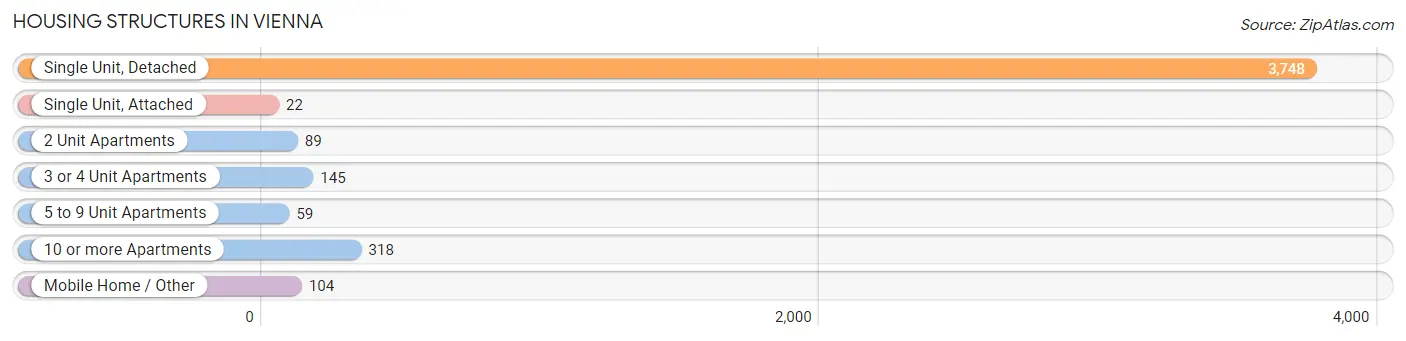
| Structure Type | # Housing Units | % Housing Units |
| Single Unit, Detached | 3,748 | 83.6% |
| Single Unit, Attached | 22 | 0.5% |
| 2 Unit Apartments | 89 | 2.0% |
| 3 or 4 Unit Apartments | 145 | 3.2% |
| 5 to 9 Unit Apartments | 59 | 1.3% |
| 10 or more Apartments | 318 | 7.1% |
| Mobile Home / Other | 104 | 2.3% |
| Total | 4,485 | 100.0% |
Housing Structures by Occupancy in Vienna
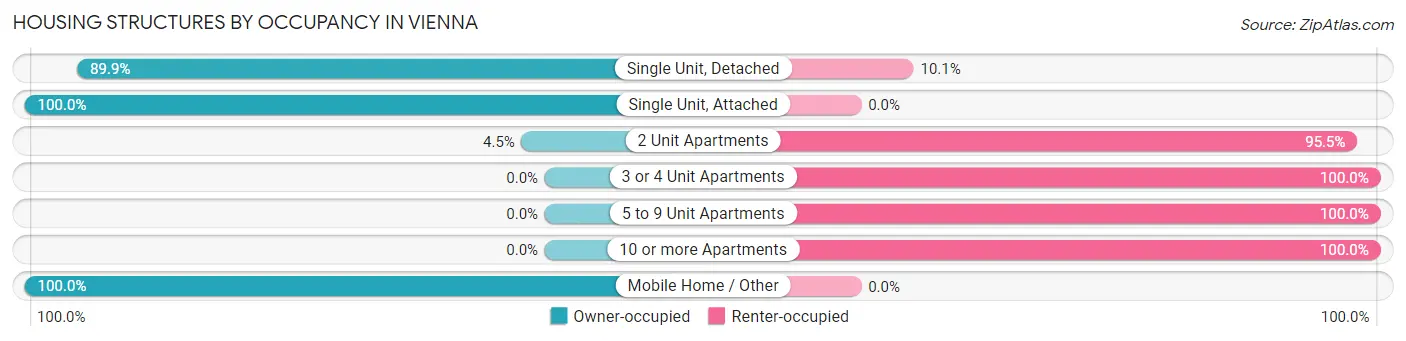
| Structure Type | Owner-occupied | Renter-occupied |
| Single Unit, Detached | 3,370 (89.9%) | 378 (10.1%) |
| Single Unit, Attached | 22 (100.0%) | 0 (0.0%) |
| 2 Unit Apartments | 4 (4.5%) | 85 (95.5%) |
| 3 or 4 Unit Apartments | 0 (0.0%) | 145 (100.0%) |
| 5 to 9 Unit Apartments | 0 (0.0%) | 59 (100.0%) |
| 10 or more Apartments | 0 (0.0%) | 318 (100.0%) |
| Mobile Home / Other | 104 (100.0%) | 0 (0.0%) |
| Total | 3,500 (78.0%) | 985 (22.0%) |
Housing Structures by Number of Rooms in Vienna
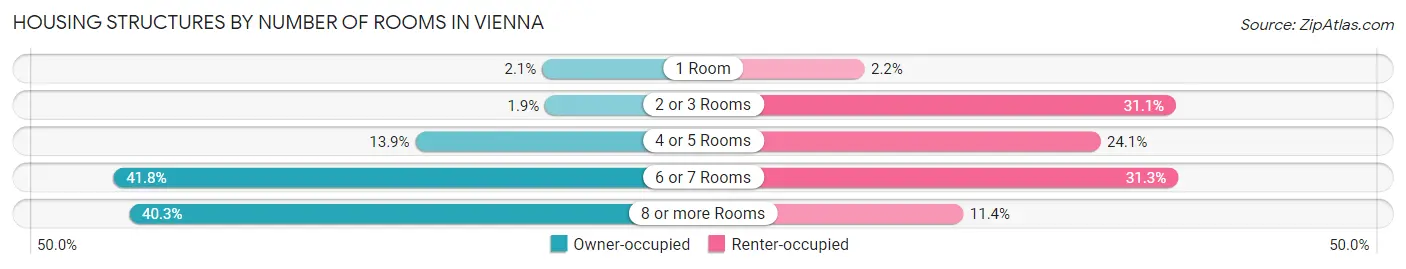
| Number of Rooms | Owner-occupied | Renter-occupied |
| 1 Room | 75 (2.1%) | 22 (2.2%) |
| 2 or 3 Rooms | 65 (1.9%) | 306 (31.1%) |
| 4 or 5 Rooms | 485 (13.9%) | 237 (24.1%) |
| 6 or 7 Rooms | 1,463 (41.8%) | 308 (31.3%) |
| 8 or more Rooms | 1,412 (40.3%) | 112 (11.4%) |
| Total | 3,500 (100.0%) | 985 (100.0%) |
Housing Structure by Heating Type in Vienna
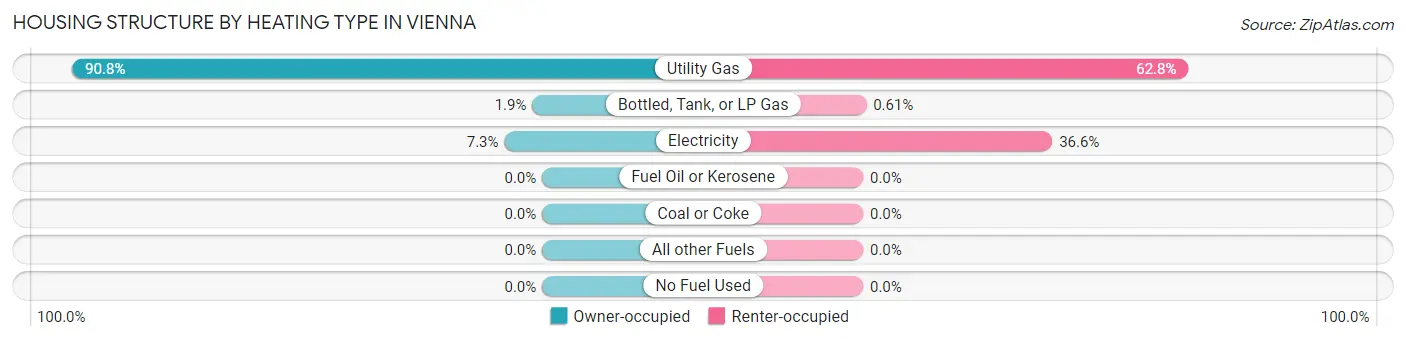
| Heating Type | Owner-occupied | Renter-occupied |
| Utility Gas | 3,179 (90.8%) | 619 (62.8%) |
| Bottled, Tank, or LP Gas | 66 (1.9%) | 6 (0.6%) |
| Electricity | 255 (7.3%) | 360 (36.5%) |
| Fuel Oil or Kerosene | 0 (0.0%) | 0 (0.0%) |
| Coal or Coke | 0 (0.0%) | 0 (0.0%) |
| All other Fuels | 0 (0.0%) | 0 (0.0%) |
| No Fuel Used | 0 (0.0%) | 0 (0.0%) |
| Total | 3,500 (100.0%) | 985 (100.0%) |
Household Vehicle Usage in Vienna
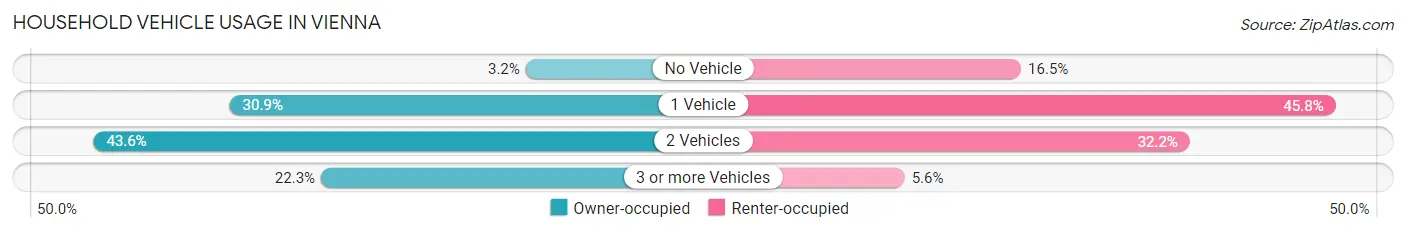
| Vehicles per Household | Owner-occupied | Renter-occupied |
| No Vehicle | 113 (3.2%) | 162 (16.5%) |
| 1 Vehicle | 1,080 (30.9%) | 451 (45.8%) |
| 2 Vehicles | 1,525 (43.6%) | 317 (32.2%) |
| 3 or more Vehicles | 782 (22.3%) | 55 (5.6%) |
| Total | 3,500 (100.0%) | 985 (100.0%) |
Real Estate & Mortgages in Vienna
Real Estate and Mortgage Overview in Vienna
| Characteristic | Without Mortgage | With Mortgage |
| Housing Units | 1,781 | 1,719 |
| Median Property Value | $147,100 | $144,200 |
| Median Household Income | $57,708 | $331 |
| Monthly Housing Costs | $388 | $81 |
| Real Estate Taxes | $998 | $48 |
Property Value by Mortgage Status in Vienna
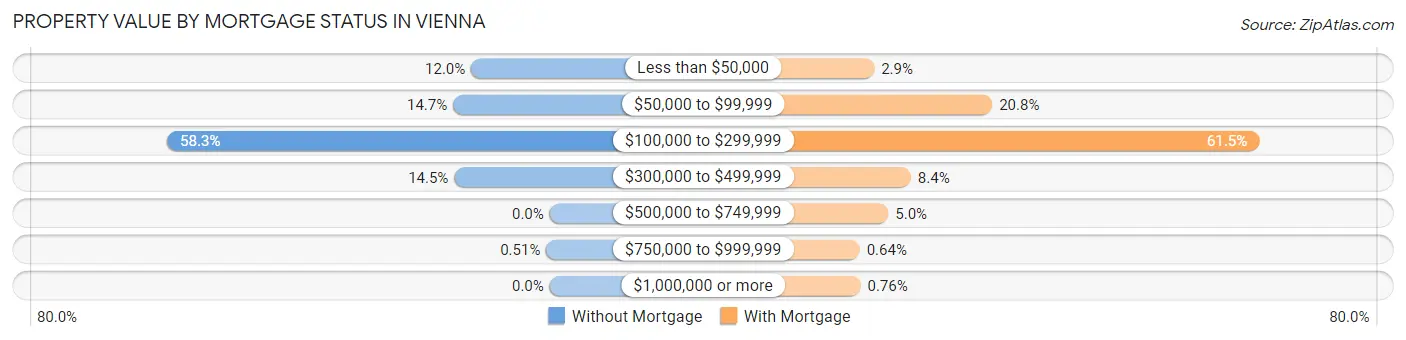
| Property Value | Without Mortgage | With Mortgage |
| Less than $50,000 | 213 (12.0%) | 49 (2.9%) |
| $50,000 to $99,999 | 262 (14.7%) | 358 (20.8%) |
| $100,000 to $299,999 | 1,038 (58.3%) | 1,057 (61.5%) |
| $300,000 to $499,999 | 259 (14.5%) | 145 (8.4%) |
| $500,000 to $749,999 | 0 (0.0%) | 86 (5.0%) |
| $750,000 to $999,999 | 9 (0.5%) | 11 (0.6%) |
| $1,000,000 or more | 0 (0.0%) | 13 (0.8%) |
| Total | 1,781 (100.0%) | 1,719 (100.0%) |
Household Income by Mortgage Status in Vienna
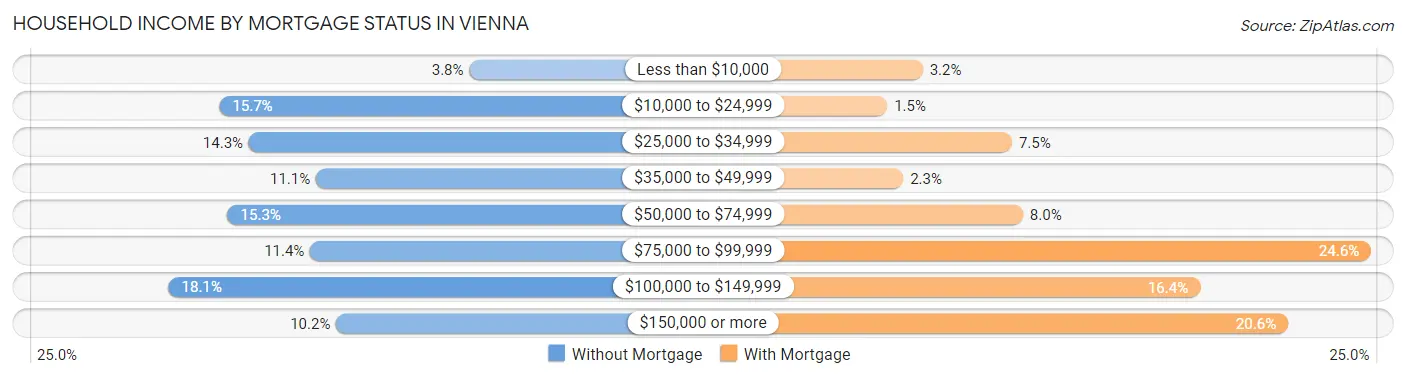
| Household Income | Without Mortgage | With Mortgage |
| Less than $10,000 | 68 (3.8%) | 55 (3.2%) |
| $10,000 to $24,999 | 280 (15.7%) | 26 (1.5%) |
| $25,000 to $34,999 | 255 (14.3%) | 128 (7.4%) |
| $35,000 to $49,999 | 198 (11.1%) | 39 (2.3%) |
| $50,000 to $74,999 | 273 (15.3%) | 137 (8.0%) |
| $75,000 to $99,999 | 203 (11.4%) | 422 (24.5%) |
| $100,000 to $149,999 | 323 (18.1%) | 282 (16.4%) |
| $150,000 or more | 181 (10.2%) | 354 (20.6%) |
| Total | 1,781 (100.0%) | 1,719 (100.0%) |
Property Value to Household Income Ratio in Vienna
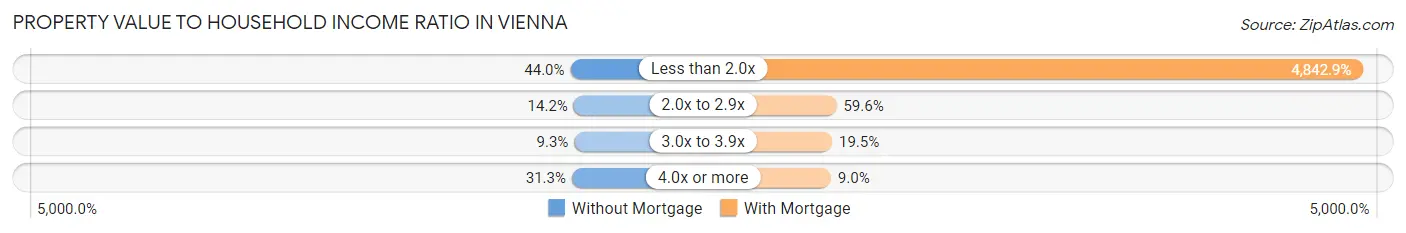
| Value-to-Income Ratio | Without Mortgage | With Mortgage |
| Less than 2.0x | 784 (44.0%) | 83,250 (4,842.9%) |
| 2.0x to 2.9x | 253 (14.2%) | 1,024 (59.6%) |
| 3.0x to 3.9x | 165 (9.3%) | 335 (19.5%) |
| 4.0x or more | 557 (31.3%) | 155 (9.0%) |
| Total | 1,781 (100.0%) | 1,719 (100.0%) |
Real Estate Taxes by Mortgage Status in Vienna
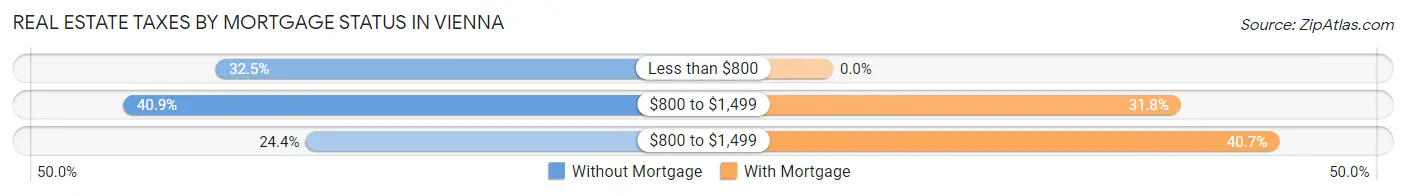
| Property Taxes | Without Mortgage | With Mortgage |
| Less than $800 | 579 (32.5%) | 0 (0.0%) |
| $800 to $1,499 | 729 (40.9%) | 546 (31.8%) |
| $800 to $1,499 | 434 (24.4%) | 700 (40.7%) |
| Total | 1,781 (100.0%) | 1,719 (100.0%) |
Health & Disability in Vienna
Health Insurance Coverage by Age in Vienna
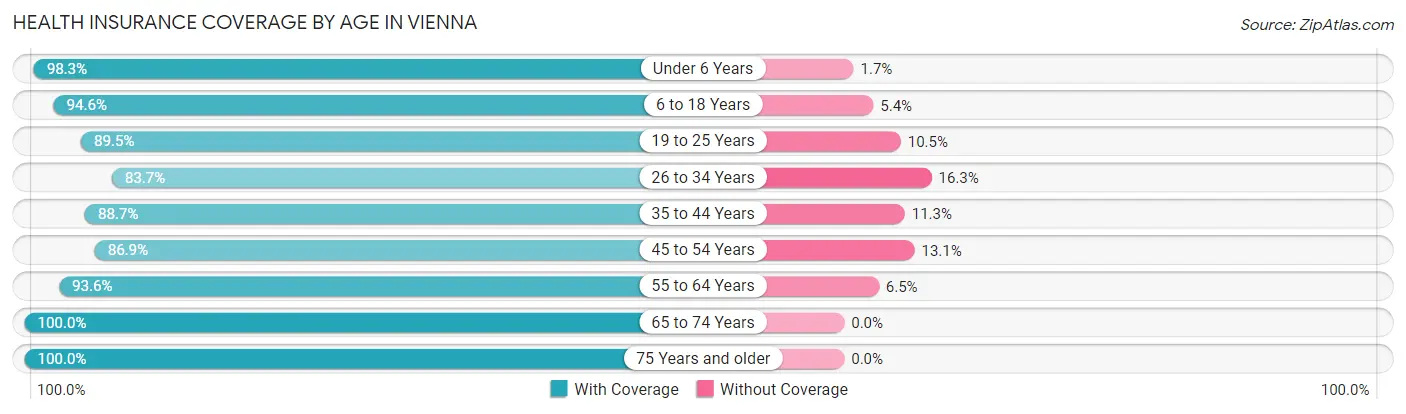
| Age Bracket | With Coverage | Without Coverage |
| Under 6 Years | 797 (98.3%) | 14 (1.7%) |
| 6 to 18 Years | 1,639 (94.6%) | 94 (5.4%) |
| 19 to 25 Years | 747 (89.5%) | 88 (10.5%) |
| 26 to 34 Years | 931 (83.7%) | 181 (16.3%) |
| 35 to 44 Years | 1,022 (88.7%) | 130 (11.3%) |
| 45 to 54 Years | 1,181 (86.9%) | 178 (13.1%) |
| 55 to 64 Years | 1,189 (93.5%) | 82 (6.5%) |
| 65 to 74 Years | 1,434 (100.0%) | 0 (0.0%) |
| 75 Years and older | 935 (100.0%) | 0 (0.0%) |
| Total | 9,875 (92.8%) | 767 (7.2%) |
Health Insurance Coverage by Citizenship Status in Vienna
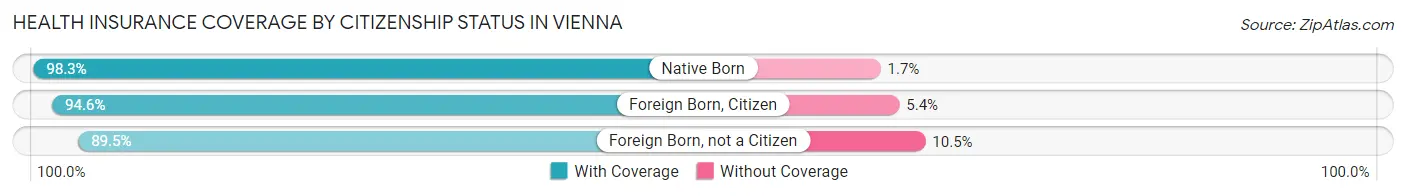
| Citizenship Status | With Coverage | Without Coverage |
| Native Born | 797 (98.3%) | 14 (1.7%) |
| Foreign Born, Citizen | 1,639 (94.6%) | 94 (5.4%) |
| Foreign Born, not a Citizen | 747 (89.5%) | 88 (10.5%) |
Health Insurance Coverage by Household Income in Vienna
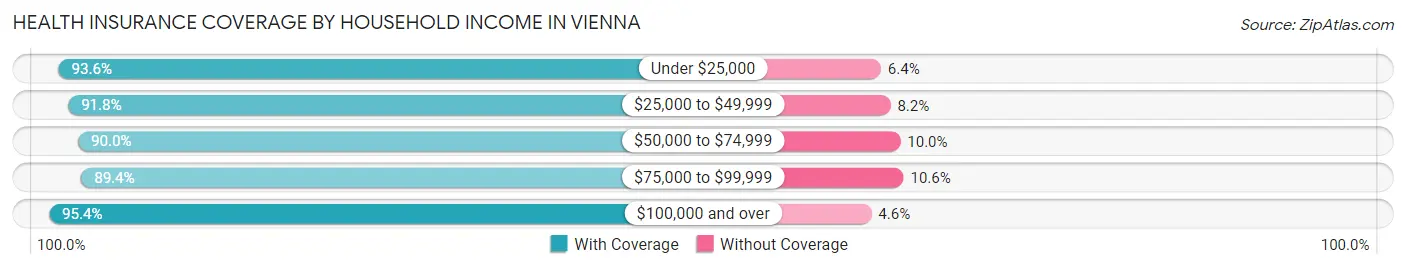
| Household Income | With Coverage | Without Coverage |
| Under $25,000 | 1,187 (93.6%) | 81 (6.4%) |
| $25,000 to $49,999 | 1,336 (91.8%) | 119 (8.2%) |
| $50,000 to $74,999 | 2,069 (90.0%) | 231 (10.0%) |
| $75,000 to $99,999 | 1,152 (89.4%) | 137 (10.6%) |
| $100,000 and over | 4,033 (95.4%) | 195 (4.6%) |
Public vs Private Health Insurance Coverage by Age in Vienna
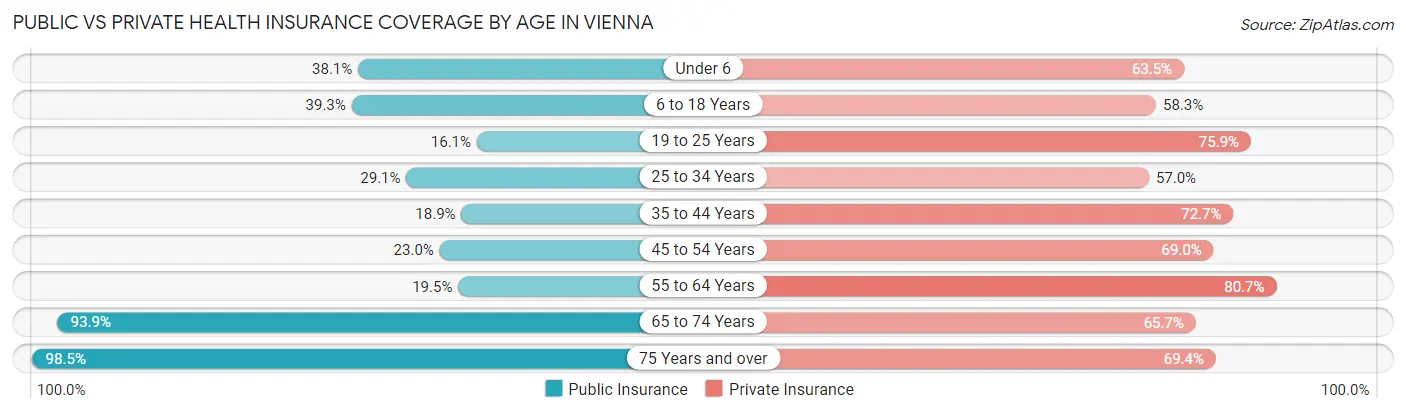
| Age Bracket | Public Insurance | Private Insurance |
| Under 6 | 309 (38.1%) | 515 (63.5%) |
| 6 to 18 Years | 681 (39.3%) | 1,011 (58.3%) |
| 19 to 25 Years | 134 (16.1%) | 634 (75.9%) |
| 25 to 34 Years | 324 (29.1%) | 634 (57.0%) |
| 35 to 44 Years | 218 (18.9%) | 837 (72.7%) |
| 45 to 54 Years | 312 (23.0%) | 938 (69.0%) |
| 55 to 64 Years | 248 (19.5%) | 1,025 (80.6%) |
| 65 to 74 Years | 1,346 (93.9%) | 942 (65.7%) |
| 75 Years and over | 921 (98.5%) | 649 (69.4%) |
| Total | 4,493 (42.2%) | 7,185 (67.5%) |
Disability Status by Sex by Age in Vienna
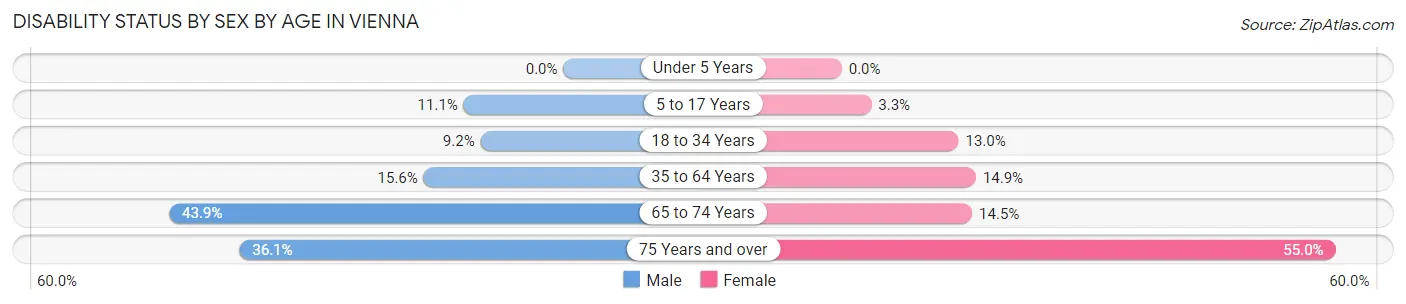
| Age Bracket | Male | Female |
| Under 5 Years | 0 (0.0%) | 0 (0.0%) |
| 5 to 17 Years | 79 (11.1%) | 33 (3.3%) |
| 18 to 34 Years | 99 (9.2%) | 133 (13.0%) |
| 35 to 64 Years | 278 (15.6%) | 298 (14.9%) |
| 65 to 74 Years | 288 (43.9%) | 113 (14.5%) |
| 75 Years and over | 105 (36.1%) | 354 (55.0%) |
Disability Class by Sex by Age in Vienna
Disability Class: Hearing Difficulty
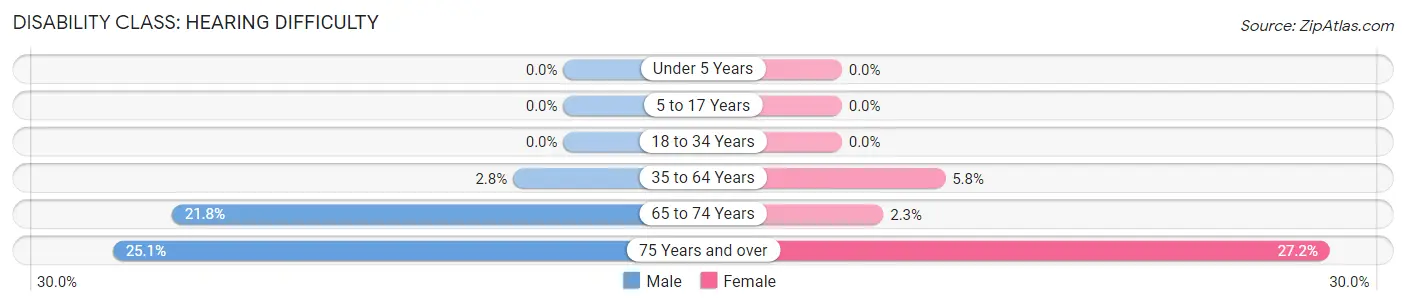
| Age Bracket | Male | Female |
| Under 5 Years | 0 (0.0%) | 0 (0.0%) |
| 5 to 17 Years | 0 (0.0%) | 0 (0.0%) |
| 18 to 34 Years | 0 (0.0%) | 0 (0.0%) |
| 35 to 64 Years | 50 (2.8%) | 115 (5.8%) |
| 65 to 74 Years | 143 (21.8%) | 18 (2.3%) |
| 75 Years and over | 73 (25.1%) | 175 (27.2%) |
Disability Class: Vision Difficulty
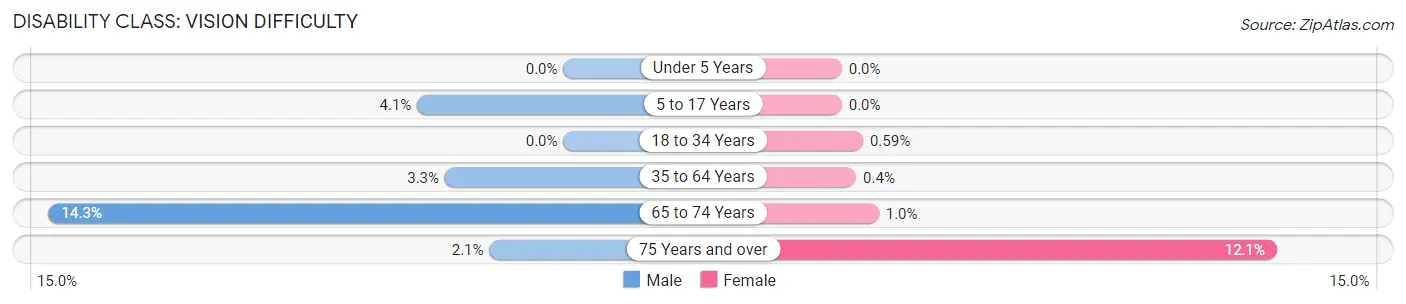
| Age Bracket | Male | Female |
| Under 5 Years | 0 (0.0%) | 0 (0.0%) |
| 5 to 17 Years | 29 (4.1%) | 0 (0.0%) |
| 18 to 34 Years | 0 (0.0%) | 6 (0.6%) |
| 35 to 64 Years | 59 (3.3%) | 8 (0.4%) |
| 65 to 74 Years | 94 (14.3%) | 8 (1.0%) |
| 75 Years and over | 6 (2.1%) | 78 (12.1%) |
Disability Class: Cognitive Difficulty
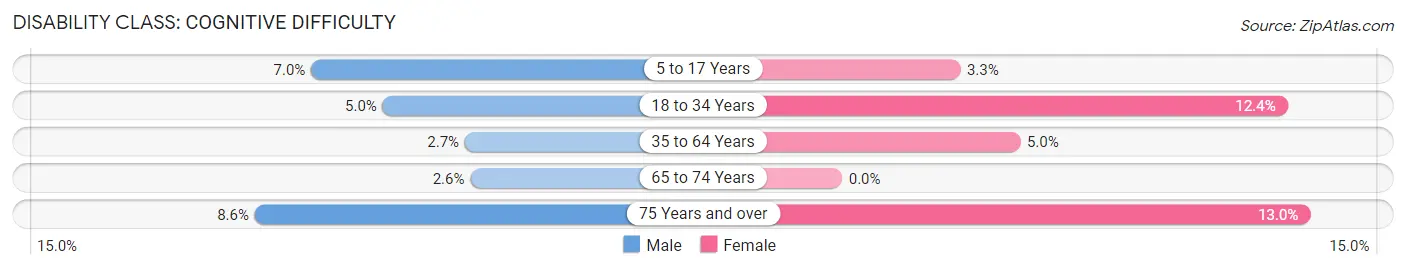
| Age Bracket | Male | Female |
| 5 to 17 Years | 50 (7.0%) | 33 (3.3%) |
| 18 to 34 Years | 54 (5.0%) | 127 (12.4%) |
| 35 to 64 Years | 49 (2.7%) | 99 (5.0%) |
| 65 to 74 Years | 17 (2.6%) | 0 (0.0%) |
| 75 Years and over | 25 (8.6%) | 84 (13.0%) |
Disability Class: Ambulatory Difficulty
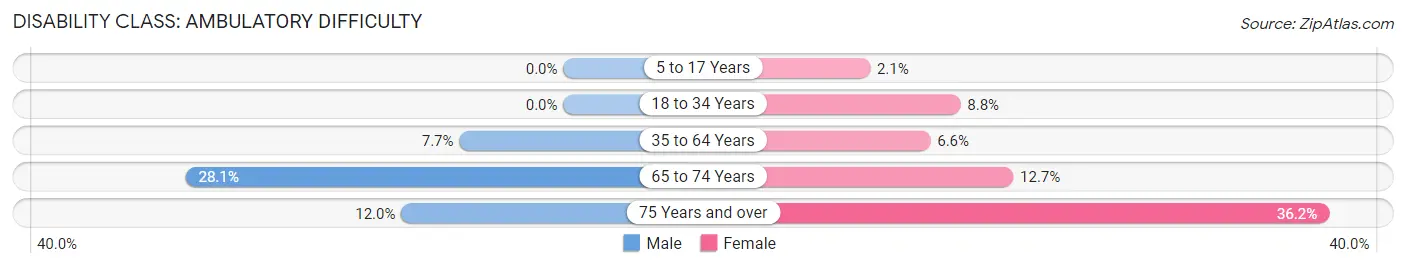
| Age Bracket | Male | Female |
| 5 to 17 Years | 0 (0.0%) | 21 (2.1%) |
| 18 to 34 Years | 0 (0.0%) | 90 (8.8%) |
| 35 to 64 Years | 138 (7.7%) | 131 (6.6%) |
| 65 to 74 Years | 184 (28.1%) | 99 (12.7%) |
| 75 Years and over | 35 (12.0%) | 233 (36.2%) |
Disability Class: Self-Care Difficulty
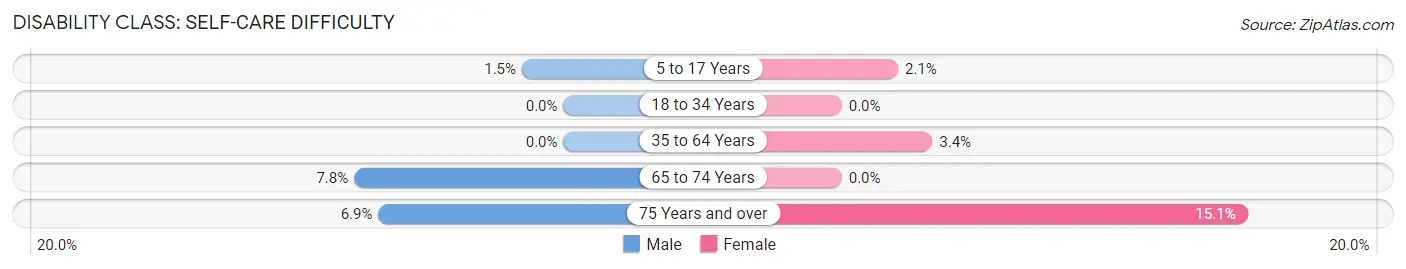
| Age Bracket | Male | Female |
| 5 to 17 Years | 11 (1.5%) | 21 (2.1%) |
| 18 to 34 Years | 0 (0.0%) | 0 (0.0%) |
| 35 to 64 Years | 0 (0.0%) | 67 (3.4%) |
| 65 to 74 Years | 51 (7.8%) | 0 (0.0%) |
| 75 Years and over | 20 (6.9%) | 97 (15.1%) |
Technology Access in Vienna
Computing Device Access in Vienna
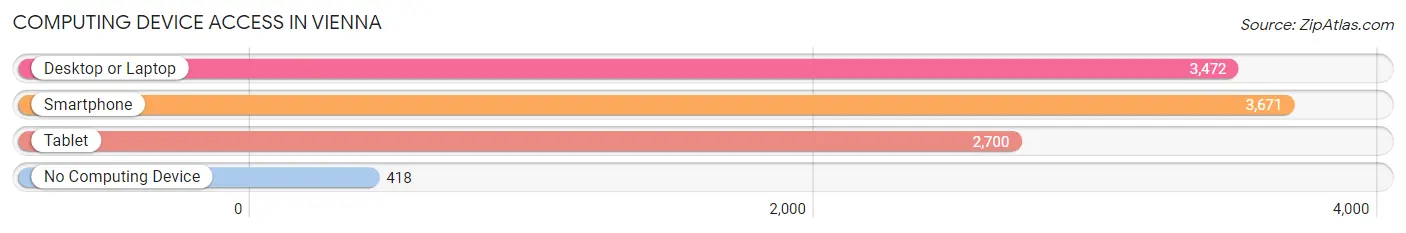
| Device Type | # Households | % Households |
| Desktop or Laptop | 3,472 | 77.4% |
| Smartphone | 3,671 | 81.9% |
| Tablet | 2,700 | 60.2% |
| No Computing Device | 418 | 9.3% |
| Total | 4,485 | 100.0% |
Internet Access in Vienna
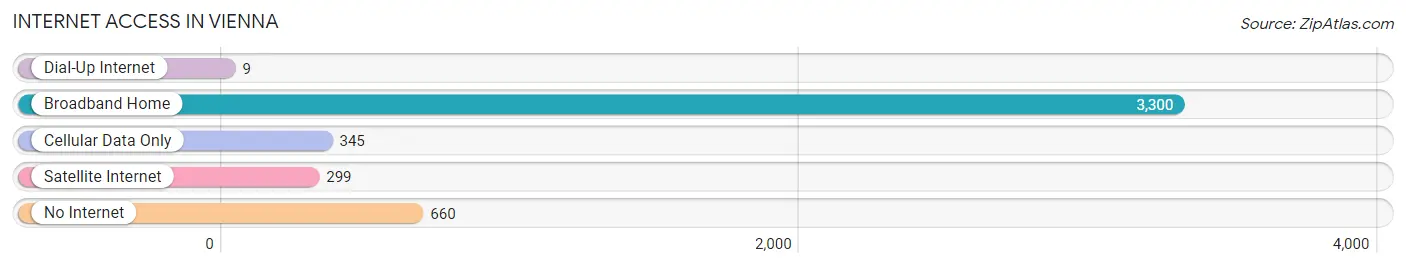
| Internet Type | # Households | % Households |
| Dial-Up Internet | 9 | 0.2% |
| Broadband Home | 3,300 | 73.6% |
| Cellular Data Only | 345 | 7.7% |
| Satellite Internet | 299 | 6.7% |
| No Internet | 660 | 14.7% |
| Total | 4,485 | 100.0% |
Vienna Summary
Vienna, West Virginia is a small city located in Wood County, West Virginia. It is situated along the Ohio River, just south of Parkersburg. Vienna was founded in 1815 and incorporated in 1892. The city has a population of 10,749 as of the 2010 census.
Geography
Vienna is located at 39°17'N 81°25'W (39.28, -81.41). It is situated along the Ohio River, just south of Parkersburg. The city has a total area of 4.2 square miles, all of which is land.
Climate
Vienna has a humid continental climate, with hot summers and cold winters. The average temperature in July is 79°F and the average temperature in January is 28°F. The average annual precipitation is 40.3 inches.
Demographics
As of the 2010 census, Vienna had a population of 10,749. The racial makeup of the city was 94.2% White, 2.7% African American, 0.3% Native American, 0.7% Asian, 0.1% Pacific Islander, 0.7% from other races, and 1.3% from two or more races. Hispanic or Latino of any race were 1.7% of the population.
Economy
Vienna’s economy is largely based on manufacturing and retail. The city is home to several large manufacturing companies, including the Parkersburg-Vienna Industrial Park, which is home to several large companies, including DuPont, Bayer, and PPG Industries. Vienna also has a large retail sector, with several large shopping centers and malls.
The city is also home to several educational institutions, including West Virginia University at Parkersburg, which is a two-year college, and West Virginia University Institute of Technology, which is a four-year college.
History
Vienna was founded in 1815 by a group of settlers from Pennsylvania. The city was named after Vienna, Austria, and was incorporated in 1892.
In the late 19th century, Vienna was a major center of the oil and gas industry. The city was home to several large oil refineries, and was the site of the first oil well in West Virginia.
In the early 20th century, Vienna was a major center of the glass industry. The city was home to several large glass factories, and was the site of the first glass factory in West Virginia.
In the late 20th century, Vienna was a major center of the chemical industry. The city was home to several large chemical plants, and was the site of the first chemical plant in West Virginia.
Today, Vienna is a small city with a diverse economy. The city is home to several large manufacturing companies, as well as a large retail sector. Vienna is also home to several educational institutions, including West Virginia University at Parkersburg and West Virginia University Institute of Technology.
Common Questions
What is Per Capita Income in Vienna?
Per Capita income in Vienna is $37,744.
What is the Median Family Income in Vienna?
Median Family Income in Vienna is $85,721.
What is the Median Household income in Vienna?
Median Household Income in Vienna is $62,979.
What is Income or Wage Gap in Vienna?
Income or Wage Gap in Vienna is 30.1%.
Women in Vienna earn 69.9 cents for every dollar earned by a man.
What is Inequality or Gini Index in Vienna?
Inequality or Gini Index in Vienna is 0.49.
What is the Total Population of Vienna?
Total Population of Vienna is 10,642.
What is the Total Male Population of Vienna?
Total Male Population of Vienna is 4,705.
What is the Total Female Population of Vienna?
Total Female Population of Vienna is 5,937.
What is the Ratio of Males per 100 Females in Vienna?
There are 79.25 Males per 100 Females in Vienna.
What is the Ratio of Females per 100 Males in Vienna?
There are 126.18 Females per 100 Males in Vienna.
What is the Median Population Age in Vienna?
Median Population Age in Vienna is 42.4 Years.
What is the Average Family Size in Vienna
Average Family Size in Vienna is 3.1 People.
What is the Average Household Size in Vienna
Average Household Size in Vienna is 2.4 People.
How Large is the Labor Force in Vienna?
There are 5,152 People in the Labor Forcein in Vienna.
What is the Percentage of People in the Labor Force in Vienna?
60.4% of People are in the Labor Force in Vienna.
What is the Unemployment Rate in Vienna?
Unemployment Rate in Vienna is 5.8%.