Charles Town, WV Map & Demographics
Charles Town Map
Charles Town Overview
$43,384
PER CAPITA INCOME
$112,581
AVG FAMILY INCOME
$83,275
AVG HOUSEHOLD INCOME
49.5%
WAGE / INCOME GAP [ % ]
50.5¢/ $1
WAGE / INCOME GAP [ $ ]
0.41
INEQUALITY / GINI INDEX
6,584
TOTAL POPULATION
3,183
MALE POPULATION
3,401
FEMALE POPULATION
93.59
MALES / 100 FEMALES
106.85
FEMALES / 100 MALES
41.2
MEDIAN AGE
3.0
AVG FAMILY SIZE
2.5
AVG HOUSEHOLD SIZE
3,663
LABOR FORCE [ PEOPLE ]
67.8%
PERCENT IN LABOR FORCE
7.3%
UNEMPLOYMENT RATE
Charles Town Zip Codes
Charles Town Area Codes
Income in Charles Town
Income Overview in Charles Town
Per Capita Income in Charles Town is $43,384, while median incomes of families and households are $112,581 and $83,275 respectively.
| Characteristic | Number | Measure |
| Per Capita Income | 6,584 | $43,384 |
| Median Family Income | 1,604 | $112,581 |
| Mean Family Income | 1,604 | $127,452 |
| Median Household Income | 2,553 | $83,275 |
| Mean Household Income | 2,553 | $107,341 |
| Income Deficit | 1,604 | $0 |
| Wage / Income Gap (%) | 6,584 | 49.50% |
| Wage / Income Gap ($) | 6,584 | 50.50¢ per $1 |
| Gini / Inequality Index | 6,584 | 0.41 |
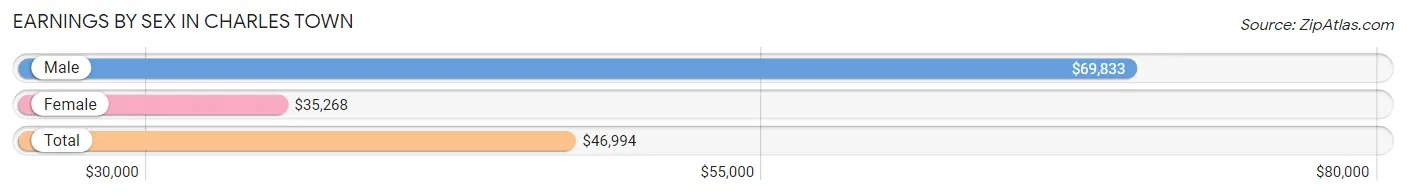
Earnings by Sex in Charles Town
Average Earnings in Charles Town are $46,994, $69,833 for men and $35,268 for women, a difference of 49.5%.
| Sex | Number | Average Earnings |
| Male | 1,994 (54.2%) | $69,833 |
| Female | 1,688 (45.8%) | $35,268 |
| Total | 3,682 (100.0%) | $46,994 |
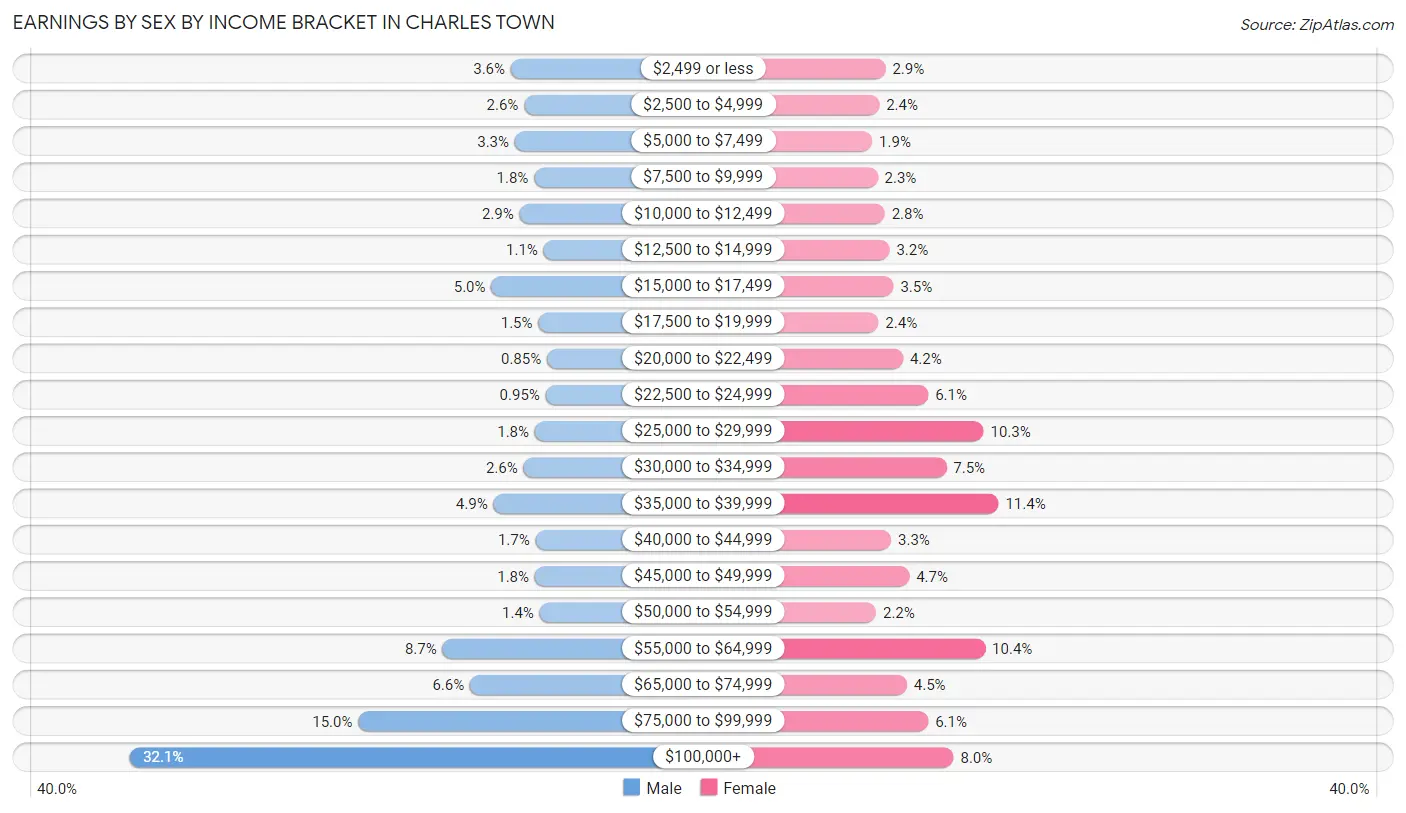
Earnings by Sex by Income Bracket in Charles Town
The most common earnings brackets in Charles Town are $100,000+ for men (640 | 32.1%) and $35,000 to $39,999 for women (192 | 11.4%).
| Income | Male | Female |
| $2,499 or less | 71 (3.6%) | 49 (2.9%) |
| $2,500 to $4,999 | 51 (2.6%) | 41 (2.4%) |
| $5,000 to $7,499 | 65 (3.3%) | 32 (1.9%) |
| $7,500 to $9,999 | 36 (1.8%) | 39 (2.3%) |
| $10,000 to $12,499 | 58 (2.9%) | 48 (2.8%) |
| $12,500 to $14,999 | 22 (1.1%) | 54 (3.2%) |
| $15,000 to $17,499 | 100 (5.0%) | 59 (3.5%) |
| $17,500 to $19,999 | 30 (1.5%) | 40 (2.4%) |
| $20,000 to $22,499 | 17 (0.9%) | 71 (4.2%) |
| $22,500 to $24,999 | 19 (0.9%) | 103 (6.1%) |
| $25,000 to $29,999 | 35 (1.8%) | 173 (10.2%) |
| $30,000 to $34,999 | 52 (2.6%) | 126 (7.5%) |
| $35,000 to $39,999 | 97 (4.9%) | 192 (11.4%) |
| $40,000 to $44,999 | 34 (1.7%) | 56 (3.3%) |
| $45,000 to $49,999 | 35 (1.8%) | 79 (4.7%) |
| $50,000 to $54,999 | 28 (1.4%) | 37 (2.2%) |
| $55,000 to $64,999 | 173 (8.7%) | 175 (10.4%) |
| $65,000 to $74,999 | 132 (6.6%) | 76 (4.5%) |
| $75,000 to $99,999 | 299 (15.0%) | 103 (6.1%) |
| $100,000+ | 640 (32.1%) | 135 (8.0%) |
| Total | 1,994 (100.0%) | 1,688 (100.0%) |
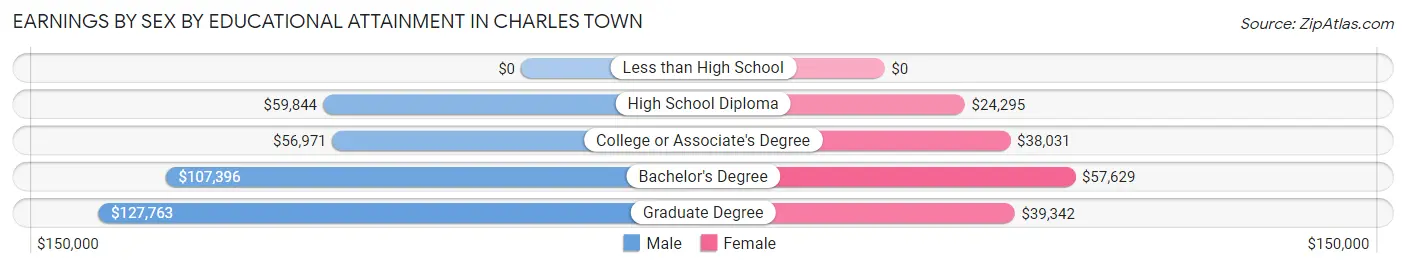
Earnings by Sex by Educational Attainment in Charles Town
Average earnings in Charles Town are $75,458 for men and $37,377 for women, a difference of 50.5%. Men with an educational attainment of graduate degree enjoy the highest average annual earnings of $127,763, while those with college or associate's degree education earn the least with $56,971. Women with an educational attainment of bachelor's degree earn the most with the average annual earnings of $57,629, while those with high school diploma education have the smallest earnings of $24,295.
| Educational Attainment | Male Income | Female Income |
| Less than High School | - | - |
| High School Diploma | $59,844 | $24,295 |
| College or Associate's Degree | $56,971 | $38,031 |
| Bachelor's Degree | $107,396 | $57,629 |
| Graduate Degree | $127,763 | $39,342 |
| Total | $75,458 | $37,377 |
Family Income in Charles Town
Family Income Brackets in Charles Town
According to the Charles Town family income data, there are 337 families falling into the $150,000 to $199,999 income range, which is the most common income bracket and makes up 21.0% of all families.
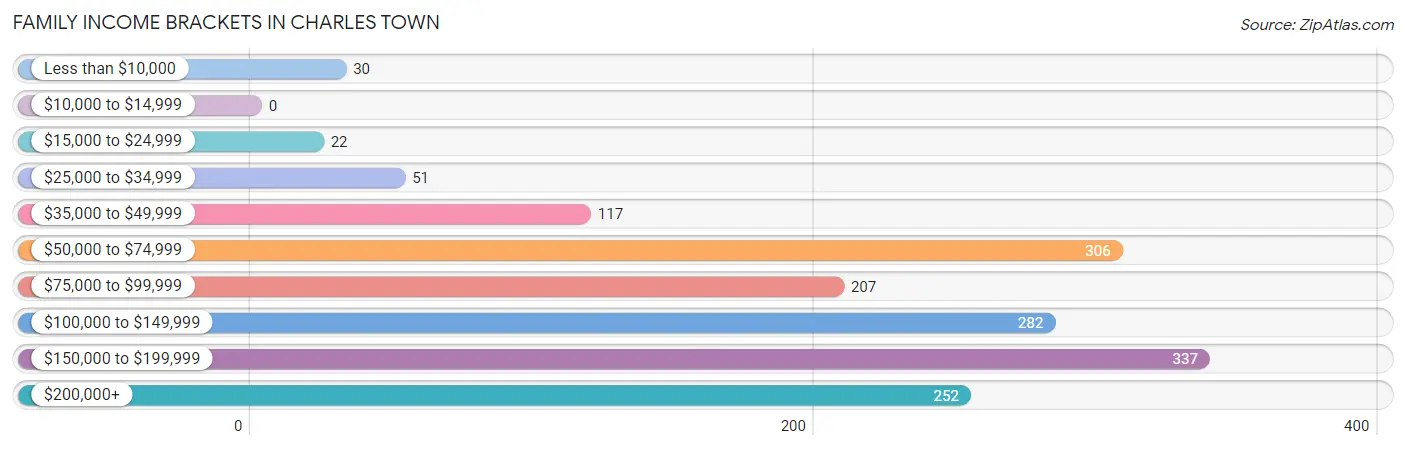
| Income Bracket | # Families | % Families |
| Less than $10,000 | 30 | 1.9% |
| $10,000 to $14,999 | 0 | 0.0% |
| $15,000 to $24,999 | 22 | 1.4% |
| $25,000 to $34,999 | 51 | 3.2% |
| $35,000 to $49,999 | 117 | 7.3% |
| $50,000 to $74,999 | 306 | 19.1% |
| $75,000 to $99,999 | 207 | 12.9% |
| $100,000 to $149,999 | 282 | 17.6% |
| $150,000 to $199,999 | 337 | 21.0% |
| $200,000+ | 252 | 15.7% |
Family Income by Famaliy Size in Charles Town
5-person families (137 | 8.5%) account for the highest median family income in Charles Town with $163,958 per family, while 3-person families (269 | 16.8%) have the highest median income of $50,373 per family member.
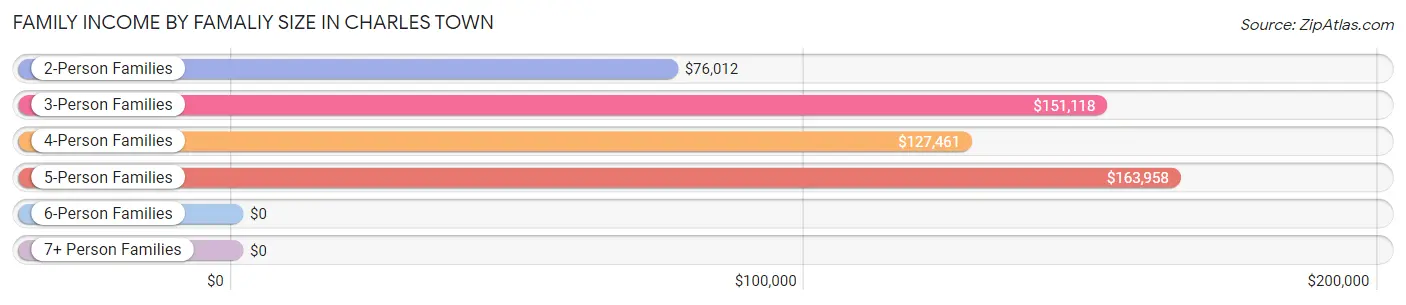
| Income Bracket | # Families | Median Income |
| 2-Person Families | 745 (46.5%) | $76,012 |
| 3-Person Families | 269 (16.8%) | $151,118 |
| 4-Person Families | 413 (25.8%) | $127,461 |
| 5-Person Families | 137 (8.5%) | $163,958 |
| 6-Person Families | 28 (1.8%) | $0 |
| 7+ Person Families | 12 (0.7%) | $0 |
| Total | 1,604 (100.0%) | $112,581 |
Family Income by Number of Earners in Charles Town
The median family income in Charles Town is $112,581, with families comprising 3+ earners (131) having the highest median family income of $189,821, while families with 1 earner (550) have the lowest median family income of $90,000, accounting for 8.2% and 34.3% of families, respectively.
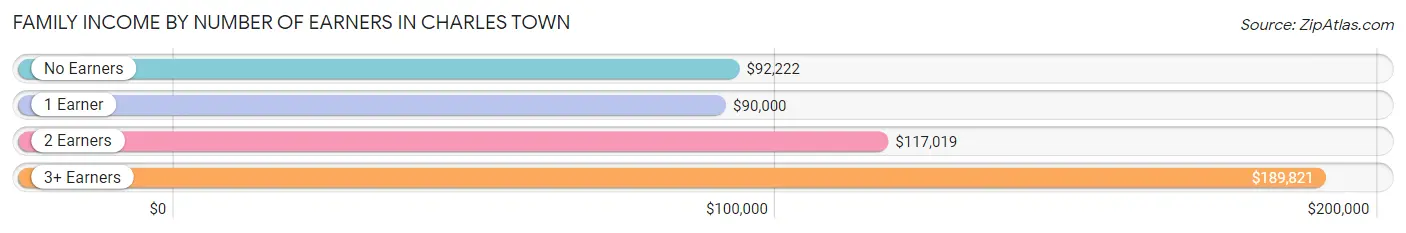
| Number of Earners | # Families | Median Income |
| No Earners | 118 (7.4%) | $92,222 |
| 1 Earner | 550 (34.3%) | $90,000 |
| 2 Earners | 805 (50.2%) | $117,019 |
| 3+ Earners | 131 (8.2%) | $189,821 |
| Total | 1,604 (100.0%) | $112,581 |
Household Income in Charles Town
Household Income Brackets in Charles Town
With 447 households falling in the category, the $50,000 to $74,999 income range is the most frequent in Charles Town, accounting for 17.5% of all households. In contrast, only 77 households (3.0%) fall into the $25,000 to $34,999 income bracket, making it the least populous group.
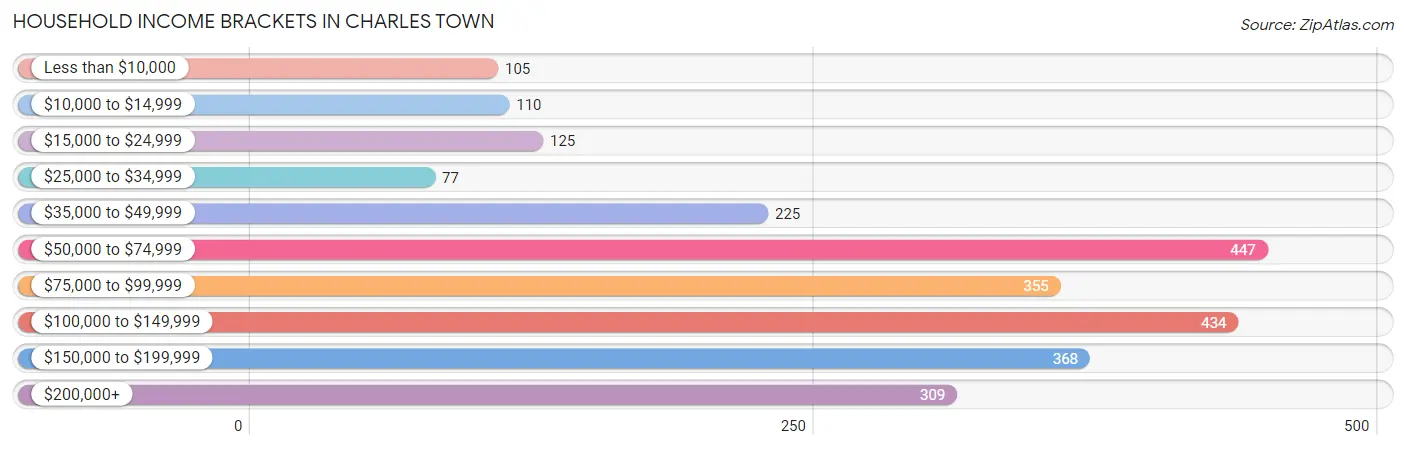
| Income Bracket | # Households | % Households |
| Less than $10,000 | 105 | 4.1% |
| $10,000 to $14,999 | 110 | 4.3% |
| $15,000 to $24,999 | 125 | 4.9% |
| $25,000 to $34,999 | 77 | 3.0% |
| $35,000 to $49,999 | 225 | 8.8% |
| $50,000 to $74,999 | 447 | 17.5% |
| $75,000 to $99,999 | 355 | 13.9% |
| $100,000 to $149,999 | 434 | 17.0% |
| $150,000 to $199,999 | 368 | 14.4% |
| $200,000+ | 309 | 12.1% |
Household Income by Householder Age in Charles Town
The median household income in Charles Town is $83,275, with the highest median household income of $117,212 found in the 25 to 44 years age bracket for the primary householder. A total of 917 households (35.9%) fall into this category. Meanwhile, the 15 to 24 years age bracket for the primary householder has the lowest median household income of $61,635, with 25 households (1.0%) in this group.
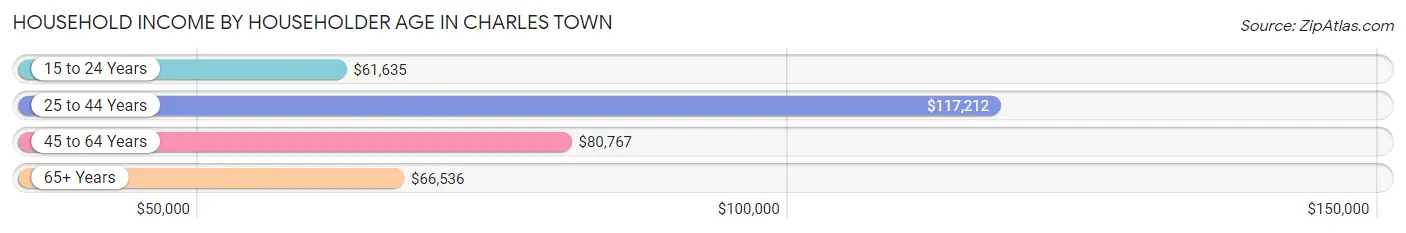
| Income Bracket | # Households | Median Income |
| 15 to 24 Years | 25 (1.0%) | $61,635 |
| 25 to 44 Years | 917 (35.9%) | $117,212 |
| 45 to 64 Years | 990 (38.8%) | $80,767 |
| 65+ Years | 621 (24.3%) | $66,536 |
| Total | 2,553 (100.0%) | $83,275 |
Poverty in Charles Town
Income Below Poverty by Sex and Age in Charles Town
With 4.8% poverty level for males and 5.8% for females among the residents of Charles Town, 15 year old males and 16 and 17 year old females are the most vulnerable to poverty, with 10 males (27.0%) and 22 females (14.4%) in their respective age groups living below the poverty level.
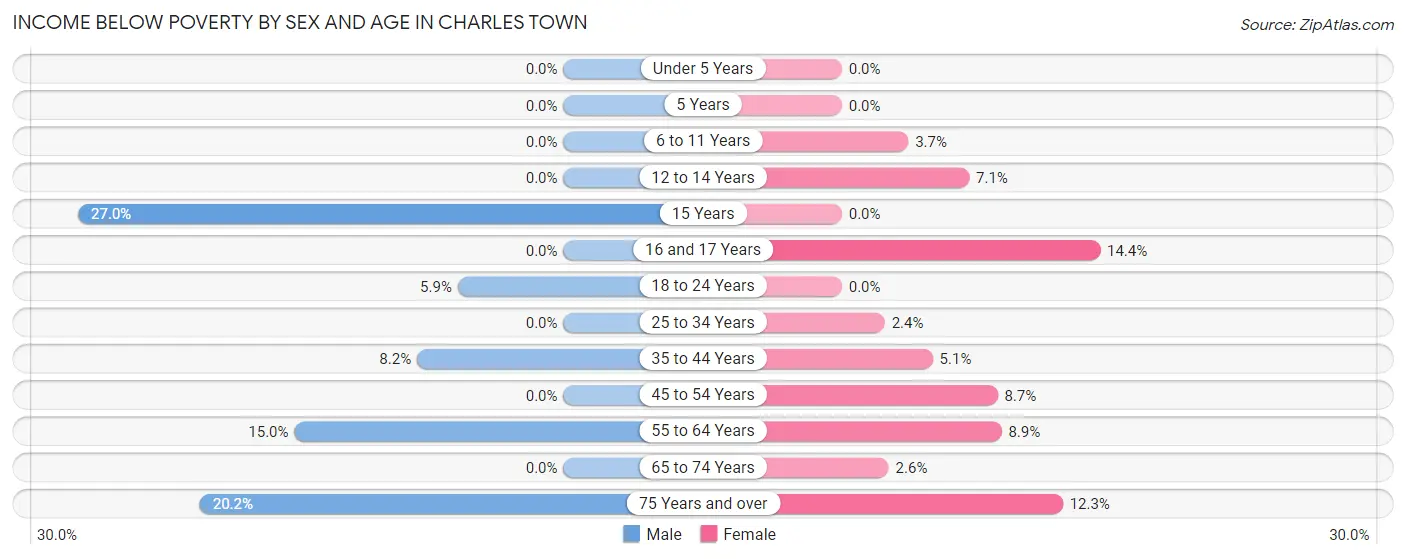
| Age Bracket | Male | Female |
| Under 5 Years | 0 (0.0%) | 0 (0.0%) |
| 5 Years | 0 (0.0%) | 0 (0.0%) |
| 6 to 11 Years | 0 (0.0%) | 9 (3.7%) |
| 12 to 14 Years | 0 (0.0%) | 10 (7.1%) |
| 15 Years | 10 (27.0%) | 0 (0.0%) |
| 16 and 17 Years | 0 (0.0%) | 22 (14.4%) |
| 18 to 24 Years | 8 (5.9%) | 0 (0.0%) |
| 25 to 34 Years | 0 (0.0%) | 10 (2.4%) |
| 35 to 44 Years | 47 (8.2%) | 27 (5.1%) |
| 45 to 54 Years | 0 (0.0%) | 39 (8.7%) |
| 55 to 64 Years | 49 (15.0%) | 41 (8.9%) |
| 65 to 74 Years | 0 (0.0%) | 11 (2.6%) |
| 75 Years and over | 34 (20.2%) | 23 (12.3%) |
| Total | 148 (4.8%) | 192 (5.8%) |
Income Above Poverty by Sex and Age in Charles Town
According to the poverty statistics in Charles Town, males aged under 5 years and females aged under 5 years are the age groups that are most secure financially, with 100.0% of males and 100.0% of females in these age groups living above the poverty line.
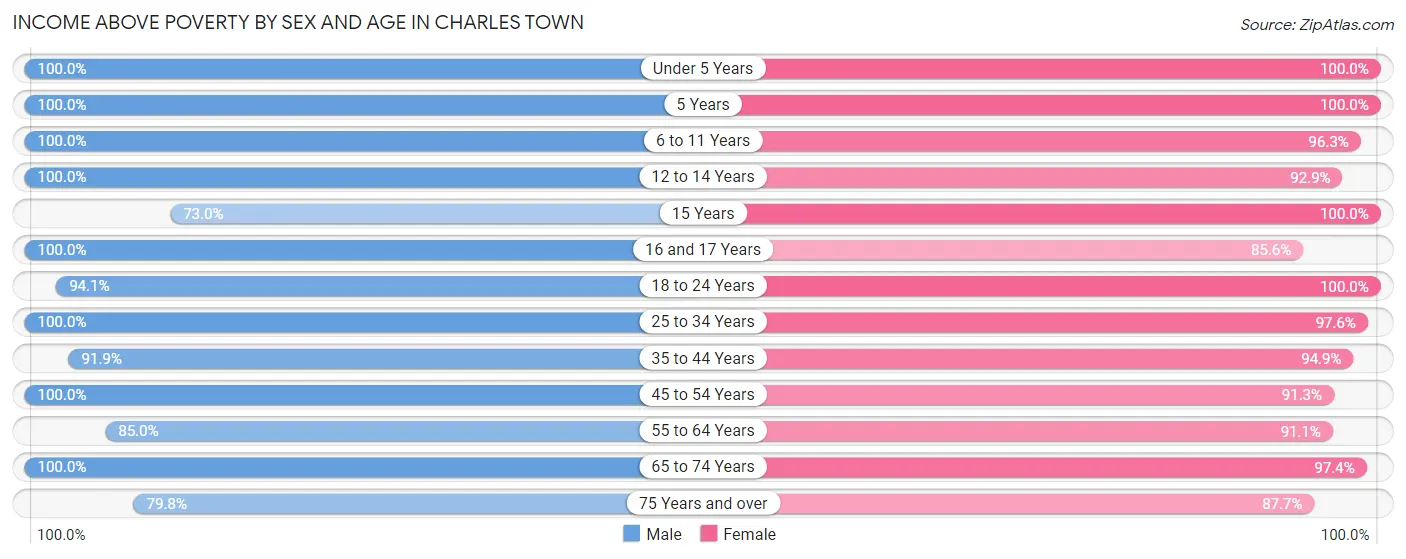
| Age Bracket | Male | Female |
| Under 5 Years | 107 (100.0%) | 90 (100.0%) |
| 5 Years | 34 (100.0%) | 28 (100.0%) |
| 6 to 11 Years | 278 (100.0%) | 234 (96.3%) |
| 12 to 14 Years | 115 (100.0%) | 131 (92.9%) |
| 15 Years | 27 (73.0%) | 25 (100.0%) |
| 16 and 17 Years | 93 (100.0%) | 131 (85.6%) |
| 18 to 24 Years | 128 (94.1%) | 136 (100.0%) |
| 25 to 34 Years | 408 (100.0%) | 408 (97.6%) |
| 35 to 44 Years | 530 (91.8%) | 507 (94.9%) |
| 45 to 54 Years | 519 (100.0%) | 411 (91.3%) |
| 55 to 64 Years | 278 (85.0%) | 420 (91.1%) |
| 65 to 74 Years | 312 (100.0%) | 411 (97.4%) |
| 75 Years and over | 134 (79.8%) | 164 (87.7%) |
| Total | 2,963 (95.2%) | 3,096 (94.2%) |
Income Below Poverty Among Married-Couple Families in Charles Town
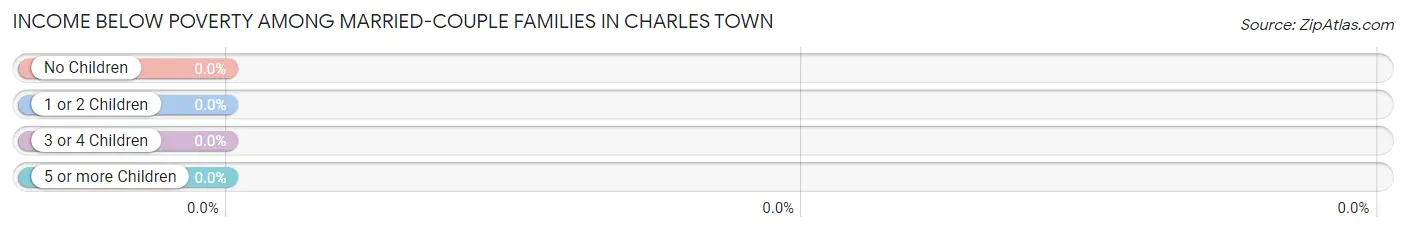
| Children | Above Poverty | Below Poverty |
| No Children | 556 (100.0%) | 0 (0.0%) |
| 1 or 2 Children | 578 (100.0%) | 0 (0.0%) |
| 3 or 4 Children | 78 (100.0%) | 0 (0.0%) |
| 5 or more Children | 12 (100.0%) | 0 (0.0%) |
| Total | 1,224 (100.0%) | 0 (0.0%) |
Income Below Poverty Among Single-Parent Households in Charles Town
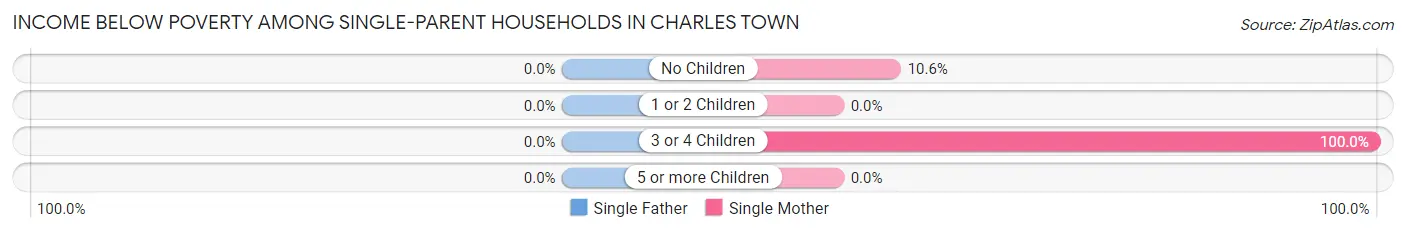
| Children | Single Father | Single Mother |
| No Children | 0 (0.0%) | 17 (10.6%) |
| 1 or 2 Children | 0 (0.0%) | 0 (0.0%) |
| 3 or 4 Children | 0 (0.0%) | 13 (100.0%) |
| 5 or more Children | 0 (0.0%) | 0 (0.0%) |
| Total | 0 (0.0%) | 30 (12.4%) |
Income Below Poverty Among Married-Couple vs Single-Parent Households in Charles Town
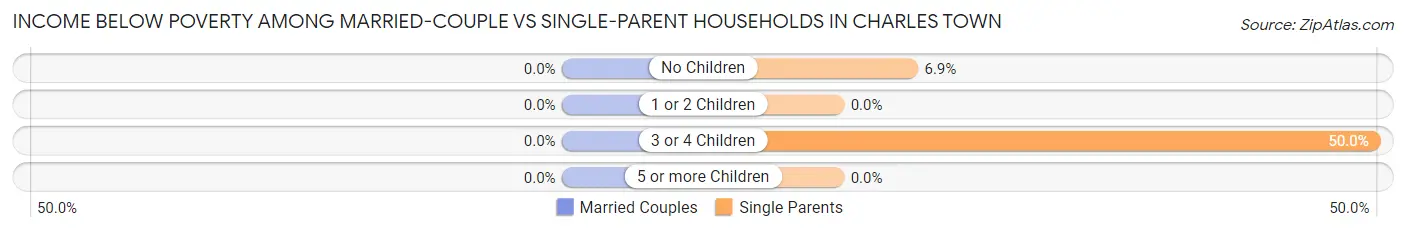
| Children | Married-Couple Families | Single-Parent Households |
| No Children | 0 (0.0%) | 17 (6.9%) |
| 1 or 2 Children | 0 (0.0%) | 0 (0.0%) |
| 3 or 4 Children | 0 (0.0%) | 13 (50.0%) |
| 5 or more Children | 0 (0.0%) | 0 (0.0%) |
| Total | 0 (0.0%) | 30 (7.9%) |
Race in Charles Town
The most populous races in Charles Town are White / Caucasian (4,912 | 74.6%), Black / African American (947 | 14.4%), and Hispanic or Latino (586 | 8.9%).
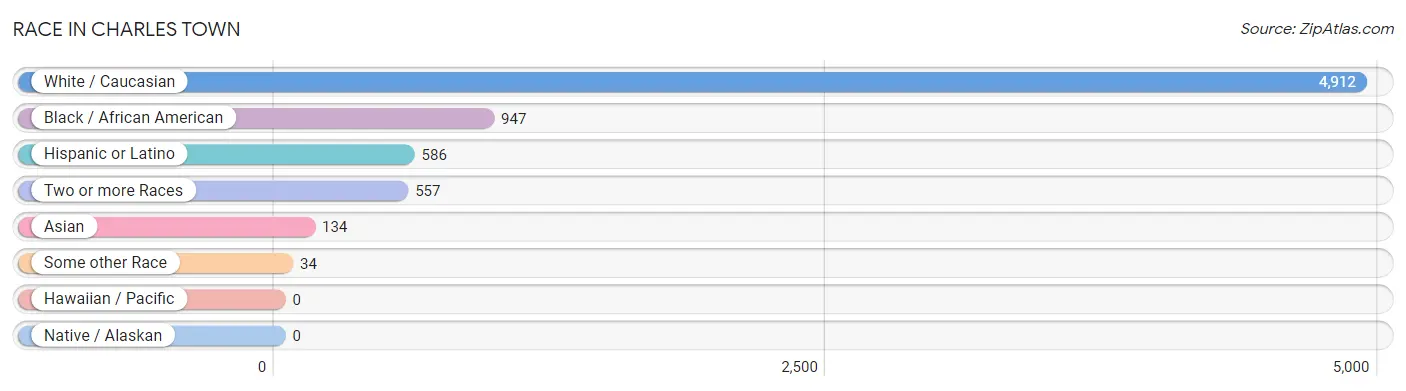
| Race | # Population | % Population |
| Asian | 134 | 2.0% |
| Black / African American | 947 | 14.4% |
| Hawaiian / Pacific | 0 | 0.0% |
| Hispanic or Latino | 586 | 8.9% |
| Native / Alaskan | 0 | 0.0% |
| White / Caucasian | 4,912 | 74.6% |
| Two or more Races | 557 | 8.5% |
| Some other Race | 34 | 0.5% |
| Total | 6,584 | 100.0% |
Ancestry in Charles Town
The most populous ancestries reported in Charles Town are German (1,273 | 19.3%), English (986 | 15.0%), Irish (853 | 13.0%), American (530 | 8.1%), and Italian (368 | 5.6%), together accounting for 60.9% of all Charles Town residents.
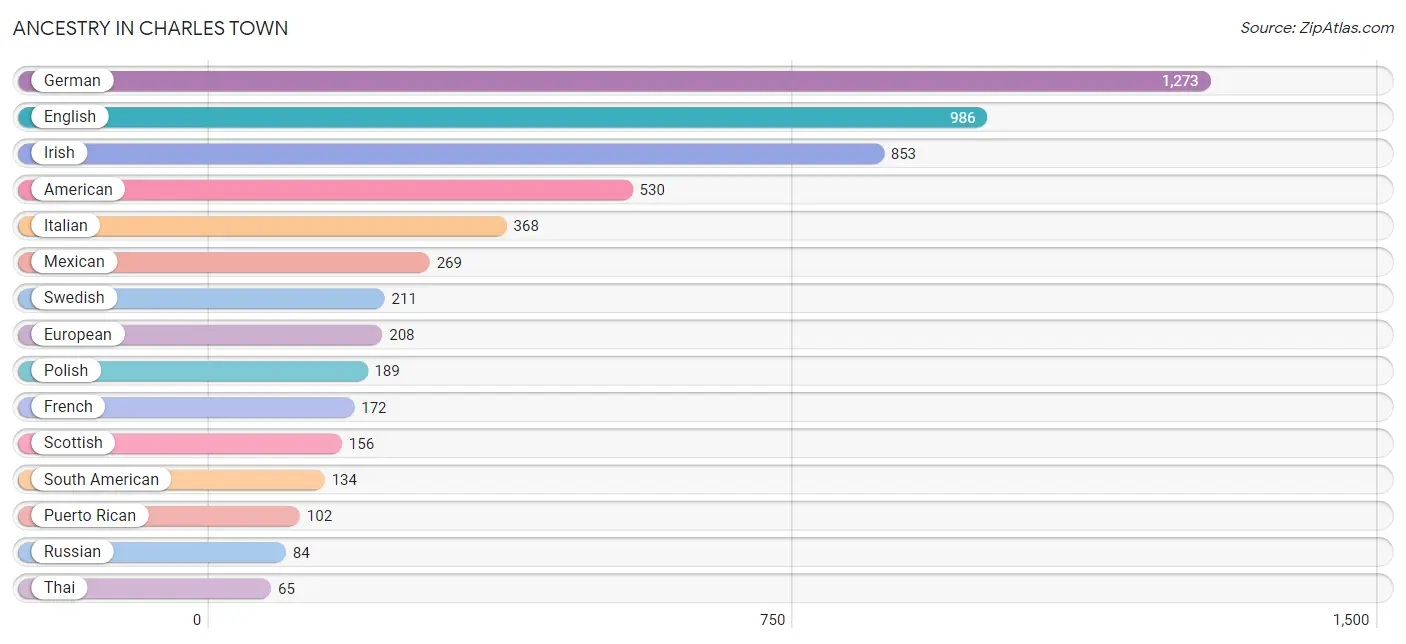
| Ancestry | # Population | % Population |
| African | 36 | 0.5% |
| American | 530 | 8.1% |
| Arab | 29 | 0.4% |
| Austrian | 26 | 0.4% |
| Bhutanese | 13 | 0.2% |
| British | 27 | 0.4% |
| Burmese | 8 | 0.1% |
| Canadian | 43 | 0.6% |
| Celtic | 28 | 0.4% |
| Central American | 41 | 0.6% |
| Central American Indian | 50 | 0.8% |
| Cherokee | 10 | 0.2% |
| Chickasaw | 4 | 0.1% |
| Colombian | 20 | 0.3% |
| Cuban | 40 | 0.6% |
| Czech | 12 | 0.2% |
| Danish | 20 | 0.3% |
| Dutch | 29 | 0.4% |
| Eastern European | 46 | 0.7% |
| Ecuadorian | 55 | 0.8% |
| English | 986 | 15.0% |
| European | 208 | 3.2% |
| French | 172 | 2.6% |
| French Canadian | 57 | 0.9% |
| German | 1,273 | 19.3% |
| Greek | 23 | 0.4% |
| Guatemalan | 8 | 0.1% |
| Haitian | 29 | 0.4% |
| Indian (Asian) | 13 | 0.2% |
| Inupiat | 4 | 0.1% |
| Irish | 853 | 13.0% |
| Italian | 368 | 5.6% |
| Korean | 59 | 0.9% |
| Latvian | 13 | 0.2% |
| Lebanese | 29 | 0.4% |
| Mexican | 269 | 4.1% |
| Navajo | 4 | 0.1% |
| Nigerian | 23 | 0.4% |
| Norwegian | 57 | 0.9% |
| Pakistani | 8 | 0.1% |
| Peruvian | 40 | 0.6% |
| Polish | 189 | 2.9% |
| Puerto Rican | 102 | 1.5% |
| Russian | 84 | 1.3% |
| Salvadoran | 33 | 0.5% |
| Scotch-Irish | 57 | 0.9% |
| Scottish | 156 | 2.4% |
| Slovak | 6 | 0.1% |
| South American | 134 | 2.0% |
| Subsaharan African | 60 | 0.9% |
| Swedish | 211 | 3.2% |
| Swiss | 8 | 0.1% |
| Thai | 65 | 1.0% |
| Ukrainian | 14 | 0.2% |
| Uruguayan | 12 | 0.2% |
| Venezuelan | 7 | 0.1% |
| Vietnamese | 58 | 0.9% |
| Welsh | 42 | 0.6% | View All 58 Rows |
Immigrants in Charles Town
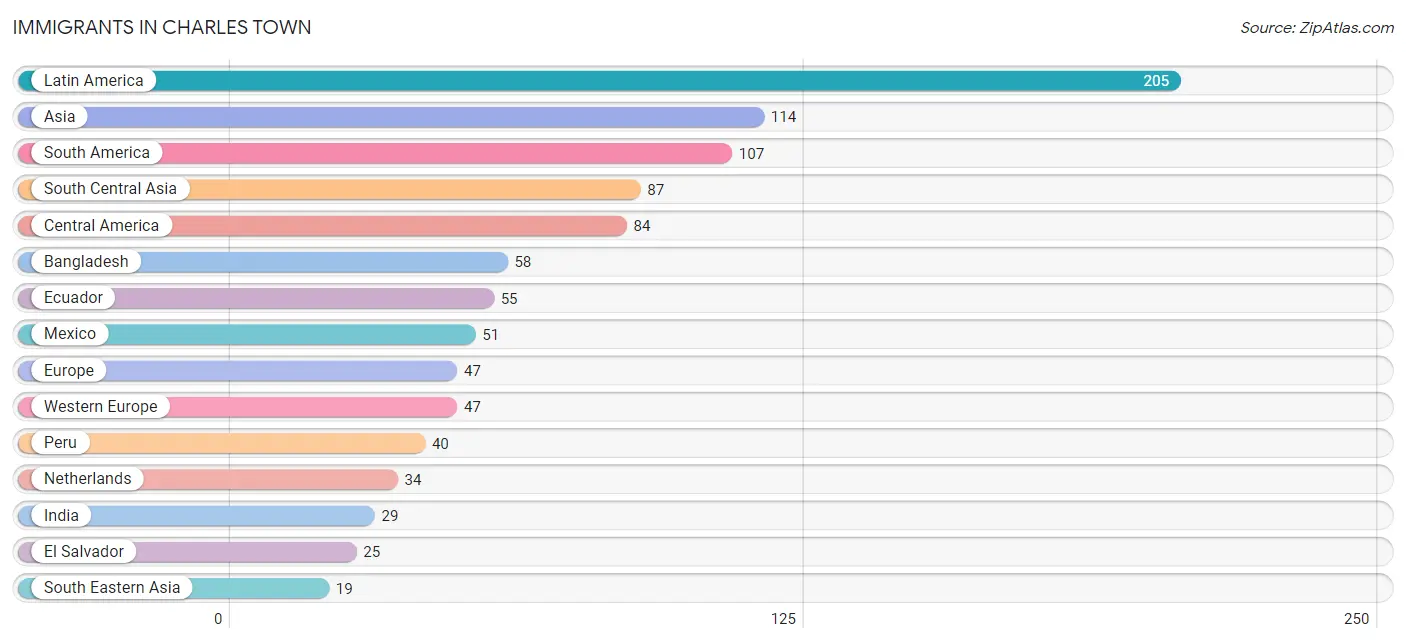
The most numerous immigrant groups reported in Charles Town came from Latin America (205 | 3.1%), Asia (114 | 1.7%), South America (107 | 1.6%), South Central Asia (87 | 1.3%), and Central America (84 | 1.3%), together accounting for 9.1% of all Charles Town residents.
| Immigration Origin | # Population | % Population |
| Africa | 10 | 0.2% |
| Asia | 114 | 1.7% |
| Bangladesh | 58 | 0.9% |
| Caribbean | 14 | 0.2% |
| Central America | 84 | 1.3% |
| Cuba | 14 | 0.2% |
| Eastern Asia | 8 | 0.1% |
| Ecuador | 55 | 0.8% |
| El Salvador | 25 | 0.4% |
| Europe | 47 | 0.7% |
| France | 13 | 0.2% |
| Guatemala | 8 | 0.1% |
| India | 29 | 0.4% |
| Korea | 8 | 0.1% |
| Latin America | 205 | 3.1% |
| Mexico | 51 | 0.8% |
| Netherlands | 34 | 0.5% |
| Nigeria | 9 | 0.1% |
| Peru | 40 | 0.6% |
| Philippines | 11 | 0.2% |
| South America | 107 | 1.6% |
| South Central Asia | 87 | 1.3% |
| South Eastern Asia | 19 | 0.3% |
| Thailand | 8 | 0.1% |
| Uruguay | 12 | 0.2% |
| Western Africa | 9 | 0.1% |
| Western Europe | 47 | 0.7% | View All 27 Rows |
Sex and Age in Charles Town
Sex and Age in Charles Town
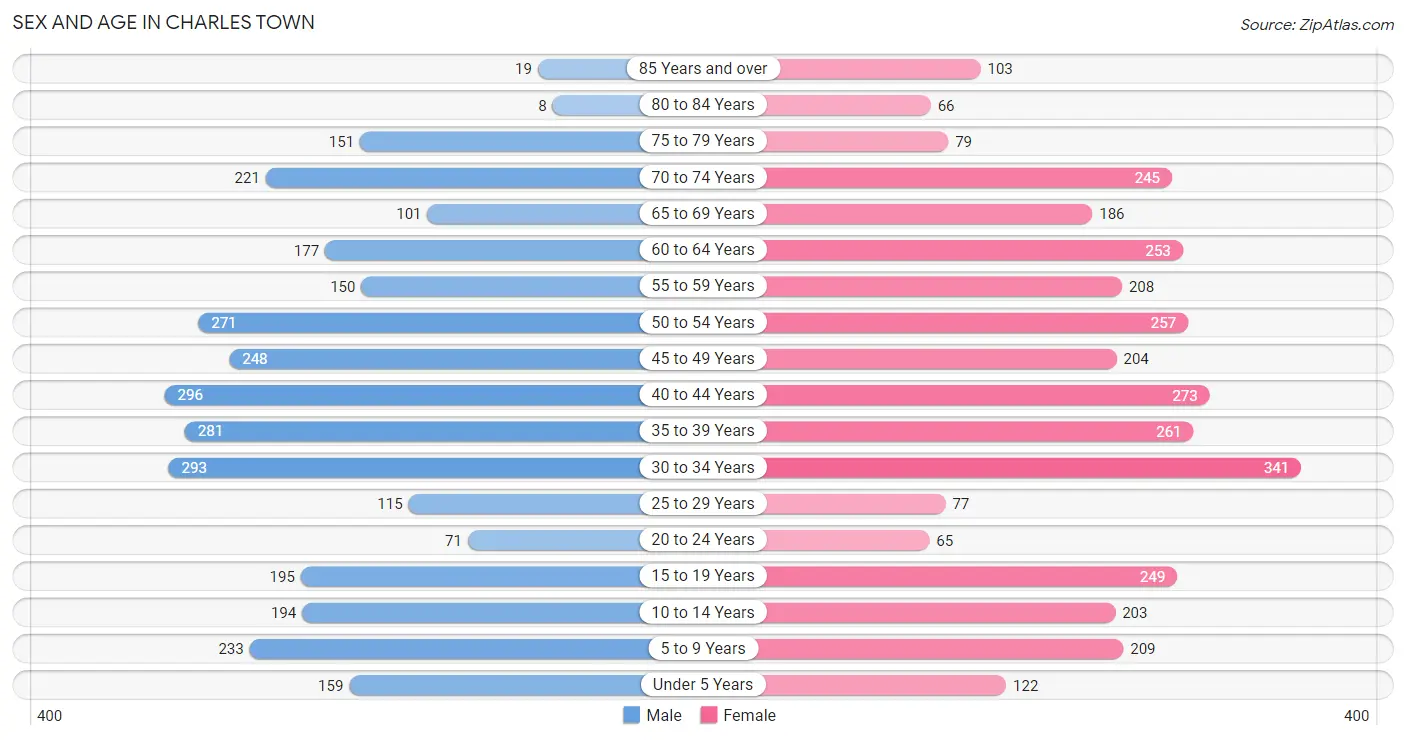
The most populous age groups in Charles Town are 40 to 44 Years (296 | 9.3%) for men and 30 to 34 Years (341 | 10.0%) for women.
| Age Bracket | Male | Female |
| Under 5 Years | 159 (5.0%) | 122 (3.6%) |
| 5 to 9 Years | 233 (7.3%) | 209 (6.1%) |
| 10 to 14 Years | 194 (6.1%) | 203 (6.0%) |
| 15 to 19 Years | 195 (6.1%) | 249 (7.3%) |
| 20 to 24 Years | 71 (2.2%) | 65 (1.9%) |
| 25 to 29 Years | 115 (3.6%) | 77 (2.3%) |
| 30 to 34 Years | 293 (9.2%) | 341 (10.0%) |
| 35 to 39 Years | 281 (8.8%) | 261 (7.7%) |
| 40 to 44 Years | 296 (9.3%) | 273 (8.0%) |
| 45 to 49 Years | 248 (7.8%) | 204 (6.0%) |
| 50 to 54 Years | 271 (8.5%) | 257 (7.6%) |
| 55 to 59 Years | 150 (4.7%) | 208 (6.1%) |
| 60 to 64 Years | 177 (5.6%) | 253 (7.4%) |
| 65 to 69 Years | 101 (3.2%) | 186 (5.5%) |
| 70 to 74 Years | 221 (6.9%) | 245 (7.2%) |
| 75 to 79 Years | 151 (4.7%) | 79 (2.3%) |
| 80 to 84 Years | 8 (0.3%) | 66 (1.9%) |
| 85 Years and over | 19 (0.6%) | 103 (3.0%) |
| Total | 3,183 (100.0%) | 3,401 (100.0%) |
Families and Households in Charles Town
Median Family Size in Charles Town
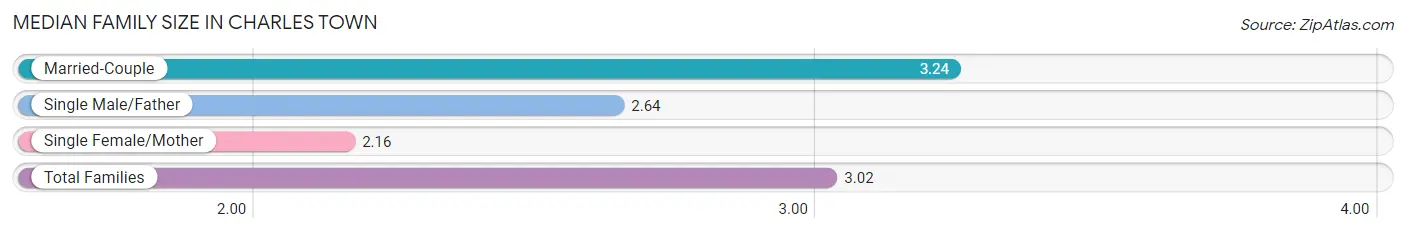
The median family size in Charles Town is 3.02 persons per family, with married-couple families (1,224 | 76.3%) accounting for the largest median family size of 3.24 persons per family. On the other hand, single female/mother families (241 | 15.0%) represent the smallest median family size with 2.16 persons per family.
| Family Type | # Families | Family Size |
| Married-Couple | 1,224 (76.3%) | 3.24 |
| Single Male/Father | 139 (8.7%) | 2.64 |
| Single Female/Mother | 241 (15.0%) | 2.16 |
| Total Families | 1,604 (100.0%) | 3.02 |
Median Household Size in Charles Town
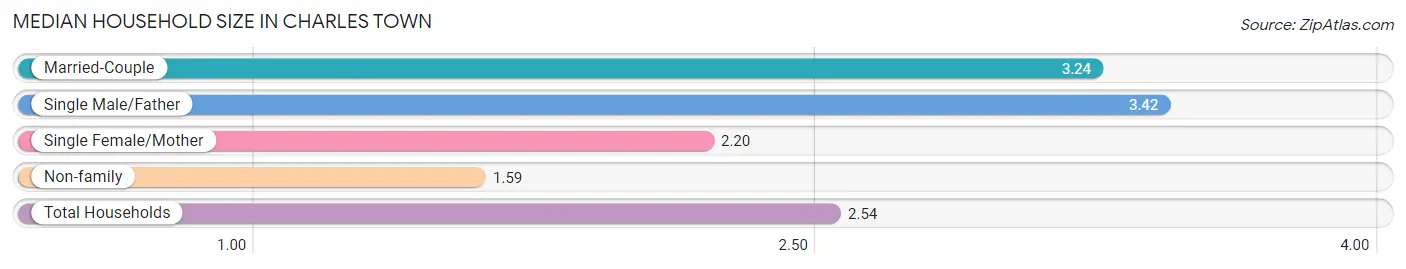
The median household size in Charles Town is 2.54 persons per household, with single male/father households (139 | 5.4%) accounting for the largest median household size of 3.42 persons per household. non-family households (949 | 37.2%) represent the smallest median household size with 1.59 persons per household.
| Household Type | # Households | Household Size |
| Married-Couple | 1,224 (47.9%) | 3.24 |
| Single Male/Father | 139 (5.4%) | 3.42 |
| Single Female/Mother | 241 (9.4%) | 2.20 |
| Non-family | 949 (37.2%) | 1.59 |
| Total Households | 2,553 (100.0%) | 2.54 |
Household Size by Marriage Status in Charles Town
Out of a total of 2,553 households in Charles Town, 1,604 (62.8%) are family households, while 949 (37.2%) are nonfamily households. The most numerous type of family households are 2-person households, comprising 693, and the most common type of nonfamily households are 1-person households, comprising 717.
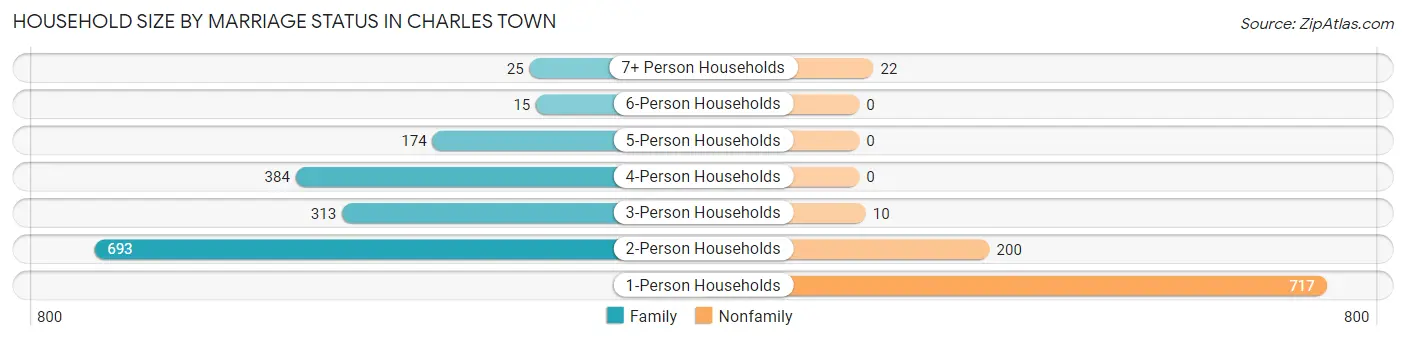
| Household Size | Family Households | Nonfamily Households |
| 1-Person Households | - | 717 (28.1%) |
| 2-Person Households | 693 (27.1%) | 200 (7.8%) |
| 3-Person Households | 313 (12.3%) | 10 (0.4%) |
| 4-Person Households | 384 (15.0%) | 0 (0.0%) |
| 5-Person Households | 174 (6.8%) | 0 (0.0%) |
| 6-Person Households | 15 (0.6%) | 0 (0.0%) |
| 7+ Person Households | 25 (1.0%) | 22 (0.9%) |
| Total | 1,604 (62.8%) | 949 (37.2%) |
Female Fertility in Charles Town
Fertility by Age in Charles Town
Average fertility rate in Charles Town is 60.0 births per 1,000 women. Women in the age bracket of 15 to 19 years have the highest fertility rate with 133.0 births per 1,000 women. Women in the age bracket of 20 to 34 years acount for 53.9% of all women with births.
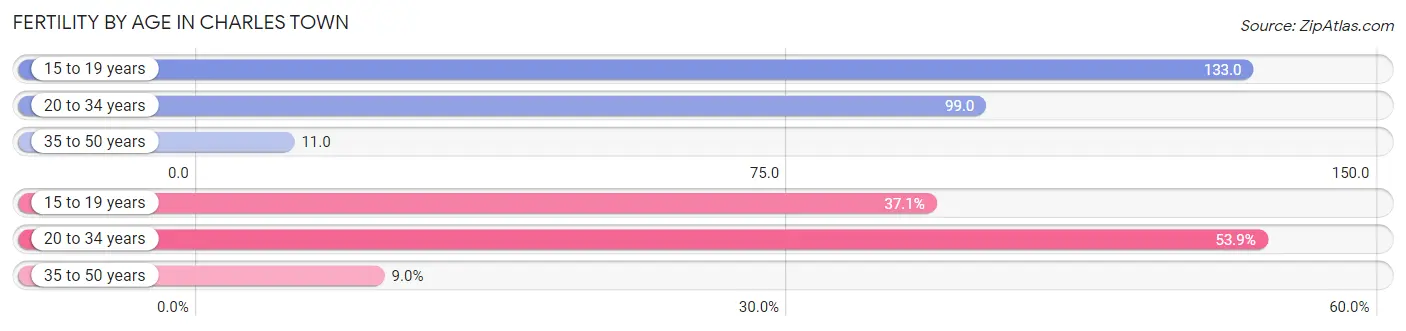
| Age Bracket | Women with Births | Births / 1,000 Women |
| 15 to 19 years | 33 (37.1%) | 133.0 |
| 20 to 34 years | 48 (53.9%) | 99.0 |
| 35 to 50 years | 8 (9.0%) | 11.0 |
| Total | 89 (100.0%) | 60.0 |
Fertility by Age by Marriage Status in Charles Town
53.9% of women with births (89) in Charles Town are married. The highest percentage of unmarried women with births falls into 15 to 19 years age bracket with 100.0% of them unmarried at the time of birth, while the lowest percentage of unmarried women with births belong to 20 to 34 years age bracket with 0.0% of them unmarried.
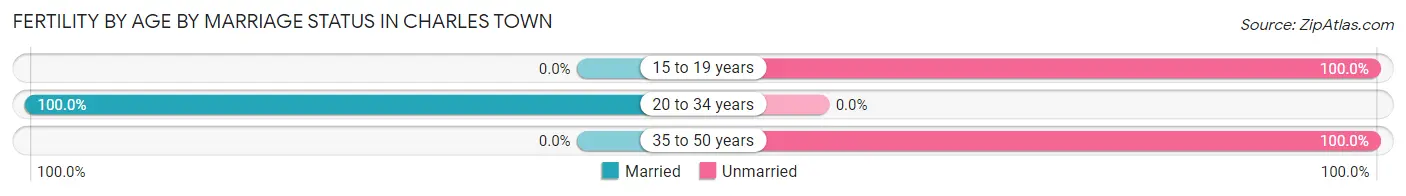
| Age Bracket | Married | Unmarried |
| 15 to 19 years | 0 (0.0%) | 33 (100.0%) |
| 20 to 34 years | 48 (100.0%) | 0 (0.0%) |
| 35 to 50 years | 0 (0.0%) | 8 (100.0%) |
| Total | 48 (53.9%) | 41 (46.1%) |
Fertility by Education in Charles Town
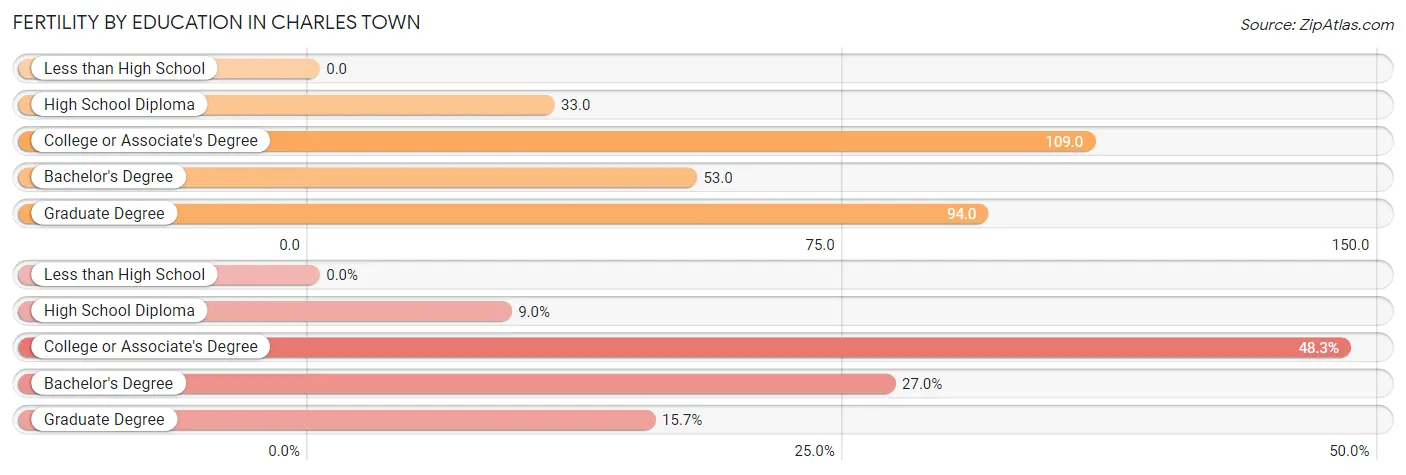
| Educational Attainment | Women with Births | Births / 1,000 Women |
| Less than High School | 0 (0.0%) | 0.0 |
| High School Diploma | 8 (9.0%) | 33.0 |
| College or Associate's Degree | 43 (48.3%) | 109.0 |
| Bachelor's Degree | 24 (27.0%) | 53.0 |
| Graduate Degree | 14 (15.7%) | 94.0 |
| Total | 89 (100.0%) | 60.0 |
Fertility by Education by Marriage Status in Charles Town
46.1% of women with births in Charles Town are unmarried. Women with the educational attainment of bachelor's degree are most likely to be married with 100.0% of them married at childbirth, while women with the educational attainment of high school diploma are least likely to be married with 100.0% of them unmarried at childbirth.
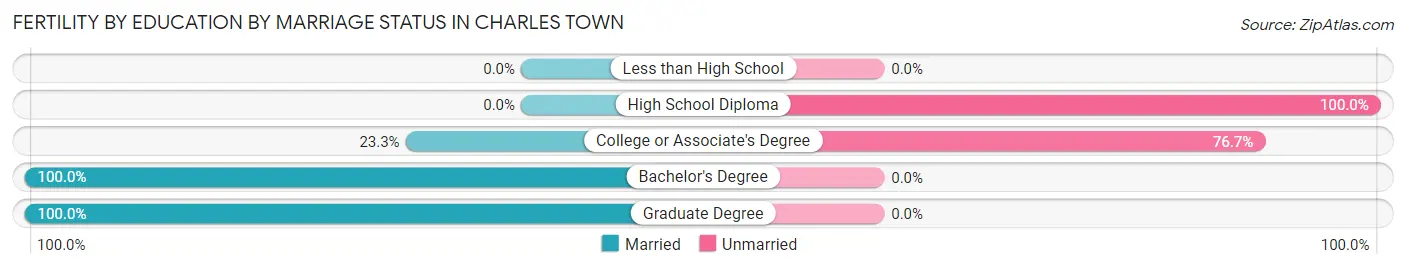
| Educational Attainment | Married | Unmarried |
| Less than High School | 0 (0.0%) | 0 (0.0%) |
| High School Diploma | 0 (0.0%) | 8 (100.0%) |
| College or Associate's Degree | 10 (23.3%) | 33 (76.7%) |
| Bachelor's Degree | 24 (100.0%) | 0 (0.0%) |
| Graduate Degree | 14 (100.0%) | 0 (0.0%) |
| Total | 48 (53.9%) | 41 (46.1%) |
Employment Characteristics in Charles Town
Employment by Class of Employer in Charles Town
Among the 3,245 employed individuals in Charles Town, private company employees (2,138 | 65.9%), federal government employees (369 | 11.4%), and local government employees (249 | 7.7%) make up the most common classes of employment.
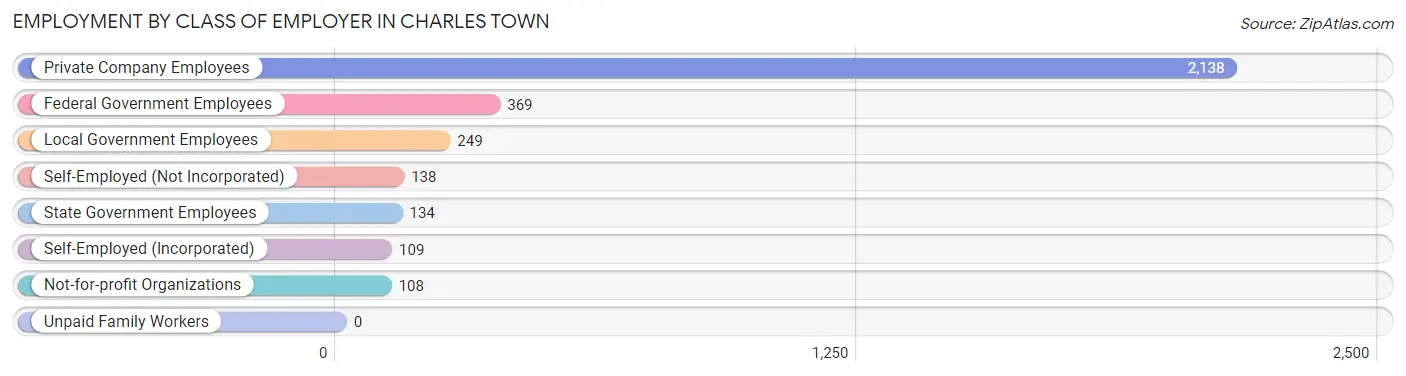
| Employer Class | # Employees | % Employees |
| Private Company Employees | 2,138 | 65.9% |
| Self-Employed (Incorporated) | 109 | 3.4% |
| Self-Employed (Not Incorporated) | 138 | 4.3% |
| Not-for-profit Organizations | 108 | 3.3% |
| Local Government Employees | 249 | 7.7% |
| State Government Employees | 134 | 4.1% |
| Federal Government Employees | 369 | 11.4% |
| Unpaid Family Workers | 0 | 0.0% |
| Total | 3,245 | 100.0% |
Employment Status by Age in Charles Town
According to the labor force statistics for Charles Town, out of the total population over 16 years of age (5,402), 67.8% or 3,663 individuals are in the labor force, with 7.3% or 267 of them unemployed. The age group with the highest labor force participation rate is 25 to 29 years, with 89.1% or 171 individuals in the labor force. Within the labor force, the 16 to 19 years age range has the highest percentage of unemployed individuals, with 21.7% or 40 of them being unemployed.
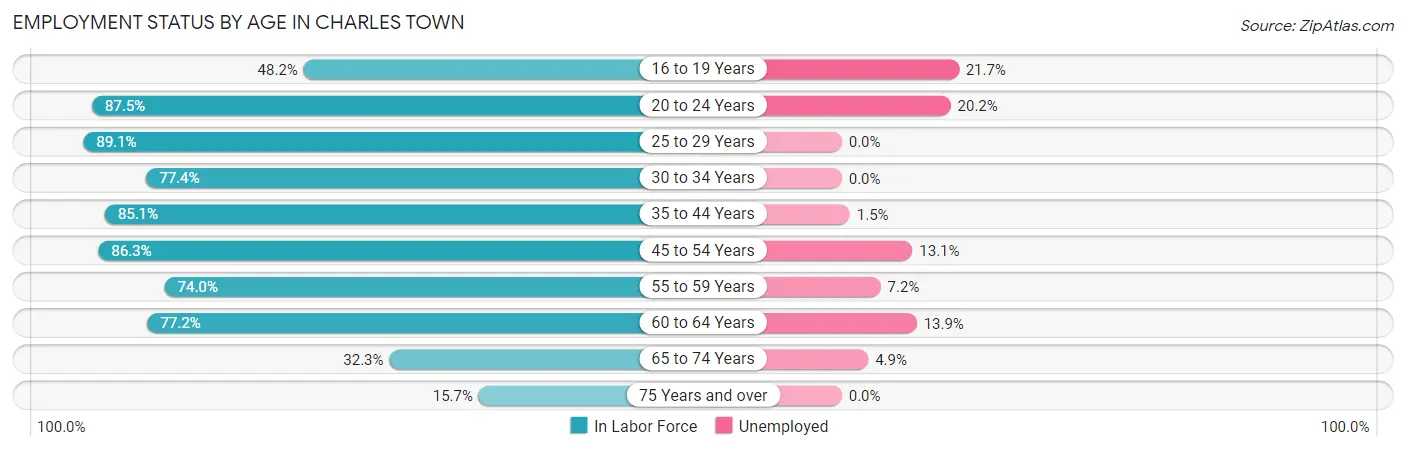
| Age Bracket | In Labor Force | Unemployed |
| 16 to 19 Years | 184 (48.2%) | 40 (21.7%) |
| 20 to 24 Years | 119 (87.5%) | 24 (20.2%) |
| 25 to 29 Years | 171 (89.1%) | 0 (0.0%) |
| 30 to 34 Years | 491 (77.4%) | 0 (0.0%) |
| 35 to 44 Years | 945 (85.1%) | 14 (1.5%) |
| 45 to 54 Years | 846 (86.3%) | 111 (13.1%) |
| 55 to 59 Years | 265 (74.0%) | 19 (7.2%) |
| 60 to 64 Years | 332 (77.2%) | 46 (13.9%) |
| 65 to 74 Years | 243 (32.3%) | 12 (4.9%) |
| 75 Years and over | 67 (15.7%) | 0 (0.0%) |
| Total | 3,663 (67.8%) | 267 (7.3%) |
Employment Status by Educational Attainment in Charles Town
According to labor force statistics for Charles Town, 82.3% of individuals (3,049) out of the total population between 25 and 64 years of age (3,705) are in the labor force, with 6.2% or 189 of them being unemployed. The group with the highest labor force participation rate are those with the educational attainment of less than high school, with 100.0% or 282 individuals in the labor force. Within the labor force, individuals with less than high school education have the highest percentage of unemployment, with 44.3% or 125 of them being unemployed.
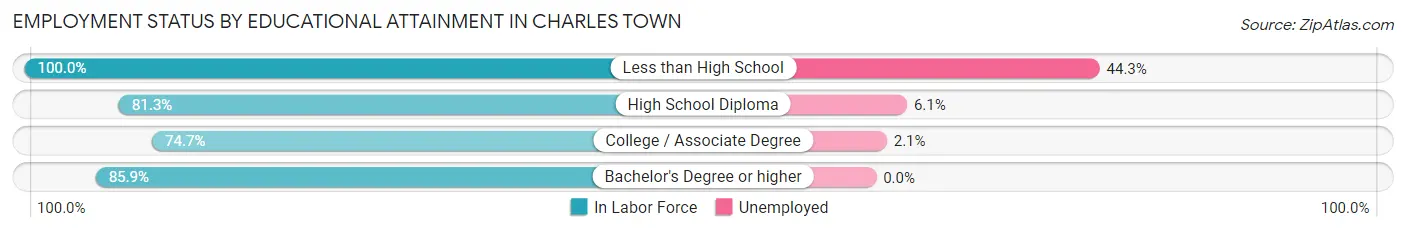
| Educational Attainment | In Labor Force | Unemployed |
| Less than High School | 282 (100.0%) | 125 (44.3%) |
| High School Diploma | 768 (81.3%) | 58 (6.1%) |
| College / Associate Degree | 848 (74.7%) | 24 (2.1%) |
| Bachelor's Degree or higher | 1,154 (85.9%) | 0 (0.0%) |
| Total | 3,049 (82.3%) | 230 (6.2%) |
Employment Occupations by Sex in Charles Town
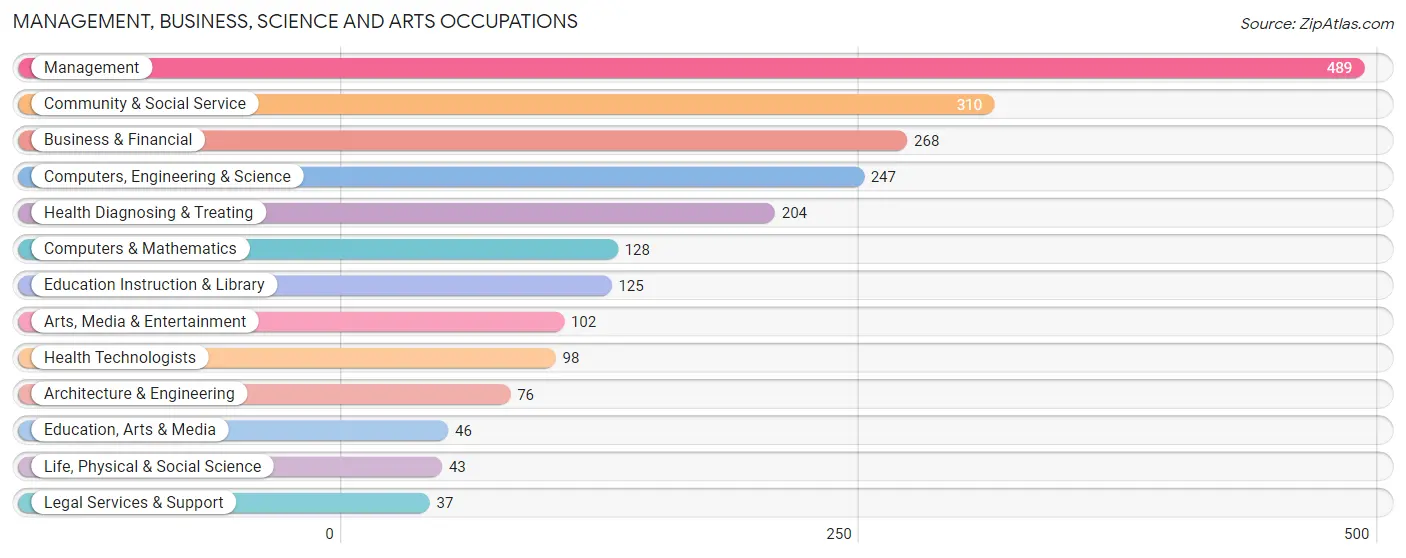
Management, Business, Science and Arts Occupations
The most common Management, Business, Science and Arts occupations in Charles Town are Management (489 | 14.4%), Community & Social Service (310 | 9.1%), Business & Financial (268 | 7.9%), Computers, Engineering & Science (247 | 7.3%), and Health Diagnosing & Treating (204 | 6.0%).
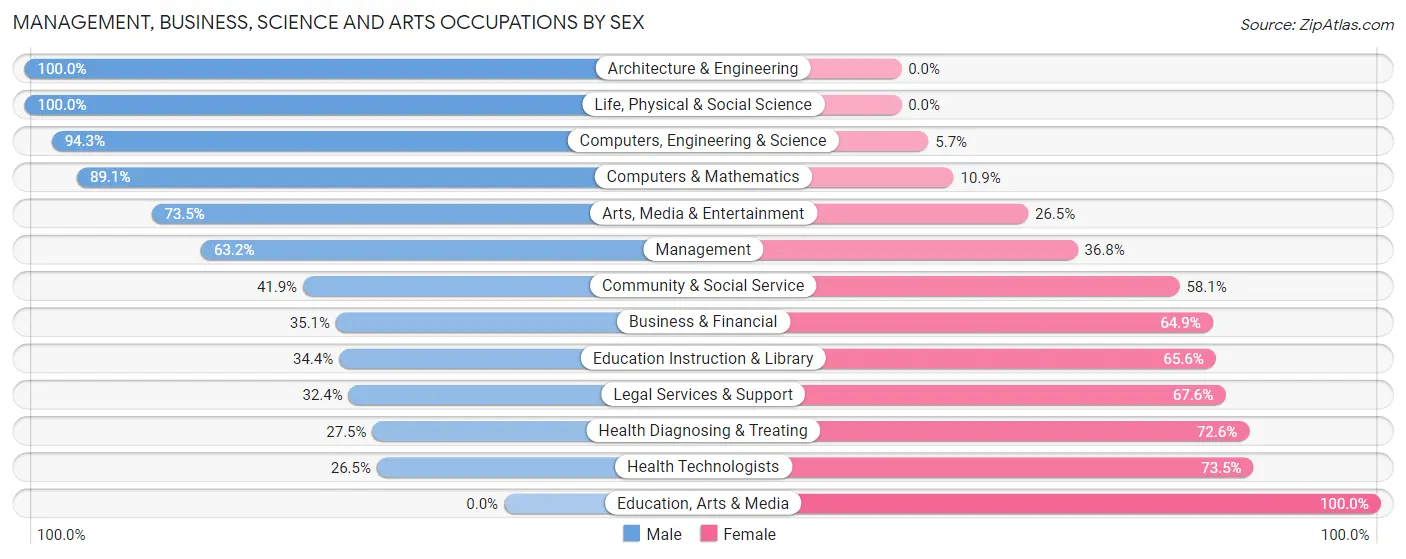
Management, Business, Science and Arts Occupations by Sex
Within the Management, Business, Science and Arts occupations in Charles Town, the most male-oriented occupations are Architecture & Engineering (100.0%), Life, Physical & Social Science (100.0%), and Computers, Engineering & Science (94.3%), while the most female-oriented occupations are Education, Arts & Media (100.0%), Health Technologists (73.5%), and Health Diagnosing & Treating (72.6%).
| Occupation | Male | Female |
| Management | 309 (63.2%) | 180 (36.8%) |
| Business & Financial | 94 (35.1%) | 174 (64.9%) |
| Computers, Engineering & Science | 233 (94.3%) | 14 (5.7%) |
| Computers & Mathematics | 114 (89.1%) | 14 (10.9%) |
| Architecture & Engineering | 76 (100.0%) | 0 (0.0%) |
| Life, Physical & Social Science | 43 (100.0%) | 0 (0.0%) |
| Community & Social Service | 130 (41.9%) | 180 (58.1%) |
| Education, Arts & Media | 0 (0.0%) | 46 (100.0%) |
| Legal Services & Support | 12 (32.4%) | 25 (67.6%) |
| Education Instruction & Library | 43 (34.4%) | 82 (65.6%) |
| Arts, Media & Entertainment | 75 (73.5%) | 27 (26.5%) |
| Health Diagnosing & Treating | 56 (27.5%) | 148 (72.6%) |
| Health Technologists | 26 (26.5%) | 72 (73.5%) |
| Total (Category) | 822 (54.1%) | 696 (45.9%) |
| Total (Overall) | 1,794 (52.8%) | 1,604 (47.2%) |
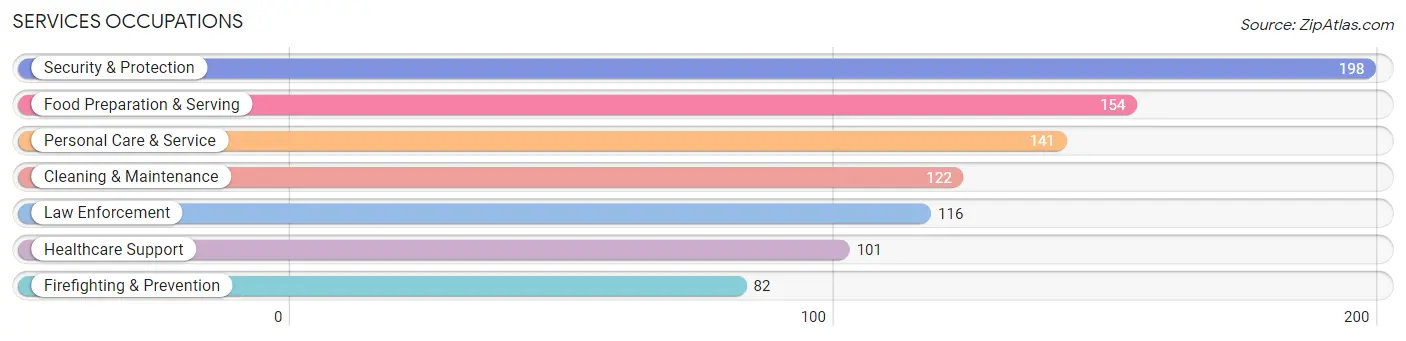
Services Occupations
The most common Services occupations in Charles Town are Security & Protection (198 | 5.8%), Food Preparation & Serving (154 | 4.5%), Personal Care & Service (141 | 4.2%), Cleaning & Maintenance (122 | 3.6%), and Law Enforcement (116 | 3.4%).
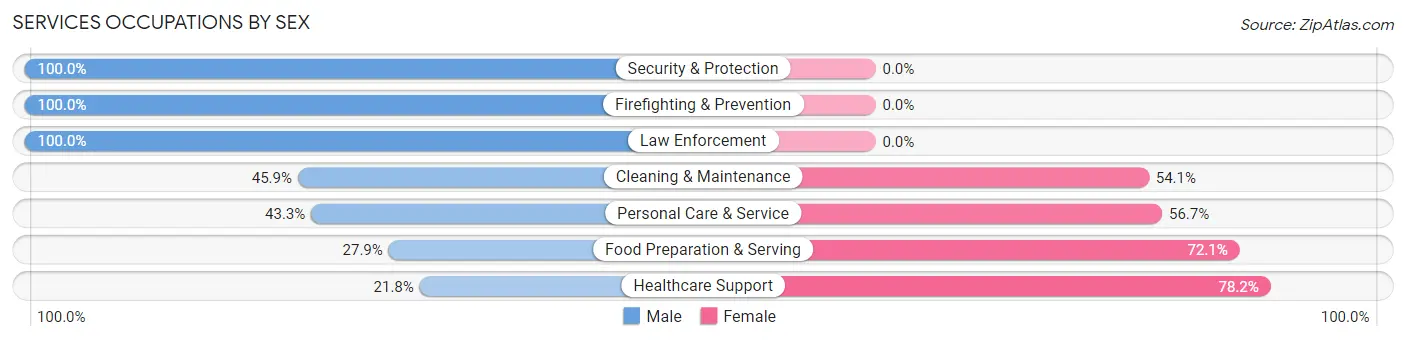
Services Occupations by Sex
Within the Services occupations in Charles Town, the most male-oriented occupations are Security & Protection (100.0%), Firefighting & Prevention (100.0%), and Law Enforcement (100.0%), while the most female-oriented occupations are Healthcare Support (78.2%), Food Preparation & Serving (72.1%), and Personal Care & Service (56.7%).
| Occupation | Male | Female |
| Healthcare Support | 22 (21.8%) | 79 (78.2%) |
| Security & Protection | 198 (100.0%) | 0 (0.0%) |
| Firefighting & Prevention | 82 (100.0%) | 0 (0.0%) |
| Law Enforcement | 116 (100.0%) | 0 (0.0%) |
| Food Preparation & Serving | 43 (27.9%) | 111 (72.1%) |
| Cleaning & Maintenance | 56 (45.9%) | 66 (54.1%) |
| Personal Care & Service | 61 (43.3%) | 80 (56.7%) |
| Total (Category) | 380 (53.1%) | 336 (46.9%) |
| Total (Overall) | 1,794 (52.8%) | 1,604 (47.2%) |
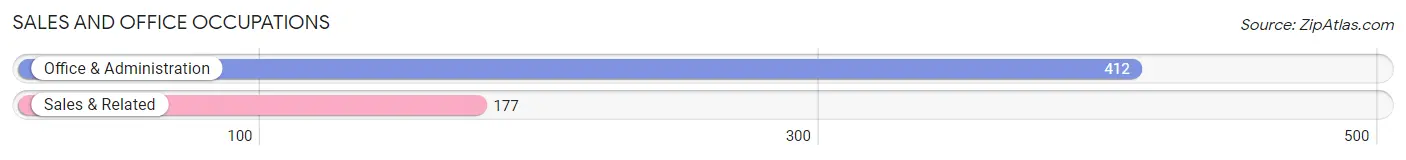
Sales and Office Occupations
The most common Sales and Office occupations in Charles Town are Office & Administration (412 | 12.1%), and Sales & Related (177 | 5.2%).
Sales and Office Occupations by Sex
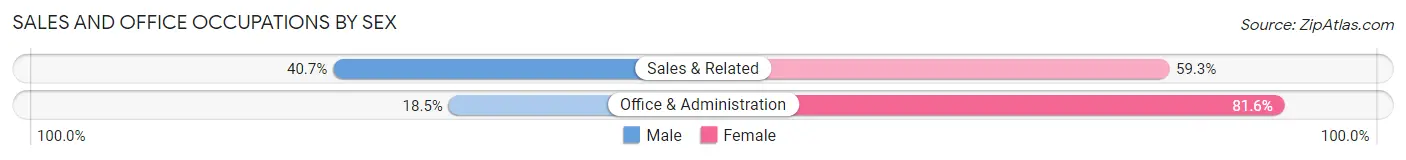
| Occupation | Male | Female |
| Sales & Related | 72 (40.7%) | 105 (59.3%) |
| Office & Administration | 76 (18.4%) | 336 (81.6%) |
| Total (Category) | 148 (25.1%) | 441 (74.9%) |
| Total (Overall) | 1,794 (52.8%) | 1,604 (47.2%) |
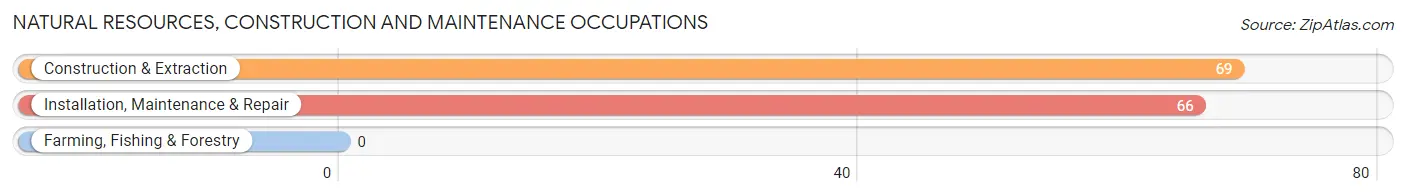
Natural Resources, Construction and Maintenance Occupations
The most common Natural Resources, Construction and Maintenance occupations in Charles Town are Construction & Extraction (69 | 2.0%), and Installation, Maintenance & Repair (66 | 1.9%).
Natural Resources, Construction and Maintenance Occupations by Sex
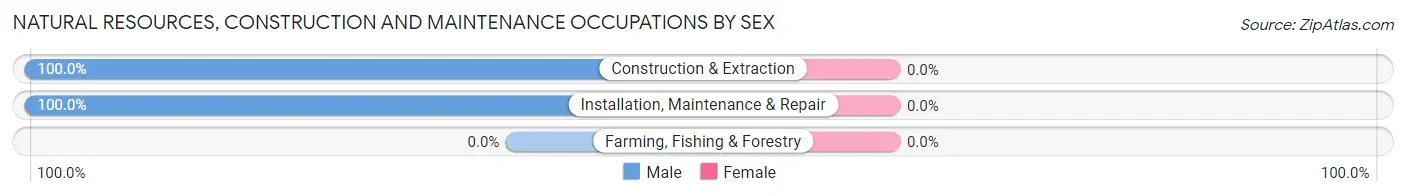
| Occupation | Male | Female |
| Farming, Fishing & Forestry | 0 (0.0%) | 0 (0.0%) |
| Construction & Extraction | 69 (100.0%) | 0 (0.0%) |
| Installation, Maintenance & Repair | 66 (100.0%) | 0 (0.0%) |
| Total (Category) | 135 (100.0%) | 0 (0.0%) |
| Total (Overall) | 1,794 (52.8%) | 1,604 (47.2%) |
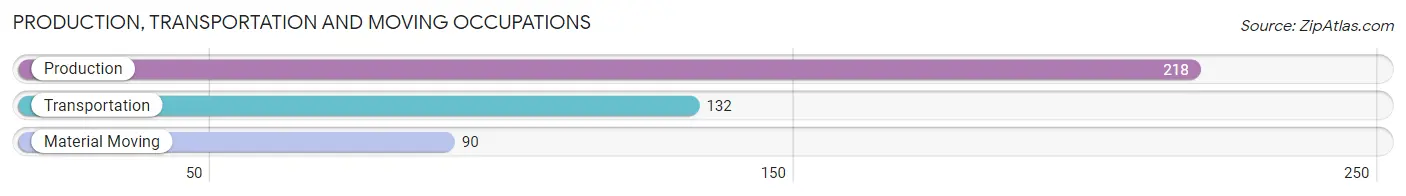
Production, Transportation and Moving Occupations
The most common Production, Transportation and Moving occupations in Charles Town are Production (218 | 6.4%), Transportation (132 | 3.9%), and Material Moving (90 | 2.6%).
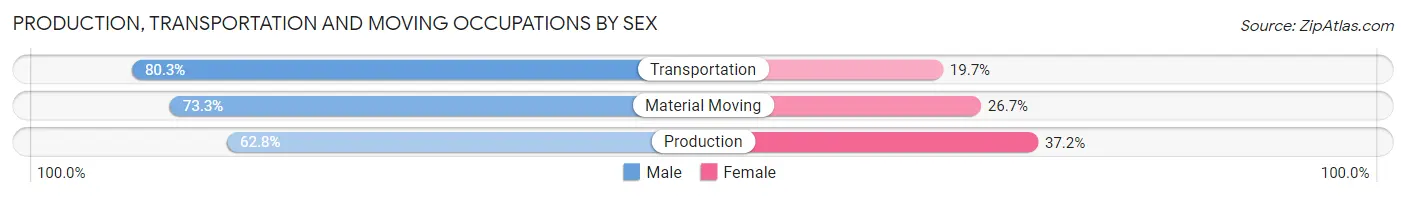
Production, Transportation and Moving Occupations by Sex
| Occupation | Male | Female |
| Production | 137 (62.8%) | 81 (37.2%) |
| Transportation | 106 (80.3%) | 26 (19.7%) |
| Material Moving | 66 (73.3%) | 24 (26.7%) |
| Total (Category) | 309 (70.2%) | 131 (29.8%) |
| Total (Overall) | 1,794 (52.8%) | 1,604 (47.2%) |
Employment Industries by Sex in Charles Town
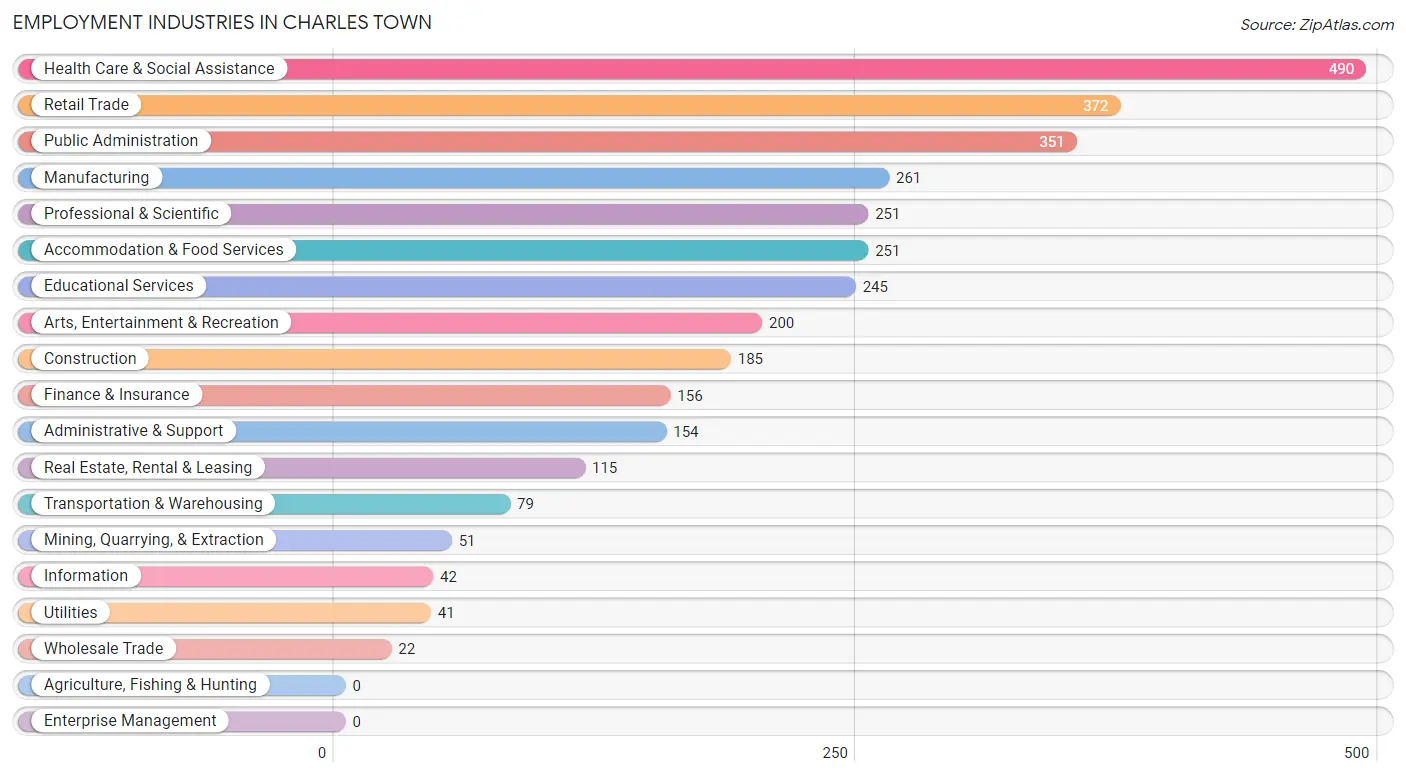
Employment Industries in Charles Town
The major employment industries in Charles Town include Health Care & Social Assistance (490 | 14.4%), Retail Trade (372 | 11.0%), Public Administration (351 | 10.3%), Manufacturing (261 | 7.7%), and Professional & Scientific (251 | 7.4%).
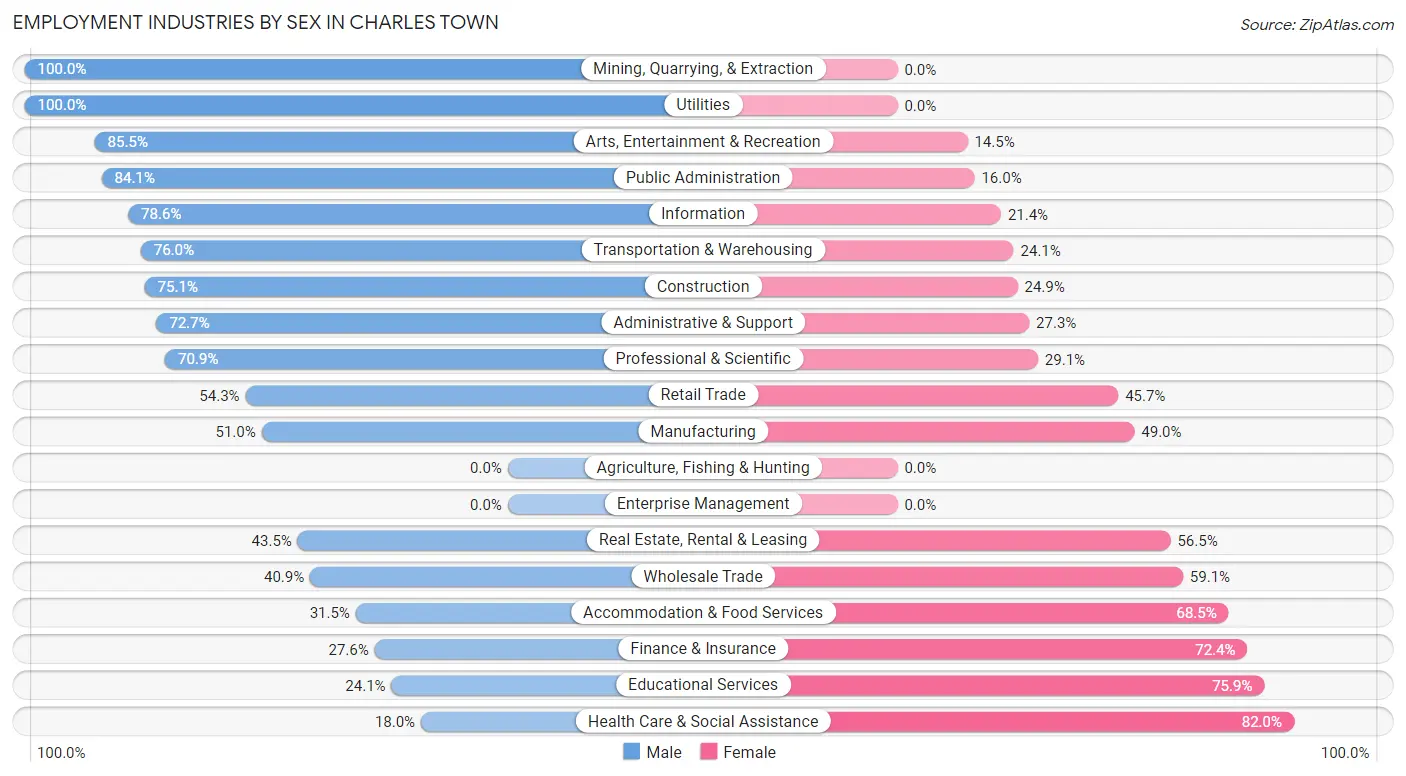
Employment Industries by Sex in Charles Town
The Charles Town industries that see more men than women are Mining, Quarrying, & Extraction (100.0%), Utilities (100.0%), and Arts, Entertainment & Recreation (85.5%), whereas the industries that tend to have a higher number of women are Health Care & Social Assistance (82.0%), Educational Services (75.9%), and Finance & Insurance (72.4%).
| Industry | Male | Female |
| Agriculture, Fishing & Hunting | 0 (0.0%) | 0 (0.0%) |
| Mining, Quarrying, & Extraction | 51 (100.0%) | 0 (0.0%) |
| Construction | 139 (75.1%) | 46 (24.9%) |
| Manufacturing | 133 (51.0%) | 128 (49.0%) |
| Wholesale Trade | 9 (40.9%) | 13 (59.1%) |
| Retail Trade | 202 (54.3%) | 170 (45.7%) |
| Transportation & Warehousing | 60 (75.9%) | 19 (24.0%) |
| Utilities | 41 (100.0%) | 0 (0.0%) |
| Information | 33 (78.6%) | 9 (21.4%) |
| Finance & Insurance | 43 (27.6%) | 113 (72.4%) |
| Real Estate, Rental & Leasing | 50 (43.5%) | 65 (56.5%) |
| Professional & Scientific | 178 (70.9%) | 73 (29.1%) |
| Enterprise Management | 0 (0.0%) | 0 (0.0%) |
| Administrative & Support | 112 (72.7%) | 42 (27.3%) |
| Educational Services | 59 (24.1%) | 186 (75.9%) |
| Health Care & Social Assistance | 88 (18.0%) | 402 (82.0%) |
| Arts, Entertainment & Recreation | 171 (85.5%) | 29 (14.5%) |
| Accommodation & Food Services | 79 (31.5%) | 172 (68.5%) |
| Public Administration | 295 (84.1%) | 56 (16.0%) |
| Total | 1,794 (52.8%) | 1,604 (47.2%) |
Education in Charles Town
School Enrollment in Charles Town
The most common levels of schooling among the 1,629 students in Charles Town are high school (389 | 23.9%), elementary school (356 | 21.8%), and middle school (298 | 18.3%).
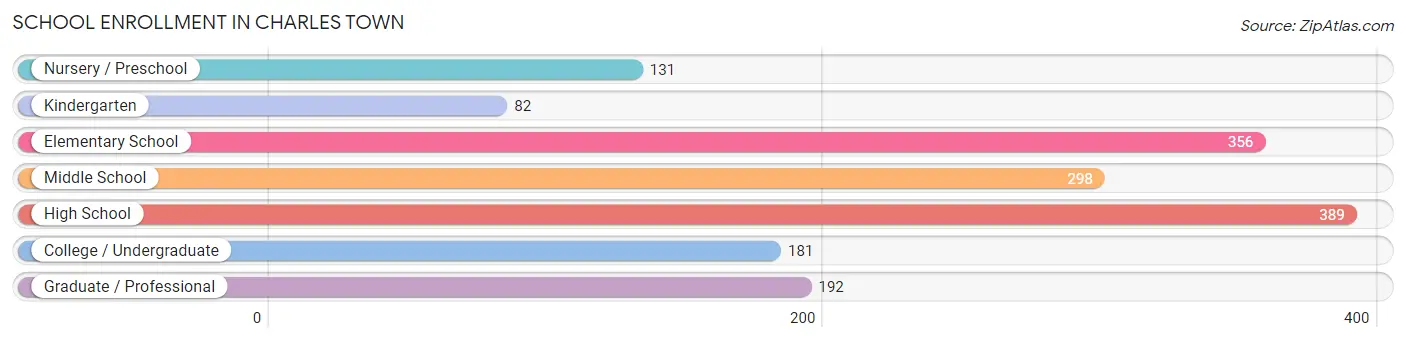
| School Level | # Students | % Students |
| Nursery / Preschool | 131 | 8.0% |
| Kindergarten | 82 | 5.0% |
| Elementary School | 356 | 21.8% |
| Middle School | 298 | 18.3% |
| High School | 389 | 23.9% |
| College / Undergraduate | 181 | 11.1% |
| Graduate / Professional | 192 | 11.8% |
| Total | 1,629 | 100.0% |
School Enrollment by Age by Funding Source in Charles Town
Out of a total of 1,629 students who are enrolled in schools in Charles Town, 280 (17.2%) attend a private institution, while the remaining 1,349 (82.8%) are enrolled in public schools. The age group of 3 to 4 year olds has the highest likelihood of being enrolled in private schools, with 72 (77.4% in the age bracket) enrolled. Conversely, the age group of 15 to 17 year olds has the lowest likelihood of being enrolled in a private school, with 308 (100.0% in the age bracket) attending a public institution.
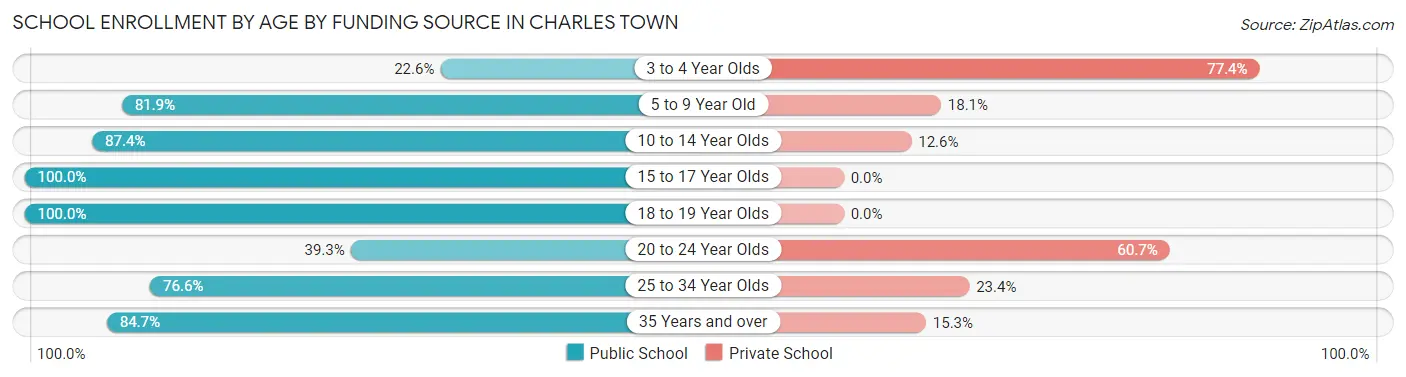
| Age Bracket | Public School | Private School |
| 3 to 4 Year Olds | 21 (22.6%) | 72 (77.4%) |
| 5 to 9 Year Old | 362 (81.9%) | 80 (18.1%) |
| 10 to 14 Year Olds | 347 (87.4%) | 50 (12.6%) |
| 15 to 17 Year Olds | 308 (100.0%) | 0 (0.0%) |
| 18 to 19 Year Olds | 28 (100.0%) | 0 (0.0%) |
| 20 to 24 Year Olds | 11 (39.3%) | 17 (60.7%) |
| 25 to 34 Year Olds | 95 (76.6%) | 29 (23.4%) |
| 35 Years and over | 177 (84.7%) | 32 (15.3%) |
| Total | 1,349 (82.8%) | 280 (17.2%) |
Educational Attainment by Field of Study in Charles Town
Business (394 | 20.3%), education (275 | 14.1%), social sciences (202 | 10.4%), arts & humanities (185 | 9.5%), and bio, nature & agricultural (147 | 7.5%) are the most common fields of study among 1,946 individuals in Charles Town who have obtained a bachelor's degree or higher.
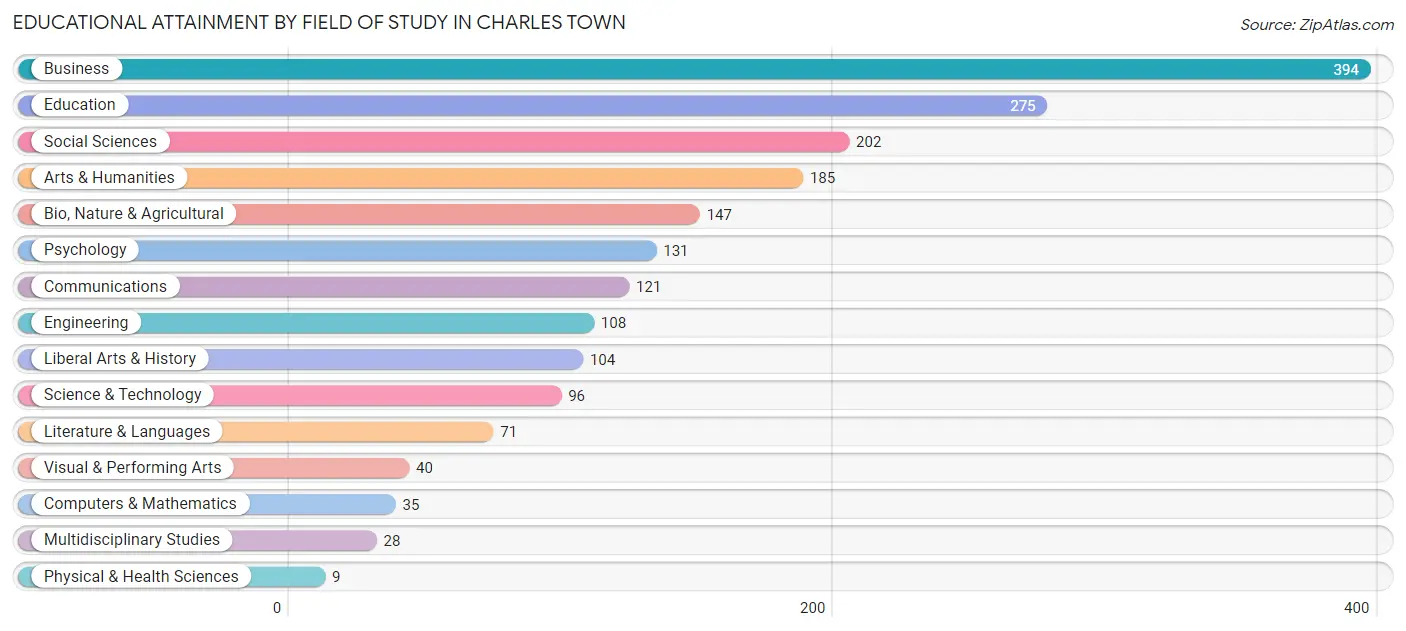
| Field of Study | # Graduates | % Graduates |
| Computers & Mathematics | 35 | 1.8% |
| Bio, Nature & Agricultural | 147 | 7.5% |
| Physical & Health Sciences | 9 | 0.5% |
| Psychology | 131 | 6.7% |
| Social Sciences | 202 | 10.4% |
| Engineering | 108 | 5.6% |
| Multidisciplinary Studies | 28 | 1.4% |
| Science & Technology | 96 | 4.9% |
| Business | 394 | 20.3% |
| Education | 275 | 14.1% |
| Literature & Languages | 71 | 3.6% |
| Liberal Arts & History | 104 | 5.3% |
| Visual & Performing Arts | 40 | 2.1% |
| Communications | 121 | 6.2% |
| Arts & Humanities | 185 | 9.5% |
| Total | 1,946 | 100.0% |
Transportation & Commute in Charles Town
Vehicle Availability by Sex in Charles Town
The most prevalent vehicle ownership categories in Charles Town are males with 2 vehicles (802, accounting for 46.4%) and females with 2 vehicles (450, making up 52.9%).
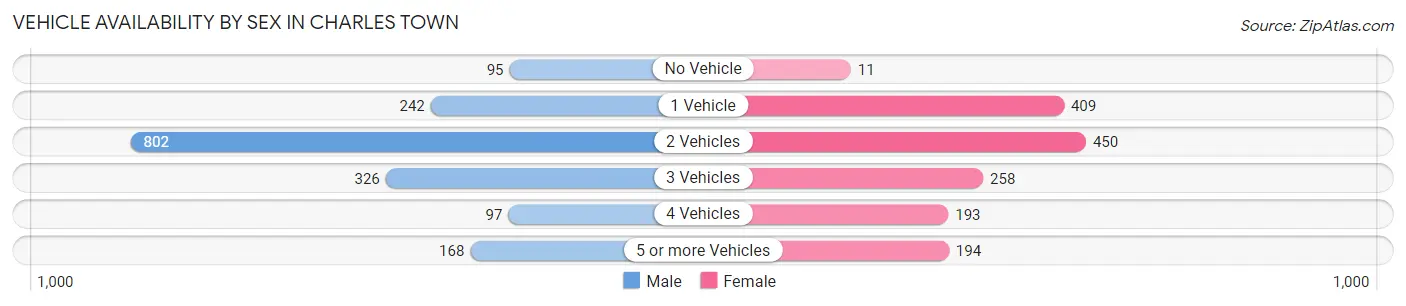
| Vehicles Available | Male | Female |
| No Vehicle | 95 (5.5%) | 11 (0.7%) |
| 1 Vehicle | 242 (14.0%) | 409 (27.0%) |
| 2 Vehicles | 802 (46.4%) | 450 (29.7%) |
| 3 Vehicles | 326 (18.8%) | 258 (17.0%) |
| 4 Vehicles | 97 (5.6%) | 193 (12.7%) |
| 5 or more Vehicles | 168 (9.7%) | 194 (12.8%) |
| Total | 1,730 (100.0%) | 1,515 (100.0%) |
Commute Time in Charles Town
The most frequently occuring commute durations in Charles Town are 10 to 14 minutes (550 commuters, 19.5%), 45 to 59 minutes (482 commuters, 17.1%), and 60 to 89 minutes (410 commuters, 14.5%).
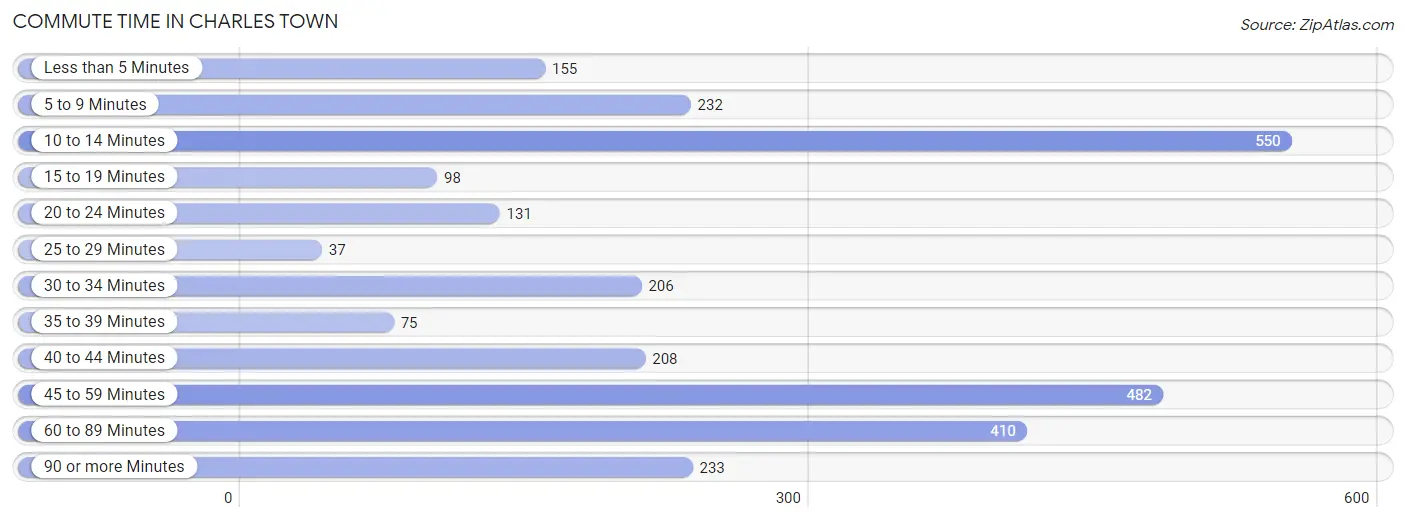
| Commute Time | # Commuters | % Commuters |
| Less than 5 Minutes | 155 | 5.5% |
| 5 to 9 Minutes | 232 | 8.2% |
| 10 to 14 Minutes | 550 | 19.5% |
| 15 to 19 Minutes | 98 | 3.5% |
| 20 to 24 Minutes | 131 | 4.6% |
| 25 to 29 Minutes | 37 | 1.3% |
| 30 to 34 Minutes | 206 | 7.3% |
| 35 to 39 Minutes | 75 | 2.7% |
| 40 to 44 Minutes | 208 | 7.4% |
| 45 to 59 Minutes | 482 | 17.1% |
| 60 to 89 Minutes | 410 | 14.5% |
| 90 or more Minutes | 233 | 8.3% |
Commute Time by Sex in Charles Town
The most common commute times in Charles Town are 45 to 59 minutes (286 commuters, 18.8%) for males and 10 to 14 minutes (278 commuters, 21.4%) for females.
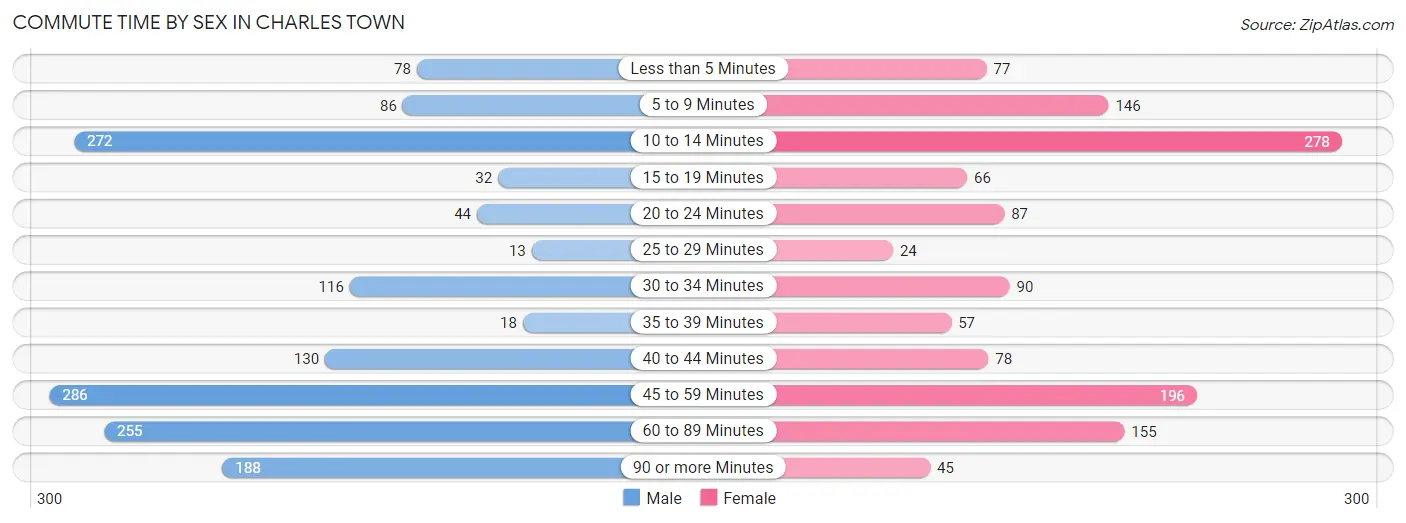
| Commute Time | Male | Female |
| Less than 5 Minutes | 78 (5.1%) | 77 (5.9%) |
| 5 to 9 Minutes | 86 (5.7%) | 146 (11.2%) |
| 10 to 14 Minutes | 272 (17.9%) | 278 (21.4%) |
| 15 to 19 Minutes | 32 (2.1%) | 66 (5.1%) |
| 20 to 24 Minutes | 44 (2.9%) | 87 (6.7%) |
| 25 to 29 Minutes | 13 (0.9%) | 24 (1.8%) |
| 30 to 34 Minutes | 116 (7.6%) | 90 (6.9%) |
| 35 to 39 Minutes | 18 (1.2%) | 57 (4.4%) |
| 40 to 44 Minutes | 130 (8.6%) | 78 (6.0%) |
| 45 to 59 Minutes | 286 (18.8%) | 196 (15.1%) |
| 60 to 89 Minutes | 255 (16.8%) | 155 (11.9%) |
| 90 or more Minutes | 188 (12.4%) | 45 (3.5%) |
Time of Departure to Work by Sex in Charles Town
The most frequent times of departure to work in Charles Town are 5:00 AM to 5:29 AM (241, 15.9%) for males and 8:00 AM to 8:29 AM (233, 17.9%) for females.
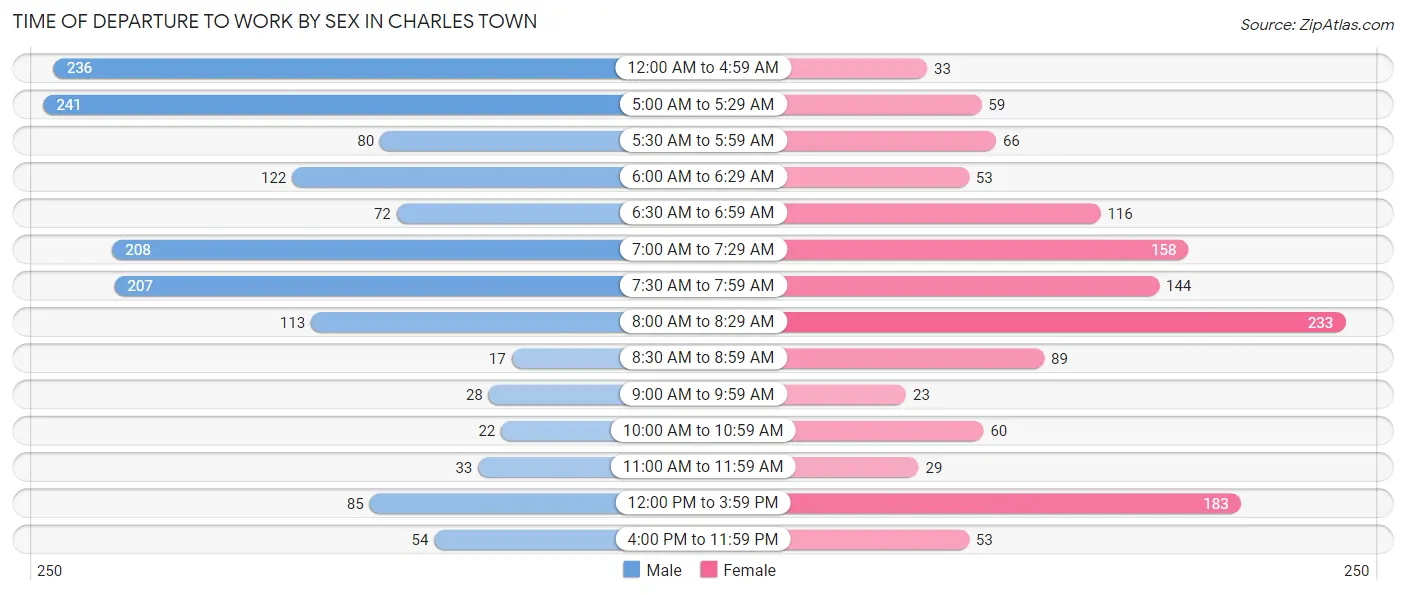
| Time of Departure | Male | Female |
| 12:00 AM to 4:59 AM | 236 (15.5%) | 33 (2.5%) |
| 5:00 AM to 5:29 AM | 241 (15.9%) | 59 (4.5%) |
| 5:30 AM to 5:59 AM | 80 (5.3%) | 66 (5.1%) |
| 6:00 AM to 6:29 AM | 122 (8.0%) | 53 (4.1%) |
| 6:30 AM to 6:59 AM | 72 (4.7%) | 116 (8.9%) |
| 7:00 AM to 7:29 AM | 208 (13.7%) | 158 (12.2%) |
| 7:30 AM to 7:59 AM | 207 (13.6%) | 144 (11.1%) |
| 8:00 AM to 8:29 AM | 113 (7.4%) | 233 (17.9%) |
| 8:30 AM to 8:59 AM | 17 (1.1%) | 89 (6.9%) |
| 9:00 AM to 9:59 AM | 28 (1.8%) | 23 (1.8%) |
| 10:00 AM to 10:59 AM | 22 (1.5%) | 60 (4.6%) |
| 11:00 AM to 11:59 AM | 33 (2.2%) | 29 (2.2%) |
| 12:00 PM to 3:59 PM | 85 (5.6%) | 183 (14.1%) |
| 4:00 PM to 11:59 PM | 54 (3.6%) | 53 (4.1%) |
| Total | 1,518 (100.0%) | 1,299 (100.0%) |
Housing Occupancy in Charles Town
Occupancy by Ownership in Charles Town
Of the total 2,553 dwellings in Charles Town, owner-occupied units account for 1,811 (70.9%), while renter-occupied units make up 742 (29.1%).
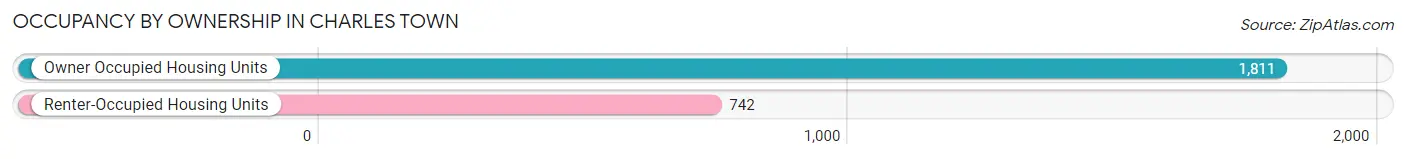
| Occupancy | # Housing Units | % Housing Units |
| Owner Occupied Housing Units | 1,811 | 70.9% |
| Renter-Occupied Housing Units | 742 | 29.1% |
| Total Occupied Housing Units | 2,553 | 100.0% |
Occupancy by Household Size in Charles Town
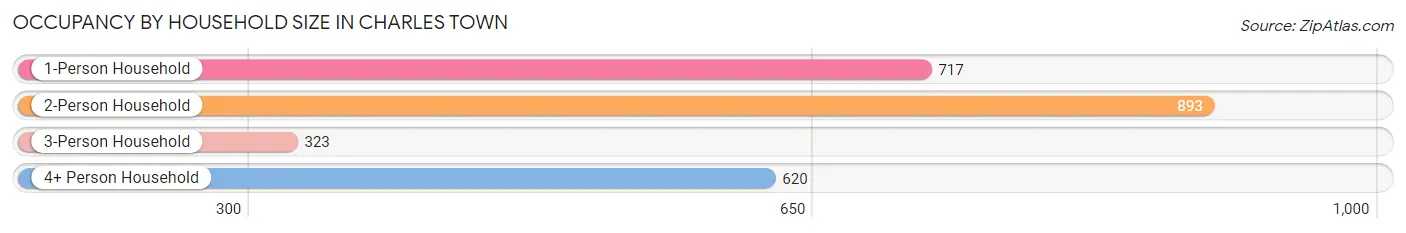
| Household Size | # Housing Units | % Housing Units |
| 1-Person Household | 717 | 28.1% |
| 2-Person Household | 893 | 35.0% |
| 3-Person Household | 323 | 12.7% |
| 4+ Person Household | 620 | 24.3% |
| Total Housing Units | 2,553 | 100.0% |
Occupancy by Ownership by Household Size in Charles Town
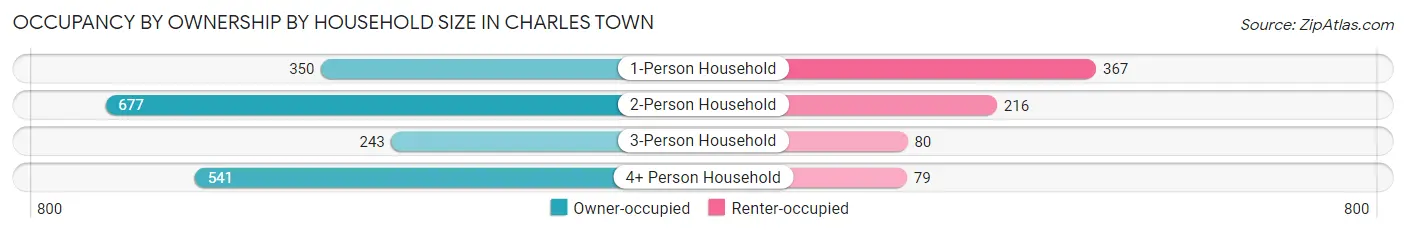
| Household Size | Owner-occupied | Renter-occupied |
| 1-Person Household | 350 (48.8%) | 367 (51.2%) |
| 2-Person Household | 677 (75.8%) | 216 (24.2%) |
| 3-Person Household | 243 (75.2%) | 80 (24.8%) |
| 4+ Person Household | 541 (87.3%) | 79 (12.7%) |
| Total Housing Units | 1,811 (70.9%) | 742 (29.1%) |
Occupancy by Educational Attainment in Charles Town
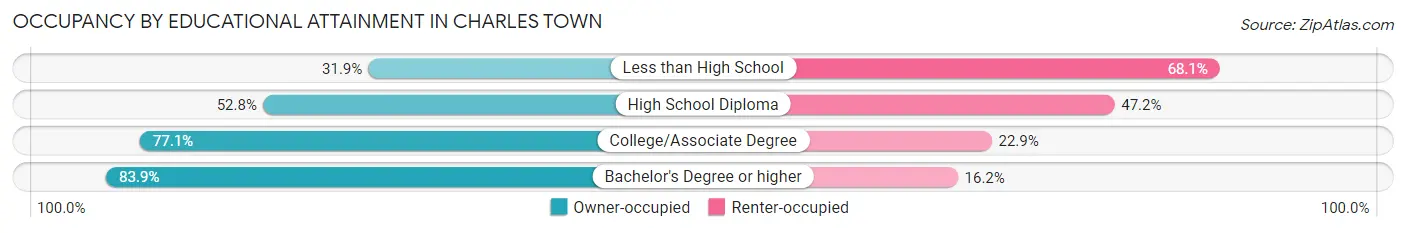
| Household Size | Owner-occupied | Renter-occupied |
| Less than High School | 37 (31.9%) | 79 (68.1%) |
| High School Diploma | 379 (52.8%) | 339 (47.2%) |
| College/Associate Degree | 533 (77.1%) | 158 (22.9%) |
| Bachelor's Degree or higher | 862 (83.9%) | 166 (16.2%) |
Occupancy by Age of Householder in Charles Town
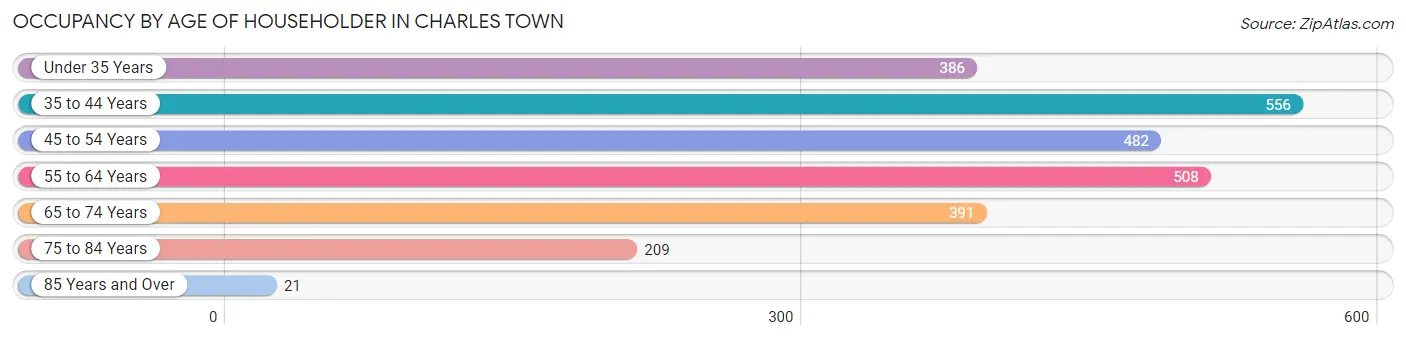
| Age Bracket | # Households | % Households |
| Under 35 Years | 386 | 15.1% |
| 35 to 44 Years | 556 | 21.8% |
| 45 to 54 Years | 482 | 18.9% |
| 55 to 64 Years | 508 | 19.9% |
| 65 to 74 Years | 391 | 15.3% |
| 75 to 84 Years | 209 | 8.2% |
| 85 Years and Over | 21 | 0.8% |
| Total | 2,553 | 100.0% |
Housing Finances in Charles Town
Median Income by Occupancy in Charles Town
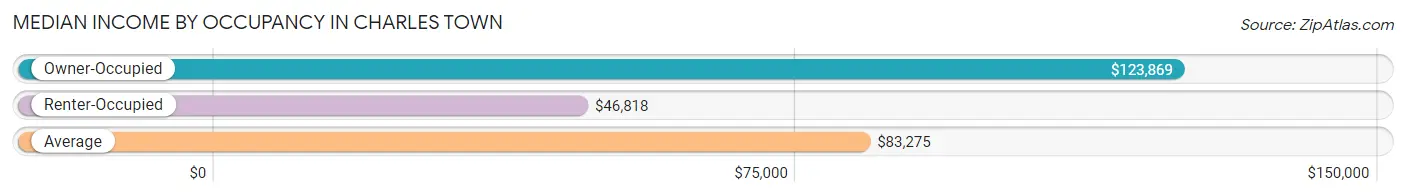
| Occupancy Type | # Households | Median Income |
| Owner-Occupied | 1,811 (70.9%) | $123,869 |
| Renter-Occupied | 742 (29.1%) | $46,818 |
| Average | 2,553 (100.0%) | $83,275 |
Occupancy by Householder Income Bracket in Charles Town
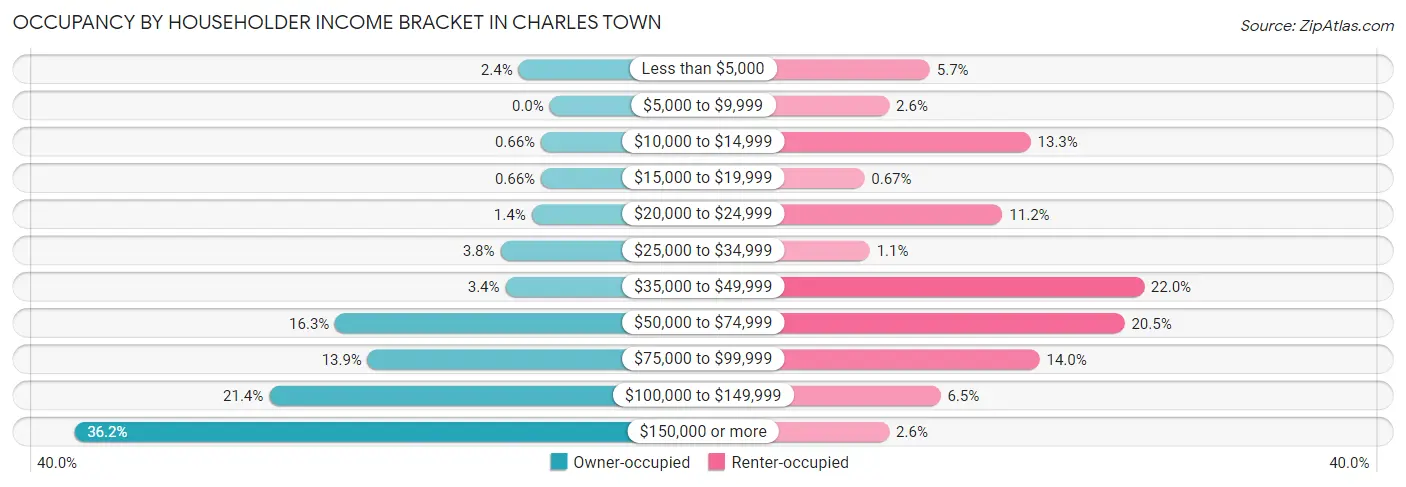
| Income Bracket | Owner-occupied | Renter-occupied |
| Less than $5,000 | 43 (2.4%) | 42 (5.7%) |
| $5,000 to $9,999 | 0 (0.0%) | 19 (2.6%) |
| $10,000 to $14,999 | 12 (0.7%) | 99 (13.3%) |
| $15,000 to $19,999 | 12 (0.7%) | 5 (0.7%) |
| $20,000 to $24,999 | 25 (1.4%) | 83 (11.2%) |
| $25,000 to $34,999 | 68 (3.7%) | 8 (1.1%) |
| $35,000 to $49,999 | 61 (3.4%) | 163 (22.0%) |
| $50,000 to $74,999 | 296 (16.3%) | 152 (20.5%) |
| $75,000 to $99,999 | 251 (13.9%) | 104 (14.0%) |
| $100,000 to $149,999 | 387 (21.4%) | 48 (6.5%) |
| $150,000 or more | 656 (36.2%) | 19 (2.6%) |
| Total | 1,811 (100.0%) | 742 (100.0%) |
Monthly Housing Cost Tiers in Charles Town
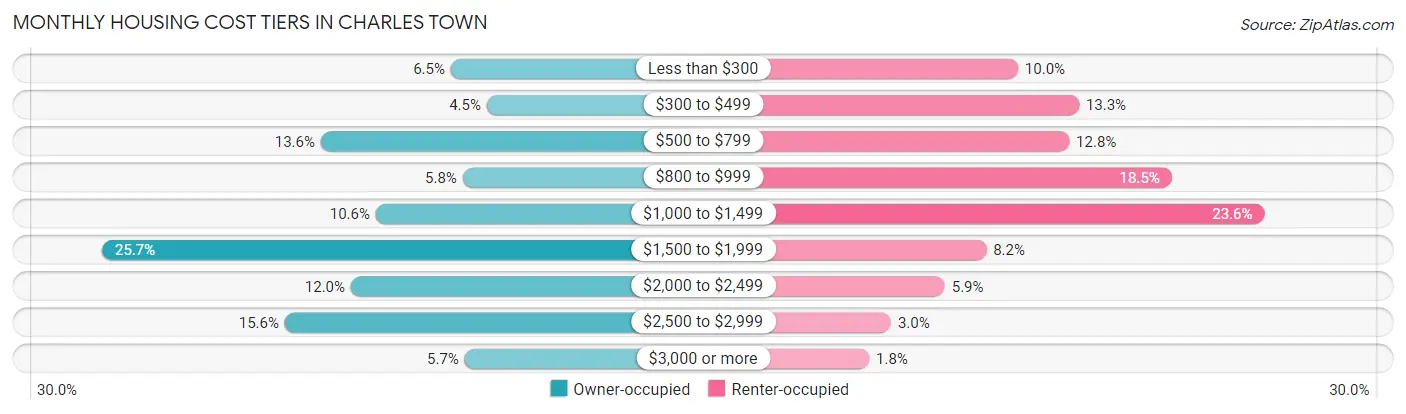
| Monthly Cost | Owner-occupied | Renter-occupied |
| Less than $300 | 117 (6.5%) | 74 (10.0%) |
| $300 to $499 | 81 (4.5%) | 99 (13.3%) |
| $500 to $799 | 247 (13.6%) | 95 (12.8%) |
| $800 to $999 | 105 (5.8%) | 137 (18.5%) |
| $1,000 to $1,499 | 192 (10.6%) | 175 (23.6%) |
| $1,500 to $1,999 | 466 (25.7%) | 61 (8.2%) |
| $2,000 to $2,499 | 217 (12.0%) | 44 (5.9%) |
| $2,500 to $2,999 | 283 (15.6%) | 22 (3.0%) |
| $3,000 or more | 103 (5.7%) | 13 (1.8%) |
| Total | 1,811 (100.0%) | 742 (100.0%) |
Physical Housing Characteristics in Charles Town
Housing Structures in Charles Town
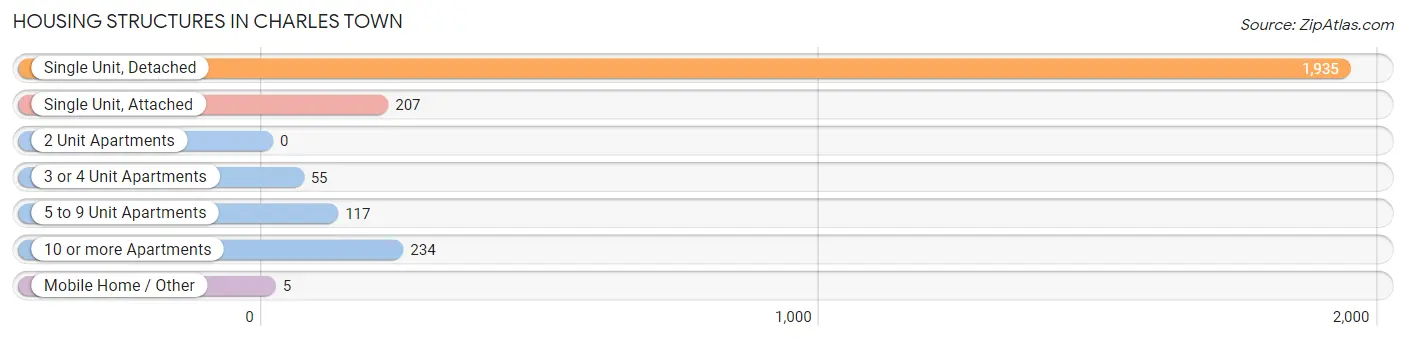
| Structure Type | # Housing Units | % Housing Units |
| Single Unit, Detached | 1,935 | 75.8% |
| Single Unit, Attached | 207 | 8.1% |
| 2 Unit Apartments | 0 | 0.0% |
| 3 or 4 Unit Apartments | 55 | 2.1% |
| 5 to 9 Unit Apartments | 117 | 4.6% |
| 10 or more Apartments | 234 | 9.2% |
| Mobile Home / Other | 5 | 0.2% |
| Total | 2,553 | 100.0% |
Housing Structures by Occupancy in Charles Town
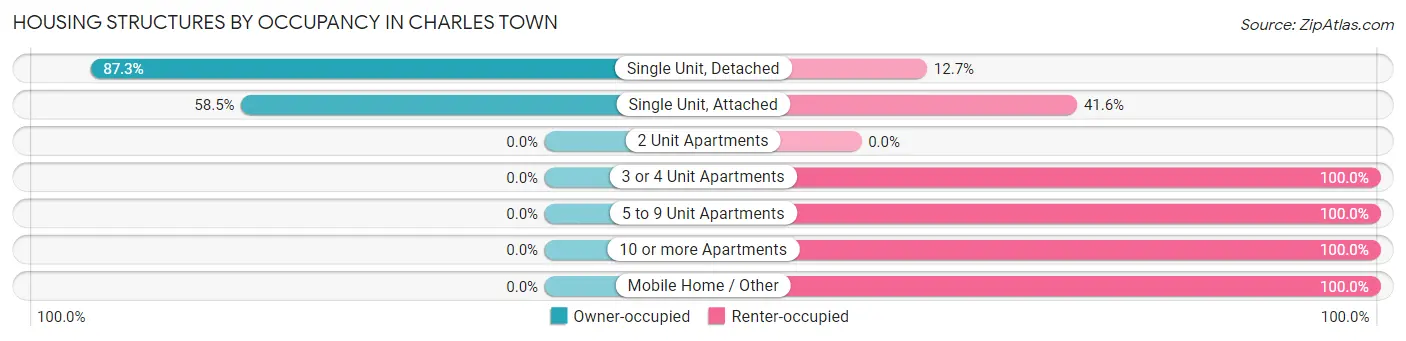
| Structure Type | Owner-occupied | Renter-occupied |
| Single Unit, Detached | 1,690 (87.3%) | 245 (12.7%) |
| Single Unit, Attached | 121 (58.5%) | 86 (41.5%) |
| 2 Unit Apartments | 0 (0.0%) | 0 (0.0%) |
| 3 or 4 Unit Apartments | 0 (0.0%) | 55 (100.0%) |
| 5 to 9 Unit Apartments | 0 (0.0%) | 117 (100.0%) |
| 10 or more Apartments | 0 (0.0%) | 234 (100.0%) |
| Mobile Home / Other | 0 (0.0%) | 5 (100.0%) |
| Total | 1,811 (70.9%) | 742 (29.1%) |
Housing Structures by Number of Rooms in Charles Town
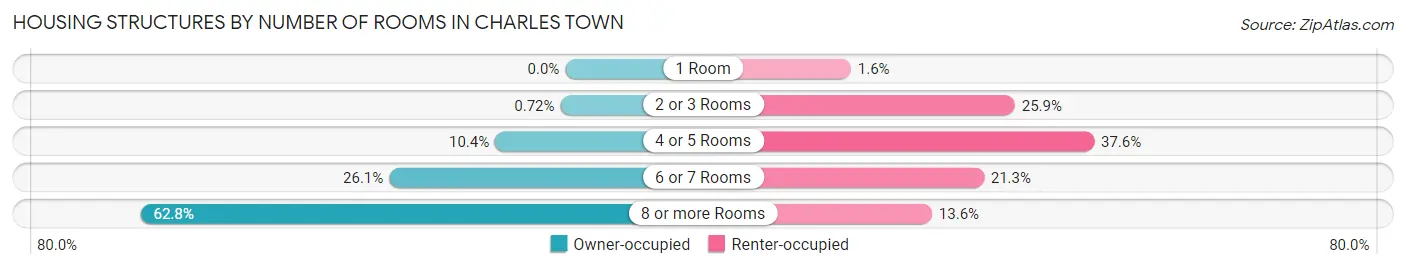
| Number of Rooms | Owner-occupied | Renter-occupied |
| 1 Room | 0 (0.0%) | 12 (1.6%) |
| 2 or 3 Rooms | 13 (0.7%) | 192 (25.9%) |
| 4 or 5 Rooms | 188 (10.4%) | 279 (37.6%) |
| 6 or 7 Rooms | 472 (26.1%) | 158 (21.3%) |
| 8 or more Rooms | 1,138 (62.8%) | 101 (13.6%) |
| Total | 1,811 (100.0%) | 742 (100.0%) |
Housing Structure by Heating Type in Charles Town
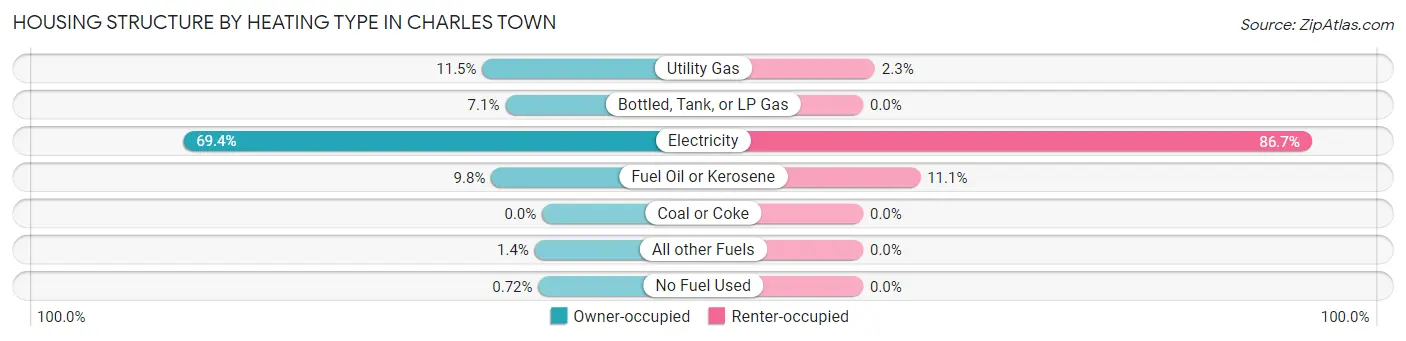
| Heating Type | Owner-occupied | Renter-occupied |
| Utility Gas | 209 (11.5%) | 17 (2.3%) |
| Bottled, Tank, or LP Gas | 129 (7.1%) | 0 (0.0%) |
| Electricity | 1,256 (69.4%) | 643 (86.7%) |
| Fuel Oil or Kerosene | 178 (9.8%) | 82 (11.1%) |
| Coal or Coke | 0 (0.0%) | 0 (0.0%) |
| All other Fuels | 26 (1.4%) | 0 (0.0%) |
| No Fuel Used | 13 (0.7%) | 0 (0.0%) |
| Total | 1,811 (100.0%) | 742 (100.0%) |
Household Vehicle Usage in Charles Town
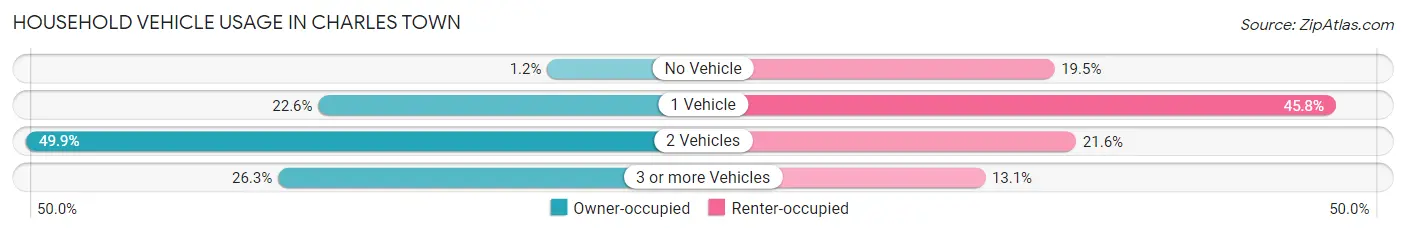
| Vehicles per Household | Owner-occupied | Renter-occupied |
| No Vehicle | 22 (1.2%) | 145 (19.5%) |
| 1 Vehicle | 409 (22.6%) | 340 (45.8%) |
| 2 Vehicles | 903 (49.9%) | 160 (21.6%) |
| 3 or more Vehicles | 477 (26.3%) | 97 (13.1%) |
| Total | 1,811 (100.0%) | 742 (100.0%) |
Real Estate & Mortgages in Charles Town
Real Estate and Mortgage Overview in Charles Town
| Characteristic | Without Mortgage | With Mortgage |
| Housing Units | 462 | 1,349 |
| Median Property Value | $246,100 | $345,700 |
| Median Household Income | $81,694 | $585 |
| Monthly Housing Costs | $613 | $103 |
| Real Estate Taxes | $2,372 | $0 |
Property Value by Mortgage Status in Charles Town
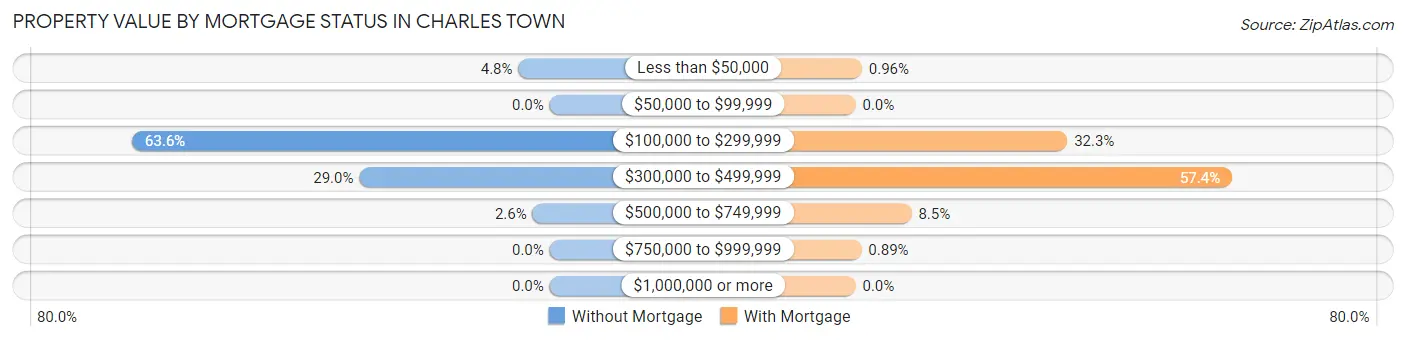
| Property Value | Without Mortgage | With Mortgage |
| Less than $50,000 | 22 (4.8%) | 13 (1.0%) |
| $50,000 to $99,999 | 0 (0.0%) | 0 (0.0%) |
| $100,000 to $299,999 | 294 (63.6%) | 435 (32.3%) |
| $300,000 to $499,999 | 134 (29.0%) | 774 (57.4%) |
| $500,000 to $749,999 | 12 (2.6%) | 115 (8.5%) |
| $750,000 to $999,999 | 0 (0.0%) | 12 (0.9%) |
| $1,000,000 or more | 0 (0.0%) | 0 (0.0%) |
| Total | 462 (100.0%) | 1,349 (100.0%) |
Household Income by Mortgage Status in Charles Town
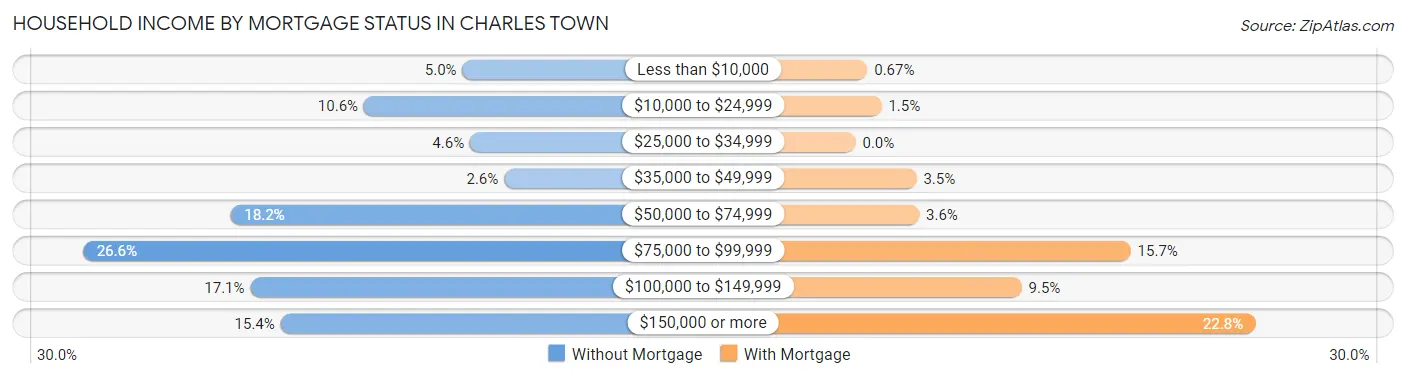
| Household Income | Without Mortgage | With Mortgage |
| Less than $10,000 | 23 (5.0%) | 9 (0.7%) |
| $10,000 to $24,999 | 49 (10.6%) | 20 (1.5%) |
| $25,000 to $34,999 | 21 (4.5%) | 0 (0.0%) |
| $35,000 to $49,999 | 12 (2.6%) | 47 (3.5%) |
| $50,000 to $74,999 | 84 (18.2%) | 49 (3.6%) |
| $75,000 to $99,999 | 123 (26.6%) | 212 (15.7%) |
| $100,000 to $149,999 | 79 (17.1%) | 128 (9.5%) |
| $150,000 or more | 71 (15.4%) | 308 (22.8%) |
| Total | 462 (100.0%) | 1,349 (100.0%) |
Property Value to Household Income Ratio in Charles Town
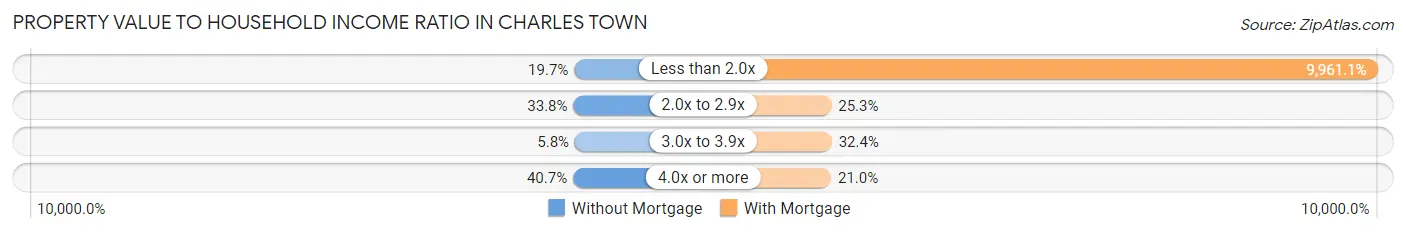
| Value-to-Income Ratio | Without Mortgage | With Mortgage |
| Less than 2.0x | 91 (19.7%) | 134,375 (9,961.1%) |
| 2.0x to 2.9x | 156 (33.8%) | 341 (25.3%) |
| 3.0x to 3.9x | 27 (5.8%) | 437 (32.4%) |
| 4.0x or more | 188 (40.7%) | 283 (21.0%) |
| Total | 462 (100.0%) | 1,349 (100.0%) |
Real Estate Taxes by Mortgage Status in Charles Town
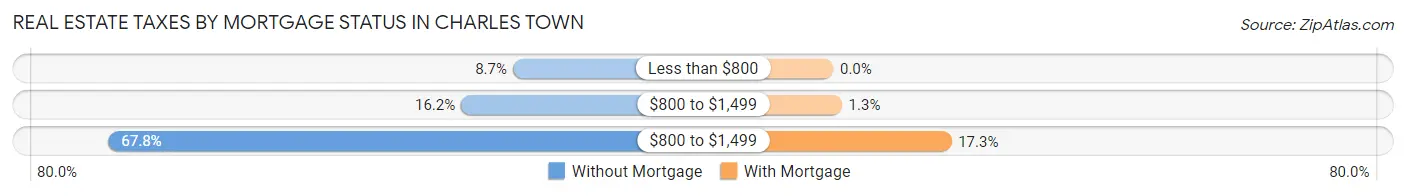
| Property Taxes | Without Mortgage | With Mortgage |
| Less than $800 | 40 (8.7%) | 0 (0.0%) |
| $800 to $1,499 | 75 (16.2%) | 17 (1.3%) |
| $800 to $1,499 | 313 (67.7%) | 233 (17.3%) |
| Total | 462 (100.0%) | 1,349 (100.0%) |
Health & Disability in Charles Town
Health Insurance Coverage by Age in Charles Town
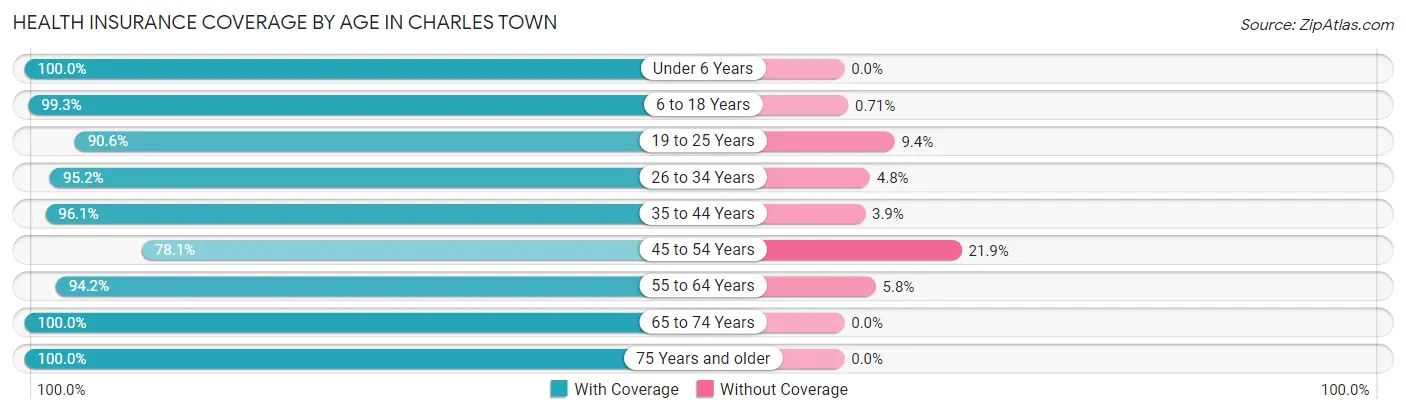
| Age Bracket | With Coverage | Without Coverage |
| Under 6 Years | 343 (100.0%) | 0 (0.0%) |
| 6 to 18 Years | 1,121 (99.3%) | 8 (0.7%) |
| 19 to 25 Years | 271 (90.6%) | 28 (9.4%) |
| 26 to 34 Years | 719 (95.2%) | 36 (4.8%) |
| 35 to 44 Years | 1,068 (96.1%) | 43 (3.9%) |
| 45 to 54 Years | 757 (78.1%) | 212 (21.9%) |
| 55 to 64 Years | 742 (94.2%) | 46 (5.8%) |
| 65 to 74 Years | 734 (100.0%) | 0 (0.0%) |
| 75 Years and older | 355 (100.0%) | 0 (0.0%) |
| Total | 6,110 (94.3%) | 373 (5.8%) |
Health Insurance Coverage by Citizenship Status in Charles Town
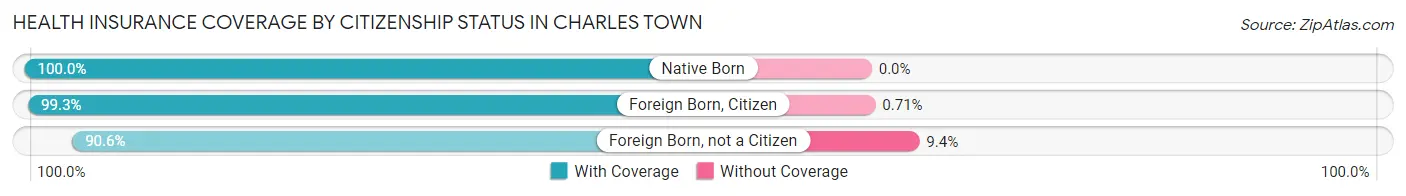
| Citizenship Status | With Coverage | Without Coverage |
| Native Born | 343 (100.0%) | 0 (0.0%) |
| Foreign Born, Citizen | 1,121 (99.3%) | 8 (0.7%) |
| Foreign Born, not a Citizen | 271 (90.6%) | 28 (9.4%) |
Health Insurance Coverage by Household Income in Charles Town
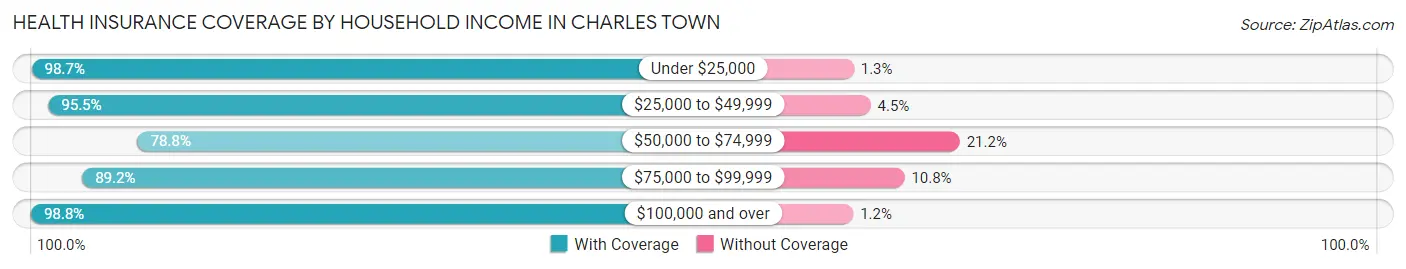
| Household Income | With Coverage | Without Coverage |
| Under $25,000 | 378 (98.7%) | 5 (1.3%) |
| $25,000 to $49,999 | 600 (95.5%) | 28 (4.5%) |
| $50,000 to $74,999 | 775 (78.8%) | 208 (21.2%) |
| $75,000 to $99,999 | 727 (89.2%) | 88 (10.8%) |
| $100,000 and over | 3,630 (98.8%) | 44 (1.2%) |
Public vs Private Health Insurance Coverage by Age in Charles Town
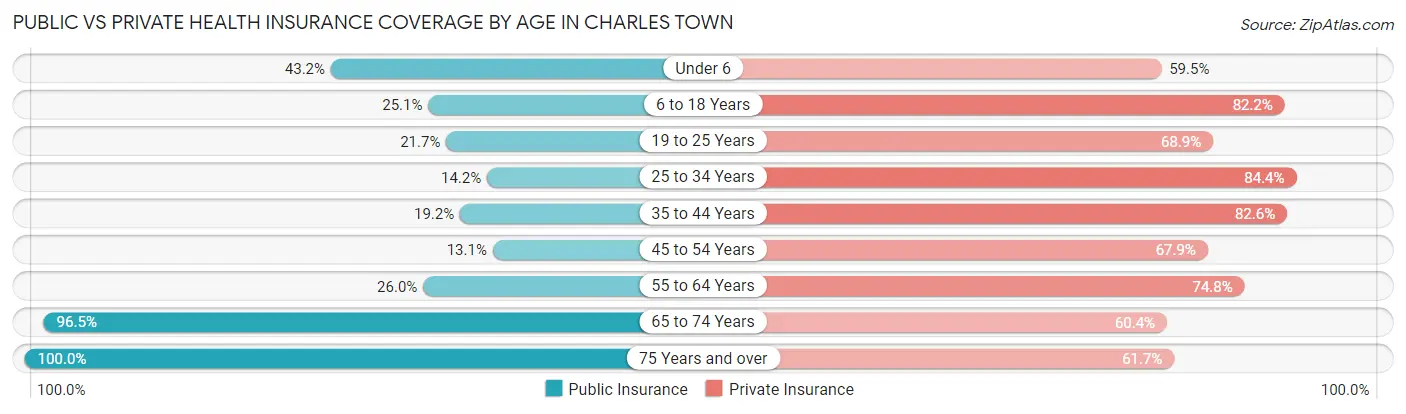
| Age Bracket | Public Insurance | Private Insurance |
| Under 6 | 148 (43.1%) | 204 (59.5%) |
| 6 to 18 Years | 283 (25.1%) | 928 (82.2%) |
| 19 to 25 Years | 65 (21.7%) | 206 (68.9%) |
| 25 to 34 Years | 107 (14.2%) | 637 (84.4%) |
| 35 to 44 Years | 213 (19.2%) | 918 (82.6%) |
| 45 to 54 Years | 127 (13.1%) | 658 (67.9%) |
| 55 to 64 Years | 205 (26.0%) | 589 (74.8%) |
| 65 to 74 Years | 708 (96.5%) | 443 (60.4%) |
| 75 Years and over | 355 (100.0%) | 219 (61.7%) |
| Total | 2,211 (34.1%) | 4,802 (74.1%) |
Disability Status by Sex by Age in Charles Town
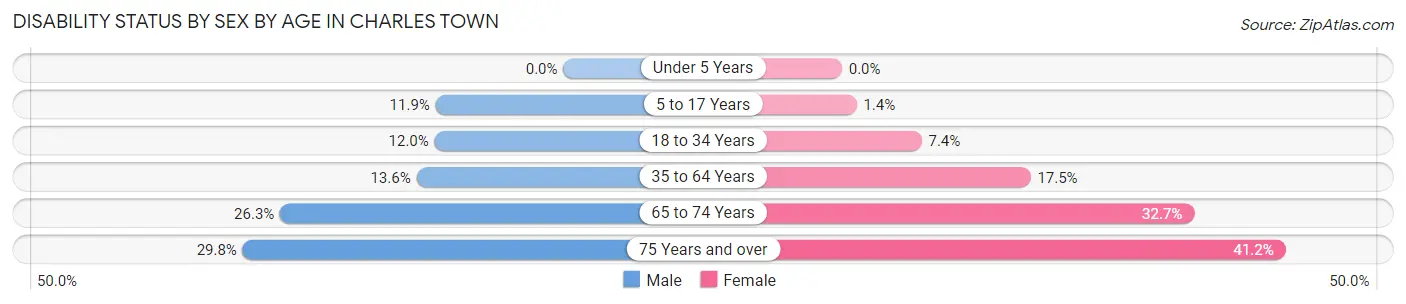
| Age Bracket | Male | Female |
| Under 5 Years | 0 (0.0%) | 0 (0.0%) |
| 5 to 17 Years | 66 (11.8%) | 8 (1.4%) |
| 18 to 34 Years | 65 (11.9%) | 41 (7.4%) |
| 35 to 64 Years | 194 (13.6%) | 253 (17.5%) |
| 65 to 74 Years | 82 (26.3%) | 138 (32.7%) |
| 75 Years and over | 50 (29.8%) | 77 (41.2%) |
Disability Class by Sex by Age in Charles Town
Disability Class: Hearing Difficulty
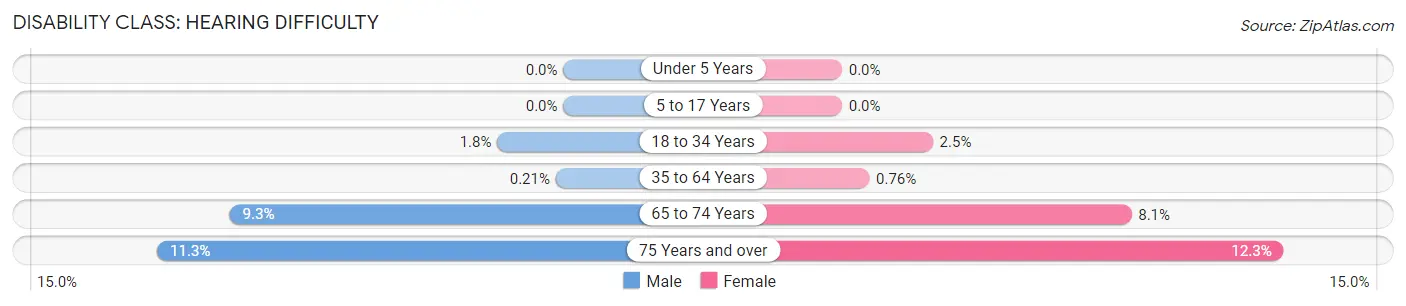
| Age Bracket | Male | Female |
| Under 5 Years | 0 (0.0%) | 0 (0.0%) |
| 5 to 17 Years | 0 (0.0%) | 0 (0.0%) |
| 18 to 34 Years | 10 (1.8%) | 14 (2.5%) |
| 35 to 64 Years | 3 (0.2%) | 11 (0.8%) |
| 65 to 74 Years | 29 (9.3%) | 34 (8.1%) |
| 75 Years and over | 19 (11.3%) | 23 (12.3%) |
Disability Class: Vision Difficulty
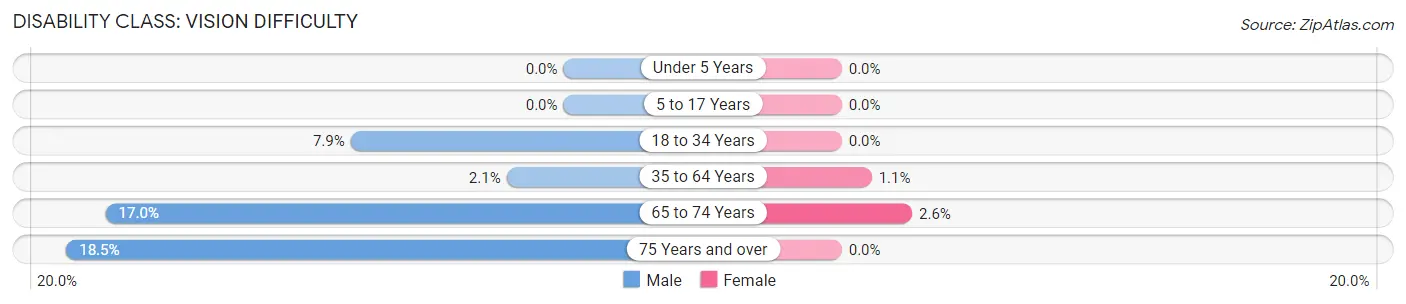
| Age Bracket | Male | Female |
| Under 5 Years | 0 (0.0%) | 0 (0.0%) |
| 5 to 17 Years | 0 (0.0%) | 0 (0.0%) |
| 18 to 34 Years | 43 (7.9%) | 0 (0.0%) |
| 35 to 64 Years | 30 (2.1%) | 16 (1.1%) |
| 65 to 74 Years | 53 (17.0%) | 11 (2.6%) |
| 75 Years and over | 31 (18.4%) | 0 (0.0%) |
Disability Class: Cognitive Difficulty
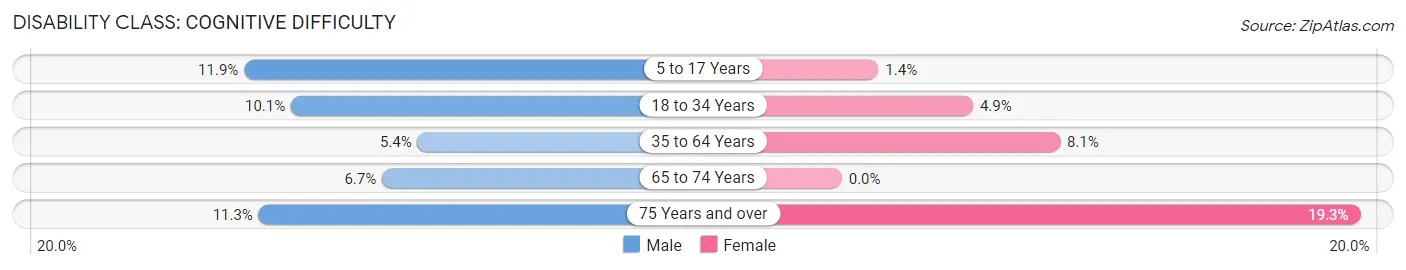
| Age Bracket | Male | Female |
| 5 to 17 Years | 66 (11.8%) | 8 (1.4%) |
| 18 to 34 Years | 55 (10.1%) | 27 (4.9%) |
| 35 to 64 Years | 77 (5.4%) | 117 (8.1%) |
| 65 to 74 Years | 21 (6.7%) | 0 (0.0%) |
| 75 Years and over | 19 (11.3%) | 36 (19.3%) |
Disability Class: Ambulatory Difficulty
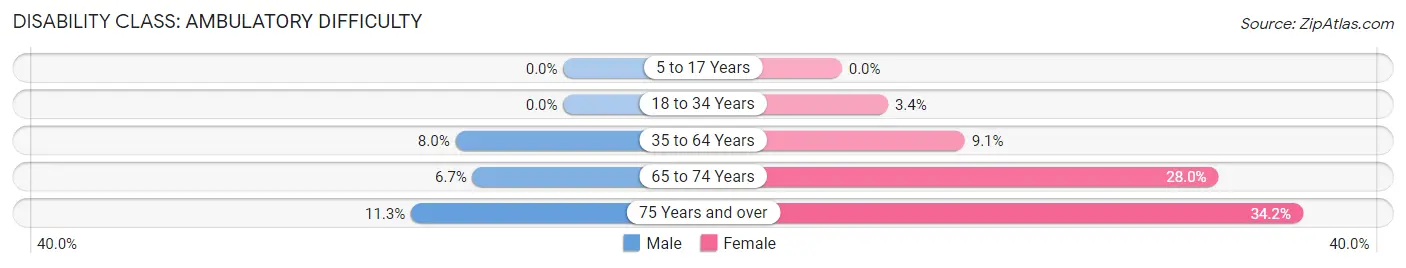
| Age Bracket | Male | Female |
| 5 to 17 Years | 0 (0.0%) | 0 (0.0%) |
| 18 to 34 Years | 0 (0.0%) | 19 (3.4%) |
| 35 to 64 Years | 114 (8.0%) | 132 (9.1%) |
| 65 to 74 Years | 21 (6.7%) | 118 (28.0%) |
| 75 Years and over | 19 (11.3%) | 64 (34.2%) |
Disability Class: Self-Care Difficulty
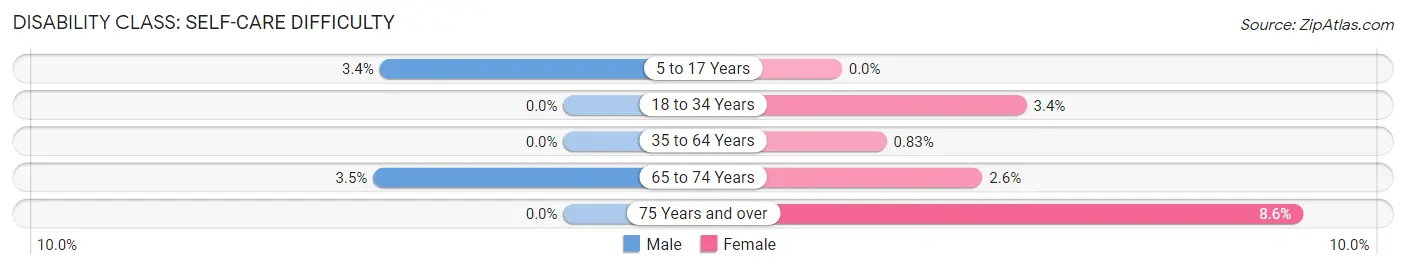
| Age Bracket | Male | Female |
| 5 to 17 Years | 19 (3.4%) | 0 (0.0%) |
| 18 to 34 Years | 0 (0.0%) | 19 (3.4%) |
| 35 to 64 Years | 0 (0.0%) | 12 (0.8%) |
| 65 to 74 Years | 11 (3.5%) | 11 (2.6%) |
| 75 Years and over | 0 (0.0%) | 16 (8.6%) |
Technology Access in Charles Town
Computing Device Access in Charles Town
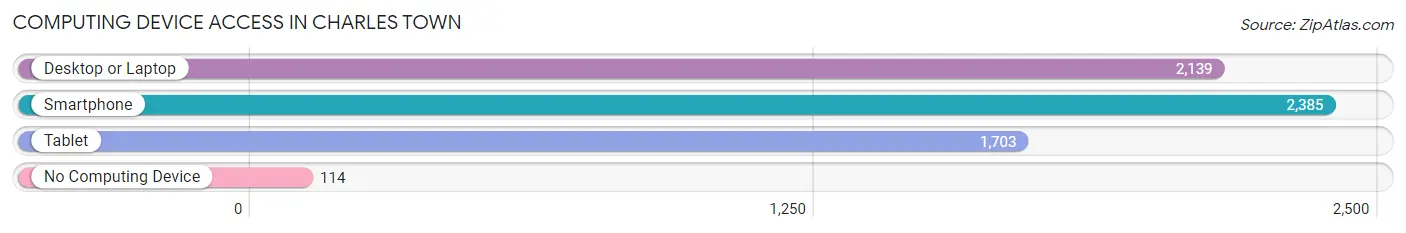
| Device Type | # Households | % Households |
| Desktop or Laptop | 2,139 | 83.8% |
| Smartphone | 2,385 | 93.4% |
| Tablet | 1,703 | 66.7% |
| No Computing Device | 114 | 4.5% |
| Total | 2,553 | 100.0% |
Internet Access in Charles Town
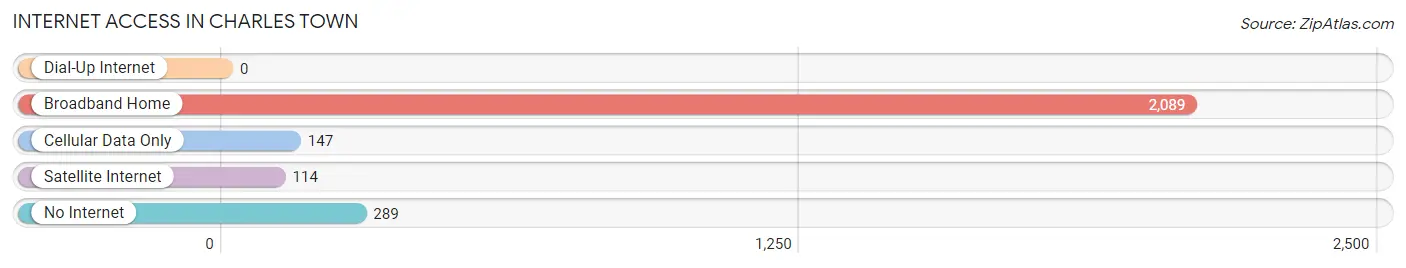
| Internet Type | # Households | % Households |
| Dial-Up Internet | 0 | 0.0% |
| Broadband Home | 2,089 | 81.8% |
| Cellular Data Only | 147 | 5.8% |
| Satellite Internet | 114 | 4.5% |
| No Internet | 289 | 11.3% |
| Total | 2,553 | 100.0% |
Charles Town Summary
Town History
Charles Town, West Virginia is a small town located in the eastern panhandle of the state. It is the county seat of Jefferson County and is located about an hour and a half from Washington, D.C. The town was founded in 1786 by Charles Washington, the youngest brother of George Washington. Charles Washington was a surveyor and land speculator who purchased the land from Lord Fairfax and named it Charles Town in honor of himself.
The town was an important center of commerce and transportation in the early 19th century. It was the site of the first courthouse in the county and the first post office in the state. The town was also the site of the first bank in the state, the Bank of Charles Town, which was established in 1802.
The town was also the site of the first college in the state, the Potomac Academy, which was established in 1808. The college was later renamed Shepherd University and is still in operation today.
The town was also the site of the first railroad in the state, the Baltimore and Ohio Railroad, which was completed in 1834. The railroad connected the town to Baltimore and Washington, D.C. and was a major factor in the town’s growth.
The town was also the site of the first telegraph line in the state, which was completed in 1844. The telegraph line connected the town to Baltimore and Washington, D.C. and was a major factor in the town’s growth.
The town was also the site of the first newspaper in the state, the Charles Town Intelligencer, which was established in 1845. The newspaper was a major factor in the town’s growth and was an important source of news and information for the citizens of the town.
The town was also the site of the first public library in the state, the Charles Town Library, which was established in 1848. The library was an important source of knowledge and information for the citizens of the town.
The town was also the site of the first hospital in the state, the Charles Town Hospital, which was established in 1851. The hospital was an important source of medical care for the citizens of the town.
The town was also the site of the first telephone exchange in the state, which was established in 1883. The telephone exchange was an important factor in the town’s growth and was an important source of communication for the citizens of the town.
The town was also the site of the first electric power plant in the state, which was established in 1887. The power plant was an important factor in the town’s growth and was an important source of electricity for the citizens of the town.
The town was also the site of the first movie theater in the state, which was established in 1910. The movie theater was an important factor in the town’s growth and was an important source of entertainment for the citizens of the town.
The town was also the site of the first radio station in the state, which was established in 1922. The radio station was an important factor in the town’s growth and was an important source of news and information for the citizens of the town.
Geography
Charles Town is located in the eastern panhandle of West Virginia, in Jefferson County. The town is situated on the banks of the Shenandoah River, which forms the border between West Virginia and Virginia. The town is located about an hour and a half from Washington, D.C.
The town is located in a valley surrounded by the Blue Ridge Mountains to the east and the Allegheny Mountains to the west. The town is located at an elevation of about 1,000 feet above sea level.
The climate in Charles Town is temperate, with hot summers and cold winters. The average annual temperature is about 54 degrees Fahrenheit. The average annual precipitation is about 40 inches.
Economy
The economy of Charles Town is largely based on tourism and agriculture. The town is home to several wineries and vineyards, as well as a number of historic sites and attractions. The town is also home to several manufacturing companies, including a paper mill and a furniture factory.
The town is also home to several educational institutions, including Shepherd University and the Potomac Job Corps Center.
Demographics
As of the 2010 census, the population of Charles Town was 5,259. The racial makeup of the town was 91.3% White, 4.3% African American, 0.4% Native American, 0.7% Asian, 0.1% Pacific Islander, and 2.2% from other races. Hispanic or Latino of any race were 2.7% of the population.
The median household income in Charles Town was $45,938, and the median family income was $54,844. The per capita income in the town was $22,945. About 8.3% of families and 11.2% of the population were below the poverty line, including 15.2% of those under age 18 and 8.2% of those age 65 or over.
Common Questions
What is Per Capita Income in Charles Town?
Per Capita income in Charles Town is $43,384.
What is the Median Family Income in Charles Town?
Median Family Income in Charles Town is $112,581.
What is the Median Household income in Charles Town?
Median Household Income in Charles Town is $83,275.
What is Income or Wage Gap in Charles Town?
Income or Wage Gap in Charles Town is 49.5%.
Women in Charles Town earn 50.5 cents for every dollar earned by a man.
What is Inequality or Gini Index in Charles Town?
Inequality or Gini Index in Charles Town is 0.41.
What is the Total Population of Charles Town?
Total Population of Charles Town is 6,584.
What is the Total Male Population of Charles Town?
Total Male Population of Charles Town is 3,183.
What is the Total Female Population of Charles Town?
Total Female Population of Charles Town is 3,401.
What is the Ratio of Males per 100 Females in Charles Town?
There are 93.59 Males per 100 Females in Charles Town.
What is the Ratio of Females per 100 Males in Charles Town?
There are 106.85 Females per 100 Males in Charles Town.
What is the Median Population Age in Charles Town?
Median Population Age in Charles Town is 41.2 Years.
What is the Average Family Size in Charles Town
Average Family Size in Charles Town is 3.0 People.
What is the Average Household Size in Charles Town
Average Household Size in Charles Town is 2.5 People.
How Large is the Labor Force in Charles Town?
There are 3,663 People in the Labor Forcein in Charles Town.
What is the Percentage of People in the Labor Force in Charles Town?
67.8% of People are in the Labor Force in Charles Town.
What is the Unemployment Rate in Charles Town?
Unemployment Rate in Charles Town is 7.3%.