Wheeling, WV Map & Demographics
Wheeling Map
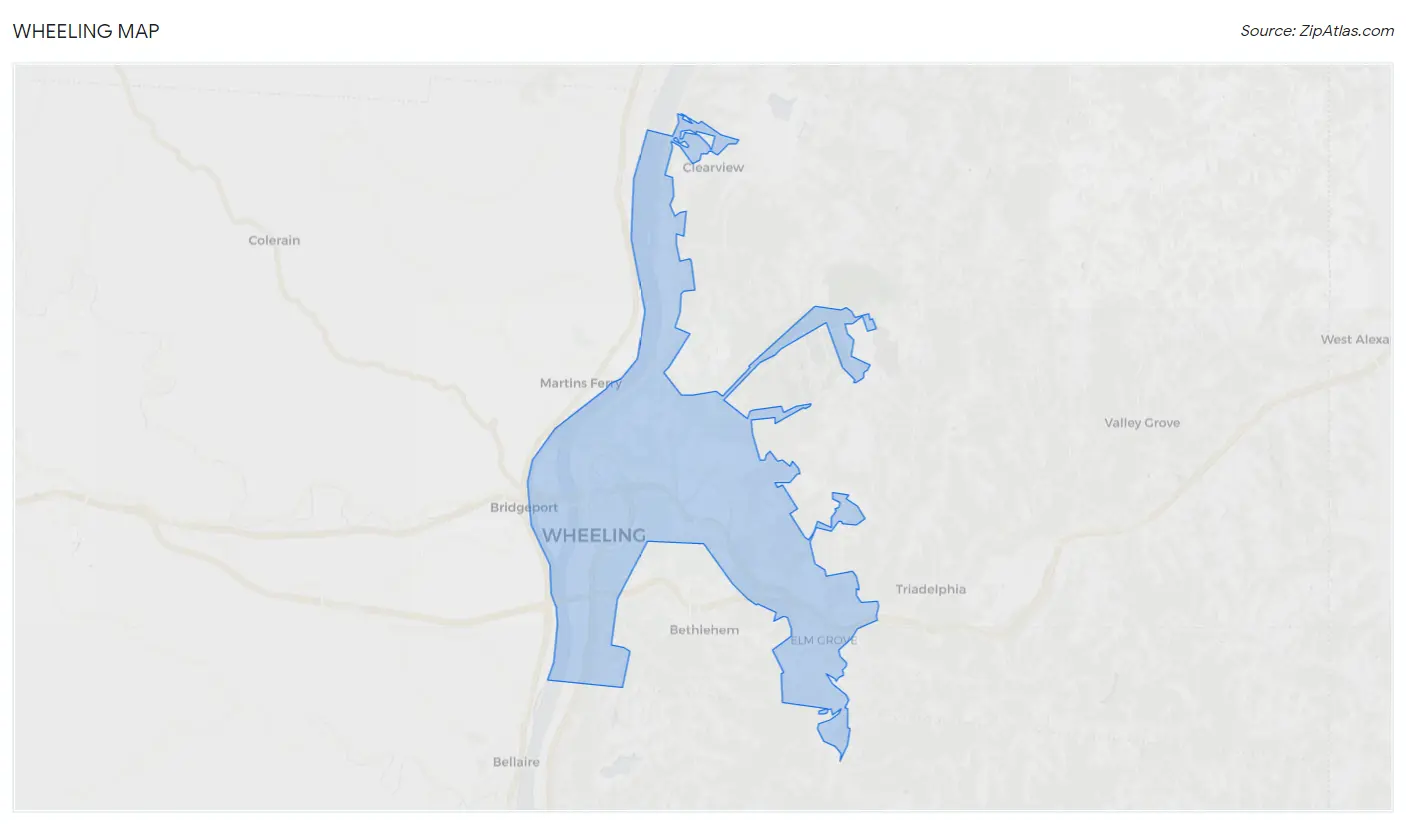
Wheeling Overview
$33,868
PER CAPITA INCOME
$78,607
AVG FAMILY INCOME
$46,516
AVG HOUSEHOLD INCOME
20.2%
WAGE / INCOME GAP [ % ]
79.8¢/ $1
WAGE / INCOME GAP [ $ ]
$9,800
FAMILY INCOME DEFICIT
0.52
INEQUALITY / GINI INDEX
26,900
TOTAL POPULATION
12,779
MALE POPULATION
14,121
FEMALE POPULATION
90.50
MALES / 100 FEMALES
110.50
FEMALES / 100 MALES
45.0
MEDIAN AGE
3.1
AVG FAMILY SIZE
2.2
AVG HOUSEHOLD SIZE
12,058
LABOR FORCE [ PEOPLE ]
54.0%
PERCENT IN LABOR FORCE
6.2%
UNEMPLOYMENT RATE
Wheeling Zip Codes
Wheeling Area Codes
Income in Wheeling
Income Overview in Wheeling
Per Capita Income in Wheeling is $33,868, while median incomes of families and households are $78,607 and $46,516 respectively.
| Characteristic | Number | Measure |
| Per Capita Income | 26,900 | $33,868 |
| Median Family Income | 6,056 | $78,607 |
| Mean Family Income | 6,056 | $97,086 |
| Median Household Income | 11,760 | $46,516 |
| Mean Household Income | 11,760 | $73,300 |
| Income Deficit | 6,056 | $9,800 |
| Wage / Income Gap (%) | 26,900 | 20.25% |
| Wage / Income Gap ($) | 26,900 | 79.75¢ per $1 |
| Gini / Inequality Index | 26,900 | 0.52 |
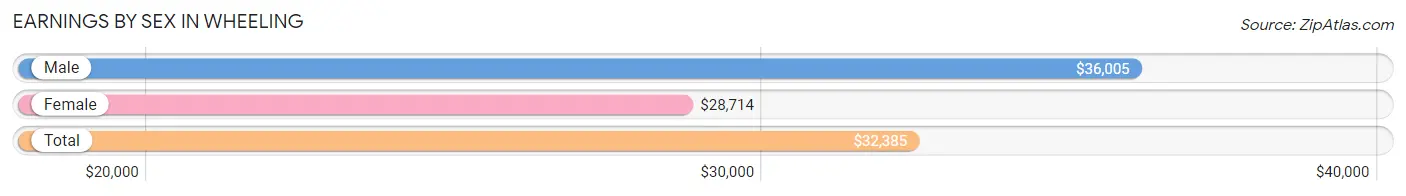
Earnings by Sex in Wheeling
Average Earnings in Wheeling are $32,385, $36,005 for men and $28,714 for women, a difference of 20.3%.
| Sex | Number | Average Earnings |
| Male | 6,884 (53.1%) | $36,005 |
| Female | 6,071 (46.9%) | $28,714 |
| Total | 12,955 (100.0%) | $32,385 |
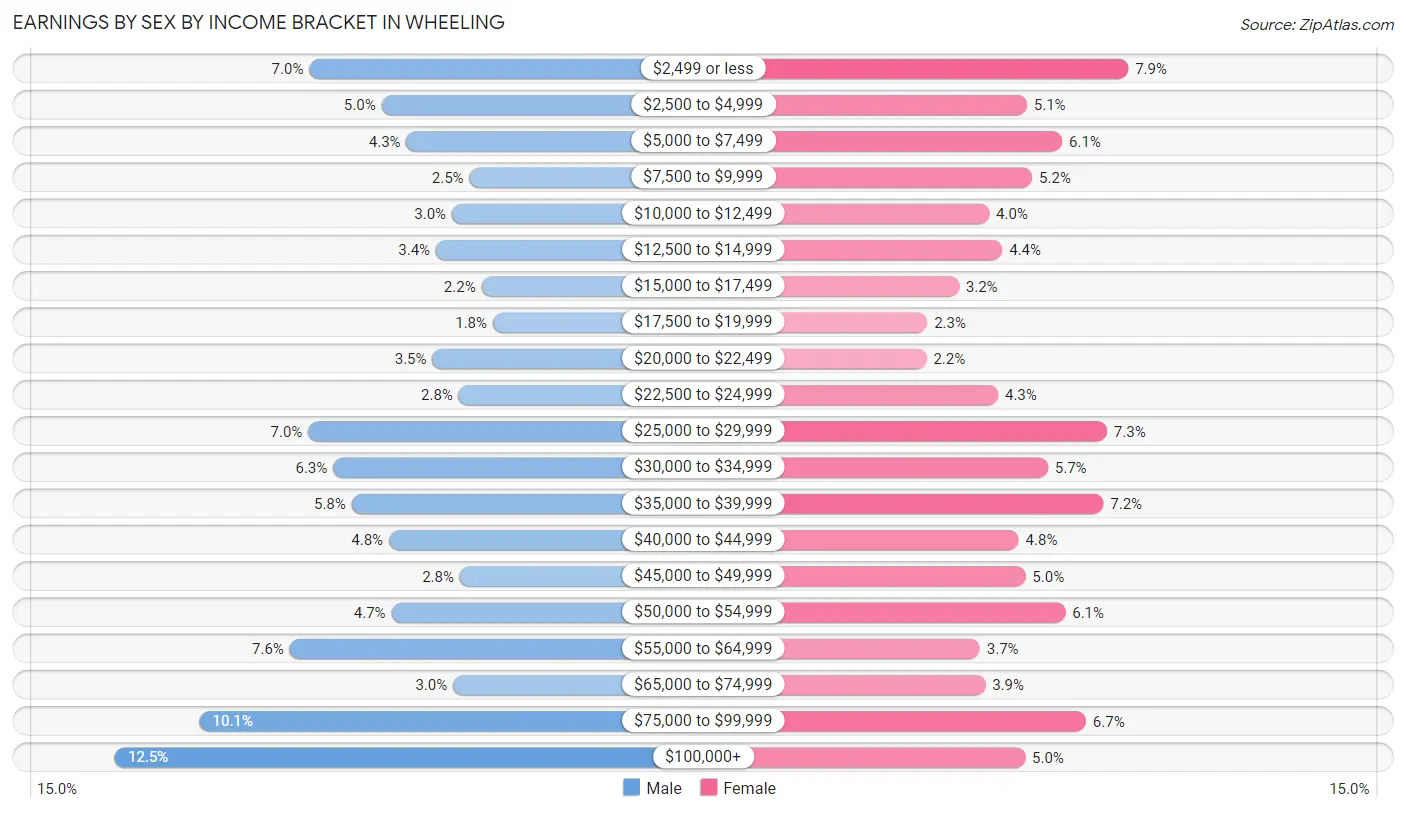
Earnings by Sex by Income Bracket in Wheeling
The most common earnings brackets in Wheeling are $100,000+ for men (858 | 12.5%) and $2,499 or less for women (480 | 7.9%).
| Income | Male | Female |
| $2,499 or less | 482 (7.0%) | 480 (7.9%) |
| $2,500 to $4,999 | 342 (5.0%) | 307 (5.1%) |
| $5,000 to $7,499 | 294 (4.3%) | 367 (6.0%) |
| $7,500 to $9,999 | 172 (2.5%) | 316 (5.2%) |
| $10,000 to $12,499 | 206 (3.0%) | 243 (4.0%) |
| $12,500 to $14,999 | 237 (3.4%) | 265 (4.4%) |
| $15,000 to $17,499 | 149 (2.2%) | 191 (3.2%) |
| $17,500 to $19,999 | 127 (1.8%) | 137 (2.3%) |
| $20,000 to $22,499 | 244 (3.5%) | 136 (2.2%) |
| $22,500 to $24,999 | 193 (2.8%) | 258 (4.3%) |
| $25,000 to $29,999 | 484 (7.0%) | 444 (7.3%) |
| $30,000 to $34,999 | 436 (6.3%) | 343 (5.7%) |
| $35,000 to $39,999 | 400 (5.8%) | 438 (7.2%) |
| $40,000 to $44,999 | 328 (4.8%) | 293 (4.8%) |
| $45,000 to $49,999 | 191 (2.8%) | 305 (5.0%) |
| $50,000 to $54,999 | 323 (4.7%) | 373 (6.1%) |
| $55,000 to $64,999 | 520 (7.5%) | 227 (3.7%) |
| $65,000 to $74,999 | 204 (3.0%) | 236 (3.9%) |
| $75,000 to $99,999 | 694 (10.1%) | 408 (6.7%) |
| $100,000+ | 858 (12.5%) | 304 (5.0%) |
| Total | 6,884 (100.0%) | 6,071 (100.0%) |
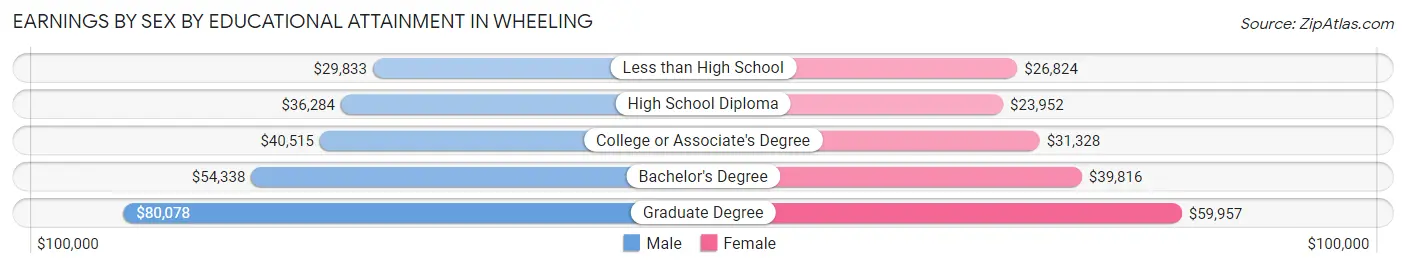
Earnings by Sex by Educational Attainment in Wheeling
Average earnings in Wheeling are $42,941 for men and $35,342 for women, a difference of 17.7%. Men with an educational attainment of graduate degree enjoy the highest average annual earnings of $80,078, while those with less than high school education earn the least with $29,833. Women with an educational attainment of graduate degree earn the most with the average annual earnings of $59,957, while those with high school diploma education have the smallest earnings of $23,952.
| Educational Attainment | Male Income | Female Income |
| Less than High School | $29,833 | $26,824 |
| High School Diploma | $36,284 | $23,952 |
| College or Associate's Degree | $40,515 | $31,328 |
| Bachelor's Degree | $54,338 | $39,816 |
| Graduate Degree | $80,078 | $59,957 |
| Total | $42,941 | $35,342 |
Family Income in Wheeling
Family Income Brackets in Wheeling
According to the Wheeling family income data, there are 1,187 families falling into the $100,000 to $149,999 income range, which is the most common income bracket and makes up 19.6% of all families. Conversely, the $10,000 to $14,999 income bracket is the least frequent group with only 164 families (2.7%) belonging to this category.
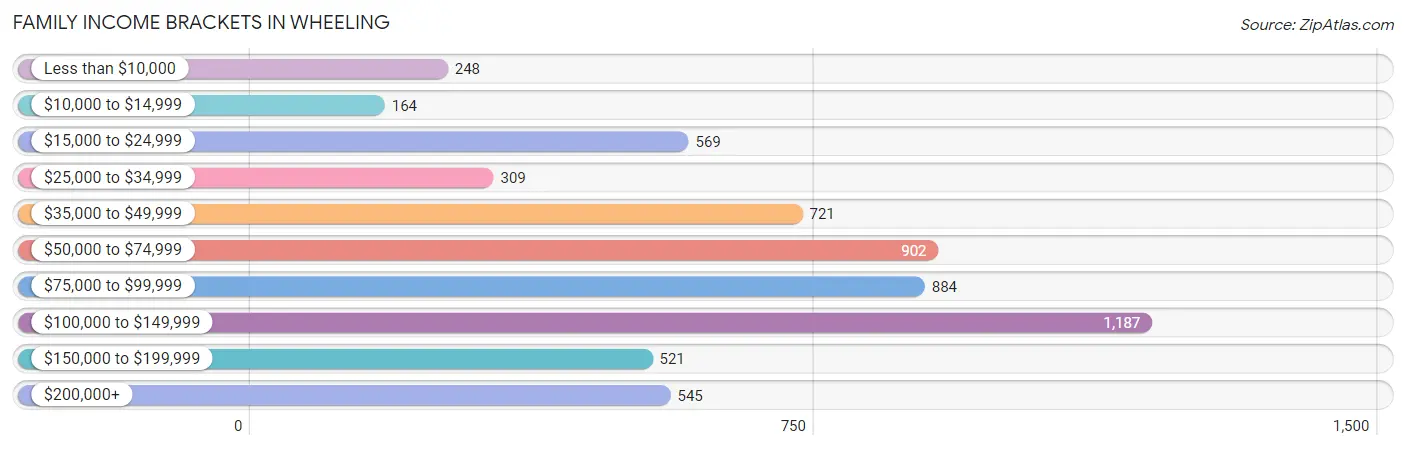
| Income Bracket | # Families | % Families |
| Less than $10,000 | 248 | 4.1% |
| $10,000 to $14,999 | 164 | 2.7% |
| $15,000 to $24,999 | 569 | 9.4% |
| $25,000 to $34,999 | 309 | 5.1% |
| $35,000 to $49,999 | 721 | 11.9% |
| $50,000 to $74,999 | 902 | 14.9% |
| $75,000 to $99,999 | 884 | 14.6% |
| $100,000 to $149,999 | 1,187 | 19.6% |
| $150,000 to $199,999 | 521 | 8.6% |
| $200,000+ | 545 | 9.0% |
Family Income by Famaliy Size in Wheeling
5-person families (299 | 4.9%) account for the highest median family income in Wheeling with $100,495 per family, while 2-person families (3,206 | 52.9%) have the highest median income of $35,540 per family member.
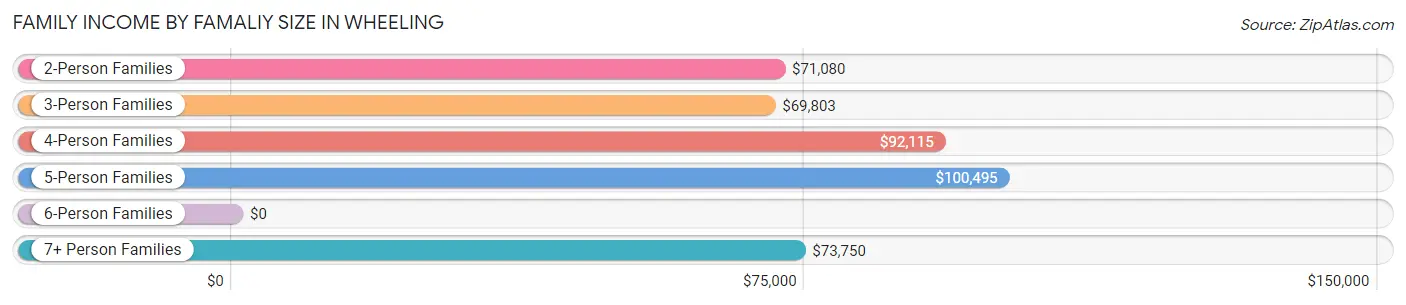
| Income Bracket | # Families | Median Income |
| 2-Person Families | 3,206 (52.9%) | $71,080 |
| 3-Person Families | 1,294 (21.4%) | $69,803 |
| 4-Person Families | 1,094 (18.1%) | $92,115 |
| 5-Person Families | 299 (4.9%) | $100,495 |
| 6-Person Families | 140 (2.3%) | $0 |
| 7+ Person Families | 23 (0.4%) | $73,750 |
| Total | 6,056 (100.0%) | $78,607 |
Family Income by Number of Earners in Wheeling
The median family income in Wheeling is $78,607, with families comprising 3+ earners (550) having the highest median family income of $132,027, while families with no earners (1,182) have the lowest median family income of $36,181, accounting for 9.1% and 19.5% of families, respectively.
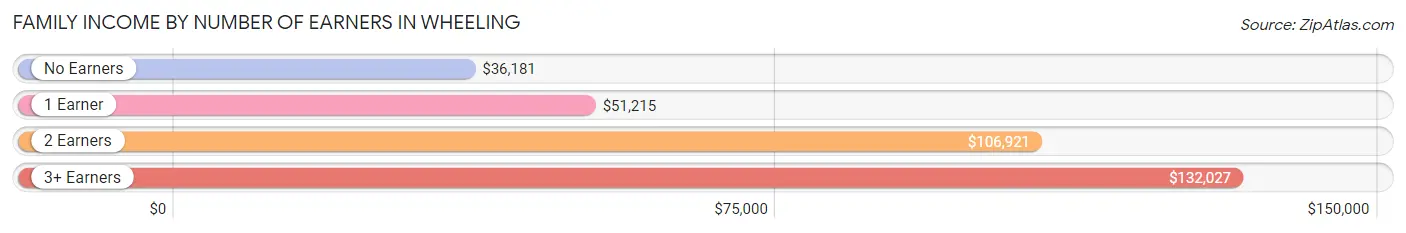
| Number of Earners | # Families | Median Income |
| No Earners | 1,182 (19.5%) | $36,181 |
| 1 Earner | 2,043 (33.7%) | $51,215 |
| 2 Earners | 2,281 (37.7%) | $106,921 |
| 3+ Earners | 550 (9.1%) | $132,027 |
| Total | 6,056 (100.0%) | $78,607 |
Household Income in Wheeling
Household Income Brackets in Wheeling
With 1,646 households falling in the category, the $50,000 to $74,999 income range is the most frequent in Wheeling, accounting for 14.0% of all households. In contrast, only 588 households (5.0%) fall into the $150,000 to $199,999 income bracket, making it the least populous group.
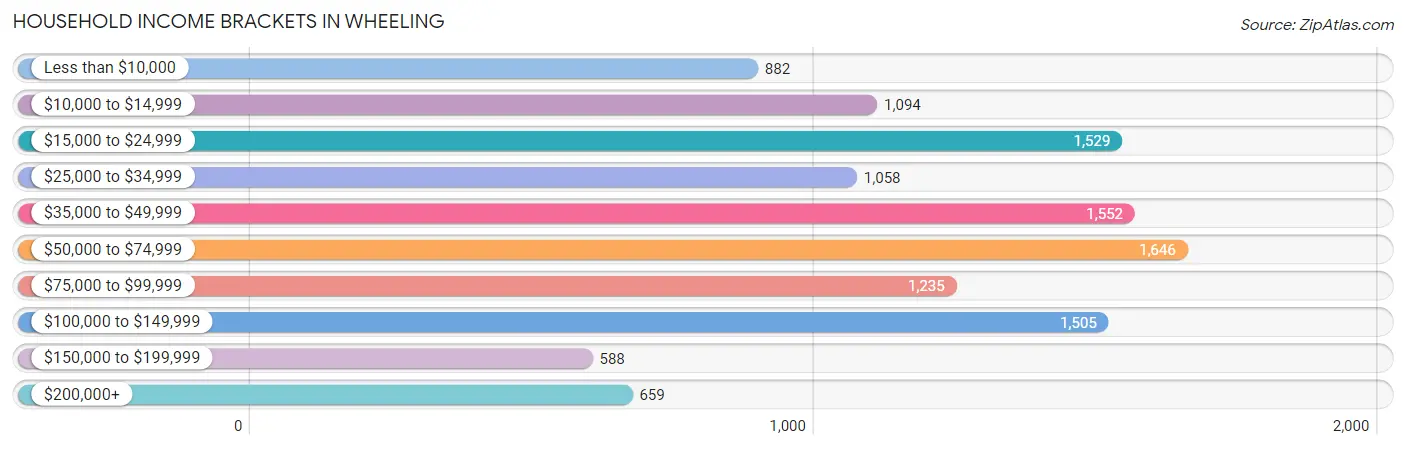
| Income Bracket | # Households | % Households |
| Less than $10,000 | 882 | 7.5% |
| $10,000 to $14,999 | 1,094 | 9.3% |
| $15,000 to $24,999 | 1,529 | 13.0% |
| $25,000 to $34,999 | 1,058 | 9.0% |
| $35,000 to $49,999 | 1,552 | 13.2% |
| $50,000 to $74,999 | 1,646 | 14.0% |
| $75,000 to $99,999 | 1,235 | 10.5% |
| $100,000 to $149,999 | 1,505 | 12.8% |
| $150,000 to $199,999 | 588 | 5.0% |
| $200,000+ | 659 | 5.6% |
Household Income by Householder Age in Wheeling
The median household income in Wheeling is $46,516, with the highest median household income of $58,942 found in the 45 to 64 years age bracket for the primary householder. A total of 3,826 households (32.5%) fall into this category. Meanwhile, the 15 to 24 years age bracket for the primary householder has the lowest median household income of $21,509, with 276 households (2.4%) in this group.
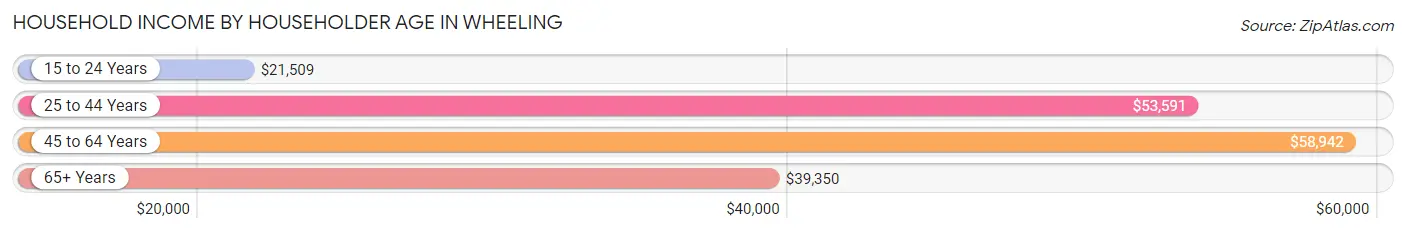
| Income Bracket | # Households | Median Income |
| 15 to 24 Years | 276 (2.4%) | $21,509 |
| 25 to 44 Years | 2,955 (25.1%) | $53,591 |
| 45 to 64 Years | 3,826 (32.5%) | $58,942 |
| 65+ Years | 4,703 (40.0%) | $39,350 |
| Total | 11,760 (100.0%) | $46,516 |
Poverty in Wheeling
Income Below Poverty by Sex and Age in Wheeling
With 15.5% poverty level for males and 20.8% for females among the residents of Wheeling, 6 to 11 year old males and under 5 year old females are the most vulnerable to poverty, with 238 males (31.7%) and 242 females (36.2%) in their respective age groups living below the poverty level.
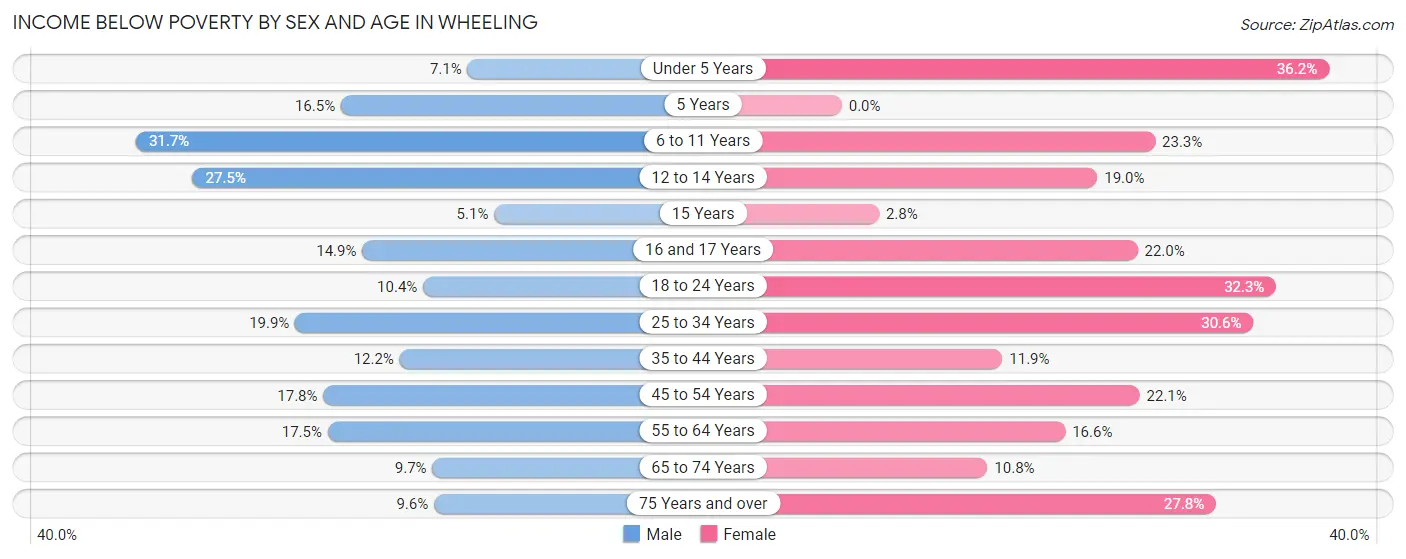
| Age Bracket | Male | Female |
| Under 5 Years | 47 (7.1%) | 242 (36.2%) |
| 5 Years | 18 (16.5%) | 0 (0.0%) |
| 6 to 11 Years | 238 (31.7%) | 211 (23.3%) |
| 12 to 14 Years | 125 (27.5%) | 81 (19.0%) |
| 15 Years | 6 (5.1%) | 6 (2.8%) |
| 16 and 17 Years | 56 (14.9%) | 65 (22.0%) |
| 18 to 24 Years | 103 (10.4%) | 208 (32.3%) |
| 25 to 34 Years | 308 (19.9%) | 468 (30.5%) |
| 35 to 44 Years | 168 (12.1%) | 180 (11.9%) |
| 45 to 54 Years | 252 (17.8%) | 337 (22.1%) |
| 55 to 64 Years | 327 (17.5%) | 334 (16.6%) |
| 65 to 74 Years | 162 (9.7%) | 214 (10.8%) |
| 75 Years and over | 93 (9.6%) | 443 (27.8%) |
| Total | 1,903 (15.5%) | 2,789 (20.8%) |
Income Above Poverty by Sex and Age in Wheeling
According to the poverty statistics in Wheeling, males aged 15 years and females aged 5 years are the age groups that are most secure financially, with 94.9% of males and 100.0% of females in these age groups living above the poverty line.
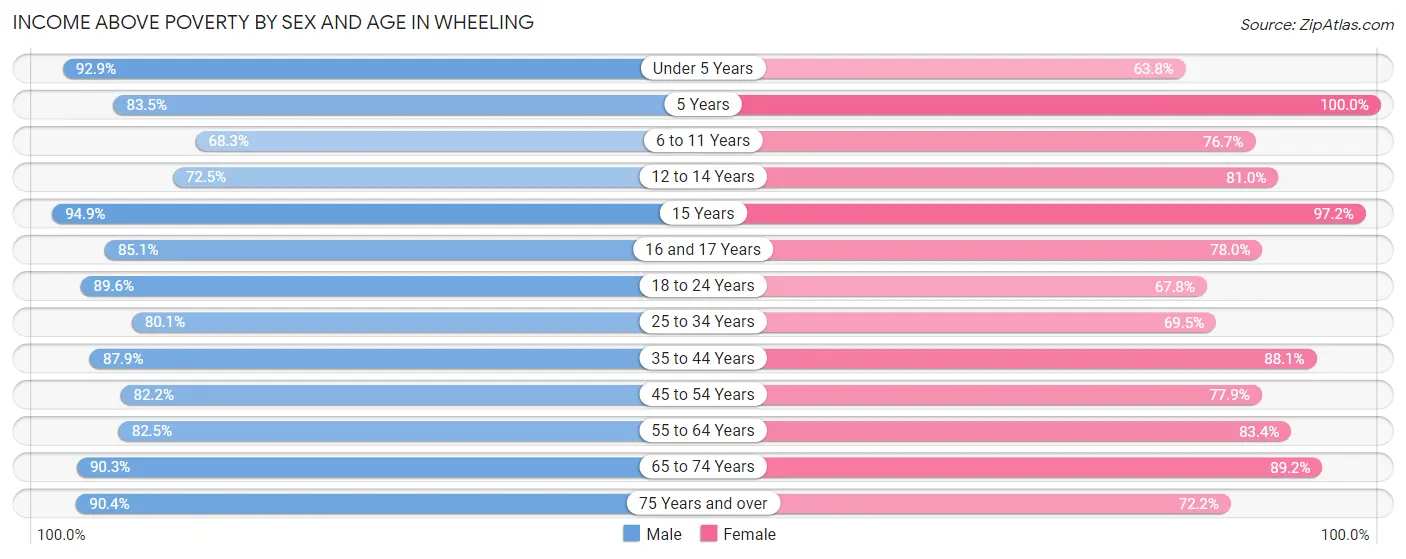
| Age Bracket | Male | Female |
| Under 5 Years | 614 (92.9%) | 427 (63.8%) |
| 5 Years | 91 (83.5%) | 97 (100.0%) |
| 6 to 11 Years | 512 (68.3%) | 696 (76.7%) |
| 12 to 14 Years | 329 (72.5%) | 346 (81.0%) |
| 15 Years | 111 (94.9%) | 211 (97.2%) |
| 16 and 17 Years | 319 (85.1%) | 231 (78.0%) |
| 18 to 24 Years | 886 (89.6%) | 437 (67.7%) |
| 25 to 34 Years | 1,239 (80.1%) | 1,064 (69.5%) |
| 35 to 44 Years | 1,215 (87.8%) | 1,330 (88.1%) |
| 45 to 54 Years | 1,162 (82.2%) | 1,187 (77.9%) |
| 55 to 64 Years | 1,543 (82.5%) | 1,679 (83.4%) |
| 65 to 74 Years | 1,504 (90.3%) | 1,765 (89.2%) |
| 75 Years and over | 876 (90.4%) | 1,151 (72.2%) |
| Total | 10,401 (84.5%) | 10,621 (79.2%) |
Income Below Poverty Among Married-Couple Families in Wheeling
The poverty statistics for married-couple families in Wheeling show that 6.1% or 255 of the total 4,182 families live below the poverty line. Families with 3 or 4 children have the highest poverty rate of 18.1%, comprising of 48 families. On the other hand, families with 5 or more children have the lowest poverty rate of 0.0%, which includes 0 families.
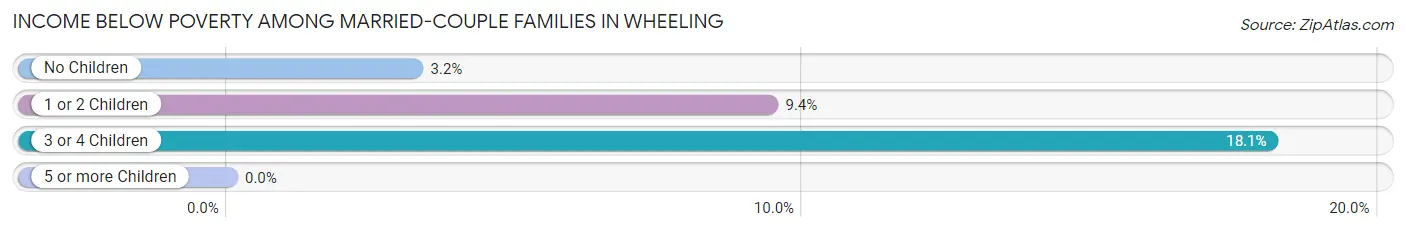
| Children | Above Poverty | Below Poverty |
| No Children | 2,515 (96.8%) | 84 (3.2%) |
| 1 or 2 Children | 1,184 (90.6%) | 123 (9.4%) |
| 3 or 4 Children | 217 (81.9%) | 48 (18.1%) |
| 5 or more Children | 11 (100.0%) | 0 (0.0%) |
| Total | 3,927 (93.9%) | 255 (6.1%) |
Income Below Poverty Among Single-Parent Households in Wheeling
According to the poverty data in Wheeling, 22.1% or 106 single-father households and 26.0% or 363 single-mother households are living below the poverty line. Among single-father households, those with no children have the highest poverty rate, with 48 households (26.1%) experiencing poverty. Likewise, among single-mother households, those with 3 or 4 children have the highest poverty rate, with 68 households (70.1%) falling below the poverty line.
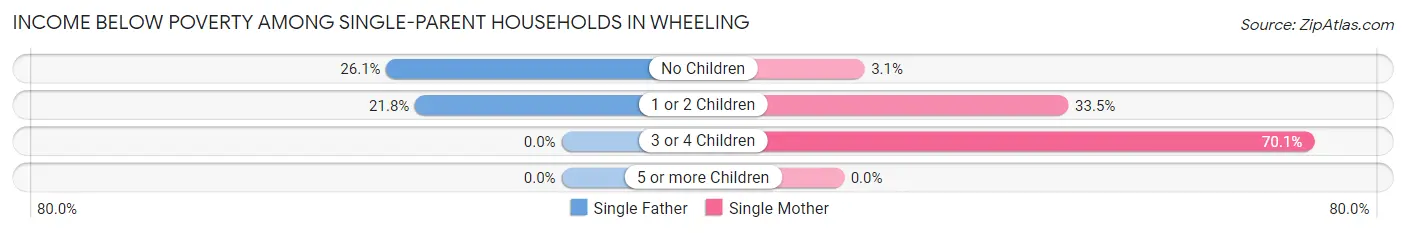
| Children | Single Father | Single Mother |
| No Children | 48 (26.1%) | 14 (3.1%) |
| 1 or 2 Children | 58 (21.8%) | 281 (33.5%) |
| 3 or 4 Children | 0 (0.0%) | 68 (70.1%) |
| 5 or more Children | 0 (0.0%) | 0 (0.0%) |
| Total | 106 (22.1%) | 363 (26.0%) |
Income Below Poverty Among Married-Couple vs Single-Parent Households in Wheeling
The poverty data for Wheeling shows that 255 of the married-couple family households (6.1%) and 469 of the single-parent households (25.0%) are living below the poverty level. Within the married-couple family households, those with 3 or 4 children have the highest poverty rate, with 48 households (18.1%) falling below the poverty line. Among the single-parent households, those with 3 or 4 children have the highest poverty rate, with 68 household (54.0%) living below poverty.
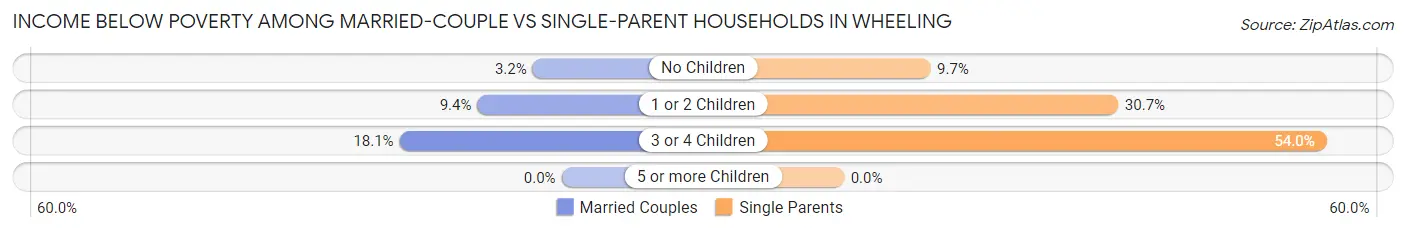
| Children | Married-Couple Families | Single-Parent Households |
| No Children | 84 (3.2%) | 62 (9.7%) |
| 1 or 2 Children | 123 (9.4%) | 339 (30.6%) |
| 3 or 4 Children | 48 (18.1%) | 68 (54.0%) |
| 5 or more Children | 0 (0.0%) | 0 (0.0%) |
| Total | 255 (6.1%) | 469 (25.0%) |
Race in Wheeling
The most populous races in Wheeling are White / Caucasian (24,294 | 90.3%), Two or more Races (1,179 | 4.4%), and Black / African American (1,160 | 4.3%).
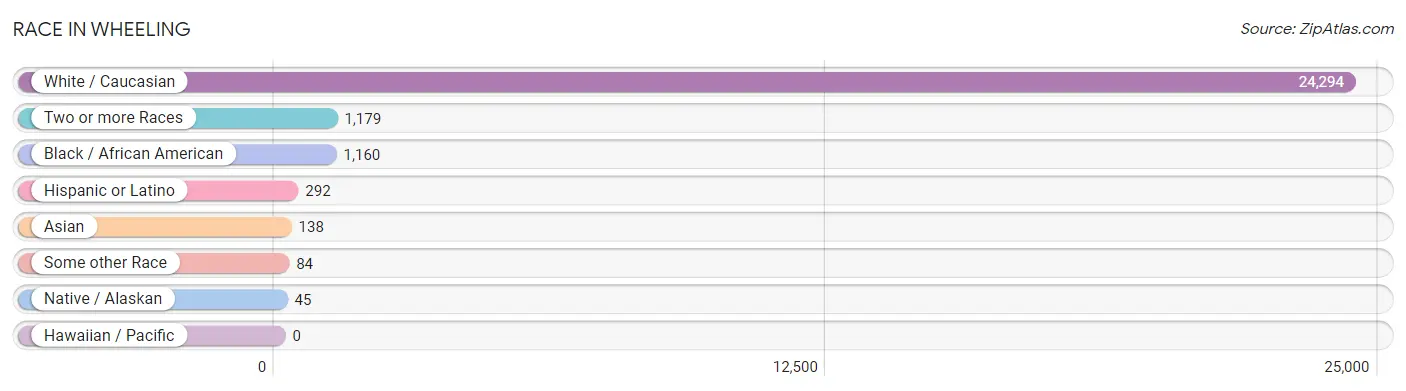
| Race | # Population | % Population |
| Asian | 138 | 0.5% |
| Black / African American | 1,160 | 4.3% |
| Hawaiian / Pacific | 0 | 0.0% |
| Hispanic or Latino | 292 | 1.1% |
| Native / Alaskan | 45 | 0.2% |
| White / Caucasian | 24,294 | 90.3% |
| Two or more Races | 1,179 | 4.4% |
| Some other Race | 84 | 0.3% |
| Total | 26,900 | 100.0% |
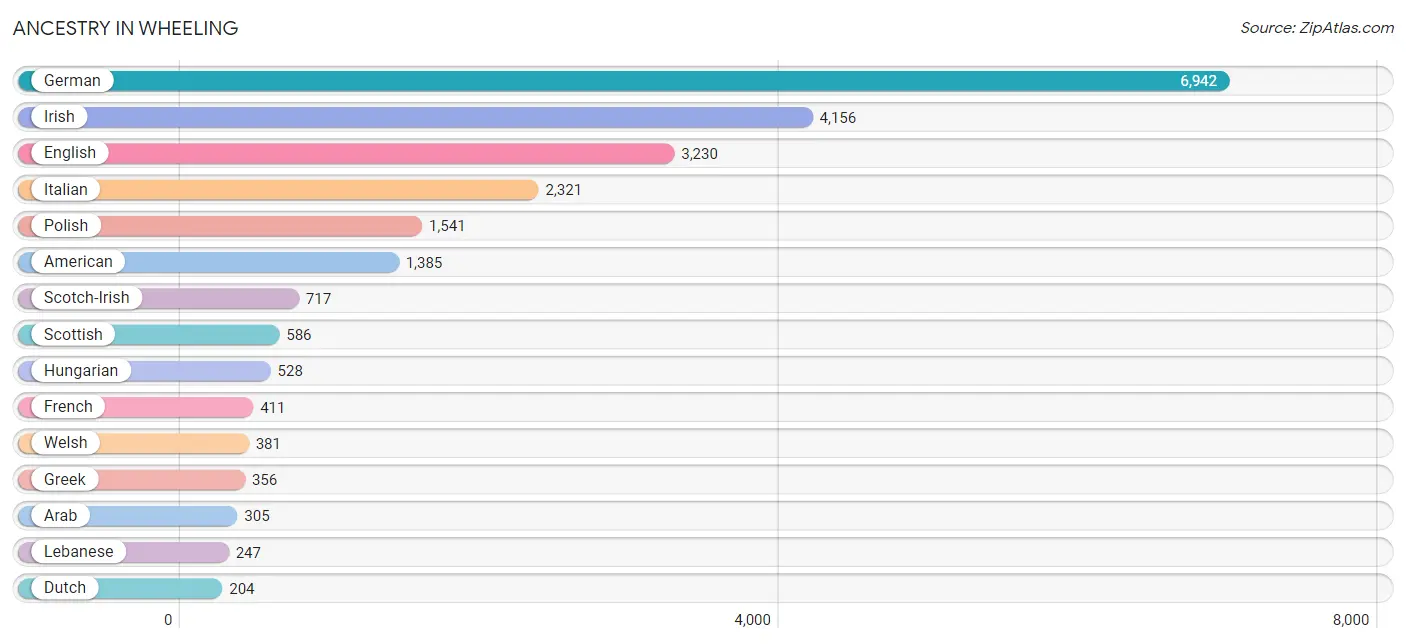
Ancestry in Wheeling
The most populous ancestries reported in Wheeling are German (6,942 | 25.8%), Irish (4,156 | 15.4%), English (3,230 | 12.0%), Italian (2,321 | 8.6%), and Polish (1,541 | 5.7%), together accounting for 67.6% of all Wheeling residents.
| Ancestry | # Population | % Population |
| African | 145 | 0.5% |
| American | 1,385 | 5.1% |
| Arab | 305 | 1.1% |
| Argentinean | 16 | 0.1% |
| Assyrian / Chaldean / Syriac | 8 | 0.0% |
| Australian | 44 | 0.2% |
| Austrian | 27 | 0.1% |
| Basque | 15 | 0.1% |
| Belgian | 12 | 0.0% |
| Bhutanese | 66 | 0.3% |
| Blackfeet | 7 | 0.0% |
| British | 131 | 0.5% |
| Burmese | 30 | 0.1% |
| Canadian | 25 | 0.1% |
| Central American Indian | 7 | 0.0% |
| Cherokee | 48 | 0.2% |
| Colombian | 25 | 0.1% |
| Creek | 6 | 0.0% |
| Croatian | 121 | 0.4% |
| Cuban | 25 | 0.1% |
| Czech | 127 | 0.5% |
| Czechoslovakian | 74 | 0.3% |
| Danish | 5 | 0.0% |
| Dutch | 204 | 0.8% |
| Eastern European | 30 | 0.1% |
| English | 3,230 | 12.0% |
| European | 194 | 0.7% |
| Filipino | 5 | 0.0% |
| Finnish | 25 | 0.1% |
| French | 411 | 1.5% |
| French Canadian | 44 | 0.2% |
| German | 6,942 | 25.8% |
| Greek | 356 | 1.3% |
| Guyanese | 28 | 0.1% |
| Haitian | 36 | 0.1% |
| Hungarian | 528 | 2.0% |
| Indian (Asian) | 33 | 0.1% |
| Iranian | 11 | 0.0% |
| Iraqi | 8 | 0.0% |
| Irish | 4,156 | 15.4% |
| Italian | 2,321 | 8.6% |
| Jamaican | 3 | 0.0% |
| Korean | 118 | 0.4% |
| Laotian | 1 | 0.0% |
| Lebanese | 247 | 0.9% |
| Lithuanian | 57 | 0.2% |
| Luxembourger | 8 | 0.0% |
| Mexican | 135 | 0.5% |
| Mexican American Indian | 54 | 0.2% |
| Nigerian | 16 | 0.1% |
| Northern European | 37 | 0.1% |
| Norwegian | 138 | 0.5% |
| Pakistani | 12 | 0.0% |
| Pennsylvania German | 5 | 0.0% |
| Polish | 1,541 | 5.7% |
| Portuguese | 43 | 0.2% |
| Puerto Rican | 15 | 0.1% |
| Romanian | 97 | 0.4% |
| Russian | 195 | 0.7% |
| Scandinavian | 85 | 0.3% |
| Scotch-Irish | 717 | 2.7% |
| Scottish | 586 | 2.2% |
| Seminole | 1 | 0.0% |
| Serbian | 4 | 0.0% |
| Shoshone | 2 | 0.0% |
| Slavic | 11 | 0.0% |
| Slovak | 195 | 0.7% |
| Slovene | 17 | 0.1% |
| South American | 56 | 0.2% |
| Spaniard | 44 | 0.2% |
| Spanish | 17 | 0.1% |
| Subsaharan African | 161 | 0.6% |
| Swedish | 156 | 0.6% |
| Swiss | 153 | 0.6% |
| Syrian | 56 | 0.2% |
| Thai | 41 | 0.2% |
| Turkish | 21 | 0.1% |
| Ukrainian | 40 | 0.2% |
| Venezuelan | 15 | 0.1% |
| Welsh | 381 | 1.4% |
| West Indian | 1 | 0.0% |
| Yugoslavian | 17 | 0.1% | View All 82 Rows |
Immigrants in Wheeling
The most numerous immigrant groups reported in Wheeling came from Europe (255 | 0.9%), Asia (136 | 0.5%), Latin America (124 | 0.5%), Italy (117 | 0.4%), and Southern Europe (117 | 0.4%), together accounting for 2.8% of all Wheeling residents.
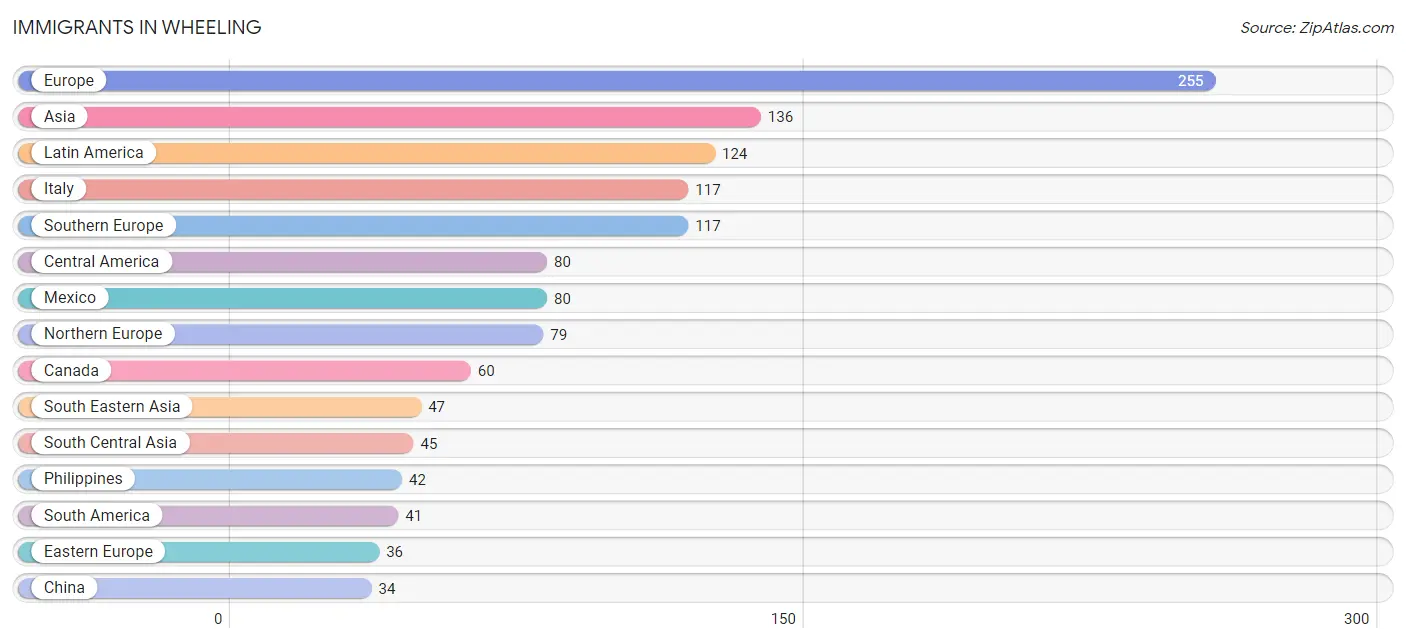
| Immigration Origin | # Population | % Population |
| Argentina | 16 | 0.1% |
| Asia | 136 | 0.5% |
| Australia | 16 | 0.1% |
| Canada | 60 | 0.2% |
| Caribbean | 3 | 0.0% |
| Central America | 80 | 0.3% |
| China | 34 | 0.1% |
| Colombia | 17 | 0.1% |
| Eastern Asia | 34 | 0.1% |
| Eastern Europe | 36 | 0.1% |
| England | 11 | 0.0% |
| Europe | 255 | 0.9% |
| France | 5 | 0.0% |
| Germany | 18 | 0.1% |
| Hong Kong | 17 | 0.1% |
| India | 34 | 0.1% |
| Indonesia | 5 | 0.0% |
| Iran | 11 | 0.0% |
| Italy | 117 | 0.4% |
| Jamaica | 3 | 0.0% |
| Latin America | 124 | 0.5% |
| Lebanon | 10 | 0.0% |
| Mexico | 80 | 0.3% |
| Moldova | 15 | 0.1% |
| Northern Europe | 79 | 0.3% |
| Oceania | 16 | 0.1% |
| Philippines | 42 | 0.2% |
| South America | 41 | 0.2% |
| South Central Asia | 45 | 0.2% |
| South Eastern Asia | 47 | 0.2% |
| Southern Europe | 117 | 0.4% |
| Taiwan | 5 | 0.0% |
| Venezuela | 8 | 0.0% |
| Western Asia | 10 | 0.0% |
| Western Europe | 23 | 0.1% | View All 35 Rows |
Sex and Age in Wheeling
Sex and Age in Wheeling
The most populous age groups in Wheeling are 65 to 69 Years (1,047 | 8.2%) for men and 65 to 69 Years (1,166 | 8.3%) for women.
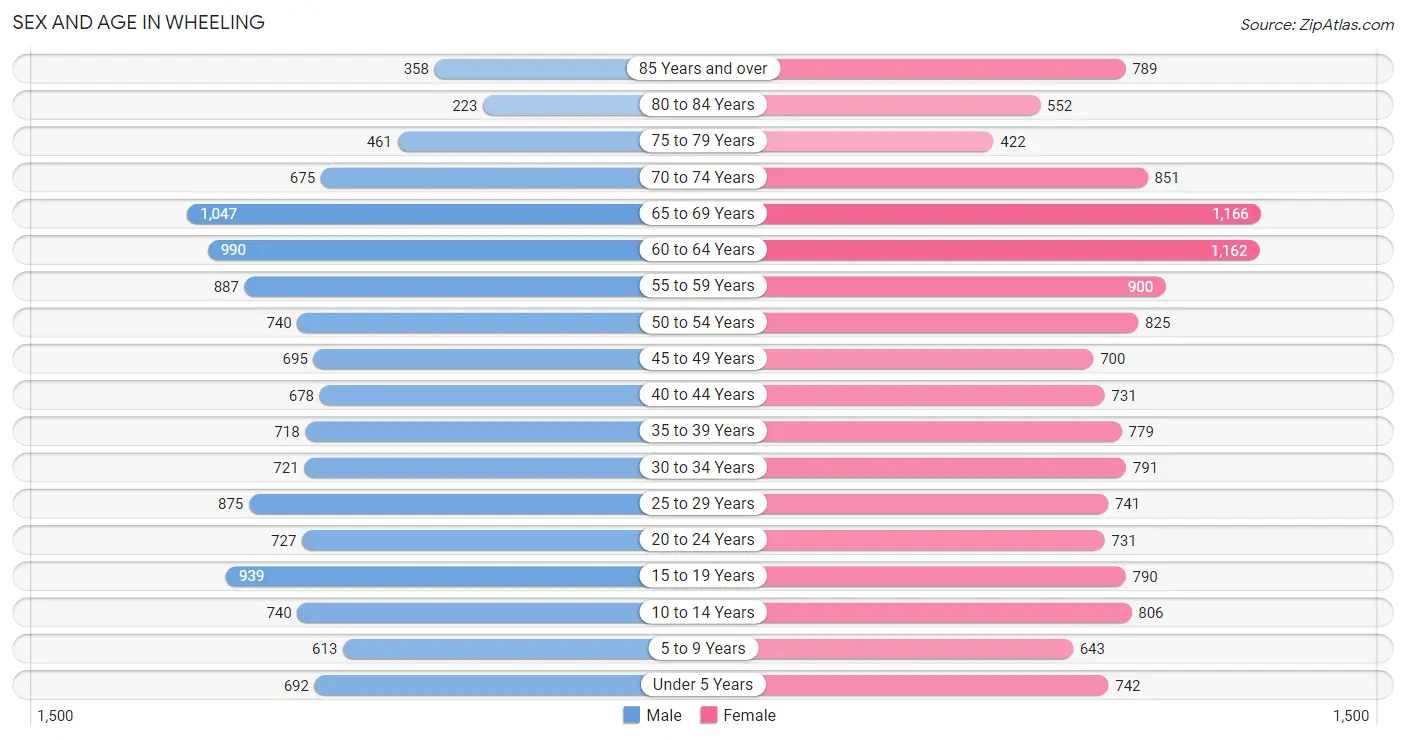
| Age Bracket | Male | Female |
| Under 5 Years | 692 (5.4%) | 742 (5.2%) |
| 5 to 9 Years | 613 (4.8%) | 643 (4.5%) |
| 10 to 14 Years | 740 (5.8%) | 806 (5.7%) |
| 15 to 19 Years | 939 (7.3%) | 790 (5.6%) |
| 20 to 24 Years | 727 (5.7%) | 731 (5.2%) |
| 25 to 29 Years | 875 (6.9%) | 741 (5.2%) |
| 30 to 34 Years | 721 (5.6%) | 791 (5.6%) |
| 35 to 39 Years | 718 (5.6%) | 779 (5.5%) |
| 40 to 44 Years | 678 (5.3%) | 731 (5.2%) |
| 45 to 49 Years | 695 (5.4%) | 700 (5.0%) |
| 50 to 54 Years | 740 (5.8%) | 825 (5.8%) |
| 55 to 59 Years | 887 (6.9%) | 900 (6.4%) |
| 60 to 64 Years | 990 (7.7%) | 1,162 (8.2%) |
| 65 to 69 Years | 1,047 (8.2%) | 1,166 (8.3%) |
| 70 to 74 Years | 675 (5.3%) | 851 (6.0%) |
| 75 to 79 Years | 461 (3.6%) | 422 (3.0%) |
| 80 to 84 Years | 223 (1.8%) | 552 (3.9%) |
| 85 Years and over | 358 (2.8%) | 789 (5.6%) |
| Total | 12,779 (100.0%) | 14,121 (100.0%) |
Families and Households in Wheeling
Median Family Size in Wheeling
The median family size in Wheeling is 3.06 persons per family, with married-couple families (4,182 | 69.1%) accounting for the largest median family size of 3.07 persons per family. On the other hand, single male/father families (479 | 7.9%) represent the smallest median family size with 2.99 persons per family.
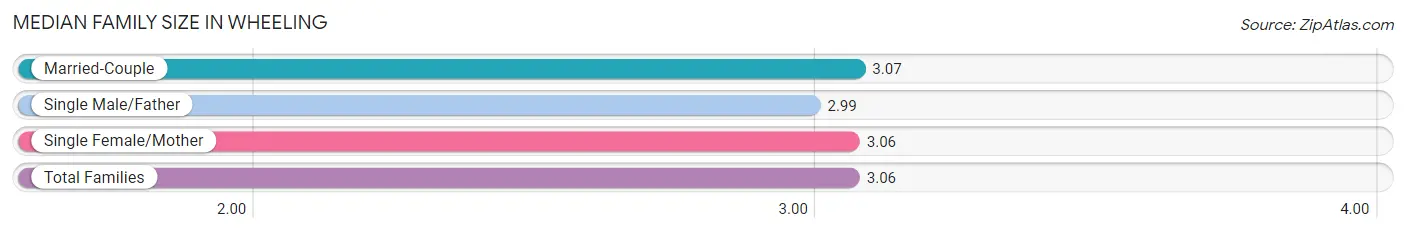
| Family Type | # Families | Family Size |
| Married-Couple | 4,182 (69.1%) | 3.07 |
| Single Male/Father | 479 (7.9%) | 2.99 |
| Single Female/Mother | 1,395 (23.0%) | 3.06 |
| Total Families | 6,056 (100.0%) | 3.06 |
Median Household Size in Wheeling
The median household size in Wheeling is 2.19 persons per household, with single male/father households (479 | 4.1%) accounting for the largest median household size of 3.35 persons per household. non-family households (5,704 | 48.5%) represent the smallest median household size with 1.18 persons per household.
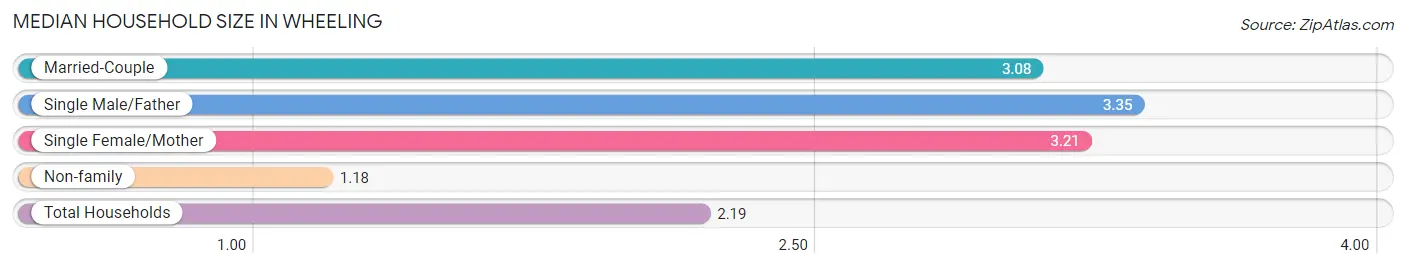
| Household Type | # Households | Household Size |
| Married-Couple | 4,182 (35.6%) | 3.08 |
| Single Male/Father | 479 (4.1%) | 3.35 |
| Single Female/Mother | 1,395 (11.9%) | 3.21 |
| Non-family | 5,704 (48.5%) | 1.18 |
| Total Households | 11,760 (100.0%) | 2.19 |
Household Size by Marriage Status in Wheeling
Out of a total of 11,760 households in Wheeling, 6,056 (51.5%) are family households, while 5,704 (48.5%) are nonfamily households. The most numerous type of family households are 2-person households, comprising 3,012, and the most common type of nonfamily households are 1-person households, comprising 5,077.
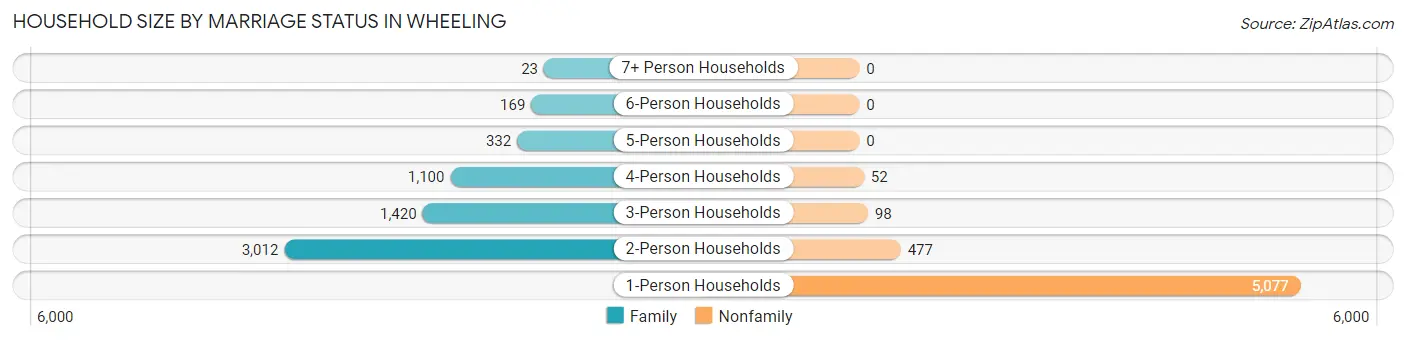
| Household Size | Family Households | Nonfamily Households |
| 1-Person Households | - | 5,077 (43.2%) |
| 2-Person Households | 3,012 (25.6%) | 477 (4.1%) |
| 3-Person Households | 1,420 (12.1%) | 98 (0.8%) |
| 4-Person Households | 1,100 (9.3%) | 52 (0.4%) |
| 5-Person Households | 332 (2.8%) | 0 (0.0%) |
| 6-Person Households | 169 (1.4%) | 0 (0.0%) |
| 7+ Person Households | 23 (0.2%) | 0 (0.0%) |
| Total | 6,056 (51.5%) | 5,704 (48.5%) |
Female Fertility in Wheeling
Fertility by Age in Wheeling
Average fertility rate in Wheeling is 41.0 births per 1,000 women. Women in the age bracket of 20 to 34 years have the highest fertility rate with 75.0 births per 1,000 women. Women in the age bracket of 20 to 34 years acount for 75.1% of all women with births.
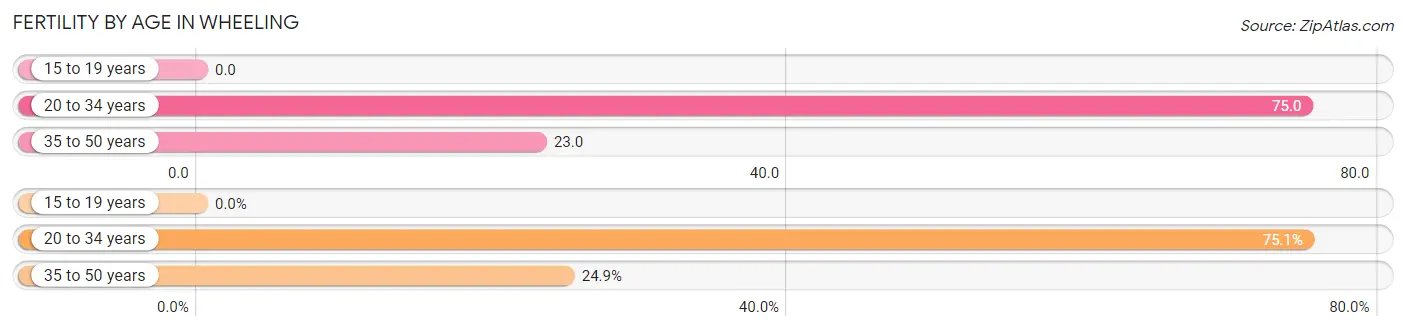
| Age Bracket | Women with Births | Births / 1,000 Women |
| 15 to 19 years | 0 (0.0%) | 0.0 |
| 20 to 34 years | 169 (75.1%) | 75.0 |
| 35 to 50 years | 56 (24.9%) | 23.0 |
| Total | 225 (100.0%) | 41.0 |
Fertility by Age by Marriage Status in Wheeling
57.8% of women with births (225) in Wheeling are married. The highest percentage of unmarried women with births falls into 35 to 50 years age bracket with 44.6% of them unmarried at the time of birth, while the lowest percentage of unmarried women with births belong to 20 to 34 years age bracket with 41.4% of them unmarried.
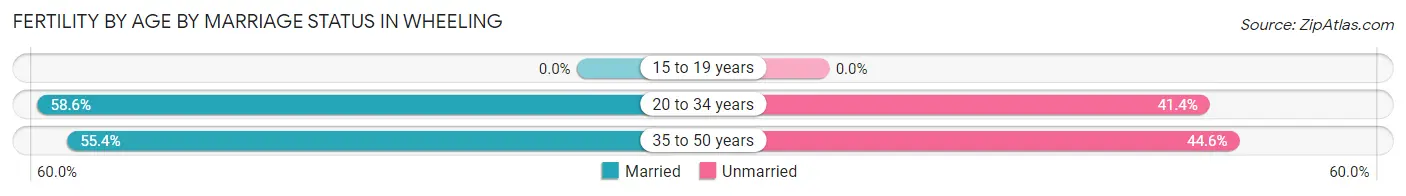
| Age Bracket | Married | Unmarried |
| 15 to 19 years | 0 (0.0%) | 0 (0.0%) |
| 20 to 34 years | 99 (58.6%) | 70 (41.4%) |
| 35 to 50 years | 31 (55.4%) | 25 (44.6%) |
| Total | 130 (57.8%) | 95 (42.2%) |
Fertility by Education in Wheeling
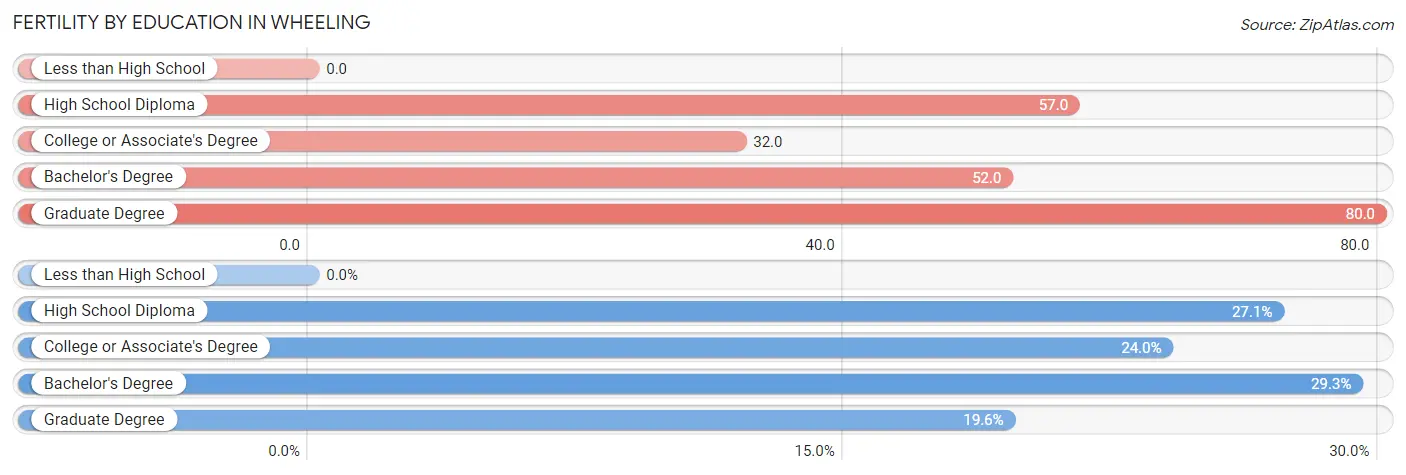
| Educational Attainment | Women with Births | Births / 1,000 Women |
| Less than High School | 0 (0.0%) | 0.0 |
| High School Diploma | 61 (27.1%) | 57.0 |
| College or Associate's Degree | 54 (24.0%) | 32.0 |
| Bachelor's Degree | 66 (29.3%) | 52.0 |
| Graduate Degree | 44 (19.6%) | 80.0 |
| Total | 225 (100.0%) | 41.0 |
Fertility by Education by Marriage Status in Wheeling
42.2% of women with births in Wheeling are unmarried. Women with the educational attainment of graduate degree are most likely to be married with 100.0% of them married at childbirth, while women with the educational attainment of college or associate's degree are least likely to be married with 81.5% of them unmarried at childbirth.
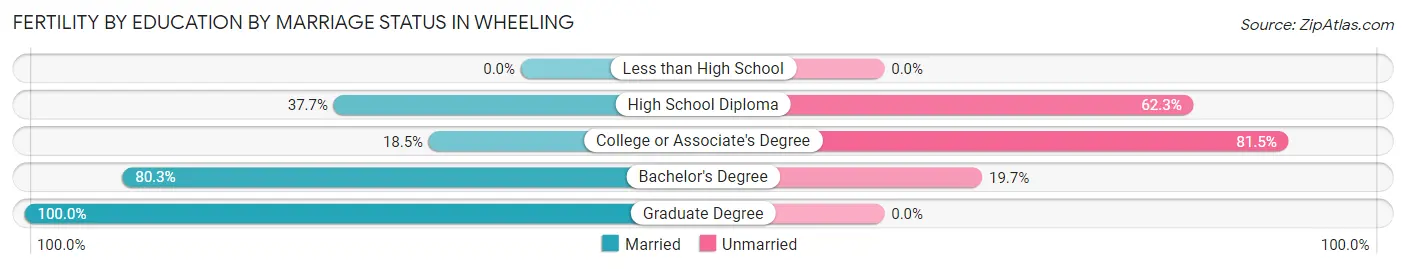
| Educational Attainment | Married | Unmarried |
| Less than High School | 0 (0.0%) | 0 (0.0%) |
| High School Diploma | 23 (37.7%) | 38 (62.3%) |
| College or Associate's Degree | 10 (18.5%) | 44 (81.5%) |
| Bachelor's Degree | 53 (80.3%) | 13 (19.7%) |
| Graduate Degree | 44 (100.0%) | 0 (0.0%) |
| Total | 130 (57.8%) | 95 (42.2%) |
Employment Characteristics in Wheeling
Employment by Class of Employer in Wheeling
Among the 11,055 employed individuals in Wheeling, private company employees (7,251 | 65.6%), not-for-profit organizations (1,599 | 14.5%), and local government employees (856 | 7.7%) make up the most common classes of employment.
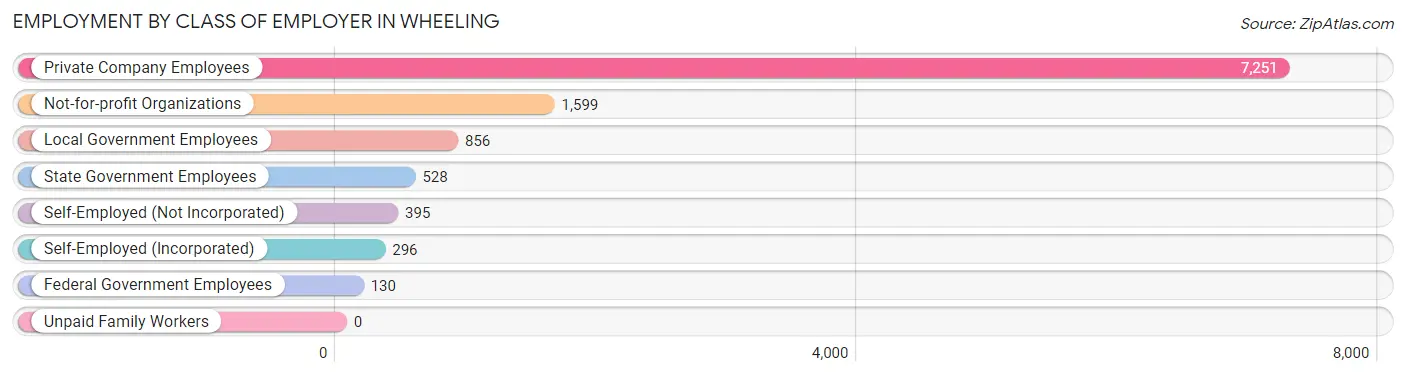
| Employer Class | # Employees | % Employees |
| Private Company Employees | 7,251 | 65.6% |
| Self-Employed (Incorporated) | 296 | 2.7% |
| Self-Employed (Not Incorporated) | 395 | 3.6% |
| Not-for-profit Organizations | 1,599 | 14.5% |
| Local Government Employees | 856 | 7.7% |
| State Government Employees | 528 | 4.8% |
| Federal Government Employees | 130 | 1.2% |
| Unpaid Family Workers | 0 | 0.0% |
| Total | 11,055 | 100.0% |
Employment Status by Age in Wheeling
According to the labor force statistics for Wheeling, out of the total population over 16 years of age (22,330), 54.0% or 12,058 individuals are in the labor force, with 6.2% or 748 of them unemployed. The age group with the highest labor force participation rate is 25 to 29 years, with 86.1% or 1,391 individuals in the labor force. Within the labor force, the 16 to 19 years age range has the highest percentage of unemployed individuals, with 19.0% or 98 of them being unemployed.

| Age Bracket | In Labor Force | Unemployed |
| 16 to 19 Years | 516 (37.0%) | 98 (19.0%) |
| 20 to 24 Years | 1,102 (75.6%) | 142 (12.9%) |
| 25 to 29 Years | 1,391 (86.1%) | 85 (6.1%) |
| 30 to 34 Years | 1,077 (71.2%) | 70 (6.5%) |
| 35 to 44 Years | 2,014 (69.3%) | 141 (7.0%) |
| 45 to 54 Years | 2,374 (80.2%) | 140 (5.9%) |
| 55 to 59 Years | 1,222 (68.4%) | 20 (1.6%) |
| 60 to 64 Years | 1,054 (49.0%) | 34 (3.2%) |
| 65 to 74 Years | 1,148 (30.7%) | 6 (0.5%) |
| 75 Years and over | 165 (5.9%) | 8 (4.8%) |
| Total | 12,058 (54.0%) | 748 (6.2%) |
Employment Status by Educational Attainment in Wheeling
According to labor force statistics for Wheeling, 70.6% of individuals (9,131) out of the total population between 25 and 64 years of age (12,933) are in the labor force, with 5.3% or 484 of them being unemployed. The group with the highest labor force participation rate are those with the educational attainment of bachelor's degree or higher, with 87.9% or 3,759 individuals in the labor force. Within the labor force, individuals with less than high school education have the highest percentage of unemployment, with 8.2% or 33 of them being unemployed.
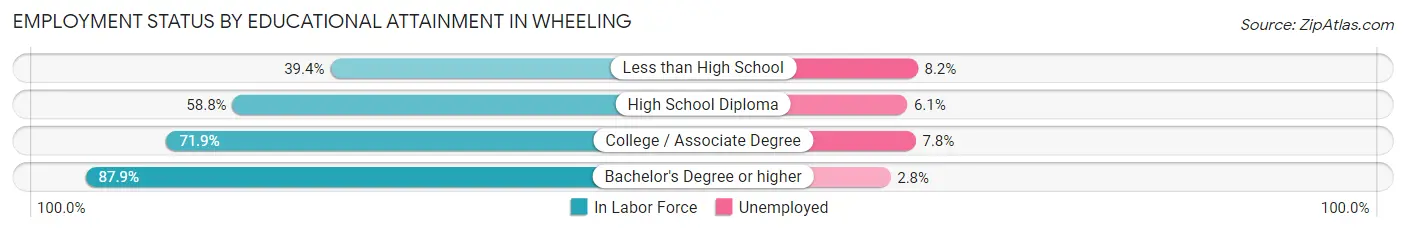
| Educational Attainment | In Labor Force | Unemployed |
| Less than High School | 401 (39.4%) | 83 (8.2%) |
| High School Diploma | 2,339 (58.8%) | 243 (6.1%) |
| College / Associate Degree | 2,632 (71.9%) | 286 (7.8%) |
| Bachelor's Degree or higher | 3,759 (87.9%) | 120 (2.8%) |
| Total | 9,131 (70.6%) | 685 (5.3%) |
Employment Occupations by Sex in Wheeling
Management, Business, Science and Arts Occupations
The most common Management, Business, Science and Arts occupations in Wheeling are Community & Social Service (1,286 | 11.4%), Management (1,016 | 9.0%), Health Diagnosing & Treating (806 | 7.1%), Education Instruction & Library (646 | 5.7%), and Health Technologists (623 | 5.5%).
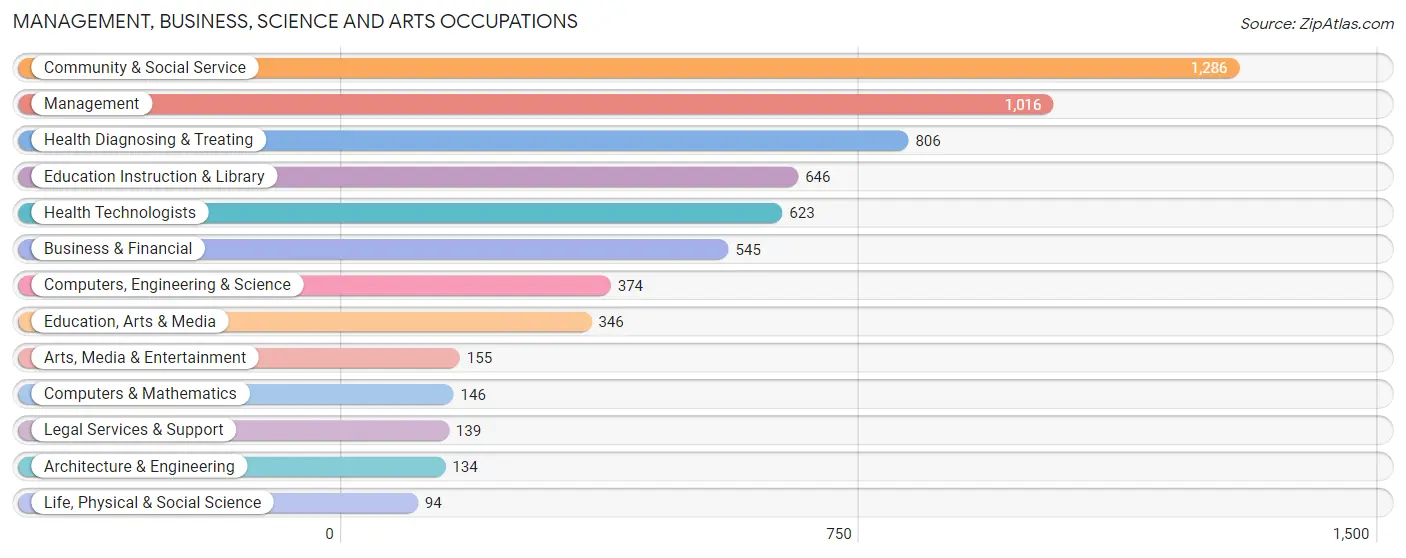
Management, Business, Science and Arts Occupations by Sex
Within the Management, Business, Science and Arts occupations in Wheeling, the most male-oriented occupations are Life, Physical & Social Science (79.8%), Computers & Mathematics (68.5%), and Legal Services & Support (67.6%), while the most female-oriented occupations are Arts, Media & Entertainment (81.3%), Education, Arts & Media (72.5%), and Education Instruction & Library (70.7%).
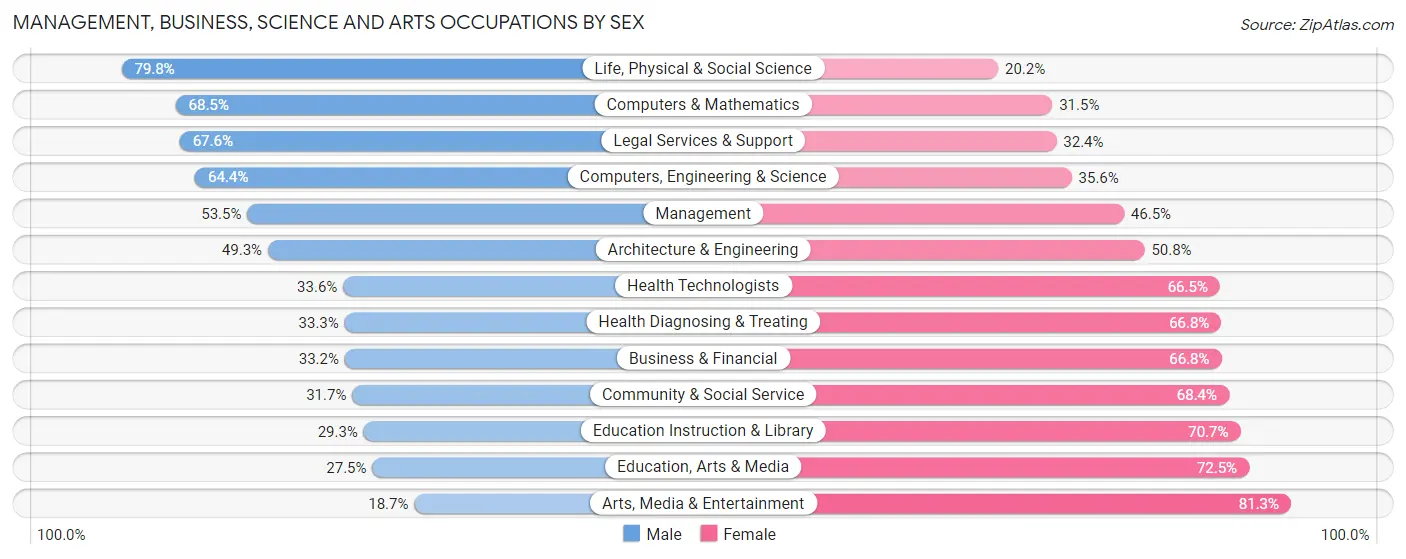
| Occupation | Male | Female |
| Management | 544 (53.5%) | 472 (46.5%) |
| Business & Financial | 181 (33.2%) | 364 (66.8%) |
| Computers, Engineering & Science | 241 (64.4%) | 133 (35.6%) |
| Computers & Mathematics | 100 (68.5%) | 46 (31.5%) |
| Architecture & Engineering | 66 (49.2%) | 68 (50.7%) |
| Life, Physical & Social Science | 75 (79.8%) | 19 (20.2%) |
| Community & Social Service | 407 (31.7%) | 879 (68.3%) |
| Education, Arts & Media | 95 (27.5%) | 251 (72.5%) |
| Legal Services & Support | 94 (67.6%) | 45 (32.4%) |
| Education Instruction & Library | 189 (29.3%) | 457 (70.7%) |
| Arts, Media & Entertainment | 29 (18.7%) | 126 (81.3%) |
| Health Diagnosing & Treating | 268 (33.3%) | 538 (66.7%) |
| Health Technologists | 209 (33.6%) | 414 (66.4%) |
| Total (Category) | 1,641 (40.7%) | 2,386 (59.3%) |
| Total (Overall) | 5,949 (52.6%) | 5,365 (47.4%) |
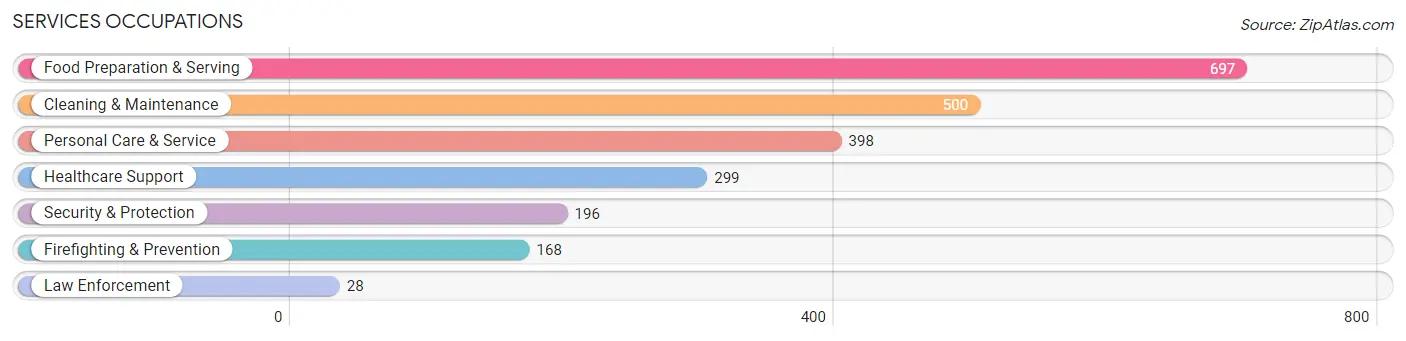
Services Occupations
The most common Services occupations in Wheeling are Food Preparation & Serving (697 | 6.2%), Cleaning & Maintenance (500 | 4.4%), Personal Care & Service (398 | 3.5%), Healthcare Support (299 | 2.6%), and Security & Protection (196 | 1.7%).
Services Occupations by Sex
Within the Services occupations in Wheeling, the most male-oriented occupations are Firefighting & Prevention (78.6%), Security & Protection (78.1%), and Law Enforcement (75.0%), while the most female-oriented occupations are Healthcare Support (83.3%), Personal Care & Service (60.1%), and Food Preparation & Serving (54.7%).
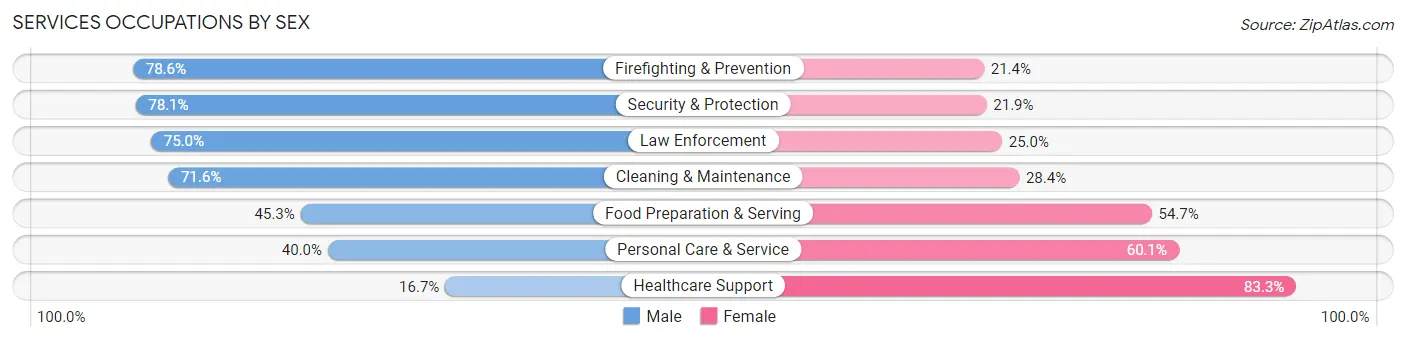
| Occupation | Male | Female |
| Healthcare Support | 50 (16.7%) | 249 (83.3%) |
| Security & Protection | 153 (78.1%) | 43 (21.9%) |
| Firefighting & Prevention | 132 (78.6%) | 36 (21.4%) |
| Law Enforcement | 21 (75.0%) | 7 (25.0%) |
| Food Preparation & Serving | 316 (45.3%) | 381 (54.7%) |
| Cleaning & Maintenance | 358 (71.6%) | 142 (28.4%) |
| Personal Care & Service | 159 (40.0%) | 239 (60.1%) |
| Total (Category) | 1,036 (49.6%) | 1,054 (50.4%) |
| Total (Overall) | 5,949 (52.6%) | 5,365 (47.4%) |
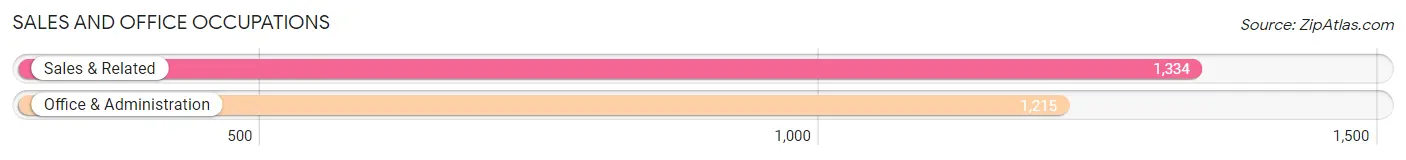
Sales and Office Occupations
The most common Sales and Office occupations in Wheeling are Sales & Related (1,334 | 11.8%), and Office & Administration (1,215 | 10.7%).
Sales and Office Occupations by Sex
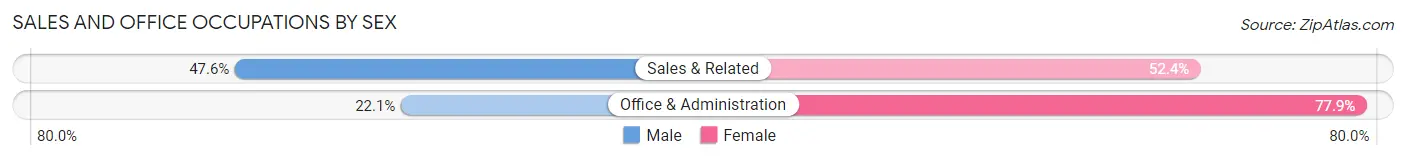
| Occupation | Male | Female |
| Sales & Related | 635 (47.6%) | 699 (52.4%) |
| Office & Administration | 268 (22.1%) | 947 (77.9%) |
| Total (Category) | 903 (35.4%) | 1,646 (64.6%) |
| Total (Overall) | 5,949 (52.6%) | 5,365 (47.4%) |
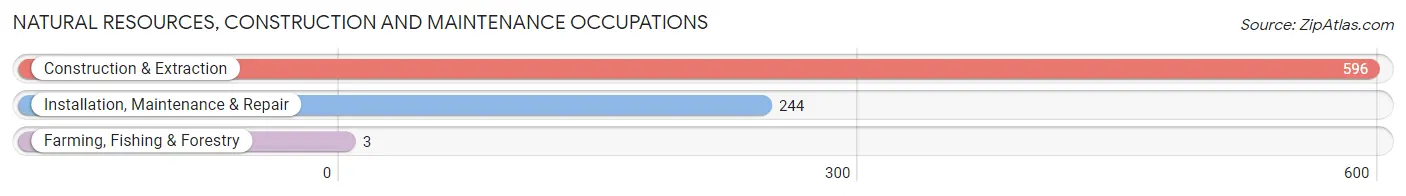
Natural Resources, Construction and Maintenance Occupations
The most common Natural Resources, Construction and Maintenance occupations in Wheeling are Construction & Extraction (596 | 5.3%), Installation, Maintenance & Repair (244 | 2.2%), and Farming, Fishing & Forestry (3 | 0.0%).
Natural Resources, Construction and Maintenance Occupations by Sex
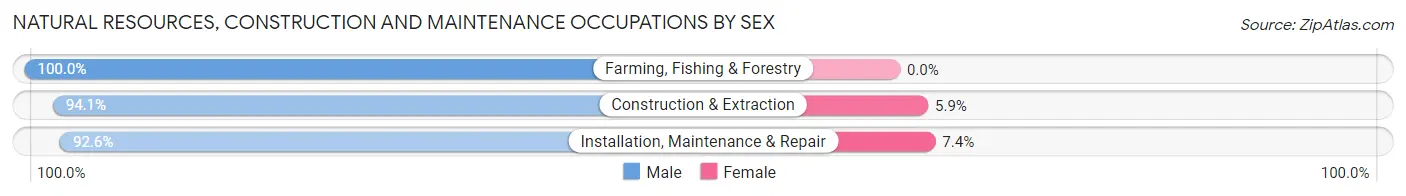
| Occupation | Male | Female |
| Farming, Fishing & Forestry | 3 (100.0%) | 0 (0.0%) |
| Construction & Extraction | 561 (94.1%) | 35 (5.9%) |
| Installation, Maintenance & Repair | 226 (92.6%) | 18 (7.4%) |
| Total (Category) | 790 (93.7%) | 53 (6.3%) |
| Total (Overall) | 5,949 (52.6%) | 5,365 (47.4%) |
Production, Transportation and Moving Occupations
The most common Production, Transportation and Moving occupations in Wheeling are Production (676 | 6.0%), Material Moving (578 | 5.1%), and Transportation (551 | 4.9%).
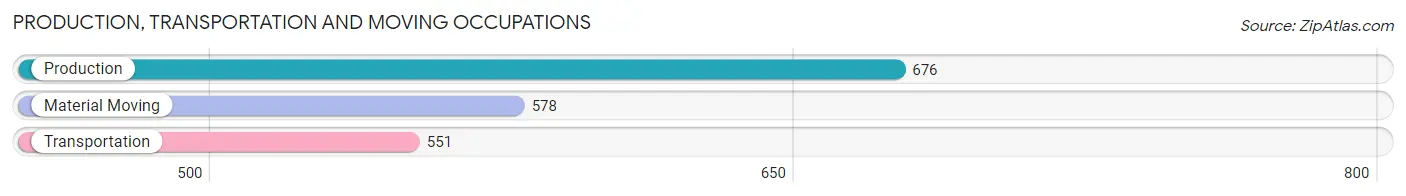
Production, Transportation and Moving Occupations by Sex
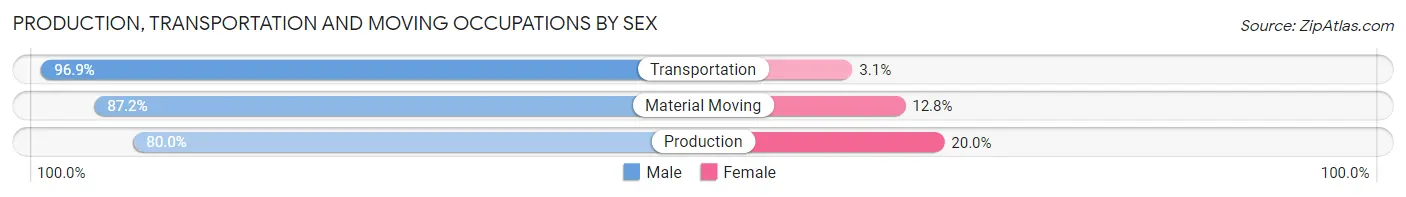
| Occupation | Male | Female |
| Production | 541 (80.0%) | 135 (20.0%) |
| Transportation | 534 (96.9%) | 17 (3.1%) |
| Material Moving | 504 (87.2%) | 74 (12.8%) |
| Total (Category) | 1,579 (87.5%) | 226 (12.5%) |
| Total (Overall) | 5,949 (52.6%) | 5,365 (47.4%) |
Employment Industries by Sex in Wheeling
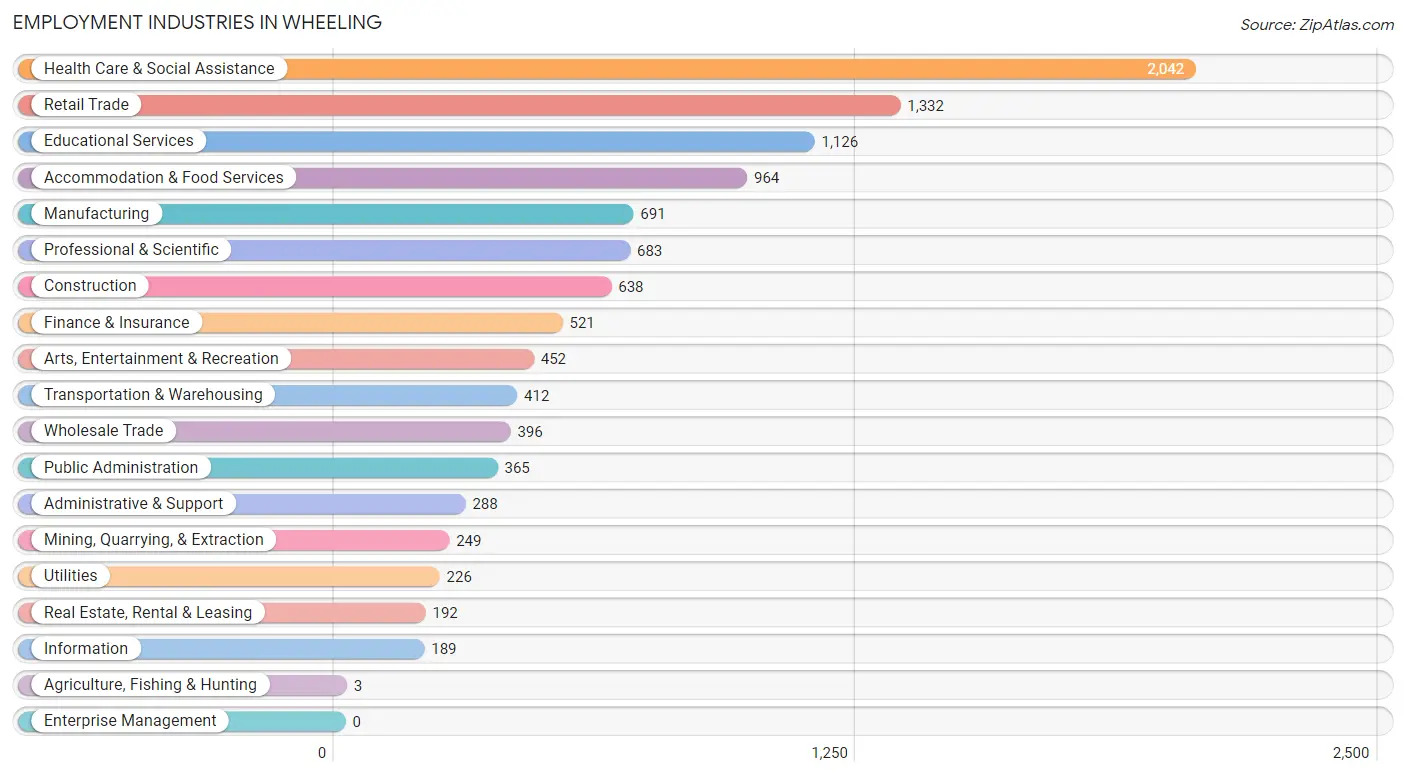
Employment Industries in Wheeling
The major employment industries in Wheeling include Health Care & Social Assistance (2,042 | 18.0%), Retail Trade (1,332 | 11.8%), Educational Services (1,126 | 10.0%), Accommodation & Food Services (964 | 8.5%), and Manufacturing (691 | 6.1%).
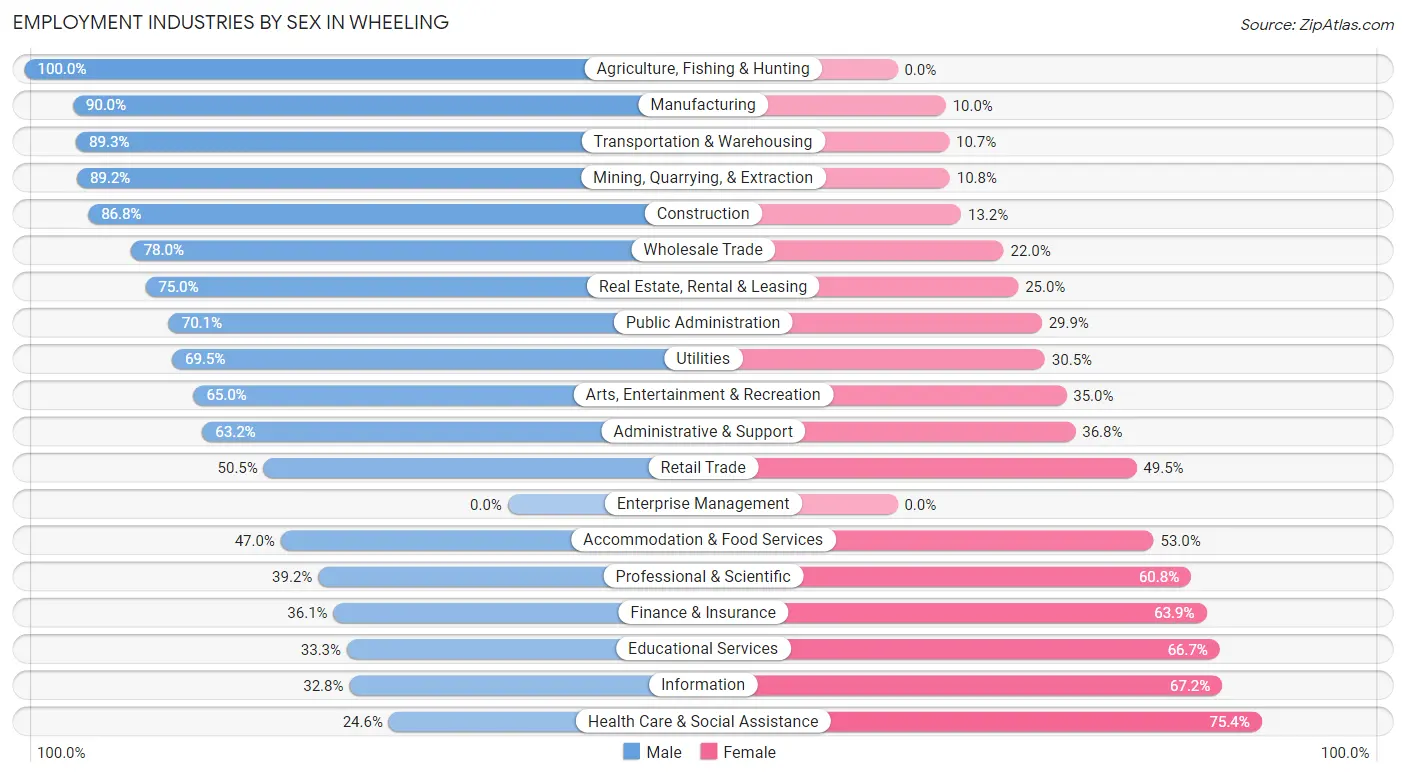
Employment Industries by Sex in Wheeling
The Wheeling industries that see more men than women are Agriculture, Fishing & Hunting (100.0%), Manufacturing (90.0%), and Transportation & Warehousing (89.3%), whereas the industries that tend to have a higher number of women are Health Care & Social Assistance (75.4%), Information (67.2%), and Educational Services (66.7%).
| Industry | Male | Female |
| Agriculture, Fishing & Hunting | 3 (100.0%) | 0 (0.0%) |
| Mining, Quarrying, & Extraction | 222 (89.2%) | 27 (10.8%) |
| Construction | 554 (86.8%) | 84 (13.2%) |
| Manufacturing | 622 (90.0%) | 69 (10.0%) |
| Wholesale Trade | 309 (78.0%) | 87 (22.0%) |
| Retail Trade | 673 (50.5%) | 659 (49.5%) |
| Transportation & Warehousing | 368 (89.3%) | 44 (10.7%) |
| Utilities | 157 (69.5%) | 69 (30.5%) |
| Information | 62 (32.8%) | 127 (67.2%) |
| Finance & Insurance | 188 (36.1%) | 333 (63.9%) |
| Real Estate, Rental & Leasing | 144 (75.0%) | 48 (25.0%) |
| Professional & Scientific | 268 (39.2%) | 415 (60.8%) |
| Enterprise Management | 0 (0.0%) | 0 (0.0%) |
| Administrative & Support | 182 (63.2%) | 106 (36.8%) |
| Educational Services | 375 (33.3%) | 751 (66.7%) |
| Health Care & Social Assistance | 503 (24.6%) | 1,539 (75.4%) |
| Arts, Entertainment & Recreation | 294 (65.0%) | 158 (35.0%) |
| Accommodation & Food Services | 453 (47.0%) | 511 (53.0%) |
| Public Administration | 256 (70.1%) | 109 (29.9%) |
| Total | 5,949 (52.6%) | 5,365 (47.4%) |
Education in Wheeling
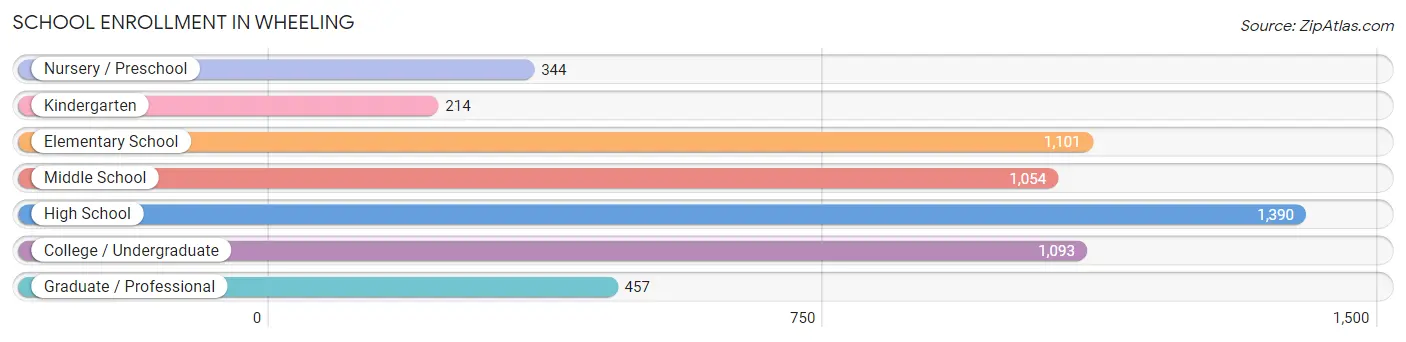
School Enrollment in Wheeling
The most common levels of schooling among the 5,653 students in Wheeling are high school (1,390 | 24.6%), elementary school (1,101 | 19.5%), and college / undergraduate (1,093 | 19.3%).
| School Level | # Students | % Students |
| Nursery / Preschool | 344 | 6.1% |
| Kindergarten | 214 | 3.8% |
| Elementary School | 1,101 | 19.5% |
| Middle School | 1,054 | 18.6% |
| High School | 1,390 | 24.6% |
| College / Undergraduate | 1,093 | 19.3% |
| Graduate / Professional | 457 | 8.1% |
| Total | 5,653 | 100.0% |
School Enrollment by Age by Funding Source in Wheeling
Out of a total of 5,653 students who are enrolled in schools in Wheeling, 1,453 (25.7%) attend a private institution, while the remaining 4,200 (74.3%) are enrolled in public schools. The age group of 35 years and over has the highest likelihood of being enrolled in private schools, with 143 (53.0% in the age bracket) enrolled. Conversely, the age group of 25 to 34 year olds has the lowest likelihood of being enrolled in a private school, with 249 (87.7% in the age bracket) attending a public institution.
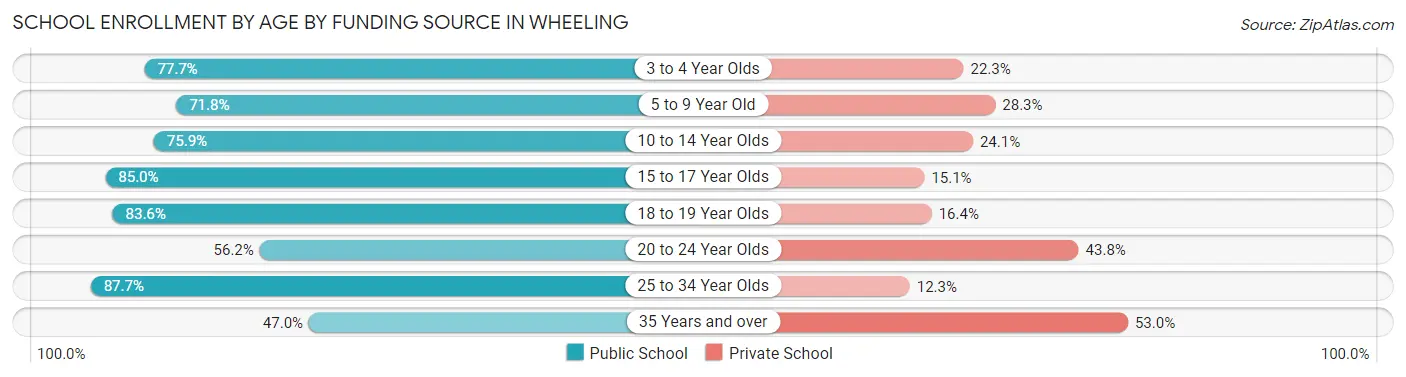
| Age Bracket | Public School | Private School |
| 3 to 4 Year Olds | 167 (77.7%) | 48 (22.3%) |
| 5 to 9 Year Old | 856 (71.8%) | 337 (28.2%) |
| 10 to 14 Year Olds | 1,100 (75.9%) | 349 (24.1%) |
| 15 to 17 Year Olds | 847 (85.0%) | 150 (15.0%) |
| 18 to 19 Year Olds | 464 (83.6%) | 91 (16.4%) |
| 20 to 24 Year Olds | 388 (56.2%) | 302 (43.8%) |
| 25 to 34 Year Olds | 249 (87.7%) | 35 (12.3%) |
| 35 Years and over | 127 (47.0%) | 143 (53.0%) |
| Total | 4,200 (74.3%) | 1,453 (25.7%) |
Educational Attainment by Field of Study in Wheeling
Business (1,082 | 16.3%), education (1,014 | 15.3%), science & technology (1,013 | 15.3%), social sciences (471 | 7.1%), and liberal arts & history (450 | 6.8%) are the most common fields of study among 6,628 individuals in Wheeling who have obtained a bachelor's degree or higher.
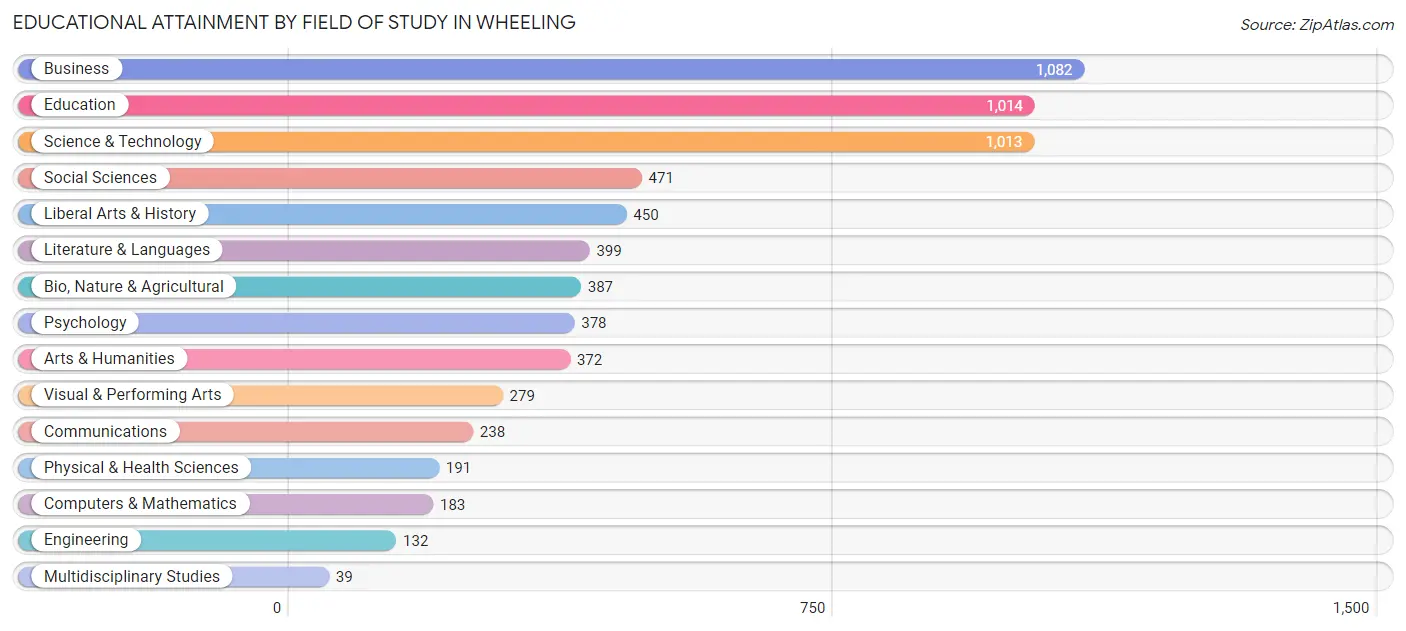
| Field of Study | # Graduates | % Graduates |
| Computers & Mathematics | 183 | 2.8% |
| Bio, Nature & Agricultural | 387 | 5.8% |
| Physical & Health Sciences | 191 | 2.9% |
| Psychology | 378 | 5.7% |
| Social Sciences | 471 | 7.1% |
| Engineering | 132 | 2.0% |
| Multidisciplinary Studies | 39 | 0.6% |
| Science & Technology | 1,013 | 15.3% |
| Business | 1,082 | 16.3% |
| Education | 1,014 | 15.3% |
| Literature & Languages | 399 | 6.0% |
| Liberal Arts & History | 450 | 6.8% |
| Visual & Performing Arts | 279 | 4.2% |
| Communications | 238 | 3.6% |
| Arts & Humanities | 372 | 5.6% |
| Total | 6,628 | 100.0% |
Transportation & Commute in Wheeling
Vehicle Availability by Sex in Wheeling
The most prevalent vehicle ownership categories in Wheeling are males with 2 vehicles (2,666, accounting for 46.5%) and females with 2 vehicles (2,280, making up 53.3%).
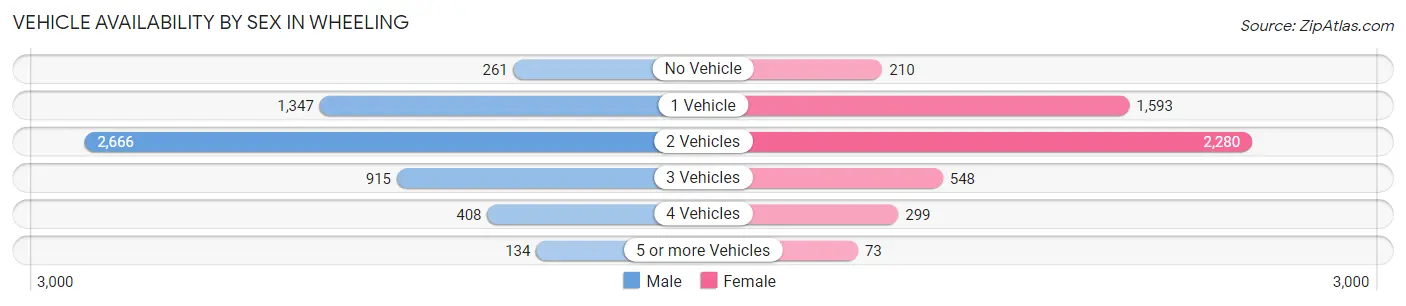
| Vehicles Available | Male | Female |
| No Vehicle | 261 (4.5%) | 210 (4.2%) |
| 1 Vehicle | 1,347 (23.5%) | 1,593 (31.8%) |
| 2 Vehicles | 2,666 (46.5%) | 2,280 (45.6%) |
| 3 Vehicles | 915 (16.0%) | 548 (11.0%) |
| 4 Vehicles | 408 (7.1%) | 299 (6.0%) |
| 5 or more Vehicles | 134 (2.3%) | 73 (1.5%) |
| Total | 5,731 (100.0%) | 5,003 (100.0%) |
Commute Time in Wheeling
The most frequently occuring commute durations in Wheeling are 10 to 14 minutes (2,599 commuters, 24.8%), 15 to 19 minutes (1,993 commuters, 19.1%), and 20 to 24 minutes (1,514 commuters, 14.5%).
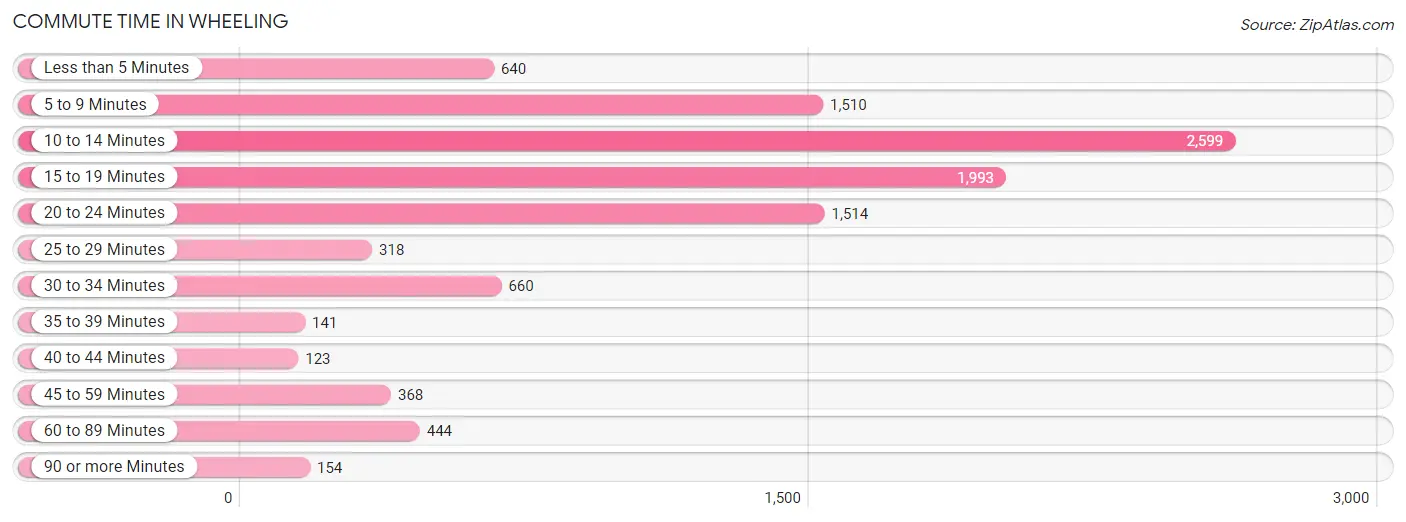
| Commute Time | # Commuters | % Commuters |
| Less than 5 Minutes | 640 | 6.1% |
| 5 to 9 Minutes | 1,510 | 14.4% |
| 10 to 14 Minutes | 2,599 | 24.8% |
| 15 to 19 Minutes | 1,993 | 19.1% |
| 20 to 24 Minutes | 1,514 | 14.5% |
| 25 to 29 Minutes | 318 | 3.0% |
| 30 to 34 Minutes | 660 | 6.3% |
| 35 to 39 Minutes | 141 | 1.3% |
| 40 to 44 Minutes | 123 | 1.2% |
| 45 to 59 Minutes | 368 | 3.5% |
| 60 to 89 Minutes | 444 | 4.2% |
| 90 or more Minutes | 154 | 1.5% |
Commute Time by Sex in Wheeling
The most common commute times in Wheeling are 10 to 14 minutes (1,318 commuters, 23.7%) for males and 10 to 14 minutes (1,281 commuters, 26.1%) for females.
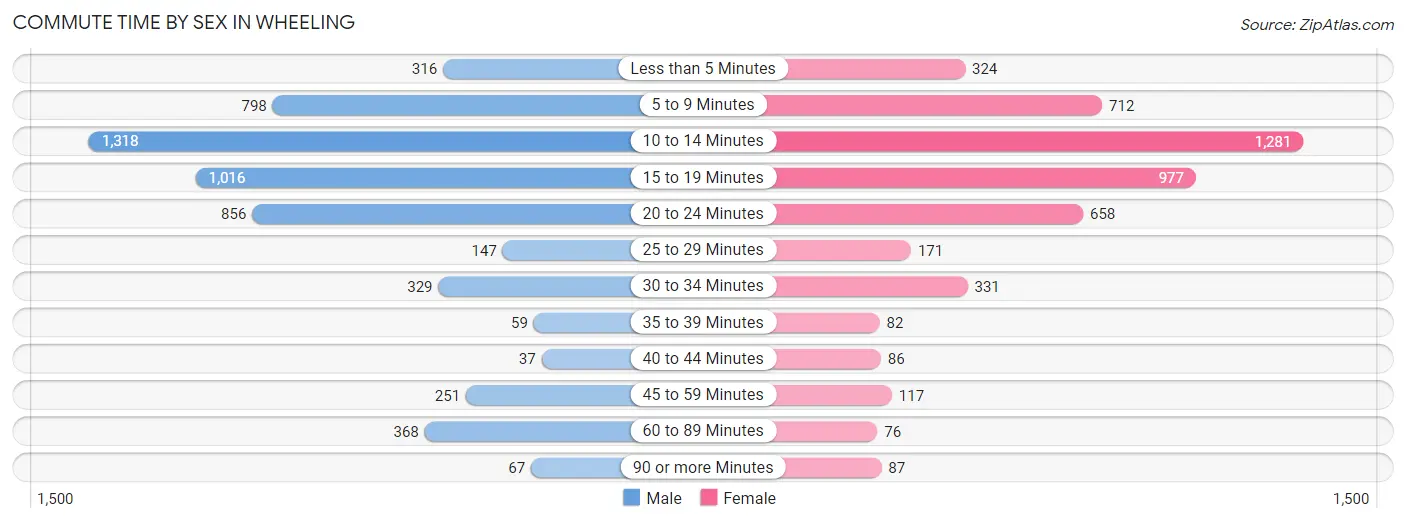
| Commute Time | Male | Female |
| Less than 5 Minutes | 316 (5.7%) | 324 (6.6%) |
| 5 to 9 Minutes | 798 (14.3%) | 712 (14.5%) |
| 10 to 14 Minutes | 1,318 (23.7%) | 1,281 (26.1%) |
| 15 to 19 Minutes | 1,016 (18.3%) | 977 (19.9%) |
| 20 to 24 Minutes | 856 (15.4%) | 658 (13.4%) |
| 25 to 29 Minutes | 147 (2.6%) | 171 (3.5%) |
| 30 to 34 Minutes | 329 (5.9%) | 331 (6.8%) |
| 35 to 39 Minutes | 59 (1.1%) | 82 (1.7%) |
| 40 to 44 Minutes | 37 (0.7%) | 86 (1.8%) |
| 45 to 59 Minutes | 251 (4.5%) | 117 (2.4%) |
| 60 to 89 Minutes | 368 (6.6%) | 76 (1.5%) |
| 90 or more Minutes | 67 (1.2%) | 87 (1.8%) |
Time of Departure to Work by Sex in Wheeling
The most frequent times of departure to work in Wheeling are 7:30 AM to 7:59 AM (811, 14.6%) for males and 8:00 AM to 8:29 AM (825, 16.8%) for females.
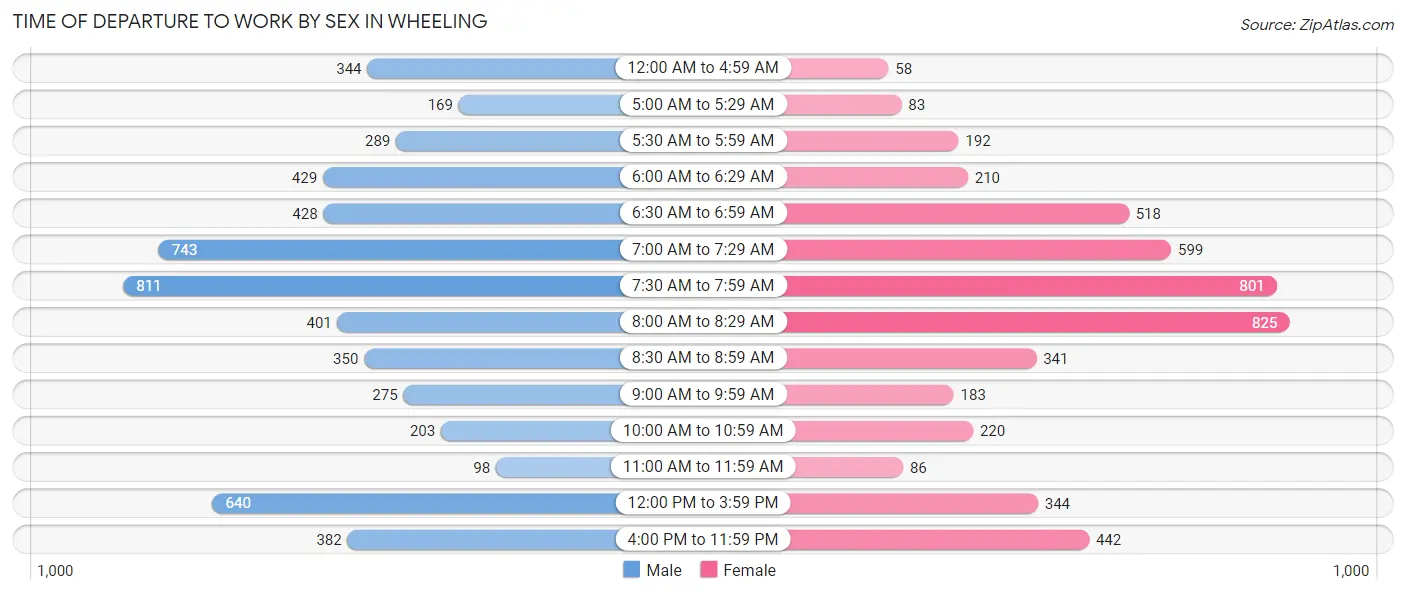
| Time of Departure | Male | Female |
| 12:00 AM to 4:59 AM | 344 (6.2%) | 58 (1.2%) |
| 5:00 AM to 5:29 AM | 169 (3.0%) | 83 (1.7%) |
| 5:30 AM to 5:59 AM | 289 (5.2%) | 192 (3.9%) |
| 6:00 AM to 6:29 AM | 429 (7.7%) | 210 (4.3%) |
| 6:30 AM to 6:59 AM | 428 (7.7%) | 518 (10.6%) |
| 7:00 AM to 7:29 AM | 743 (13.4%) | 599 (12.2%) |
| 7:30 AM to 7:59 AM | 811 (14.6%) | 801 (16.3%) |
| 8:00 AM to 8:29 AM | 401 (7.2%) | 825 (16.8%) |
| 8:30 AM to 8:59 AM | 350 (6.3%) | 341 (7.0%) |
| 9:00 AM to 9:59 AM | 275 (4.9%) | 183 (3.7%) |
| 10:00 AM to 10:59 AM | 203 (3.6%) | 220 (4.5%) |
| 11:00 AM to 11:59 AM | 98 (1.8%) | 86 (1.8%) |
| 12:00 PM to 3:59 PM | 640 (11.5%) | 344 (7.0%) |
| 4:00 PM to 11:59 PM | 382 (6.9%) | 442 (9.0%) |
| Total | 5,562 (100.0%) | 4,902 (100.0%) |
Housing Occupancy in Wheeling
Occupancy by Ownership in Wheeling
Of the total 11,760 dwellings in Wheeling, owner-occupied units account for 7,135 (60.7%), while renter-occupied units make up 4,625 (39.3%).
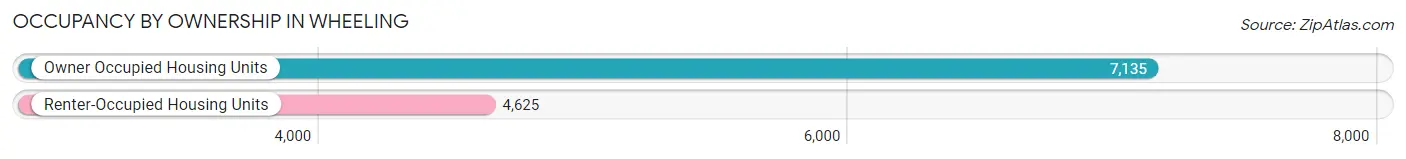
| Occupancy | # Housing Units | % Housing Units |
| Owner Occupied Housing Units | 7,135 | 60.7% |
| Renter-Occupied Housing Units | 4,625 | 39.3% |
| Total Occupied Housing Units | 11,760 | 100.0% |
Occupancy by Household Size in Wheeling
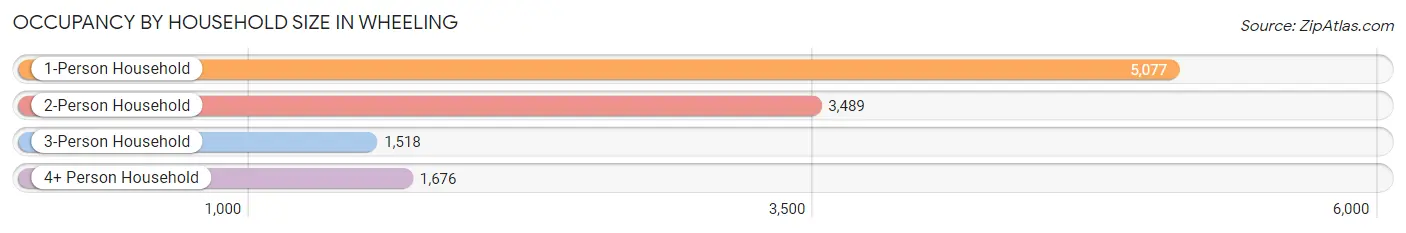
| Household Size | # Housing Units | % Housing Units |
| 1-Person Household | 5,077 | 43.2% |
| 2-Person Household | 3,489 | 29.7% |
| 3-Person Household | 1,518 | 12.9% |
| 4+ Person Household | 1,676 | 14.2% |
| Total Housing Units | 11,760 | 100.0% |
Occupancy by Ownership by Household Size in Wheeling
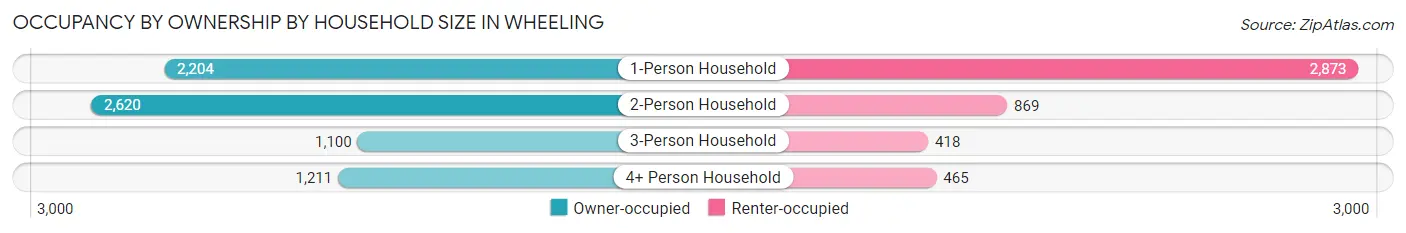
| Household Size | Owner-occupied | Renter-occupied |
| 1-Person Household | 2,204 (43.4%) | 2,873 (56.6%) |
| 2-Person Household | 2,620 (75.1%) | 869 (24.9%) |
| 3-Person Household | 1,100 (72.5%) | 418 (27.5%) |
| 4+ Person Household | 1,211 (72.3%) | 465 (27.7%) |
| Total Housing Units | 7,135 (60.7%) | 4,625 (39.3%) |
Occupancy by Educational Attainment in Wheeling
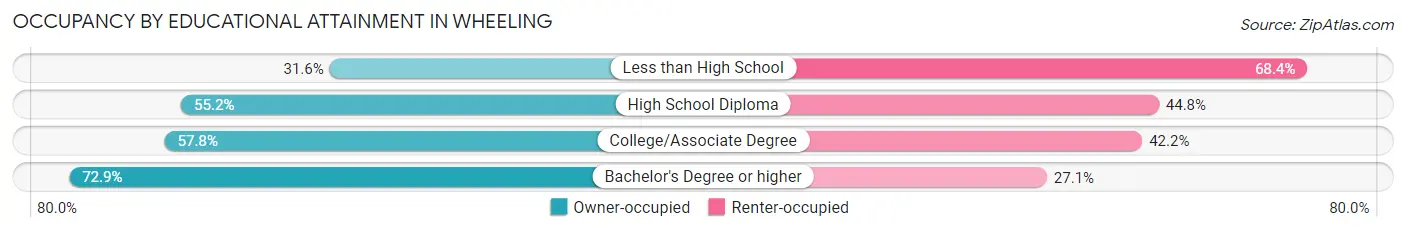
| Household Size | Owner-occupied | Renter-occupied |
| Less than High School | 235 (31.6%) | 508 (68.4%) |
| High School Diploma | 1,968 (55.2%) | 1,600 (44.8%) |
| College/Associate Degree | 1,911 (57.8%) | 1,395 (42.2%) |
| Bachelor's Degree or higher | 3,021 (72.9%) | 1,122 (27.1%) |
Occupancy by Age of Householder in Wheeling
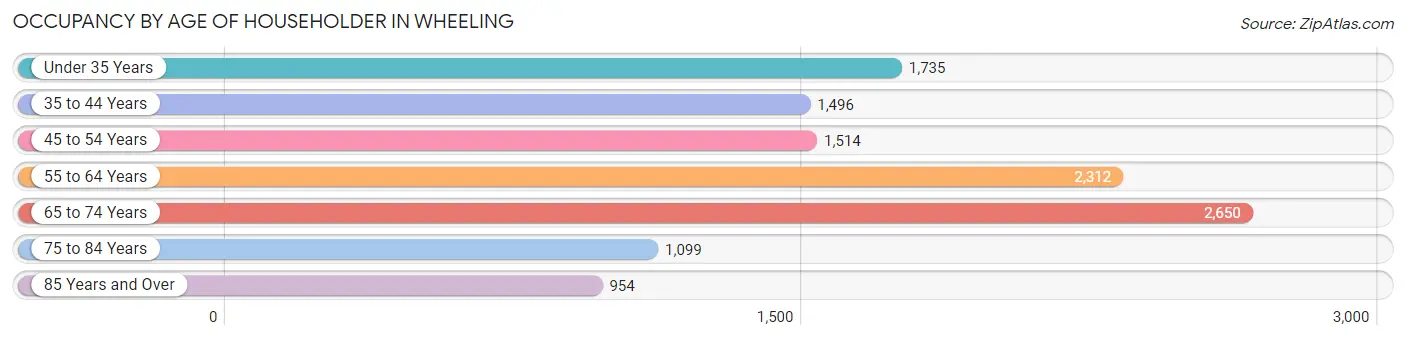
| Age Bracket | # Households | % Households |
| Under 35 Years | 1,735 | 14.7% |
| 35 to 44 Years | 1,496 | 12.7% |
| 45 to 54 Years | 1,514 | 12.9% |
| 55 to 64 Years | 2,312 | 19.7% |
| 65 to 74 Years | 2,650 | 22.5% |
| 75 to 84 Years | 1,099 | 9.3% |
| 85 Years and Over | 954 | 8.1% |
| Total | 11,760 | 100.0% |
Housing Finances in Wheeling
Median Income by Occupancy in Wheeling
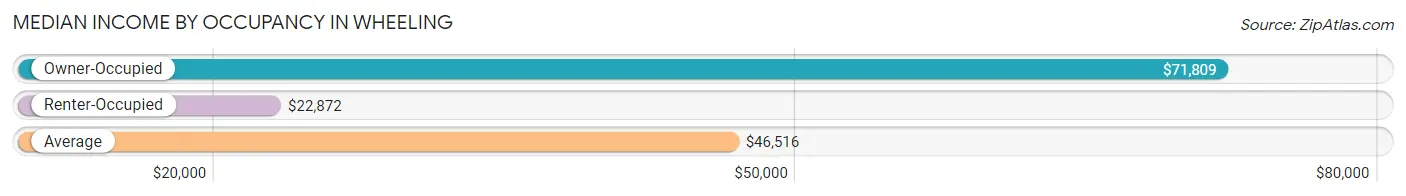
| Occupancy Type | # Households | Median Income |
| Owner-Occupied | 7,135 (60.7%) | $71,809 |
| Renter-Occupied | 4,625 (39.3%) | $22,872 |
| Average | 11,760 (100.0%) | $46,516 |
Occupancy by Householder Income Bracket in Wheeling
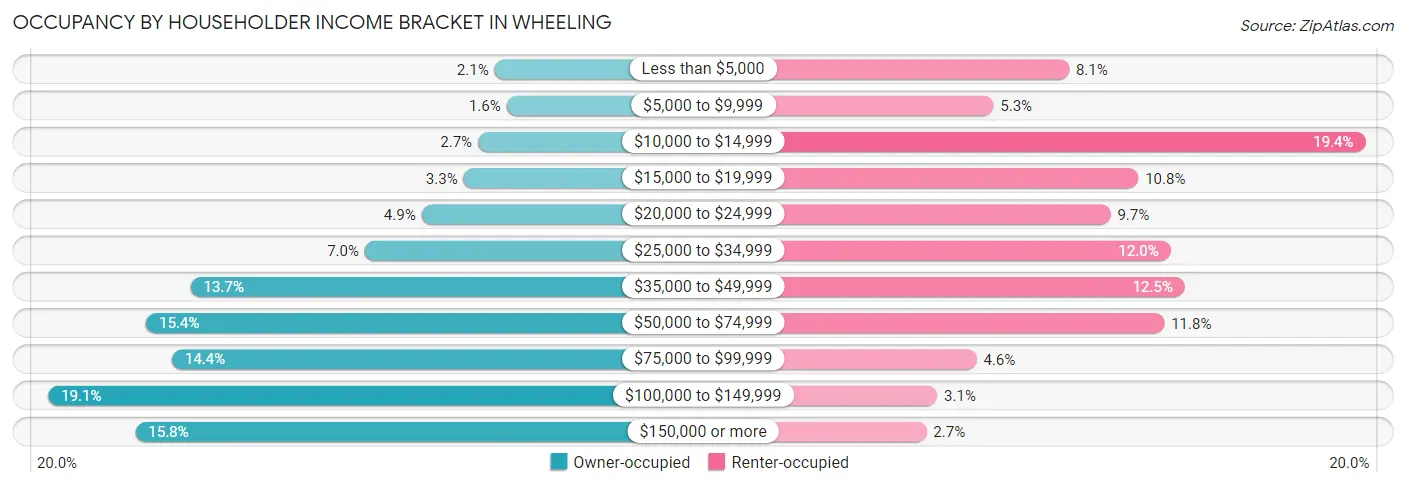
| Income Bracket | Owner-occupied | Renter-occupied |
| Less than $5,000 | 150 (2.1%) | 376 (8.1%) |
| $5,000 to $9,999 | 117 (1.6%) | 243 (5.2%) |
| $10,000 to $14,999 | 195 (2.7%) | 898 (19.4%) |
| $15,000 to $19,999 | 234 (3.3%) | 498 (10.8%) |
| $20,000 to $24,999 | 348 (4.9%) | 449 (9.7%) |
| $25,000 to $34,999 | 502 (7.0%) | 555 (12.0%) |
| $35,000 to $49,999 | 976 (13.7%) | 580 (12.5%) |
| $50,000 to $74,999 | 1,097 (15.4%) | 544 (11.8%) |
| $75,000 to $99,999 | 1,027 (14.4%) | 213 (4.6%) |
| $100,000 to $149,999 | 1,363 (19.1%) | 144 (3.1%) |
| $150,000 or more | 1,126 (15.8%) | 125 (2.7%) |
| Total | 7,135 (100.0%) | 4,625 (100.0%) |
Monthly Housing Cost Tiers in Wheeling
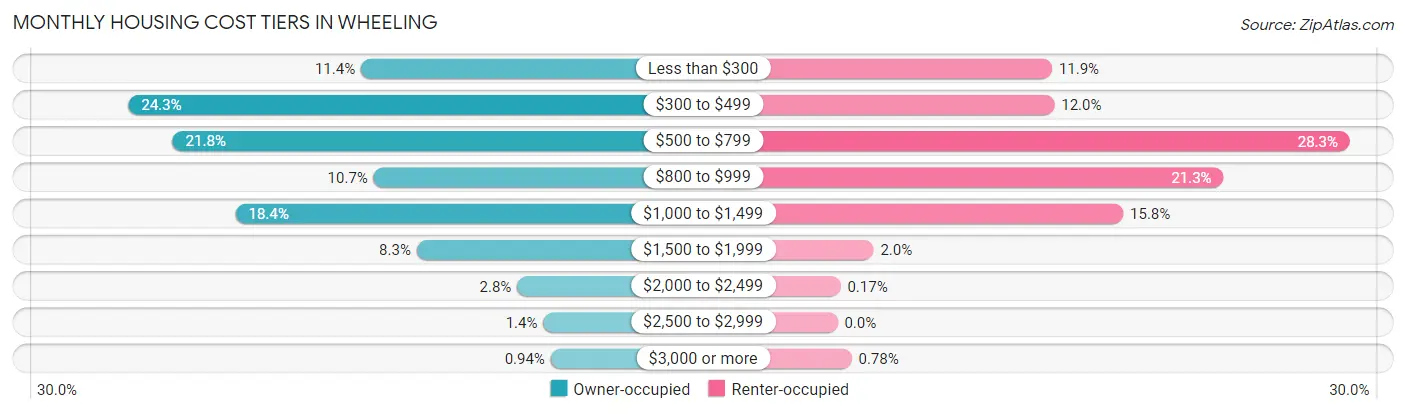
| Monthly Cost | Owner-occupied | Renter-occupied |
| Less than $300 | 815 (11.4%) | 548 (11.8%) |
| $300 to $499 | 1,732 (24.3%) | 554 (12.0%) |
| $500 to $799 | 1,557 (21.8%) | 1,309 (28.3%) |
| $800 to $999 | 765 (10.7%) | 986 (21.3%) |
| $1,000 to $1,499 | 1,309 (18.3%) | 730 (15.8%) |
| $1,500 to $1,999 | 595 (8.3%) | 92 (2.0%) |
| $2,000 to $2,499 | 199 (2.8%) | 8 (0.2%) |
| $2,500 to $2,999 | 96 (1.3%) | 0 (0.0%) |
| $3,000 or more | 67 (0.9%) | 36 (0.8%) |
| Total | 7,135 (100.0%) | 4,625 (100.0%) |
Physical Housing Characteristics in Wheeling
Housing Structures in Wheeling
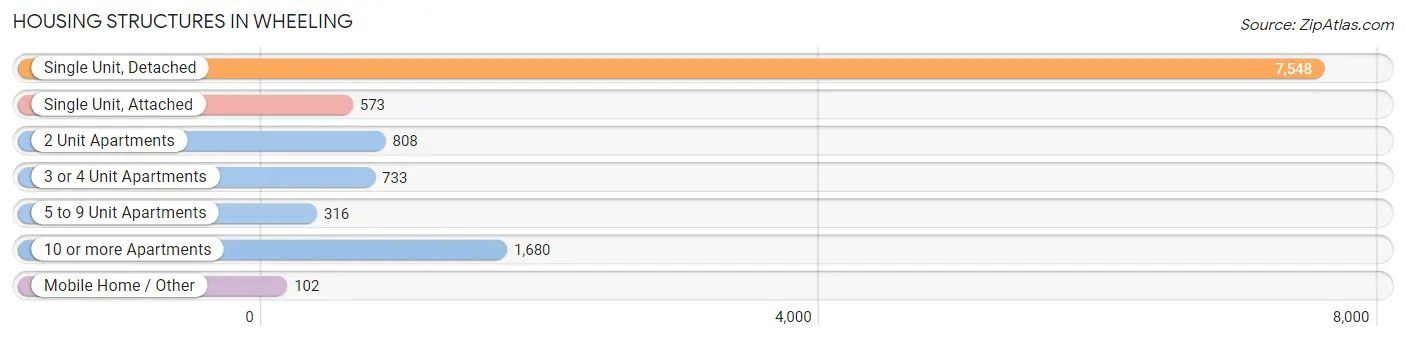
| Structure Type | # Housing Units | % Housing Units |
| Single Unit, Detached | 7,548 | 64.2% |
| Single Unit, Attached | 573 | 4.9% |
| 2 Unit Apartments | 808 | 6.9% |
| 3 or 4 Unit Apartments | 733 | 6.2% |
| 5 to 9 Unit Apartments | 316 | 2.7% |
| 10 or more Apartments | 1,680 | 14.3% |
| Mobile Home / Other | 102 | 0.9% |
| Total | 11,760 | 100.0% |
Housing Structures by Occupancy in Wheeling
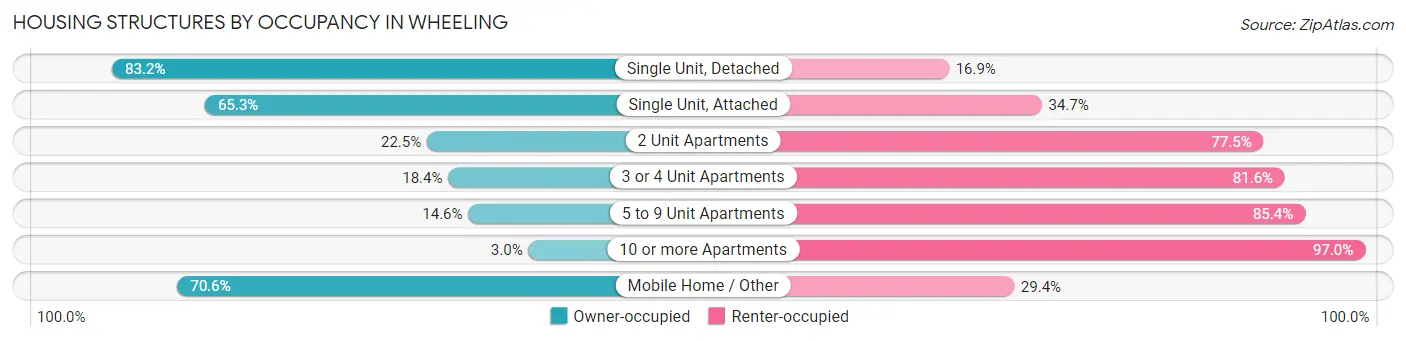
| Structure Type | Owner-occupied | Renter-occupied |
| Single Unit, Detached | 6,276 (83.2%) | 1,272 (16.9%) |
| Single Unit, Attached | 374 (65.3%) | 199 (34.7%) |
| 2 Unit Apartments | 182 (22.5%) | 626 (77.5%) |
| 3 or 4 Unit Apartments | 135 (18.4%) | 598 (81.6%) |
| 5 to 9 Unit Apartments | 46 (14.6%) | 270 (85.4%) |
| 10 or more Apartments | 50 (3.0%) | 1,630 (97.0%) |
| Mobile Home / Other | 72 (70.6%) | 30 (29.4%) |
| Total | 7,135 (60.7%) | 4,625 (39.3%) |
Housing Structures by Number of Rooms in Wheeling
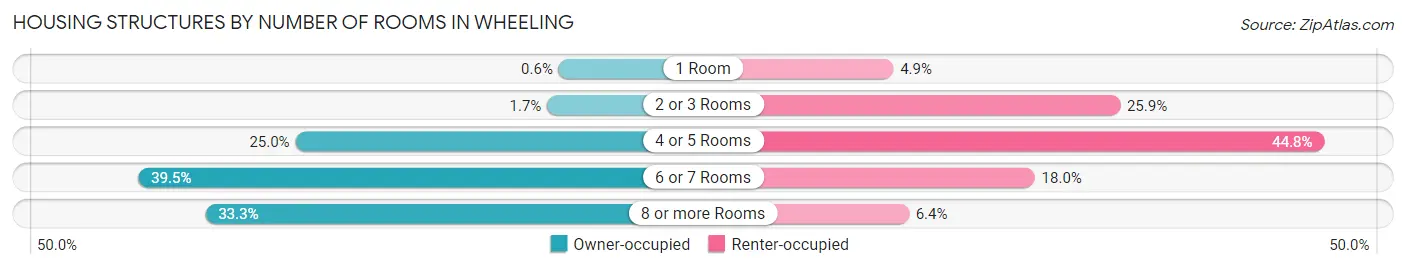
| Number of Rooms | Owner-occupied | Renter-occupied |
| 1 Room | 43 (0.6%) | 228 (4.9%) |
| 2 or 3 Rooms | 119 (1.7%) | 1,198 (25.9%) |
| 4 or 5 Rooms | 1,780 (24.9%) | 2,072 (44.8%) |
| 6 or 7 Rooms | 2,818 (39.5%) | 833 (18.0%) |
| 8 or more Rooms | 2,375 (33.3%) | 294 (6.4%) |
| Total | 7,135 (100.0%) | 4,625 (100.0%) |
Housing Structure by Heating Type in Wheeling
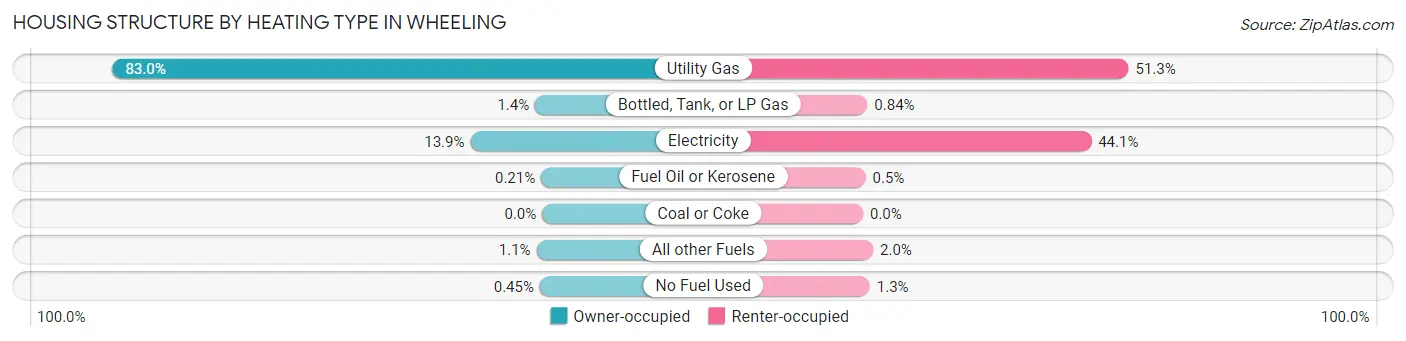
| Heating Type | Owner-occupied | Renter-occupied |
| Utility Gas | 5,923 (83.0%) | 2,373 (51.3%) |
| Bottled, Tank, or LP Gas | 97 (1.4%) | 39 (0.8%) |
| Electricity | 990 (13.9%) | 2,039 (44.1%) |
| Fuel Oil or Kerosene | 15 (0.2%) | 23 (0.5%) |
| Coal or Coke | 0 (0.0%) | 0 (0.0%) |
| All other Fuels | 78 (1.1%) | 90 (1.9%) |
| No Fuel Used | 32 (0.4%) | 61 (1.3%) |
| Total | 7,135 (100.0%) | 4,625 (100.0%) |
Household Vehicle Usage in Wheeling
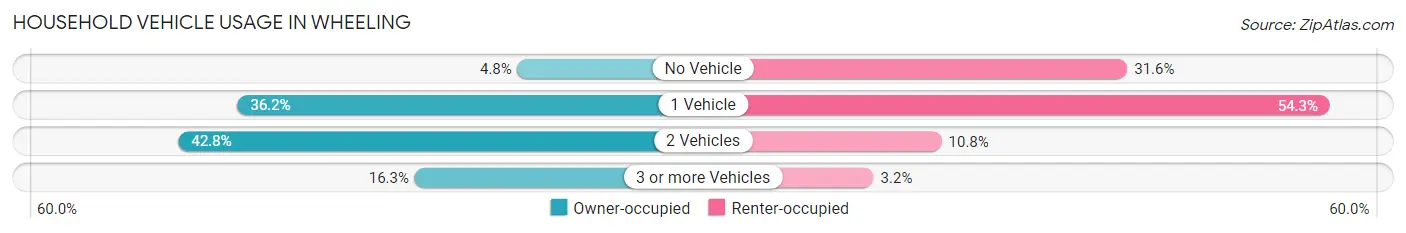
| Vehicles per Household | Owner-occupied | Renter-occupied |
| No Vehicle | 340 (4.8%) | 1,463 (31.6%) |
| 1 Vehicle | 2,581 (36.2%) | 2,512 (54.3%) |
| 2 Vehicles | 3,052 (42.8%) | 501 (10.8%) |
| 3 or more Vehicles | 1,162 (16.3%) | 149 (3.2%) |
| Total | 7,135 (100.0%) | 4,625 (100.0%) |
Real Estate & Mortgages in Wheeling
Real Estate and Mortgage Overview in Wheeling
| Characteristic | Without Mortgage | With Mortgage |
| Housing Units | 3,583 | 3,552 |
| Median Property Value | $122,500 | $141,700 |
| Median Household Income | $55,680 | $623 |
| Monthly Housing Costs | $412 | $67 |
| Real Estate Taxes | $897 | $118 |
Property Value by Mortgage Status in Wheeling
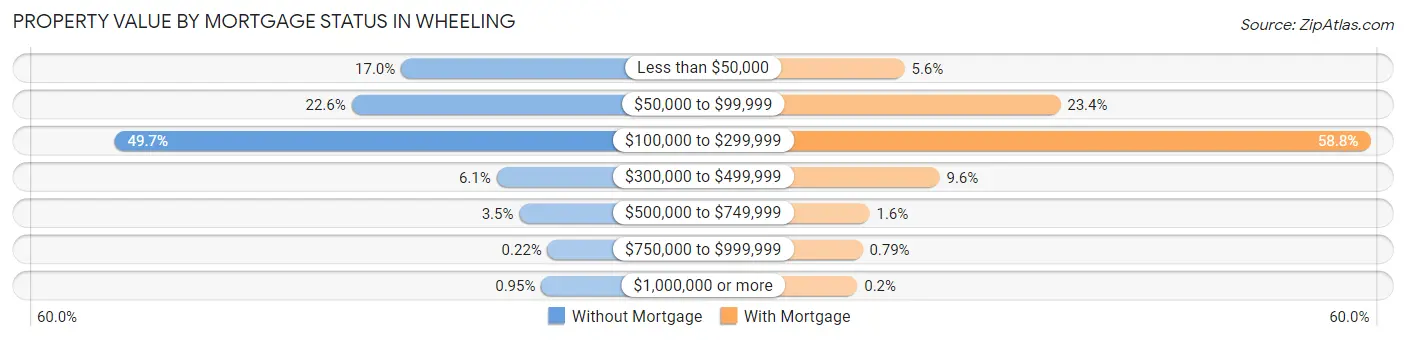
| Property Value | Without Mortgage | With Mortgage |
| Less than $50,000 | 608 (17.0%) | 199 (5.6%) |
| $50,000 to $99,999 | 811 (22.6%) | 831 (23.4%) |
| $100,000 to $299,999 | 1,781 (49.7%) | 2,089 (58.8%) |
| $300,000 to $499,999 | 217 (6.1%) | 341 (9.6%) |
| $500,000 to $749,999 | 124 (3.5%) | 57 (1.6%) |
| $750,000 to $999,999 | 8 (0.2%) | 28 (0.8%) |
| $1,000,000 or more | 34 (0.9%) | 7 (0.2%) |
| Total | 3,583 (100.0%) | 3,552 (100.0%) |
Household Income by Mortgage Status in Wheeling
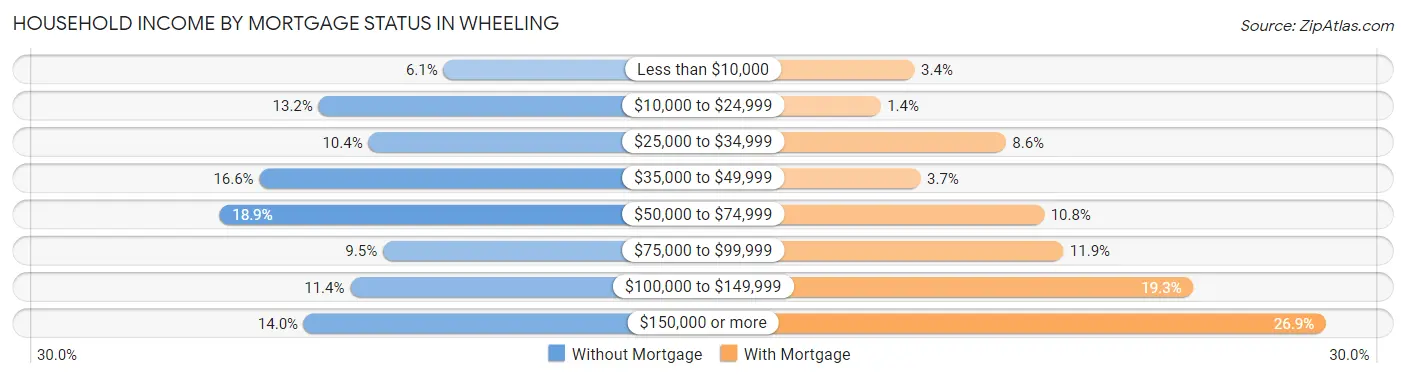
| Household Income | Without Mortgage | With Mortgage |
| Less than $10,000 | 217 (6.1%) | 119 (3.4%) |
| $10,000 to $24,999 | 473 (13.2%) | 50 (1.4%) |
| $25,000 to $34,999 | 371 (10.3%) | 304 (8.6%) |
| $35,000 to $49,999 | 594 (16.6%) | 131 (3.7%) |
| $50,000 to $74,999 | 676 (18.9%) | 382 (10.7%) |
| $75,000 to $99,999 | 341 (9.5%) | 421 (11.8%) |
| $100,000 to $149,999 | 408 (11.4%) | 686 (19.3%) |
| $150,000 or more | 503 (14.0%) | 955 (26.9%) |
| Total | 3,583 (100.0%) | 3,552 (100.0%) |
Property Value to Household Income Ratio in Wheeling
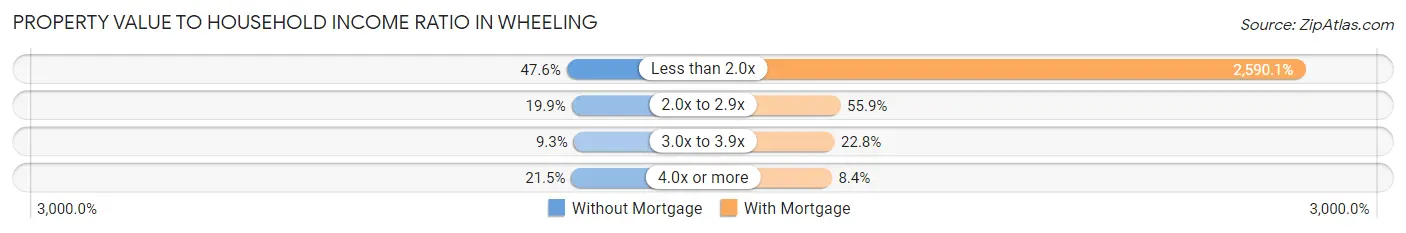
| Value-to-Income Ratio | Without Mortgage | With Mortgage |
| Less than 2.0x | 1,707 (47.6%) | 92,000 (2,590.1%) |
| 2.0x to 2.9x | 713 (19.9%) | 1,984 (55.9%) |
| 3.0x to 3.9x | 332 (9.3%) | 811 (22.8%) |
| 4.0x or more | 770 (21.5%) | 298 (8.4%) |
| Total | 3,583 (100.0%) | 3,552 (100.0%) |
Real Estate Taxes by Mortgage Status in Wheeling
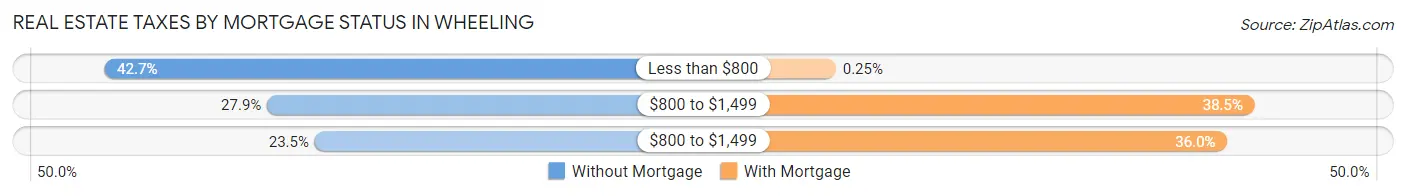
| Property Taxes | Without Mortgage | With Mortgage |
| Less than $800 | 1,531 (42.7%) | 9 (0.3%) |
| $800 to $1,499 | 998 (27.9%) | 1,368 (38.5%) |
| $800 to $1,499 | 842 (23.5%) | 1,279 (36.0%) |
| Total | 3,583 (100.0%) | 3,552 (100.0%) |
Health & Disability in Wheeling
Health Insurance Coverage by Age in Wheeling
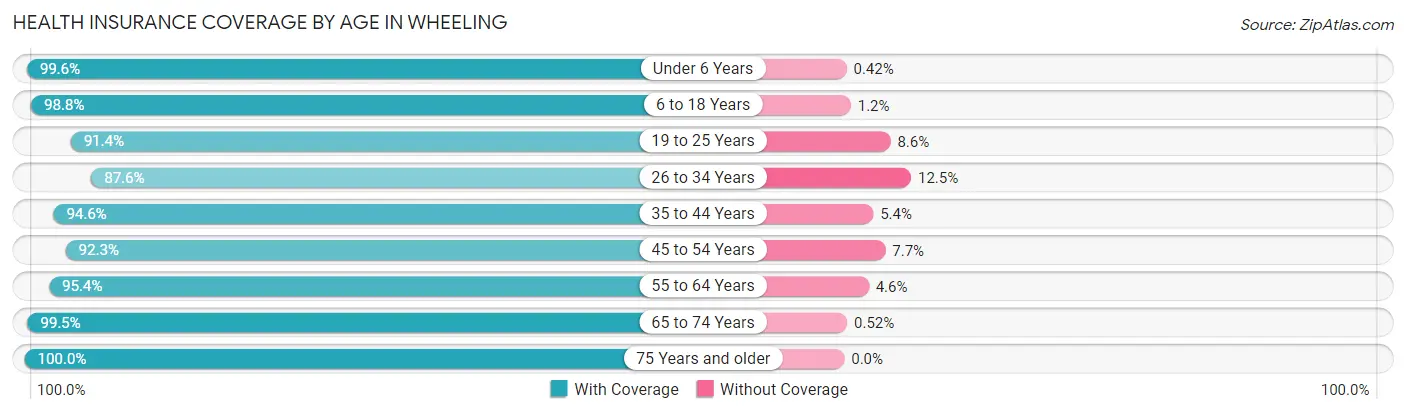
| Age Bracket | With Coverage | Without Coverage |
| Under 6 Years | 1,649 (99.6%) | 7 (0.4%) |
| 6 to 18 Years | 3,913 (98.8%) | 48 (1.2%) |
| 19 to 25 Years | 2,027 (91.4%) | 191 (8.6%) |
| 26 to 34 Years | 2,334 (87.5%) | 332 (12.4%) |
| 35 to 44 Years | 2,737 (94.6%) | 156 (5.4%) |
| 45 to 54 Years | 2,713 (92.3%) | 225 (7.7%) |
| 55 to 64 Years | 3,706 (95.4%) | 177 (4.6%) |
| 65 to 74 Years | 3,626 (99.5%) | 19 (0.5%) |
| 75 Years and older | 2,563 (100.0%) | 0 (0.0%) |
| Total | 25,268 (95.6%) | 1,155 (4.4%) |
Health Insurance Coverage by Citizenship Status in Wheeling
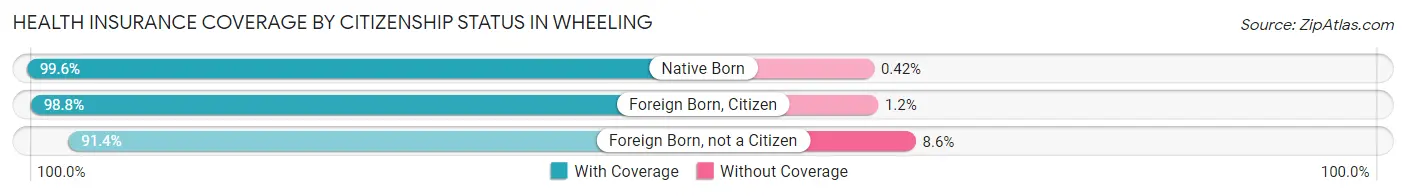
| Citizenship Status | With Coverage | Without Coverage |
| Native Born | 1,649 (99.6%) | 7 (0.4%) |
| Foreign Born, Citizen | 3,913 (98.8%) | 48 (1.2%) |
| Foreign Born, not a Citizen | 2,027 (91.4%) | 191 (8.6%) |
Health Insurance Coverage by Household Income in Wheeling
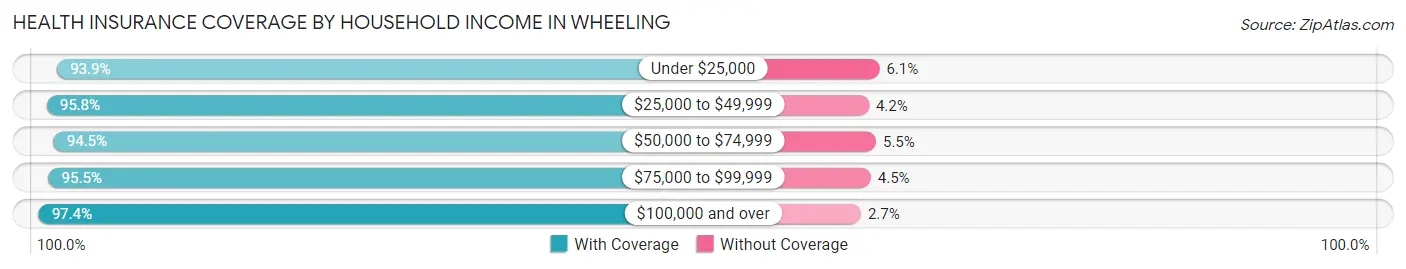
| Household Income | With Coverage | Without Coverage |
| Under $25,000 | 4,998 (93.9%) | 326 (6.1%) |
| $25,000 to $49,999 | 4,935 (95.8%) | 214 (4.2%) |
| $50,000 to $74,999 | 3,552 (94.5%) | 206 (5.5%) |
| $75,000 to $99,999 | 2,944 (95.5%) | 139 (4.5%) |
| $100,000 and over | 8,170 (97.4%) | 222 (2.6%) |
Public vs Private Health Insurance Coverage by Age in Wheeling
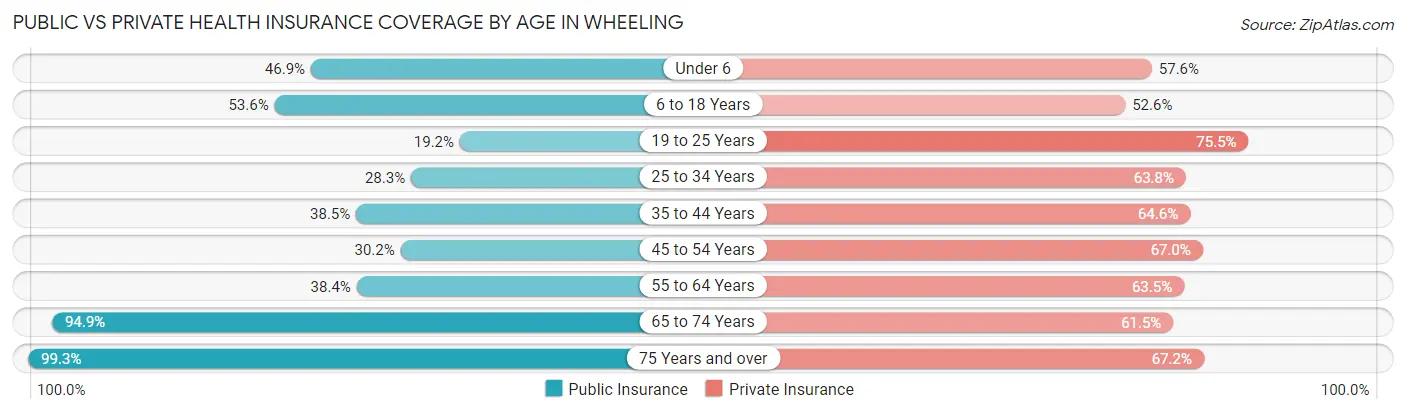
| Age Bracket | Public Insurance | Private Insurance |
| Under 6 | 776 (46.9%) | 953 (57.6%) |
| 6 to 18 Years | 2,124 (53.6%) | 2,084 (52.6%) |
| 19 to 25 Years | 426 (19.2%) | 1,674 (75.5%) |
| 25 to 34 Years | 754 (28.3%) | 1,702 (63.8%) |
| 35 to 44 Years | 1,113 (38.5%) | 1,870 (64.6%) |
| 45 to 54 Years | 888 (30.2%) | 1,968 (67.0%) |
| 55 to 64 Years | 1,490 (38.4%) | 2,466 (63.5%) |
| 65 to 74 Years | 3,460 (94.9%) | 2,242 (61.5%) |
| 75 Years and over | 2,546 (99.3%) | 1,722 (67.2%) |
| Total | 13,577 (51.4%) | 16,681 (63.1%) |
Disability Status by Sex by Age in Wheeling
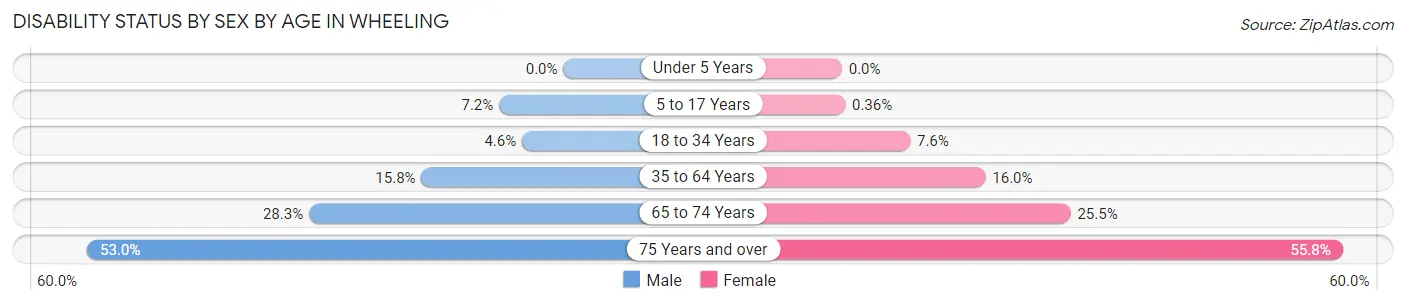
| Age Bracket | Male | Female |
| Under 5 Years | 0 (0.0%) | 0 (0.0%) |
| 5 to 17 Years | 132 (7.1%) | 7 (0.4%) |
| 18 to 34 Years | 125 (4.6%) | 193 (7.6%) |
| 35 to 64 Years | 738 (15.8%) | 807 (16.0%) |
| 65 to 74 Years | 472 (28.3%) | 504 (25.5%) |
| 75 Years and over | 514 (53.0%) | 889 (55.8%) |
Disability Class by Sex by Age in Wheeling
Disability Class: Hearing Difficulty
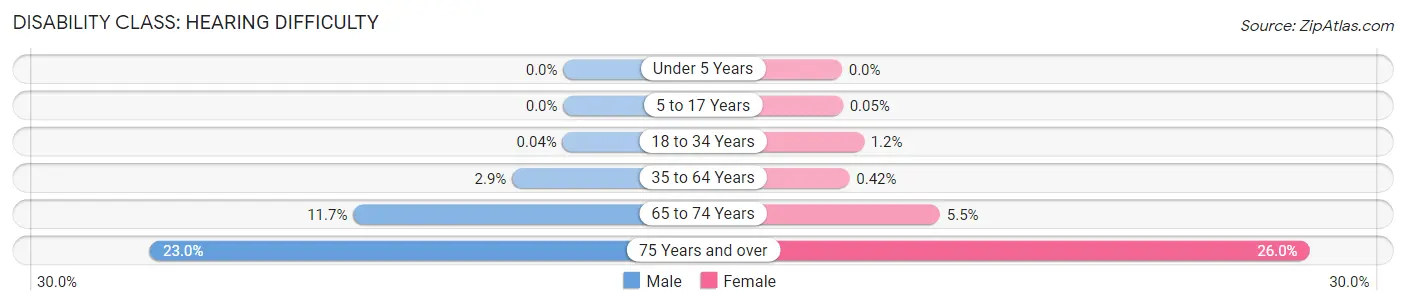
| Age Bracket | Male | Female |
| Under 5 Years | 0 (0.0%) | 0 (0.0%) |
| 5 to 17 Years | 0 (0.0%) | 1 (0.1%) |
| 18 to 34 Years | 1 (0.0%) | 31 (1.2%) |
| 35 to 64 Years | 133 (2.9%) | 21 (0.4%) |
| 65 to 74 Years | 195 (11.7%) | 108 (5.5%) |
| 75 Years and over | 223 (23.0%) | 415 (26.0%) |
Disability Class: Vision Difficulty
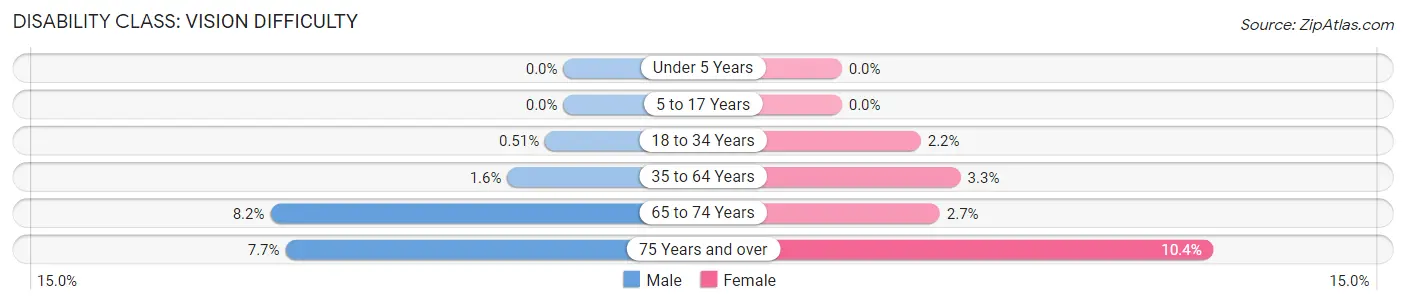
| Age Bracket | Male | Female |
| Under 5 Years | 0 (0.0%) | 0 (0.0%) |
| 5 to 17 Years | 0 (0.0%) | 0 (0.0%) |
| 18 to 34 Years | 14 (0.5%) | 56 (2.2%) |
| 35 to 64 Years | 73 (1.6%) | 167 (3.3%) |
| 65 to 74 Years | 136 (8.2%) | 54 (2.7%) |
| 75 Years and over | 75 (7.7%) | 165 (10.3%) |
Disability Class: Cognitive Difficulty
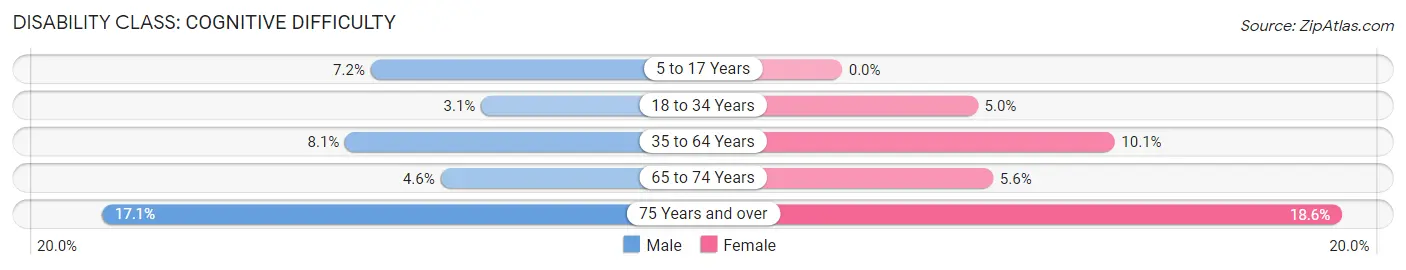
| Age Bracket | Male | Female |
| 5 to 17 Years | 132 (7.1%) | 0 (0.0%) |
| 18 to 34 Years | 83 (3.0%) | 128 (5.0%) |
| 35 to 64 Years | 378 (8.1%) | 511 (10.1%) |
| 65 to 74 Years | 76 (4.6%) | 111 (5.6%) |
| 75 Years and over | 166 (17.1%) | 296 (18.6%) |
Disability Class: Ambulatory Difficulty
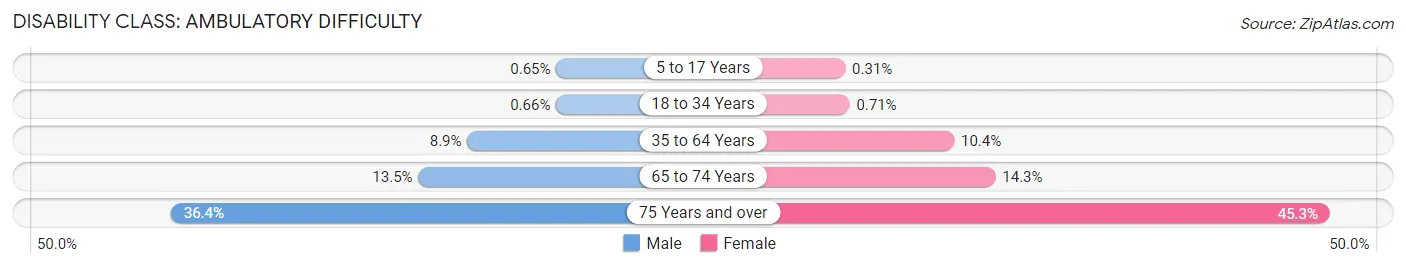
| Age Bracket | Male | Female |
| 5 to 17 Years | 12 (0.6%) | 6 (0.3%) |
| 18 to 34 Years | 18 (0.7%) | 18 (0.7%) |
| 35 to 64 Years | 416 (8.9%) | 526 (10.4%) |
| 65 to 74 Years | 224 (13.5%) | 282 (14.2%) |
| 75 Years and over | 353 (36.4%) | 722 (45.3%) |
Disability Class: Self-Care Difficulty
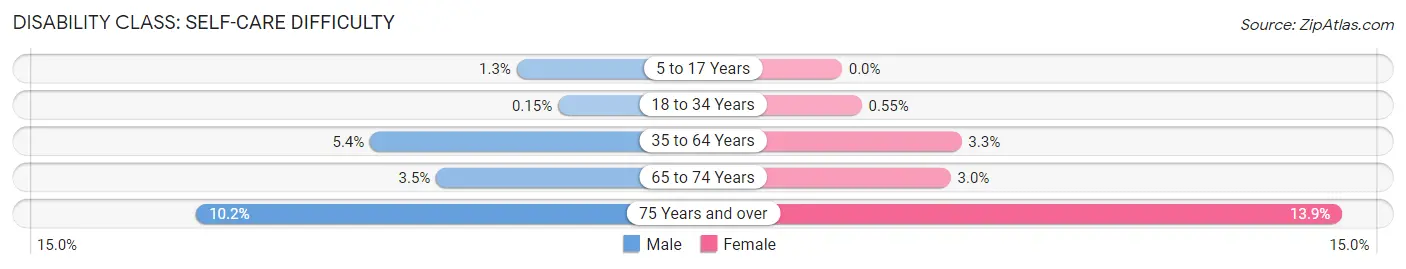
| Age Bracket | Male | Female |
| 5 to 17 Years | 24 (1.3%) | 0 (0.0%) |
| 18 to 34 Years | 4 (0.2%) | 14 (0.5%) |
| 35 to 64 Years | 251 (5.4%) | 168 (3.3%) |
| 65 to 74 Years | 59 (3.5%) | 60 (3.0%) |
| 75 Years and over | 99 (10.2%) | 222 (13.9%) |
Technology Access in Wheeling
Computing Device Access in Wheeling
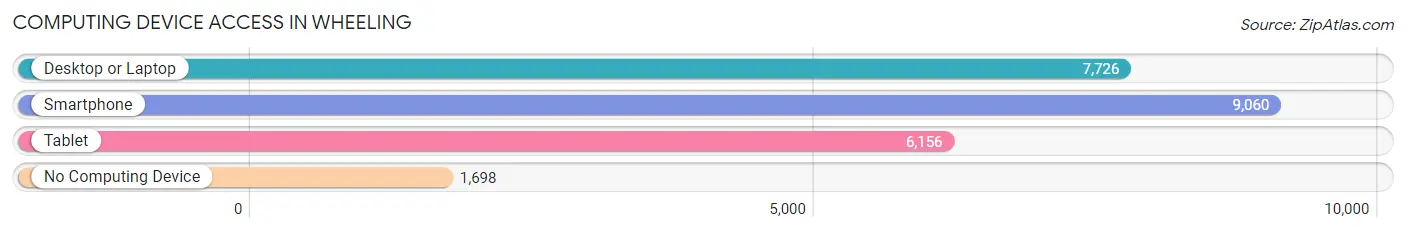
| Device Type | # Households | % Households |
| Desktop or Laptop | 7,726 | 65.7% |
| Smartphone | 9,060 | 77.0% |
| Tablet | 6,156 | 52.3% |
| No Computing Device | 1,698 | 14.4% |
| Total | 11,760 | 100.0% |
Internet Access in Wheeling
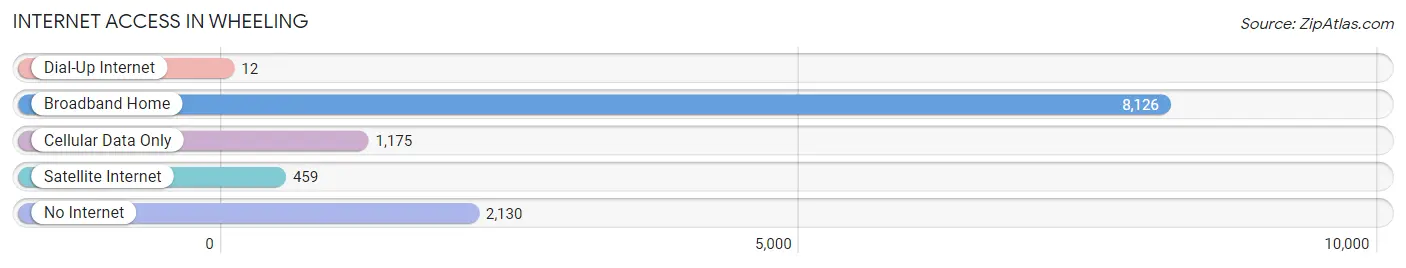
| Internet Type | # Households | % Households |
| Dial-Up Internet | 12 | 0.1% |
| Broadband Home | 8,126 | 69.1% |
| Cellular Data Only | 1,175 | 10.0% |
| Satellite Internet | 459 | 3.9% |
| No Internet | 2,130 | 18.1% |
| Total | 11,760 | 100.0% |
Wheeling Summary
Wheeling, West Virginia is a city located in the northern panhandle of the state. It is the county seat of Ohio County and is the largest city in the state. The city is situated along the Ohio River and is part of the Wheeling, WV-OH Metropolitan Statistical Area. The city has a population of 28,486 according to the 2010 census.
History
Wheeling was founded in 1769 by Ebenezer Zane, a settler from Pennsylvania. The city was originally known as Zane's Town and was the first permanent settlement in the state of West Virginia. The city was named after the Wheeling Creek, which was named after the Delaware Indian word for “place of the head.” The city was incorporated in 1836 and became the county seat of Ohio County in 1848.
Wheeling was an important transportation hub in the 19th century. The city was the western terminus of the National Road, which connected the city to Cumberland, Maryland. The city was also the eastern terminus of the Baltimore and Ohio Railroad, which connected the city to the rest of the country. The city was also an important industrial center during the 19th century. The city was home to several steel mills, glass factories, and other industries.
Geography
Wheeling is located in the northern panhandle of West Virginia. The city is situated along the Ohio River and is part of the Wheeling, WV-OH Metropolitan Statistical Area. The city has a total area of 8.7 square miles, of which 8.3 square miles is land and 0.4 square miles is water. The city is located in the Appalachian Plateau region of the state and is surrounded by rolling hills and valleys.
Economy
Wheeling has a diverse economy that is driven by healthcare, manufacturing, and tourism. The city is home to several large healthcare providers, including Wheeling Hospital, Ohio Valley Medical Center, and Reynolds Memorial Hospital. The city is also home to several manufacturing companies, including Fostoria Glass Company, Wheeling-Pittsburgh Steel, and the former Wheeling Corrugating Company. The city is also a popular tourist destination, with attractions such as the Wheeling Suspension Bridge, the Oglebay Resort, and the Wheeling Island Casino.
Demographics
According to the 2010 census, the population of Wheeling was 28,486. The city has a population density of 3,288 people per square mile. The racial makeup of the city is 87.3% White, 8.2% African American, 0.3% Native American, 0.7% Asian, 0.1% Pacific Islander, 1.2% from other races, and 2.2% from two or more races. The median household income in the city is $30,945 and the median family income is $37,945. The per capita income in the city is $17,945. The city has a poverty rate of 22.3%.
Common Questions
What is Per Capita Income in Wheeling?
Per Capita income in Wheeling is $33,868.
What is the Median Family Income in Wheeling?
Median Family Income in Wheeling is $78,607.
What is the Median Household income in Wheeling?
Median Household Income in Wheeling is $46,516.
What is Income or Wage Gap in Wheeling?
Income or Wage Gap in Wheeling is 20.2%.
Women in Wheeling earn 79.8 cents for every dollar earned by a man.
What is Family Income Deficit in Wheeling?
Family Income Deficit in Wheeling is $9,800.
Families that are below poverty line in Wheeling earn $9,800 less on average than the poverty threshold level.
What is Inequality or Gini Index in Wheeling?
Inequality or Gini Index in Wheeling is 0.52.
What is the Total Population of Wheeling?
Total Population of Wheeling is 26,900.
What is the Total Male Population of Wheeling?
Total Male Population of Wheeling is 12,779.
What is the Total Female Population of Wheeling?
Total Female Population of Wheeling is 14,121.
What is the Ratio of Males per 100 Females in Wheeling?
There are 90.50 Males per 100 Females in Wheeling.
What is the Ratio of Females per 100 Males in Wheeling?
There are 110.50 Females per 100 Males in Wheeling.
What is the Median Population Age in Wheeling?
Median Population Age in Wheeling is 45.0 Years.
What is the Average Family Size in Wheeling
Average Family Size in Wheeling is 3.1 People.
What is the Average Household Size in Wheeling
Average Household Size in Wheeling is 2.2 People.
How Large is the Labor Force in Wheeling?
There are 12,058 People in the Labor Forcein in Wheeling.
What is the Percentage of People in the Labor Force in Wheeling?
54.0% of People are in the Labor Force in Wheeling.
What is the Unemployment Rate in Wheeling?
Unemployment Rate in Wheeling is 6.2%.