Huntington, WV Map & Demographics
Huntington Map
Huntington Overview
$27,632
PER CAPITA INCOME
$58,757
AVG FAMILY INCOME
$39,066
AVG HOUSEHOLD INCOME
21.3%
WAGE / INCOME GAP [ % ]
78.7¢/ $1
WAGE / INCOME GAP [ $ ]
$11,759
FAMILY INCOME DEFICIT
0.55
INEQUALITY / GINI INDEX
46,637
TOTAL POPULATION
22,063
MALE POPULATION
24,574
FEMALE POPULATION
89.78
MALES / 100 FEMALES
111.38
FEMALES / 100 MALES
35.4
MEDIAN AGE
3.1
AVG FAMILY SIZE
2.2
AVG HOUSEHOLD SIZE
21,513
LABOR FORCE [ PEOPLE ]
54.7%
PERCENT IN LABOR FORCE
7.8%
UNEMPLOYMENT RATE
Income in Huntington
Income Overview in Huntington
Per Capita Income in Huntington is $27,632, while median incomes of families and households are $58,757 and $39,066 respectively.
| Characteristic | Number | Measure |
| Per Capita Income | 46,637 | $27,632 |
| Median Family Income | 9,187 | $58,757 |
| Mean Family Income | 9,187 | $87,101 |
| Median Household Income | 19,411 | $39,066 |
| Mean Household Income | 19,411 | $62,889 |
| Income Deficit | 9,187 | $11,759 |
| Wage / Income Gap (%) | 46,637 | 21.26% |
| Wage / Income Gap ($) | 46,637 | 78.74¢ per $1 |
| Gini / Inequality Index | 46,637 | 0.55 |
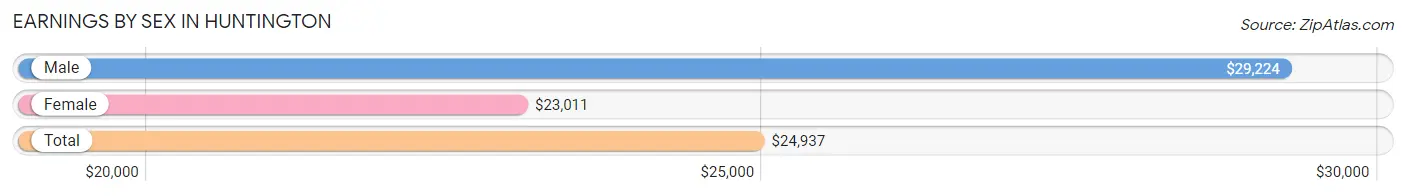
Earnings by Sex in Huntington
Average Earnings in Huntington are $24,937, $29,224 for men and $23,011 for women, a difference of 21.3%.
| Sex | Number | Average Earnings |
| Male | 10,976 (48.7%) | $29,224 |
| Female | 11,557 (51.3%) | $23,011 |
| Total | 22,533 (100.0%) | $24,937 |
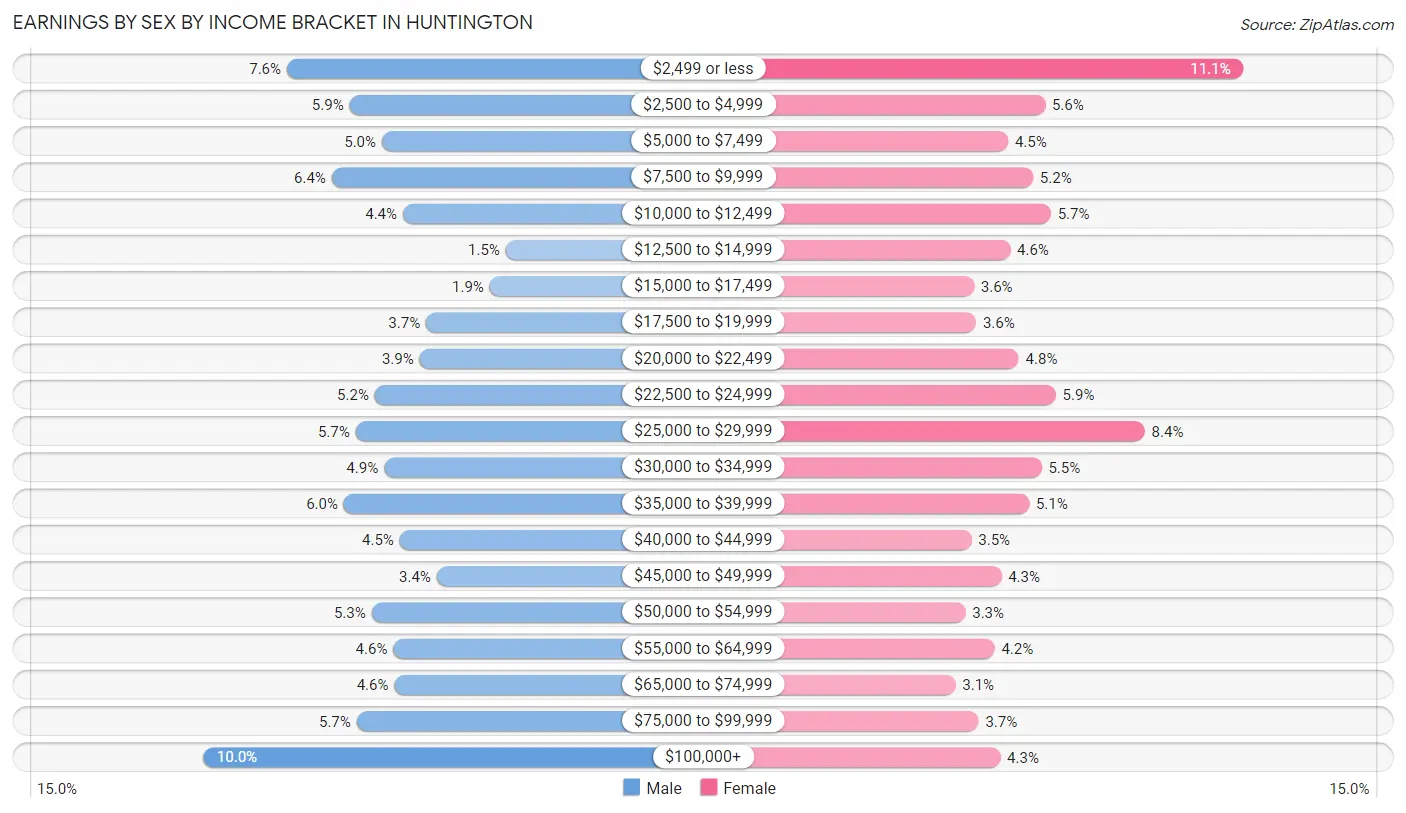
Earnings by Sex by Income Bracket in Huntington
The most common earnings brackets in Huntington are $100,000+ for men (1,093 | 10.0%) and $2,499 or less for women (1,285 | 11.1%).
| Income | Male | Female |
| $2,499 or less | 837 (7.6%) | 1,285 (11.1%) |
| $2,500 to $4,999 | 644 (5.9%) | 644 (5.6%) |
| $5,000 to $7,499 | 544 (5.0%) | 523 (4.5%) |
| $7,500 to $9,999 | 699 (6.4%) | 605 (5.2%) |
| $10,000 to $12,499 | 480 (4.4%) | 662 (5.7%) |
| $12,500 to $14,999 | 162 (1.5%) | 530 (4.6%) |
| $15,000 to $17,499 | 212 (1.9%) | 413 (3.6%) |
| $17,500 to $19,999 | 408 (3.7%) | 420 (3.6%) |
| $20,000 to $22,499 | 428 (3.9%) | 558 (4.8%) |
| $22,500 to $24,999 | 566 (5.2%) | 678 (5.9%) |
| $25,000 to $29,999 | 626 (5.7%) | 967 (8.4%) |
| $30,000 to $34,999 | 538 (4.9%) | 632 (5.5%) |
| $35,000 to $39,999 | 662 (6.0%) | 592 (5.1%) |
| $40,000 to $44,999 | 489 (4.5%) | 404 (3.5%) |
| $45,000 to $49,999 | 375 (3.4%) | 501 (4.3%) |
| $50,000 to $54,999 | 576 (5.2%) | 385 (3.3%) |
| $55,000 to $64,999 | 509 (4.6%) | 480 (4.2%) |
| $65,000 to $74,999 | 506 (4.6%) | 352 (3.0%) |
| $75,000 to $99,999 | 622 (5.7%) | 428 (3.7%) |
| $100,000+ | 1,093 (10.0%) | 498 (4.3%) |
| Total | 10,976 (100.0%) | 11,557 (100.0%) |
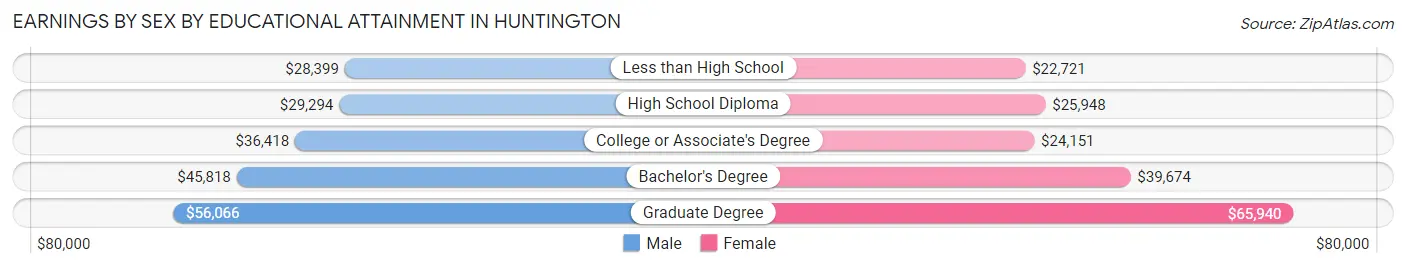
Earnings by Sex by Educational Attainment in Huntington
Average earnings in Huntington are $39,758 for men and $32,271 for women, a difference of 18.8%. Men with an educational attainment of graduate degree enjoy the highest average annual earnings of $56,066, while those with less than high school education earn the least with $28,399. Women with an educational attainment of graduate degree earn the most with the average annual earnings of $65,940, while those with less than high school education have the smallest earnings of $22,721.
| Educational Attainment | Male Income | Female Income |
| Less than High School | $28,399 | $22,721 |
| High School Diploma | $29,294 | $25,948 |
| College or Associate's Degree | $36,418 | $24,151 |
| Bachelor's Degree | $45,818 | $39,674 |
| Graduate Degree | $56,066 | $65,940 |
| Total | $39,758 | $32,271 |
Family Income in Huntington
Family Income Brackets in Huntington
According to the Huntington family income data, there are 1,617 families falling into the $50,000 to $74,999 income range, which is the most common income bracket and makes up 17.6% of all families. Conversely, the $10,000 to $14,999 income bracket is the least frequent group with only 505 families (5.5%) belonging to this category.
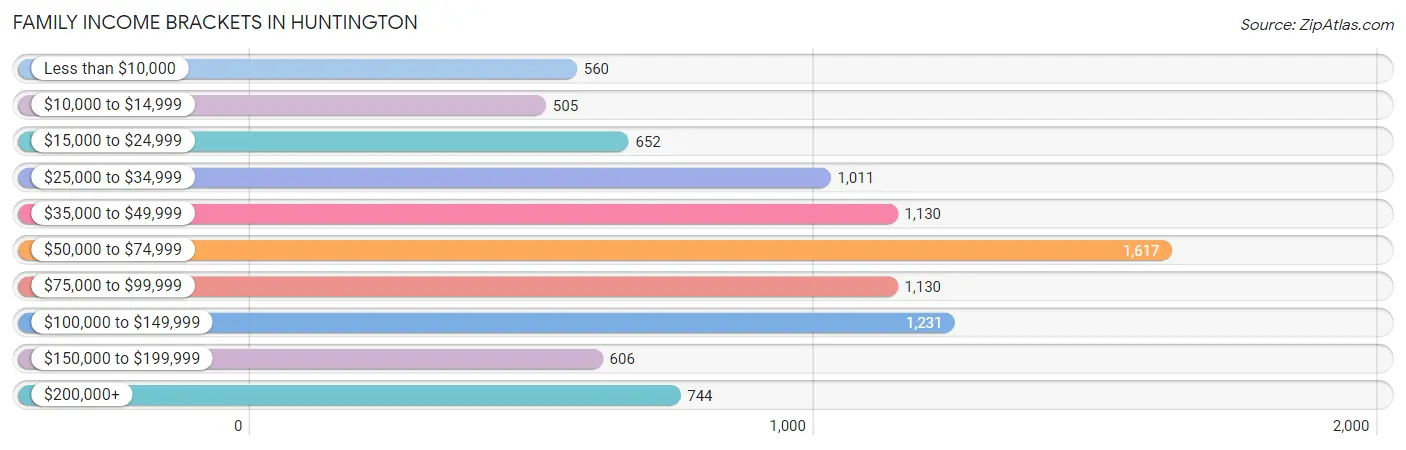
| Income Bracket | # Families | % Families |
| Less than $10,000 | 560 | 6.1% |
| $10,000 to $14,999 | 505 | 5.5% |
| $15,000 to $24,999 | 652 | 7.1% |
| $25,000 to $34,999 | 1,011 | 11.0% |
| $35,000 to $49,999 | 1,130 | 12.3% |
| $50,000 to $74,999 | 1,617 | 17.6% |
| $75,000 to $99,999 | 1,130 | 12.3% |
| $100,000 to $149,999 | 1,231 | 13.4% |
| $150,000 to $199,999 | 606 | 6.6% |
| $200,000+ | 744 | 8.1% |
Family Income by Famaliy Size in Huntington
5-person families (566 | 6.2%) account for the highest median family income in Huntington with $68,929 per family, while 2-person families (4,904 | 53.4%) have the highest median income of $27,235 per family member.
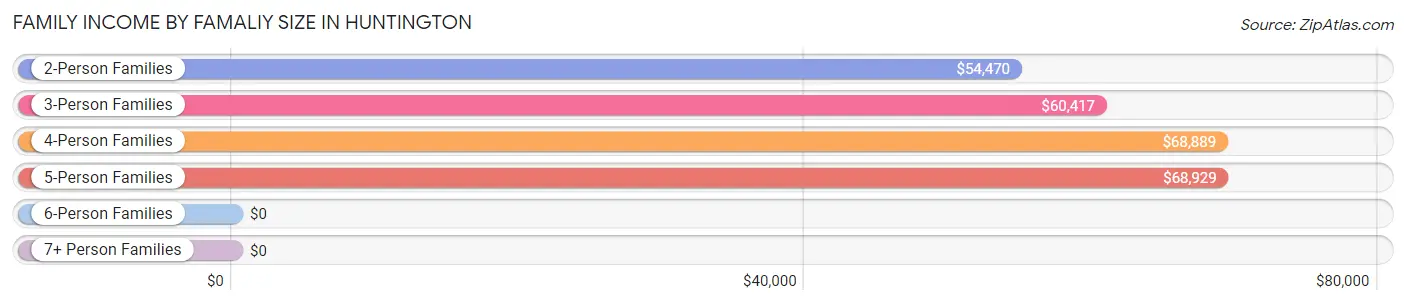
| Income Bracket | # Families | Median Income |
| 2-Person Families | 4,904 (53.4%) | $54,470 |
| 3-Person Families | 2,168 (23.6%) | $60,417 |
| 4-Person Families | 1,364 (14.8%) | $68,889 |
| 5-Person Families | 566 (6.2%) | $68,929 |
| 6-Person Families | 118 (1.3%) | $0 |
| 7+ Person Families | 67 (0.7%) | $0 |
| Total | 9,187 (100.0%) | $58,757 |
Family Income by Number of Earners in Huntington
The median family income in Huntington is $58,757, with families comprising 3+ earners (358) having the highest median family income of $118,750, while families with no earners (2,167) have the lowest median family income of $33,718, accounting for 3.9% and 23.6% of families, respectively.
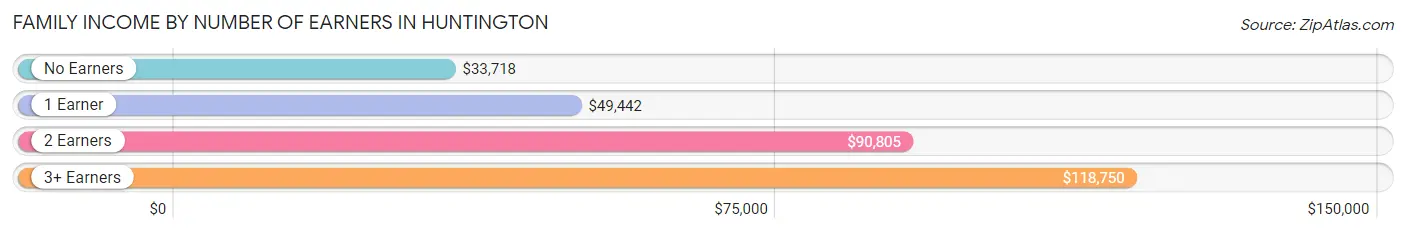
| Number of Earners | # Families | Median Income |
| No Earners | 2,167 (23.6%) | $33,718 |
| 1 Earner | 3,391 (36.9%) | $49,442 |
| 2 Earners | 3,271 (35.6%) | $90,805 |
| 3+ Earners | 358 (3.9%) | $118,750 |
| Total | 9,187 (100.0%) | $58,757 |
Household Income in Huntington
Household Income Brackets in Huntington
With 3,145 households falling in the category, the $50,000 to $74,999 income range is the most frequent in Huntington, accounting for 16.2% of all households. In contrast, only 679 households (3.5%) fall into the $150,000 to $199,999 income bracket, making it the least populous group.
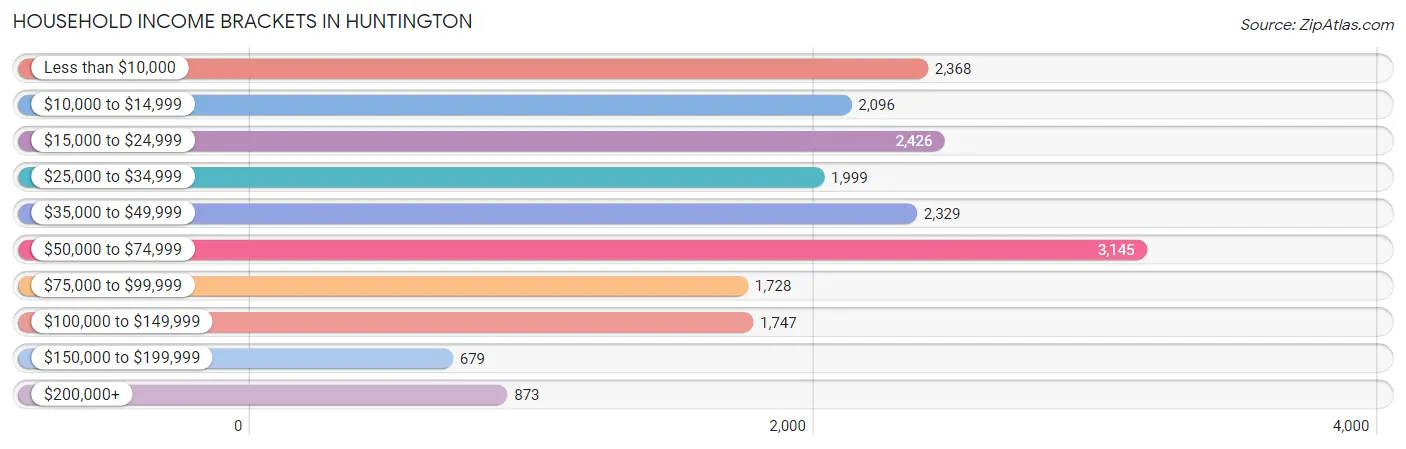
| Income Bracket | # Households | % Households |
| Less than $10,000 | 2,368 | 12.2% |
| $10,000 to $14,999 | 2,096 | 10.8% |
| $15,000 to $24,999 | 2,426 | 12.5% |
| $25,000 to $34,999 | 1,999 | 10.3% |
| $35,000 to $49,999 | 2,329 | 12.0% |
| $50,000 to $74,999 | 3,145 | 16.2% |
| $75,000 to $99,999 | 1,728 | 8.9% |
| $100,000 to $149,999 | 1,747 | 9.0% |
| $150,000 to $199,999 | 679 | 3.5% |
| $200,000+ | 873 | 4.5% |
Household Income by Householder Age in Huntington
The median household income in Huntington is $39,066, with the highest median household income of $46,462 found in the 45 to 64 years age bracket for the primary householder. A total of 6,021 households (31.0%) fall into this category. Meanwhile, the 15 to 24 years age bracket for the primary householder has the lowest median household income of $16,140, with 2,154 households (11.1%) in this group.
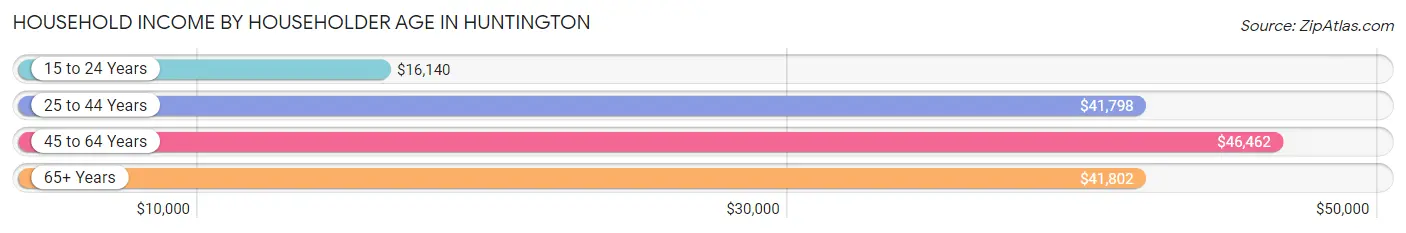
| Income Bracket | # Households | Median Income |
| 15 to 24 Years | 2,154 (11.1%) | $16,140 |
| 25 to 44 Years | 5,964 (30.7%) | $41,798 |
| 45 to 64 Years | 6,021 (31.0%) | $46,462 |
| 65+ Years | 5,272 (27.2%) | $41,802 |
| Total | 19,411 (100.0%) | $39,066 |
Poverty in Huntington
Income Below Poverty by Sex and Age in Huntington
With 27.6% poverty level for males and 29.9% for females among the residents of Huntington, 18 to 24 year old males and under 5 year old females are the most vulnerable to poverty, with 1,501 males (45.4%) and 638 females (50.8%) in their respective age groups living below the poverty level.
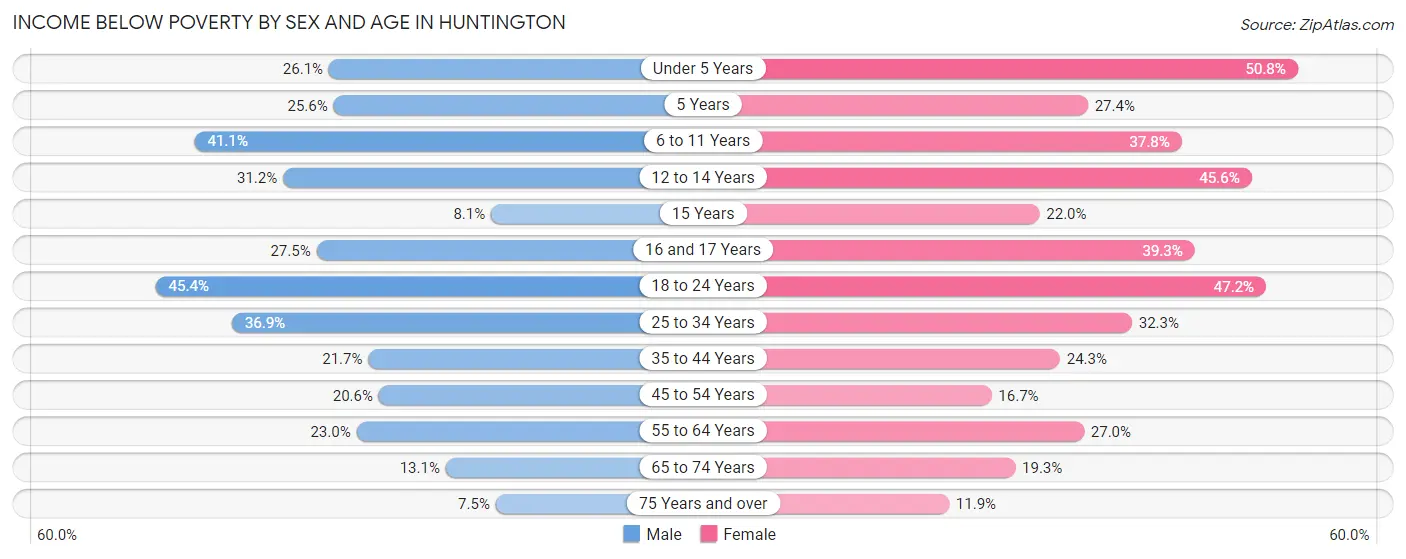
| Age Bracket | Male | Female |
| Under 5 Years | 259 (26.1%) | 638 (50.8%) |
| 5 Years | 87 (25.6%) | 63 (27.4%) |
| 6 to 11 Years | 437 (41.1%) | 607 (37.8%) |
| 12 to 14 Years | 232 (31.2%) | 276 (45.6%) |
| 15 Years | 12 (8.1%) | 44 (22.0%) |
| 16 and 17 Years | 127 (27.5%) | 154 (39.3%) |
| 18 to 24 Years | 1,501 (45.4%) | 1,663 (47.2%) |
| 25 to 34 Years | 1,119 (36.9%) | 927 (32.3%) |
| 35 to 44 Years | 519 (21.7%) | 605 (24.3%) |
| 45 to 54 Years | 578 (20.5%) | 418 (16.7%) |
| 55 to 64 Years | 528 (23.0%) | 659 (27.0%) |
| 65 to 74 Years | 264 (13.1%) | 508 (19.3%) |
| 75 Years and over | 92 (7.5%) | 239 (11.9%) |
| Total | 5,755 (27.6%) | 6,801 (29.9%) |
Income Above Poverty by Sex and Age in Huntington
According to the poverty statistics in Huntington, males aged 75 years and over and females aged 75 years and over are the age groups that are most secure financially, with 92.5% of males and 88.1% of females in these age groups living above the poverty line.
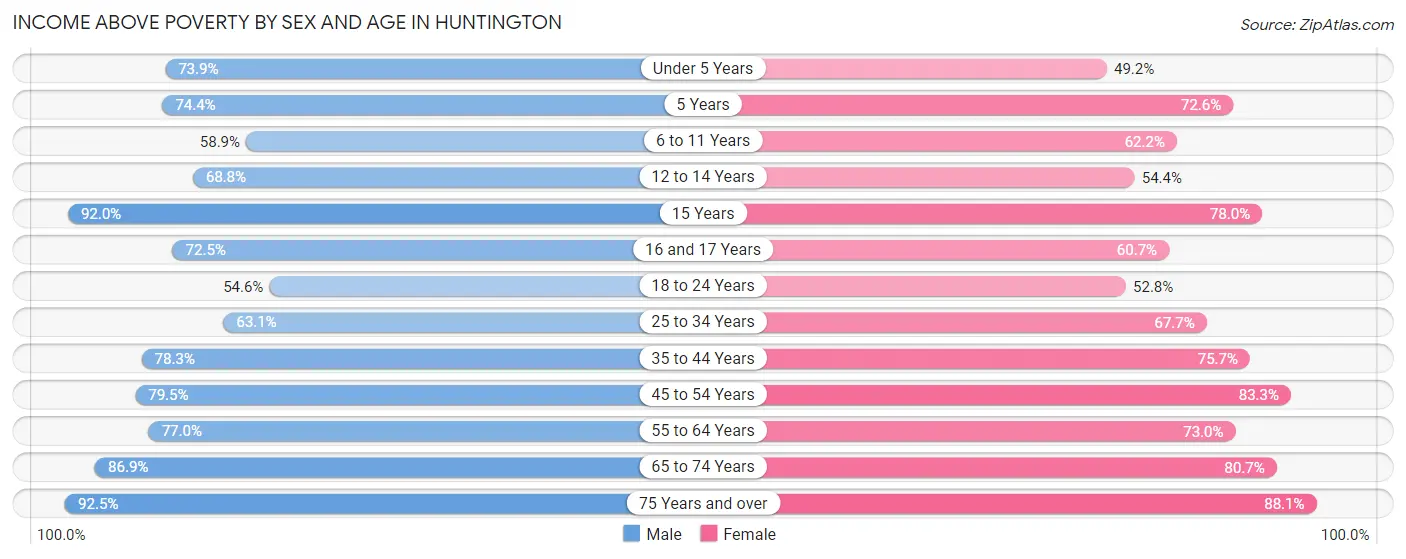
| Age Bracket | Male | Female |
| Under 5 Years | 733 (73.9%) | 619 (49.2%) |
| 5 Years | 253 (74.4%) | 167 (72.6%) |
| 6 to 11 Years | 627 (58.9%) | 997 (62.2%) |
| 12 to 14 Years | 511 (68.8%) | 329 (54.4%) |
| 15 Years | 137 (91.9%) | 156 (78.0%) |
| 16 and 17 Years | 335 (72.5%) | 238 (60.7%) |
| 18 to 24 Years | 1,805 (54.6%) | 1,858 (52.8%) |
| 25 to 34 Years | 1,913 (63.1%) | 1,943 (67.7%) |
| 35 to 44 Years | 1,871 (78.3%) | 1,887 (75.7%) |
| 45 to 54 Years | 2,235 (79.4%) | 2,091 (83.3%) |
| 55 to 64 Years | 1,764 (77.0%) | 1,785 (73.0%) |
| 65 to 74 Years | 1,751 (86.9%) | 2,124 (80.7%) |
| 75 Years and over | 1,129 (92.5%) | 1,764 (88.1%) |
| Total | 15,064 (72.4%) | 15,958 (70.1%) |
Income Below Poverty Among Married-Couple Families in Huntington
The poverty statistics for married-couple families in Huntington show that 8.4% or 522 of the total 6,251 families live below the poverty line. Families with 5 or more children have the highest poverty rate of 71.9%, comprising of 23 families. On the other hand, families with no children have the lowest poverty rate of 5.8%, which includes 232 families.
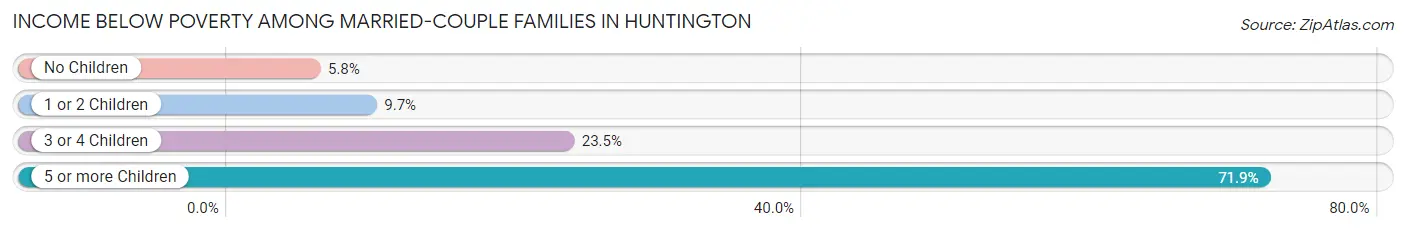
| Children | Above Poverty | Below Poverty |
| No Children | 3,785 (94.2%) | 232 (5.8%) |
| 1 or 2 Children | 1,638 (90.3%) | 176 (9.7%) |
| 3 or 4 Children | 297 (76.5%) | 91 (23.4%) |
| 5 or more Children | 9 (28.1%) | 23 (71.9%) |
| Total | 5,729 (91.6%) | 522 (8.4%) |
Income Below Poverty Among Single-Parent Households in Huntington
According to the poverty data in Huntington, 19.2% or 152 single-father households and 43.6% or 935 single-mother households are living below the poverty line. Among single-father households, those with 3 or 4 children have the highest poverty rate, with 34 households (100.0%) experiencing poverty. Likewise, among single-mother households, those with 5 or more children have the highest poverty rate, with 6 households (100.0%) falling below the poverty line.
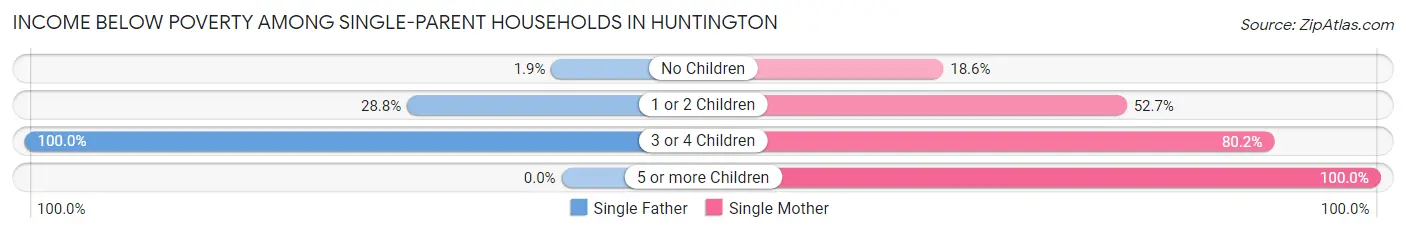
| Children | Single Father | Single Mother |
| No Children | 7 (1.9%) | 144 (18.6%) |
| 1 or 2 Children | 111 (28.8%) | 591 (52.7%) |
| 3 or 4 Children | 34 (100.0%) | 194 (80.2%) |
| 5 or more Children | 0 (0.0%) | 6 (100.0%) |
| Total | 152 (19.2%) | 935 (43.6%) |
Income Below Poverty Among Married-Couple vs Single-Parent Households in Huntington
The poverty data for Huntington shows that 522 of the married-couple family households (8.4%) and 1,087 of the single-parent households (37.0%) are living below the poverty level. Within the married-couple family households, those with 5 or more children have the highest poverty rate, with 23 households (71.9%) falling below the poverty line. Among the single-parent households, those with 5 or more children have the highest poverty rate, with 6 household (100.0%) living below poverty.
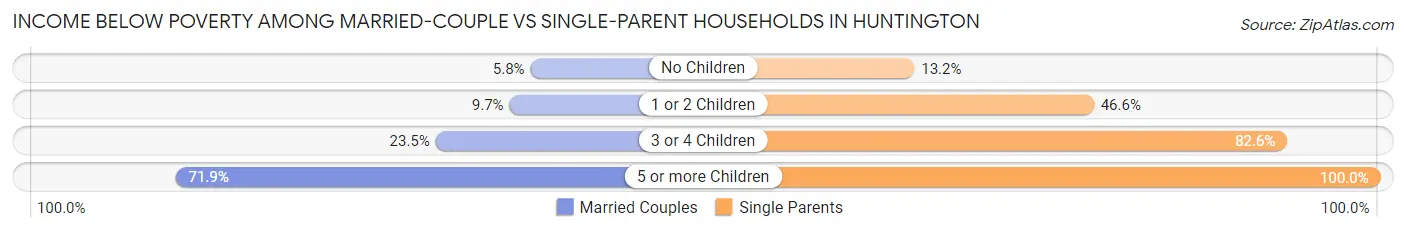
| Children | Married-Couple Families | Single-Parent Households |
| No Children | 232 (5.8%) | 151 (13.2%) |
| 1 or 2 Children | 176 (9.7%) | 702 (46.6%) |
| 3 or 4 Children | 91 (23.4%) | 228 (82.6%) |
| 5 or more Children | 23 (71.9%) | 6 (100.0%) |
| Total | 522 (8.4%) | 1,087 (37.0%) |
Race in Huntington
The most populous races in Huntington are White / Caucasian (39,634 | 85.0%), Black / African American (3,324 | 7.1%), and Two or more Races (2,700 | 5.8%).
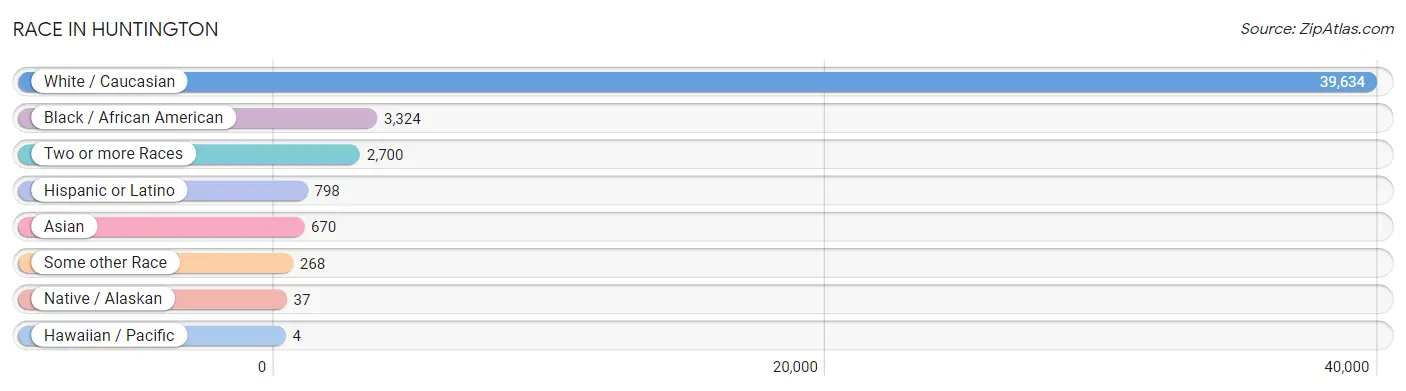
| Race | # Population | % Population |
| Asian | 670 | 1.4% |
| Black / African American | 3,324 | 7.1% |
| Hawaiian / Pacific | 4 | 0.0% |
| Hispanic or Latino | 798 | 1.7% |
| Native / Alaskan | 37 | 0.1% |
| White / Caucasian | 39,634 | 85.0% |
| Two or more Races | 2,700 | 5.8% |
| Some other Race | 268 | 0.6% |
| Total | 46,637 | 100.0% |
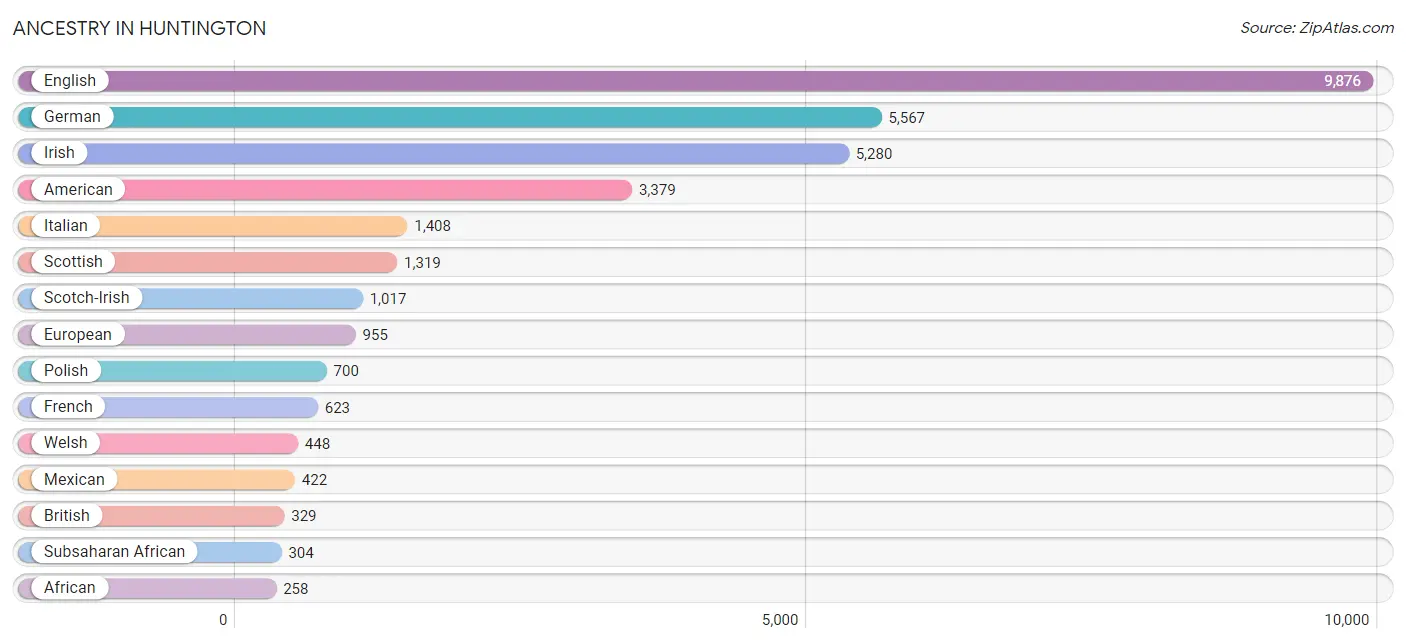
Ancestry in Huntington
The most populous ancestries reported in Huntington are English (9,876 | 21.2%), German (5,567 | 11.9%), Irish (5,280 | 11.3%), American (3,379 | 7.2%), and Italian (1,408 | 3.0%), together accounting for 54.7% of all Huntington residents.
| Ancestry | # Population | % Population |
| African | 258 | 0.5% |
| American | 3,379 | 7.2% |
| Apache | 4 | 0.0% |
| Arab | 129 | 0.3% |
| Austrian | 9 | 0.0% |
| Belgian | 24 | 0.1% |
| Belizean | 7 | 0.0% |
| Bhutanese | 126 | 0.3% |
| Blackfeet | 27 | 0.1% |
| Brazilian | 12 | 0.0% |
| British | 329 | 0.7% |
| Burmese | 93 | 0.2% |
| Canadian | 81 | 0.2% |
| Central American | 154 | 0.3% |
| Cherokee | 125 | 0.3% |
| Chinese | 26 | 0.1% |
| Croatian | 18 | 0.0% |
| Cuban | 13 | 0.0% |
| Czech | 47 | 0.1% |
| Czechoslovakian | 32 | 0.1% |
| Danish | 32 | 0.1% |
| Dominican | 10 | 0.0% |
| Dutch | 195 | 0.4% |
| Eastern European | 126 | 0.3% |
| English | 9,876 | 21.2% |
| European | 955 | 2.1% |
| Filipino | 27 | 0.1% |
| Finnish | 7 | 0.0% |
| French | 623 | 1.3% |
| French Canadian | 15 | 0.0% |
| German | 5,567 | 11.9% |
| German Russian | 2 | 0.0% |
| Ghanaian | 22 | 0.1% |
| Greek | 59 | 0.1% |
| Guamanian / Chamorro | 4 | 0.0% |
| Guatemalan | 14 | 0.0% |
| Haitian | 17 | 0.0% |
| Hungarian | 161 | 0.4% |
| Indian (Asian) | 232 | 0.5% |
| Indonesian | 30 | 0.1% |
| Inupiat | 13 | 0.0% |
| Iranian | 60 | 0.1% |
| Irish | 5,280 | 11.3% |
| Iroquois | 7 | 0.0% |
| Israeli | 19 | 0.0% |
| Italian | 1,408 | 3.0% |
| Jamaican | 55 | 0.1% |
| Korean | 136 | 0.3% |
| Lebanese | 112 | 0.2% |
| Lithuanian | 34 | 0.1% |
| Lumbee | 4 | 0.0% |
| Mexican | 422 | 0.9% |
| Mexican American Indian | 1 | 0.0% |
| Native Hawaiian | 39 | 0.1% |
| Nicaraguan | 23 | 0.1% |
| Nigerian | 10 | 0.0% |
| Northern European | 90 | 0.2% |
| Norwegian | 223 | 0.5% |
| Pakistani | 1 | 0.0% |
| Panamanian | 4 | 0.0% |
| Peruvian | 22 | 0.1% |
| Polish | 700 | 1.5% |
| Portuguese | 32 | 0.1% |
| Puerto Rican | 66 | 0.1% |
| Russian | 128 | 0.3% |
| Salvadoran | 113 | 0.2% |
| Scandinavian | 233 | 0.5% |
| Scotch-Irish | 1,017 | 2.2% |
| Scottish | 1,319 | 2.8% |
| Serbian | 27 | 0.1% |
| Sioux | 27 | 0.1% |
| Slovak | 46 | 0.1% |
| Slovene | 12 | 0.0% |
| South American | 42 | 0.1% |
| Spaniard | 48 | 0.1% |
| Spanish | 7 | 0.0% |
| Sri Lankan | 35 | 0.1% |
| Subsaharan African | 304 | 0.6% |
| Swedish | 90 | 0.2% |
| Swiss | 97 | 0.2% |
| Syrian | 3 | 0.0% |
| Thai | 238 | 0.5% |
| Trinidadian and Tobagonian | 16 | 0.0% |
| Turkish | 8 | 0.0% |
| Ukrainian | 56 | 0.1% |
| Venezuelan | 20 | 0.0% |
| Welsh | 448 | 1.0% |
| West Indian | 12 | 0.0% | View All 88 Rows |
Immigrants in Huntington
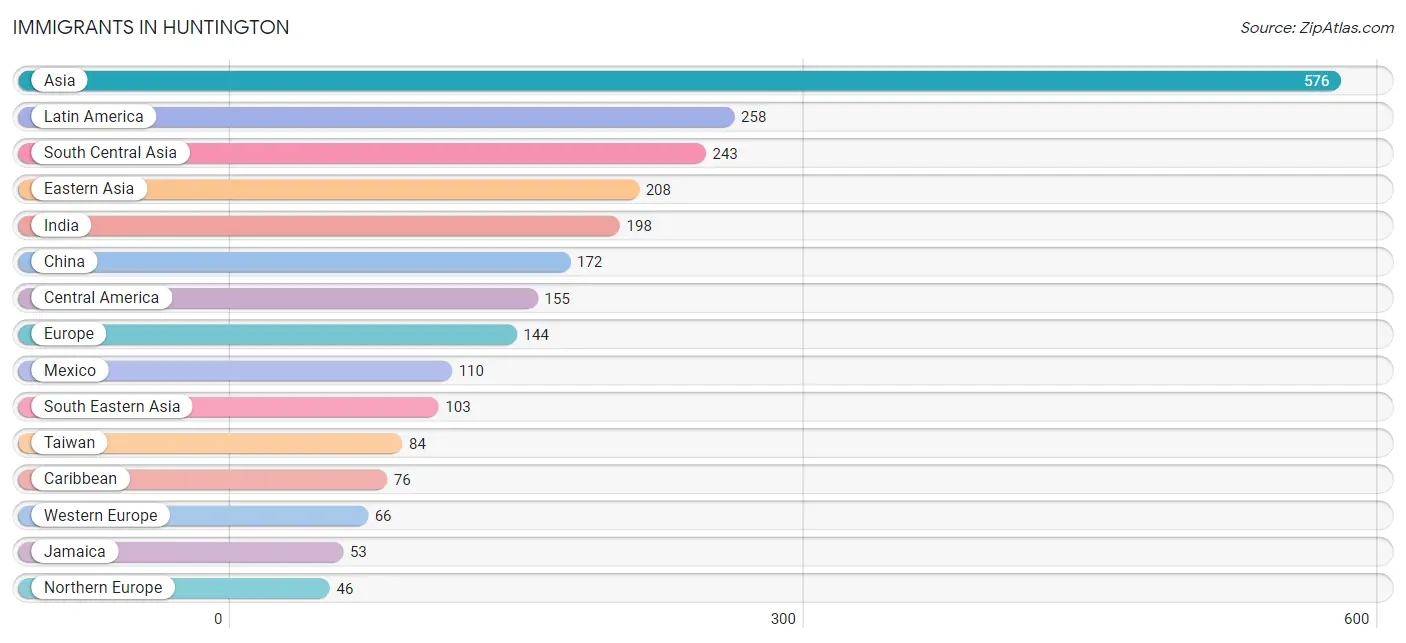
The most numerous immigrant groups reported in Huntington came from Asia (576 | 1.2%), Latin America (258 | 0.5%), South Central Asia (243 | 0.5%), Eastern Asia (208 | 0.4%), and India (198 | 0.4%), together accounting for 3.2% of all Huntington residents.
| Immigration Origin | # Population | % Population |
| Africa | 36 | 0.1% |
| Asia | 576 | 1.2% |
| Brazil | 12 | 0.0% |
| Canada | 18 | 0.0% |
| Caribbean | 76 | 0.2% |
| Central America | 155 | 0.3% |
| China | 172 | 0.4% |
| Croatia | 10 | 0.0% |
| Cuba | 7 | 0.0% |
| Eastern Africa | 17 | 0.0% |
| Eastern Asia | 208 | 0.4% |
| Eastern Europe | 10 | 0.0% |
| El Salvador | 22 | 0.1% |
| Europe | 144 | 0.3% |
| France | 16 | 0.0% |
| Germany | 34 | 0.1% |
| Guatemala | 10 | 0.0% |
| India | 198 | 0.4% |
| Iran | 16 | 0.0% |
| Israel | 19 | 0.0% |
| Jamaica | 53 | 0.1% |
| Japan | 8 | 0.0% |
| Korea | 28 | 0.1% |
| Latin America | 258 | 0.5% |
| Mexico | 110 | 0.2% |
| Netherlands | 5 | 0.0% |
| Nicaragua | 9 | 0.0% |
| Nigeria | 9 | 0.0% |
| Northern Europe | 46 | 0.1% |
| Pakistan | 29 | 0.1% |
| Panama | 4 | 0.0% |
| Peru | 5 | 0.0% |
| Philippines | 26 | 0.1% |
| Portugal | 8 | 0.0% |
| South America | 27 | 0.1% |
| South Central Asia | 243 | 0.5% |
| South Eastern Asia | 103 | 0.2% |
| Southern Europe | 22 | 0.1% |
| Spain | 14 | 0.0% |
| Sweden | 9 | 0.0% |
| Switzerland | 11 | 0.0% |
| Syria | 3 | 0.0% |
| Taiwan | 84 | 0.2% |
| Thailand | 18 | 0.0% |
| Trinidad and Tobago | 16 | 0.0% |
| Uganda | 17 | 0.0% |
| Venezuela | 10 | 0.0% |
| Vietnam | 29 | 0.1% |
| Western Africa | 19 | 0.0% |
| Western Asia | 22 | 0.1% |
| Western Europe | 66 | 0.1% | View All 51 Rows |
Sex and Age in Huntington
Sex and Age in Huntington
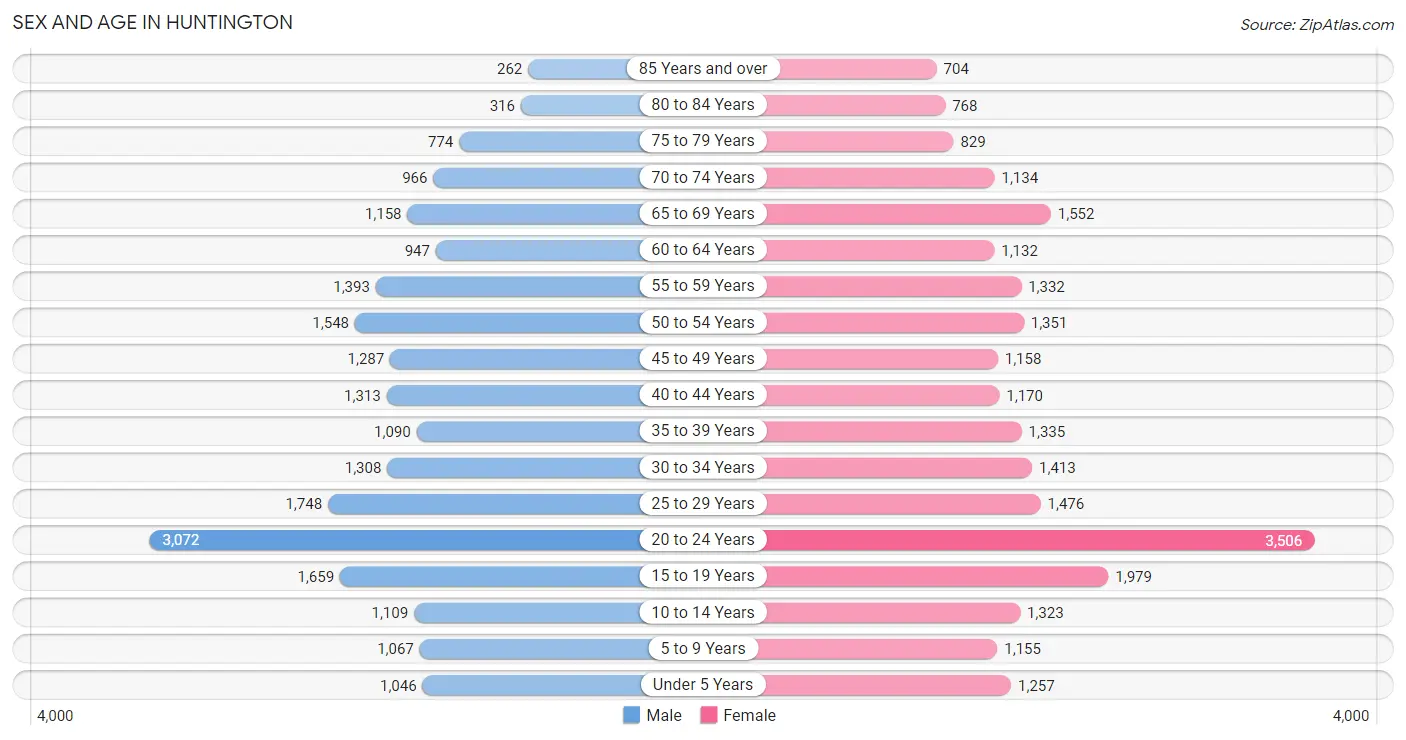
The most populous age groups in Huntington are 20 to 24 Years (3,072 | 13.9%) for men and 20 to 24 Years (3,506 | 14.3%) for women.
| Age Bracket | Male | Female |
| Under 5 Years | 1,046 (4.7%) | 1,257 (5.1%) |
| 5 to 9 Years | 1,067 (4.8%) | 1,155 (4.7%) |
| 10 to 14 Years | 1,109 (5.0%) | 1,323 (5.4%) |
| 15 to 19 Years | 1,659 (7.5%) | 1,979 (8.1%) |
| 20 to 24 Years | 3,072 (13.9%) | 3,506 (14.3%) |
| 25 to 29 Years | 1,748 (7.9%) | 1,476 (6.0%) |
| 30 to 34 Years | 1,308 (5.9%) | 1,413 (5.8%) |
| 35 to 39 Years | 1,090 (4.9%) | 1,335 (5.4%) |
| 40 to 44 Years | 1,313 (5.9%) | 1,170 (4.8%) |
| 45 to 49 Years | 1,287 (5.8%) | 1,158 (4.7%) |
| 50 to 54 Years | 1,548 (7.0%) | 1,351 (5.5%) |
| 55 to 59 Years | 1,393 (6.3%) | 1,332 (5.4%) |
| 60 to 64 Years | 947 (4.3%) | 1,132 (4.6%) |
| 65 to 69 Years | 1,158 (5.2%) | 1,552 (6.3%) |
| 70 to 74 Years | 966 (4.4%) | 1,134 (4.6%) |
| 75 to 79 Years | 774 (3.5%) | 829 (3.4%) |
| 80 to 84 Years | 316 (1.4%) | 768 (3.1%) |
| 85 Years and over | 262 (1.2%) | 704 (2.9%) |
| Total | 22,063 (100.0%) | 24,574 (100.0%) |
Families and Households in Huntington
Median Family Size in Huntington
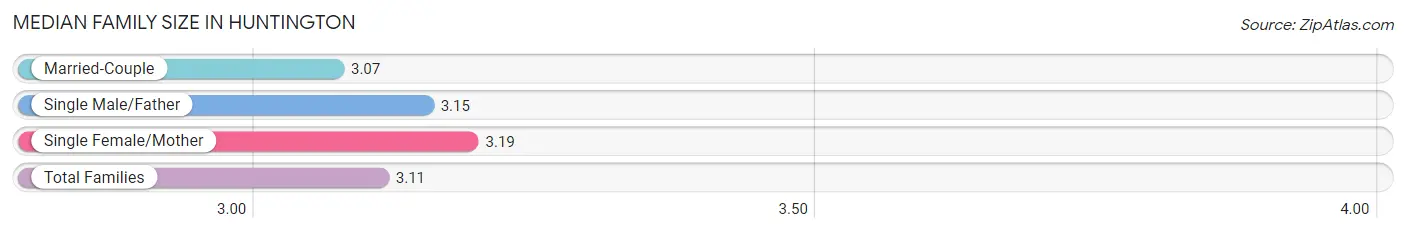
The median family size in Huntington is 3.11 persons per family, with single female/mother families (2,145 | 23.4%) accounting for the largest median family size of 3.19 persons per family. On the other hand, married-couple families (6,251 | 68.0%) represent the smallest median family size with 3.07 persons per family.
| Family Type | # Families | Family Size |
| Married-Couple | 6,251 (68.0%) | 3.07 |
| Single Male/Father | 791 (8.6%) | 3.15 |
| Single Female/Mother | 2,145 (23.4%) | 3.19 |
| Total Families | 9,187 (100.0%) | 3.11 |
Median Household Size in Huntington
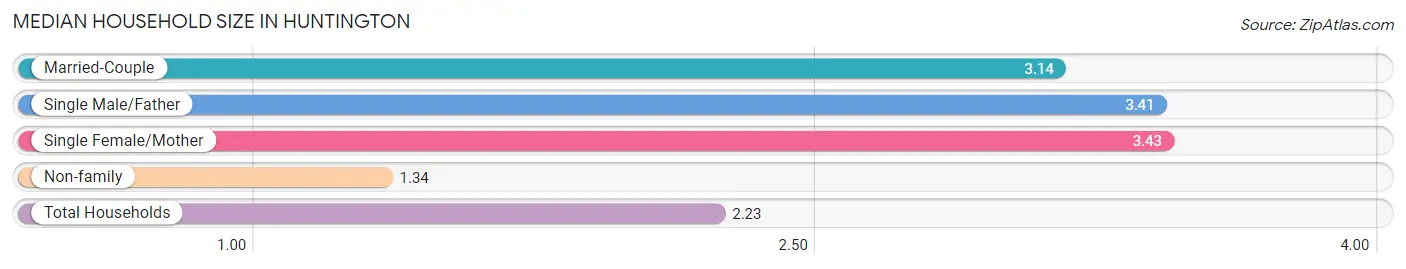
The median household size in Huntington is 2.23 persons per household, with single female/mother households (2,145 | 11.1%) accounting for the largest median household size of 3.43 persons per household. non-family households (10,224 | 52.7%) represent the smallest median household size with 1.34 persons per household.
| Household Type | # Households | Household Size |
| Married-Couple | 6,251 (32.2%) | 3.14 |
| Single Male/Father | 791 (4.1%) | 3.41 |
| Single Female/Mother | 2,145 (11.1%) | 3.43 |
| Non-family | 10,224 (52.7%) | 1.34 |
| Total Households | 19,411 (100.0%) | 2.23 |
Household Size by Marriage Status in Huntington
Out of a total of 19,411 households in Huntington, 9,187 (47.3%) are family households, while 10,224 (52.7%) are nonfamily households. The most numerous type of family households are 2-person households, comprising 4,493, and the most common type of nonfamily households are 1-person households, comprising 8,143.
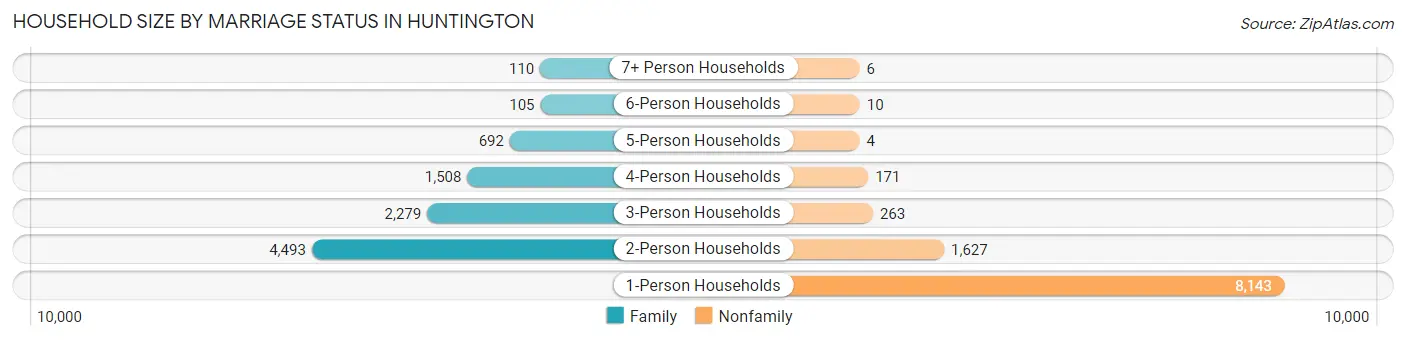
| Household Size | Family Households | Nonfamily Households |
| 1-Person Households | - | 8,143 (41.9%) |
| 2-Person Households | 4,493 (23.2%) | 1,627 (8.4%) |
| 3-Person Households | 2,279 (11.7%) | 263 (1.3%) |
| 4-Person Households | 1,508 (7.8%) | 171 (0.9%) |
| 5-Person Households | 692 (3.6%) | 4 (0.0%) |
| 6-Person Households | 105 (0.5%) | 10 (0.1%) |
| 7+ Person Households | 110 (0.6%) | 6 (0.0%) |
| Total | 9,187 (47.3%) | 10,224 (52.7%) |
Female Fertility in Huntington
Fertility by Age in Huntington
Average fertility rate in Huntington is 28.0 births per 1,000 women. Women in the age bracket of 20 to 34 years have the highest fertility rate with 35.0 births per 1,000 women. Women in the age bracket of 20 to 34 years acount for 66.0% of all women with births.
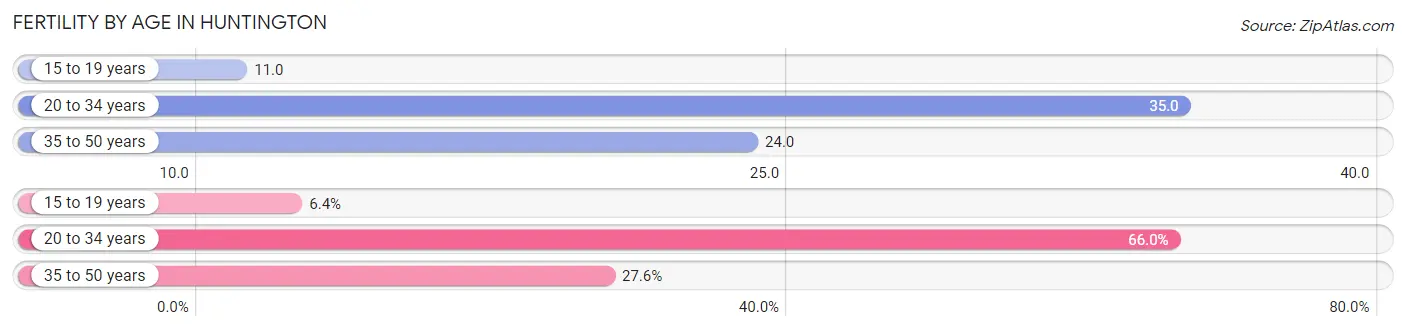
| Age Bracket | Women with Births | Births / 1,000 Women |
| 15 to 19 years | 22 (6.4%) | 11.0 |
| 20 to 34 years | 227 (66.0%) | 35.0 |
| 35 to 50 years | 95 (27.6%) | 24.0 |
| Total | 344 (100.0%) | 28.0 |
Fertility by Age by Marriage Status in Huntington
70.3% of women with births (344) in Huntington are married. The highest percentage of unmarried women with births falls into 15 to 19 years age bracket with 100.0% of them unmarried at the time of birth, while the lowest percentage of unmarried women with births belong to 35 to 50 years age bracket with 0.0% of them unmarried.
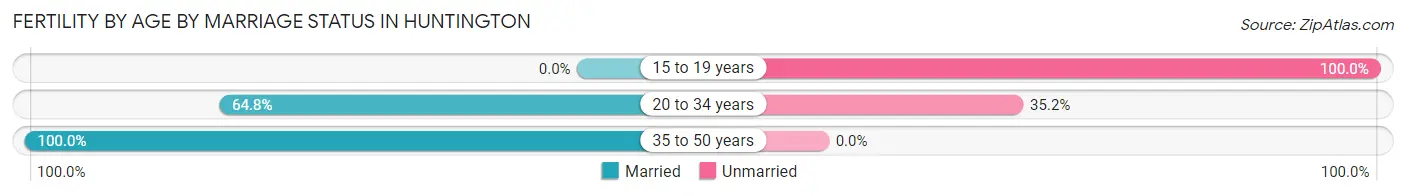
| Age Bracket | Married | Unmarried |
| 15 to 19 years | 0 (0.0%) | 22 (100.0%) |
| 20 to 34 years | 147 (64.8%) | 80 (35.2%) |
| 35 to 50 years | 95 (100.0%) | 0 (0.0%) |
| Total | 242 (70.4%) | 102 (29.6%) |
Fertility by Education in Huntington
Average fertility rate in Huntington is 28.0 births per 1,000 women. Women with the education attainment of high school diploma have the highest fertility rate of 43.0 births per 1,000 women, while women with the education attainment of bachelor's degree have the lowest fertility at 18.0 births per 1,000 women. Women with the education attainment of college or associate's degree represent 38.4% of all women with births.
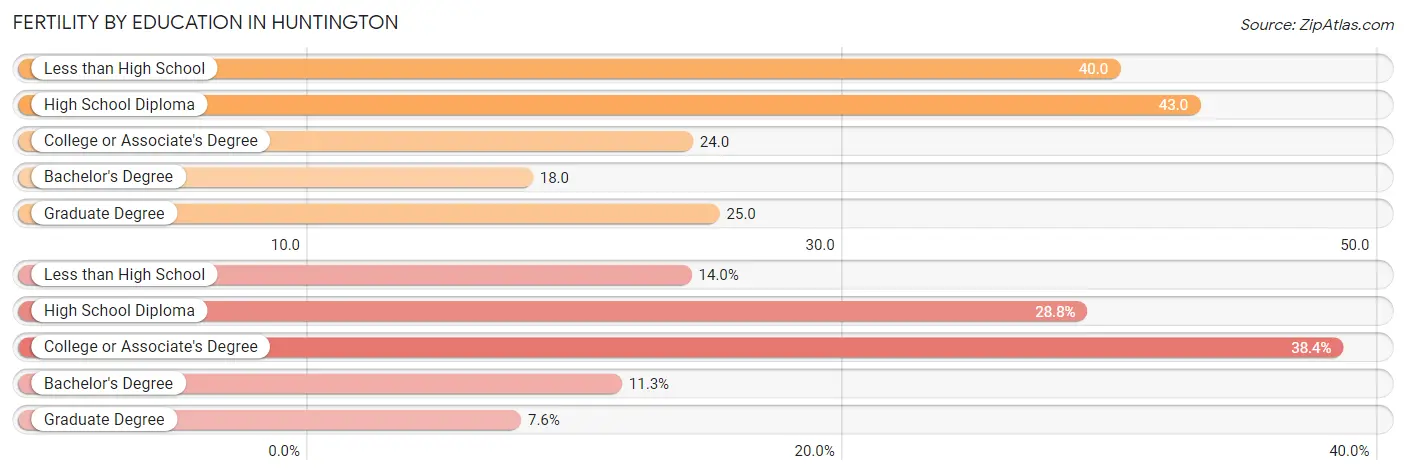
| Educational Attainment | Women with Births | Births / 1,000 Women |
| Less than High School | 48 (14.0%) | 40.0 |
| High School Diploma | 99 (28.8%) | 43.0 |
| College or Associate's Degree | 132 (38.4%) | 24.0 |
| Bachelor's Degree | 39 (11.3%) | 18.0 |
| Graduate Degree | 26 (7.6%) | 25.0 |
| Total | 344 (100.0%) | 28.0 |
Fertility by Education by Marriage Status in Huntington
29.6% of women with births in Huntington are unmarried. Women with the educational attainment of bachelor's degree are most likely to be married with 100.0% of them married at childbirth, while women with the educational attainment of high school diploma are least likely to be married with 49.5% of them unmarried at childbirth.
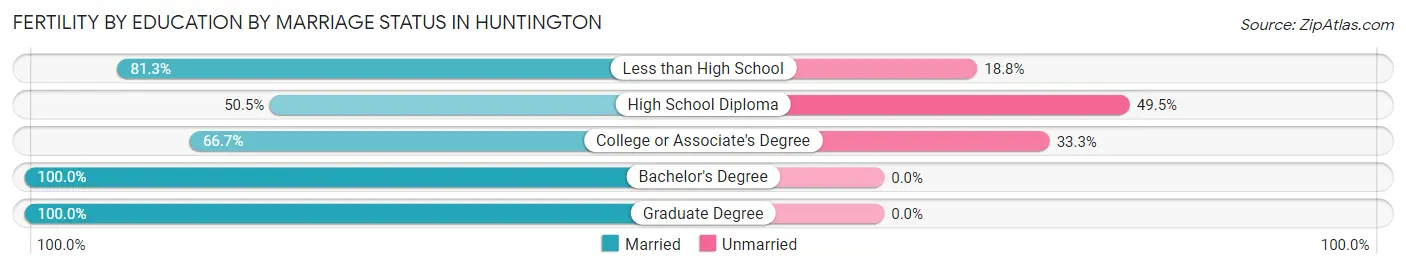
| Educational Attainment | Married | Unmarried |
| Less than High School | 39 (81.2%) | 9 (18.8%) |
| High School Diploma | 50 (50.5%) | 49 (49.5%) |
| College or Associate's Degree | 88 (66.7%) | 44 (33.3%) |
| Bachelor's Degree | 39 (100.0%) | 0 (0.0%) |
| Graduate Degree | 26 (100.0%) | 0 (0.0%) |
| Total | 242 (70.4%) | 102 (29.6%) |
Employment Characteristics in Huntington
Employment by Class of Employer in Huntington
Among the 19,361 employed individuals in Huntington, private company employees (12,181 | 62.9%), state government employees (2,096 | 10.8%), and not-for-profit organizations (1,952 | 10.1%) make up the most common classes of employment.
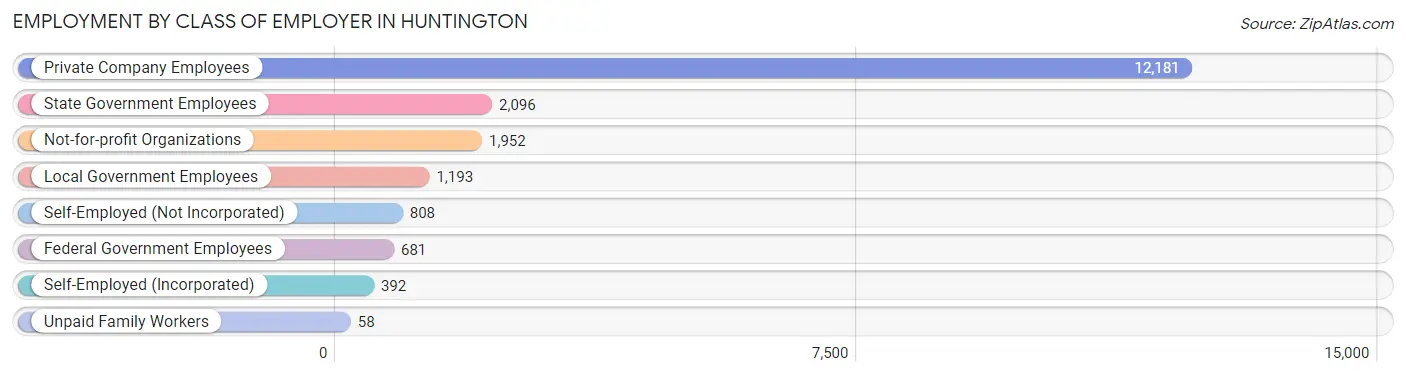
| Employer Class | # Employees | % Employees |
| Private Company Employees | 12,181 | 62.9% |
| Self-Employed (Incorporated) | 392 | 2.0% |
| Self-Employed (Not Incorporated) | 808 | 4.2% |
| Not-for-profit Organizations | 1,952 | 10.1% |
| Local Government Employees | 1,193 | 6.2% |
| State Government Employees | 2,096 | 10.8% |
| Federal Government Employees | 681 | 3.5% |
| Unpaid Family Workers | 58 | 0.3% |
| Total | 19,361 | 100.0% |
Employment Status by Age in Huntington
According to the labor force statistics for Huntington, out of the total population over 16 years of age (39,329), 54.7% or 21,513 individuals are in the labor force, with 7.8% or 1,678 of them unemployed. The age group with the highest labor force participation rate is 35 to 44 years, with 77.4% or 3,799 individuals in the labor force. Within the labor force, the 16 to 19 years age range has the highest percentage of unemployed individuals, with 14.2% or 182 of them being unemployed.
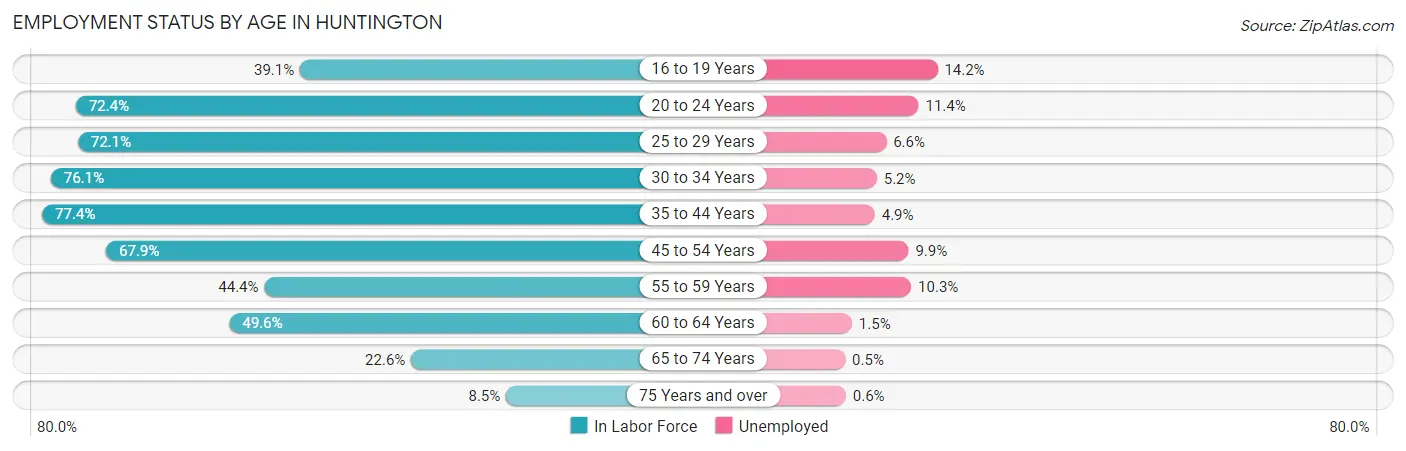
| Age Bracket | In Labor Force | Unemployed |
| 16 to 19 Years | 1,285 (39.1%) | 182 (14.2%) |
| 20 to 24 Years | 4,762 (72.4%) | 543 (11.4%) |
| 25 to 29 Years | 2,325 (72.1%) | 153 (6.6%) |
| 30 to 34 Years | 2,071 (76.1%) | 108 (5.2%) |
| 35 to 44 Years | 3,799 (77.4%) | 186 (4.9%) |
| 45 to 54 Years | 3,629 (67.9%) | 359 (9.9%) |
| 55 to 59 Years | 1,210 (44.4%) | 125 (10.3%) |
| 60 to 64 Years | 1,031 (49.6%) | 15 (1.5%) |
| 65 to 74 Years | 1,087 (22.6%) | 5 (0.5%) |
| 75 Years and over | 311 (8.5%) | 2 (0.6%) |
| Total | 21,513 (54.7%) | 1,678 (7.8%) |
Employment Status by Educational Attainment in Huntington
According to labor force statistics for Huntington, 67.0% of individuals (14,071) out of the total population between 25 and 64 years of age (21,001) are in the labor force, with 6.7% or 943 of them being unemployed. The group with the highest labor force participation rate are those with the educational attainment of bachelor's degree or higher, with 80.2% or 5,526 individuals in the labor force. Within the labor force, individuals with less than high school education have the highest percentage of unemployment, with 15.8% or 126 of them being unemployed.
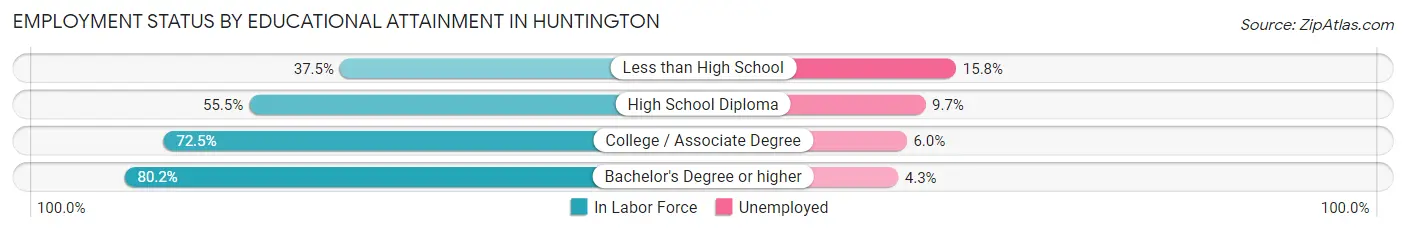
| Educational Attainment | In Labor Force | Unemployed |
| Less than High School | 795 (37.5%) | 335 (15.8%) |
| High School Diploma | 3,090 (55.5%) | 540 (9.7%) |
| College / Associate Degree | 4,657 (72.5%) | 385 (6.0%) |
| Bachelor's Degree or higher | 5,526 (80.2%) | 296 (4.3%) |
| Total | 14,071 (67.0%) | 1,407 (6.7%) |
Employment Occupations by Sex in Huntington
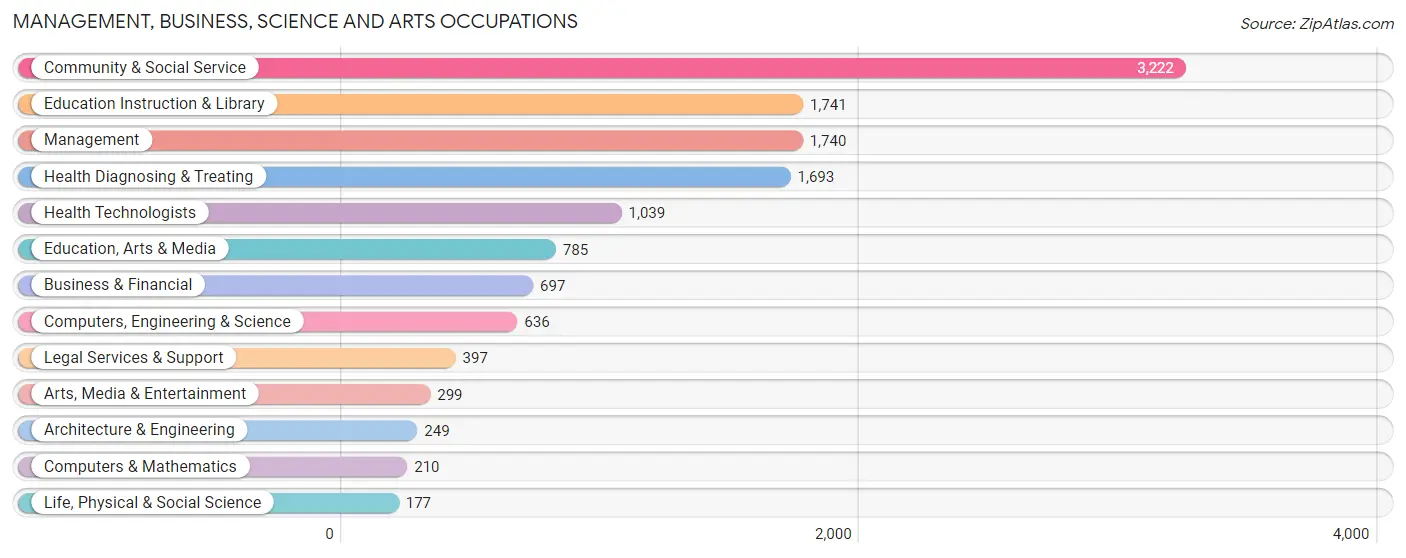
Management, Business, Science and Arts Occupations
The most common Management, Business, Science and Arts occupations in Huntington are Community & Social Service (3,222 | 16.3%), Education Instruction & Library (1,741 | 8.8%), Management (1,740 | 8.8%), Health Diagnosing & Treating (1,693 | 8.6%), and Health Technologists (1,039 | 5.2%).
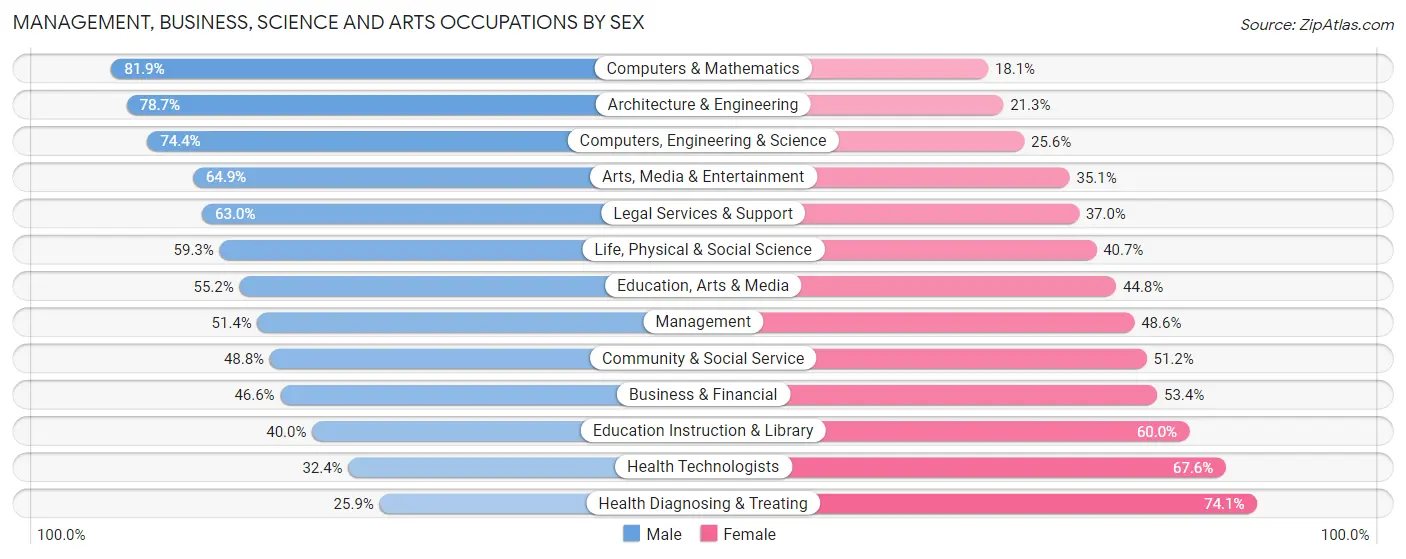
Management, Business, Science and Arts Occupations by Sex
Within the Management, Business, Science and Arts occupations in Huntington, the most male-oriented occupations are Computers & Mathematics (81.9%), Architecture & Engineering (78.7%), and Computers, Engineering & Science (74.4%), while the most female-oriented occupations are Health Diagnosing & Treating (74.1%), Health Technologists (67.6%), and Education Instruction & Library (60.0%).
| Occupation | Male | Female |
| Management | 894 (51.4%) | 846 (48.6%) |
| Business & Financial | 325 (46.6%) | 372 (53.4%) |
| Computers, Engineering & Science | 473 (74.4%) | 163 (25.6%) |
| Computers & Mathematics | 172 (81.9%) | 38 (18.1%) |
| Architecture & Engineering | 196 (78.7%) | 53 (21.3%) |
| Life, Physical & Social Science | 105 (59.3%) | 72 (40.7%) |
| Community & Social Service | 1,573 (48.8%) | 1,649 (51.2%) |
| Education, Arts & Media | 433 (55.2%) | 352 (44.8%) |
| Legal Services & Support | 250 (63.0%) | 147 (37.0%) |
| Education Instruction & Library | 696 (40.0%) | 1,045 (60.0%) |
| Arts, Media & Entertainment | 194 (64.9%) | 105 (35.1%) |
| Health Diagnosing & Treating | 439 (25.9%) | 1,254 (74.1%) |
| Health Technologists | 337 (32.4%) | 702 (67.6%) |
| Total (Category) | 3,704 (46.4%) | 4,284 (53.6%) |
| Total (Overall) | 9,625 (48.6%) | 10,176 (51.4%) |
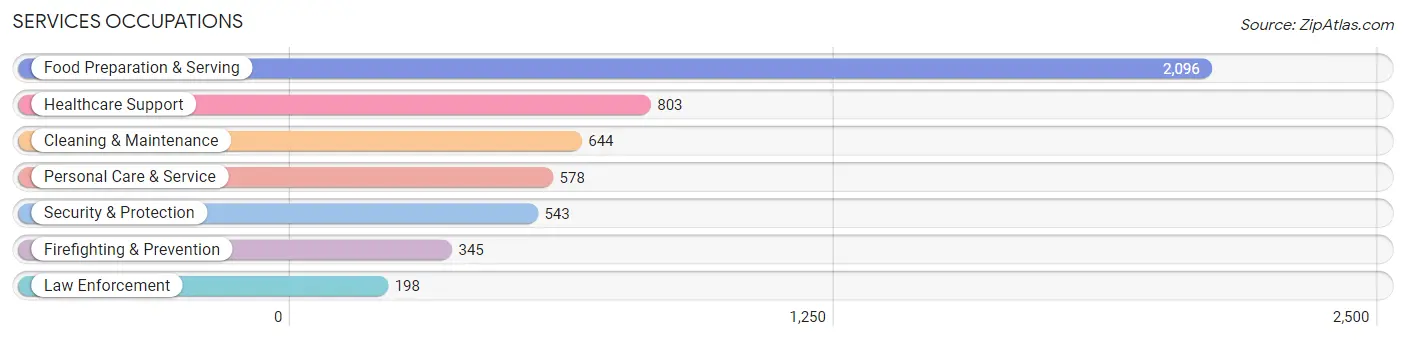
Services Occupations
The most common Services occupations in Huntington are Food Preparation & Serving (2,096 | 10.6%), Healthcare Support (803 | 4.1%), Cleaning & Maintenance (644 | 3.3%), Personal Care & Service (578 | 2.9%), and Security & Protection (543 | 2.7%).
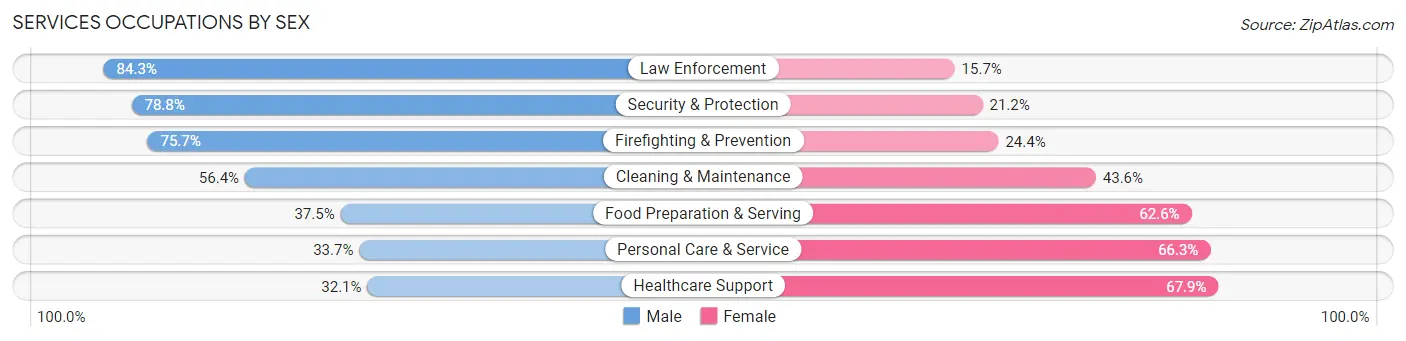
Services Occupations by Sex
Within the Services occupations in Huntington, the most male-oriented occupations are Law Enforcement (84.3%), Security & Protection (78.8%), and Firefighting & Prevention (75.6%), while the most female-oriented occupations are Healthcare Support (67.9%), Personal Care & Service (66.3%), and Food Preparation & Serving (62.5%).
| Occupation | Male | Female |
| Healthcare Support | 258 (32.1%) | 545 (67.9%) |
| Security & Protection | 428 (78.8%) | 115 (21.2%) |
| Firefighting & Prevention | 261 (75.6%) | 84 (24.3%) |
| Law Enforcement | 167 (84.3%) | 31 (15.7%) |
| Food Preparation & Serving | 785 (37.4%) | 1,311 (62.5%) |
| Cleaning & Maintenance | 363 (56.4%) | 281 (43.6%) |
| Personal Care & Service | 195 (33.7%) | 383 (66.3%) |
| Total (Category) | 2,029 (43.5%) | 2,635 (56.5%) |
| Total (Overall) | 9,625 (48.6%) | 10,176 (51.4%) |
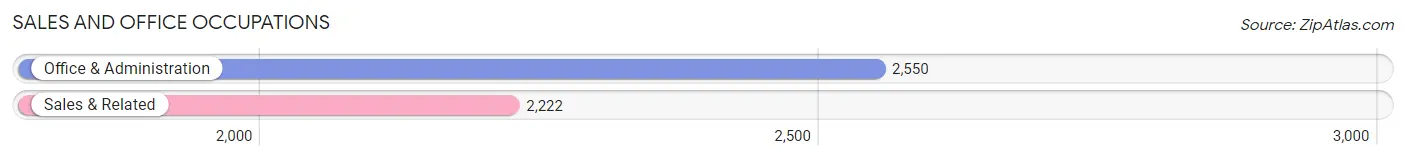
Sales and Office Occupations
The most common Sales and Office occupations in Huntington are Office & Administration (2,550 | 12.9%), and Sales & Related (2,222 | 11.2%).
Sales and Office Occupations by Sex
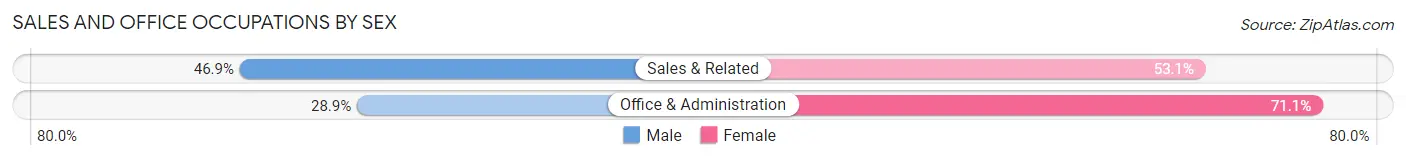
| Occupation | Male | Female |
| Sales & Related | 1,042 (46.9%) | 1,180 (53.1%) |
| Office & Administration | 736 (28.9%) | 1,814 (71.1%) |
| Total (Category) | 1,778 (37.3%) | 2,994 (62.7%) |
| Total (Overall) | 9,625 (48.6%) | 10,176 (51.4%) |
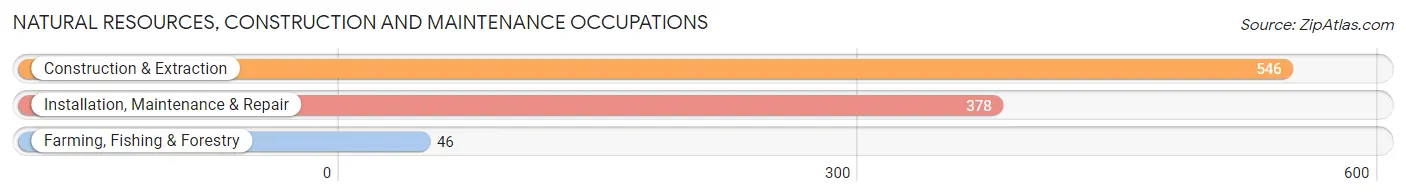
Natural Resources, Construction and Maintenance Occupations
The most common Natural Resources, Construction and Maintenance occupations in Huntington are Construction & Extraction (546 | 2.8%), Installation, Maintenance & Repair (378 | 1.9%), and Farming, Fishing & Forestry (46 | 0.2%).
Natural Resources, Construction and Maintenance Occupations by Sex
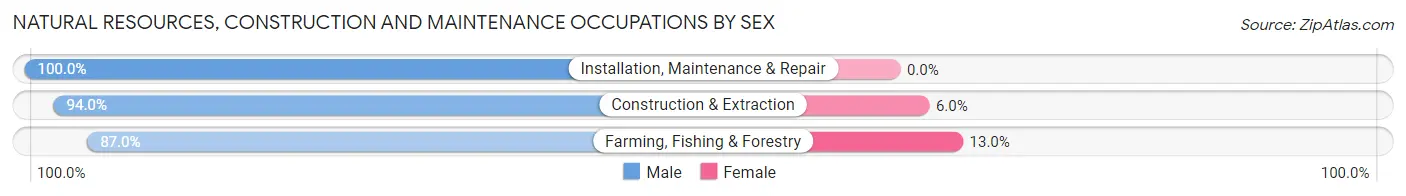
| Occupation | Male | Female |
| Farming, Fishing & Forestry | 40 (87.0%) | 6 (13.0%) |
| Construction & Extraction | 513 (94.0%) | 33 (6.0%) |
| Installation, Maintenance & Repair | 378 (100.0%) | 0 (0.0%) |
| Total (Category) | 931 (96.0%) | 39 (4.0%) |
| Total (Overall) | 9,625 (48.6%) | 10,176 (51.4%) |
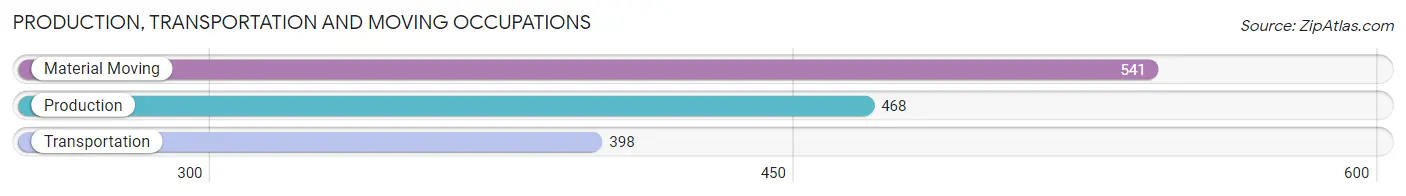
Production, Transportation and Moving Occupations
The most common Production, Transportation and Moving occupations in Huntington are Material Moving (541 | 2.7%), Production (468 | 2.4%), and Transportation (398 | 2.0%).
Production, Transportation and Moving Occupations by Sex
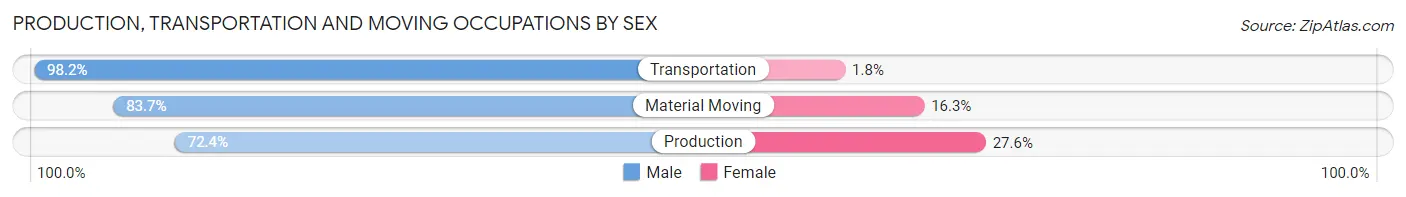
| Occupation | Male | Female |
| Production | 339 (72.4%) | 129 (27.6%) |
| Transportation | 391 (98.2%) | 7 (1.8%) |
| Material Moving | 453 (83.7%) | 88 (16.3%) |
| Total (Category) | 1,183 (84.1%) | 224 (15.9%) |
| Total (Overall) | 9,625 (48.6%) | 10,176 (51.4%) |
Employment Industries by Sex in Huntington
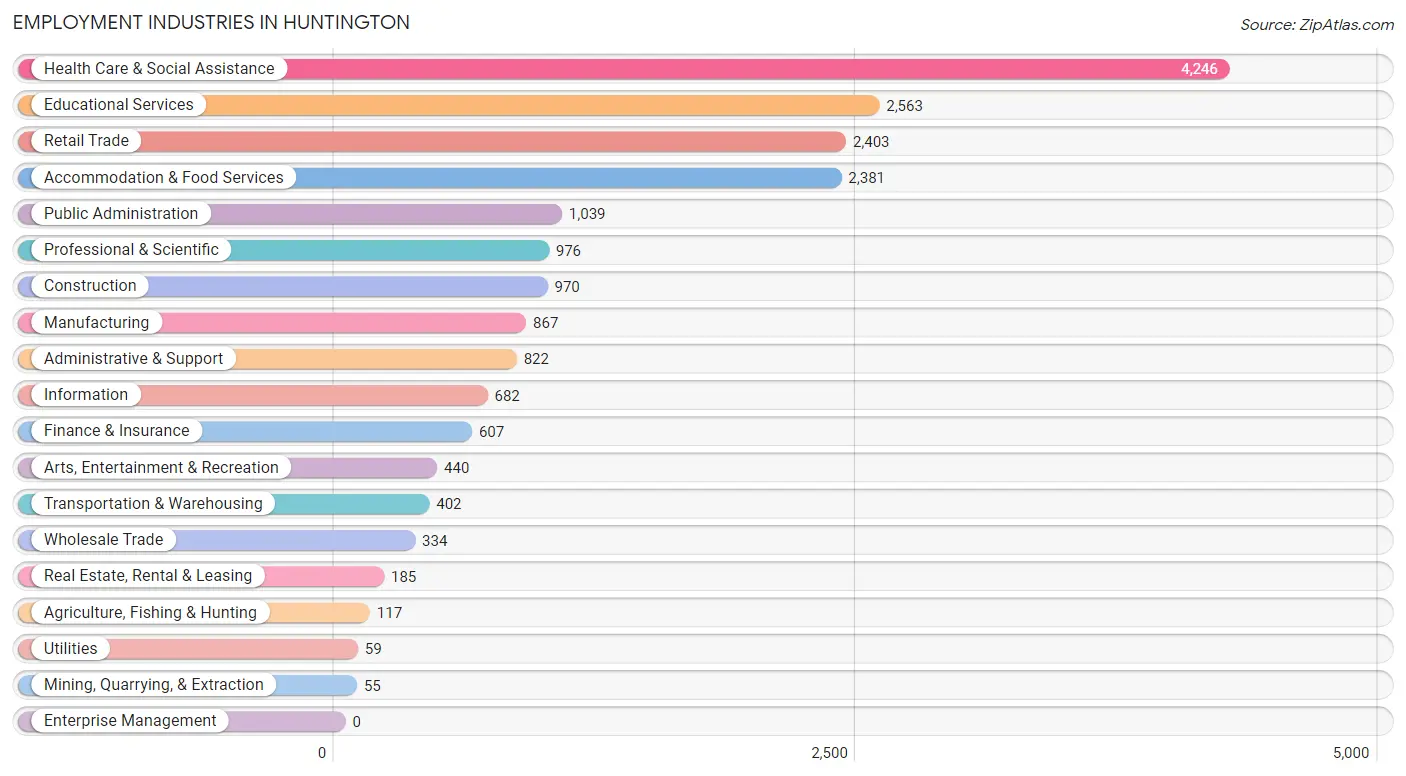
Employment Industries in Huntington
The major employment industries in Huntington include Health Care & Social Assistance (4,246 | 21.4%), Educational Services (2,563 | 12.9%), Retail Trade (2,403 | 12.1%), Accommodation & Food Services (2,381 | 12.0%), and Public Administration (1,039 | 5.2%).
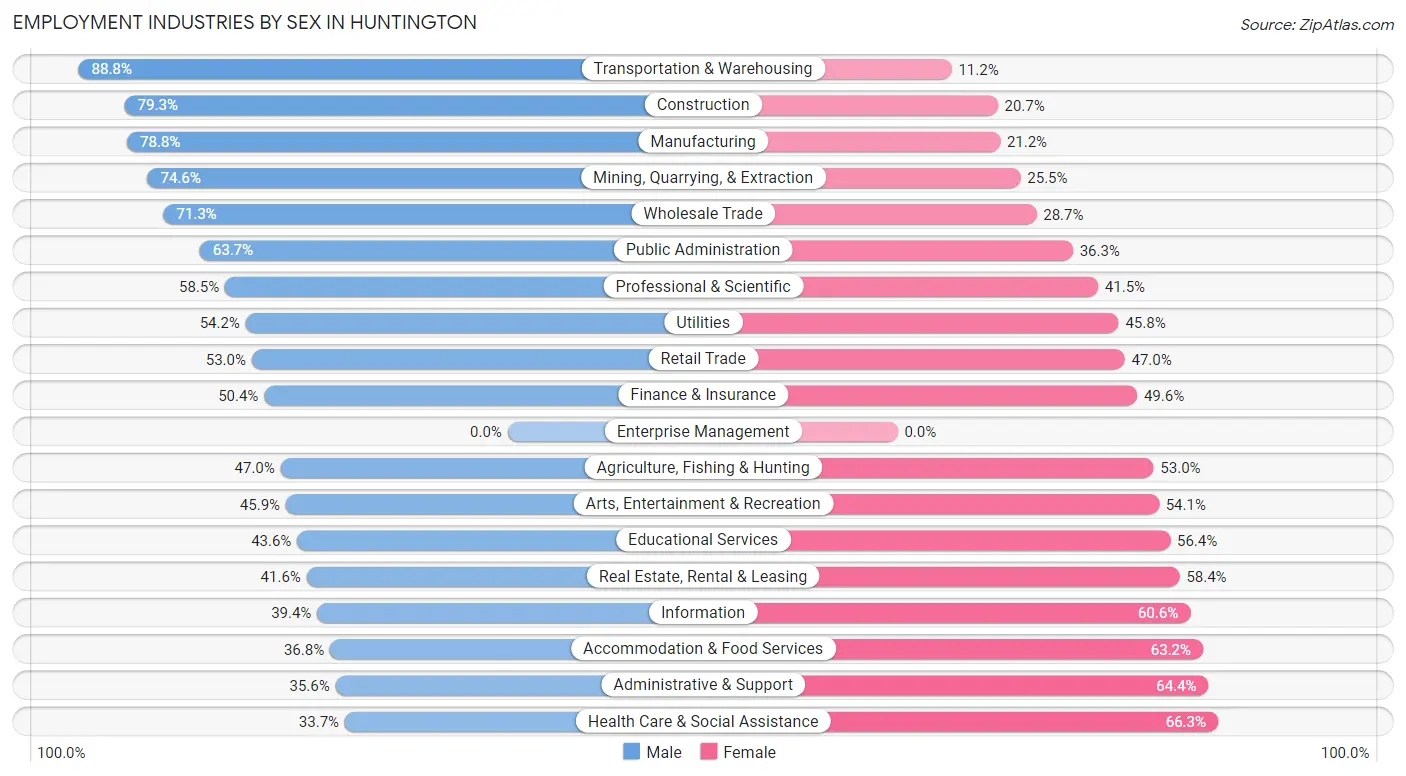
Employment Industries by Sex in Huntington
The Huntington industries that see more men than women are Transportation & Warehousing (88.8%), Construction (79.3%), and Manufacturing (78.8%), whereas the industries that tend to have a higher number of women are Health Care & Social Assistance (66.3%), Administrative & Support (64.4%), and Accommodation & Food Services (63.2%).
| Industry | Male | Female |
| Agriculture, Fishing & Hunting | 55 (47.0%) | 62 (53.0%) |
| Mining, Quarrying, & Extraction | 41 (74.6%) | 14 (25.5%) |
| Construction | 769 (79.3%) | 201 (20.7%) |
| Manufacturing | 683 (78.8%) | 184 (21.2%) |
| Wholesale Trade | 238 (71.3%) | 96 (28.7%) |
| Retail Trade | 1,273 (53.0%) | 1,130 (47.0%) |
| Transportation & Warehousing | 357 (88.8%) | 45 (11.2%) |
| Utilities | 32 (54.2%) | 27 (45.8%) |
| Information | 269 (39.4%) | 413 (60.6%) |
| Finance & Insurance | 306 (50.4%) | 301 (49.6%) |
| Real Estate, Rental & Leasing | 77 (41.6%) | 108 (58.4%) |
| Professional & Scientific | 571 (58.5%) | 405 (41.5%) |
| Enterprise Management | 0 (0.0%) | 0 (0.0%) |
| Administrative & Support | 293 (35.6%) | 529 (64.4%) |
| Educational Services | 1,117 (43.6%) | 1,446 (56.4%) |
| Health Care & Social Assistance | 1,431 (33.7%) | 2,815 (66.3%) |
| Arts, Entertainment & Recreation | 202 (45.9%) | 238 (54.1%) |
| Accommodation & Food Services | 876 (36.8%) | 1,505 (63.2%) |
| Public Administration | 662 (63.7%) | 377 (36.3%) |
| Total | 9,625 (48.6%) | 10,176 (51.4%) |
Education in Huntington
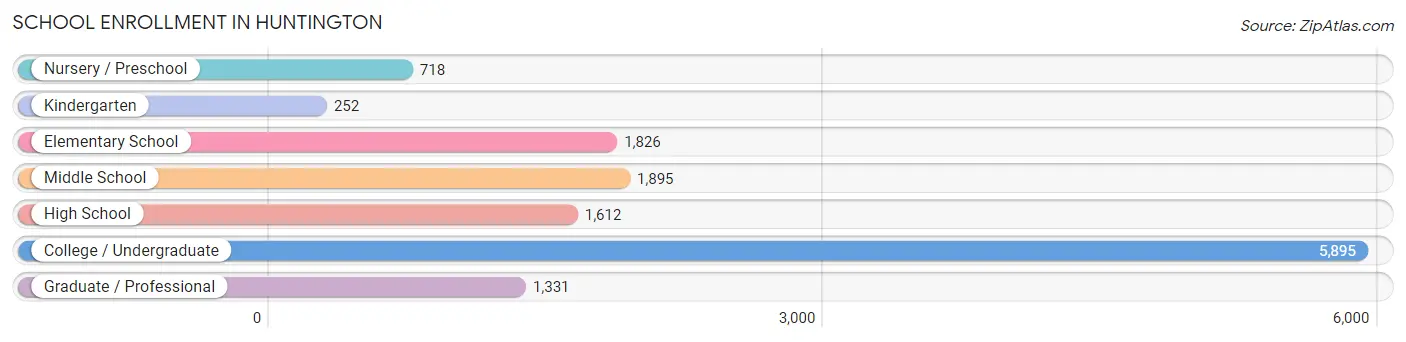
School Enrollment in Huntington
The most common levels of schooling among the 13,529 students in Huntington are college / undergraduate (5,895 | 43.6%), middle school (1,895 | 14.0%), and elementary school (1,826 | 13.5%).
| School Level | # Students | % Students |
| Nursery / Preschool | 718 | 5.3% |
| Kindergarten | 252 | 1.9% |
| Elementary School | 1,826 | 13.5% |
| Middle School | 1,895 | 14.0% |
| High School | 1,612 | 11.9% |
| College / Undergraduate | 5,895 | 43.6% |
| Graduate / Professional | 1,331 | 9.8% |
| Total | 13,529 | 100.0% |
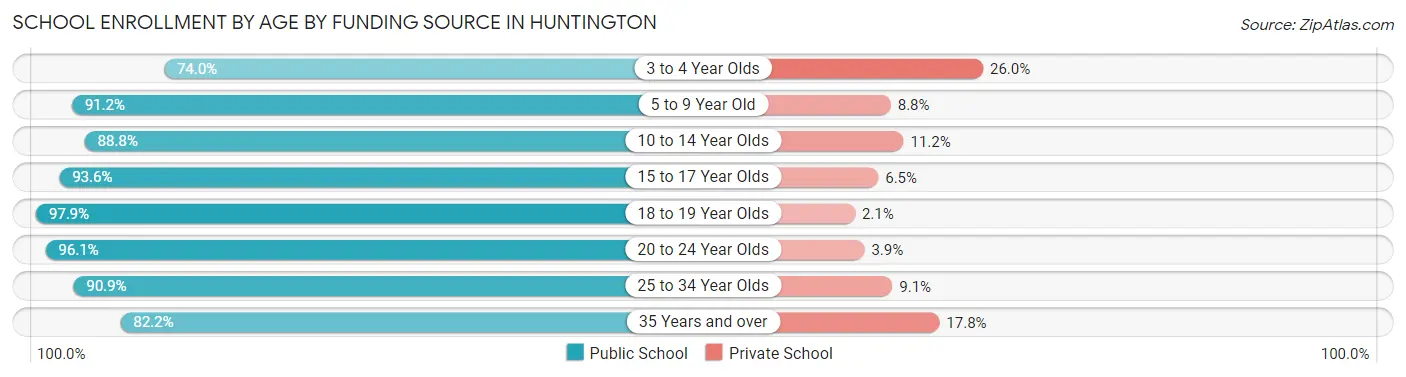
School Enrollment by Age by Funding Source in Huntington
Out of a total of 13,529 students who are enrolled in schools in Huntington, 1,001 (7.4%) attend a private institution, while the remaining 12,528 (92.6%) are enrolled in public schools. The age group of 3 to 4 year olds has the highest likelihood of being enrolled in private schools, with 95 (26.0% in the age bracket) enrolled. Conversely, the age group of 18 to 19 year olds has the lowest likelihood of being enrolled in a private school, with 1,996 (97.9% in the age bracket) attending a public institution.
| Age Bracket | Public School | Private School |
| 3 to 4 Year Olds | 271 (74.0%) | 95 (26.0%) |
| 5 to 9 Year Old | 1,880 (91.2%) | 181 (8.8%) |
| 10 to 14 Year Olds | 2,126 (88.8%) | 267 (11.2%) |
| 15 to 17 Year Olds | 1,030 (93.5%) | 71 (6.5%) |
| 18 to 19 Year Olds | 1,996 (97.9%) | 43 (2.1%) |
| 20 to 24 Year Olds | 3,893 (96.1%) | 157 (3.9%) |
| 25 to 34 Year Olds | 912 (90.9%) | 91 (9.1%) |
| 35 Years and over | 424 (82.2%) | 92 (17.8%) |
| Total | 12,528 (92.6%) | 1,001 (7.4%) |
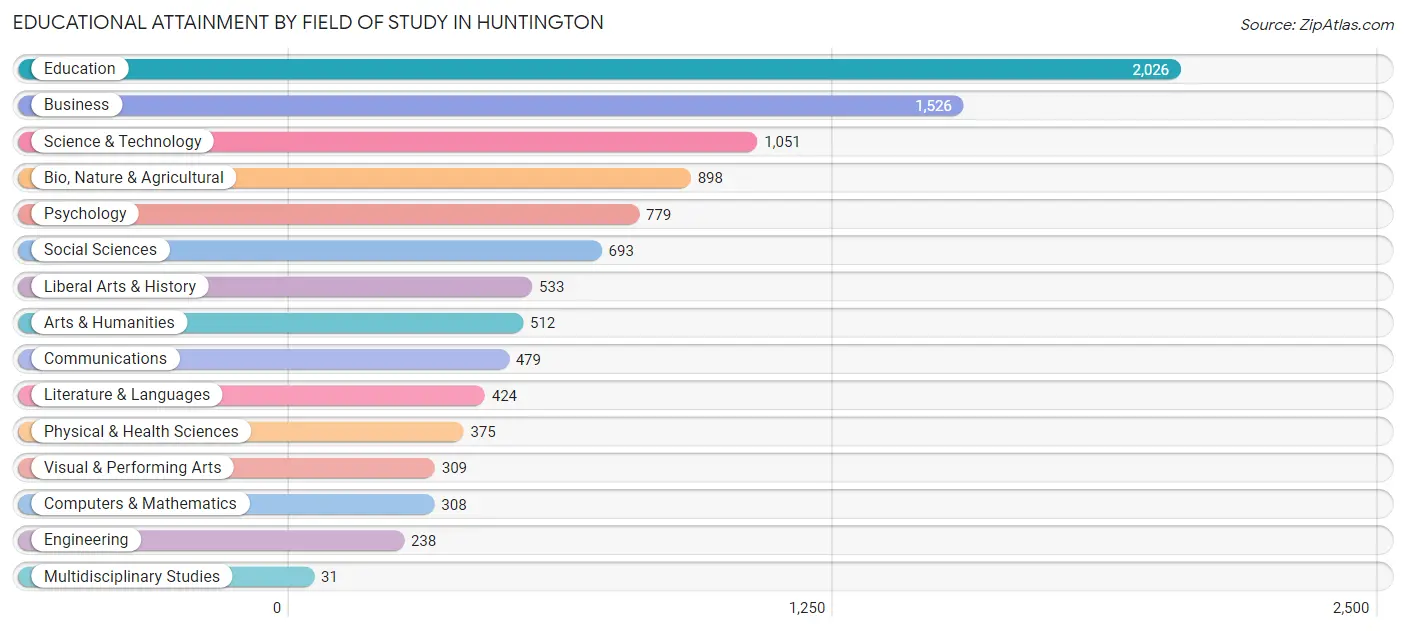
Educational Attainment by Field of Study in Huntington
Education (2,026 | 19.9%), business (1,526 | 15.0%), science & technology (1,051 | 10.3%), bio, nature & agricultural (898 | 8.8%), and psychology (779 | 7.6%) are the most common fields of study among 10,182 individuals in Huntington who have obtained a bachelor's degree or higher.
| Field of Study | # Graduates | % Graduates |
| Computers & Mathematics | 308 | 3.0% |
| Bio, Nature & Agricultural | 898 | 8.8% |
| Physical & Health Sciences | 375 | 3.7% |
| Psychology | 779 | 7.6% |
| Social Sciences | 693 | 6.8% |
| Engineering | 238 | 2.3% |
| Multidisciplinary Studies | 31 | 0.3% |
| Science & Technology | 1,051 | 10.3% |
| Business | 1,526 | 15.0% |
| Education | 2,026 | 19.9% |
| Literature & Languages | 424 | 4.2% |
| Liberal Arts & History | 533 | 5.2% |
| Visual & Performing Arts | 309 | 3.0% |
| Communications | 479 | 4.7% |
| Arts & Humanities | 512 | 5.0% |
| Total | 10,182 | 100.0% |
Transportation & Commute in Huntington
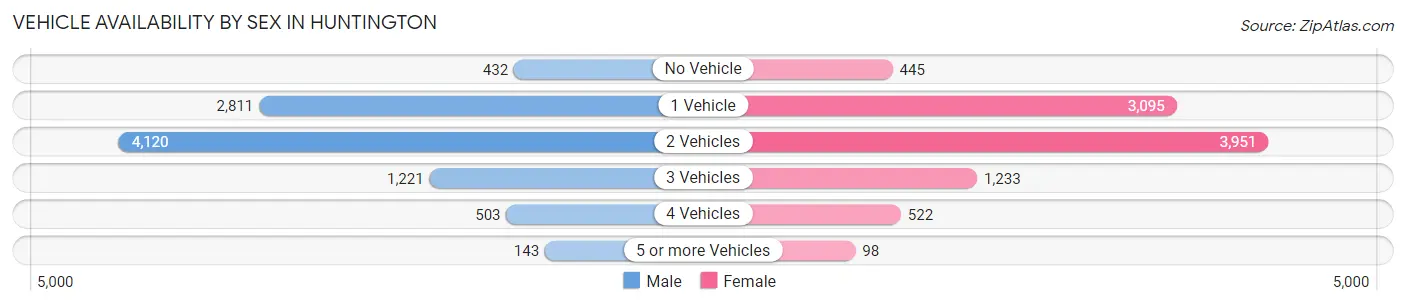
Vehicle Availability by Sex in Huntington
The most prevalent vehicle ownership categories in Huntington are males with 2 vehicles (4,120, accounting for 44.6%) and females with 2 vehicles (3,951, making up 44.1%).
| Vehicles Available | Male | Female |
| No Vehicle | 432 (4.7%) | 445 (4.8%) |
| 1 Vehicle | 2,811 (30.5%) | 3,095 (33.1%) |
| 2 Vehicles | 4,120 (44.6%) | 3,951 (42.3%) |
| 3 Vehicles | 1,221 (13.2%) | 1,233 (13.2%) |
| 4 Vehicles | 503 (5.4%) | 522 (5.6%) |
| 5 or more Vehicles | 143 (1.5%) | 98 (1.1%) |
| Total | 9,230 (100.0%) | 9,344 (100.0%) |
Commute Time in Huntington
The most frequently occuring commute durations in Huntington are 10 to 14 minutes (3,953 commuters, 22.1%), 5 to 9 minutes (3,732 commuters, 20.8%), and 15 to 19 minutes (3,137 commuters, 17.5%).
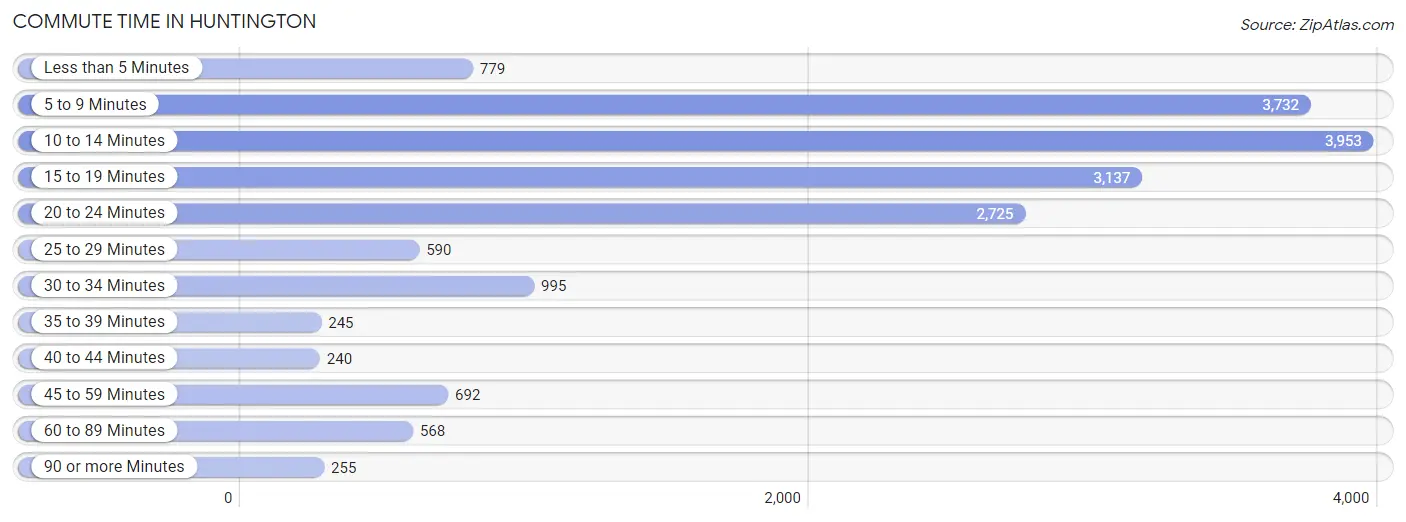
| Commute Time | # Commuters | % Commuters |
| Less than 5 Minutes | 779 | 4.3% |
| 5 to 9 Minutes | 3,732 | 20.8% |
| 10 to 14 Minutes | 3,953 | 22.1% |
| 15 to 19 Minutes | 3,137 | 17.5% |
| 20 to 24 Minutes | 2,725 | 15.2% |
| 25 to 29 Minutes | 590 | 3.3% |
| 30 to 34 Minutes | 995 | 5.6% |
| 35 to 39 Minutes | 245 | 1.4% |
| 40 to 44 Minutes | 240 | 1.3% |
| 45 to 59 Minutes | 692 | 3.9% |
| 60 to 89 Minutes | 568 | 3.2% |
| 90 or more Minutes | 255 | 1.4% |
Commute Time by Sex in Huntington
The most common commute times in Huntington are 10 to 14 minutes (1,939 commuters, 21.8%) for males and 10 to 14 minutes (2,014 commuters, 22.4%) for females.
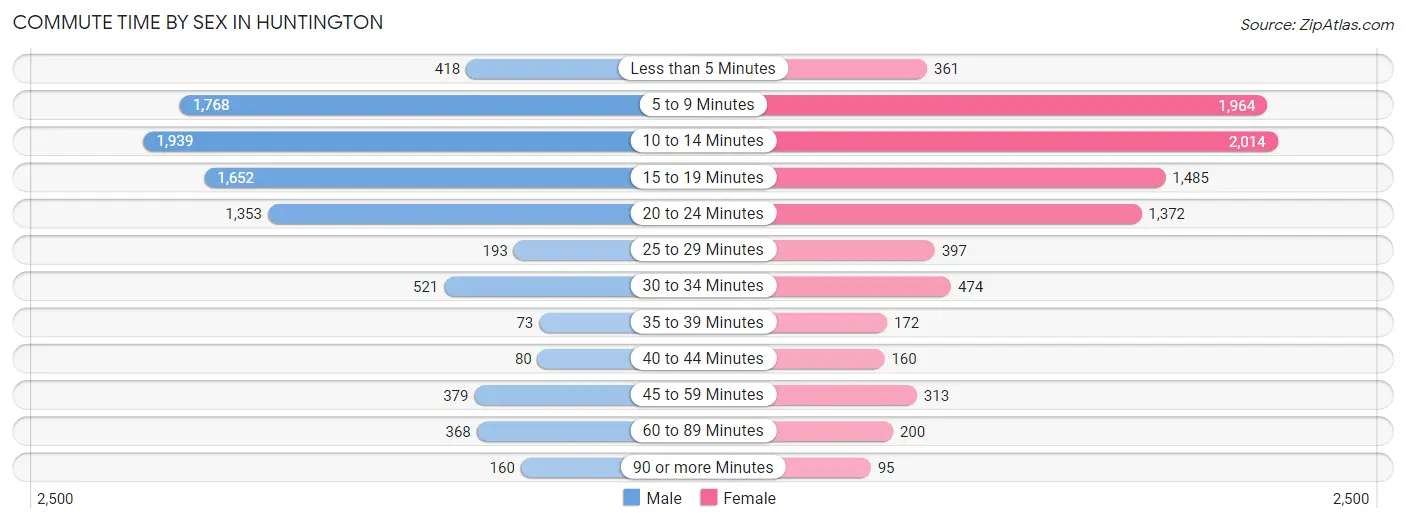
| Commute Time | Male | Female |
| Less than 5 Minutes | 418 (4.7%) | 361 (4.0%) |
| 5 to 9 Minutes | 1,768 (19.9%) | 1,964 (21.8%) |
| 10 to 14 Minutes | 1,939 (21.8%) | 2,014 (22.4%) |
| 15 to 19 Minutes | 1,652 (18.5%) | 1,485 (16.5%) |
| 20 to 24 Minutes | 1,353 (15.2%) | 1,372 (15.2%) |
| 25 to 29 Minutes | 193 (2.2%) | 397 (4.4%) |
| 30 to 34 Minutes | 521 (5.9%) | 474 (5.3%) |
| 35 to 39 Minutes | 73 (0.8%) | 172 (1.9%) |
| 40 to 44 Minutes | 80 (0.9%) | 160 (1.8%) |
| 45 to 59 Minutes | 379 (4.3%) | 313 (3.5%) |
| 60 to 89 Minutes | 368 (4.1%) | 200 (2.2%) |
| 90 or more Minutes | 160 (1.8%) | 95 (1.1%) |
Time of Departure to Work by Sex in Huntington
The most frequent times of departure to work in Huntington are 12:00 PM to 3:59 PM (985, 11.1%) for males and 7:30 AM to 7:59 AM (1,362, 15.1%) for females.
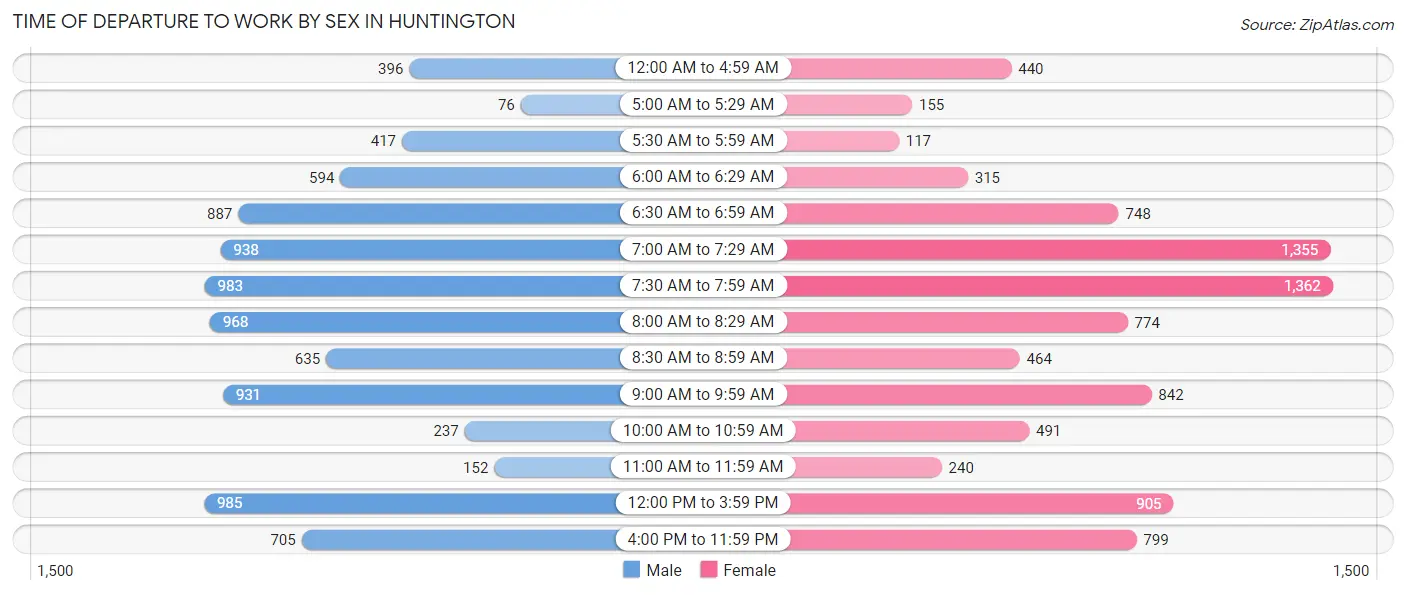
| Time of Departure | Male | Female |
| 12:00 AM to 4:59 AM | 396 (4.4%) | 440 (4.9%) |
| 5:00 AM to 5:29 AM | 76 (0.9%) | 155 (1.7%) |
| 5:30 AM to 5:59 AM | 417 (4.7%) | 117 (1.3%) |
| 6:00 AM to 6:29 AM | 594 (6.7%) | 315 (3.5%) |
| 6:30 AM to 6:59 AM | 887 (10.0%) | 748 (8.3%) |
| 7:00 AM to 7:29 AM | 938 (10.5%) | 1,355 (15.0%) |
| 7:30 AM to 7:59 AM | 983 (11.0%) | 1,362 (15.1%) |
| 8:00 AM to 8:29 AM | 968 (10.9%) | 774 (8.6%) |
| 8:30 AM to 8:59 AM | 635 (7.1%) | 464 (5.1%) |
| 9:00 AM to 9:59 AM | 931 (10.5%) | 842 (9.3%) |
| 10:00 AM to 10:59 AM | 237 (2.7%) | 491 (5.4%) |
| 11:00 AM to 11:59 AM | 152 (1.7%) | 240 (2.7%) |
| 12:00 PM to 3:59 PM | 985 (11.1%) | 905 (10.1%) |
| 4:00 PM to 11:59 PM | 705 (7.9%) | 799 (8.9%) |
| Total | 8,904 (100.0%) | 9,007 (100.0%) |
Housing Occupancy in Huntington
Occupancy by Ownership in Huntington
Of the total 19,411 dwellings in Huntington, owner-occupied units account for 10,557 (54.4%), while renter-occupied units make up 8,854 (45.6%).
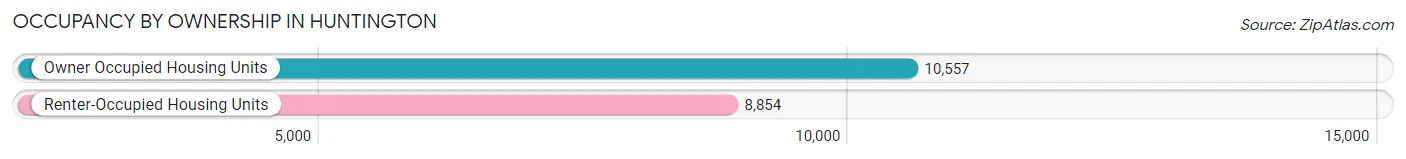
| Occupancy | # Housing Units | % Housing Units |
| Owner Occupied Housing Units | 10,557 | 54.4% |
| Renter-Occupied Housing Units | 8,854 | 45.6% |
| Total Occupied Housing Units | 19,411 | 100.0% |
Occupancy by Household Size in Huntington
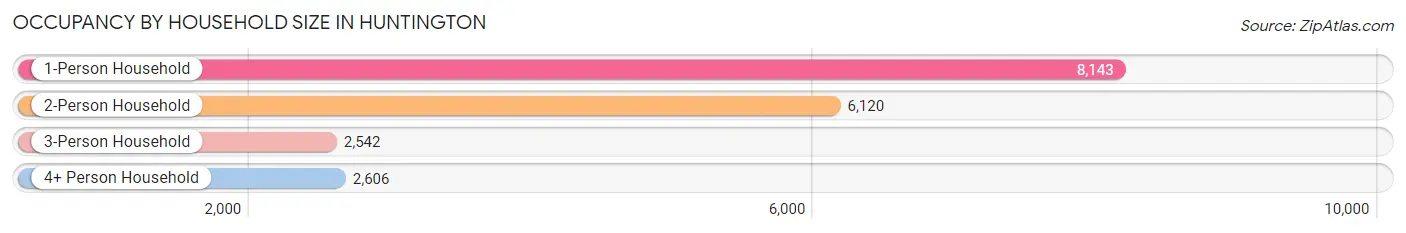
| Household Size | # Housing Units | % Housing Units |
| 1-Person Household | 8,143 | 41.9% |
| 2-Person Household | 6,120 | 31.5% |
| 3-Person Household | 2,542 | 13.1% |
| 4+ Person Household | 2,606 | 13.4% |
| Total Housing Units | 19,411 | 100.0% |
Occupancy by Ownership by Household Size in Huntington
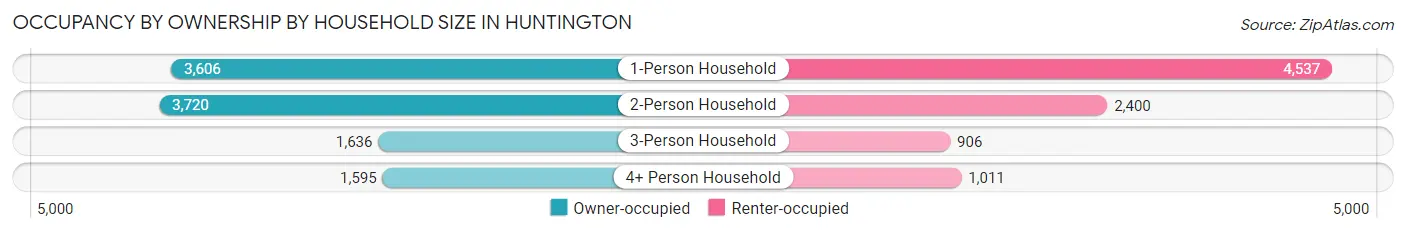
| Household Size | Owner-occupied | Renter-occupied |
| 1-Person Household | 3,606 (44.3%) | 4,537 (55.7%) |
| 2-Person Household | 3,720 (60.8%) | 2,400 (39.2%) |
| 3-Person Household | 1,636 (64.4%) | 906 (35.6%) |
| 4+ Person Household | 1,595 (61.2%) | 1,011 (38.8%) |
| Total Housing Units | 10,557 (54.4%) | 8,854 (45.6%) |
Occupancy by Educational Attainment in Huntington
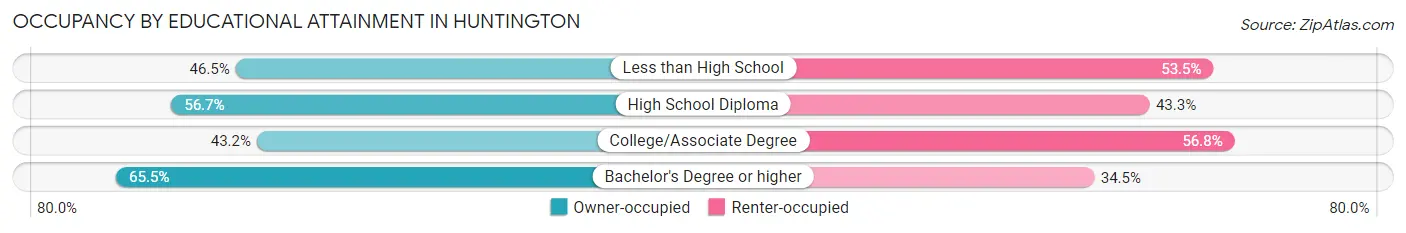
| Household Size | Owner-occupied | Renter-occupied |
| Less than High School | 744 (46.5%) | 855 (53.5%) |
| High School Diploma | 2,659 (56.7%) | 2,028 (43.3%) |
| College/Associate Degree | 2,786 (43.2%) | 3,668 (56.8%) |
| Bachelor's Degree or higher | 4,368 (65.5%) | 2,303 (34.5%) |
Occupancy by Age of Householder in Huntington
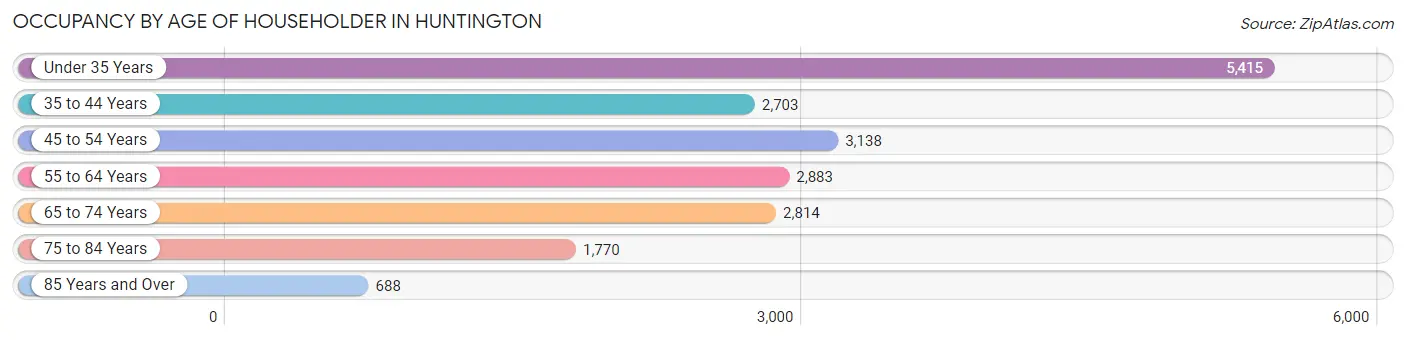
| Age Bracket | # Households | % Households |
| Under 35 Years | 5,415 | 27.9% |
| 35 to 44 Years | 2,703 | 13.9% |
| 45 to 54 Years | 3,138 | 16.2% |
| 55 to 64 Years | 2,883 | 14.8% |
| 65 to 74 Years | 2,814 | 14.5% |
| 75 to 84 Years | 1,770 | 9.1% |
| 85 Years and Over | 688 | 3.5% |
| Total | 19,411 | 100.0% |
Housing Finances in Huntington
Median Income by Occupancy in Huntington
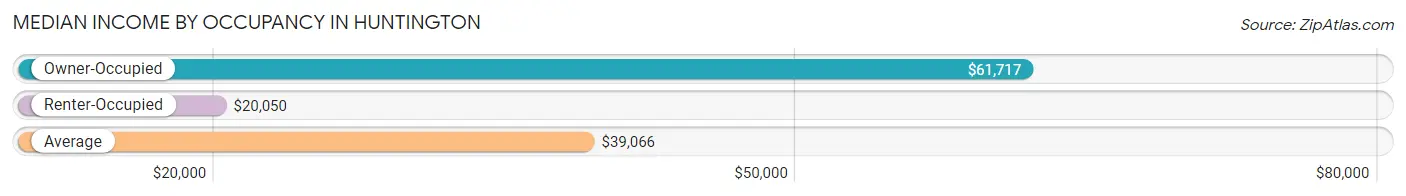
| Occupancy Type | # Households | Median Income |
| Owner-Occupied | 10,557 (54.4%) | $61,717 |
| Renter-Occupied | 8,854 (45.6%) | $20,050 |
| Average | 19,411 (100.0%) | $39,066 |
Occupancy by Householder Income Bracket in Huntington
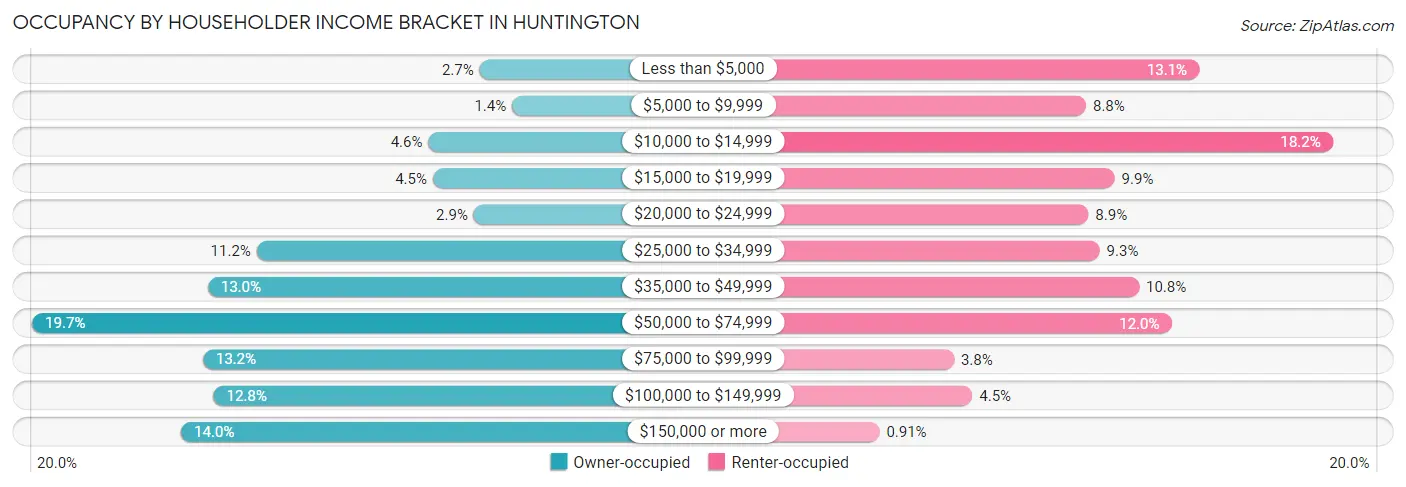
| Income Bracket | Owner-occupied | Renter-occupied |
| Less than $5,000 | 282 (2.7%) | 1,158 (13.1%) |
| $5,000 to $9,999 | 151 (1.4%) | 777 (8.8%) |
| $10,000 to $14,999 | 488 (4.6%) | 1,609 (18.2%) |
| $15,000 to $19,999 | 470 (4.4%) | 874 (9.9%) |
| $20,000 to $24,999 | 305 (2.9%) | 785 (8.9%) |
| $25,000 to $34,999 | 1,178 (11.2%) | 823 (9.3%) |
| $35,000 to $49,999 | 1,374 (13.0%) | 956 (10.8%) |
| $50,000 to $74,999 | 2,081 (19.7%) | 1,065 (12.0%) |
| $75,000 to $99,999 | 1,395 (13.2%) | 332 (3.7%) |
| $100,000 to $149,999 | 1,351 (12.8%) | 394 (4.4%) |
| $150,000 or more | 1,482 (14.0%) | 81 (0.9%) |
| Total | 10,557 (100.0%) | 8,854 (100.0%) |
Monthly Housing Cost Tiers in Huntington
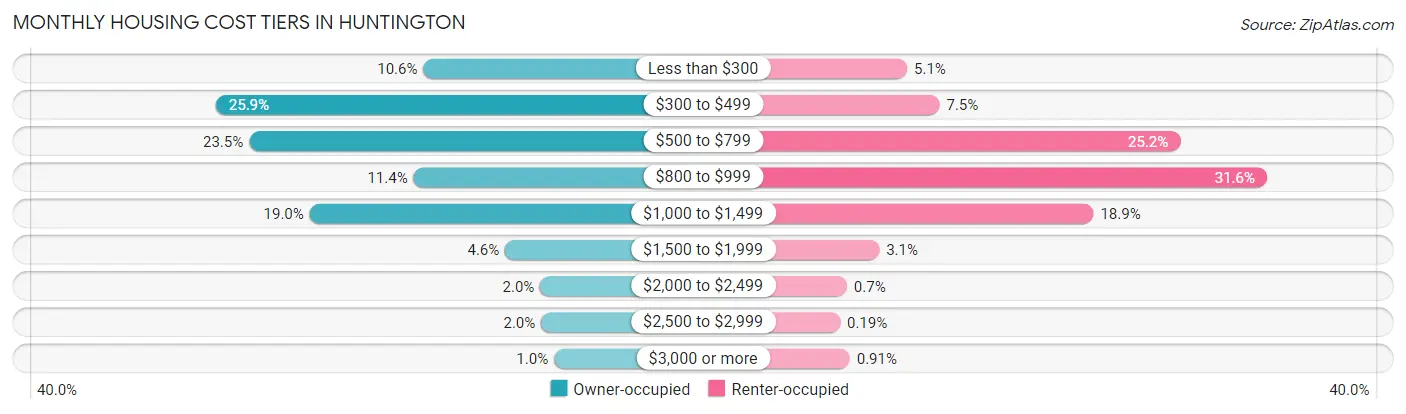
| Monthly Cost | Owner-occupied | Renter-occupied |
| Less than $300 | 1,123 (10.6%) | 454 (5.1%) |
| $300 to $499 | 2,735 (25.9%) | 666 (7.5%) |
| $500 to $799 | 2,478 (23.5%) | 2,234 (25.2%) |
| $800 to $999 | 1,199 (11.4%) | 2,800 (31.6%) |
| $1,000 to $1,499 | 2,007 (19.0%) | 1,670 (18.9%) |
| $1,500 to $1,999 | 487 (4.6%) | 273 (3.1%) |
| $2,000 to $2,499 | 214 (2.0%) | 62 (0.7%) |
| $2,500 to $2,999 | 207 (2.0%) | 17 (0.2%) |
| $3,000 or more | 107 (1.0%) | 81 (0.9%) |
| Total | 10,557 (100.0%) | 8,854 (100.0%) |
Physical Housing Characteristics in Huntington
Housing Structures in Huntington
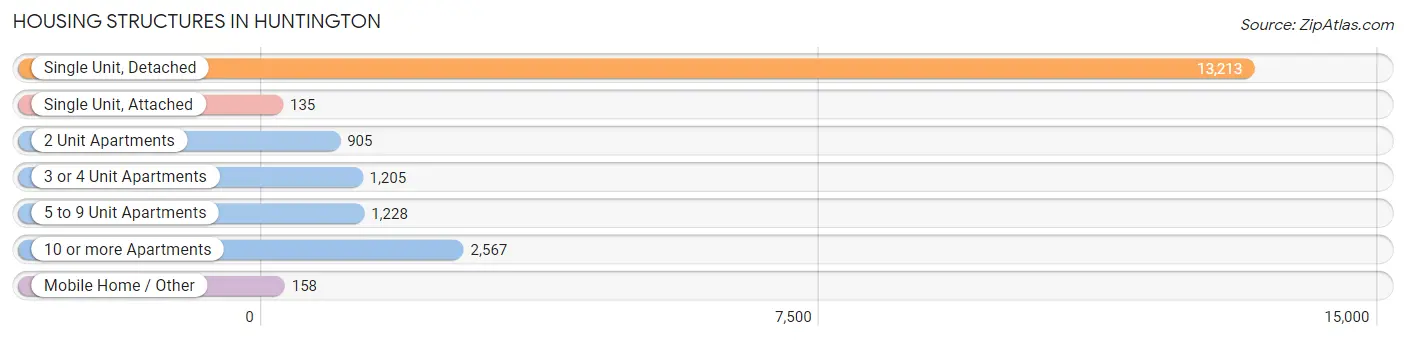
| Structure Type | # Housing Units | % Housing Units |
| Single Unit, Detached | 13,213 | 68.1% |
| Single Unit, Attached | 135 | 0.7% |
| 2 Unit Apartments | 905 | 4.7% |
| 3 or 4 Unit Apartments | 1,205 | 6.2% |
| 5 to 9 Unit Apartments | 1,228 | 6.3% |
| 10 or more Apartments | 2,567 | 13.2% |
| Mobile Home / Other | 158 | 0.8% |
| Total | 19,411 | 100.0% |
Housing Structures by Occupancy in Huntington
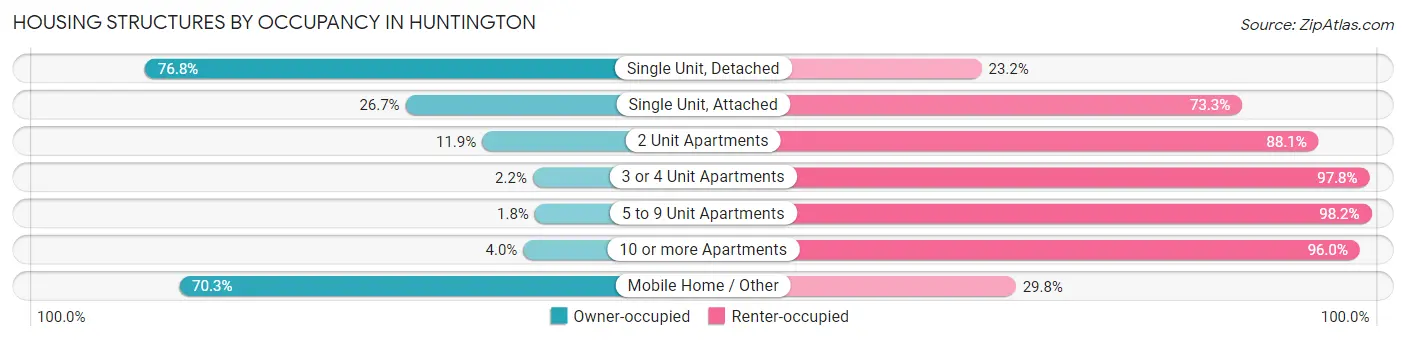
| Structure Type | Owner-occupied | Renter-occupied |
| Single Unit, Detached | 10,151 (76.8%) | 3,062 (23.2%) |
| Single Unit, Attached | 36 (26.7%) | 99 (73.3%) |
| 2 Unit Apartments | 108 (11.9%) | 797 (88.1%) |
| 3 or 4 Unit Apartments | 26 (2.2%) | 1,179 (97.8%) |
| 5 to 9 Unit Apartments | 22 (1.8%) | 1,206 (98.2%) |
| 10 or more Apartments | 103 (4.0%) | 2,464 (96.0%) |
| Mobile Home / Other | 111 (70.3%) | 47 (29.7%) |
| Total | 10,557 (54.4%) | 8,854 (45.6%) |
Housing Structures by Number of Rooms in Huntington
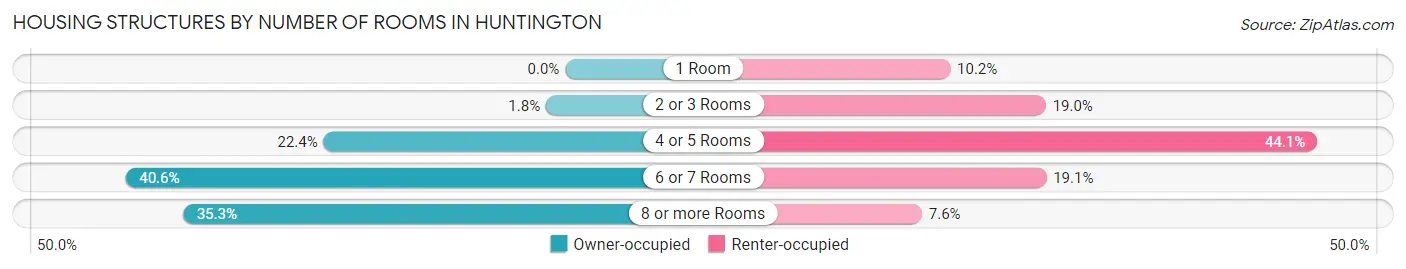
| Number of Rooms | Owner-occupied | Renter-occupied |
| 1 Room | 0 (0.0%) | 902 (10.2%) |
| 2 or 3 Rooms | 188 (1.8%) | 1,685 (19.0%) |
| 4 or 5 Rooms | 2,360 (22.4%) | 3,907 (44.1%) |
| 6 or 7 Rooms | 4,285 (40.6%) | 1,689 (19.1%) |
| 8 or more Rooms | 3,724 (35.3%) | 671 (7.6%) |
| Total | 10,557 (100.0%) | 8,854 (100.0%) |
Housing Structure by Heating Type in Huntington
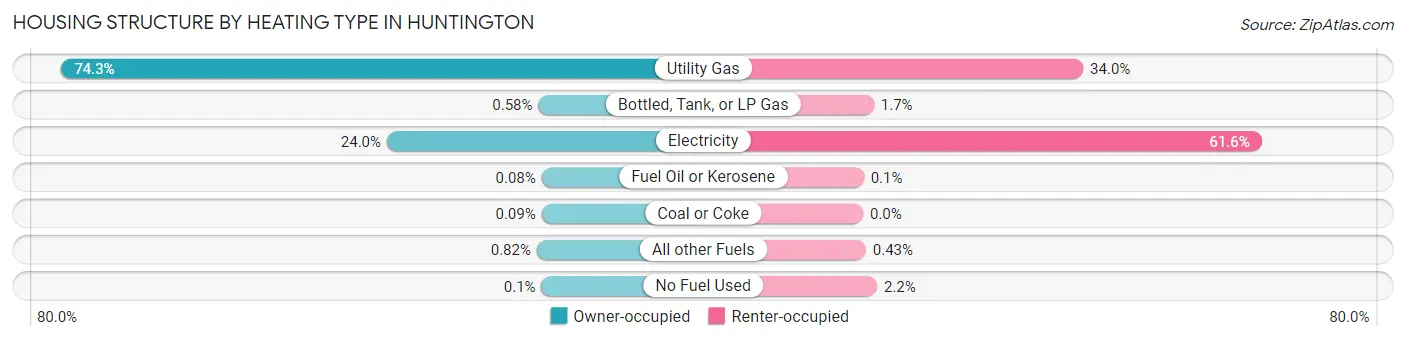
| Heating Type | Owner-occupied | Renter-occupied |
| Utility Gas | 7,847 (74.3%) | 3,013 (34.0%) |
| Bottled, Tank, or LP Gas | 61 (0.6%) | 148 (1.7%) |
| Electricity | 2,534 (24.0%) | 5,455 (61.6%) |
| Fuel Oil or Kerosene | 8 (0.1%) | 9 (0.1%) |
| Coal or Coke | 9 (0.1%) | 0 (0.0%) |
| All other Fuels | 87 (0.8%) | 38 (0.4%) |
| No Fuel Used | 11 (0.1%) | 191 (2.2%) |
| Total | 10,557 (100.0%) | 8,854 (100.0%) |
Household Vehicle Usage in Huntington
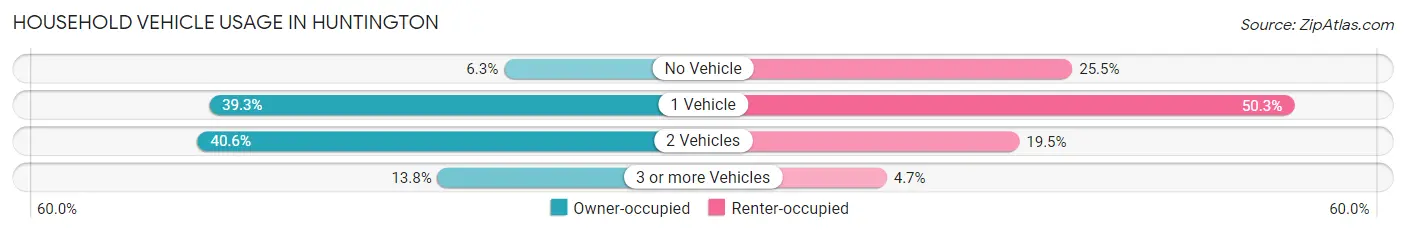
| Vehicles per Household | Owner-occupied | Renter-occupied |
| No Vehicle | 665 (6.3%) | 2,255 (25.5%) |
| 1 Vehicle | 4,152 (39.3%) | 4,454 (50.3%) |
| 2 Vehicles | 4,288 (40.6%) | 1,730 (19.5%) |
| 3 or more Vehicles | 1,452 (13.8%) | 415 (4.7%) |
| Total | 10,557 (100.0%) | 8,854 (100.0%) |
Real Estate & Mortgages in Huntington
Real Estate and Mortgage Overview in Huntington
| Characteristic | Without Mortgage | With Mortgage |
| Housing Units | 5,636 | 4,921 |
| Median Property Value | $99,000 | $129,600 |
| Median Household Income | $46,793 | $938 |
| Monthly Housing Costs | $429 | $107 |
| Real Estate Taxes | $724 | $206 |
Property Value by Mortgage Status in Huntington
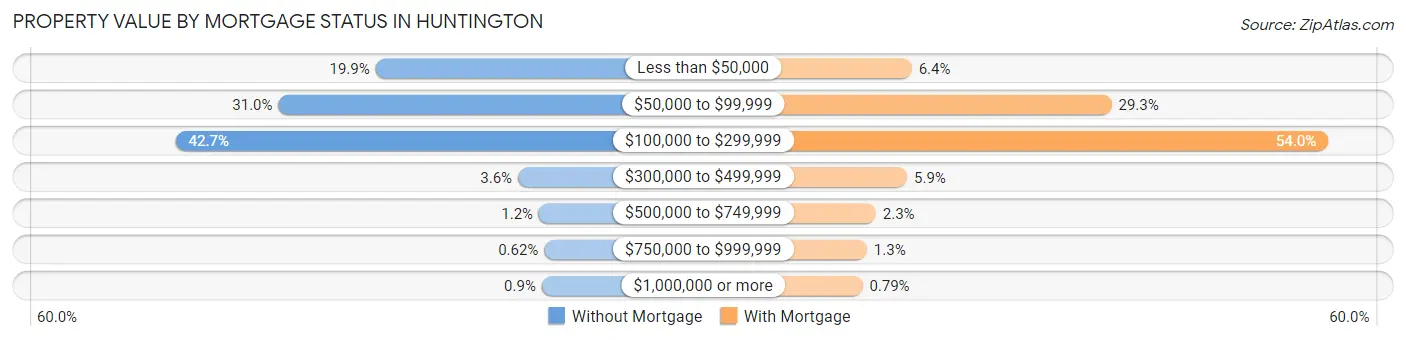
| Property Value | Without Mortgage | With Mortgage |
| Less than $50,000 | 1,121 (19.9%) | 316 (6.4%) |
| $50,000 to $99,999 | 1,747 (31.0%) | 1,440 (29.3%) |
| $100,000 to $299,999 | 2,409 (42.7%) | 2,658 (54.0%) |
| $300,000 to $499,999 | 204 (3.6%) | 290 (5.9%) |
| $500,000 to $749,999 | 69 (1.2%) | 114 (2.3%) |
| $750,000 to $999,999 | 35 (0.6%) | 64 (1.3%) |
| $1,000,000 or more | 51 (0.9%) | 39 (0.8%) |
| Total | 5,636 (100.0%) | 4,921 (100.0%) |
Household Income by Mortgage Status in Huntington
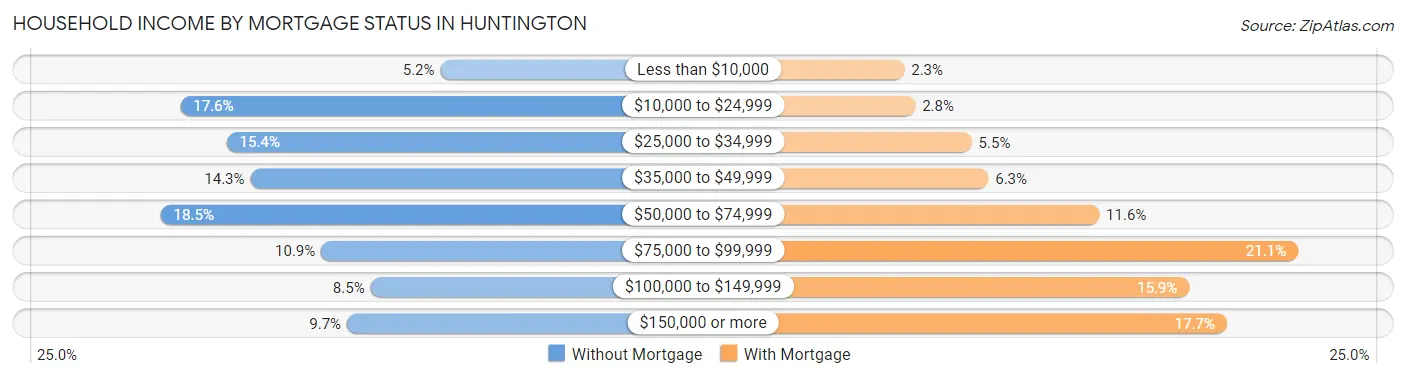
| Household Income | Without Mortgage | With Mortgage |
| Less than $10,000 | 293 (5.2%) | 114 (2.3%) |
| $10,000 to $24,999 | 991 (17.6%) | 140 (2.8%) |
| $25,000 to $34,999 | 867 (15.4%) | 272 (5.5%) |
| $35,000 to $49,999 | 803 (14.2%) | 311 (6.3%) |
| $50,000 to $74,999 | 1,044 (18.5%) | 571 (11.6%) |
| $75,000 to $99,999 | 613 (10.9%) | 1,037 (21.1%) |
| $100,000 to $149,999 | 481 (8.5%) | 782 (15.9%) |
| $150,000 or more | 544 (9.7%) | 870 (17.7%) |
| Total | 5,636 (100.0%) | 4,921 (100.0%) |
Property Value to Household Income Ratio in Huntington
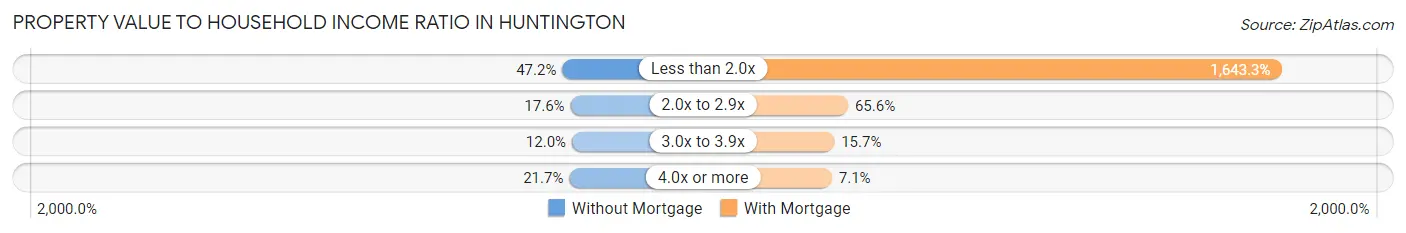
| Value-to-Income Ratio | Without Mortgage | With Mortgage |
| Less than 2.0x | 2,662 (47.2%) | 80,867 (1,643.3%) |
| 2.0x to 2.9x | 989 (17.5%) | 3,228 (65.6%) |
| 3.0x to 3.9x | 677 (12.0%) | 771 (15.7%) |
| 4.0x or more | 1,225 (21.7%) | 348 (7.1%) |
| Total | 5,636 (100.0%) | 4,921 (100.0%) |
Real Estate Taxes by Mortgage Status in Huntington
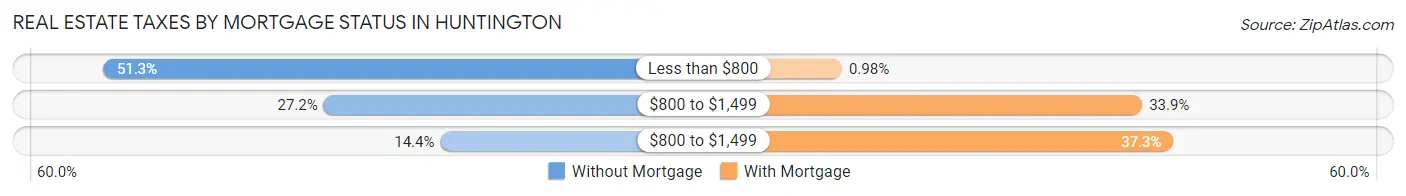
| Property Taxes | Without Mortgage | With Mortgage |
| Less than $800 | 2,892 (51.3%) | 48 (1.0%) |
| $800 to $1,499 | 1,535 (27.2%) | 1,667 (33.9%) |
| $800 to $1,499 | 814 (14.4%) | 1,835 (37.3%) |
| Total | 5,636 (100.0%) | 4,921 (100.0%) |
Health & Disability in Huntington
Health Insurance Coverage by Age in Huntington
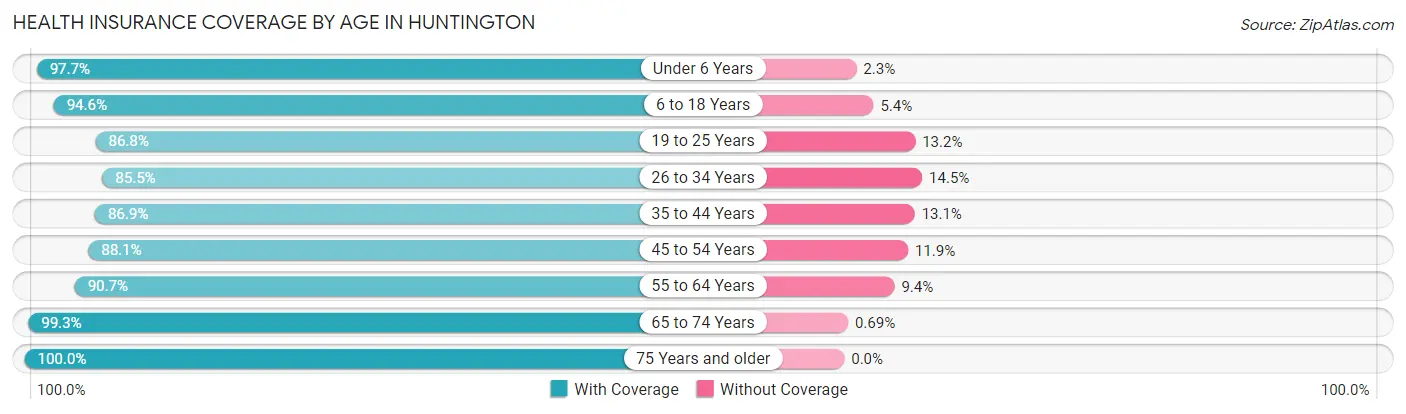
| Age Bracket | With Coverage | Without Coverage |
| Under 6 Years | 2,808 (97.7%) | 65 (2.3%) |
| 6 to 18 Years | 5,924 (94.6%) | 341 (5.4%) |
| 19 to 25 Years | 7,445 (86.8%) | 1,135 (13.2%) |
| 26 to 34 Years | 4,573 (85.5%) | 777 (14.5%) |
| 35 to 44 Years | 4,227 (86.9%) | 639 (13.1%) |
| 45 to 54 Years | 4,682 (88.1%) | 631 (11.9%) |
| 55 to 64 Years | 4,293 (90.6%) | 443 (9.3%) |
| 65 to 74 Years | 4,615 (99.3%) | 32 (0.7%) |
| 75 Years and older | 3,224 (100.0%) | 0 (0.0%) |
| Total | 41,791 (91.1%) | 4,063 (8.9%) |
Health Insurance Coverage by Citizenship Status in Huntington
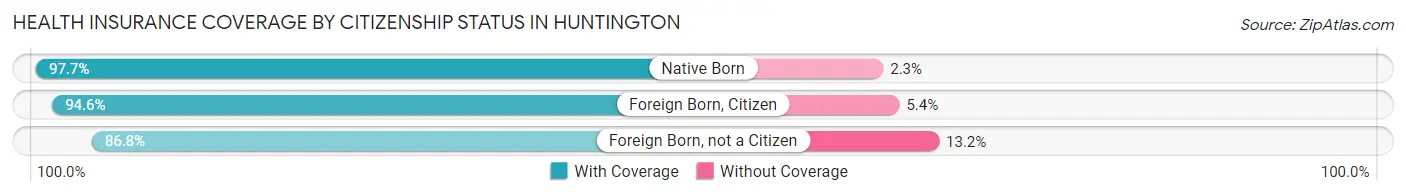
| Citizenship Status | With Coverage | Without Coverage |
| Native Born | 2,808 (97.7%) | 65 (2.3%) |
| Foreign Born, Citizen | 5,924 (94.6%) | 341 (5.4%) |
| Foreign Born, not a Citizen | 7,445 (86.8%) | 1,135 (13.2%) |
Health Insurance Coverage by Household Income in Huntington
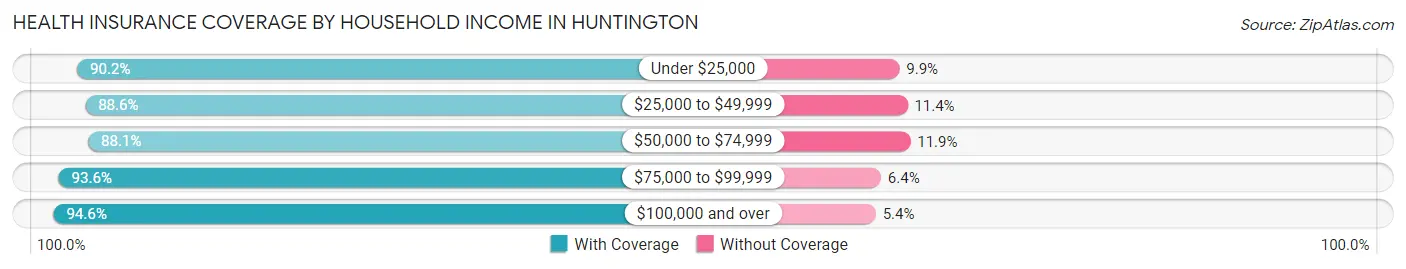
| Household Income | With Coverage | Without Coverage |
| Under $25,000 | 10,952 (90.1%) | 1,197 (9.9%) |
| $25,000 to $49,999 | 7,817 (88.6%) | 1,002 (11.4%) |
| $50,000 to $74,999 | 6,479 (88.1%) | 875 (11.9%) |
| $75,000 to $99,999 | 4,677 (93.6%) | 319 (6.4%) |
| $100,000 and over | 9,467 (94.6%) | 542 (5.4%) |
Public vs Private Health Insurance Coverage by Age in Huntington
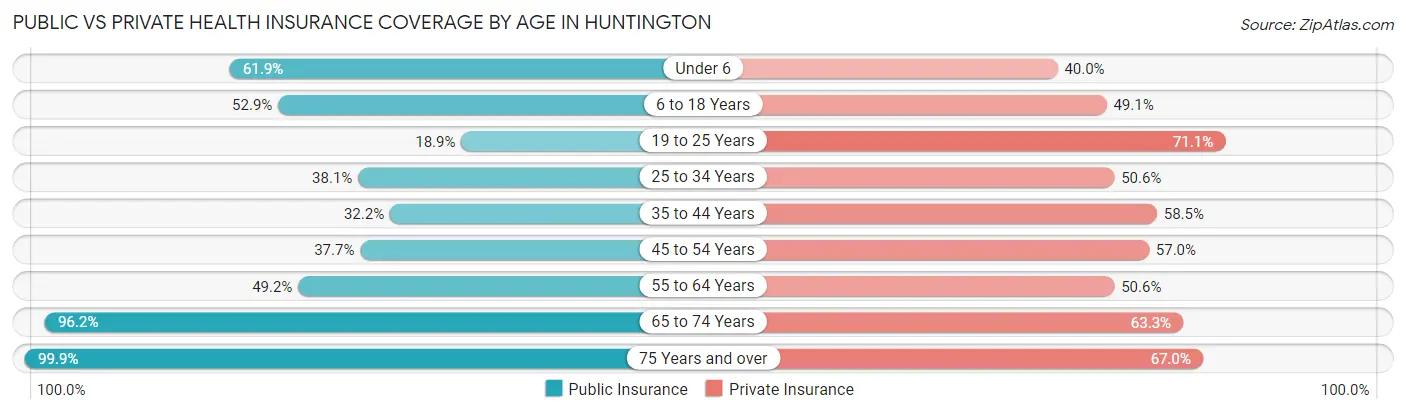
| Age Bracket | Public Insurance | Private Insurance |
| Under 6 | 1,778 (61.9%) | 1,150 (40.0%) |
| 6 to 18 Years | 3,317 (52.9%) | 3,078 (49.1%) |
| 19 to 25 Years | 1,625 (18.9%) | 6,103 (71.1%) |
| 25 to 34 Years | 2,038 (38.1%) | 2,705 (50.6%) |
| 35 to 44 Years | 1,566 (32.2%) | 2,845 (58.5%) |
| 45 to 54 Years | 2,003 (37.7%) | 3,028 (57.0%) |
| 55 to 64 Years | 2,331 (49.2%) | 2,395 (50.6%) |
| 65 to 74 Years | 4,471 (96.2%) | 2,942 (63.3%) |
| 75 Years and over | 3,221 (99.9%) | 2,160 (67.0%) |
| Total | 22,350 (48.7%) | 26,406 (57.6%) |
Disability Status by Sex by Age in Huntington
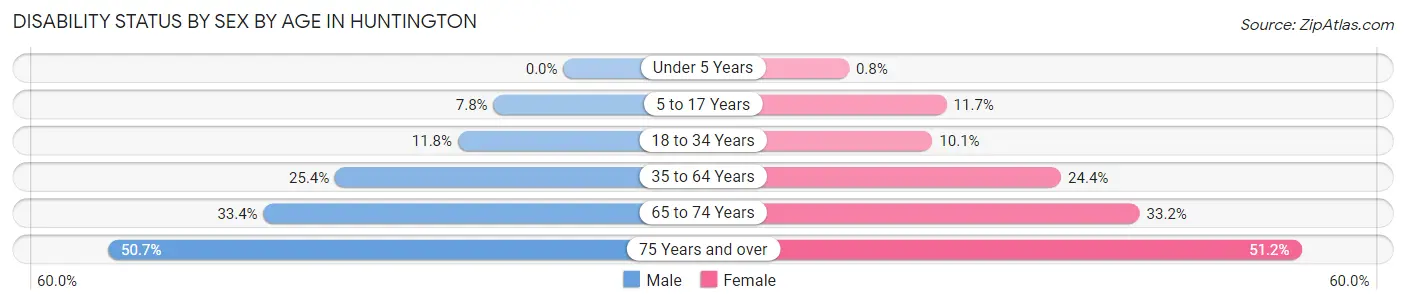
| Age Bracket | Male | Female |
| Under 5 Years | 0 (0.0%) | 10 (0.8%) |
| 5 to 17 Years | 217 (7.8%) | 358 (11.7%) |
| 18 to 34 Years | 839 (11.7%) | 784 (10.1%) |
| 35 to 64 Years | 1,899 (25.4%) | 1,819 (24.4%) |
| 65 to 74 Years | 673 (33.4%) | 873 (33.2%) |
| 75 Years and over | 619 (50.7%) | 1,025 (51.2%) |
Disability Class by Sex by Age in Huntington
Disability Class: Hearing Difficulty
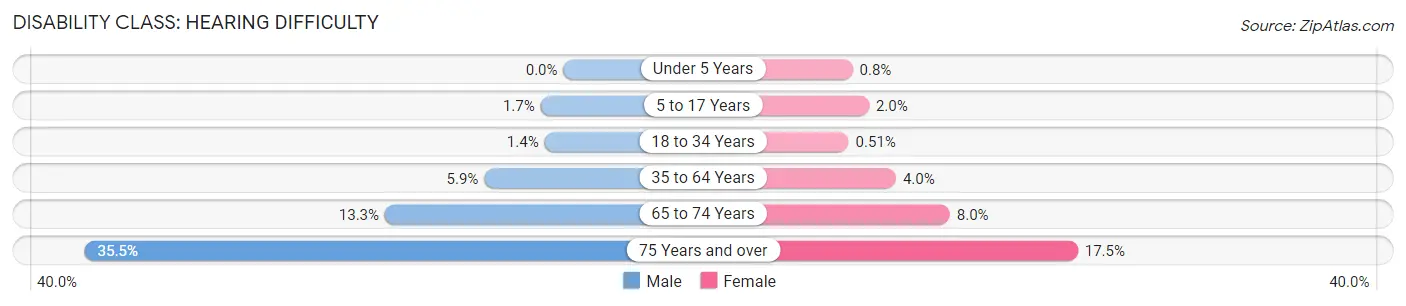
| Age Bracket | Male | Female |
| Under 5 Years | 0 (0.0%) | 10 (0.8%) |
| 5 to 17 Years | 47 (1.7%) | 62 (2.0%) |
| 18 to 34 Years | 100 (1.4%) | 40 (0.5%) |
| 35 to 64 Years | 439 (5.9%) | 299 (4.0%) |
| 65 to 74 Years | 267 (13.3%) | 211 (8.0%) |
| 75 Years and over | 434 (35.5%) | 351 (17.5%) |
Disability Class: Vision Difficulty
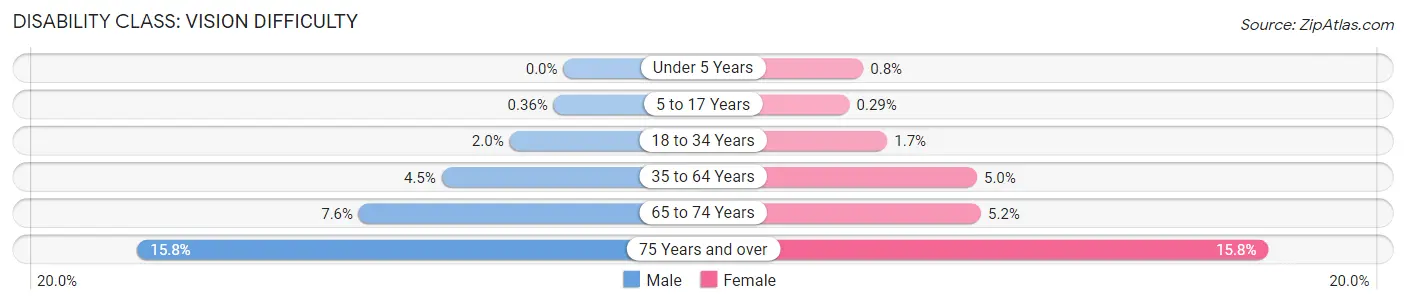
| Age Bracket | Male | Female |
| Under 5 Years | 0 (0.0%) | 10 (0.8%) |
| 5 to 17 Years | 10 (0.4%) | 9 (0.3%) |
| 18 to 34 Years | 143 (2.0%) | 131 (1.7%) |
| 35 to 64 Years | 338 (4.5%) | 374 (5.0%) |
| 65 to 74 Years | 153 (7.6%) | 136 (5.2%) |
| 75 Years and over | 193 (15.8%) | 317 (15.8%) |
Disability Class: Cognitive Difficulty
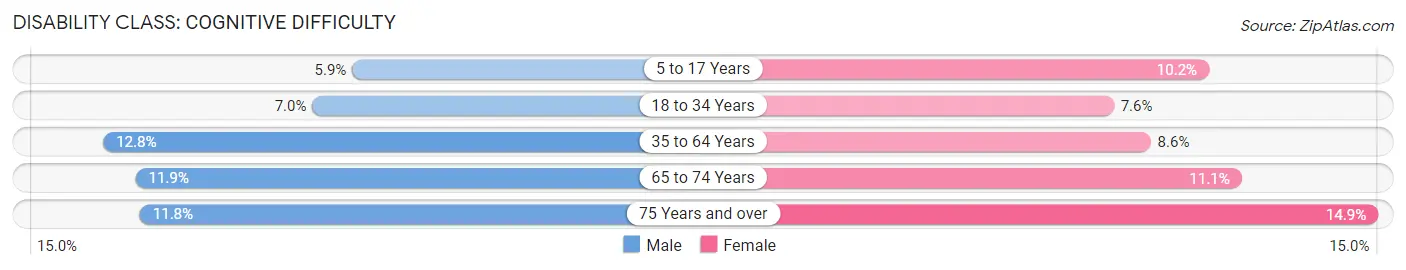
| Age Bracket | Male | Female |
| 5 to 17 Years | 164 (5.9%) | 313 (10.2%) |
| 18 to 34 Years | 499 (7.0%) | 588 (7.6%) |
| 35 to 64 Years | 957 (12.8%) | 640 (8.6%) |
| 65 to 74 Years | 240 (11.9%) | 293 (11.1%) |
| 75 Years and over | 144 (11.8%) | 299 (14.9%) |
Disability Class: Ambulatory Difficulty
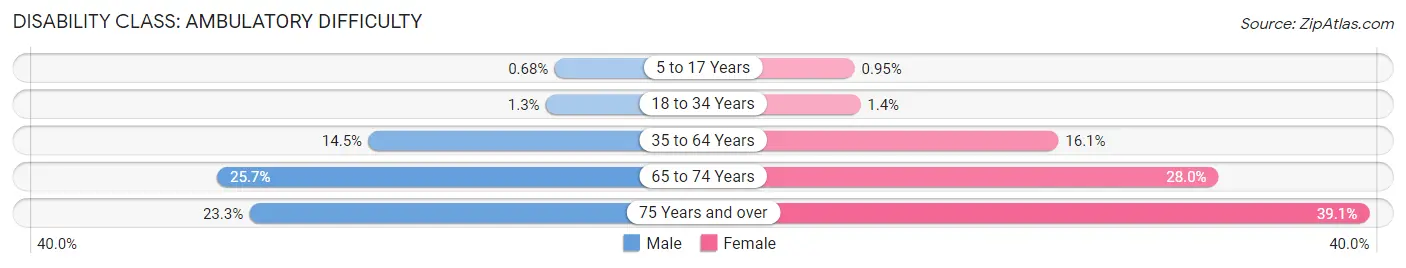
| Age Bracket | Male | Female |
| 5 to 17 Years | 19 (0.7%) | 29 (0.9%) |
| 18 to 34 Years | 95 (1.3%) | 107 (1.4%) |
| 35 to 64 Years | 1,084 (14.5%) | 1,197 (16.1%) |
| 65 to 74 Years | 518 (25.7%) | 736 (28.0%) |
| 75 Years and over | 285 (23.3%) | 784 (39.1%) |
Disability Class: Self-Care Difficulty
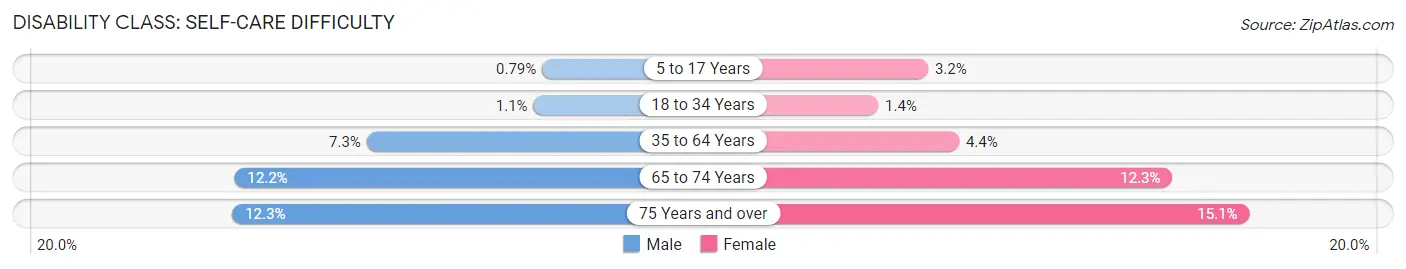
| Age Bracket | Male | Female |
| 5 to 17 Years | 22 (0.8%) | 98 (3.2%) |
| 18 to 34 Years | 79 (1.1%) | 105 (1.3%) |
| 35 to 64 Years | 545 (7.3%) | 324 (4.3%) |
| 65 to 74 Years | 246 (12.2%) | 323 (12.3%) |
| 75 Years and over | 150 (12.3%) | 303 (15.1%) |
Technology Access in Huntington
Computing Device Access in Huntington
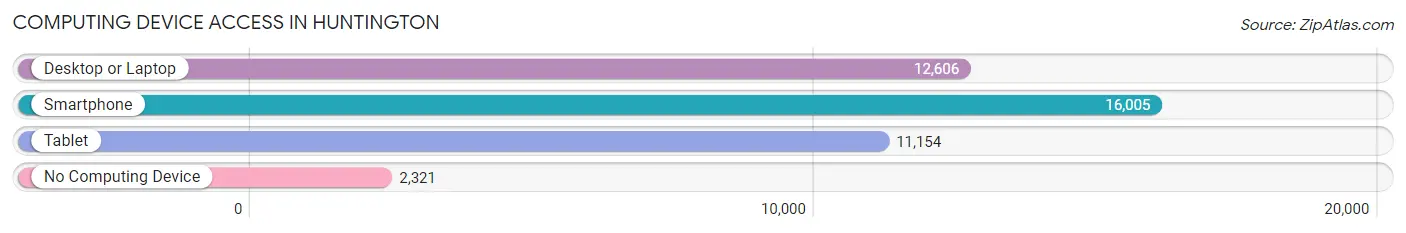
| Device Type | # Households | % Households |
| Desktop or Laptop | 12,606 | 64.9% |
| Smartphone | 16,005 | 82.5% |
| Tablet | 11,154 | 57.5% |
| No Computing Device | 2,321 | 12.0% |
| Total | 19,411 | 100.0% |
Internet Access in Huntington
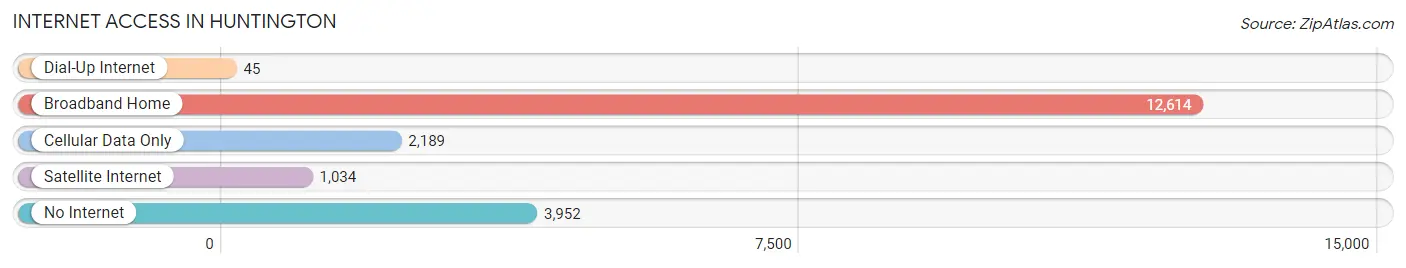
| Internet Type | # Households | % Households |
| Dial-Up Internet | 45 | 0.2% |
| Broadband Home | 12,614 | 65.0% |
| Cellular Data Only | 2,189 | 11.3% |
| Satellite Internet | 1,034 | 5.3% |
| No Internet | 3,952 | 20.4% |
| Total | 19,411 | 100.0% |
Huntington Summary
Huntington, West Virginia is a city located in the western part of the state, along the Ohio River. It is the county seat of Cabell County and the largest city in the state. The city has a population of 48,638, according to the 2010 census.
Huntington was founded in 1871 by Collis P. Huntington, a railroad magnate. The city was named after him and was originally a railroad town. The city was incorporated in 1871 and has since grown to become the largest city in West Virginia.
Geographically, Huntington is located in the western part of the state, along the Ohio River. It is situated in the Appalachian Mountains and is surrounded by hills and valleys. The city is located in the Appalachian Plateau, which is characterized by rolling hills and valleys. The city is also located in the Eastern Panhandle, which is a region of West Virginia that is bordered by Maryland and Pennsylvania.
The economy of Huntington is largely based on the service industry. The city is home to several large employers, including Marshall University, Cabell Huntington Hospital, St. Mary's Medical Center, and the Huntington Mall. The city also has a large manufacturing sector, with companies such as AK Steel, Frito-Lay, and PepsiCo having major operations in the city.
The demographics of Huntington are diverse. The city has a population that is predominantly white, with African Americans making up the second largest racial group. The city also has a large Hispanic population, with Hispanics making up nearly 10% of the population. The city also has a large Asian population, with Asians making up nearly 5% of the population.
Huntington is a city with a rich history and culture. The city is home to several museums, including the Huntington Museum of Art, the Huntington Railroad Museum, and the Huntington Museum of Natural History. The city also has a vibrant music scene, with several venues hosting live music events. The city is also home to several festivals, including the Huntington Music and Arts Festival and the Huntington Heritage Festival.
Huntington is a city with a bright future. The city is home to several major employers and has a diverse population. The city is also home to several cultural attractions and is a great place to live and work.
Common Questions
What is Per Capita Income in Huntington?
Per Capita income in Huntington is $27,632.
What is the Median Family Income in Huntington?
Median Family Income in Huntington is $58,757.
What is the Median Household income in Huntington?
Median Household Income in Huntington is $39,066.
What is Income or Wage Gap in Huntington?
Income or Wage Gap in Huntington is 21.3%.
Women in Huntington earn 78.7 cents for every dollar earned by a man.
What is Family Income Deficit in Huntington?
Family Income Deficit in Huntington is $11,759.
Families that are below poverty line in Huntington earn $11,759 less on average than the poverty threshold level.
What is Inequality or Gini Index in Huntington?
Inequality or Gini Index in Huntington is 0.55.
What is the Total Population of Huntington?
Total Population of Huntington is 46,637.
What is the Total Male Population of Huntington?
Total Male Population of Huntington is 22,063.
What is the Total Female Population of Huntington?
Total Female Population of Huntington is 24,574.
What is the Ratio of Males per 100 Females in Huntington?
There are 89.78 Males per 100 Females in Huntington.
What is the Ratio of Females per 100 Males in Huntington?
There are 111.38 Females per 100 Males in Huntington.
What is the Median Population Age in Huntington?
Median Population Age in Huntington is 35.4 Years.
What is the Average Family Size in Huntington
Average Family Size in Huntington is 3.1 People.
What is the Average Household Size in Huntington
Average Household Size in Huntington is 2.2 People.
How Large is the Labor Force in Huntington?
There are 21,513 People in the Labor Forcein in Huntington.
What is the Percentage of People in the Labor Force in Huntington?
54.7% of People are in the Labor Force in Huntington.
What is the Unemployment Rate in Huntington?
Unemployment Rate in Huntington is 7.8%.