Parkersburg, WV Map & Demographics
Parkersburg Map
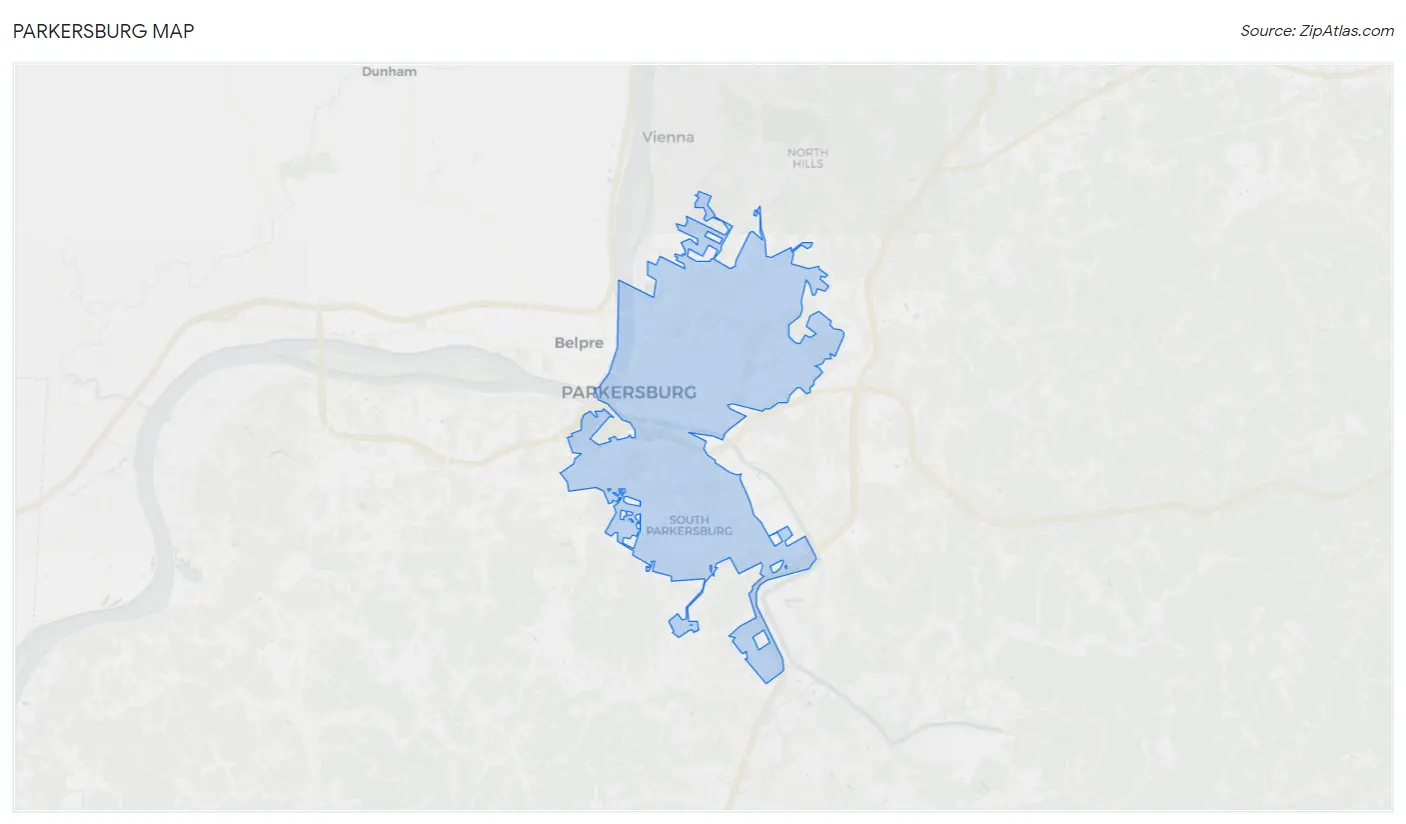
Parkersburg Overview
$27,017
PER CAPITA INCOME
$56,196
AVG FAMILY INCOME
$41,921
AVG HOUSEHOLD INCOME
18.8%
WAGE / INCOME GAP [ % ]
81.2¢/ $1
WAGE / INCOME GAP [ $ ]
$9,876
FAMILY INCOME DEFICIT
0.47
INEQUALITY / GINI INDEX
29,685
TOTAL POPULATION
14,801
MALE POPULATION
14,884
FEMALE POPULATION
99.44
MALES / 100 FEMALES
100.56
FEMALES / 100 MALES
42.0
MEDIAN AGE
3.0
AVG FAMILY SIZE
2.2
AVG HOUSEHOLD SIZE
12,879
LABOR FORCE [ PEOPLE ]
52.6%
PERCENT IN LABOR FORCE
6.9%
UNEMPLOYMENT RATE
Income in Parkersburg
Income Overview in Parkersburg
Per Capita Income in Parkersburg is $27,017, while median incomes of families and households are $56,196 and $41,921 respectively.
| Characteristic | Number | Measure |
| Per Capita Income | 29,685 | $27,017 |
| Median Family Income | 7,232 | $56,196 |
| Mean Family Income | 7,232 | $74,378 |
| Median Household Income | 13,302 | $41,921 |
| Mean Household Income | 13,302 | $59,172 |
| Income Deficit | 7,232 | $9,876 |
| Wage / Income Gap (%) | 29,685 | 18.79% |
| Wage / Income Gap ($) | 29,685 | 81.21¢ per $1 |
| Gini / Inequality Index | 29,685 | 0.47 |
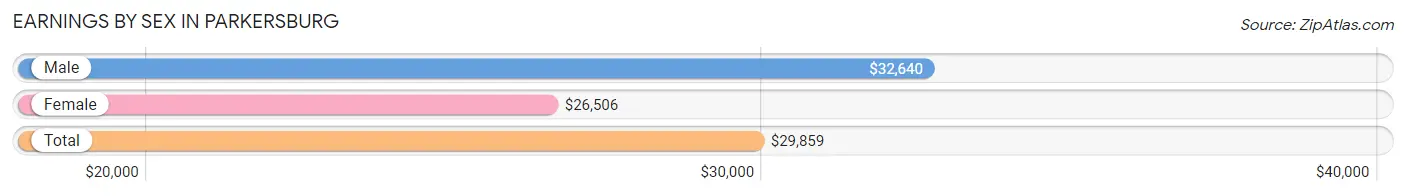
Earnings by Sex in Parkersburg
Average Earnings in Parkersburg are $29,859, $32,640 for men and $26,506 for women, a difference of 18.8%.
| Sex | Number | Average Earnings |
| Male | 6,972 (52.5%) | $32,640 |
| Female | 6,306 (47.5%) | $26,506 |
| Total | 13,278 (100.0%) | $29,859 |
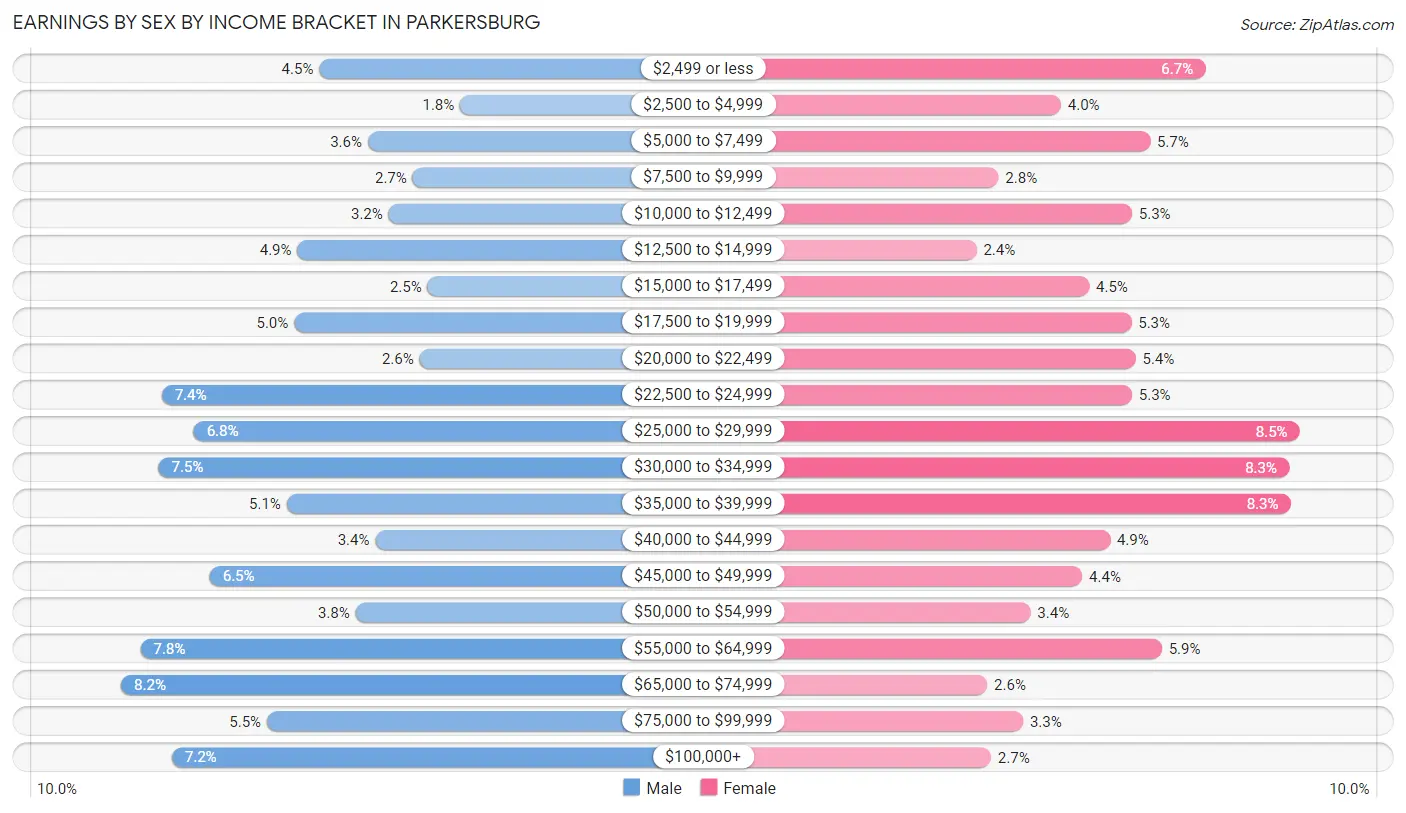
Earnings by Sex by Income Bracket in Parkersburg
The most common earnings brackets in Parkersburg are $65,000 to $74,999 for men (571 | 8.2%) and $25,000 to $29,999 for women (535 | 8.5%).
| Income | Male | Female |
| $2,499 or less | 312 (4.5%) | 423 (6.7%) |
| $2,500 to $4,999 | 128 (1.8%) | 253 (4.0%) |
| $5,000 to $7,499 | 249 (3.6%) | 358 (5.7%) |
| $7,500 to $9,999 | 190 (2.7%) | 179 (2.8%) |
| $10,000 to $12,499 | 222 (3.2%) | 337 (5.3%) |
| $12,500 to $14,999 | 341 (4.9%) | 153 (2.4%) |
| $15,000 to $17,499 | 171 (2.5%) | 286 (4.5%) |
| $17,500 to $19,999 | 345 (5.0%) | 336 (5.3%) |
| $20,000 to $22,499 | 181 (2.6%) | 341 (5.4%) |
| $22,500 to $24,999 | 518 (7.4%) | 337 (5.3%) |
| $25,000 to $29,999 | 476 (6.8%) | 535 (8.5%) |
| $30,000 to $34,999 | 522 (7.5%) | 522 (8.3%) |
| $35,000 to $39,999 | 355 (5.1%) | 524 (8.3%) |
| $40,000 to $44,999 | 239 (3.4%) | 311 (4.9%) |
| $45,000 to $49,999 | 455 (6.5%) | 278 (4.4%) |
| $50,000 to $54,999 | 265 (3.8%) | 217 (3.4%) |
| $55,000 to $64,999 | 546 (7.8%) | 372 (5.9%) |
| $65,000 to $74,999 | 571 (8.2%) | 166 (2.6%) |
| $75,000 to $99,999 | 381 (5.5%) | 208 (3.3%) |
| $100,000+ | 505 (7.2%) | 170 (2.7%) |
| Total | 6,972 (100.0%) | 6,306 (100.0%) |
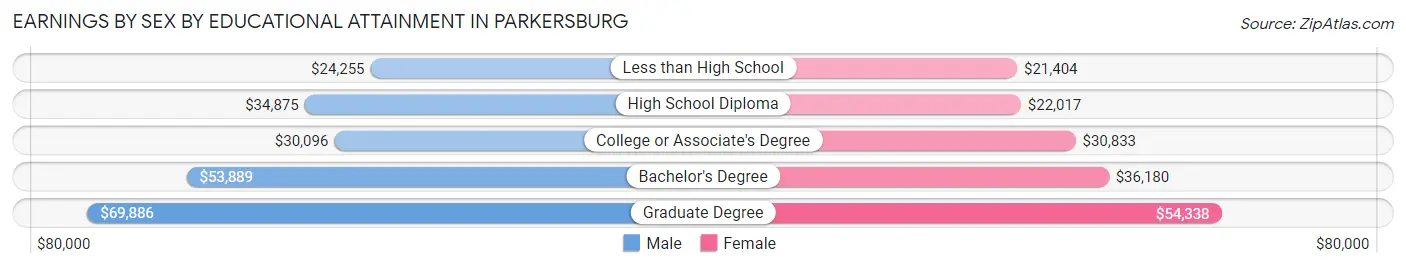
Earnings by Sex by Educational Attainment in Parkersburg
Average earnings in Parkersburg are $37,635 for men and $28,731 for women, a difference of 23.7%. Men with an educational attainment of graduate degree enjoy the highest average annual earnings of $69,886, while those with less than high school education earn the least with $24,255. Women with an educational attainment of graduate degree earn the most with the average annual earnings of $54,338, while those with less than high school education have the smallest earnings of $21,404.
| Educational Attainment | Male Income | Female Income |
| Less than High School | $24,255 | $21,404 |
| High School Diploma | $34,875 | $22,017 |
| College or Associate's Degree | $30,096 | $30,833 |
| Bachelor's Degree | $53,889 | $36,180 |
| Graduate Degree | $69,886 | $54,338 |
| Total | $37,635 | $28,731 |
Family Income in Parkersburg
Family Income Brackets in Parkersburg
According to the Parkersburg family income data, there are 1,208 families falling into the $50,000 to $74,999 income range, which is the most common income bracket and makes up 16.7% of all families. Conversely, the $200,000+ income bracket is the least frequent group with only 246 families (3.4%) belonging to this category.
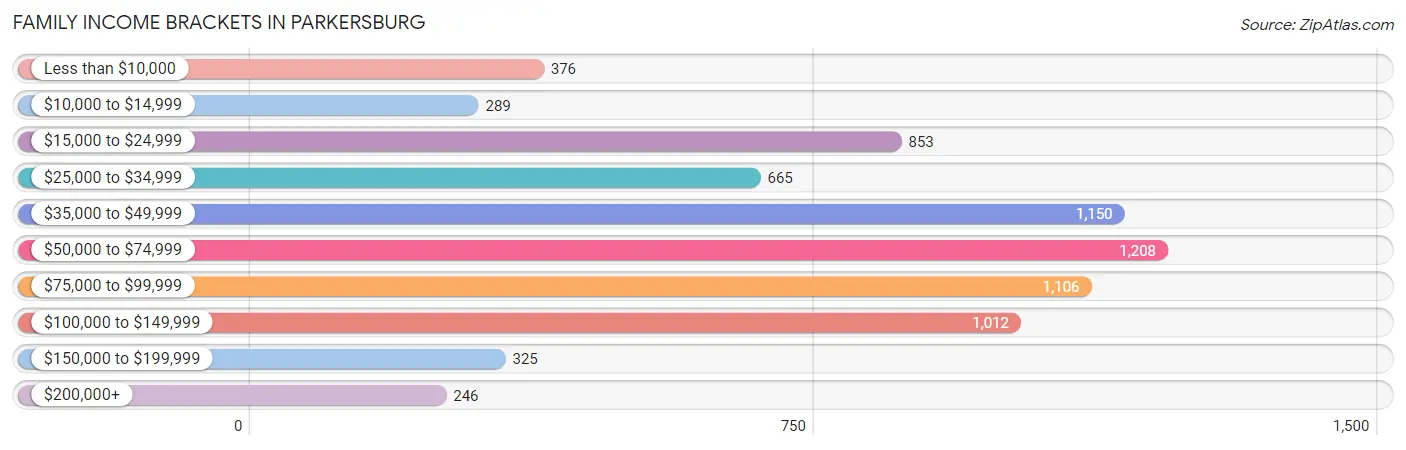
| Income Bracket | # Families | % Families |
| Less than $10,000 | 376 | 5.2% |
| $10,000 to $14,999 | 289 | 4.0% |
| $15,000 to $24,999 | 853 | 11.8% |
| $25,000 to $34,999 | 665 | 9.2% |
| $35,000 to $49,999 | 1,150 | 15.9% |
| $50,000 to $74,999 | 1,208 | 16.7% |
| $75,000 to $99,999 | 1,106 | 15.3% |
| $100,000 to $149,999 | 1,012 | 14.0% |
| $150,000 to $199,999 | 325 | 4.5% |
| $200,000+ | 246 | 3.4% |
Family Income by Famaliy Size in Parkersburg
2-person families (3,929 | 54.3%) account for the highest median family income in Parkersburg with $57,372 per family, while 2-person families (3,929 | 54.3%) have the highest median income of $28,686 per family member.
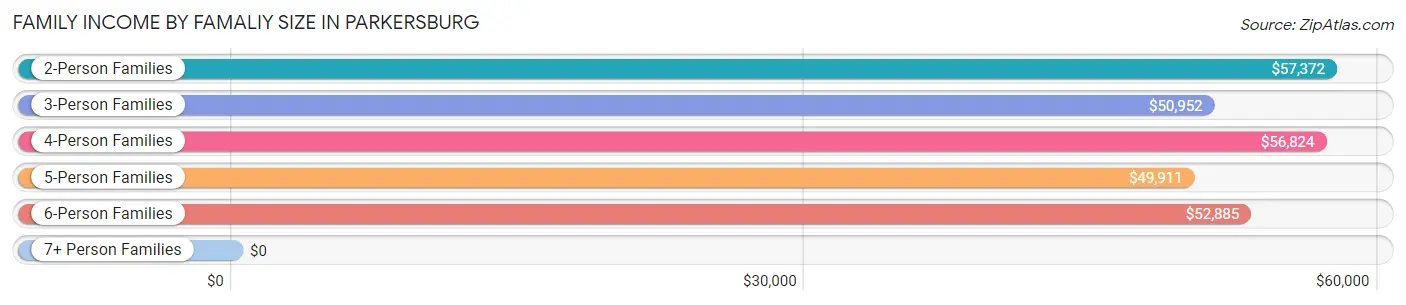
| Income Bracket | # Families | Median Income |
| 2-Person Families | 3,929 (54.3%) | $57,372 |
| 3-Person Families | 1,742 (24.1%) | $50,952 |
| 4-Person Families | 1,078 (14.9%) | $56,824 |
| 5-Person Families | 300 (4.2%) | $49,911 |
| 6-Person Families | 148 (2.1%) | $52,885 |
| 7+ Person Families | 35 (0.5%) | $0 |
| Total | 7,232 (100.0%) | $56,196 |
Family Income by Number of Earners in Parkersburg
The median family income in Parkersburg is $56,196, with families comprising 3+ earners (361) having the highest median family income of $134,076, while families with no earners (1,476) have the lowest median family income of $39,518, accounting for 5.0% and 20.4% of families, respectively.
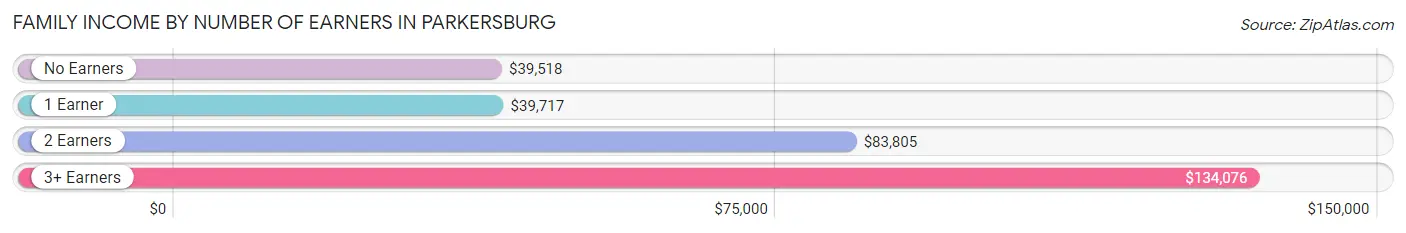
| Number of Earners | # Families | Median Income |
| No Earners | 1,476 (20.4%) | $39,518 |
| 1 Earner | 2,829 (39.1%) | $39,717 |
| 2 Earners | 2,566 (35.5%) | $83,805 |
| 3+ Earners | 361 (5.0%) | $134,076 |
| Total | 7,232 (100.0%) | $56,196 |
Household Income in Parkersburg
Household Income Brackets in Parkersburg
With 2,248 households falling in the category, the $15,000 to $24,999 income range is the most frequent in Parkersburg, accounting for 16.9% of all households. In contrast, only 293 households (2.2%) fall into the $200,000+ income bracket, making it the least populous group.
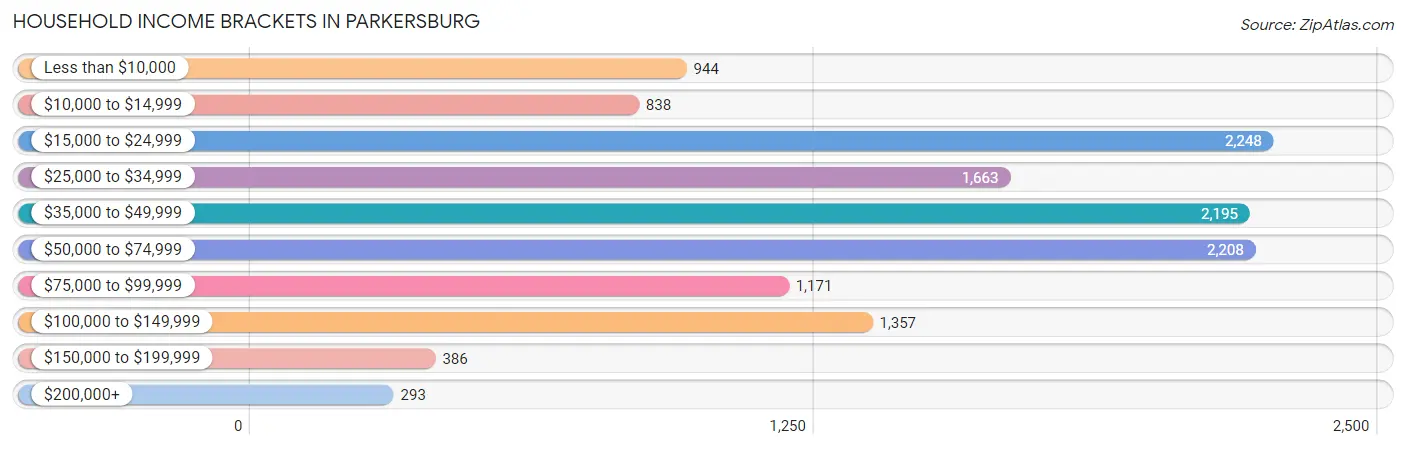
| Income Bracket | # Households | % Households |
| Less than $10,000 | 944 | 7.1% |
| $10,000 to $14,999 | 838 | 6.3% |
| $15,000 to $24,999 | 2,248 | 16.9% |
| $25,000 to $34,999 | 1,663 | 12.5% |
| $35,000 to $49,999 | 2,195 | 16.5% |
| $50,000 to $74,999 | 2,208 | 16.6% |
| $75,000 to $99,999 | 1,171 | 8.8% |
| $100,000 to $149,999 | 1,357 | 10.2% |
| $150,000 to $199,999 | 386 | 2.9% |
| $200,000+ | 293 | 2.2% |
Household Income by Householder Age in Parkersburg
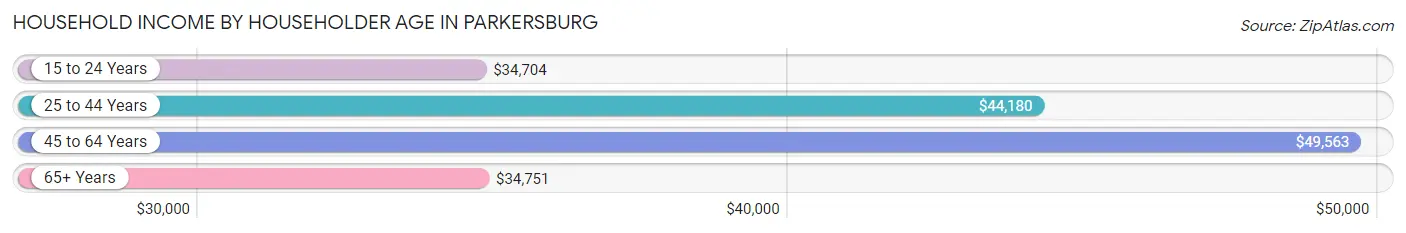
The median household income in Parkersburg is $41,921, with the highest median household income of $49,563 found in the 45 to 64 years age bracket for the primary householder. A total of 4,592 households (34.5%) fall into this category. Meanwhile, the 15 to 24 years age bracket for the primary householder has the lowest median household income of $34,704, with 593 households (4.5%) in this group.
| Income Bracket | # Households | Median Income |
| 15 to 24 Years | 593 (4.5%) | $34,704 |
| 25 to 44 Years | 3,528 (26.5%) | $44,180 |
| 45 to 64 Years | 4,592 (34.5%) | $49,563 |
| 65+ Years | 4,589 (34.5%) | $34,751 |
| Total | 13,302 (100.0%) | $41,921 |
Poverty in Parkersburg
Income Below Poverty by Sex and Age in Parkersburg
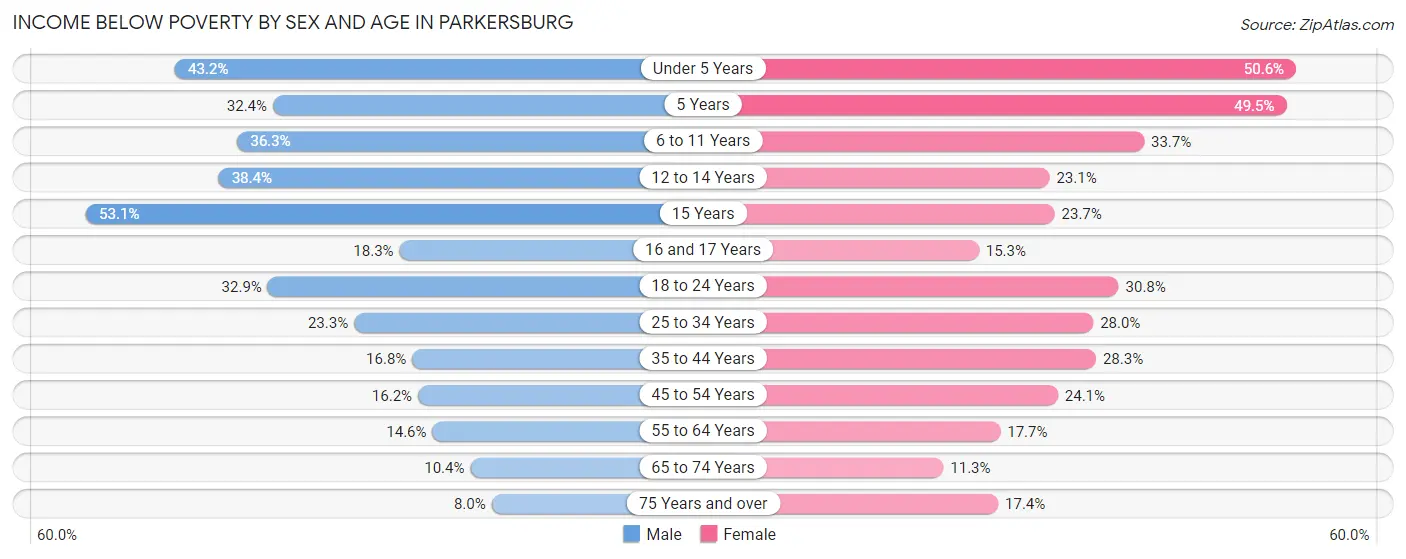
With 21.6% poverty level for males and 24.3% for females among the residents of Parkersburg, 15 year old males and under 5 year old females are the most vulnerable to poverty, with 110 males (53.1%) and 354 females (50.6%) in their respective age groups living below the poverty level.
| Age Bracket | Male | Female |
| Under 5 Years | 310 (43.2%) | 354 (50.6%) |
| 5 Years | 33 (32.4%) | 100 (49.5%) |
| 6 to 11 Years | 452 (36.3%) | 309 (33.7%) |
| 12 to 14 Years | 175 (38.4%) | 96 (23.1%) |
| 15 Years | 110 (53.1%) | 32 (23.7%) |
| 16 and 17 Years | 88 (18.3%) | 58 (15.3%) |
| 18 to 24 Years | 435 (32.9%) | 296 (30.8%) |
| 25 to 34 Years | 410 (23.3%) | 557 (28.0%) |
| 35 to 44 Years | 306 (16.8%) | 507 (28.3%) |
| 45 to 54 Years | 289 (16.2%) | 418 (24.1%) |
| 55 to 64 Years | 305 (14.6%) | 343 (17.6%) |
| 65 to 74 Years | 178 (10.4%) | 220 (11.3%) |
| 75 Years and over | 77 (8.0%) | 269 (17.4%) |
| Total | 3,168 (21.6%) | 3,559 (24.3%) |
Income Above Poverty by Sex and Age in Parkersburg
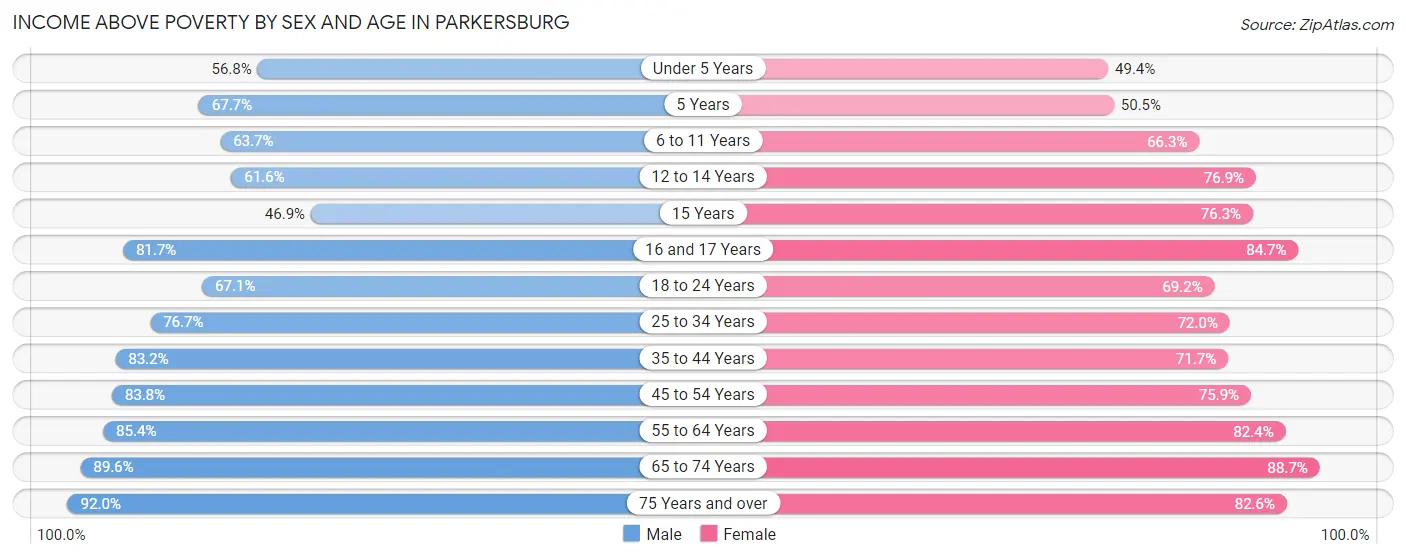
According to the poverty statistics in Parkersburg, males aged 75 years and over and females aged 65 to 74 years are the age groups that are most secure financially, with 92.0% of males and 88.7% of females in these age groups living above the poverty line.
| Age Bracket | Male | Female |
| Under 5 Years | 407 (56.8%) | 346 (49.4%) |
| 5 Years | 69 (67.6%) | 102 (50.5%) |
| 6 to 11 Years | 793 (63.7%) | 609 (66.3%) |
| 12 to 14 Years | 281 (61.6%) | 319 (76.9%) |
| 15 Years | 97 (46.9%) | 103 (76.3%) |
| 16 and 17 Years | 394 (81.7%) | 322 (84.7%) |
| 18 to 24 Years | 886 (67.1%) | 664 (69.2%) |
| 25 to 34 Years | 1,348 (76.7%) | 1,432 (72.0%) |
| 35 to 44 Years | 1,511 (83.2%) | 1,284 (71.7%) |
| 45 to 54 Years | 1,495 (83.8%) | 1,319 (75.9%) |
| 55 to 64 Years | 1,786 (85.4%) | 1,600 (82.4%) |
| 65 to 74 Years | 1,540 (89.6%) | 1,726 (88.7%) |
| 75 Years and over | 886 (92.0%) | 1,276 (82.6%) |
| Total | 11,493 (78.4%) | 11,102 (75.7%) |
Income Below Poverty Among Married-Couple Families in Parkersburg
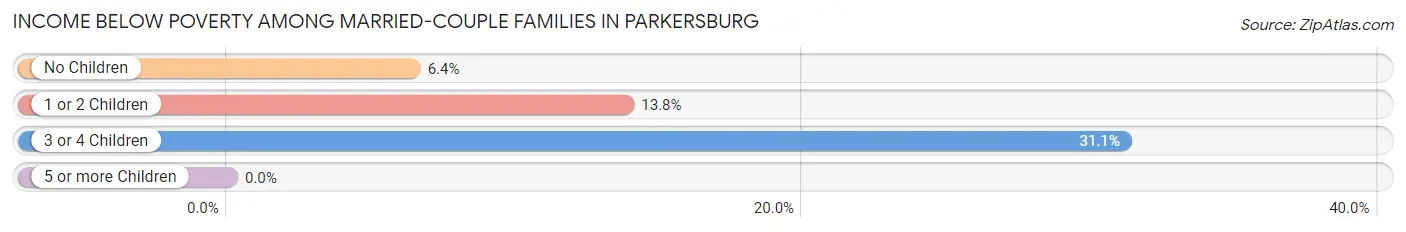
The poverty statistics for married-couple families in Parkersburg show that 9.8% or 462 of the total 4,728 families live below the poverty line. Families with 3 or 4 children have the highest poverty rate of 31.1%, comprising of 84 families. On the other hand, families with 5 or more children have the lowest poverty rate of 0.0%, which includes 0 families.
| Children | Above Poverty | Below Poverty |
| No Children | 2,972 (93.6%) | 202 (6.4%) |
| 1 or 2 Children | 1,099 (86.2%) | 176 (13.8%) |
| 3 or 4 Children | 186 (68.9%) | 84 (31.1%) |
| 5 or more Children | 9 (100.0%) | 0 (0.0%) |
| Total | 4,266 (90.2%) | 462 (9.8%) |
Income Below Poverty Among Single-Parent Households in Parkersburg
According to the poverty data in Parkersburg, 20.8% or 169 single-father households and 40.8% or 690 single-mother households are living below the poverty line. Among single-father households, those with 3 or 4 children have the highest poverty rate, with 14 households (82.4%) experiencing poverty. Likewise, among single-mother households, those with 5 or more children have the highest poverty rate, with 17 households (100.0%) falling below the poverty line.
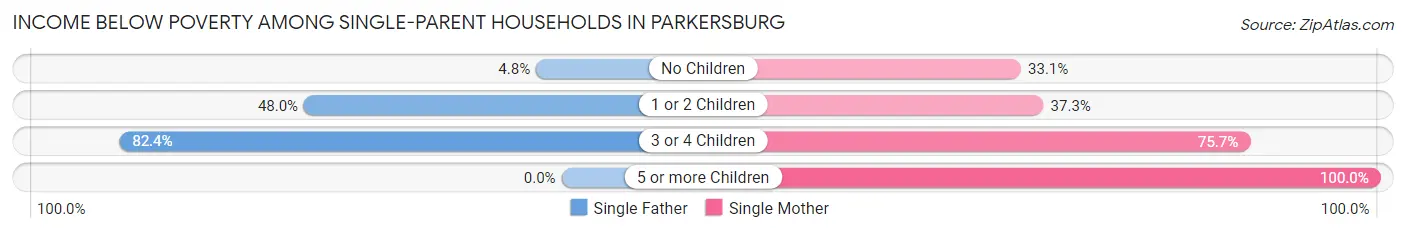
| Children | Single Father | Single Mother |
| No Children | 25 (4.8%) | 156 (33.1%) |
| 1 or 2 Children | 130 (48.0%) | 380 (37.2%) |
| 3 or 4 Children | 14 (82.4%) | 137 (75.7%) |
| 5 or more Children | 0 (0.0%) | 17 (100.0%) |
| Total | 169 (20.8%) | 690 (40.8%) |
Income Below Poverty Among Married-Couple vs Single-Parent Households in Parkersburg
The poverty data for Parkersburg shows that 462 of the married-couple family households (9.8%) and 859 of the single-parent households (34.3%) are living below the poverty level. Within the married-couple family households, those with 3 or 4 children have the highest poverty rate, with 84 households (31.1%) falling below the poverty line. Among the single-parent households, those with 5 or more children have the highest poverty rate, with 17 household (100.0%) living below poverty.
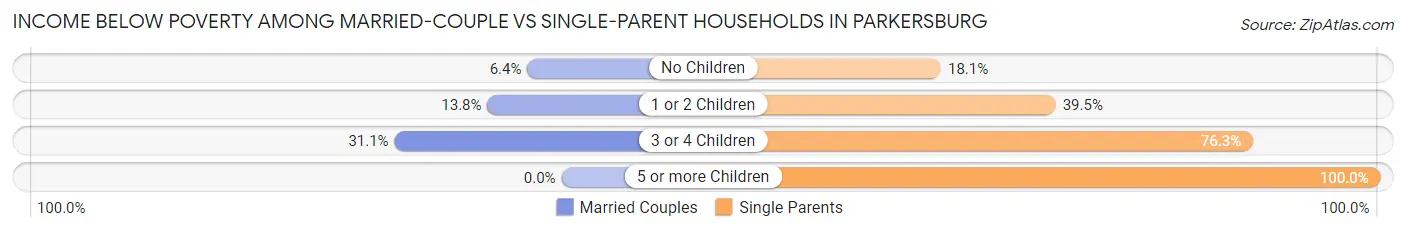
| Children | Married-Couple Families | Single-Parent Households |
| No Children | 202 (6.4%) | 181 (18.1%) |
| 1 or 2 Children | 176 (13.8%) | 510 (39.5%) |
| 3 or 4 Children | 84 (31.1%) | 151 (76.3%) |
| 5 or more Children | 0 (0.0%) | 17 (100.0%) |
| Total | 462 (9.8%) | 859 (34.3%) |
Race in Parkersburg
The most populous races in Parkersburg are White / Caucasian (27,832 | 93.8%), Two or more Races (907 | 3.1%), and Black / African American (566 | 1.9%).
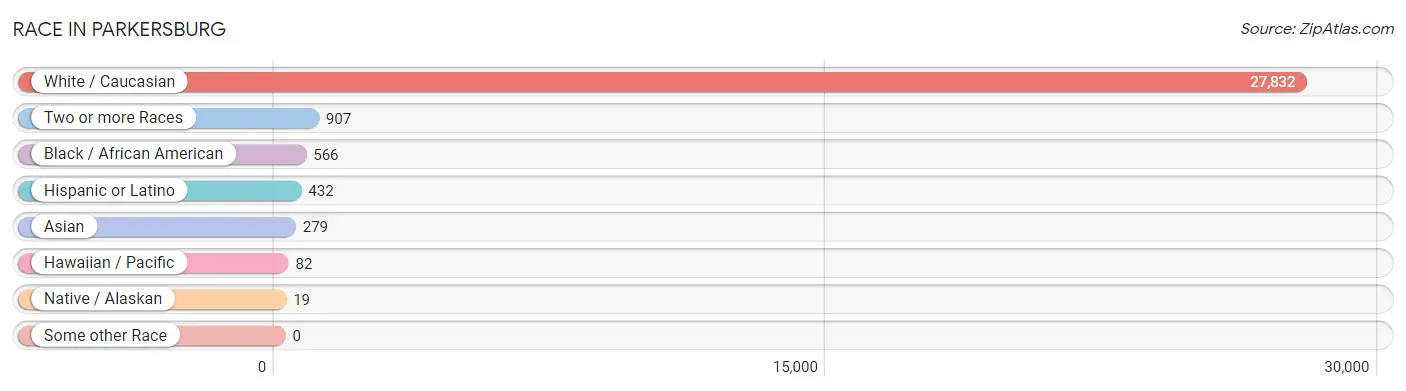
| Race | # Population | % Population |
| Asian | 279 | 0.9% |
| Black / African American | 566 | 1.9% |
| Hawaiian / Pacific | 82 | 0.3% |
| Hispanic or Latino | 432 | 1.5% |
| Native / Alaskan | 19 | 0.1% |
| White / Caucasian | 27,832 | 93.8% |
| Two or more Races | 907 | 3.1% |
| Some other Race | 0 | 0.0% |
| Total | 29,685 | 100.0% |
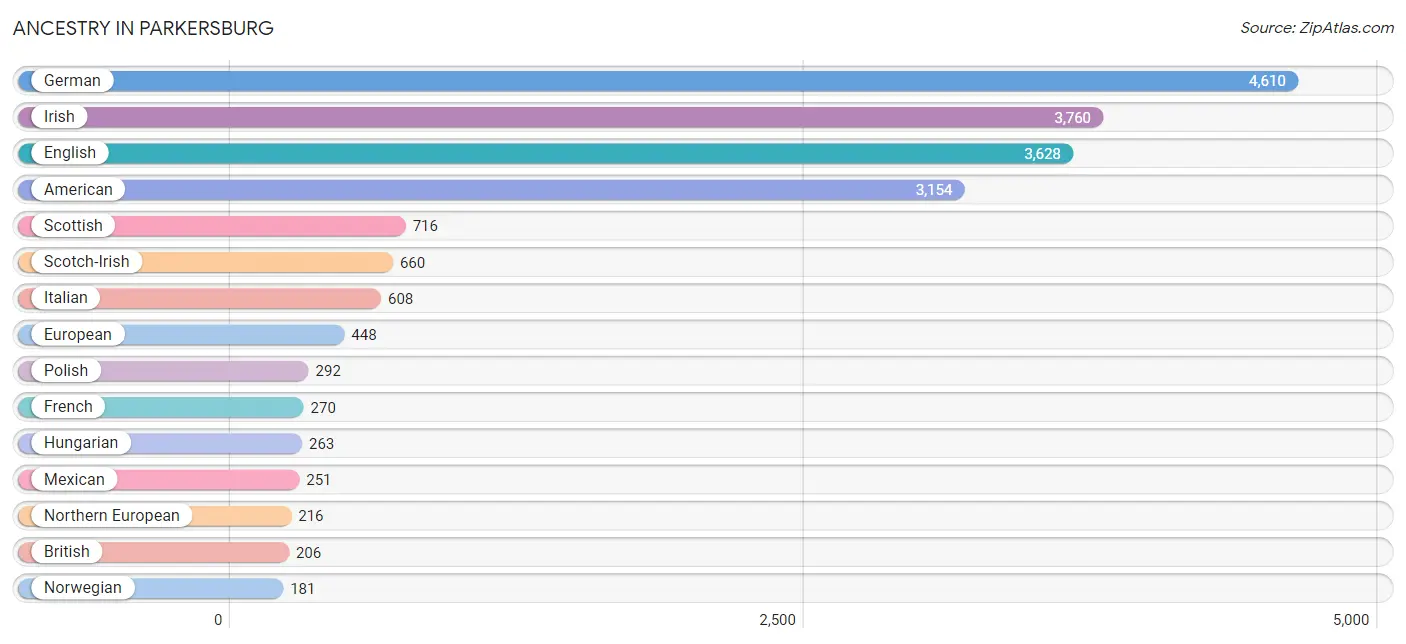
Ancestry in Parkersburg
The most populous ancestries reported in Parkersburg are German (4,610 | 15.5%), Irish (3,760 | 12.7%), English (3,628 | 12.2%), American (3,154 | 10.6%), and Scottish (716 | 2.4%), together accounting for 53.4% of all Parkersburg residents.
| Ancestry | # Population | % Population |
| African | 112 | 0.4% |
| American | 3,154 | 10.6% |
| Apache | 21 | 0.1% |
| Arab | 51 | 0.2% |
| Belgian | 55 | 0.2% |
| Bhutanese | 23 | 0.1% |
| Blackfeet | 5 | 0.0% |
| British | 206 | 0.7% |
| Burmese | 18 | 0.1% |
| Canadian | 20 | 0.1% |
| Cherokee | 97 | 0.3% |
| Choctaw | 47 | 0.2% |
| Croatian | 25 | 0.1% |
| Cuban | 32 | 0.1% |
| Czech | 11 | 0.0% |
| Czechoslovakian | 16 | 0.1% |
| Danish | 12 | 0.0% |
| Delaware | 9 | 0.0% |
| Dominican | 46 | 0.2% |
| Dutch | 162 | 0.5% |
| Eastern European | 173 | 0.6% |
| English | 3,628 | 12.2% |
| European | 448 | 1.5% |
| French | 270 | 0.9% |
| French Canadian | 68 | 0.2% |
| German | 4,610 | 15.5% |
| Greek | 67 | 0.2% |
| Hungarian | 263 | 0.9% |
| Indian (Asian) | 109 | 0.4% |
| Inupiat | 21 | 0.1% |
| Irish | 3,760 | 12.7% |
| Iroquois | 7 | 0.0% |
| Italian | 608 | 2.1% |
| Jamaican | 33 | 0.1% |
| Korean | 101 | 0.3% |
| Laotian | 11 | 0.0% |
| Lebanese | 51 | 0.2% |
| Mexican | 251 | 0.9% |
| Native Hawaiian | 101 | 0.3% |
| Nigerian | 11 | 0.0% |
| Northern European | 216 | 0.7% |
| Norwegian | 181 | 0.6% |
| Polish | 292 | 1.0% |
| Portuguese | 16 | 0.1% |
| Puerto Rican | 92 | 0.3% |
| Russian | 37 | 0.1% |
| Samoan | 151 | 0.5% |
| Scandinavian | 26 | 0.1% |
| Scotch-Irish | 660 | 2.2% |
| Scottish | 716 | 2.4% |
| Slavic | 26 | 0.1% |
| Slovak | 5 | 0.0% |
| South African | 16 | 0.1% |
| Spaniard | 11 | 0.0% |
| Sri Lankan | 14 | 0.1% |
| Subsaharan African | 139 | 0.5% |
| Swedish | 166 | 0.6% |
| Swiss | 46 | 0.2% |
| Thai | 33 | 0.1% |
| Ukrainian | 24 | 0.1% |
| Welsh | 168 | 0.6% |
| Yugoslavian | 35 | 0.1% | View All 62 Rows |
Immigrants in Parkersburg
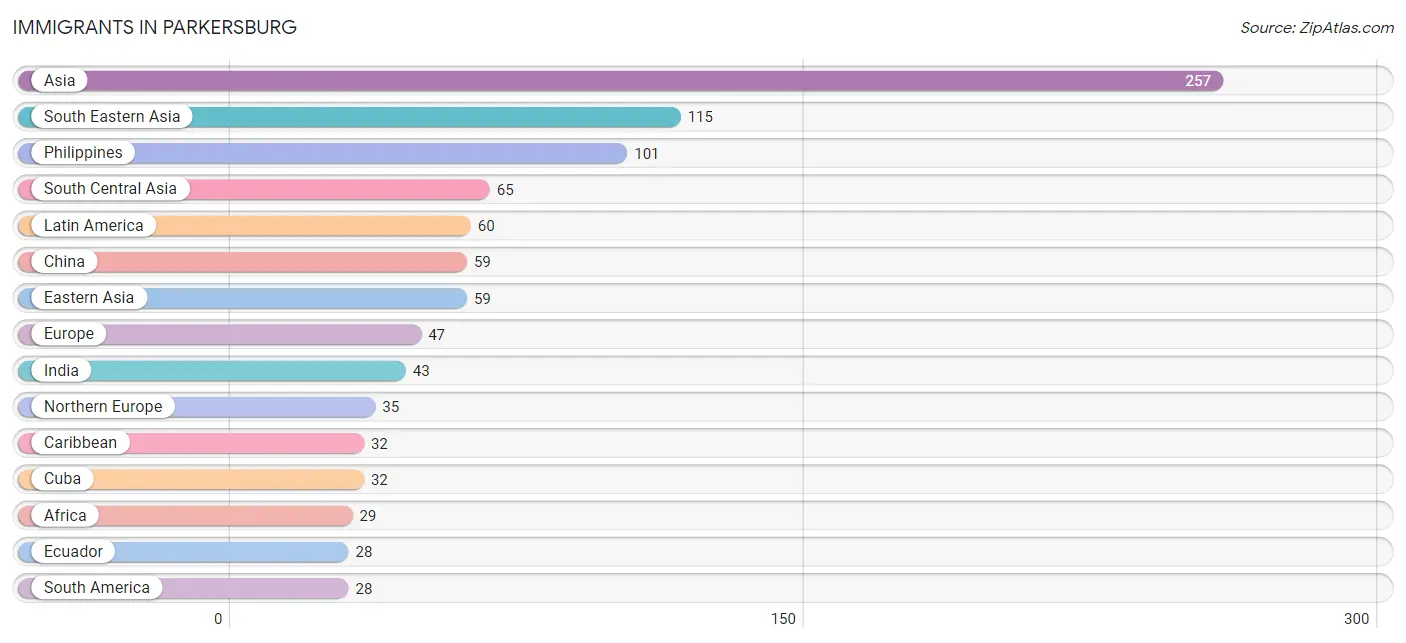
The most numerous immigrant groups reported in Parkersburg came from Asia (257 | 0.9%), South Eastern Asia (115 | 0.4%), Philippines (101 | 0.3%), South Central Asia (65 | 0.2%), and Latin America (60 | 0.2%), together accounting for 2.0% of all Parkersburg residents.
| Immigration Origin | # Population | % Population |
| Africa | 29 | 0.1% |
| Asia | 257 | 0.9% |
| Canada | 15 | 0.1% |
| Caribbean | 32 | 0.1% |
| China | 59 | 0.2% |
| Cuba | 32 | 0.1% |
| Eastern Asia | 59 | 0.2% |
| Eastern Europe | 5 | 0.0% |
| Ecuador | 28 | 0.1% |
| England | 12 | 0.0% |
| Europe | 47 | 0.2% |
| India | 43 | 0.1% |
| Latin America | 60 | 0.2% |
| Lebanon | 18 | 0.1% |
| Nigeria | 26 | 0.1% |
| Northern Europe | 35 | 0.1% |
| Philippines | 101 | 0.3% |
| Portugal | 7 | 0.0% |
| Russia | 5 | 0.0% |
| South Africa | 3 | 0.0% |
| South America | 28 | 0.1% |
| South Central Asia | 65 | 0.2% |
| South Eastern Asia | 115 | 0.4% |
| Southern Europe | 7 | 0.0% |
| Sri Lanka | 22 | 0.1% |
| Vietnam | 14 | 0.1% |
| Western Africa | 26 | 0.1% |
| Western Asia | 18 | 0.1% | View All 28 Rows |
Sex and Age in Parkersburg
Sex and Age in Parkersburg
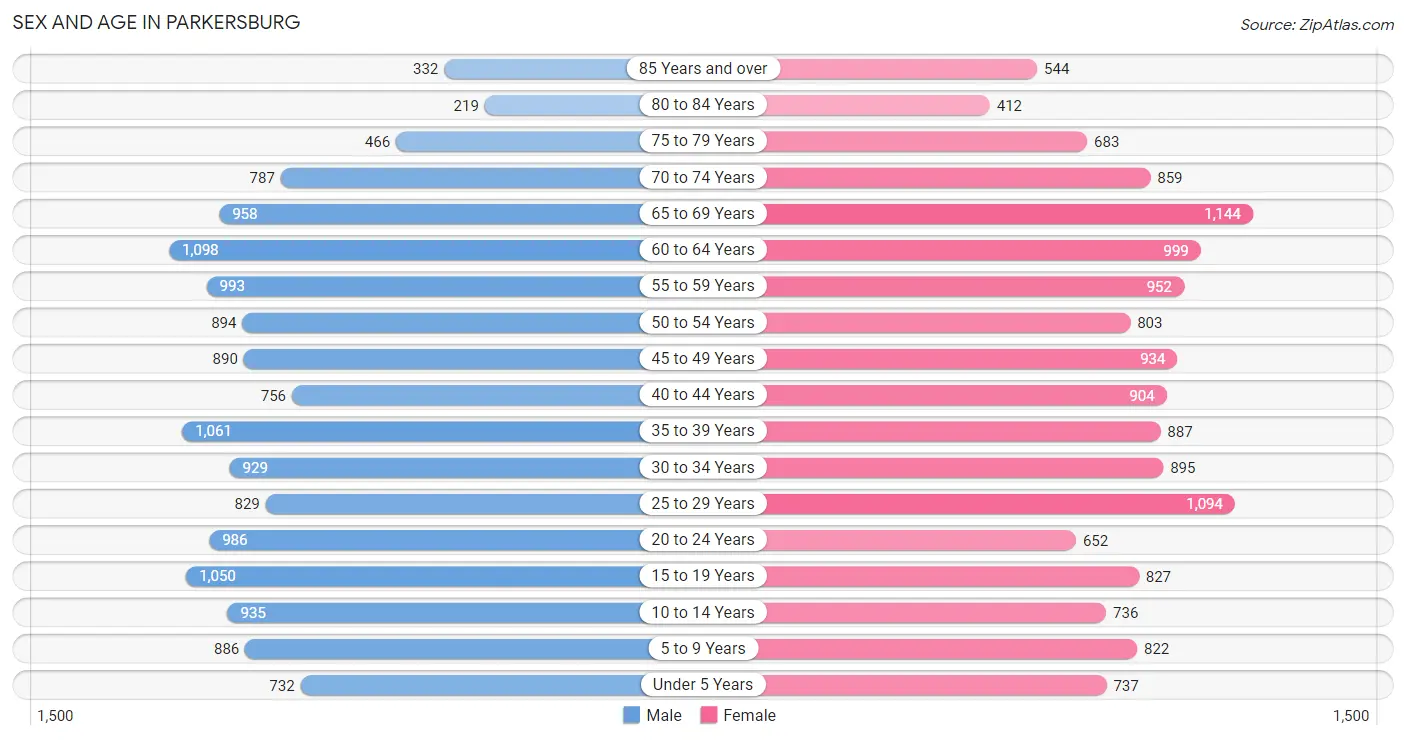
The most populous age groups in Parkersburg are 60 to 64 Years (1,098 | 7.4%) for men and 65 to 69 Years (1,144 | 7.7%) for women.
| Age Bracket | Male | Female |
| Under 5 Years | 732 (5.0%) | 737 (5.0%) |
| 5 to 9 Years | 886 (6.0%) | 822 (5.5%) |
| 10 to 14 Years | 935 (6.3%) | 736 (4.9%) |
| 15 to 19 Years | 1,050 (7.1%) | 827 (5.6%) |
| 20 to 24 Years | 986 (6.7%) | 652 (4.4%) |
| 25 to 29 Years | 829 (5.6%) | 1,094 (7.3%) |
| 30 to 34 Years | 929 (6.3%) | 895 (6.0%) |
| 35 to 39 Years | 1,061 (7.2%) | 887 (6.0%) |
| 40 to 44 Years | 756 (5.1%) | 904 (6.1%) |
| 45 to 49 Years | 890 (6.0%) | 934 (6.3%) |
| 50 to 54 Years | 894 (6.0%) | 803 (5.4%) |
| 55 to 59 Years | 993 (6.7%) | 952 (6.4%) |
| 60 to 64 Years | 1,098 (7.4%) | 999 (6.7%) |
| 65 to 69 Years | 958 (6.5%) | 1,144 (7.7%) |
| 70 to 74 Years | 787 (5.3%) | 859 (5.8%) |
| 75 to 79 Years | 466 (3.2%) | 683 (4.6%) |
| 80 to 84 Years | 219 (1.5%) | 412 (2.8%) |
| 85 Years and over | 332 (2.2%) | 544 (3.6%) |
| Total | 14,801 (100.0%) | 14,884 (100.0%) |
Families and Households in Parkersburg
Median Family Size in Parkersburg
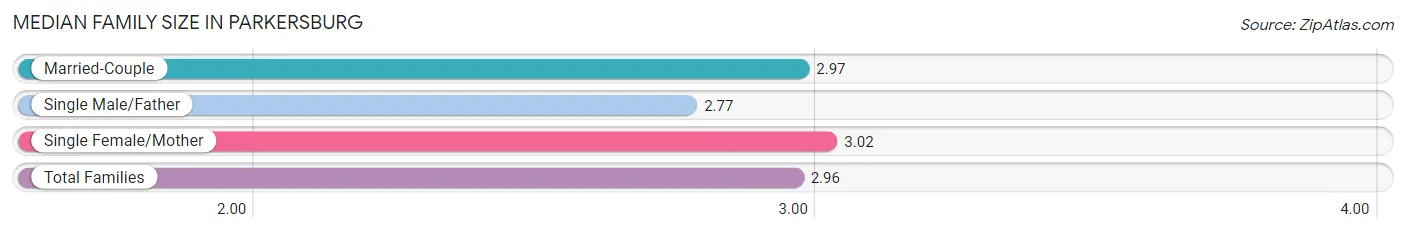
The median family size in Parkersburg is 2.96 persons per family, with single female/mother families (1,690 | 23.4%) accounting for the largest median family size of 3.02 persons per family. On the other hand, single male/father families (814 | 11.3%) represent the smallest median family size with 2.77 persons per family.
| Family Type | # Families | Family Size |
| Married-Couple | 4,728 (65.4%) | 2.97 |
| Single Male/Father | 814 (11.3%) | 2.77 |
| Single Female/Mother | 1,690 (23.4%) | 3.02 |
| Total Families | 7,232 (100.0%) | 2.96 |
Median Household Size in Parkersburg
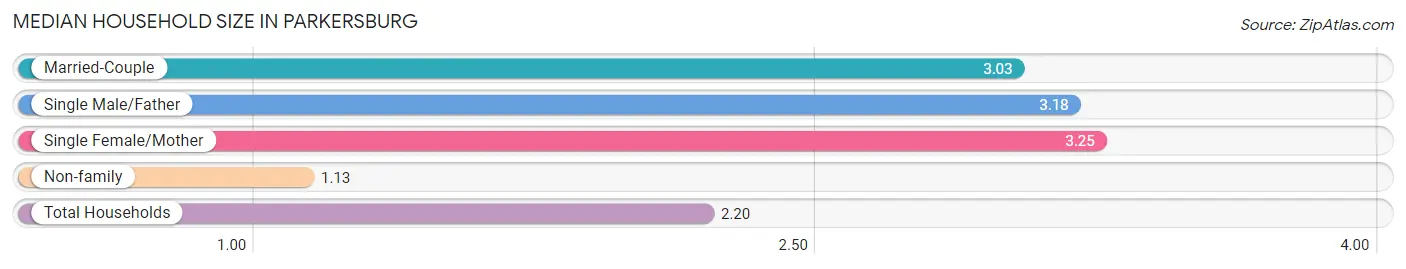
The median household size in Parkersburg is 2.20 persons per household, with single female/mother households (1,690 | 12.7%) accounting for the largest median household size of 3.25 persons per household. non-family households (6,070 | 45.6%) represent the smallest median household size with 1.13 persons per household.
| Household Type | # Households | Household Size |
| Married-Couple | 4,728 (35.5%) | 3.03 |
| Single Male/Father | 814 (6.1%) | 3.18 |
| Single Female/Mother | 1,690 (12.7%) | 3.25 |
| Non-family | 6,070 (45.6%) | 1.13 |
| Total Households | 13,302 (100.0%) | 2.20 |
Household Size by Marriage Status in Parkersburg
Out of a total of 13,302 households in Parkersburg, 7,232 (54.4%) are family households, while 6,070 (45.6%) are nonfamily households. The most numerous type of family households are 2-person households, comprising 3,396, and the most common type of nonfamily households are 1-person households, comprising 5,396.
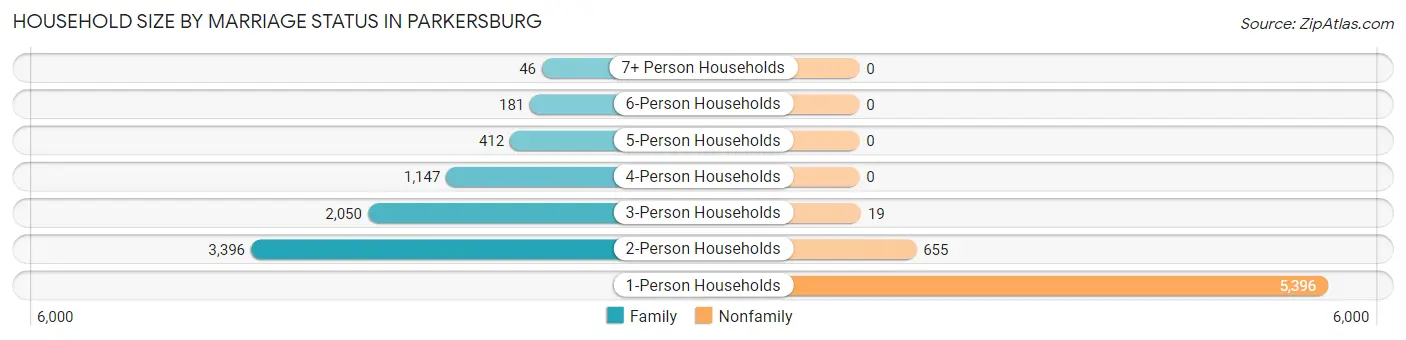
| Household Size | Family Households | Nonfamily Households |
| 1-Person Households | - | 5,396 (40.6%) |
| 2-Person Households | 3,396 (25.5%) | 655 (4.9%) |
| 3-Person Households | 2,050 (15.4%) | 19 (0.1%) |
| 4-Person Households | 1,147 (8.6%) | 0 (0.0%) |
| 5-Person Households | 412 (3.1%) | 0 (0.0%) |
| 6-Person Households | 181 (1.4%) | 0 (0.0%) |
| 7+ Person Households | 46 (0.4%) | 0 (0.0%) |
| Total | 7,232 (54.4%) | 6,070 (45.6%) |
Female Fertility in Parkersburg
Fertility by Age in Parkersburg
Average fertility rate in Parkersburg is 71.0 births per 1,000 women. Women in the age bracket of 20 to 34 years have the highest fertility rate with 131.0 births per 1,000 women. Women in the age bracket of 20 to 34 years acount for 77.5% of all women with births.
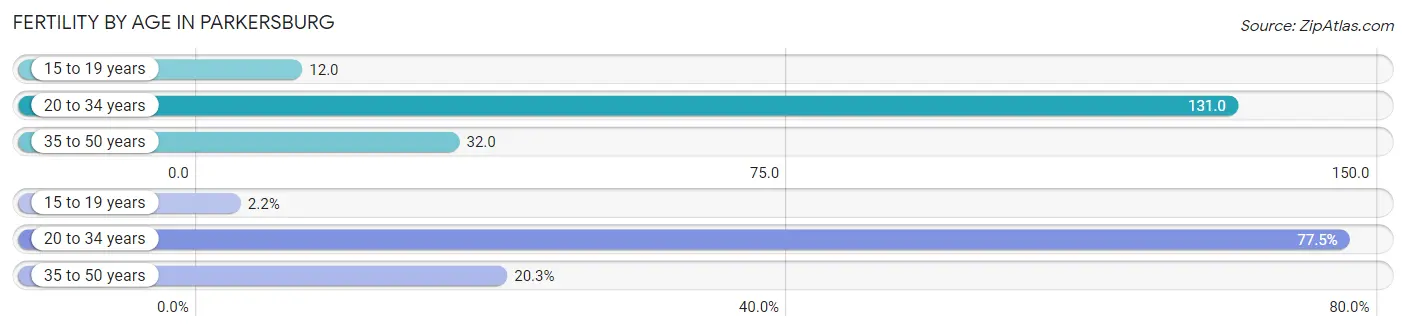
| Age Bracket | Women with Births | Births / 1,000 Women |
| 15 to 19 years | 10 (2.2%) | 12.0 |
| 20 to 34 years | 347 (77.5%) | 131.0 |
| 35 to 50 years | 91 (20.3%) | 32.0 |
| Total | 448 (100.0%) | 71.0 |
Fertility by Age by Marriage Status in Parkersburg
57.6% of women with births (448) in Parkersburg are married. The highest percentage of unmarried women with births falls into 15 to 19 years age bracket with 100.0% of them unmarried at the time of birth, while the lowest percentage of unmarried women with births belong to 20 to 34 years age bracket with 37.5% of them unmarried.
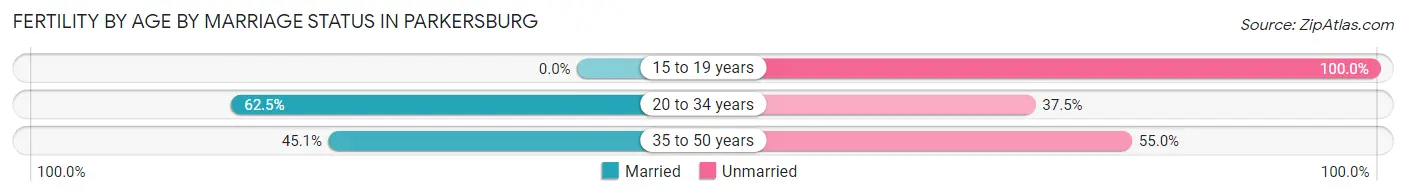
| Age Bracket | Married | Unmarried |
| 15 to 19 years | 0 (0.0%) | 10 (100.0%) |
| 20 to 34 years | 217 (62.5%) | 130 (37.5%) |
| 35 to 50 years | 41 (45.1%) | 50 (54.9%) |
| Total | 258 (57.6%) | 190 (42.4%) |
Fertility by Education in Parkersburg
Average fertility rate in Parkersburg is 71.0 births per 1,000 women. Women with the education attainment of bachelor's degree have the highest fertility rate of 107.0 births per 1,000 women, while women with the education attainment of graduate degree have the lowest fertility at 15.0 births per 1,000 women. Women with the education attainment of high school diploma represent 27.5% of all women with births.
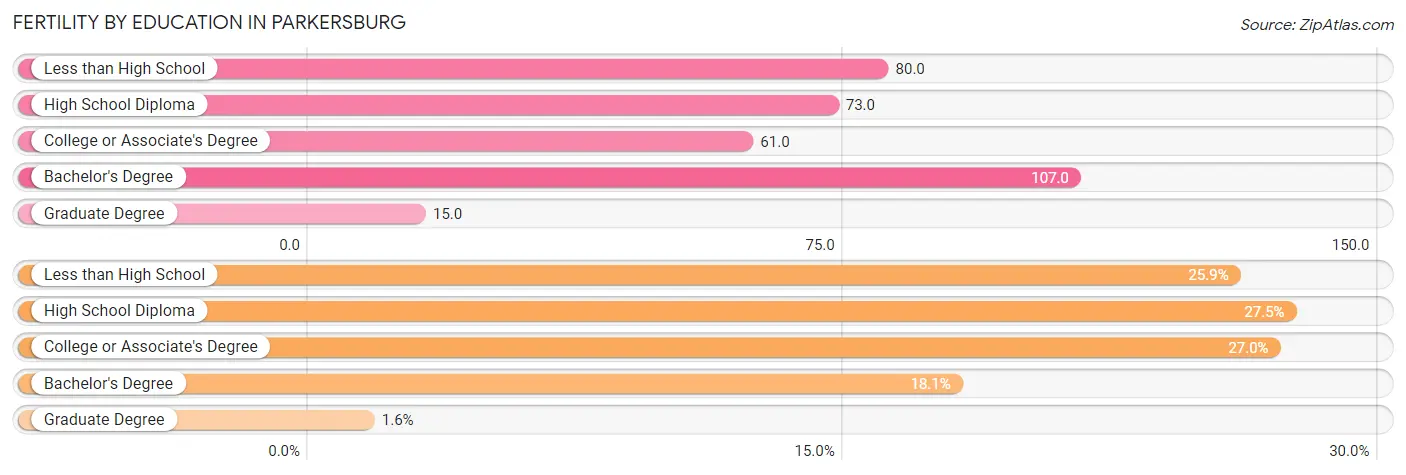
| Educational Attainment | Women with Births | Births / 1,000 Women |
| Less than High School | 116 (25.9%) | 80.0 |
| High School Diploma | 123 (27.5%) | 73.0 |
| College or Associate's Degree | 121 (27.0%) | 61.0 |
| Bachelor's Degree | 81 (18.1%) | 107.0 |
| Graduate Degree | 7 (1.6%) | 15.0 |
| Total | 448 (100.0%) | 71.0 |
Fertility by Education by Marriage Status in Parkersburg
42.4% of women with births in Parkersburg are unmarried. Women with the educational attainment of graduate degree are most likely to be married with 100.0% of them married at childbirth, while women with the educational attainment of college or associate's degree are least likely to be married with 70.3% of them unmarried at childbirth.
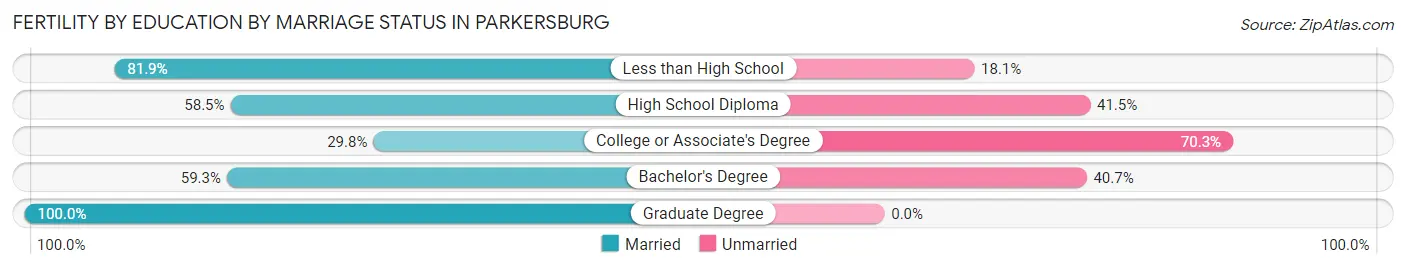
| Educational Attainment | Married | Unmarried |
| Less than High School | 95 (81.9%) | 21 (18.1%) |
| High School Diploma | 72 (58.5%) | 51 (41.5%) |
| College or Associate's Degree | 36 (29.7%) | 85 (70.3%) |
| Bachelor's Degree | 48 (59.3%) | 33 (40.7%) |
| Graduate Degree | 7 (100.0%) | 0 (0.0%) |
| Total | 258 (57.6%) | 190 (42.4%) |
Employment Characteristics in Parkersburg
Employment by Class of Employer in Parkersburg
Among the 11,882 employed individuals in Parkersburg, private company employees (8,464 | 71.2%), not-for-profit organizations (1,012 | 8.5%), and local government employees (821 | 6.9%) make up the most common classes of employment.
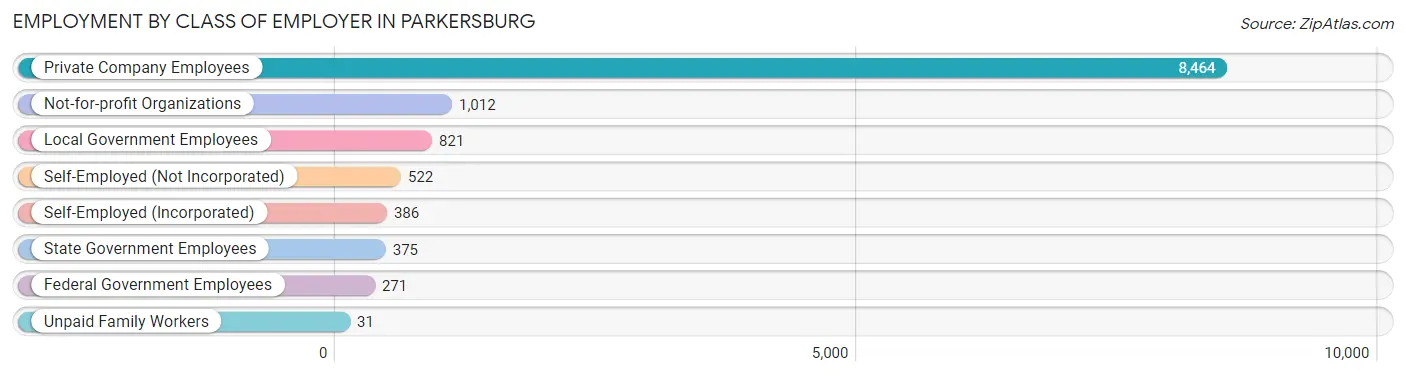
| Employer Class | # Employees | % Employees |
| Private Company Employees | 8,464 | 71.2% |
| Self-Employed (Incorporated) | 386 | 3.3% |
| Self-Employed (Not Incorporated) | 522 | 4.4% |
| Not-for-profit Organizations | 1,012 | 8.5% |
| Local Government Employees | 821 | 6.9% |
| State Government Employees | 375 | 3.2% |
| Federal Government Employees | 271 | 2.3% |
| Unpaid Family Workers | 31 | 0.3% |
| Total | 11,882 | 100.0% |
Employment Status by Age in Parkersburg
According to the labor force statistics for Parkersburg, out of the total population over 16 years of age (24,485), 52.6% or 12,879 individuals are in the labor force, with 6.9% or 889 of them unemployed. The age group with the highest labor force participation rate is 20 to 24 years, with 81.7% or 1,338 individuals in the labor force. Within the labor force, the 75 years and over age range has the highest percentage of unemployed individuals, with 22.9% or 19 of them being unemployed.
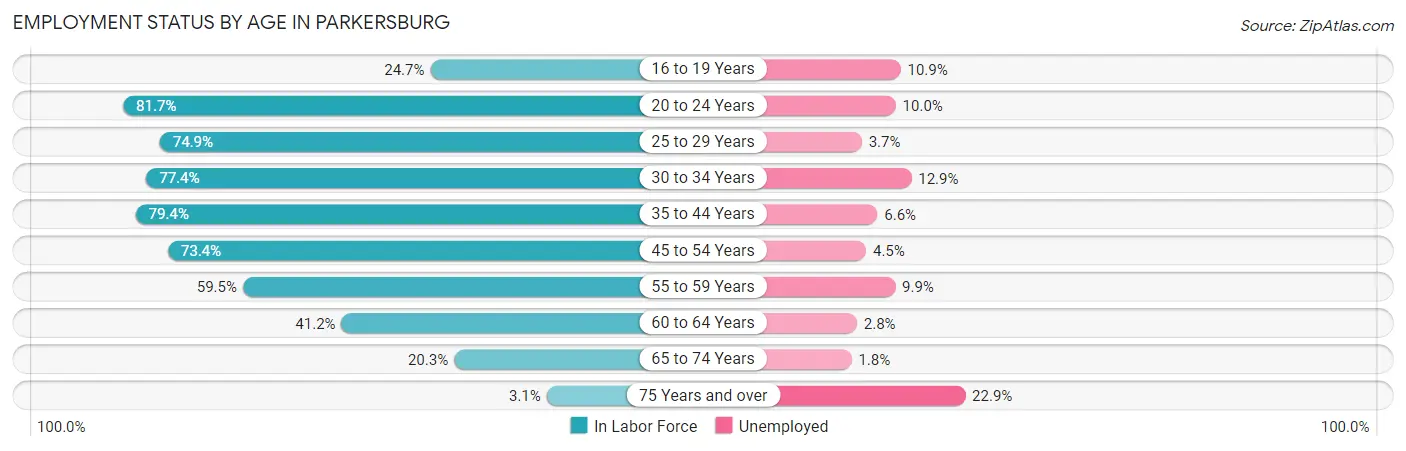
| Age Bracket | In Labor Force | Unemployed |
| 16 to 19 Years | 377 (24.7%) | 41 (10.9%) |
| 20 to 24 Years | 1,338 (81.7%) | 134 (10.0%) |
| 25 to 29 Years | 1,440 (74.9%) | 53 (3.7%) |
| 30 to 34 Years | 1,412 (77.4%) | 182 (12.9%) |
| 35 to 44 Years | 2,865 (79.4%) | 189 (6.6%) |
| 45 to 54 Years | 2,584 (73.4%) | 116 (4.5%) |
| 55 to 59 Years | 1,157 (59.5%) | 115 (9.9%) |
| 60 to 64 Years | 864 (41.2%) | 24 (2.8%) |
| 65 to 74 Years | 761 (20.3%) | 14 (1.8%) |
| 75 Years and over | 82 (3.1%) | 19 (22.9%) |
| Total | 12,879 (52.6%) | 889 (6.9%) |
Employment Status by Educational Attainment in Parkersburg
According to labor force statistics for Parkersburg, 69.2% of individuals (10,323) out of the total population between 25 and 64 years of age (14,918) are in the labor force, with 6.6% or 681 of them being unemployed. The group with the highest labor force participation rate are those with the educational attainment of bachelor's degree or higher, with 87.4% or 2,407 individuals in the labor force. Within the labor force, individuals with less than high school education have the highest percentage of unemployment, with 15.9% or 162 of them being unemployed.
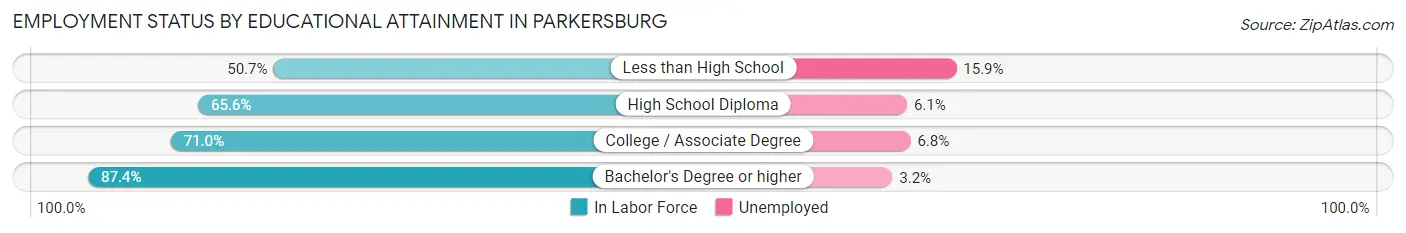
| Educational Attainment | In Labor Force | Unemployed |
| Less than High School | 1,022 (50.7%) | 320 (15.9%) |
| High School Diploma | 3,814 (65.6%) | 355 (6.1%) |
| College / Associate Degree | 3,078 (71.0%) | 295 (6.8%) |
| Bachelor's Degree or higher | 2,407 (87.4%) | 88 (3.2%) |
| Total | 10,323 (69.2%) | 985 (6.6%) |
Employment Occupations by Sex in Parkersburg
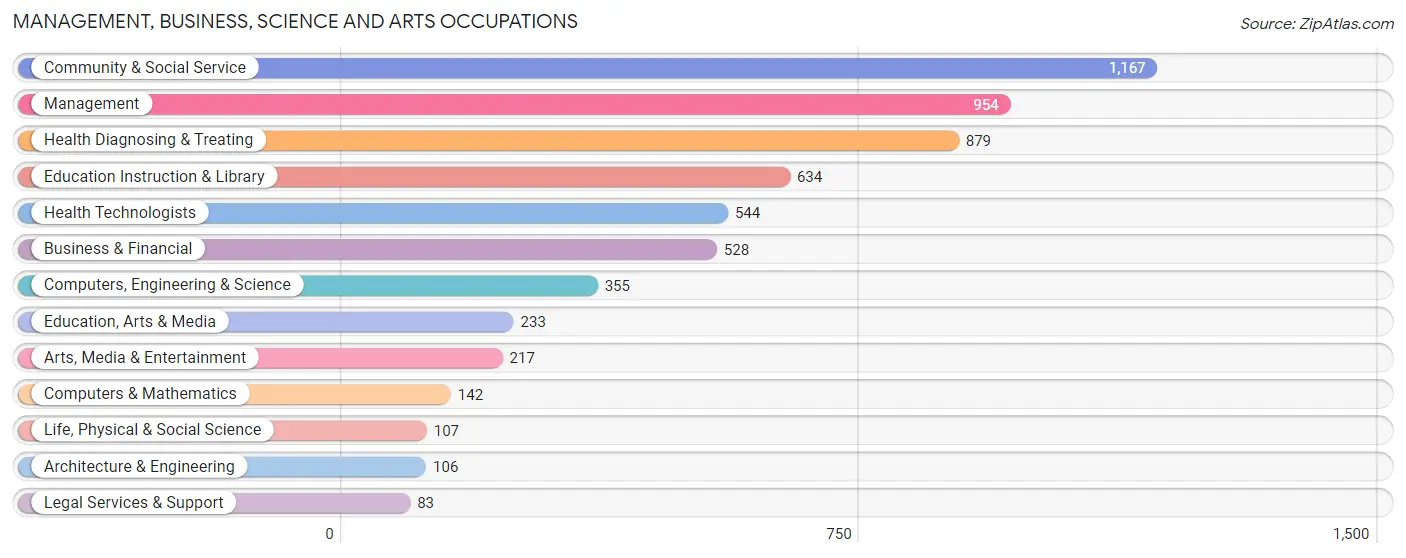
Management, Business, Science and Arts Occupations
The most common Management, Business, Science and Arts occupations in Parkersburg are Community & Social Service (1,167 | 9.7%), Management (954 | 8.0%), Health Diagnosing & Treating (879 | 7.3%), Education Instruction & Library (634 | 5.3%), and Health Technologists (544 | 4.5%).
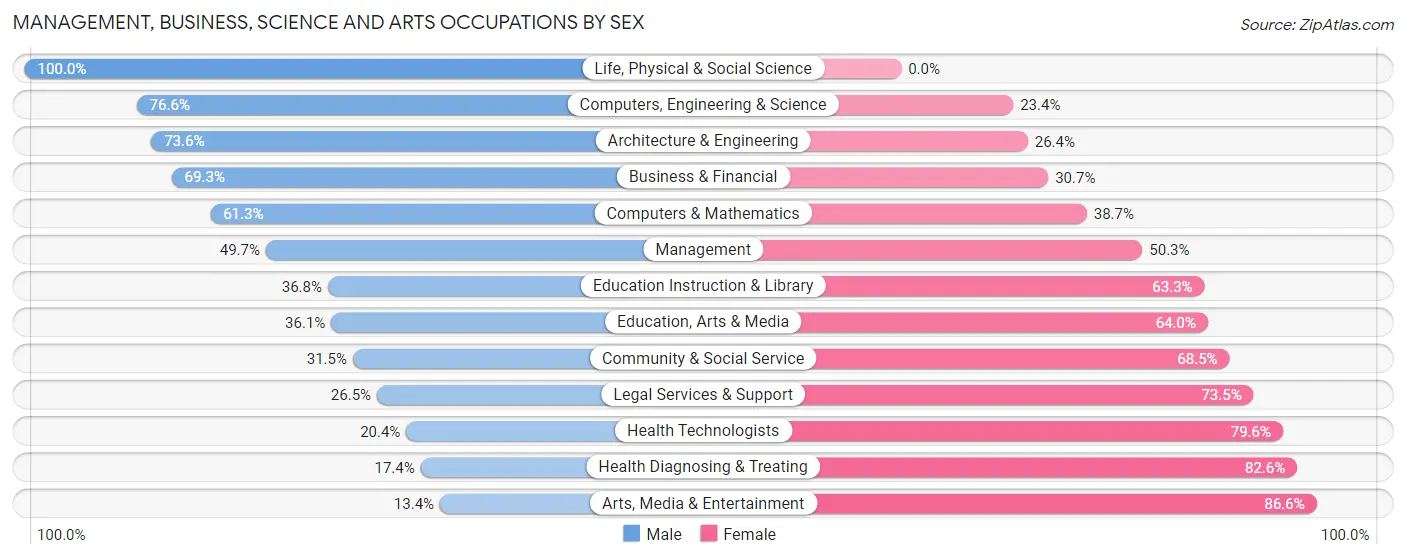
Management, Business, Science and Arts Occupations by Sex
Within the Management, Business, Science and Arts occupations in Parkersburg, the most male-oriented occupations are Life, Physical & Social Science (100.0%), Computers, Engineering & Science (76.6%), and Architecture & Engineering (73.6%), while the most female-oriented occupations are Arts, Media & Entertainment (86.6%), Health Diagnosing & Treating (82.6%), and Health Technologists (79.6%).
| Occupation | Male | Female |
| Management | 474 (49.7%) | 480 (50.3%) |
| Business & Financial | 366 (69.3%) | 162 (30.7%) |
| Computers, Engineering & Science | 272 (76.6%) | 83 (23.4%) |
| Computers & Mathematics | 87 (61.3%) | 55 (38.7%) |
| Architecture & Engineering | 78 (73.6%) | 28 (26.4%) |
| Life, Physical & Social Science | 107 (100.0%) | 0 (0.0%) |
| Community & Social Service | 368 (31.5%) | 799 (68.5%) |
| Education, Arts & Media | 84 (36.0%) | 149 (63.9%) |
| Legal Services & Support | 22 (26.5%) | 61 (73.5%) |
| Education Instruction & Library | 233 (36.7%) | 401 (63.2%) |
| Arts, Media & Entertainment | 29 (13.4%) | 188 (86.6%) |
| Health Diagnosing & Treating | 153 (17.4%) | 726 (82.6%) |
| Health Technologists | 111 (20.4%) | 433 (79.6%) |
| Total (Category) | 1,633 (42.1%) | 2,250 (57.9%) |
| Total (Overall) | 6,202 (51.7%) | 5,792 (48.3%) |
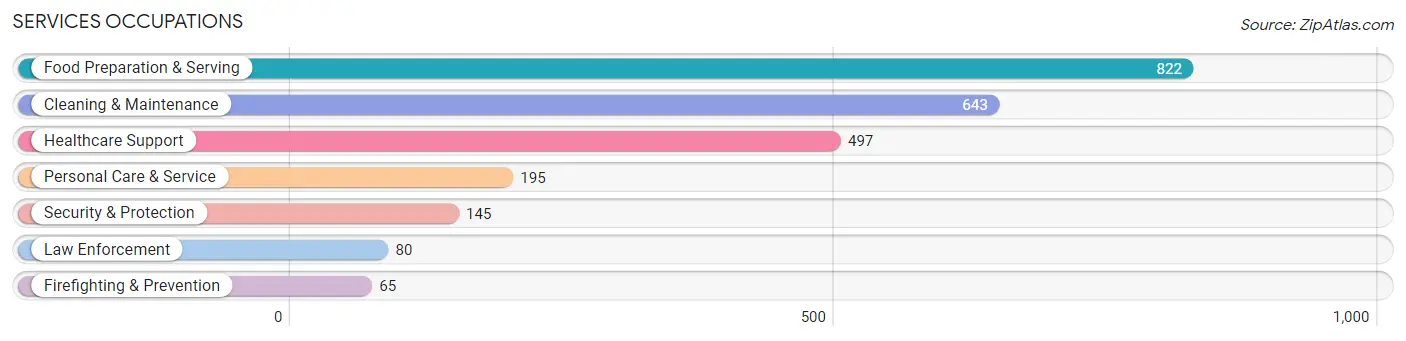
Services Occupations
The most common Services occupations in Parkersburg are Food Preparation & Serving (822 | 6.9%), Cleaning & Maintenance (643 | 5.4%), Healthcare Support (497 | 4.1%), Personal Care & Service (195 | 1.6%), and Security & Protection (145 | 1.2%).
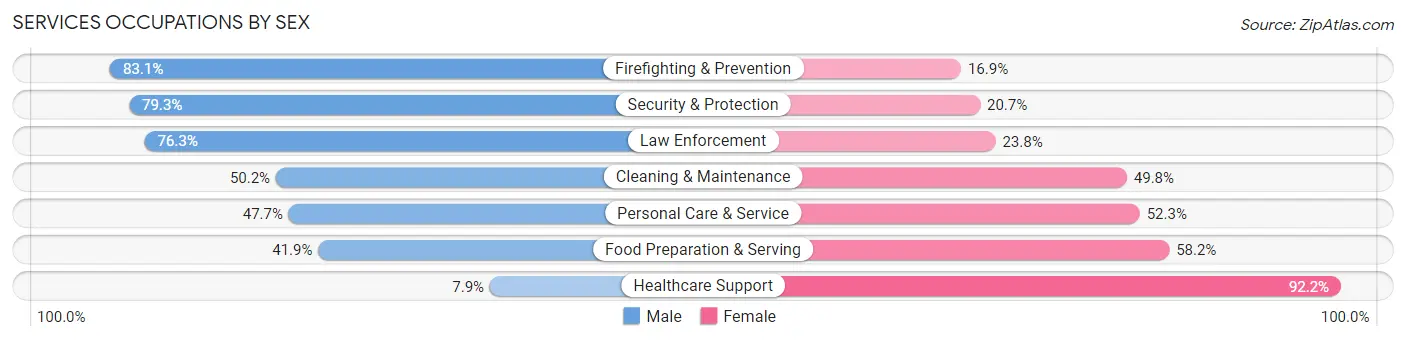
Services Occupations by Sex
Within the Services occupations in Parkersburg, the most male-oriented occupations are Firefighting & Prevention (83.1%), Security & Protection (79.3%), and Law Enforcement (76.2%), while the most female-oriented occupations are Healthcare Support (92.1%), Food Preparation & Serving (58.2%), and Personal Care & Service (52.3%).
| Occupation | Male | Female |
| Healthcare Support | 39 (7.9%) | 458 (92.1%) |
| Security & Protection | 115 (79.3%) | 30 (20.7%) |
| Firefighting & Prevention | 54 (83.1%) | 11 (16.9%) |
| Law Enforcement | 61 (76.2%) | 19 (23.7%) |
| Food Preparation & Serving | 344 (41.8%) | 478 (58.2%) |
| Cleaning & Maintenance | 323 (50.2%) | 320 (49.8%) |
| Personal Care & Service | 93 (47.7%) | 102 (52.3%) |
| Total (Category) | 914 (39.7%) | 1,388 (60.3%) |
| Total (Overall) | 6,202 (51.7%) | 5,792 (48.3%) |
Sales and Office Occupations
The most common Sales and Office occupations in Parkersburg are Sales & Related (1,599 | 13.3%), and Office & Administration (1,390 | 11.6%).

Sales and Office Occupations by Sex
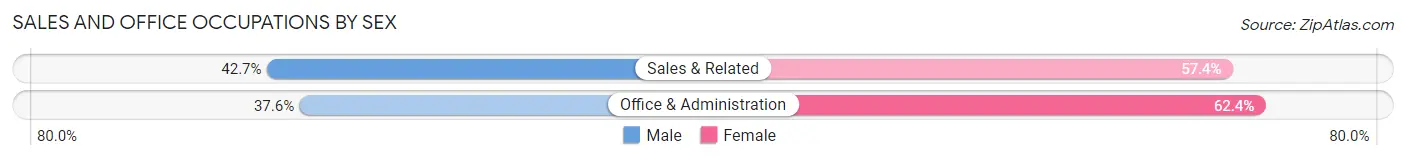
| Occupation | Male | Female |
| Sales & Related | 682 (42.6%) | 917 (57.4%) |
| Office & Administration | 523 (37.6%) | 867 (62.4%) |
| Total (Category) | 1,205 (40.3%) | 1,784 (59.7%) |
| Total (Overall) | 6,202 (51.7%) | 5,792 (48.3%) |
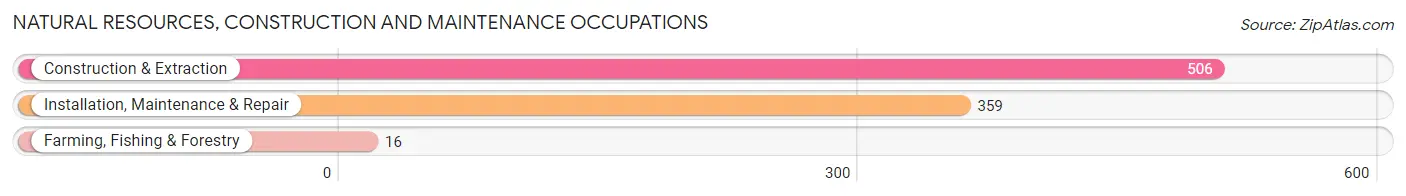
Natural Resources, Construction and Maintenance Occupations
The most common Natural Resources, Construction and Maintenance occupations in Parkersburg are Construction & Extraction (506 | 4.2%), Installation, Maintenance & Repair (359 | 3.0%), and Farming, Fishing & Forestry (16 | 0.1%).
Natural Resources, Construction and Maintenance Occupations by Sex
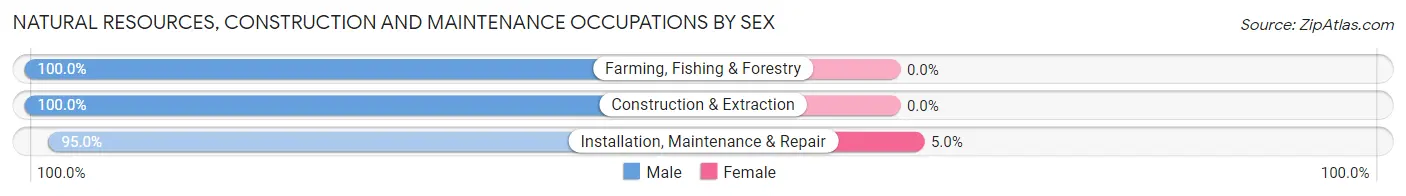
| Occupation | Male | Female |
| Farming, Fishing & Forestry | 16 (100.0%) | 0 (0.0%) |
| Construction & Extraction | 506 (100.0%) | 0 (0.0%) |
| Installation, Maintenance & Repair | 341 (95.0%) | 18 (5.0%) |
| Total (Category) | 863 (98.0%) | 18 (2.0%) |
| Total (Overall) | 6,202 (51.7%) | 5,792 (48.3%) |
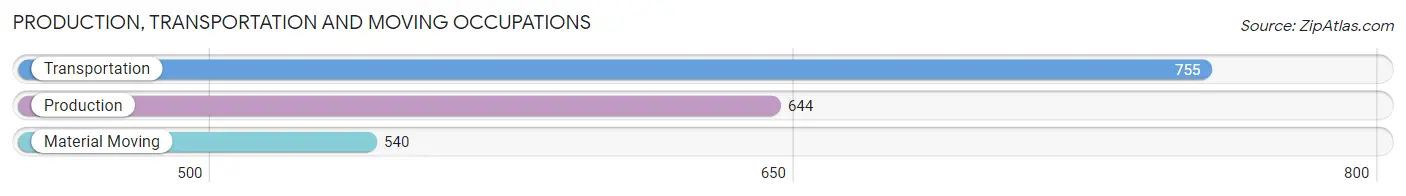
Production, Transportation and Moving Occupations
The most common Production, Transportation and Moving occupations in Parkersburg are Transportation (755 | 6.3%), Production (644 | 5.4%), and Material Moving (540 | 4.5%).
Production, Transportation and Moving Occupations by Sex
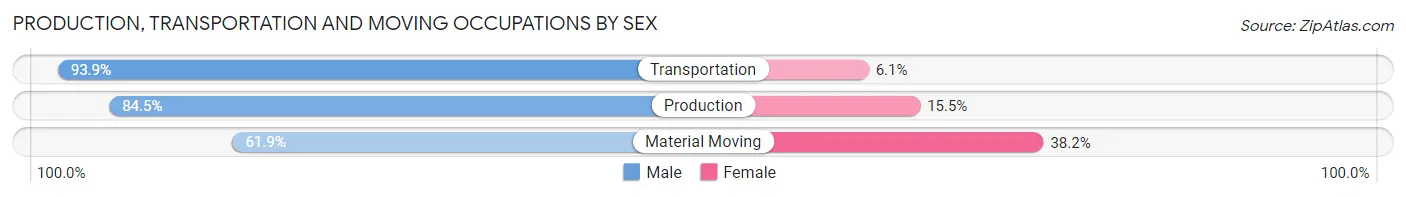
| Occupation | Male | Female |
| Production | 544 (84.5%) | 100 (15.5%) |
| Transportation | 709 (93.9%) | 46 (6.1%) |
| Material Moving | 334 (61.9%) | 206 (38.2%) |
| Total (Category) | 1,587 (81.9%) | 352 (18.1%) |
| Total (Overall) | 6,202 (51.7%) | 5,792 (48.3%) |
Employment Industries by Sex in Parkersburg
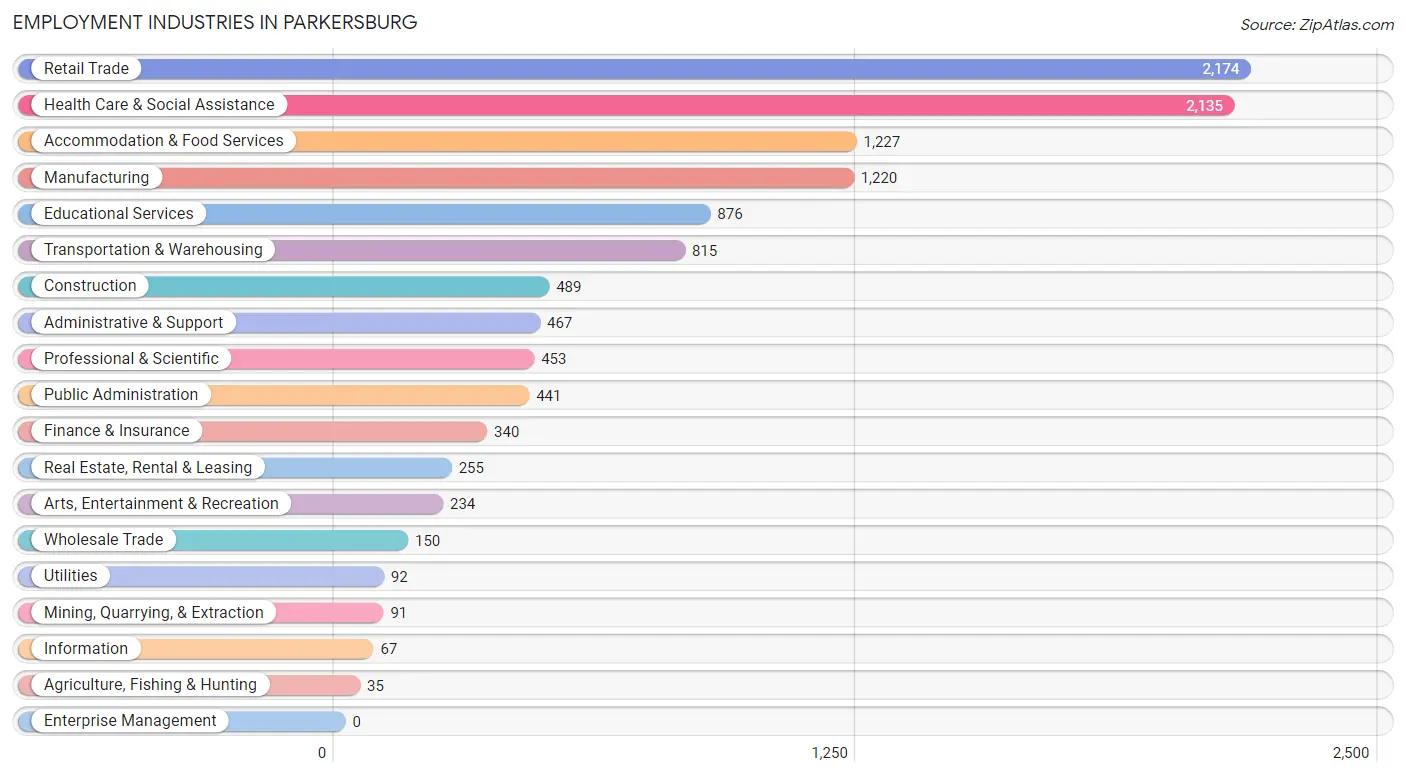
Employment Industries in Parkersburg
The major employment industries in Parkersburg include Retail Trade (2,174 | 18.1%), Health Care & Social Assistance (2,135 | 17.8%), Accommodation & Food Services (1,227 | 10.2%), Manufacturing (1,220 | 10.2%), and Educational Services (876 | 7.3%).
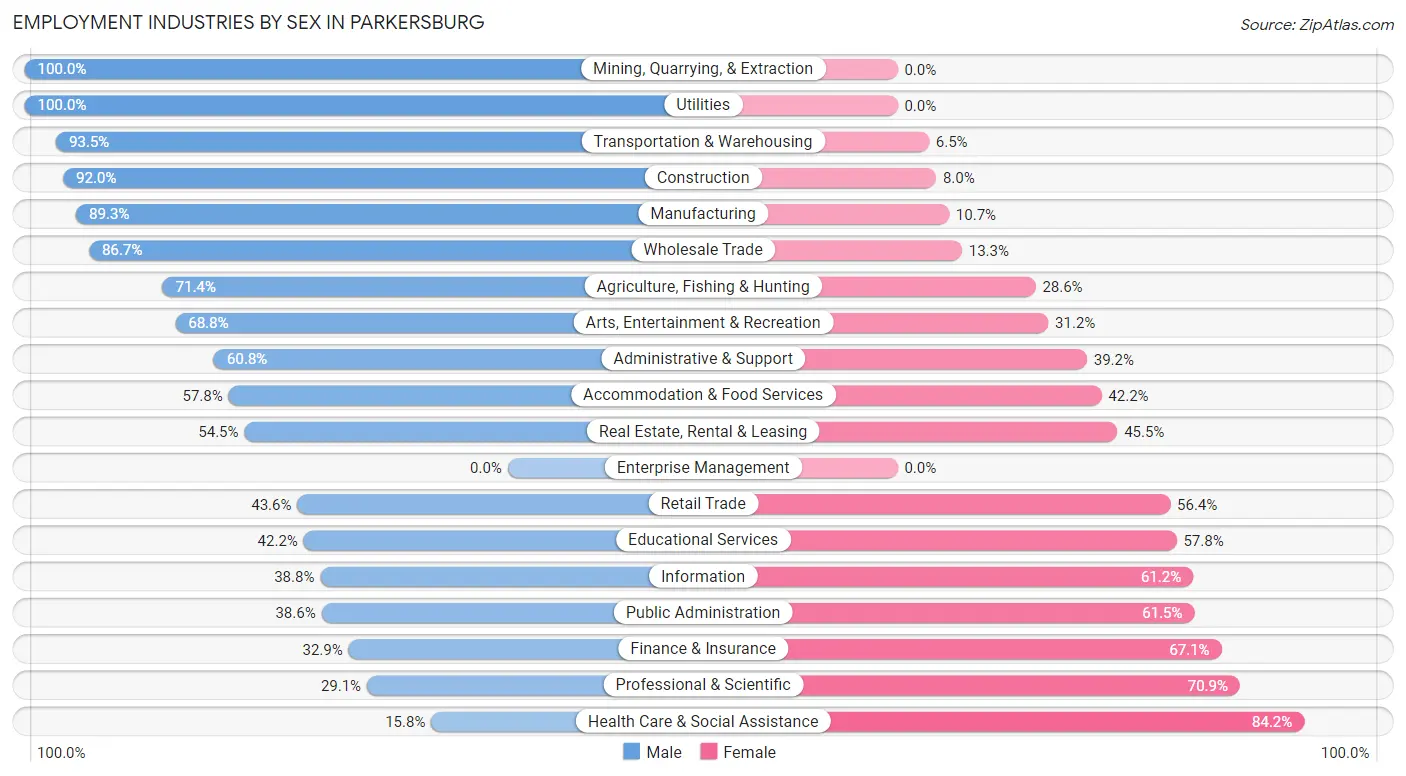
Employment Industries by Sex in Parkersburg
The Parkersburg industries that see more men than women are Mining, Quarrying, & Extraction (100.0%), Utilities (100.0%), and Transportation & Warehousing (93.5%), whereas the industries that tend to have a higher number of women are Health Care & Social Assistance (84.2%), Professional & Scientific (70.9%), and Finance & Insurance (67.1%).
| Industry | Male | Female |
| Agriculture, Fishing & Hunting | 25 (71.4%) | 10 (28.6%) |
| Mining, Quarrying, & Extraction | 91 (100.0%) | 0 (0.0%) |
| Construction | 450 (92.0%) | 39 (8.0%) |
| Manufacturing | 1,090 (89.3%) | 130 (10.7%) |
| Wholesale Trade | 130 (86.7%) | 20 (13.3%) |
| Retail Trade | 947 (43.6%) | 1,227 (56.4%) |
| Transportation & Warehousing | 762 (93.5%) | 53 (6.5%) |
| Utilities | 92 (100.0%) | 0 (0.0%) |
| Information | 26 (38.8%) | 41 (61.2%) |
| Finance & Insurance | 112 (32.9%) | 228 (67.1%) |
| Real Estate, Rental & Leasing | 139 (54.5%) | 116 (45.5%) |
| Professional & Scientific | 132 (29.1%) | 321 (70.9%) |
| Enterprise Management | 0 (0.0%) | 0 (0.0%) |
| Administrative & Support | 284 (60.8%) | 183 (39.2%) |
| Educational Services | 370 (42.2%) | 506 (57.8%) |
| Health Care & Social Assistance | 338 (15.8%) | 1,797 (84.2%) |
| Arts, Entertainment & Recreation | 161 (68.8%) | 73 (31.2%) |
| Accommodation & Food Services | 709 (57.8%) | 518 (42.2%) |
| Public Administration | 170 (38.6%) | 271 (61.5%) |
| Total | 6,202 (51.7%) | 5,792 (48.3%) |
Education in Parkersburg
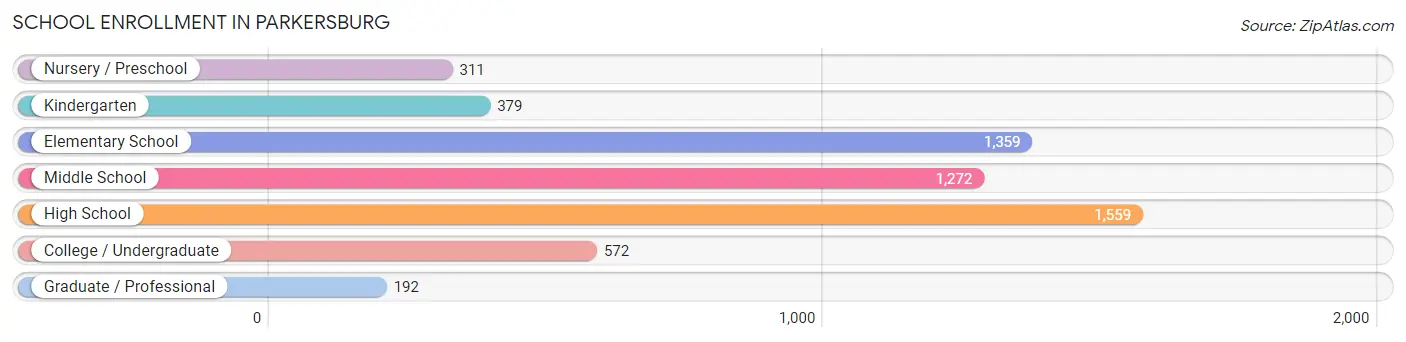
School Enrollment in Parkersburg
The most common levels of schooling among the 5,644 students in Parkersburg are high school (1,559 | 27.6%), elementary school (1,359 | 24.1%), and middle school (1,272 | 22.5%).
| School Level | # Students | % Students |
| Nursery / Preschool | 311 | 5.5% |
| Kindergarten | 379 | 6.7% |
| Elementary School | 1,359 | 24.1% |
| Middle School | 1,272 | 22.5% |
| High School | 1,559 | 27.6% |
| College / Undergraduate | 572 | 10.1% |
| Graduate / Professional | 192 | 3.4% |
| Total | 5,644 | 100.0% |
School Enrollment by Age by Funding Source in Parkersburg
Out of a total of 5,644 students who are enrolled in schools in Parkersburg, 1,101 (19.5%) attend a private institution, while the remaining 4,543 (80.5%) are enrolled in public schools. The age group of 25 to 34 year olds has the highest likelihood of being enrolled in private schools, with 113 (53.5% in the age bracket) enrolled. Conversely, the age group of 10 to 14 year olds has the lowest likelihood of being enrolled in a private school, with 1,443 (92.0% in the age bracket) attending a public institution.
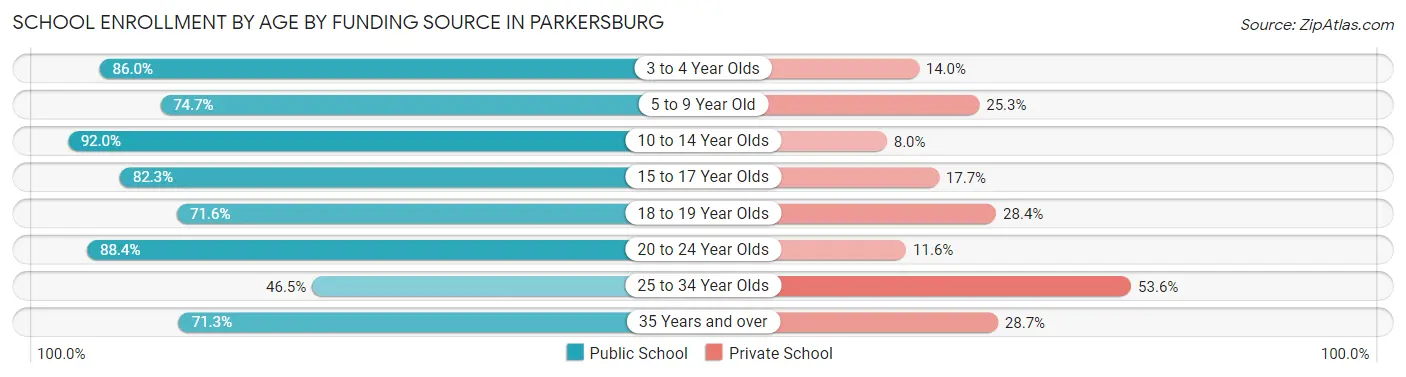
| Age Bracket | Public School | Private School |
| 3 to 4 Year Olds | 166 (86.0%) | 27 (14.0%) |
| 5 to 9 Year Old | 1,210 (74.7%) | 409 (25.3%) |
| 10 to 14 Year Olds | 1,443 (92.0%) | 126 (8.0%) |
| 15 to 17 Year Olds | 974 (82.3%) | 210 (17.7%) |
| 18 to 19 Year Olds | 232 (71.6%) | 92 (28.4%) |
| 20 to 24 Year Olds | 167 (88.4%) | 22 (11.6%) |
| 25 to 34 Year Olds | 98 (46.5%) | 113 (53.5%) |
| 35 Years and over | 253 (71.3%) | 102 (28.7%) |
| Total | 4,543 (80.5%) | 1,101 (19.5%) |
Educational Attainment by Field of Study in Parkersburg
Education (777 | 19.2%), business (767 | 19.0%), science & technology (494 | 12.2%), arts & humanities (342 | 8.5%), and bio, nature & agricultural (260 | 6.4%) are the most common fields of study among 4,047 individuals in Parkersburg who have obtained a bachelor's degree or higher.
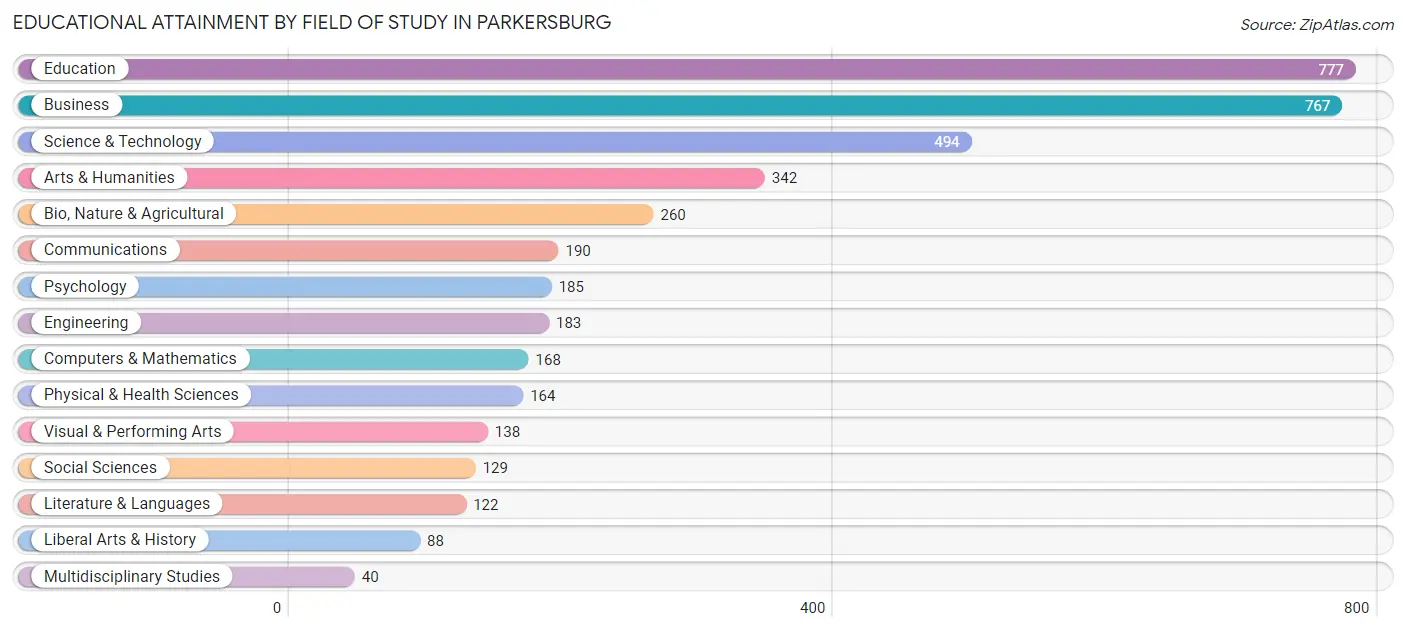
| Field of Study | # Graduates | % Graduates |
| Computers & Mathematics | 168 | 4.2% |
| Bio, Nature & Agricultural | 260 | 6.4% |
| Physical & Health Sciences | 164 | 4.1% |
| Psychology | 185 | 4.6% |
| Social Sciences | 129 | 3.2% |
| Engineering | 183 | 4.5% |
| Multidisciplinary Studies | 40 | 1.0% |
| Science & Technology | 494 | 12.2% |
| Business | 767 | 19.0% |
| Education | 777 | 19.2% |
| Literature & Languages | 122 | 3.0% |
| Liberal Arts & History | 88 | 2.2% |
| Visual & Performing Arts | 138 | 3.4% |
| Communications | 190 | 4.7% |
| Arts & Humanities | 342 | 8.5% |
| Total | 4,047 | 100.0% |
Transportation & Commute in Parkersburg
Vehicle Availability by Sex in Parkersburg
The most prevalent vehicle ownership categories in Parkersburg are males with 2 vehicles (2,617, accounting for 42.7%) and females with 2 vehicles (2,249, making up 45.7%).
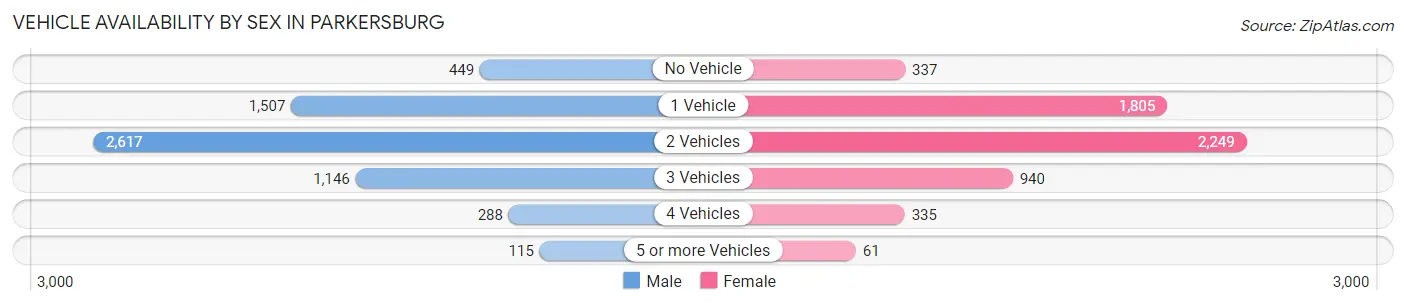
| Vehicles Available | Male | Female |
| No Vehicle | 449 (7.3%) | 337 (5.9%) |
| 1 Vehicle | 1,507 (24.6%) | 1,805 (31.5%) |
| 2 Vehicles | 2,617 (42.7%) | 2,249 (39.3%) |
| 3 Vehicles | 1,146 (18.7%) | 940 (16.4%) |
| 4 Vehicles | 288 (4.7%) | 335 (5.9%) |
| 5 or more Vehicles | 115 (1.9%) | 61 (1.1%) |
| Total | 6,122 (100.0%) | 5,727 (100.0%) |
Commute Time in Parkersburg
The most frequently occuring commute durations in Parkersburg are 10 to 14 minutes (2,683 commuters, 24.8%), 15 to 19 minutes (2,111 commuters, 19.5%), and 20 to 24 minutes (1,933 commuters, 17.9%).
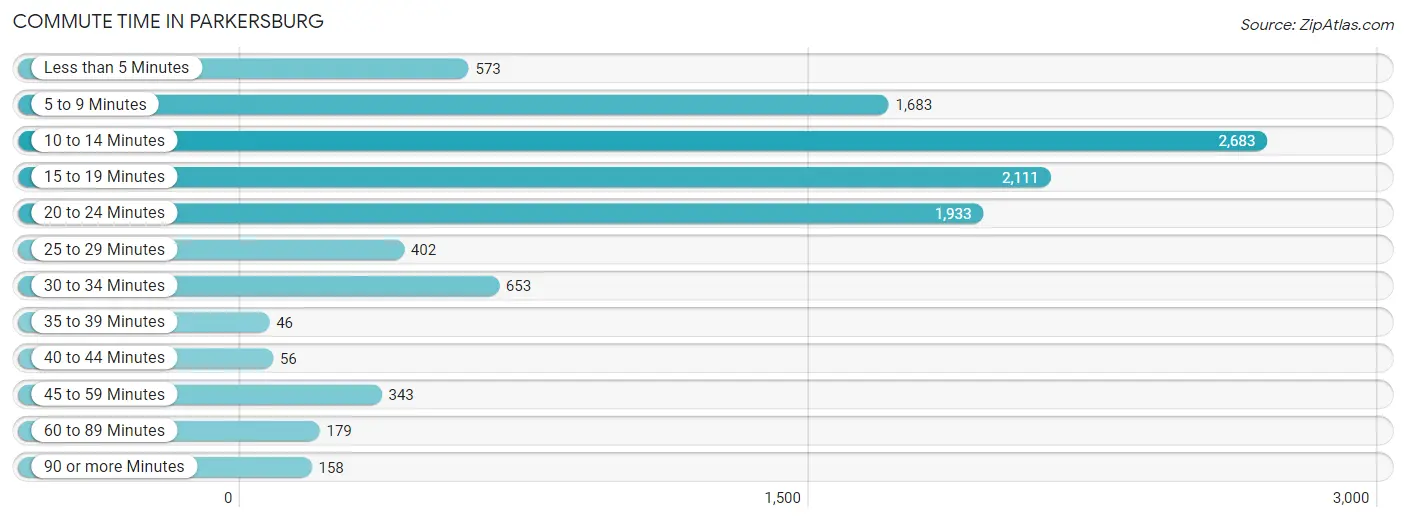
| Commute Time | # Commuters | % Commuters |
| Less than 5 Minutes | 573 | 5.3% |
| 5 to 9 Minutes | 1,683 | 15.5% |
| 10 to 14 Minutes | 2,683 | 24.8% |
| 15 to 19 Minutes | 2,111 | 19.5% |
| 20 to 24 Minutes | 1,933 | 17.9% |
| 25 to 29 Minutes | 402 | 3.7% |
| 30 to 34 Minutes | 653 | 6.0% |
| 35 to 39 Minutes | 46 | 0.4% |
| 40 to 44 Minutes | 56 | 0.5% |
| 45 to 59 Minutes | 343 | 3.2% |
| 60 to 89 Minutes | 179 | 1.7% |
| 90 or more Minutes | 158 | 1.5% |
Commute Time by Sex in Parkersburg
The most common commute times in Parkersburg are 10 to 14 minutes (1,386 commuters, 23.9%) for males and 10 to 14 minutes (1,297 commuters, 25.9%) for females.
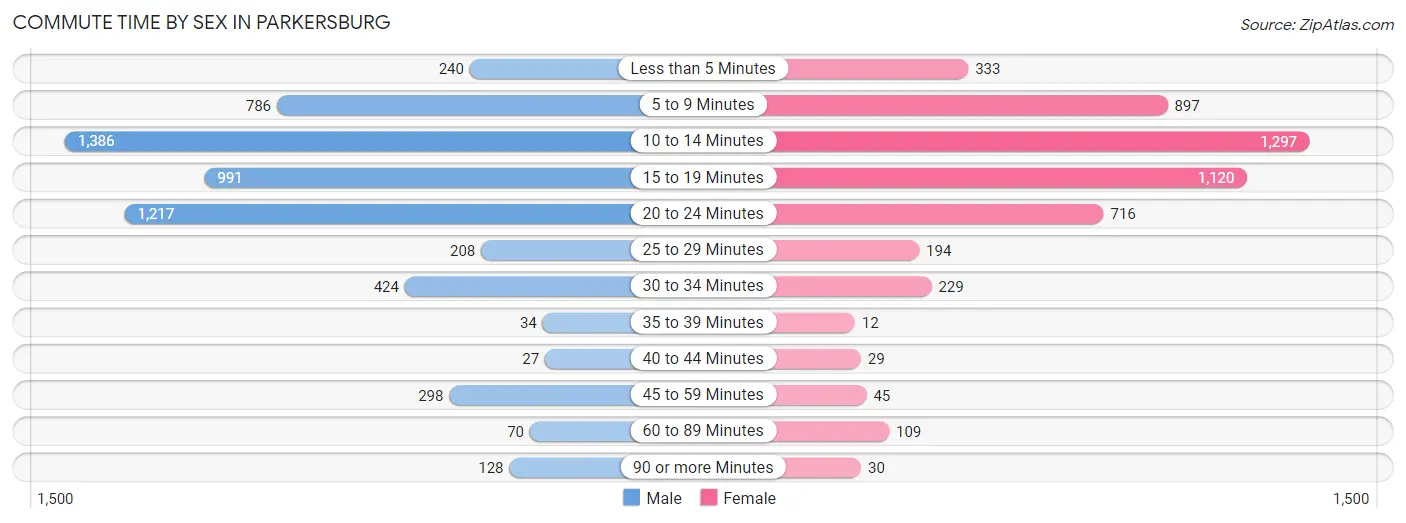
| Commute Time | Male | Female |
| Less than 5 Minutes | 240 (4.1%) | 333 (6.7%) |
| 5 to 9 Minutes | 786 (13.5%) | 897 (17.9%) |
| 10 to 14 Minutes | 1,386 (23.9%) | 1,297 (25.9%) |
| 15 to 19 Minutes | 991 (17.1%) | 1,120 (22.4%) |
| 20 to 24 Minutes | 1,217 (20.9%) | 716 (14.3%) |
| 25 to 29 Minutes | 208 (3.6%) | 194 (3.9%) |
| 30 to 34 Minutes | 424 (7.3%) | 229 (4.6%) |
| 35 to 39 Minutes | 34 (0.6%) | 12 (0.2%) |
| 40 to 44 Minutes | 27 (0.5%) | 29 (0.6%) |
| 45 to 59 Minutes | 298 (5.1%) | 45 (0.9%) |
| 60 to 89 Minutes | 70 (1.2%) | 109 (2.2%) |
| 90 or more Minutes | 128 (2.2%) | 30 (0.6%) |
Time of Departure to Work by Sex in Parkersburg
The most frequent times of departure to work in Parkersburg are 7:00 AM to 7:29 AM (886, 15.2%) for males and 7:30 AM to 7:59 AM (854, 17.0%) for females.
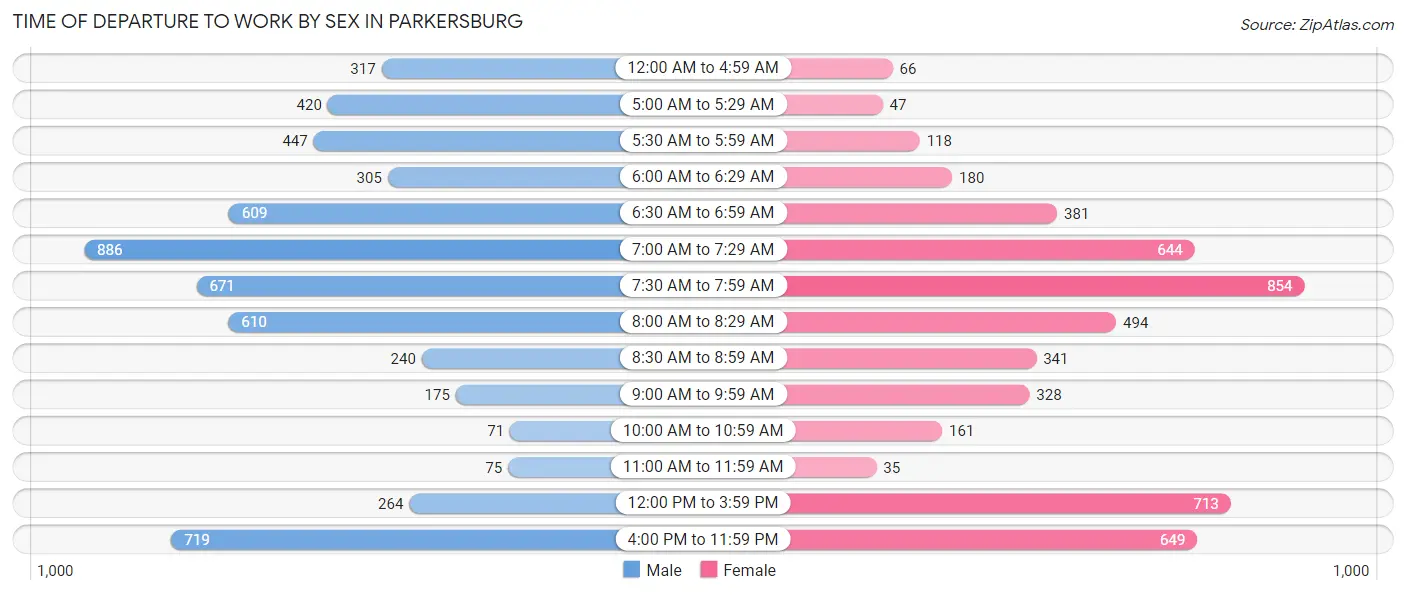
| Time of Departure | Male | Female |
| 12:00 AM to 4:59 AM | 317 (5.5%) | 66 (1.3%) |
| 5:00 AM to 5:29 AM | 420 (7.2%) | 47 (0.9%) |
| 5:30 AM to 5:59 AM | 447 (7.7%) | 118 (2.4%) |
| 6:00 AM to 6:29 AM | 305 (5.2%) | 180 (3.6%) |
| 6:30 AM to 6:59 AM | 609 (10.5%) | 381 (7.6%) |
| 7:00 AM to 7:29 AM | 886 (15.2%) | 644 (12.9%) |
| 7:30 AM to 7:59 AM | 671 (11.6%) | 854 (17.0%) |
| 8:00 AM to 8:29 AM | 610 (10.5%) | 494 (9.9%) |
| 8:30 AM to 8:59 AM | 240 (4.1%) | 341 (6.8%) |
| 9:00 AM to 9:59 AM | 175 (3.0%) | 328 (6.6%) |
| 10:00 AM to 10:59 AM | 71 (1.2%) | 161 (3.2%) |
| 11:00 AM to 11:59 AM | 75 (1.3%) | 35 (0.7%) |
| 12:00 PM to 3:59 PM | 264 (4.5%) | 713 (14.2%) |
| 4:00 PM to 11:59 PM | 719 (12.4%) | 649 (13.0%) |
| Total | 5,809 (100.0%) | 5,011 (100.0%) |
Housing Occupancy in Parkersburg
Occupancy by Ownership in Parkersburg
Of the total 13,302 dwellings in Parkersburg, owner-occupied units account for 8,506 (63.9%), while renter-occupied units make up 4,796 (36.0%).
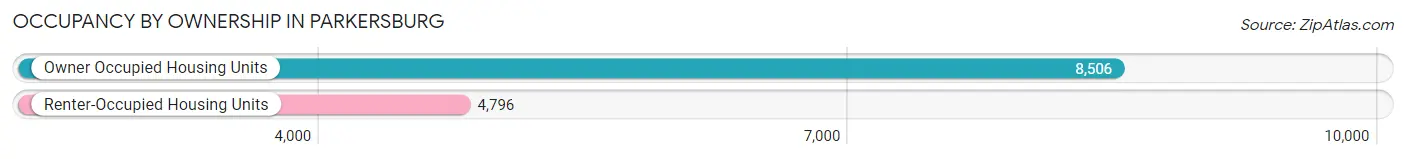
| Occupancy | # Housing Units | % Housing Units |
| Owner Occupied Housing Units | 8,506 | 63.9% |
| Renter-Occupied Housing Units | 4,796 | 36.0% |
| Total Occupied Housing Units | 13,302 | 100.0% |
Occupancy by Household Size in Parkersburg
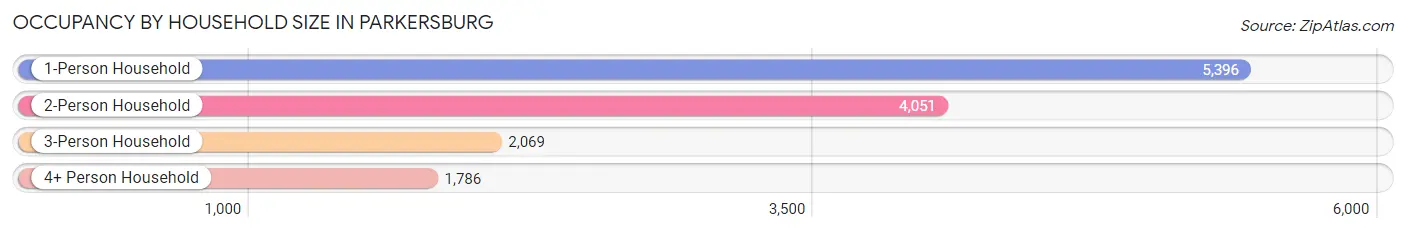
| Household Size | # Housing Units | % Housing Units |
| 1-Person Household | 5,396 | 40.6% |
| 2-Person Household | 4,051 | 30.4% |
| 3-Person Household | 2,069 | 15.5% |
| 4+ Person Household | 1,786 | 13.4% |
| Total Housing Units | 13,302 | 100.0% |
Occupancy by Ownership by Household Size in Parkersburg
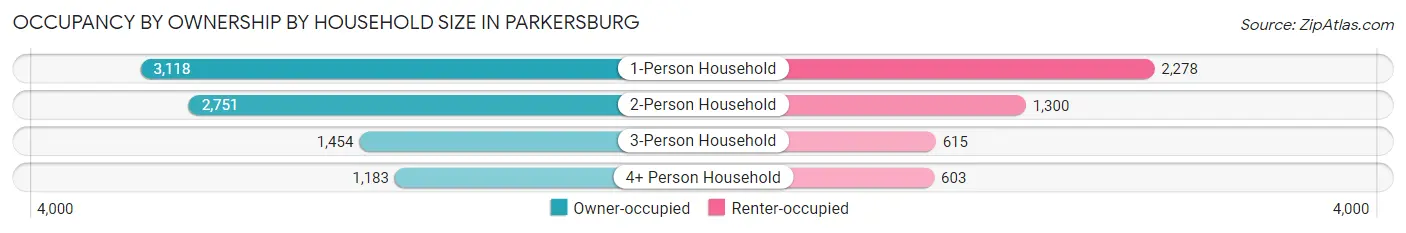
| Household Size | Owner-occupied | Renter-occupied |
| 1-Person Household | 3,118 (57.8%) | 2,278 (42.2%) |
| 2-Person Household | 2,751 (67.9%) | 1,300 (32.1%) |
| 3-Person Household | 1,454 (70.3%) | 615 (29.7%) |
| 4+ Person Household | 1,183 (66.2%) | 603 (33.8%) |
| Total Housing Units | 8,506 (63.9%) | 4,796 (36.0%) |
Occupancy by Educational Attainment in Parkersburg
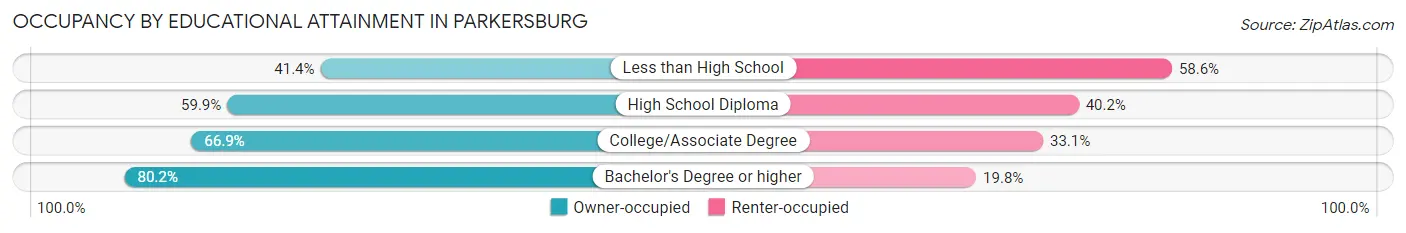
| Household Size | Owner-occupied | Renter-occupied |
| Less than High School | 639 (41.4%) | 906 (58.6%) |
| High School Diploma | 2,788 (59.9%) | 1,870 (40.2%) |
| College/Associate Degree | 3,093 (66.9%) | 1,529 (33.1%) |
| Bachelor's Degree or higher | 1,986 (80.2%) | 491 (19.8%) |
Occupancy by Age of Householder in Parkersburg
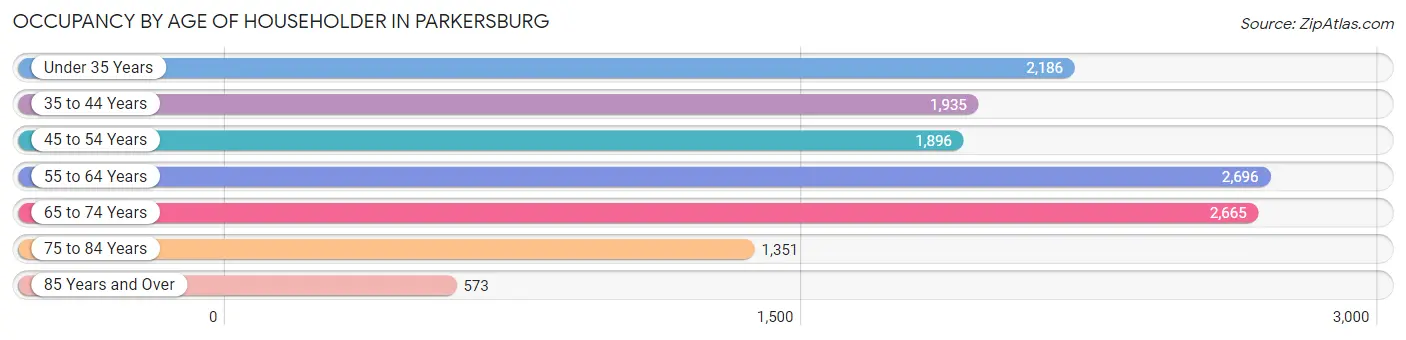
| Age Bracket | # Households | % Households |
| Under 35 Years | 2,186 | 16.4% |
| 35 to 44 Years | 1,935 | 14.5% |
| 45 to 54 Years | 1,896 | 14.2% |
| 55 to 64 Years | 2,696 | 20.3% |
| 65 to 74 Years | 2,665 | 20.0% |
| 75 to 84 Years | 1,351 | 10.2% |
| 85 Years and Over | 573 | 4.3% |
| Total | 13,302 | 100.0% |
Housing Finances in Parkersburg
Median Income by Occupancy in Parkersburg
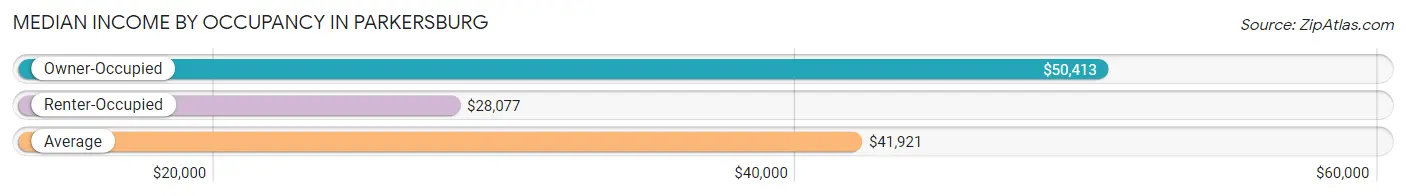
| Occupancy Type | # Households | Median Income |
| Owner-Occupied | 8,506 (63.9%) | $50,413 |
| Renter-Occupied | 4,796 (36.0%) | $28,077 |
| Average | 13,302 (100.0%) | $41,921 |
Occupancy by Householder Income Bracket in Parkersburg
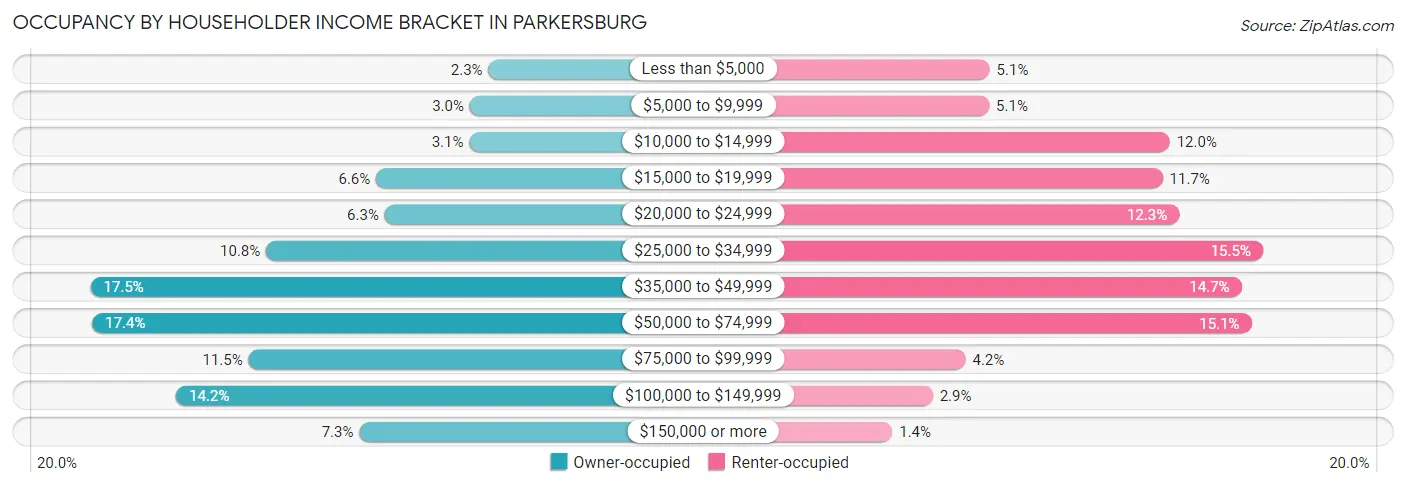
| Income Bracket | Owner-occupied | Renter-occupied |
| Less than $5,000 | 198 (2.3%) | 245 (5.1%) |
| $5,000 to $9,999 | 259 (3.0%) | 244 (5.1%) |
| $10,000 to $14,999 | 260 (3.1%) | 574 (12.0%) |
| $15,000 to $19,999 | 562 (6.6%) | 561 (11.7%) |
| $20,000 to $24,999 | 534 (6.3%) | 591 (12.3%) |
| $25,000 to $34,999 | 919 (10.8%) | 744 (15.5%) |
| $35,000 to $49,999 | 1,488 (17.5%) | 705 (14.7%) |
| $50,000 to $74,999 | 1,483 (17.4%) | 723 (15.1%) |
| $75,000 to $99,999 | 976 (11.5%) | 201 (4.2%) |
| $100,000 to $149,999 | 1,210 (14.2%) | 141 (2.9%) |
| $150,000 or more | 617 (7.2%) | 67 (1.4%) |
| Total | 8,506 (100.0%) | 4,796 (100.0%) |
Monthly Housing Cost Tiers in Parkersburg
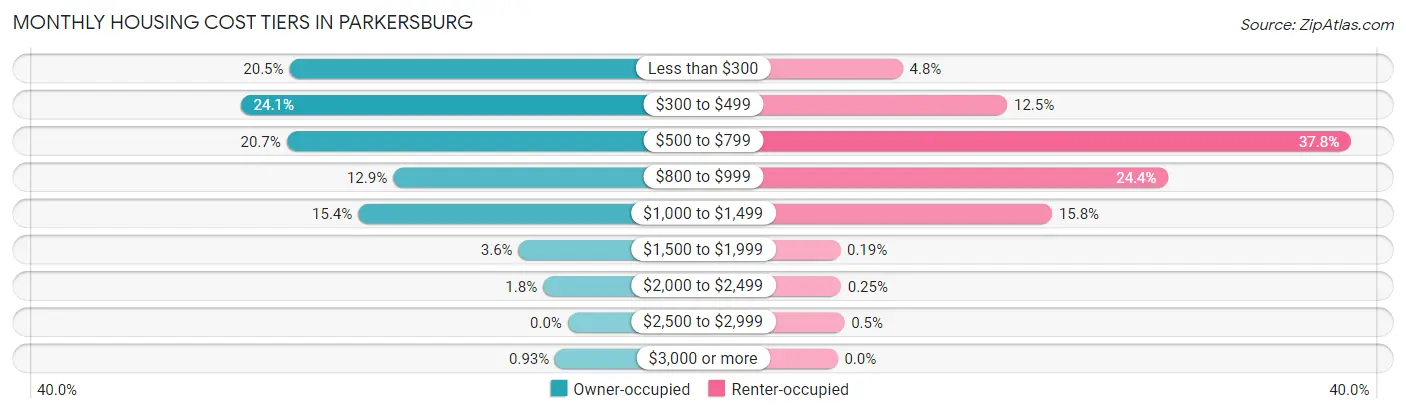
| Monthly Cost | Owner-occupied | Renter-occupied |
| Less than $300 | 1,744 (20.5%) | 230 (4.8%) |
| $300 to $499 | 2,049 (24.1%) | 599 (12.5%) |
| $500 to $799 | 1,762 (20.7%) | 1,814 (37.8%) |
| $800 to $999 | 1,095 (12.9%) | 1,169 (24.4%) |
| $1,000 to $1,499 | 1,313 (15.4%) | 758 (15.8%) |
| $1,500 to $1,999 | 309 (3.6%) | 9 (0.2%) |
| $2,000 to $2,499 | 155 (1.8%) | 12 (0.3%) |
| $2,500 to $2,999 | 0 (0.0%) | 24 (0.5%) |
| $3,000 or more | 79 (0.9%) | 0 (0.0%) |
| Total | 8,506 (100.0%) | 4,796 (100.0%) |
Physical Housing Characteristics in Parkersburg
Housing Structures in Parkersburg
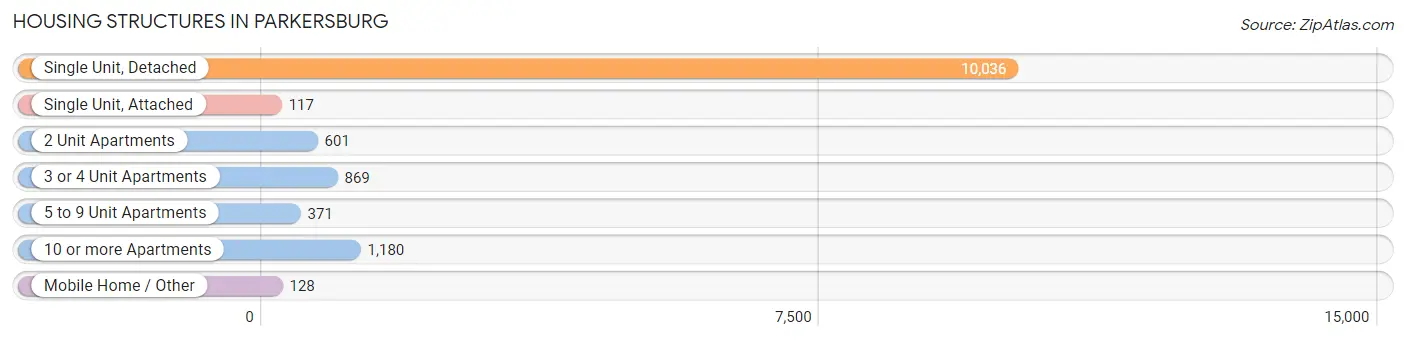
| Structure Type | # Housing Units | % Housing Units |
| Single Unit, Detached | 10,036 | 75.4% |
| Single Unit, Attached | 117 | 0.9% |
| 2 Unit Apartments | 601 | 4.5% |
| 3 or 4 Unit Apartments | 869 | 6.5% |
| 5 to 9 Unit Apartments | 371 | 2.8% |
| 10 or more Apartments | 1,180 | 8.9% |
| Mobile Home / Other | 128 | 1.0% |
| Total | 13,302 | 100.0% |
Housing Structures by Occupancy in Parkersburg
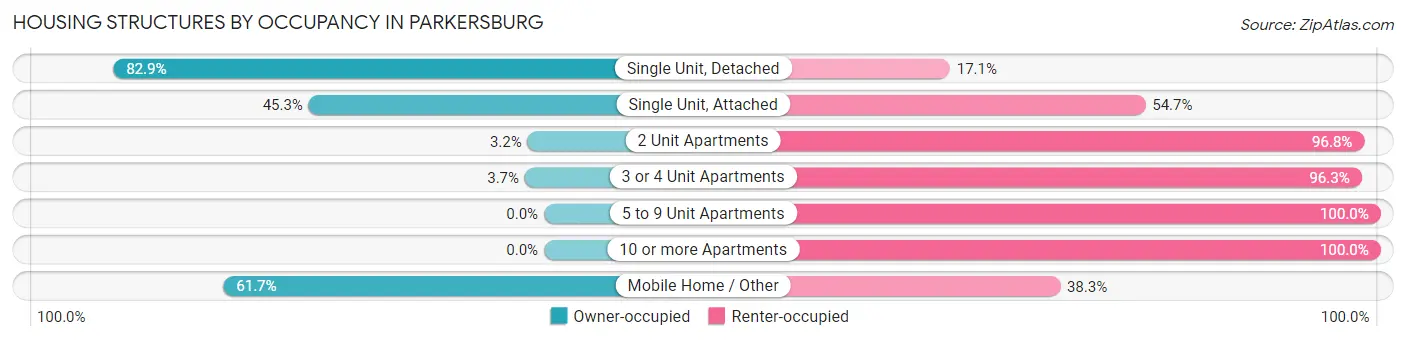
| Structure Type | Owner-occupied | Renter-occupied |
| Single Unit, Detached | 8,323 (82.9%) | 1,713 (17.1%) |
| Single Unit, Attached | 53 (45.3%) | 64 (54.7%) |
| 2 Unit Apartments | 19 (3.2%) | 582 (96.8%) |
| 3 or 4 Unit Apartments | 32 (3.7%) | 837 (96.3%) |
| 5 to 9 Unit Apartments | 0 (0.0%) | 371 (100.0%) |
| 10 or more Apartments | 0 (0.0%) | 1,180 (100.0%) |
| Mobile Home / Other | 79 (61.7%) | 49 (38.3%) |
| Total | 8,506 (63.9%) | 4,796 (36.0%) |
Housing Structures by Number of Rooms in Parkersburg
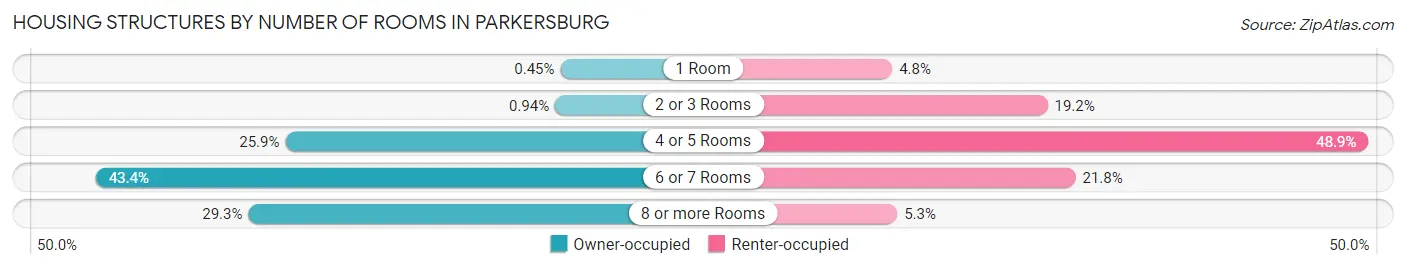
| Number of Rooms | Owner-occupied | Renter-occupied |
| 1 Room | 38 (0.4%) | 232 (4.8%) |
| 2 or 3 Rooms | 80 (0.9%) | 921 (19.2%) |
| 4 or 5 Rooms | 2,202 (25.9%) | 2,344 (48.9%) |
| 6 or 7 Rooms | 3,693 (43.4%) | 1,045 (21.8%) |
| 8 or more Rooms | 2,493 (29.3%) | 254 (5.3%) |
| Total | 8,506 (100.0%) | 4,796 (100.0%) |
Housing Structure by Heating Type in Parkersburg
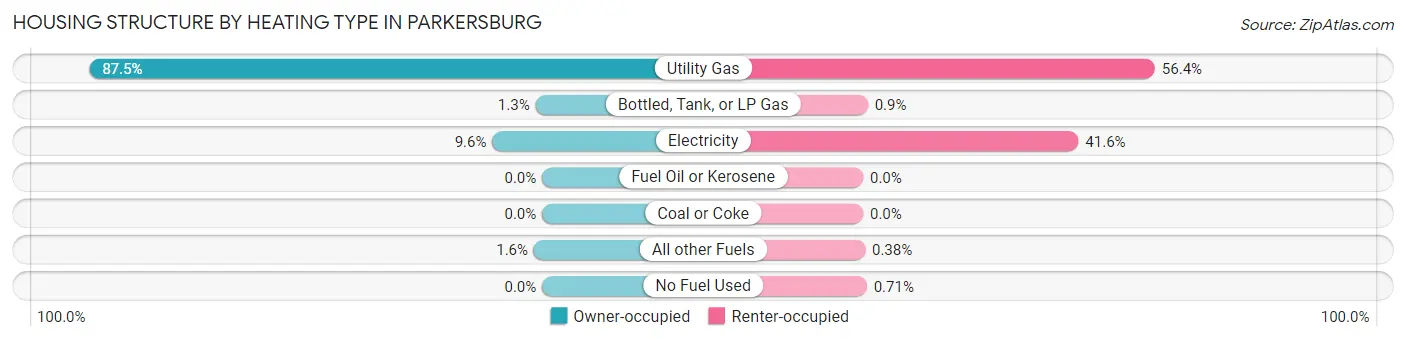
| Heating Type | Owner-occupied | Renter-occupied |
| Utility Gas | 7,444 (87.5%) | 2,705 (56.4%) |
| Bottled, Tank, or LP Gas | 109 (1.3%) | 43 (0.9%) |
| Electricity | 818 (9.6%) | 1,996 (41.6%) |
| Fuel Oil or Kerosene | 0 (0.0%) | 0 (0.0%) |
| Coal or Coke | 0 (0.0%) | 0 (0.0%) |
| All other Fuels | 135 (1.6%) | 18 (0.4%) |
| No Fuel Used | 0 (0.0%) | 34 (0.7%) |
| Total | 8,506 (100.0%) | 4,796 (100.0%) |
Household Vehicle Usage in Parkersburg
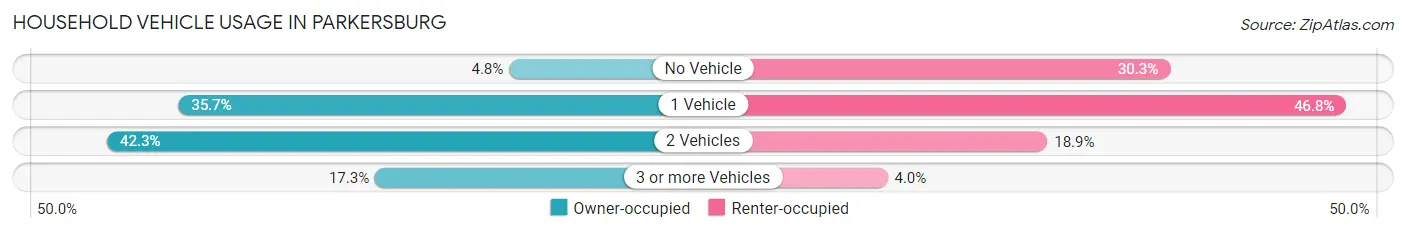
| Vehicles per Household | Owner-occupied | Renter-occupied |
| No Vehicle | 406 (4.8%) | 1,455 (30.3%) |
| 1 Vehicle | 3,032 (35.6%) | 2,244 (46.8%) |
| 2 Vehicles | 3,597 (42.3%) | 906 (18.9%) |
| 3 or more Vehicles | 1,471 (17.3%) | 191 (4.0%) |
| Total | 8,506 (100.0%) | 4,796 (100.0%) |
Real Estate & Mortgages in Parkersburg
Real Estate and Mortgage Overview in Parkersburg
| Characteristic | Without Mortgage | With Mortgage |
| Housing Units | 4,184 | 4,322 |
| Median Property Value | $96,700 | $109,800 |
| Median Household Income | $39,752 | $427 |
| Monthly Housing Costs | $329 | $79 |
| Real Estate Taxes | $699 | $170 |
Property Value by Mortgage Status in Parkersburg
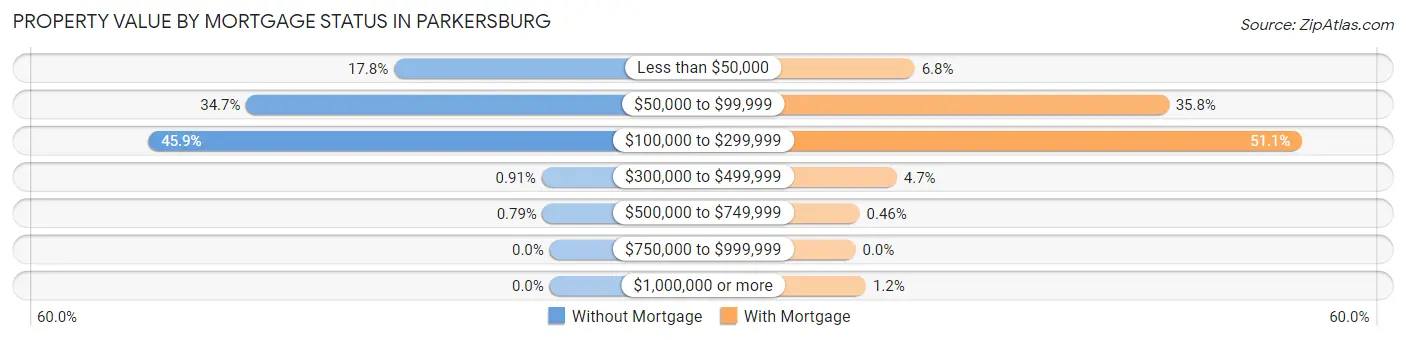
| Property Value | Without Mortgage | With Mortgage |
| Less than $50,000 | 744 (17.8%) | 292 (6.8%) |
| $50,000 to $99,999 | 1,450 (34.7%) | 1,547 (35.8%) |
| $100,000 to $299,999 | 1,919 (45.9%) | 2,207 (51.1%) |
| $300,000 to $499,999 | 38 (0.9%) | 204 (4.7%) |
| $500,000 to $749,999 | 33 (0.8%) | 20 (0.5%) |
| $750,000 to $999,999 | 0 (0.0%) | 0 (0.0%) |
| $1,000,000 or more | 0 (0.0%) | 52 (1.2%) |
| Total | 4,184 (100.0%) | 4,322 (100.0%) |
Household Income by Mortgage Status in Parkersburg
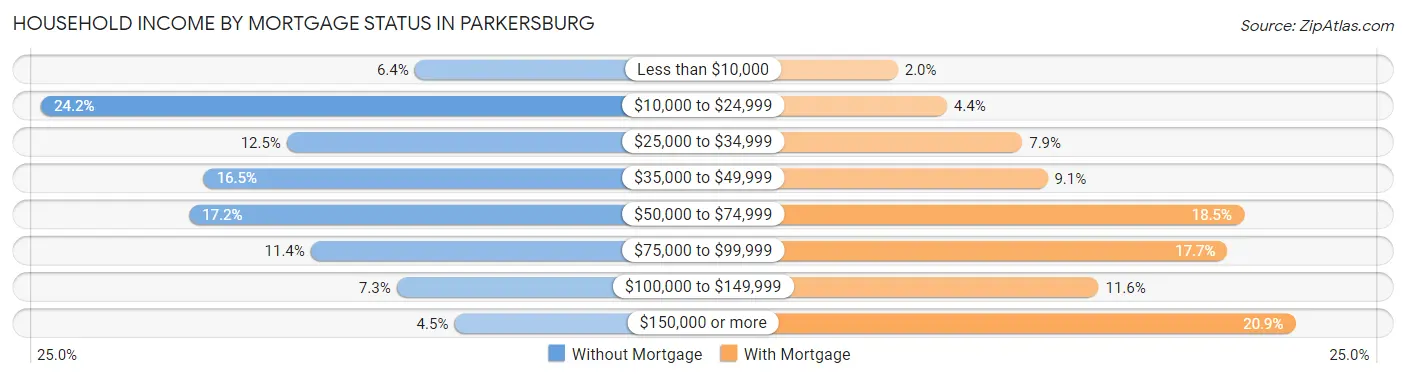
| Household Income | Without Mortgage | With Mortgage |
| Less than $10,000 | 269 (6.4%) | 87 (2.0%) |
| $10,000 to $24,999 | 1,013 (24.2%) | 188 (4.3%) |
| $25,000 to $34,999 | 524 (12.5%) | 343 (7.9%) |
| $35,000 to $49,999 | 689 (16.5%) | 395 (9.1%) |
| $50,000 to $74,999 | 718 (17.2%) | 799 (18.5%) |
| $75,000 to $99,999 | 476 (11.4%) | 765 (17.7%) |
| $100,000 to $149,999 | 305 (7.3%) | 500 (11.6%) |
| $150,000 or more | 190 (4.5%) | 905 (20.9%) |
| Total | 4,184 (100.0%) | 4,322 (100.0%) |
Property Value to Household Income Ratio in Parkersburg
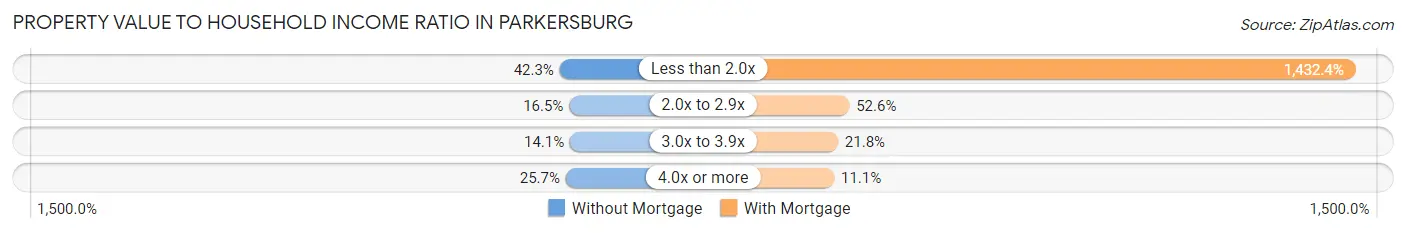
| Value-to-Income Ratio | Without Mortgage | With Mortgage |
| Less than 2.0x | 1,768 (42.3%) | 61,906 (1,432.3%) |
| 2.0x to 2.9x | 689 (16.5%) | 2,272 (52.6%) |
| 3.0x to 3.9x | 591 (14.1%) | 941 (21.8%) |
| 4.0x or more | 1,077 (25.7%) | 481 (11.1%) |
| Total | 4,184 (100.0%) | 4,322 (100.0%) |
Real Estate Taxes by Mortgage Status in Parkersburg
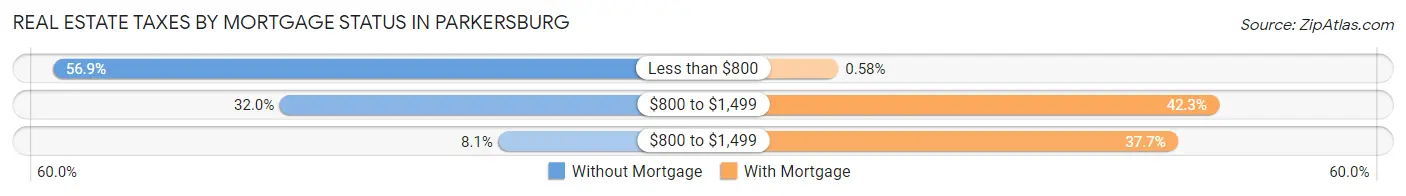
| Property Taxes | Without Mortgage | With Mortgage |
| Less than $800 | 2,381 (56.9%) | 25 (0.6%) |
| $800 to $1,499 | 1,339 (32.0%) | 1,827 (42.3%) |
| $800 to $1,499 | 337 (8.1%) | 1,631 (37.7%) |
| Total | 4,184 (100.0%) | 4,322 (100.0%) |
Health & Disability in Parkersburg
Health Insurance Coverage by Age in Parkersburg
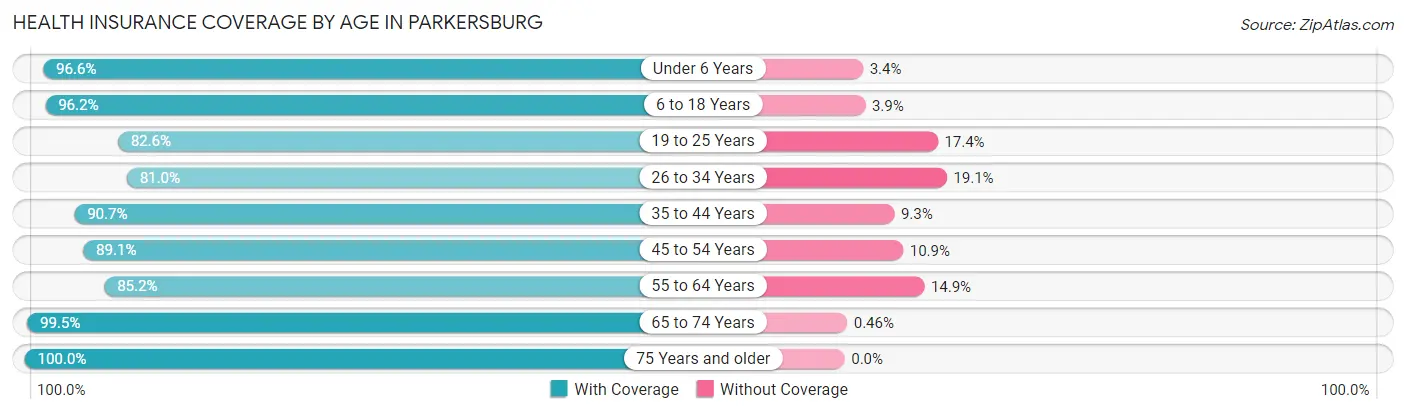
| Age Bracket | With Coverage | Without Coverage |
| Under 6 Years | 1,712 (96.6%) | 61 (3.4%) |
| 6 to 18 Years | 4,516 (96.2%) | 181 (3.8%) |
| 19 to 25 Years | 1,898 (82.6%) | 399 (17.4%) |
| 26 to 34 Years | 2,682 (80.9%) | 631 (19.1%) |
| 35 to 44 Years | 3,274 (90.7%) | 334 (9.3%) |
| 45 to 54 Years | 3,137 (89.1%) | 384 (10.9%) |
| 55 to 64 Years | 3,435 (85.2%) | 599 (14.8%) |
| 65 to 74 Years | 3,647 (99.5%) | 17 (0.5%) |
| 75 Years and older | 2,508 (100.0%) | 0 (0.0%) |
| Total | 26,809 (91.1%) | 2,606 (8.9%) |
Health Insurance Coverage by Citizenship Status in Parkersburg
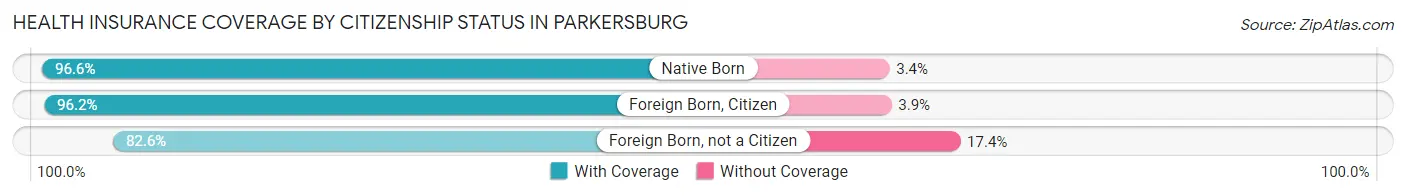
| Citizenship Status | With Coverage | Without Coverage |
| Native Born | 1,712 (96.6%) | 61 (3.4%) |
| Foreign Born, Citizen | 4,516 (96.2%) | 181 (3.8%) |
| Foreign Born, not a Citizen | 1,898 (82.6%) | 399 (17.4%) |
Health Insurance Coverage by Household Income in Parkersburg
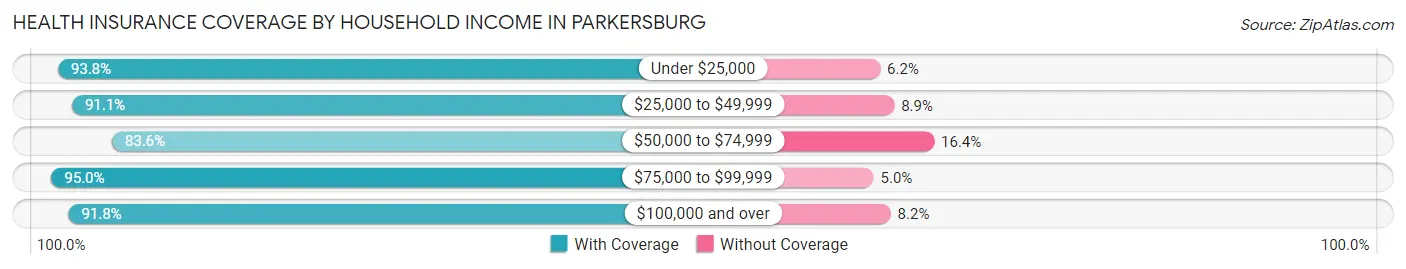
| Household Income | With Coverage | Without Coverage |
| Under $25,000 | 6,732 (93.8%) | 448 (6.2%) |
| $25,000 to $49,999 | 7,210 (91.1%) | 703 (8.9%) |
| $50,000 to $74,999 | 4,023 (83.6%) | 787 (16.4%) |
| $75,000 to $99,999 | 3,276 (95.0%) | 173 (5.0%) |
| $100,000 and over | 5,405 (91.8%) | 484 (8.2%) |
Public vs Private Health Insurance Coverage by Age in Parkersburg
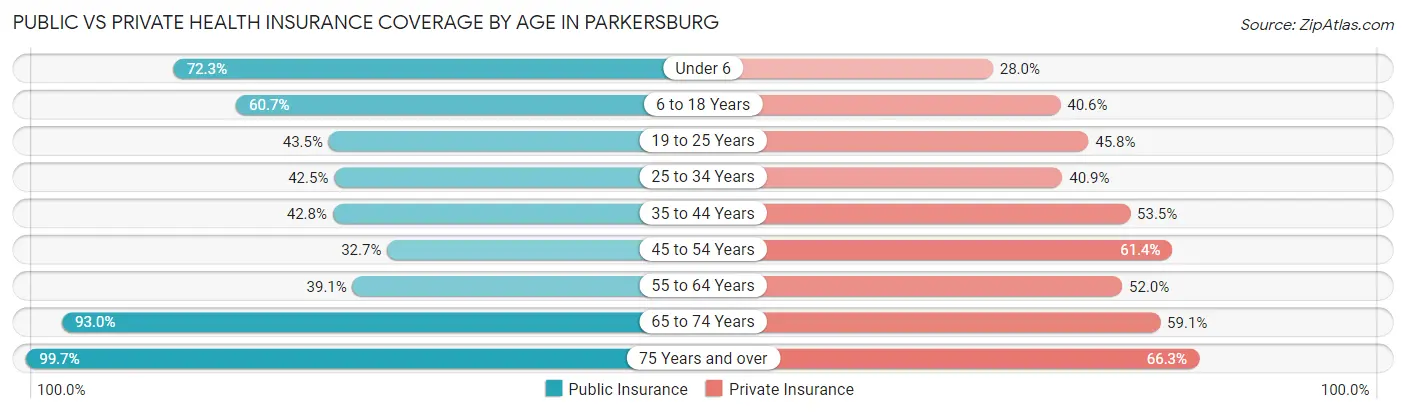
| Age Bracket | Public Insurance | Private Insurance |
| Under 6 | 1,282 (72.3%) | 497 (28.0%) |
| 6 to 18 Years | 2,852 (60.7%) | 1,905 (40.6%) |
| 19 to 25 Years | 1,000 (43.5%) | 1,051 (45.8%) |
| 25 to 34 Years | 1,409 (42.5%) | 1,356 (40.9%) |
| 35 to 44 Years | 1,544 (42.8%) | 1,931 (53.5%) |
| 45 to 54 Years | 1,151 (32.7%) | 2,160 (61.4%) |
| 55 to 64 Years | 1,578 (39.1%) | 2,099 (52.0%) |
| 65 to 74 Years | 3,409 (93.0%) | 2,165 (59.1%) |
| 75 Years and over | 2,500 (99.7%) | 1,662 (66.3%) |
| Total | 16,725 (56.9%) | 14,826 (50.4%) |
Disability Status by Sex by Age in Parkersburg
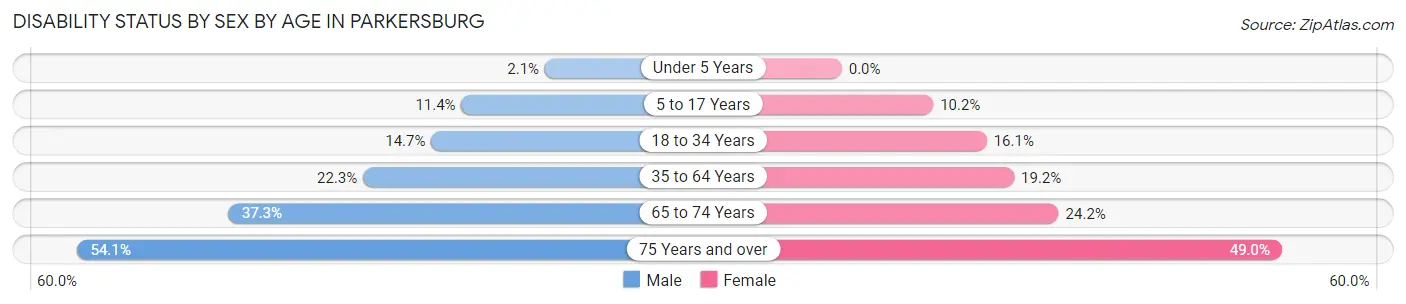
| Age Bracket | Male | Female |
| Under 5 Years | 15 (2.1%) | 0 (0.0%) |
| 5 to 17 Years | 285 (11.4%) | 211 (10.2%) |
| 18 to 34 Years | 453 (14.7%) | 476 (16.1%) |
| 35 to 64 Years | 1,270 (22.3%) | 1,050 (19.2%) |
| 65 to 74 Years | 640 (37.2%) | 470 (24.1%) |
| 75 Years and over | 521 (54.1%) | 757 (49.0%) |
Disability Class by Sex by Age in Parkersburg
Disability Class: Hearing Difficulty
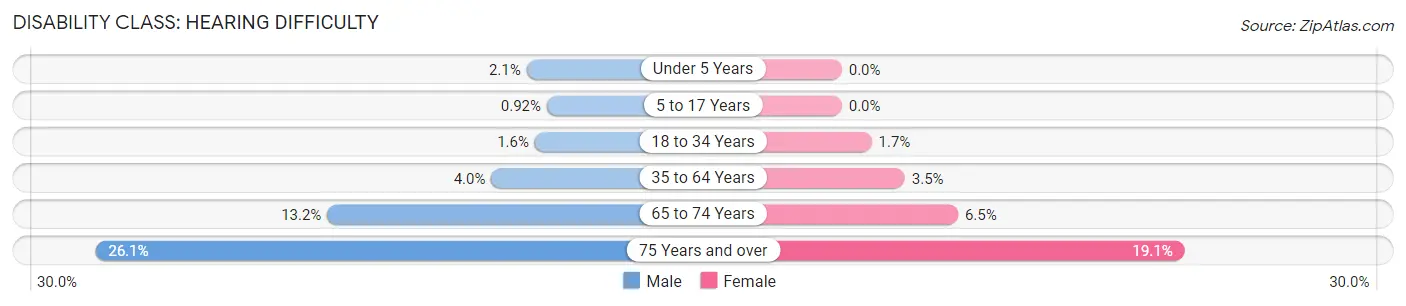
| Age Bracket | Male | Female |
| Under 5 Years | 15 (2.1%) | 0 (0.0%) |
| 5 to 17 Years | 23 (0.9%) | 0 (0.0%) |
| 18 to 34 Years | 49 (1.6%) | 49 (1.7%) |
| 35 to 64 Years | 228 (4.0%) | 192 (3.5%) |
| 65 to 74 Years | 226 (13.2%) | 126 (6.5%) |
| 75 Years and over | 251 (26.1%) | 295 (19.1%) |
Disability Class: Vision Difficulty
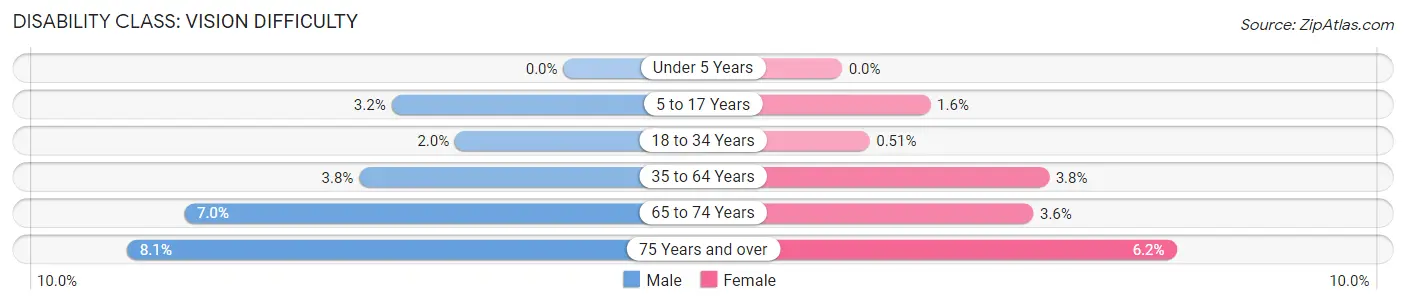
| Age Bracket | Male | Female |
| Under 5 Years | 0 (0.0%) | 0 (0.0%) |
| 5 to 17 Years | 80 (3.2%) | 34 (1.6%) |
| 18 to 34 Years | 62 (2.0%) | 15 (0.5%) |
| 35 to 64 Years | 216 (3.8%) | 210 (3.8%) |
| 65 to 74 Years | 121 (7.0%) | 69 (3.5%) |
| 75 Years and over | 78 (8.1%) | 96 (6.2%) |
Disability Class: Cognitive Difficulty
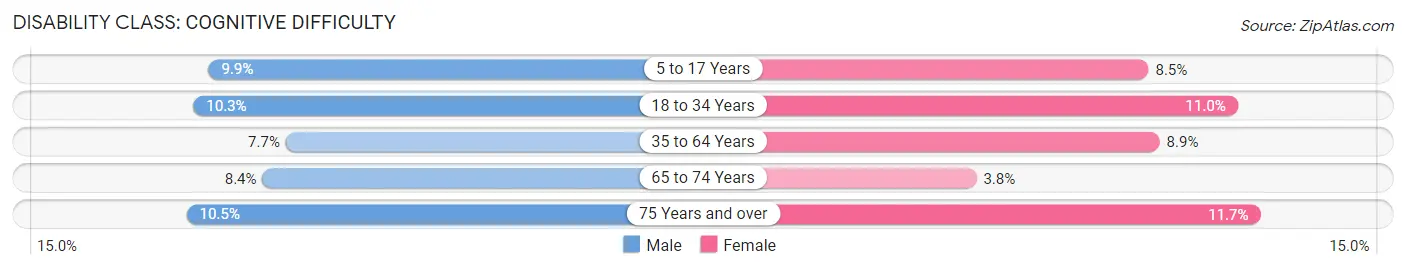
| Age Bracket | Male | Female |
| 5 to 17 Years | 248 (9.9%) | 177 (8.5%) |
| 18 to 34 Years | 317 (10.3%) | 325 (11.0%) |
| 35 to 64 Years | 440 (7.7%) | 484 (8.8%) |
| 65 to 74 Years | 144 (8.4%) | 73 (3.7%) |
| 75 Years and over | 101 (10.5%) | 180 (11.7%) |
Disability Class: Ambulatory Difficulty
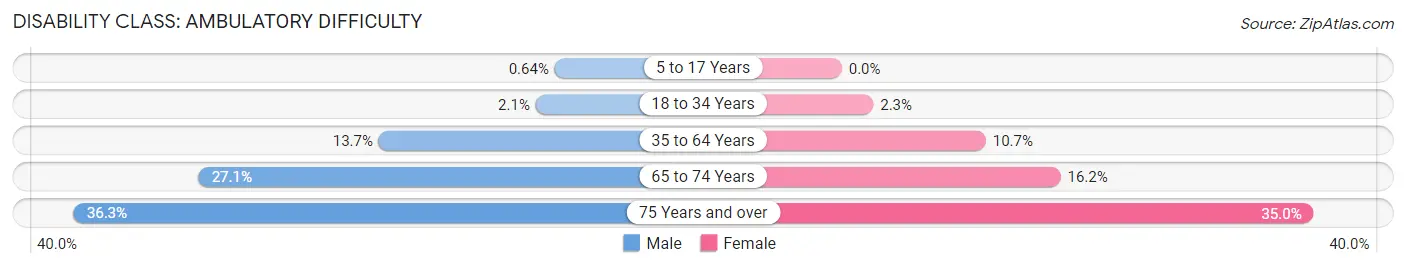
| Age Bracket | Male | Female |
| 5 to 17 Years | 16 (0.6%) | 0 (0.0%) |
| 18 to 34 Years | 63 (2.1%) | 69 (2.3%) |
| 35 to 64 Years | 780 (13.7%) | 585 (10.7%) |
| 65 to 74 Years | 465 (27.1%) | 316 (16.2%) |
| 75 Years and over | 350 (36.3%) | 541 (35.0%) |
Disability Class: Self-Care Difficulty
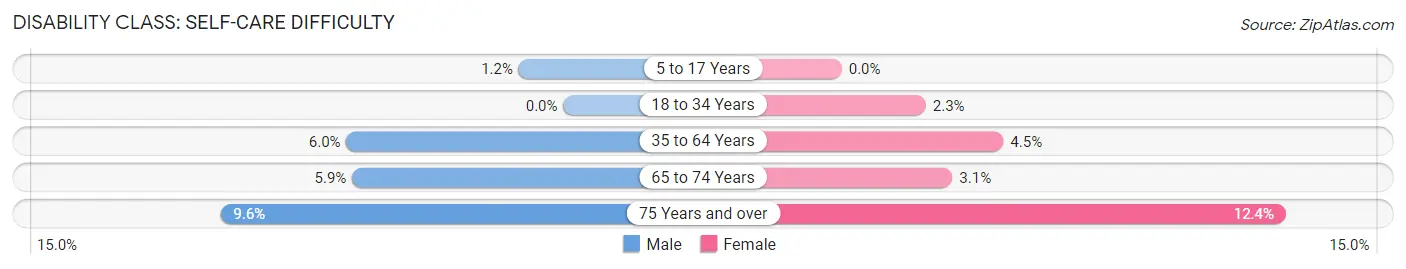
| Age Bracket | Male | Female |
| 5 to 17 Years | 31 (1.2%) | 0 (0.0%) |
| 18 to 34 Years | 0 (0.0%) | 69 (2.3%) |
| 35 to 64 Years | 344 (6.0%) | 246 (4.5%) |
| 65 to 74 Years | 101 (5.9%) | 60 (3.1%) |
| 75 Years and over | 92 (9.6%) | 191 (12.4%) |
Technology Access in Parkersburg
Computing Device Access in Parkersburg
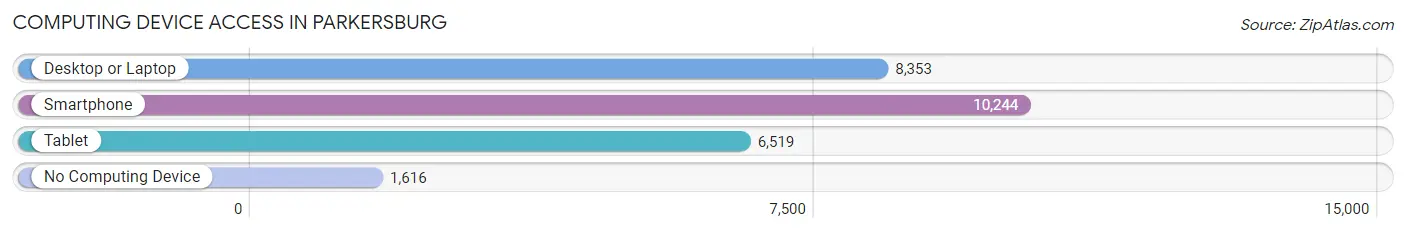
| Device Type | # Households | % Households |
| Desktop or Laptop | 8,353 | 62.8% |
| Smartphone | 10,244 | 77.0% |
| Tablet | 6,519 | 49.0% |
| No Computing Device | 1,616 | 12.1% |
| Total | 13,302 | 100.0% |
Internet Access in Parkersburg
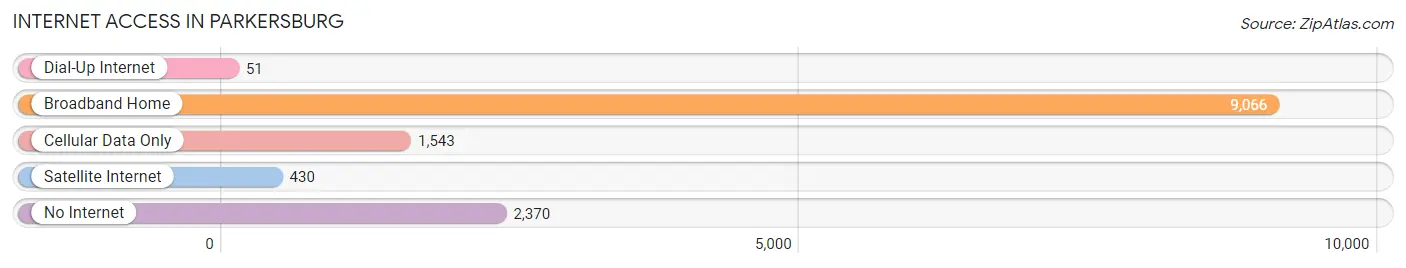
| Internet Type | # Households | % Households |
| Dial-Up Internet | 51 | 0.4% |
| Broadband Home | 9,066 | 68.2% |
| Cellular Data Only | 1,543 | 11.6% |
| Satellite Internet | 430 | 3.2% |
| No Internet | 2,370 | 17.8% |
| Total | 13,302 | 100.0% |
Parkersburg Summary
Parkersburg, West Virginia is a city located in Wood County, West Virginia, United States. It is the county seat of Wood County and the state’s third-largest city. The population was 31,492 at the 2010 census. Parkersburg is located along the Ohio River in the foothills of the Appalachian Mountains.
History
Parkersburg was founded in 1810 by European-American settlers. The town was named after Alexander Parker, a settler who had been killed by Native Americans in the area. The town was incorporated in 1820 and became the county seat of Wood County in 1824.
During the Civil War, Parkersburg was a major supply center for the Confederate Army. It was also the site of several battles, including the Battle of Parkersburg in 1863. After the war, the town experienced a period of growth and prosperity.
In the late 19th century, Parkersburg became a major center for the oil and gas industry. The city was home to several oil refineries and gas processing plants. The city also became a major transportation hub, with the completion of the Baltimore and Ohio Railroad in 1857.
Geography
Parkersburg is located at 39°15′N 81°27′W (39.25, -81.45). According to the United States Census Bureau, the city has a total area of 10.2 square miles (26.4 km2), of which 10.1 square miles (26.2 km2) is land and 0.1 square miles (0.2 km2) is water.
The city is located along the Ohio River, which forms the border between West Virginia and Ohio. The Little Kanawha River also flows through the city.
Economy
Parkersburg’s economy is largely based on the oil and gas industry. The city is home to several oil refineries and gas processing plants. The city is also a major transportation hub, with the completion of the Baltimore and Ohio Railroad in 1857.
The city is also home to several manufacturing companies, including the Parkersburg Steel Company, which produces steel products. The city is also home to several retail stores, restaurants, and other businesses.
Demographics
As of the 2010 census, there were 31,492 people, 12,845 households, and 8,072 families residing in the city. The population density was 3,098.3 people per square mile (1,196.2/km2). There were 14,068 housing units at an average density of 1,387.3 per square mile (535.3/km2).
The racial makeup of the city was 92.2% White, 4.3% African American, 0.2% Native American, 0.7% Asian, 0.1% Pacific Islander, 0.7% from other races, and 1.9% from two or more races. Hispanic or Latino of any race were 1.9% of the population.
The median income for a household in the city was $30,945, and the median income for a family was $41,845. Males had a median income of $31,945 versus $22,945 for females. The per capita income for the city was $17,945. About 11.2% of families and 14.3% of the population were below the poverty line, including 19.2% of those under age 18 and 10.2% of those age 65 or over.
Common Questions
What is Per Capita Income in Parkersburg?
Per Capita income in Parkersburg is $27,017.
What is the Median Family Income in Parkersburg?
Median Family Income in Parkersburg is $56,196.
What is the Median Household income in Parkersburg?
Median Household Income in Parkersburg is $41,921.
What is Income or Wage Gap in Parkersburg?
Income or Wage Gap in Parkersburg is 18.8%.
Women in Parkersburg earn 81.2 cents for every dollar earned by a man.
What is Family Income Deficit in Parkersburg?
Family Income Deficit in Parkersburg is $9,876.
Families that are below poverty line in Parkersburg earn $9,876 less on average than the poverty threshold level.
What is Inequality or Gini Index in Parkersburg?
Inequality or Gini Index in Parkersburg is 0.47.
What is the Total Population of Parkersburg?
Total Population of Parkersburg is 29,685.
What is the Total Male Population of Parkersburg?
Total Male Population of Parkersburg is 14,801.
What is the Total Female Population of Parkersburg?
Total Female Population of Parkersburg is 14,884.
What is the Ratio of Males per 100 Females in Parkersburg?
There are 99.44 Males per 100 Females in Parkersburg.
What is the Ratio of Females per 100 Males in Parkersburg?
There are 100.56 Females per 100 Males in Parkersburg.
What is the Median Population Age in Parkersburg?
Median Population Age in Parkersburg is 42.0 Years.
What is the Average Family Size in Parkersburg
Average Family Size in Parkersburg is 3.0 People.
What is the Average Household Size in Parkersburg
Average Household Size in Parkersburg is 2.2 People.
How Large is the Labor Force in Parkersburg?
There are 12,879 People in the Labor Forcein in Parkersburg.
What is the Percentage of People in the Labor Force in Parkersburg?
52.6% of People are in the Labor Force in Parkersburg.
What is the Unemployment Rate in Parkersburg?
Unemployment Rate in Parkersburg is 6.9%.