Fairmont, WV Map & Demographics
Fairmont Map
Fairmont Overview
$29,445
PER CAPITA INCOME
$74,850
AVG FAMILY INCOME
$55,084
AVG HOUSEHOLD INCOME
21.5%
WAGE / INCOME GAP [ % ]
78.5¢/ $1
WAGE / INCOME GAP [ $ ]
$10,283
FAMILY INCOME DEFICIT
0.44
INEQUALITY / GINI INDEX
18,402
TOTAL POPULATION
9,167
MALE POPULATION
9,235
FEMALE POPULATION
99.26
MALES / 100 FEMALES
100.74
FEMALES / 100 MALES
35.2
MEDIAN AGE
2.9
AVG FAMILY SIZE
2.2
AVG HOUSEHOLD SIZE
9,522
LABOR FORCE [ PEOPLE ]
62.2%
PERCENT IN LABOR FORCE
7.9%
UNEMPLOYMENT RATE
Fairmont Zip Codes
Income in Fairmont
Income Overview in Fairmont
Per Capita Income in Fairmont is $29,445, while median incomes of families and households are $74,850 and $55,084 respectively.
| Characteristic | Number | Measure |
| Per Capita Income | 18,402 | $29,445 |
| Median Family Income | 4,241 | $74,850 |
| Mean Family Income | 4,241 | $82,291 |
| Median Household Income | 7,855 | $55,084 |
| Mean Household Income | 7,855 | $66,938 |
| Income Deficit | 4,241 | $10,283 |
| Wage / Income Gap (%) | 18,402 | 21.54% |
| Wage / Income Gap ($) | 18,402 | 78.46¢ per $1 |
| Gini / Inequality Index | 18,402 | 0.44 |
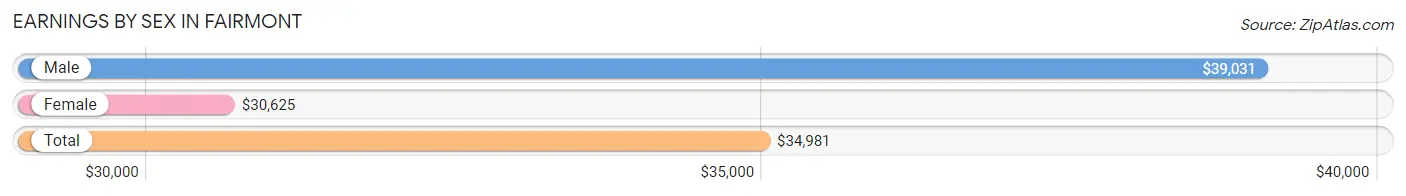
Earnings by Sex in Fairmont
Average Earnings in Fairmont are $34,981, $39,031 for men and $30,625 for women, a difference of 21.5%.
| Sex | Number | Average Earnings |
| Male | 4,944 (50.6%) | $39,031 |
| Female | 4,823 (49.4%) | $30,625 |
| Total | 9,767 (100.0%) | $34,981 |
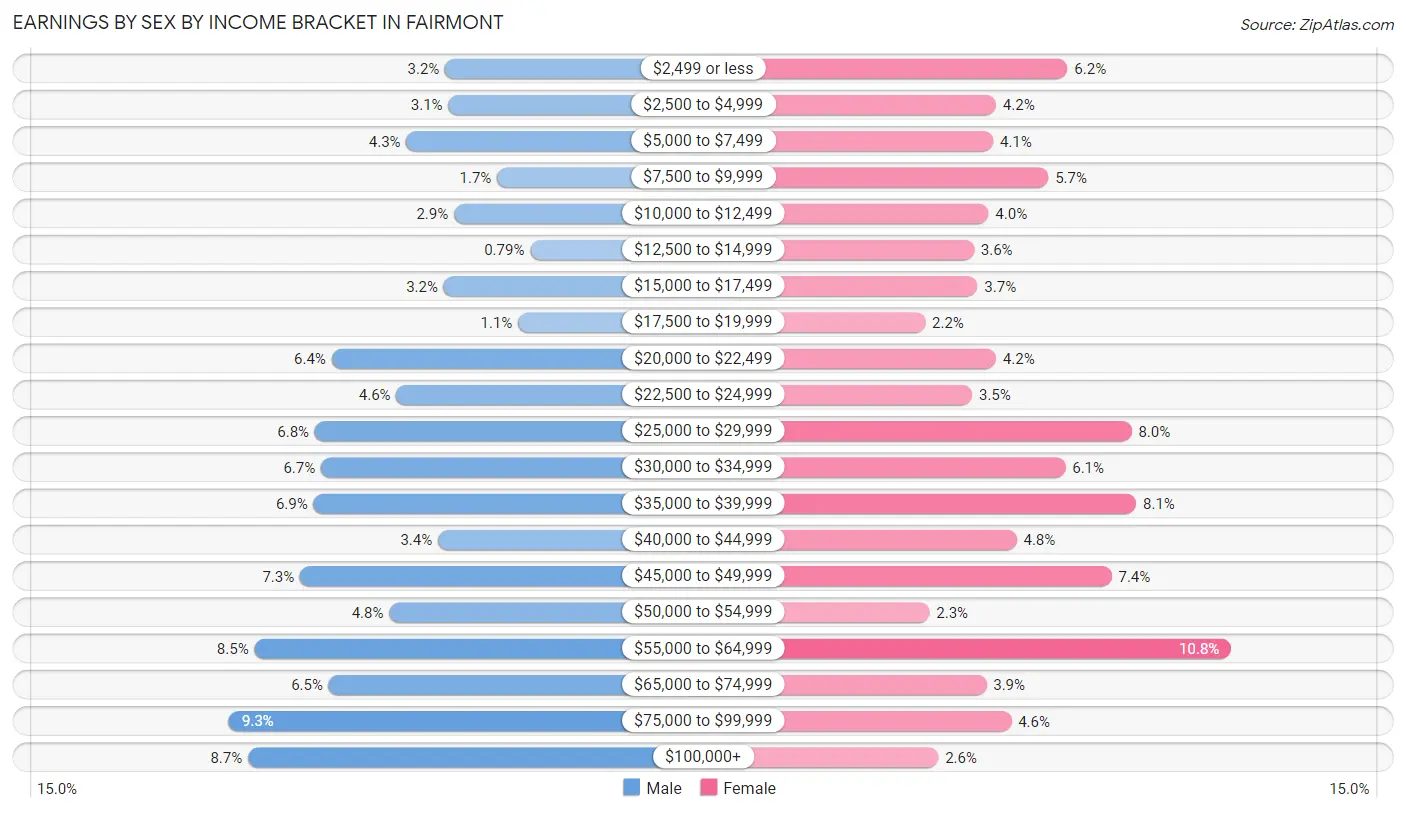
Earnings by Sex by Income Bracket in Fairmont
The most common earnings brackets in Fairmont are $75,000 to $99,999 for men (458 | 9.3%) and $55,000 to $64,999 for women (521 | 10.8%).
| Income | Male | Female |
| $2,499 or less | 157 (3.2%) | 299 (6.2%) |
| $2,500 to $4,999 | 153 (3.1%) | 202 (4.2%) |
| $5,000 to $7,499 | 211 (4.3%) | 198 (4.1%) |
| $7,500 to $9,999 | 85 (1.7%) | 273 (5.7%) |
| $10,000 to $12,499 | 145 (2.9%) | 192 (4.0%) |
| $12,500 to $14,999 | 39 (0.8%) | 172 (3.6%) |
| $15,000 to $17,499 | 159 (3.2%) | 177 (3.7%) |
| $17,500 to $19,999 | 56 (1.1%) | 106 (2.2%) |
| $20,000 to $22,499 | 315 (6.4%) | 202 (4.2%) |
| $22,500 to $24,999 | 225 (4.5%) | 170 (3.5%) |
| $25,000 to $29,999 | 338 (6.8%) | 386 (8.0%) |
| $30,000 to $34,999 | 330 (6.7%) | 296 (6.1%) |
| $35,000 to $39,999 | 340 (6.9%) | 392 (8.1%) |
| $40,000 to $44,999 | 167 (3.4%) | 230 (4.8%) |
| $45,000 to $49,999 | 359 (7.3%) | 359 (7.4%) |
| $50,000 to $54,999 | 235 (4.8%) | 112 (2.3%) |
| $55,000 to $64,999 | 422 (8.5%) | 521 (10.8%) |
| $65,000 to $74,999 | 319 (6.5%) | 189 (3.9%) |
| $75,000 to $99,999 | 458 (9.3%) | 223 (4.6%) |
| $100,000+ | 431 (8.7%) | 124 (2.6%) |
| Total | 4,944 (100.0%) | 4,823 (100.0%) |
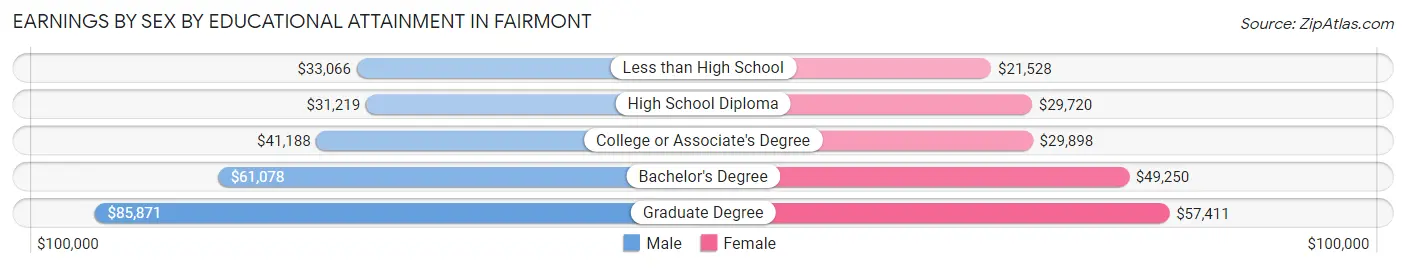
Earnings by Sex by Educational Attainment in Fairmont
Average earnings in Fairmont are $44,896 for men and $37,461 for women, a difference of 16.6%. Men with an educational attainment of graduate degree enjoy the highest average annual earnings of $85,871, while those with high school diploma education earn the least with $31,219. Women with an educational attainment of graduate degree earn the most with the average annual earnings of $57,411, while those with less than high school education have the smallest earnings of $21,528.
| Educational Attainment | Male Income | Female Income |
| Less than High School | $33,066 | $21,528 |
| High School Diploma | $31,219 | $29,720 |
| College or Associate's Degree | $41,188 | $29,898 |
| Bachelor's Degree | $61,078 | $49,250 |
| Graduate Degree | $85,871 | $57,411 |
| Total | $44,896 | $37,461 |
Family Income in Fairmont
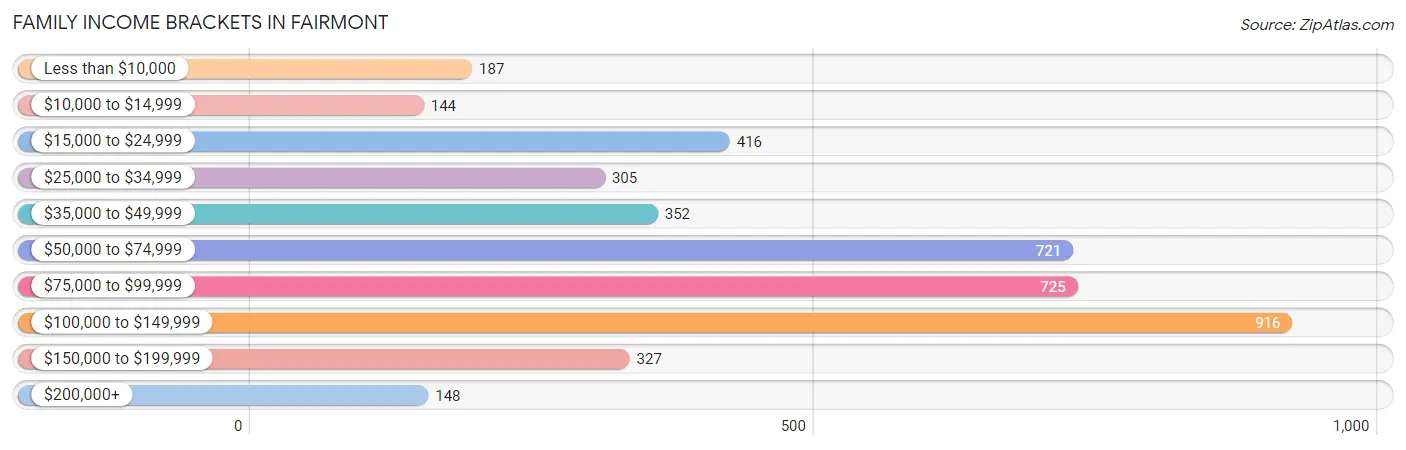
Family Income Brackets in Fairmont
According to the Fairmont family income data, there are 916 families falling into the $100,000 to $149,999 income range, which is the most common income bracket and makes up 21.6% of all families. Conversely, the $10,000 to $14,999 income bracket is the least frequent group with only 144 families (3.4%) belonging to this category.
| Income Bracket | # Families | % Families |
| Less than $10,000 | 187 | 4.4% |
| $10,000 to $14,999 | 144 | 3.4% |
| $15,000 to $24,999 | 416 | 9.8% |
| $25,000 to $34,999 | 305 | 7.2% |
| $35,000 to $49,999 | 352 | 8.3% |
| $50,000 to $74,999 | 721 | 17.0% |
| $75,000 to $99,999 | 725 | 17.1% |
| $100,000 to $149,999 | 916 | 21.6% |
| $150,000 to $199,999 | 327 | 7.7% |
| $200,000+ | 148 | 3.5% |
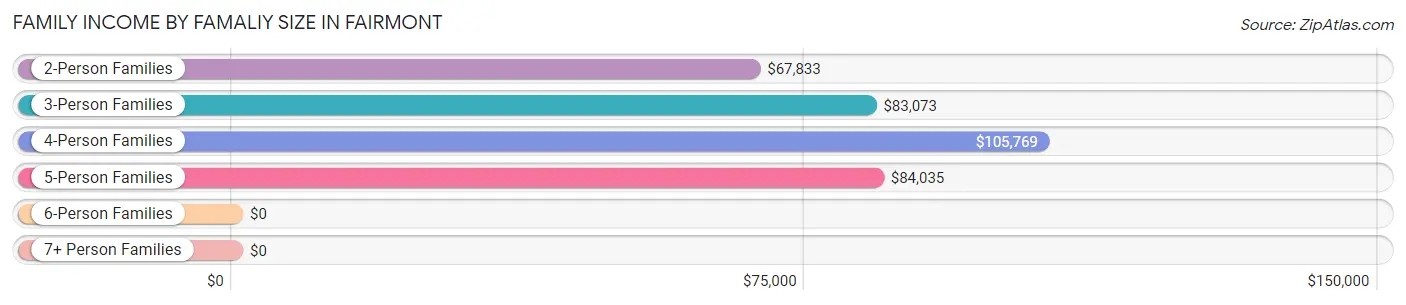
Family Income by Famaliy Size in Fairmont
4-person families (484 | 11.4%) account for the highest median family income in Fairmont with $105,769 per family, while 2-person families (2,226 | 52.5%) have the highest median income of $33,916 per family member.
| Income Bracket | # Families | Median Income |
| 2-Person Families | 2,226 (52.5%) | $67,833 |
| 3-Person Families | 1,141 (26.9%) | $83,073 |
| 4-Person Families | 484 (11.4%) | $105,769 |
| 5-Person Families | 290 (6.8%) | $84,035 |
| 6-Person Families | 86 (2.0%) | $0 |
| 7+ Person Families | 14 (0.3%) | $0 |
| Total | 4,241 (100.0%) | $74,850 |
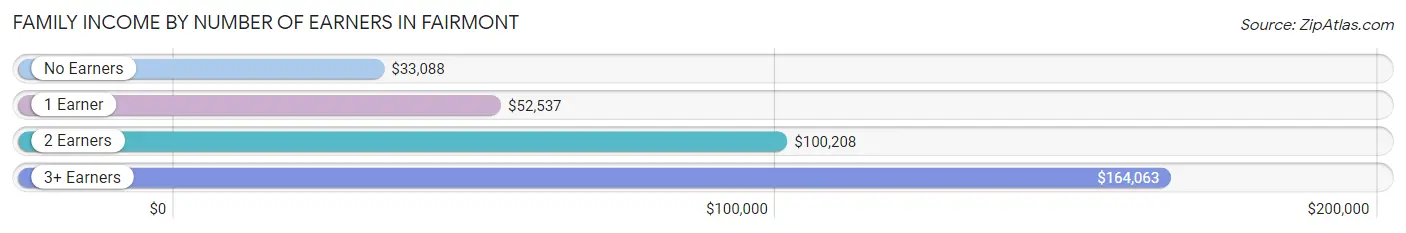
Family Income by Number of Earners in Fairmont
The median family income in Fairmont is $74,850, with families comprising 3+ earners (221) having the highest median family income of $164,063, while families with no earners (736) have the lowest median family income of $33,088, accounting for 5.2% and 17.3% of families, respectively.
| Number of Earners | # Families | Median Income |
| No Earners | 736 (17.3%) | $33,088 |
| 1 Earner | 1,610 (38.0%) | $52,537 |
| 2 Earners | 1,674 (39.5%) | $100,208 |
| 3+ Earners | 221 (5.2%) | $164,063 |
| Total | 4,241 (100.0%) | $74,850 |
Household Income in Fairmont
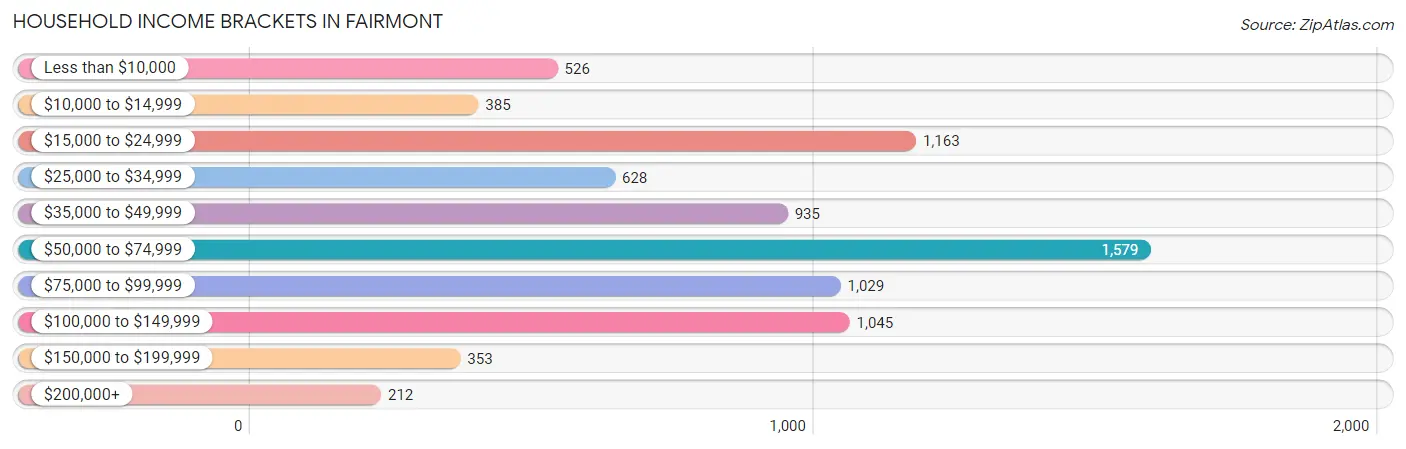
Household Income Brackets in Fairmont
With 1,579 households falling in the category, the $50,000 to $74,999 income range is the most frequent in Fairmont, accounting for 20.1% of all households. In contrast, only 212 households (2.7%) fall into the $200,000+ income bracket, making it the least populous group.
| Income Bracket | # Households | % Households |
| Less than $10,000 | 526 | 6.7% |
| $10,000 to $14,999 | 385 | 4.9% |
| $15,000 to $24,999 | 1,163 | 14.8% |
| $25,000 to $34,999 | 628 | 8.0% |
| $35,000 to $49,999 | 935 | 11.9% |
| $50,000 to $74,999 | 1,579 | 20.1% |
| $75,000 to $99,999 | 1,029 | 13.1% |
| $100,000 to $149,999 | 1,045 | 13.3% |
| $150,000 to $199,999 | 353 | 4.5% |
| $200,000+ | 212 | 2.7% |
Household Income by Householder Age in Fairmont
The median household income in Fairmont is $55,084, with the highest median household income of $63,571 found in the 25 to 44 years age bracket for the primary householder. A total of 2,692 households (34.3%) fall into this category. Meanwhile, the 65+ years age bracket for the primary householder has the lowest median household income of $36,571, with 2,288 households (29.1%) in this group.
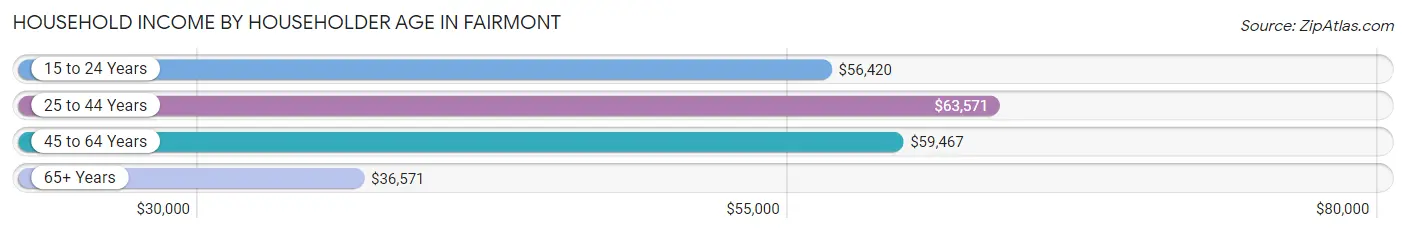
| Income Bracket | # Households | Median Income |
| 15 to 24 Years | 797 (10.2%) | $56,420 |
| 25 to 44 Years | 2,692 (34.3%) | $63,571 |
| 45 to 64 Years | 2,078 (26.5%) | $59,467 |
| 65+ Years | 2,288 (29.1%) | $36,571 |
| Total | 7,855 (100.0%) | $55,084 |
Poverty in Fairmont
Income Below Poverty by Sex and Age in Fairmont
With 19.9% poverty level for males and 20.2% for females among the residents of Fairmont, 5 year old males and 5 year old females are the most vulnerable to poverty, with 27 males (60.0%) and 33 females (66.0%) in their respective age groups living below the poverty level.
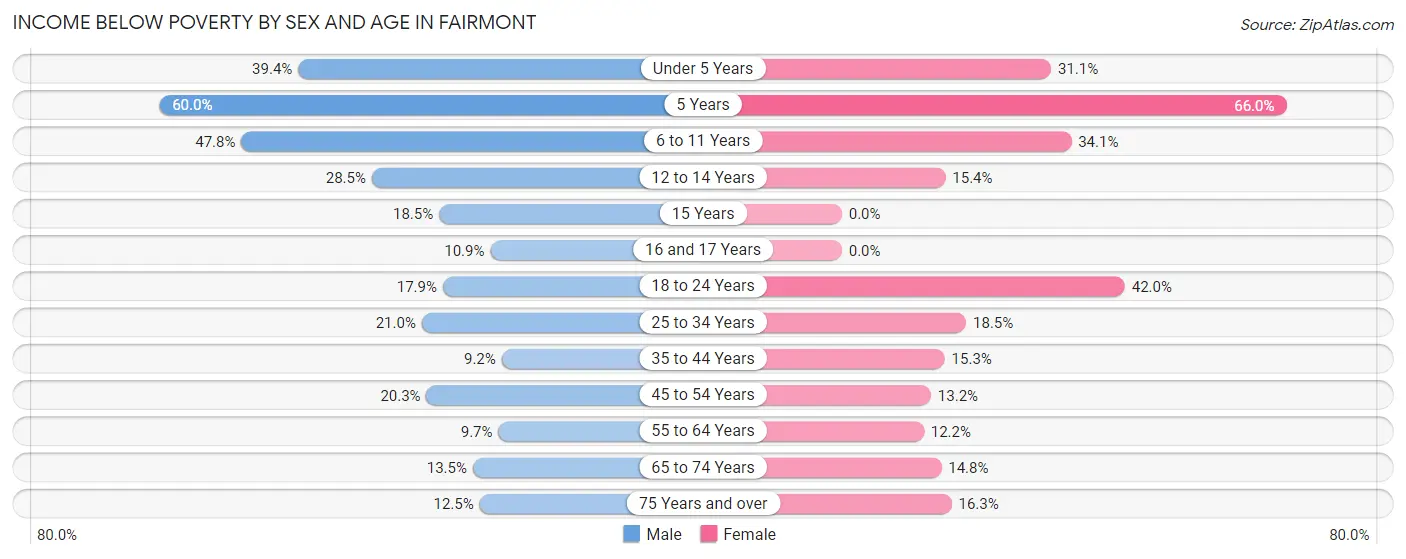
| Age Bracket | Male | Female |
| Under 5 Years | 241 (39.4%) | 142 (31.1%) |
| 5 Years | 27 (60.0%) | 33 (66.0%) |
| 6 to 11 Years | 274 (47.8%) | 139 (34.1%) |
| 12 to 14 Years | 103 (28.4%) | 40 (15.4%) |
| 15 Years | 36 (18.5%) | 0 (0.0%) |
| 16 and 17 Years | 14 (10.8%) | 0 (0.0%) |
| 18 to 24 Years | 208 (17.9%) | 416 (42.0%) |
| 25 to 34 Years | 297 (21.0%) | 282 (18.5%) |
| 35 to 44 Years | 101 (9.2%) | 173 (15.3%) |
| 45 to 54 Years | 186 (20.3%) | 122 (13.2%) |
| 55 to 64 Years | 88 (9.7%) | 125 (12.2%) |
| 65 to 74 Years | 122 (13.5%) | 145 (14.8%) |
| 75 Years and over | 61 (12.4%) | 118 (16.3%) |
| Total | 1,758 (19.9%) | 1,735 (20.2%) |
Income Above Poverty by Sex and Age in Fairmont
According to the poverty statistics in Fairmont, males aged 35 to 44 years and females aged 15 years are the age groups that are most secure financially, with 90.8% of males and 100.0% of females in these age groups living above the poverty line.
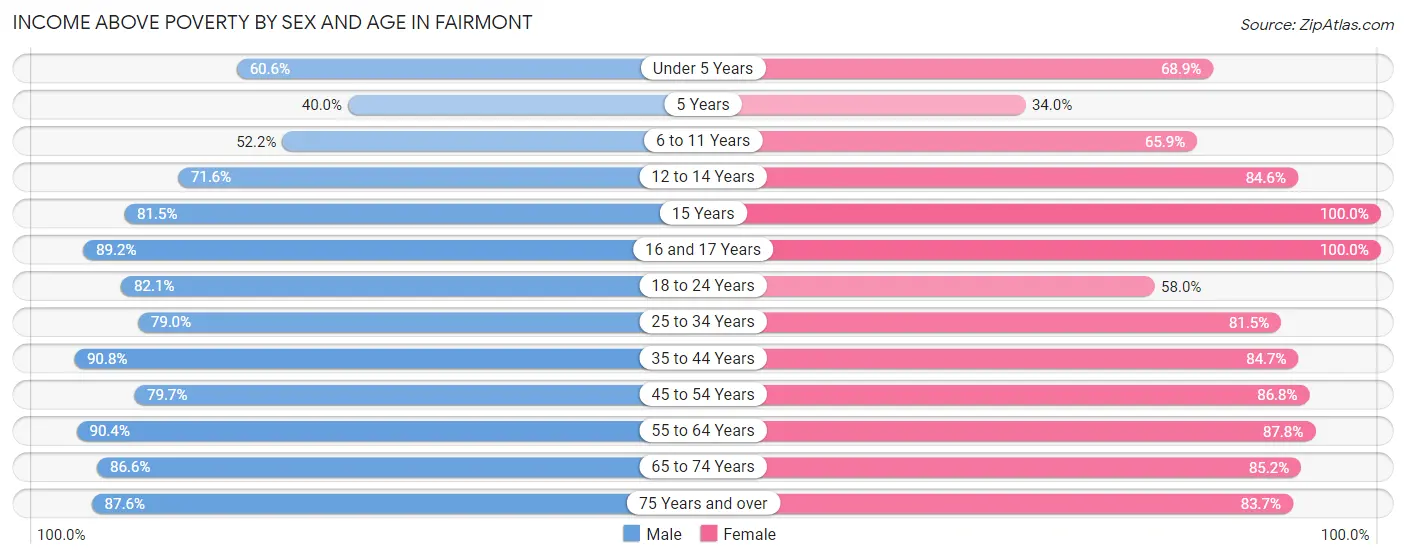
| Age Bracket | Male | Female |
| Under 5 Years | 371 (60.6%) | 315 (68.9%) |
| 5 Years | 18 (40.0%) | 17 (34.0%) |
| 6 to 11 Years | 299 (52.2%) | 269 (65.9%) |
| 12 to 14 Years | 259 (71.6%) | 220 (84.6%) |
| 15 Years | 159 (81.5%) | 60 (100.0%) |
| 16 and 17 Years | 115 (89.1%) | 69 (100.0%) |
| 18 to 24 Years | 954 (82.1%) | 574 (58.0%) |
| 25 to 34 Years | 1,115 (79.0%) | 1,246 (81.5%) |
| 35 to 44 Years | 1,000 (90.8%) | 960 (84.7%) |
| 45 to 54 Years | 729 (79.7%) | 800 (86.8%) |
| 55 to 64 Years | 824 (90.3%) | 902 (87.8%) |
| 65 to 74 Years | 785 (86.6%) | 837 (85.2%) |
| 75 Years and over | 429 (87.5%) | 606 (83.7%) |
| Total | 7,057 (80.1%) | 6,875 (79.8%) |
Income Below Poverty Among Married-Couple Families in Fairmont
The poverty statistics for married-couple families in Fairmont show that 7.7% or 233 of the total 3,030 families live below the poverty line. Families with 5 or more children have the highest poverty rate of 100.0%, comprising of 7 families. On the other hand, families with no children have the lowest poverty rate of 3.6%, which includes 67 families.
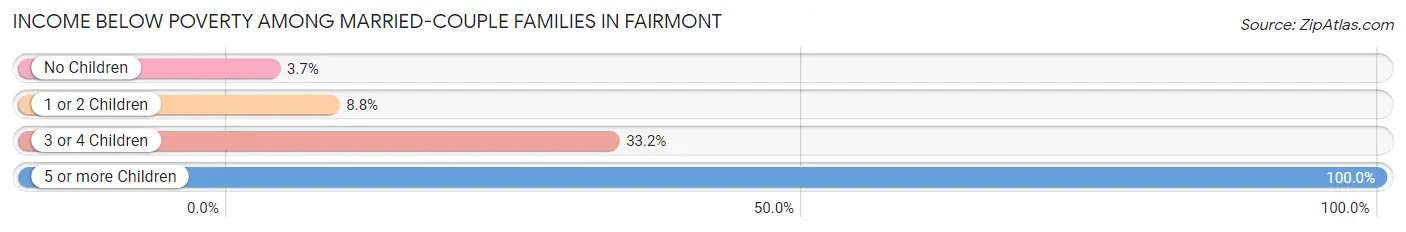
| Children | Above Poverty | Below Poverty |
| No Children | 1,769 (96.4%) | 67 (3.6%) |
| 1 or 2 Children | 879 (91.2%) | 85 (8.8%) |
| 3 or 4 Children | 149 (66.8%) | 74 (33.2%) |
| 5 or more Children | 0 (0.0%) | 7 (100.0%) |
| Total | 2,797 (92.3%) | 233 (7.7%) |
Income Below Poverty Among Single-Parent Households in Fairmont
According to the poverty data in Fairmont, 27.6% or 130 single-father households and 35.4% or 262 single-mother households are living below the poverty line. Among single-father households, those with 3 or 4 children have the highest poverty rate, with 46 households (86.8%) experiencing poverty. Likewise, among single-mother households, those with 5 or more children have the highest poverty rate, with 7 households (100.0%) falling below the poverty line.
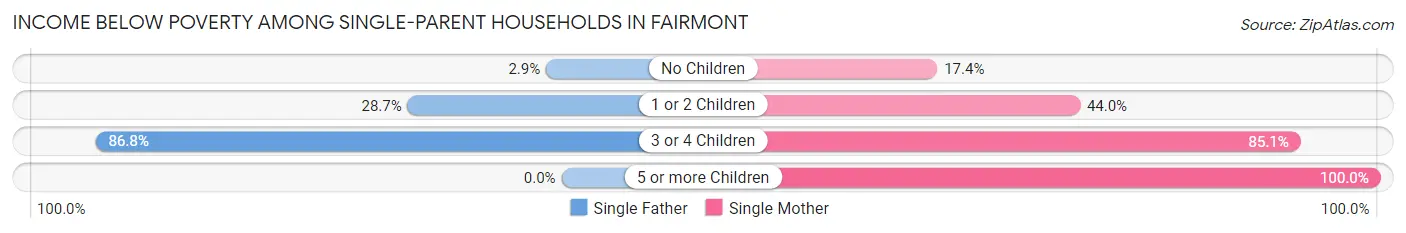
| Children | Single Father | Single Mother |
| No Children | 4 (2.9%) | 57 (17.4%) |
| 1 or 2 Children | 80 (28.7%) | 158 (44.0%) |
| 3 or 4 Children | 46 (86.8%) | 40 (85.1%) |
| 5 or more Children | 0 (0.0%) | 7 (100.0%) |
| Total | 130 (27.6%) | 262 (35.4%) |
Income Below Poverty Among Married-Couple vs Single-Parent Households in Fairmont
The poverty data for Fairmont shows that 233 of the married-couple family households (7.7%) and 392 of the single-parent households (32.4%) are living below the poverty level. Within the married-couple family households, those with 5 or more children have the highest poverty rate, with 7 households (100.0%) falling below the poverty line. Among the single-parent households, those with 5 or more children have the highest poverty rate, with 7 household (100.0%) living below poverty.
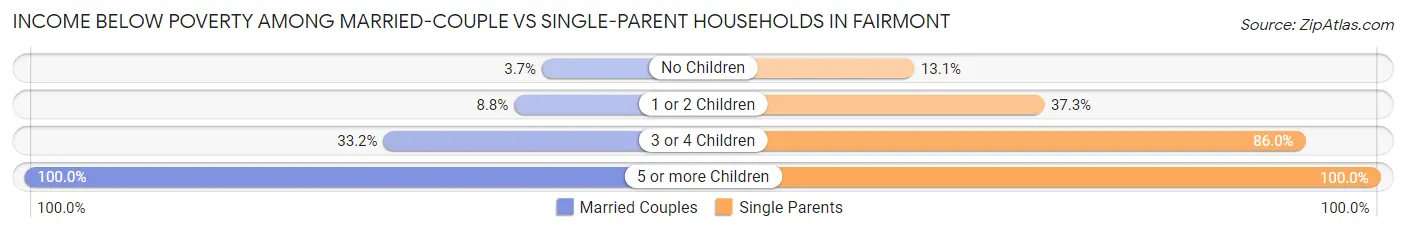
| Children | Married-Couple Families | Single-Parent Households |
| No Children | 67 (3.6%) | 61 (13.1%) |
| 1 or 2 Children | 85 (8.8%) | 238 (37.3%) |
| 3 or 4 Children | 74 (33.2%) | 86 (86.0%) |
| 5 or more Children | 7 (100.0%) | 7 (100.0%) |
| Total | 233 (7.7%) | 392 (32.4%) |
Race in Fairmont
The most populous races in Fairmont are White / Caucasian (16,046 | 87.2%), Black / African American (1,199 | 6.5%), and Two or more Races (831 | 4.5%).
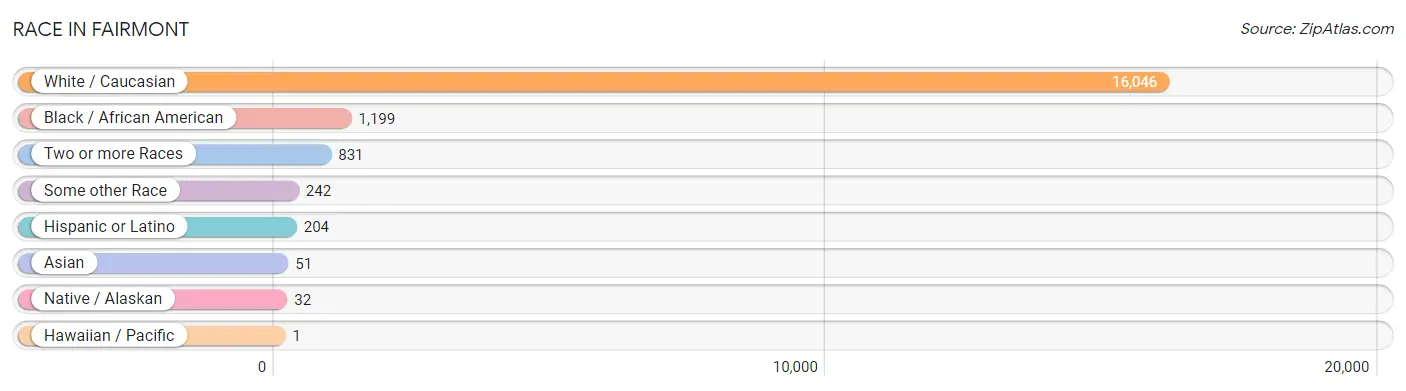
| Race | # Population | % Population |
| Asian | 51 | 0.3% |
| Black / African American | 1,199 | 6.5% |
| Hawaiian / Pacific | 1 | 0.0% |
| Hispanic or Latino | 204 | 1.1% |
| Native / Alaskan | 32 | 0.2% |
| White / Caucasian | 16,046 | 87.2% |
| Two or more Races | 831 | 4.5% |
| Some other Race | 242 | 1.3% |
| Total | 18,402 | 100.0% |
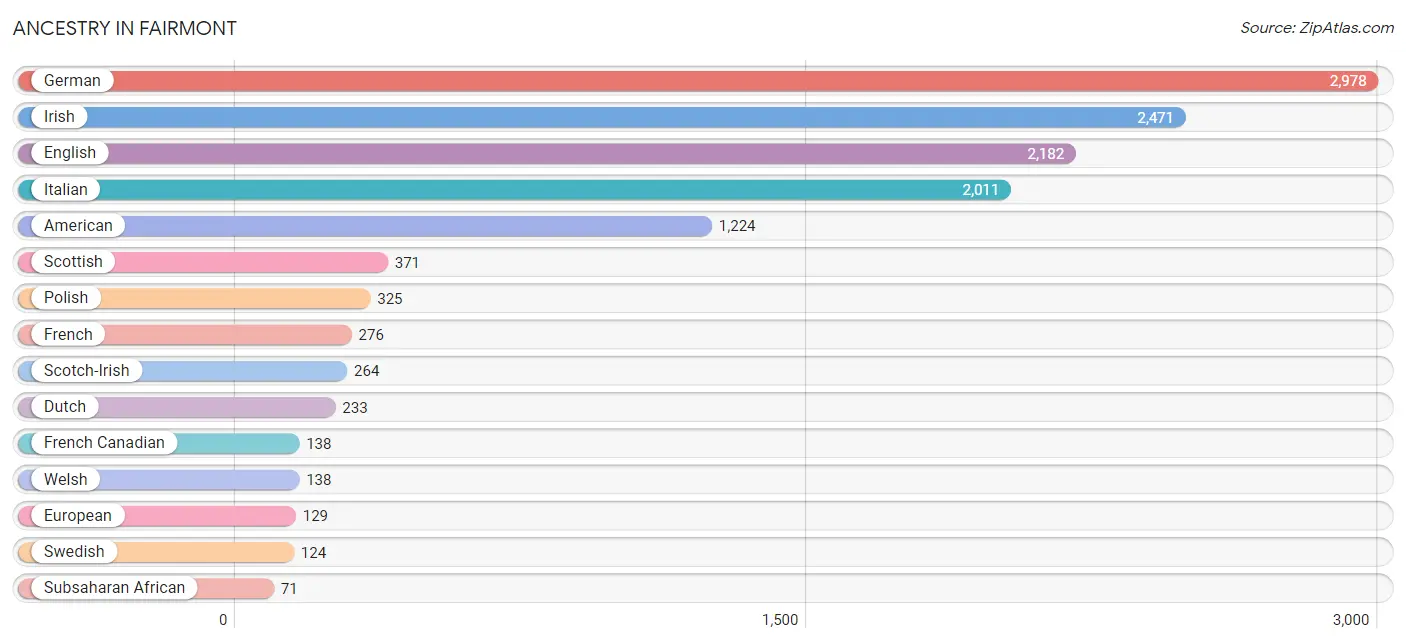
Ancestry in Fairmont
The most populous ancestries reported in Fairmont are German (2,978 | 16.2%), Irish (2,471 | 13.4%), English (2,182 | 11.9%), Italian (2,011 | 10.9%), and American (1,224 | 6.7%), together accounting for 59.1% of all Fairmont residents.
| Ancestry | # Population | % Population |
| African | 57 | 0.3% |
| American | 1,224 | 6.7% |
| Apache | 3 | 0.0% |
| Arab | 20 | 0.1% |
| Austrian | 13 | 0.1% |
| Bahamian | 9 | 0.1% |
| Bhutanese | 21 | 0.1% |
| Blackfeet | 56 | 0.3% |
| British | 55 | 0.3% |
| Canadian | 58 | 0.3% |
| Central American | 19 | 0.1% |
| Cherokee | 36 | 0.2% |
| Croatian | 43 | 0.2% |
| Cuban | 19 | 0.1% |
| Czech | 59 | 0.3% |
| Czechoslovakian | 7 | 0.0% |
| Danish | 6 | 0.0% |
| Delaware | 7 | 0.0% |
| Dutch | 233 | 1.3% |
| Eastern European | 6 | 0.0% |
| English | 2,182 | 11.9% |
| Estonian | 7 | 0.0% |
| European | 129 | 0.7% |
| French | 276 | 1.5% |
| French Canadian | 138 | 0.7% |
| German | 2,978 | 16.2% |
| Greek | 60 | 0.3% |
| Haitian | 25 | 0.1% |
| Hungarian | 62 | 0.3% |
| Indian (Asian) | 28 | 0.2% |
| Irish | 2,471 | 13.4% |
| Italian | 2,011 | 10.9% |
| Jamaican | 7 | 0.0% |
| Korean | 62 | 0.3% |
| Lebanese | 20 | 0.1% |
| Menominee | 2 | 0.0% |
| Mexican | 48 | 0.3% |
| Mongolian | 10 | 0.1% |
| Native Hawaiian | 1 | 0.0% |
| Nicaraguan | 13 | 0.1% |
| Nigerian | 24 | 0.1% |
| Northern European | 15 | 0.1% |
| Norwegian | 5 | 0.0% |
| Pennsylvania German | 10 | 0.1% |
| Polish | 325 | 1.8% |
| Puerto Rican | 32 | 0.2% |
| Russian | 34 | 0.2% |
| Salvadoran | 6 | 0.0% |
| Scandinavian | 21 | 0.1% |
| Scotch-Irish | 264 | 1.4% |
| Scottish | 371 | 2.0% |
| Serbian | 9 | 0.1% |
| Slavic | 10 | 0.1% |
| Slovak | 7 | 0.0% |
| Spaniard | 45 | 0.2% |
| Subsaharan African | 71 | 0.4% |
| Swedish | 124 | 0.7% |
| Thai | 4 | 0.0% |
| Ukrainian | 70 | 0.4% |
| Welsh | 138 | 0.7% |
| West Indian | 70 | 0.4% |
| Yugoslavian | 7 | 0.0% | View All 62 Rows |
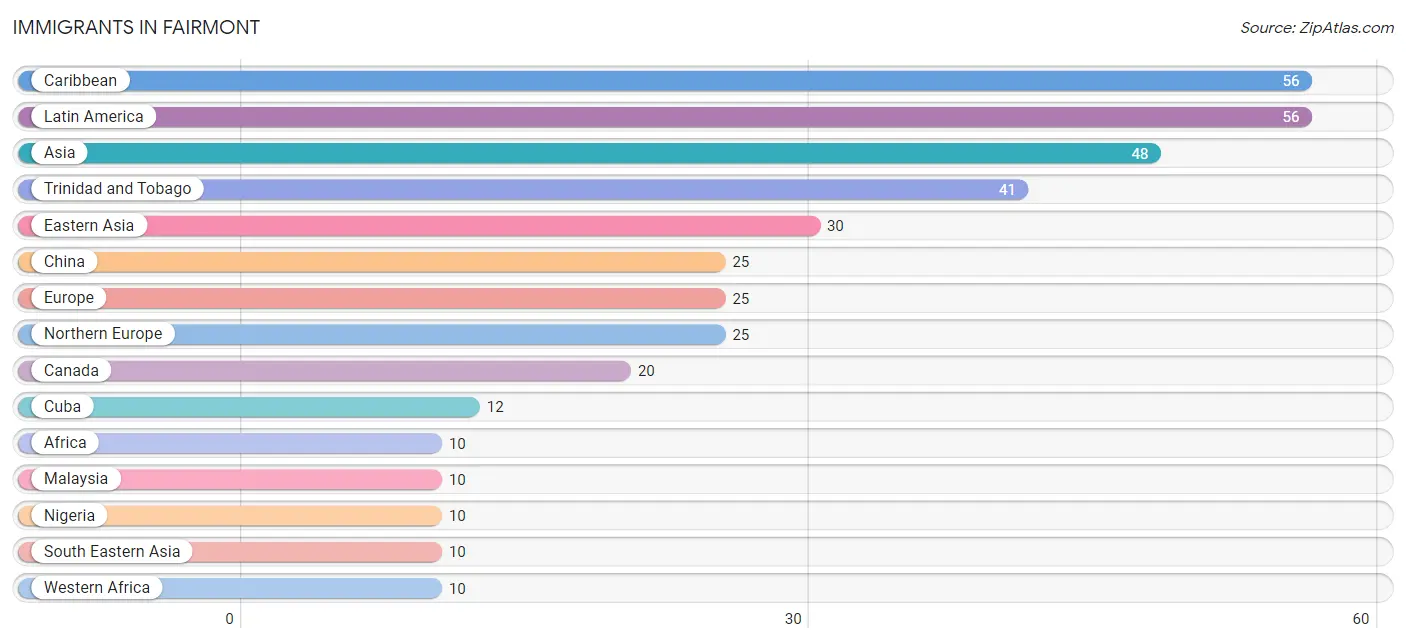
Immigrants in Fairmont
The most numerous immigrant groups reported in Fairmont came from Caribbean (56 | 0.3%), Latin America (56 | 0.3%), Asia (48 | 0.3%), Trinidad and Tobago (41 | 0.2%), and Eastern Asia (30 | 0.2%), together accounting for 1.2% of all Fairmont residents.
| Immigration Origin | # Population | % Population |
| Africa | 10 | 0.1% |
| Asia | 48 | 0.3% |
| Bangladesh | 8 | 0.0% |
| Canada | 20 | 0.1% |
| Caribbean | 56 | 0.3% |
| China | 25 | 0.1% |
| Cuba | 12 | 0.1% |
| Eastern Asia | 30 | 0.2% |
| Europe | 25 | 0.1% |
| Haiti | 3 | 0.0% |
| Japan | 5 | 0.0% |
| Latin America | 56 | 0.3% |
| Malaysia | 10 | 0.1% |
| Nigeria | 10 | 0.1% |
| Northern Europe | 25 | 0.1% |
| South Central Asia | 8 | 0.0% |
| South Eastern Asia | 10 | 0.1% |
| Trinidad and Tobago | 41 | 0.2% |
| Western Africa | 10 | 0.1% | View All 19 Rows |
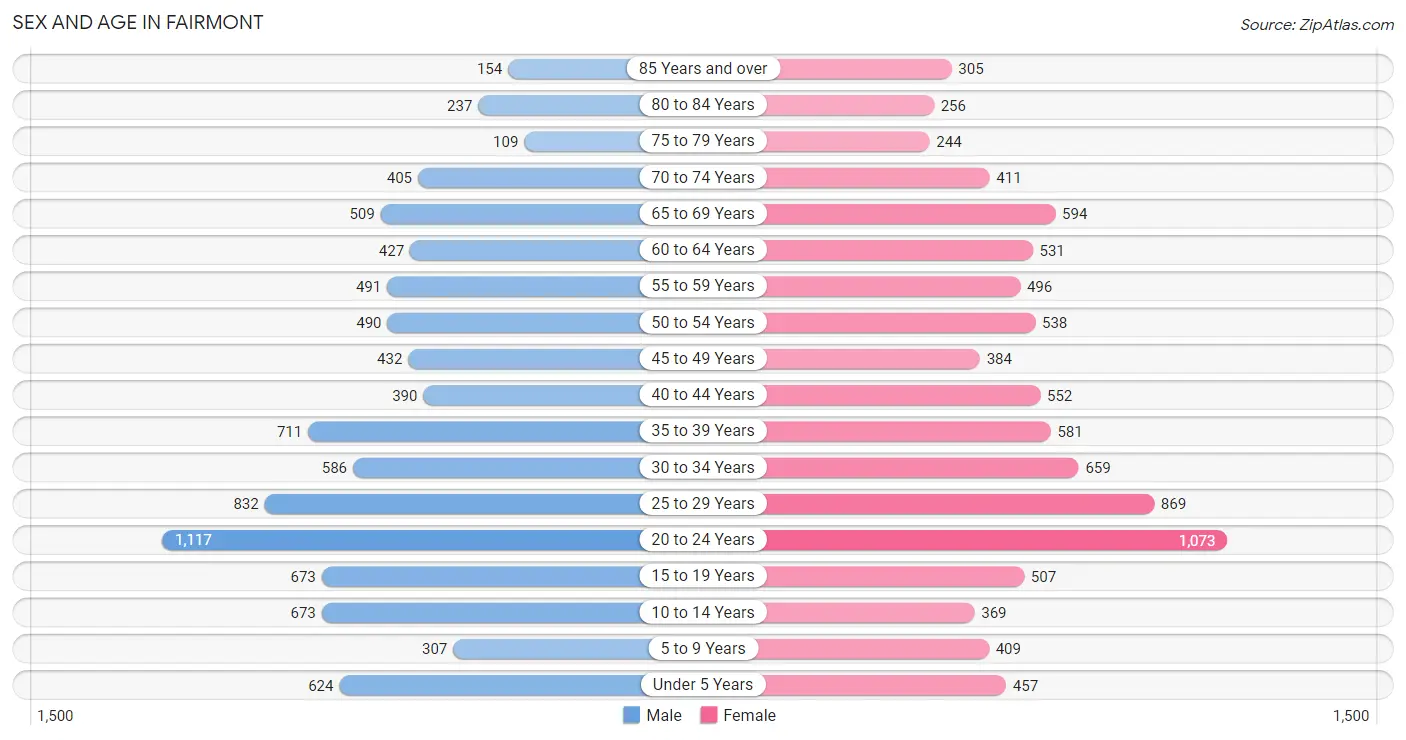
Sex and Age in Fairmont
Sex and Age in Fairmont
The most populous age groups in Fairmont are 20 to 24 Years (1,117 | 12.2%) for men and 20 to 24 Years (1,073 | 11.6%) for women.
| Age Bracket | Male | Female |
| Under 5 Years | 624 (6.8%) | 457 (5.0%) |
| 5 to 9 Years | 307 (3.4%) | 409 (4.4%) |
| 10 to 14 Years | 673 (7.3%) | 369 (4.0%) |
| 15 to 19 Years | 673 (7.3%) | 507 (5.5%) |
| 20 to 24 Years | 1,117 (12.2%) | 1,073 (11.6%) |
| 25 to 29 Years | 832 (9.1%) | 869 (9.4%) |
| 30 to 34 Years | 586 (6.4%) | 659 (7.1%) |
| 35 to 39 Years | 711 (7.8%) | 581 (6.3%) |
| 40 to 44 Years | 390 (4.3%) | 552 (6.0%) |
| 45 to 49 Years | 432 (4.7%) | 384 (4.2%) |
| 50 to 54 Years | 490 (5.3%) | 538 (5.8%) |
| 55 to 59 Years | 491 (5.4%) | 496 (5.4%) |
| 60 to 64 Years | 427 (4.7%) | 531 (5.8%) |
| 65 to 69 Years | 509 (5.6%) | 594 (6.4%) |
| 70 to 74 Years | 405 (4.4%) | 411 (4.4%) |
| 75 to 79 Years | 109 (1.2%) | 244 (2.6%) |
| 80 to 84 Years | 237 (2.6%) | 256 (2.8%) |
| 85 Years and over | 154 (1.7%) | 305 (3.3%) |
| Total | 9,167 (100.0%) | 9,235 (100.0%) |
Families and Households in Fairmont
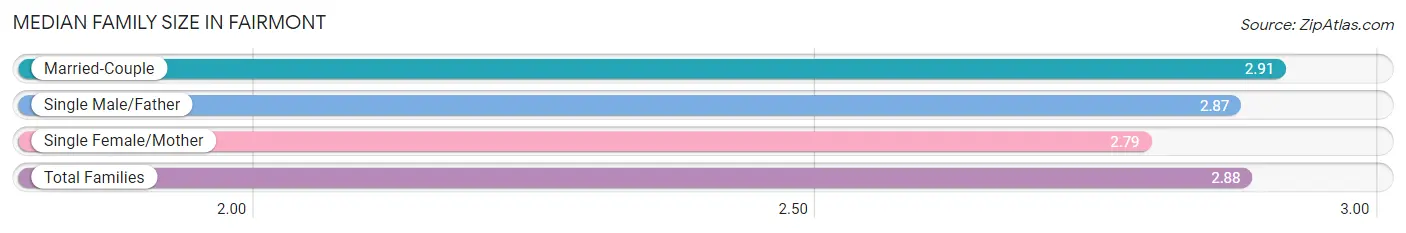
Median Family Size in Fairmont
The median family size in Fairmont is 2.88 persons per family, with married-couple families (3,030 | 71.5%) accounting for the largest median family size of 2.91 persons per family. On the other hand, single female/mother families (740 | 17.4%) represent the smallest median family size with 2.79 persons per family.
| Family Type | # Families | Family Size |
| Married-Couple | 3,030 (71.5%) | 2.91 |
| Single Male/Father | 471 (11.1%) | 2.87 |
| Single Female/Mother | 740 (17.4%) | 2.79 |
| Total Families | 4,241 (100.0%) | 2.88 |
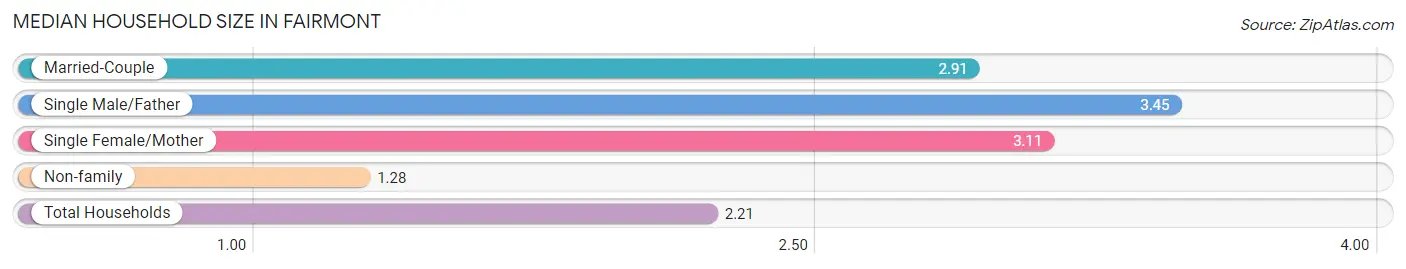
Median Household Size in Fairmont
The median household size in Fairmont is 2.21 persons per household, with single male/father households (471 | 6.0%) accounting for the largest median household size of 3.45 persons per household. non-family households (3,614 | 46.0%) represent the smallest median household size with 1.28 persons per household.
| Household Type | # Households | Household Size |
| Married-Couple | 3,030 (38.6%) | 2.91 |
| Single Male/Father | 471 (6.0%) | 3.45 |
| Single Female/Mother | 740 (9.4%) | 3.11 |
| Non-family | 3,614 (46.0%) | 1.28 |
| Total Households | 7,855 (100.0%) | 2.21 |
Household Size by Marriage Status in Fairmont
Out of a total of 7,855 households in Fairmont, 4,241 (54.0%) are family households, while 3,614 (46.0%) are nonfamily households. The most numerous type of family households are 2-person households, comprising 2,038, and the most common type of nonfamily households are 1-person households, comprising 2,671.
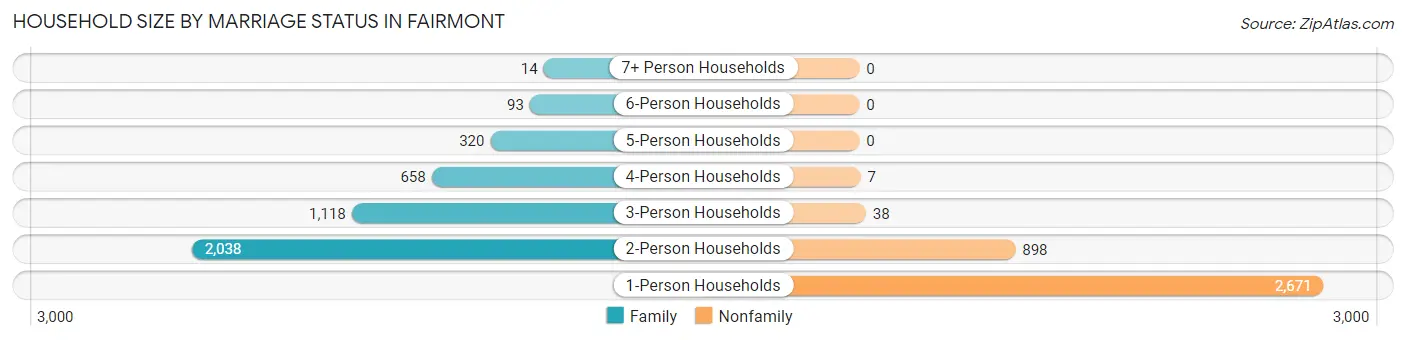
| Household Size | Family Households | Nonfamily Households |
| 1-Person Households | - | 2,671 (34.0%) |
| 2-Person Households | 2,038 (26.0%) | 898 (11.4%) |
| 3-Person Households | 1,118 (14.2%) | 38 (0.5%) |
| 4-Person Households | 658 (8.4%) | 7 (0.1%) |
| 5-Person Households | 320 (4.1%) | 0 (0.0%) |
| 6-Person Households | 93 (1.2%) | 0 (0.0%) |
| 7+ Person Households | 14 (0.2%) | 0 (0.0%) |
| Total | 4,241 (54.0%) | 3,614 (46.0%) |
Female Fertility in Fairmont
Fertility by Age in Fairmont
Average fertility rate in Fairmont is 76.0 births per 1,000 women. Women in the age bracket of 20 to 34 years have the highest fertility rate with 120.0 births per 1,000 women. Women in the age bracket of 20 to 34 years acount for 86.9% of all women with births.
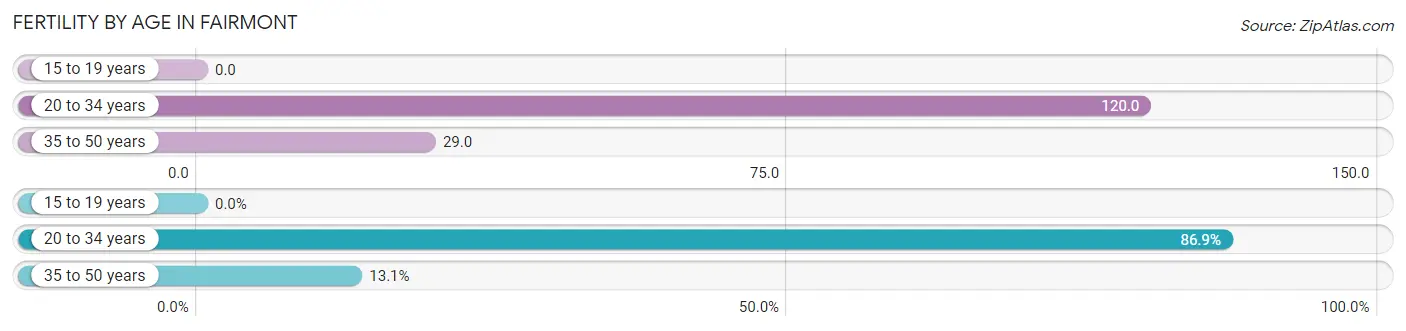
| Age Bracket | Women with Births | Births / 1,000 Women |
| 15 to 19 years | 0 (0.0%) | 0.0 |
| 20 to 34 years | 312 (86.9%) | 120.0 |
| 35 to 50 years | 47 (13.1%) | 29.0 |
| Total | 359 (100.0%) | 76.0 |
Fertility by Age by Marriage Status in Fairmont
51.5% of women with births (359) in Fairmont are married. The highest percentage of unmarried women with births falls into 35 to 50 years age bracket with 61.7% of them unmarried at the time of birth, while the lowest percentage of unmarried women with births belong to 20 to 34 years age bracket with 46.5% of them unmarried.
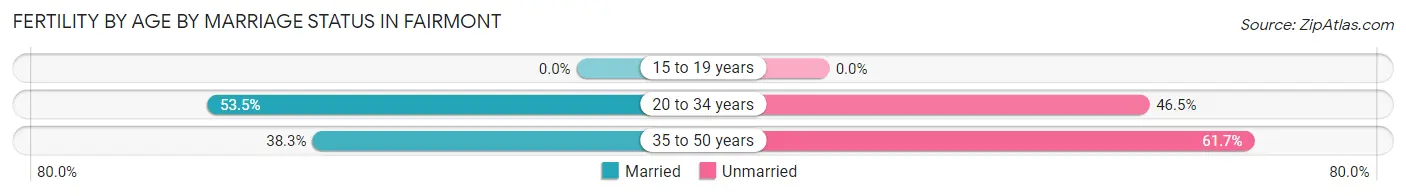
| Age Bracket | Married | Unmarried |
| 15 to 19 years | 0 (0.0%) | 0 (0.0%) |
| 20 to 34 years | 167 (53.5%) | 145 (46.5%) |
| 35 to 50 years | 18 (38.3%) | 29 (61.7%) |
| Total | 185 (51.5%) | 174 (48.5%) |
Fertility by Education in Fairmont
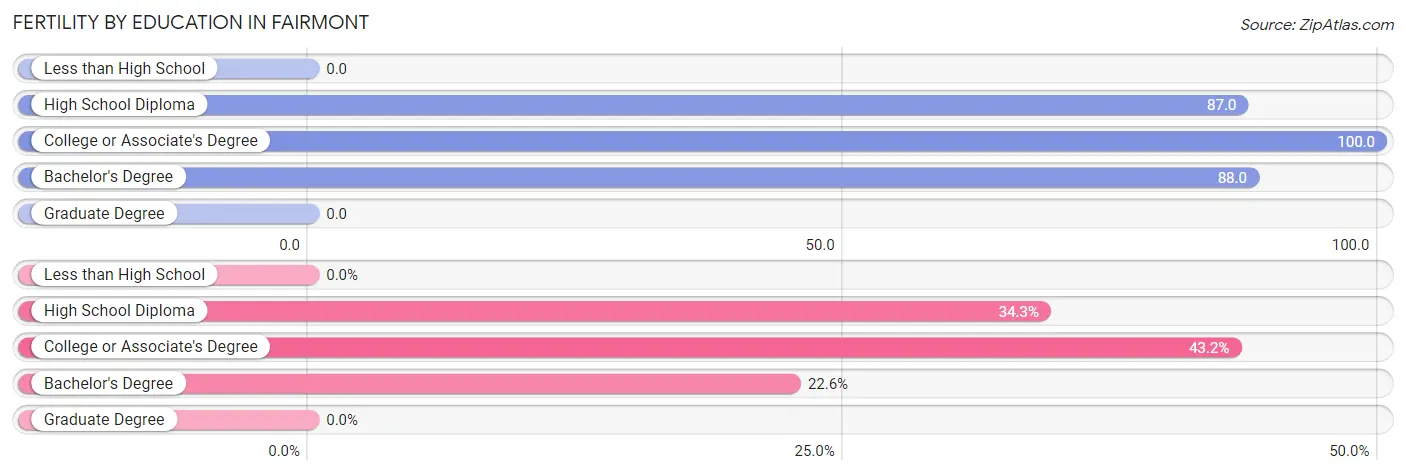
| Educational Attainment | Women with Births | Births / 1,000 Women |
| Less than High School | 0 (0.0%) | 0.0 |
| High School Diploma | 123 (34.3%) | 87.0 |
| College or Associate's Degree | 155 (43.2%) | 100.0 |
| Bachelor's Degree | 81 (22.6%) | 88.0 |
| Graduate Degree | 0 (0.0%) | 0.0 |
| Total | 359 (100.0%) | 76.0 |
Fertility by Education by Marriage Status in Fairmont
48.5% of women with births in Fairmont are unmarried. Women with the educational attainment of college or associate's degree are most likely to be married with 58.7% of them married at childbirth, while women with the educational attainment of bachelor's degree are least likely to be married with 55.6% of them unmarried at childbirth.
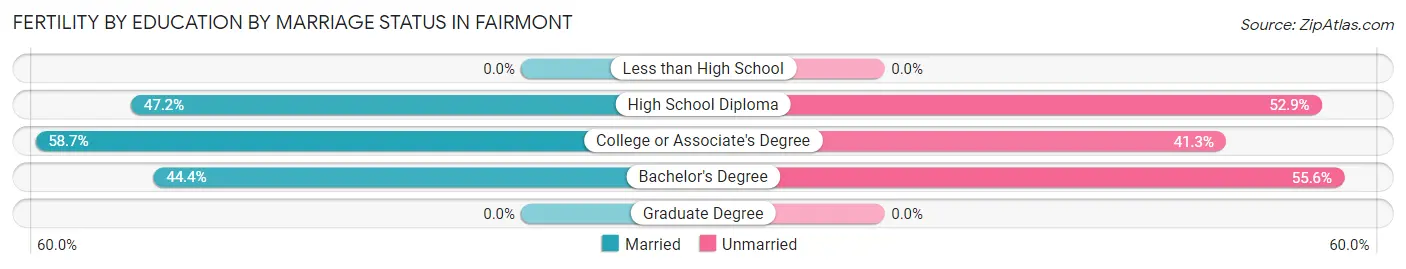
| Educational Attainment | Married | Unmarried |
| Less than High School | 0 (0.0%) | 0 (0.0%) |
| High School Diploma | 58 (47.1%) | 65 (52.8%) |
| College or Associate's Degree | 91 (58.7%) | 64 (41.3%) |
| Bachelor's Degree | 36 (44.4%) | 45 (55.6%) |
| Graduate Degree | 0 (0.0%) | 0 (0.0%) |
| Total | 185 (51.5%) | 174 (48.5%) |
Employment Characteristics in Fairmont
Employment by Class of Employer in Fairmont
Among the 8,615 employed individuals in Fairmont, private company employees (5,337 | 62.0%), not-for-profit organizations (857 | 10.0%), and state government employees (763 | 8.9%) make up the most common classes of employment.
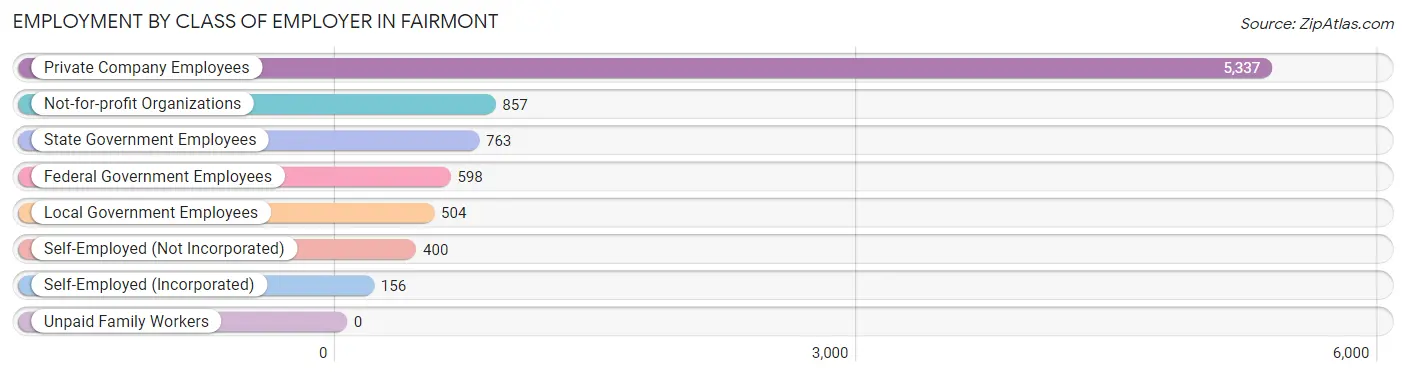
| Employer Class | # Employees | % Employees |
| Private Company Employees | 5,337 | 62.0% |
| Self-Employed (Incorporated) | 156 | 1.8% |
| Self-Employed (Not Incorporated) | 400 | 4.6% |
| Not-for-profit Organizations | 857 | 10.0% |
| Local Government Employees | 504 | 5.9% |
| State Government Employees | 763 | 8.9% |
| Federal Government Employees | 598 | 6.9% |
| Unpaid Family Workers | 0 | 0.0% |
| Total | 8,615 | 100.0% |
Employment Status by Age in Fairmont
According to the labor force statistics for Fairmont, out of the total population over 16 years of age (15,308), 62.2% or 9,522 individuals are in the labor force, with 7.9% or 752 of them unemployed. The age group with the highest labor force participation rate is 35 to 44 years, with 87.2% or 1,948 individuals in the labor force. Within the labor force, the 16 to 19 years age range has the highest percentage of unemployed individuals, with 22.4% or 59 of them being unemployed.
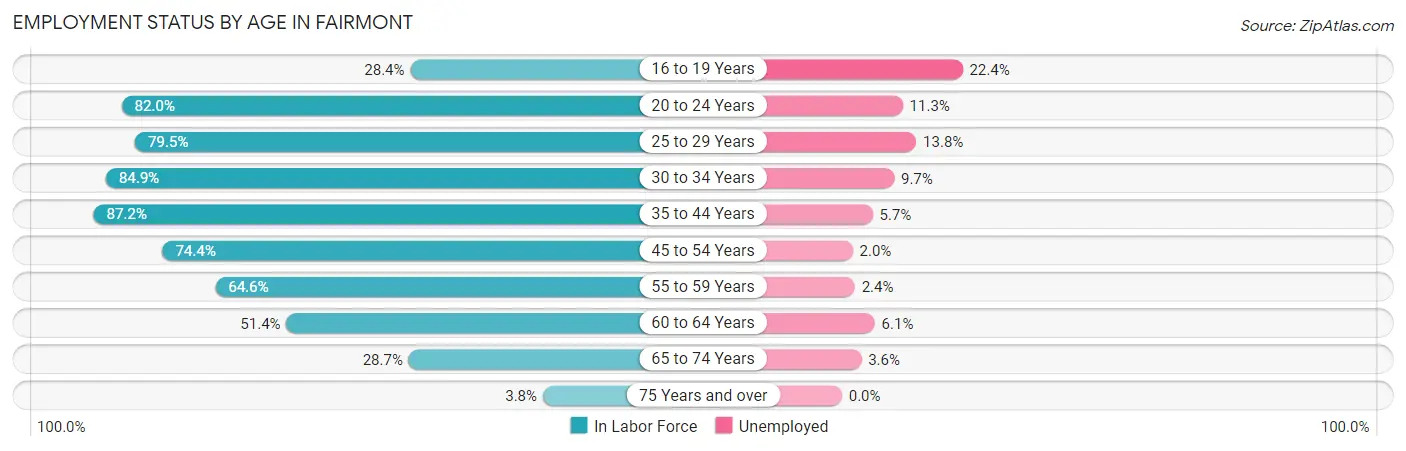
| Age Bracket | In Labor Force | Unemployed |
| 16 to 19 Years | 263 (28.4%) | 59 (22.4%) |
| 20 to 24 Years | 1,796 (82.0%) | 203 (11.3%) |
| 25 to 29 Years | 1,352 (79.5%) | 187 (13.8%) |
| 30 to 34 Years | 1,057 (84.9%) | 103 (9.7%) |
| 35 to 44 Years | 1,948 (87.2%) | 111 (5.7%) |
| 45 to 54 Years | 1,372 (74.4%) | 27 (2.0%) |
| 55 to 59 Years | 638 (64.6%) | 15 (2.4%) |
| 60 to 64 Years | 492 (51.4%) | 30 (6.1%) |
| 65 to 74 Years | 551 (28.7%) | 20 (3.6%) |
| 75 Years and over | 50 (3.8%) | 0 (0.0%) |
| Total | 9,522 (62.2%) | 752 (7.9%) |
Employment Status by Educational Attainment in Fairmont
According to labor force statistics for Fairmont, 76.5% of individuals (6,861) out of the total population between 25 and 64 years of age (8,969) are in the labor force, with 6.9% or 473 of them being unemployed. The group with the highest labor force participation rate are those with the educational attainment of bachelor's degree or higher, with 87.1% or 2,576 individuals in the labor force. Within the labor force, individuals with high school diploma education have the highest percentage of unemployment, with 14.3% or 305 of them being unemployed.
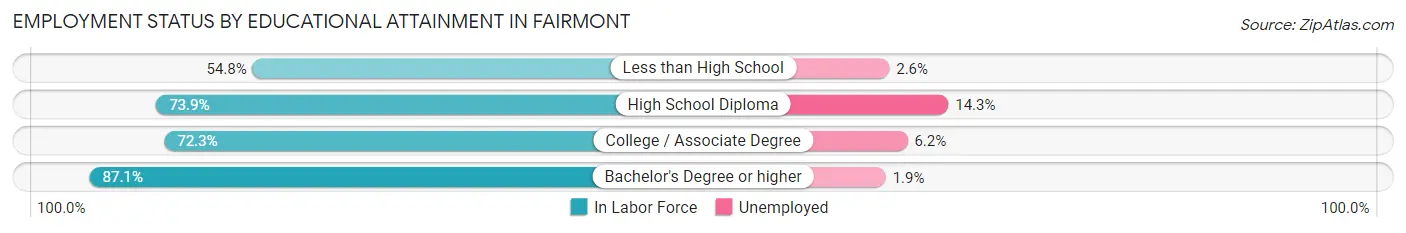
| Educational Attainment | In Labor Force | Unemployed |
| Less than High School | 345 (54.8%) | 16 (2.6%) |
| High School Diploma | 2,132 (73.9%) | 413 (14.3%) |
| College / Associate Degree | 1,806 (72.3%) | 155 (6.2%) |
| Bachelor's Degree or higher | 2,576 (87.1%) | 56 (1.9%) |
| Total | 6,861 (76.5%) | 619 (6.9%) |
Employment Occupations by Sex in Fairmont
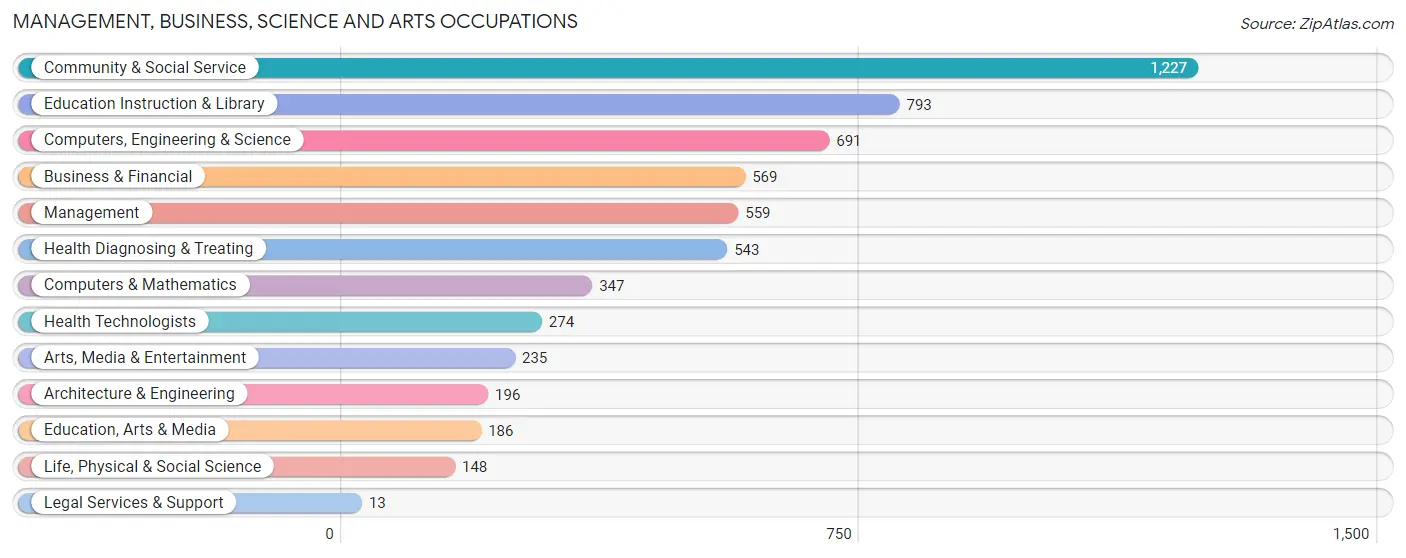
Management, Business, Science and Arts Occupations
The most common Management, Business, Science and Arts occupations in Fairmont are Community & Social Service (1,227 | 14.0%), Education Instruction & Library (793 | 9.0%), Computers, Engineering & Science (691 | 7.9%), Business & Financial (569 | 6.5%), and Management (559 | 6.4%).
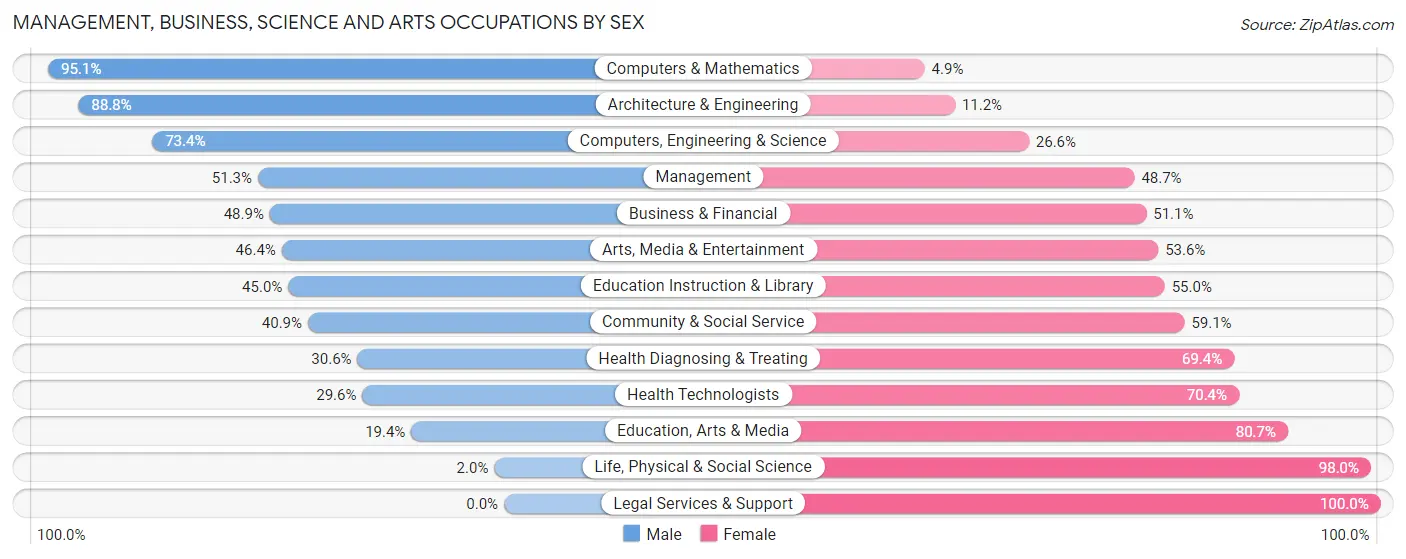
Management, Business, Science and Arts Occupations by Sex
Within the Management, Business, Science and Arts occupations in Fairmont, the most male-oriented occupations are Computers & Mathematics (95.1%), Architecture & Engineering (88.8%), and Computers, Engineering & Science (73.4%), while the most female-oriented occupations are Legal Services & Support (100.0%), Life, Physical & Social Science (98.0%), and Education, Arts & Media (80.6%).
| Occupation | Male | Female |
| Management | 287 (51.3%) | 272 (48.7%) |
| Business & Financial | 278 (48.9%) | 291 (51.1%) |
| Computers, Engineering & Science | 507 (73.4%) | 184 (26.6%) |
| Computers & Mathematics | 330 (95.1%) | 17 (4.9%) |
| Architecture & Engineering | 174 (88.8%) | 22 (11.2%) |
| Life, Physical & Social Science | 3 (2.0%) | 145 (98.0%) |
| Community & Social Service | 502 (40.9%) | 725 (59.1%) |
| Education, Arts & Media | 36 (19.4%) | 150 (80.6%) |
| Legal Services & Support | 0 (0.0%) | 13 (100.0%) |
| Education Instruction & Library | 357 (45.0%) | 436 (55.0%) |
| Arts, Media & Entertainment | 109 (46.4%) | 126 (53.6%) |
| Health Diagnosing & Treating | 166 (30.6%) | 377 (69.4%) |
| Health Technologists | 81 (29.6%) | 193 (70.4%) |
| Total (Category) | 1,740 (48.5%) | 1,849 (51.5%) |
| Total (Overall) | 4,522 (51.6%) | 4,240 (48.4%) |
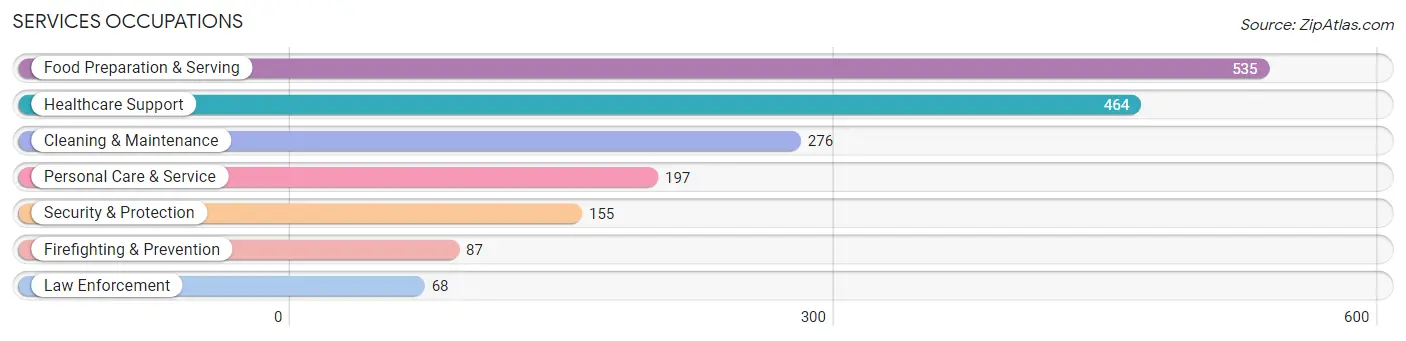
Services Occupations
The most common Services occupations in Fairmont are Food Preparation & Serving (535 | 6.1%), Healthcare Support (464 | 5.3%), Cleaning & Maintenance (276 | 3.2%), Personal Care & Service (197 | 2.2%), and Security & Protection (155 | 1.8%).
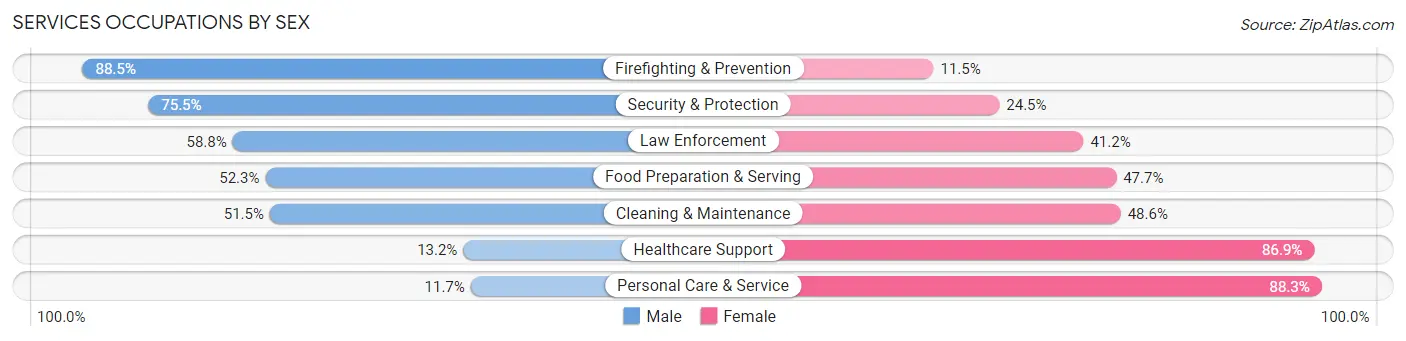
Services Occupations by Sex
Within the Services occupations in Fairmont, the most male-oriented occupations are Firefighting & Prevention (88.5%), Security & Protection (75.5%), and Law Enforcement (58.8%), while the most female-oriented occupations are Personal Care & Service (88.3%), Healthcare Support (86.9%), and Cleaning & Maintenance (48.5%).
| Occupation | Male | Female |
| Healthcare Support | 61 (13.2%) | 403 (86.9%) |
| Security & Protection | 117 (75.5%) | 38 (24.5%) |
| Firefighting & Prevention | 77 (88.5%) | 10 (11.5%) |
| Law Enforcement | 40 (58.8%) | 28 (41.2%) |
| Food Preparation & Serving | 280 (52.3%) | 255 (47.7%) |
| Cleaning & Maintenance | 142 (51.4%) | 134 (48.5%) |
| Personal Care & Service | 23 (11.7%) | 174 (88.3%) |
| Total (Category) | 623 (38.3%) | 1,004 (61.7%) |
| Total (Overall) | 4,522 (51.6%) | 4,240 (48.4%) |
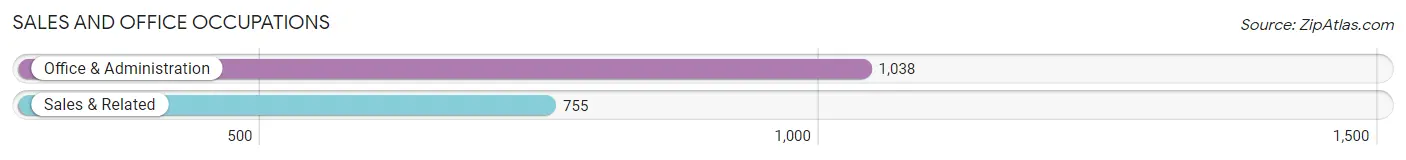
Sales and Office Occupations
The most common Sales and Office occupations in Fairmont are Office & Administration (1,038 | 11.8%), and Sales & Related (755 | 8.6%).
Sales and Office Occupations by Sex
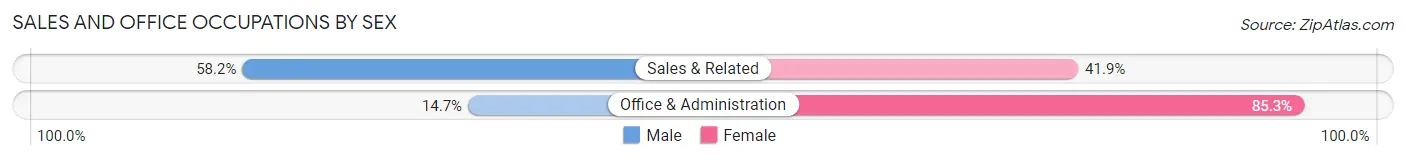
| Occupation | Male | Female |
| Sales & Related | 439 (58.2%) | 316 (41.8%) |
| Office & Administration | 153 (14.7%) | 885 (85.3%) |
| Total (Category) | 592 (33.0%) | 1,201 (67.0%) |
| Total (Overall) | 4,522 (51.6%) | 4,240 (48.4%) |
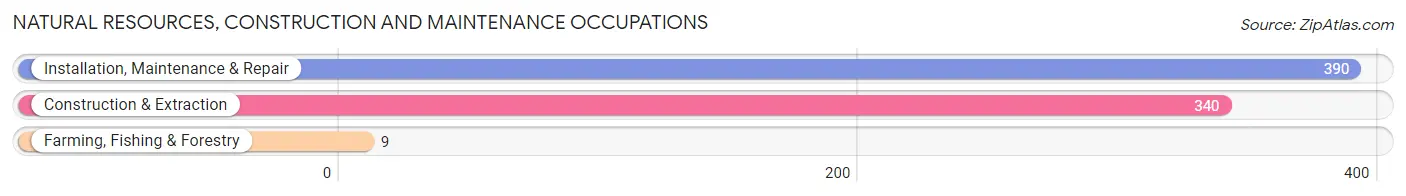
Natural Resources, Construction and Maintenance Occupations
The most common Natural Resources, Construction and Maintenance occupations in Fairmont are Installation, Maintenance & Repair (390 | 4.4%), Construction & Extraction (340 | 3.9%), and Farming, Fishing & Forestry (9 | 0.1%).
Natural Resources, Construction and Maintenance Occupations by Sex
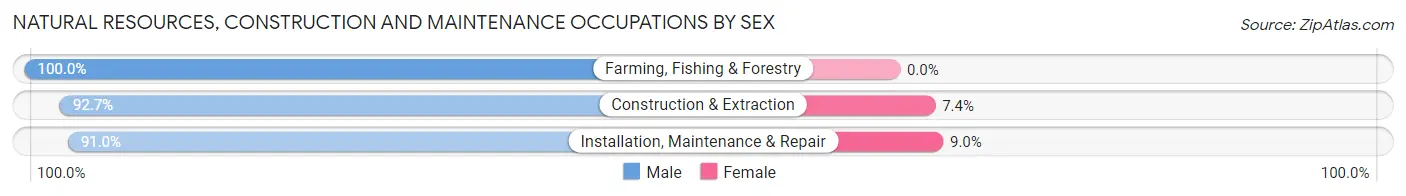
| Occupation | Male | Female |
| Farming, Fishing & Forestry | 9 (100.0%) | 0 (0.0%) |
| Construction & Extraction | 315 (92.6%) | 25 (7.3%) |
| Installation, Maintenance & Repair | 355 (91.0%) | 35 (9.0%) |
| Total (Category) | 679 (91.9%) | 60 (8.1%) |
| Total (Overall) | 4,522 (51.6%) | 4,240 (48.4%) |
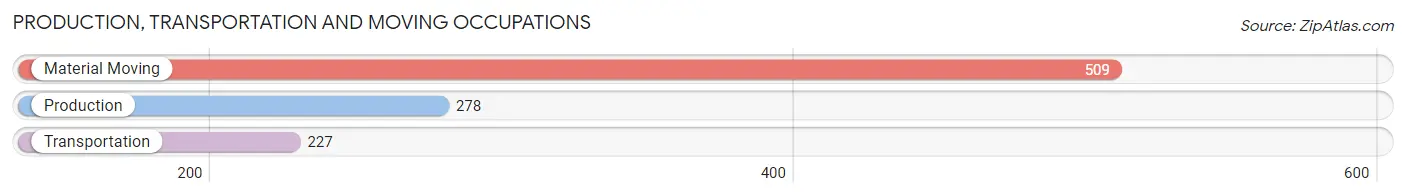
Production, Transportation and Moving Occupations
The most common Production, Transportation and Moving occupations in Fairmont are Material Moving (509 | 5.8%), Production (278 | 3.2%), and Transportation (227 | 2.6%).
Production, Transportation and Moving Occupations by Sex
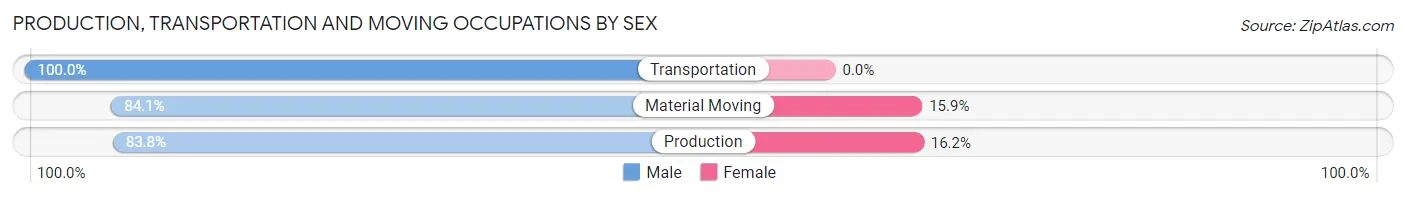
| Occupation | Male | Female |
| Production | 233 (83.8%) | 45 (16.2%) |
| Transportation | 227 (100.0%) | 0 (0.0%) |
| Material Moving | 428 (84.1%) | 81 (15.9%) |
| Total (Category) | 888 (87.6%) | 126 (12.4%) |
| Total (Overall) | 4,522 (51.6%) | 4,240 (48.4%) |
Employment Industries by Sex in Fairmont
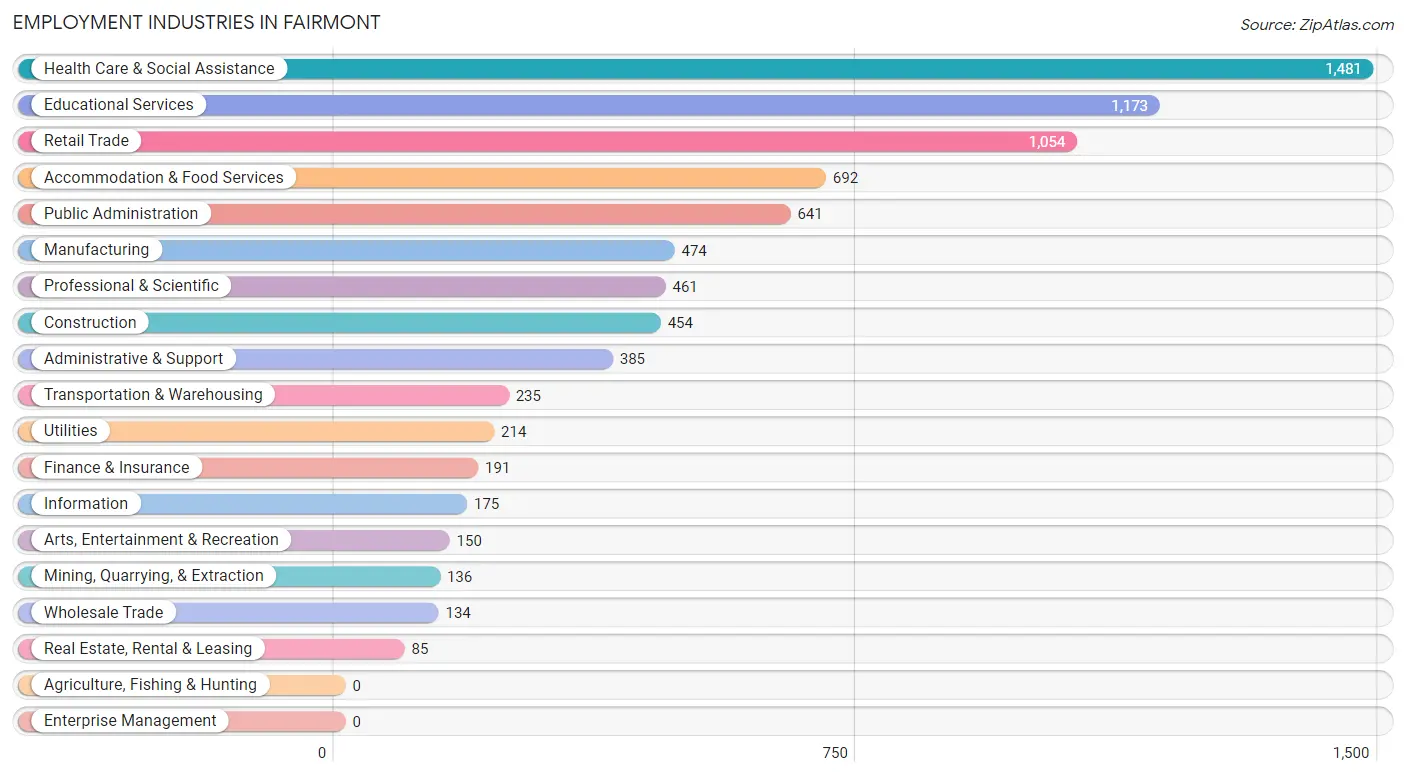
Employment Industries in Fairmont
The major employment industries in Fairmont include Health Care & Social Assistance (1,481 | 16.9%), Educational Services (1,173 | 13.4%), Retail Trade (1,054 | 12.0%), Accommodation & Food Services (692 | 7.9%), and Public Administration (641 | 7.3%).
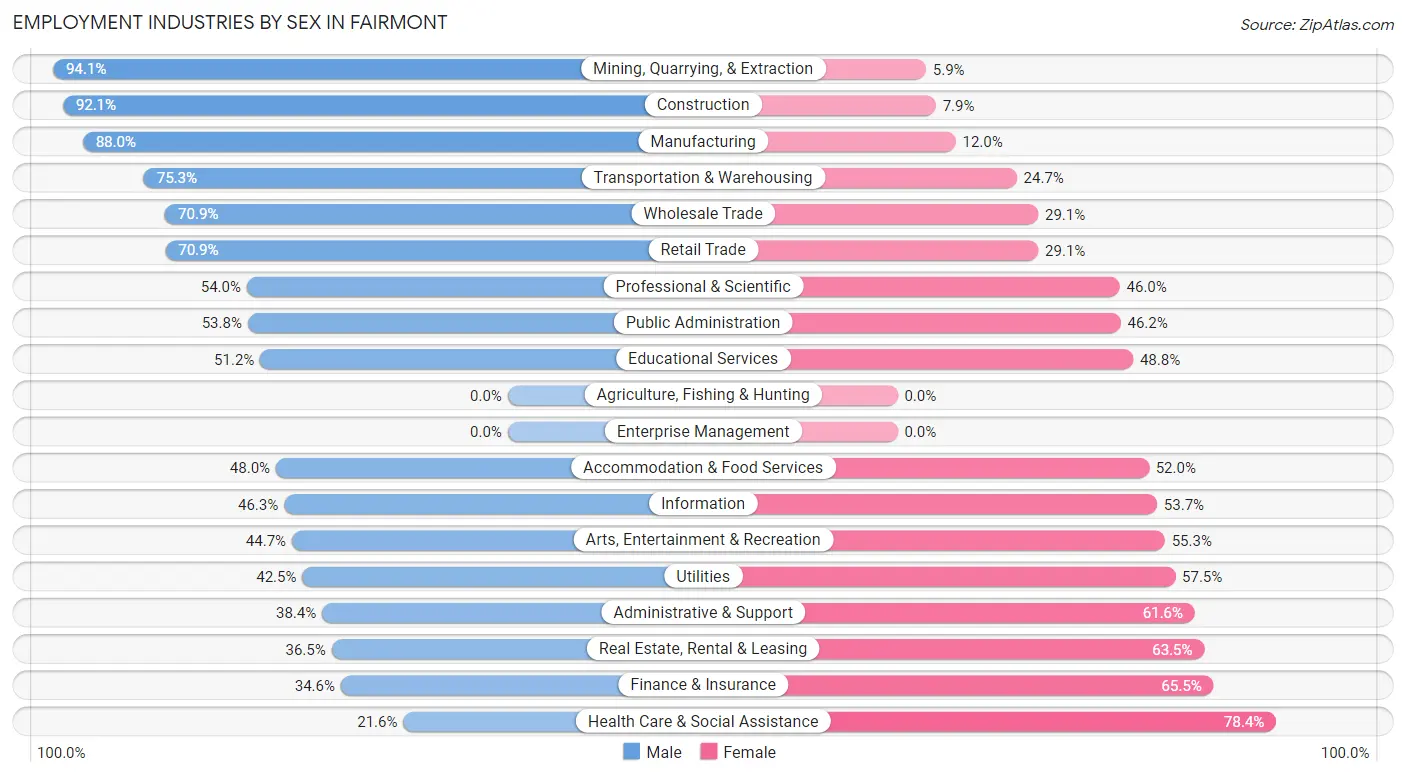
Employment Industries by Sex in Fairmont
The Fairmont industries that see more men than women are Mining, Quarrying, & Extraction (94.1%), Construction (92.1%), and Manufacturing (88.0%), whereas the industries that tend to have a higher number of women are Health Care & Social Assistance (78.4%), Finance & Insurance (65.4%), and Real Estate, Rental & Leasing (63.5%).
| Industry | Male | Female |
| Agriculture, Fishing & Hunting | 0 (0.0%) | 0 (0.0%) |
| Mining, Quarrying, & Extraction | 128 (94.1%) | 8 (5.9%) |
| Construction | 418 (92.1%) | 36 (7.9%) |
| Manufacturing | 417 (88.0%) | 57 (12.0%) |
| Wholesale Trade | 95 (70.9%) | 39 (29.1%) |
| Retail Trade | 747 (70.9%) | 307 (29.1%) |
| Transportation & Warehousing | 177 (75.3%) | 58 (24.7%) |
| Utilities | 91 (42.5%) | 123 (57.5%) |
| Information | 81 (46.3%) | 94 (53.7%) |
| Finance & Insurance | 66 (34.5%) | 125 (65.4%) |
| Real Estate, Rental & Leasing | 31 (36.5%) | 54 (63.5%) |
| Professional & Scientific | 249 (54.0%) | 212 (46.0%) |
| Enterprise Management | 0 (0.0%) | 0 (0.0%) |
| Administrative & Support | 148 (38.4%) | 237 (61.6%) |
| Educational Services | 601 (51.2%) | 572 (48.8%) |
| Health Care & Social Assistance | 320 (21.6%) | 1,161 (78.4%) |
| Arts, Entertainment & Recreation | 67 (44.7%) | 83 (55.3%) |
| Accommodation & Food Services | 332 (48.0%) | 360 (52.0%) |
| Public Administration | 345 (53.8%) | 296 (46.2%) |
| Total | 4,522 (51.6%) | 4,240 (48.4%) |
Education in Fairmont
School Enrollment in Fairmont
The most common levels of schooling among the 4,225 students in Fairmont are college / undergraduate (1,498 | 35.5%), middle school (938 | 22.2%), and high school (536 | 12.7%).
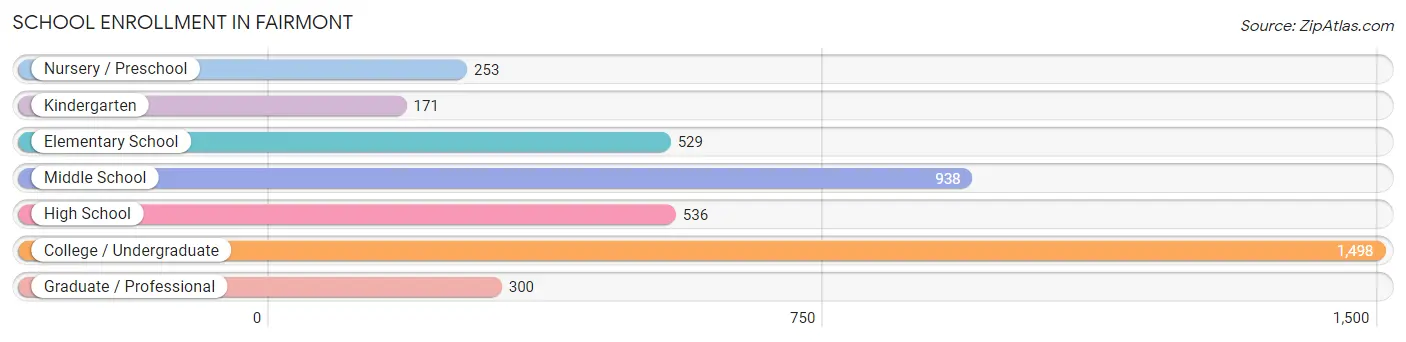
| School Level | # Students | % Students |
| Nursery / Preschool | 253 | 6.0% |
| Kindergarten | 171 | 4.1% |
| Elementary School | 529 | 12.5% |
| Middle School | 938 | 22.2% |
| High School | 536 | 12.7% |
| College / Undergraduate | 1,498 | 35.5% |
| Graduate / Professional | 300 | 7.1% |
| Total | 4,225 | 100.0% |
School Enrollment by Age by Funding Source in Fairmont
Out of a total of 4,225 students who are enrolled in schools in Fairmont, 363 (8.6%) attend a private institution, while the remaining 3,862 (91.4%) are enrolled in public schools. The age group of 3 to 4 year olds has the highest likelihood of being enrolled in private schools, with 79 (37.3% in the age bracket) enrolled. Conversely, the age group of 20 to 24 year olds has the lowest likelihood of being enrolled in a private school, with 878 (99.1% in the age bracket) attending a public institution.
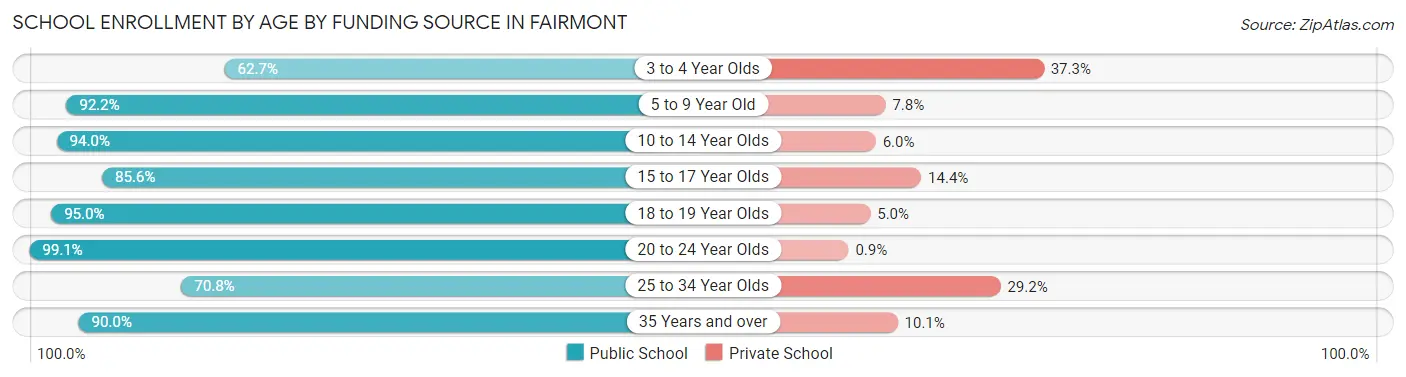
| Age Bracket | Public School | Private School |
| 3 to 4 Year Olds | 133 (62.7%) | 79 (37.3%) |
| 5 to 9 Year Old | 640 (92.2%) | 54 (7.8%) |
| 10 to 14 Year Olds | 961 (94.0%) | 61 (6.0%) |
| 15 to 17 Year Olds | 350 (85.6%) | 59 (14.4%) |
| 18 to 19 Year Olds | 594 (95.0%) | 31 (5.0%) |
| 20 to 24 Year Olds | 878 (99.1%) | 8 (0.9%) |
| 25 to 34 Year Olds | 126 (70.8%) | 52 (29.2%) |
| 35 Years and over | 179 (89.9%) | 20 (10.1%) |
| Total | 3,862 (91.4%) | 363 (8.6%) |
Educational Attainment by Field of Study in Fairmont
Education (740 | 17.4%), business (647 | 15.2%), arts & humanities (469 | 11.0%), science & technology (458 | 10.7%), and visual & performing arts (307 | 7.2%) are the most common fields of study among 4,262 individuals in Fairmont who have obtained a bachelor's degree or higher.
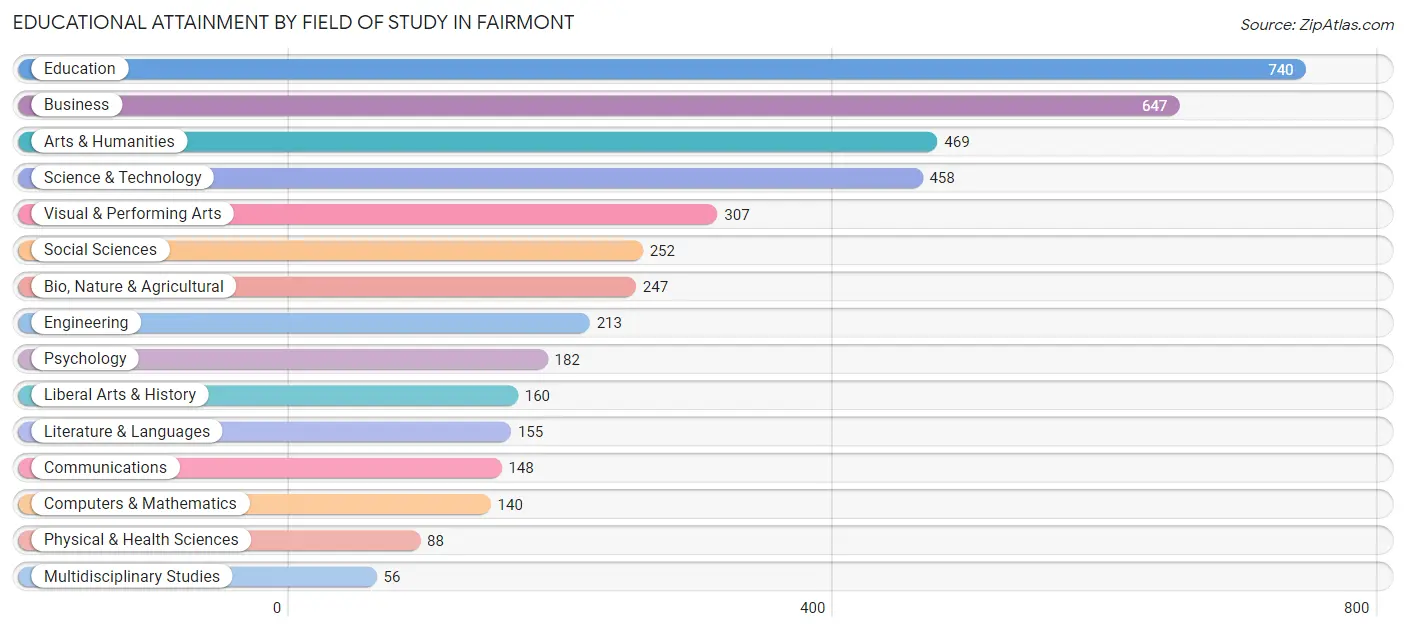
| Field of Study | # Graduates | % Graduates |
| Computers & Mathematics | 140 | 3.3% |
| Bio, Nature & Agricultural | 247 | 5.8% |
| Physical & Health Sciences | 88 | 2.1% |
| Psychology | 182 | 4.3% |
| Social Sciences | 252 | 5.9% |
| Engineering | 213 | 5.0% |
| Multidisciplinary Studies | 56 | 1.3% |
| Science & Technology | 458 | 10.7% |
| Business | 647 | 15.2% |
| Education | 740 | 17.4% |
| Literature & Languages | 155 | 3.6% |
| Liberal Arts & History | 160 | 3.7% |
| Visual & Performing Arts | 307 | 7.2% |
| Communications | 148 | 3.5% |
| Arts & Humanities | 469 | 11.0% |
| Total | 4,262 | 100.0% |
Transportation & Commute in Fairmont
Vehicle Availability by Sex in Fairmont
The most prevalent vehicle ownership categories in Fairmont are males with 2 vehicles (2,015, accounting for 46.1%) and females with 2 vehicles (1,841, making up 50.4%).
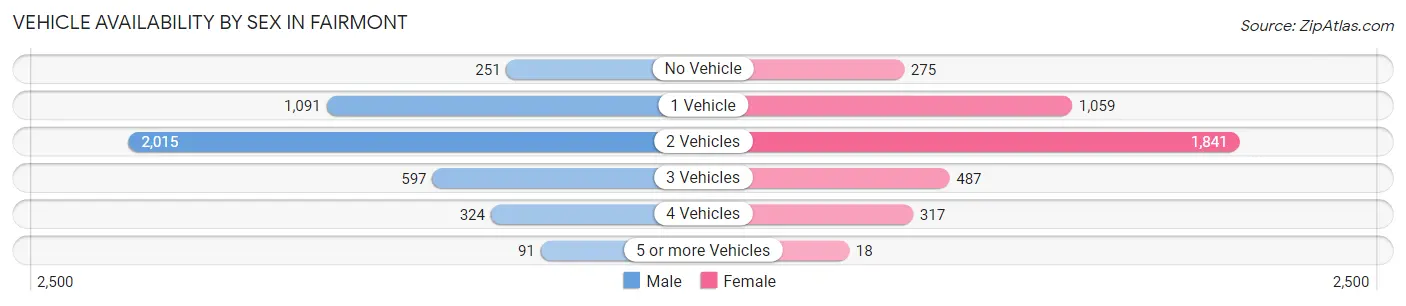
| Vehicles Available | Male | Female |
| No Vehicle | 251 (5.8%) | 275 (6.9%) |
| 1 Vehicle | 1,091 (25.0%) | 1,059 (26.5%) |
| 2 Vehicles | 2,015 (46.1%) | 1,841 (46.1%) |
| 3 Vehicles | 597 (13.7%) | 487 (12.2%) |
| 4 Vehicles | 324 (7.4%) | 317 (7.9%) |
| 5 or more Vehicles | 91 (2.1%) | 18 (0.4%) |
| Total | 4,369 (100.0%) | 3,997 (100.0%) |
Commute Time in Fairmont
The most frequently occuring commute durations in Fairmont are 30 to 34 minutes (1,466 commuters, 18.7%), 15 to 19 minutes (1,419 commuters, 18.1%), and 5 to 9 minutes (1,223 commuters, 15.6%).
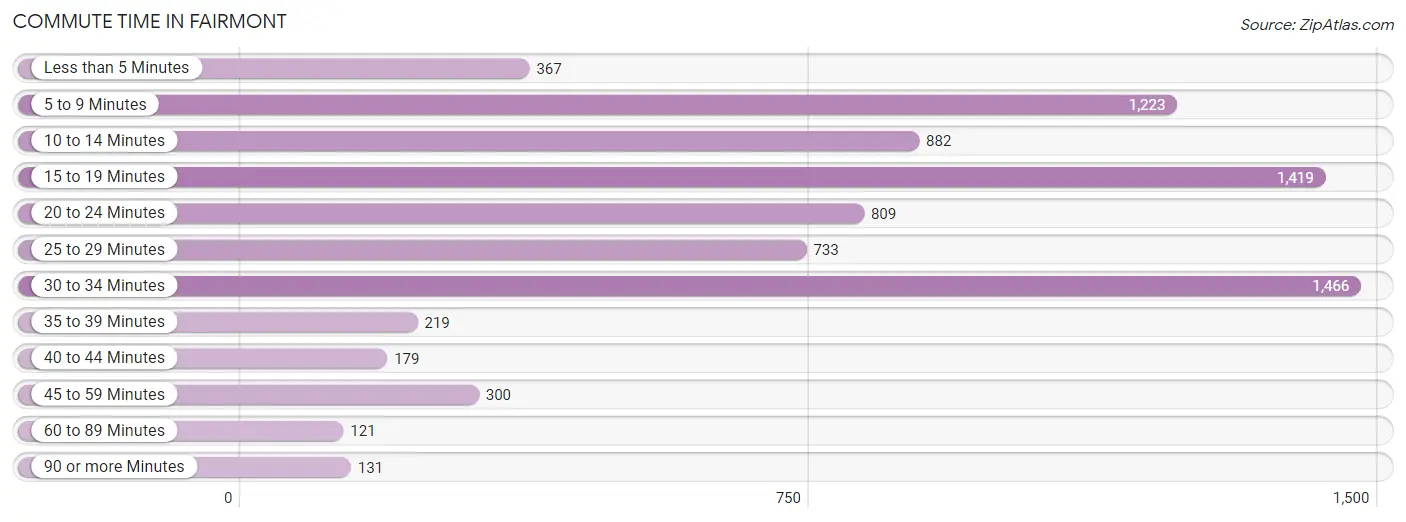
| Commute Time | # Commuters | % Commuters |
| Less than 5 Minutes | 367 | 4.7% |
| 5 to 9 Minutes | 1,223 | 15.6% |
| 10 to 14 Minutes | 882 | 11.2% |
| 15 to 19 Minutes | 1,419 | 18.1% |
| 20 to 24 Minutes | 809 | 10.3% |
| 25 to 29 Minutes | 733 | 9.3% |
| 30 to 34 Minutes | 1,466 | 18.7% |
| 35 to 39 Minutes | 219 | 2.8% |
| 40 to 44 Minutes | 179 | 2.3% |
| 45 to 59 Minutes | 300 | 3.8% |
| 60 to 89 Minutes | 121 | 1.5% |
| 90 or more Minutes | 131 | 1.7% |
Commute Time by Sex in Fairmont
The most common commute times in Fairmont are 15 to 19 minutes (716 commuters, 17.8%) for males and 30 to 34 minutes (788 commuters, 20.6%) for females.
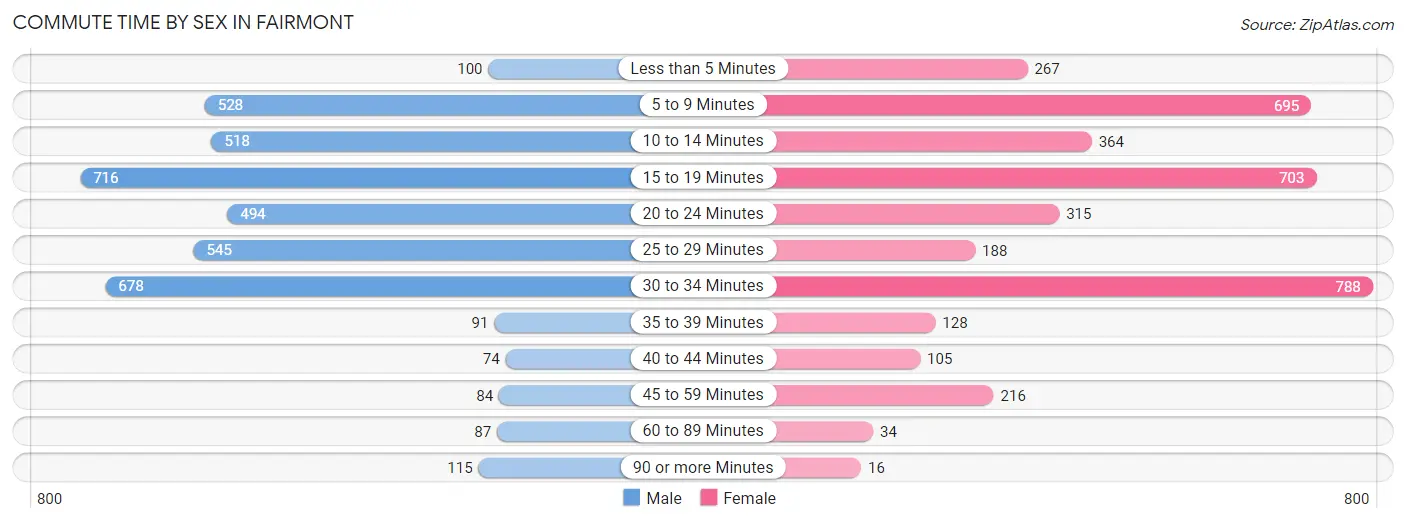
| Commute Time | Male | Female |
| Less than 5 Minutes | 100 (2.5%) | 267 (7.0%) |
| 5 to 9 Minutes | 528 (13.1%) | 695 (18.2%) |
| 10 to 14 Minutes | 518 (12.9%) | 364 (9.5%) |
| 15 to 19 Minutes | 716 (17.8%) | 703 (18.4%) |
| 20 to 24 Minutes | 494 (12.3%) | 315 (8.3%) |
| 25 to 29 Minutes | 545 (13.5%) | 188 (4.9%) |
| 30 to 34 Minutes | 678 (16.8%) | 788 (20.6%) |
| 35 to 39 Minutes | 91 (2.3%) | 128 (3.4%) |
| 40 to 44 Minutes | 74 (1.8%) | 105 (2.8%) |
| 45 to 59 Minutes | 84 (2.1%) | 216 (5.7%) |
| 60 to 89 Minutes | 87 (2.2%) | 34 (0.9%) |
| 90 or more Minutes | 115 (2.9%) | 16 (0.4%) |
Time of Departure to Work by Sex in Fairmont
The most frequent times of departure to work in Fairmont are 7:30 AM to 7:59 AM (867, 21.5%) for males and 7:30 AM to 7:59 AM (657, 17.2%) for females.
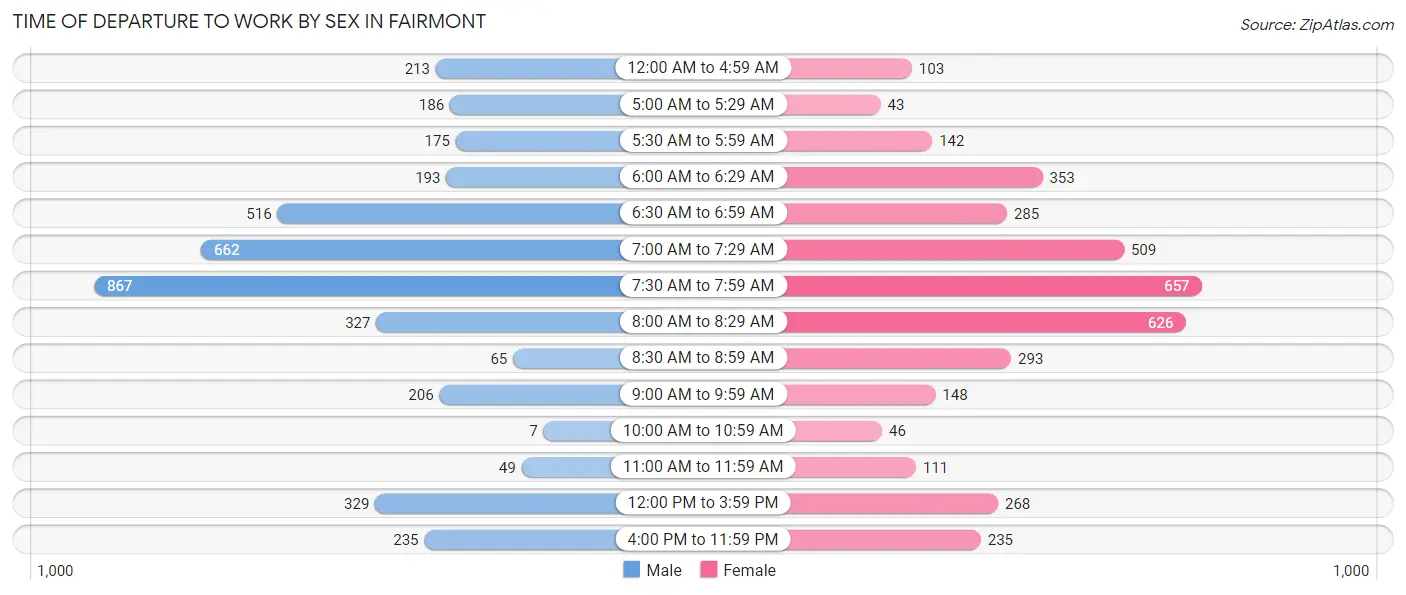
| Time of Departure | Male | Female |
| 12:00 AM to 4:59 AM | 213 (5.3%) | 103 (2.7%) |
| 5:00 AM to 5:29 AM | 186 (4.6%) | 43 (1.1%) |
| 5:30 AM to 5:59 AM | 175 (4.3%) | 142 (3.7%) |
| 6:00 AM to 6:29 AM | 193 (4.8%) | 353 (9.2%) |
| 6:30 AM to 6:59 AM | 516 (12.8%) | 285 (7.5%) |
| 7:00 AM to 7:29 AM | 662 (16.4%) | 509 (13.3%) |
| 7:30 AM to 7:59 AM | 867 (21.5%) | 657 (17.2%) |
| 8:00 AM to 8:29 AM | 327 (8.1%) | 626 (16.4%) |
| 8:30 AM to 8:59 AM | 65 (1.6%) | 293 (7.7%) |
| 9:00 AM to 9:59 AM | 206 (5.1%) | 148 (3.9%) |
| 10:00 AM to 10:59 AM | 7 (0.2%) | 46 (1.2%) |
| 11:00 AM to 11:59 AM | 49 (1.2%) | 111 (2.9%) |
| 12:00 PM to 3:59 PM | 329 (8.2%) | 268 (7.0%) |
| 4:00 PM to 11:59 PM | 235 (5.8%) | 235 (6.1%) |
| Total | 4,030 (100.0%) | 3,819 (100.0%) |
Housing Occupancy in Fairmont
Occupancy by Ownership in Fairmont
Of the total 7,855 dwellings in Fairmont, owner-occupied units account for 4,864 (61.9%), while renter-occupied units make up 2,991 (38.1%).
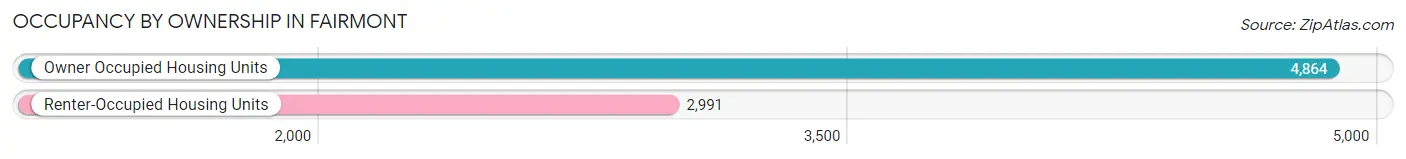
| Occupancy | # Housing Units | % Housing Units |
| Owner Occupied Housing Units | 4,864 | 61.9% |
| Renter-Occupied Housing Units | 2,991 | 38.1% |
| Total Occupied Housing Units | 7,855 | 100.0% |
Occupancy by Household Size in Fairmont
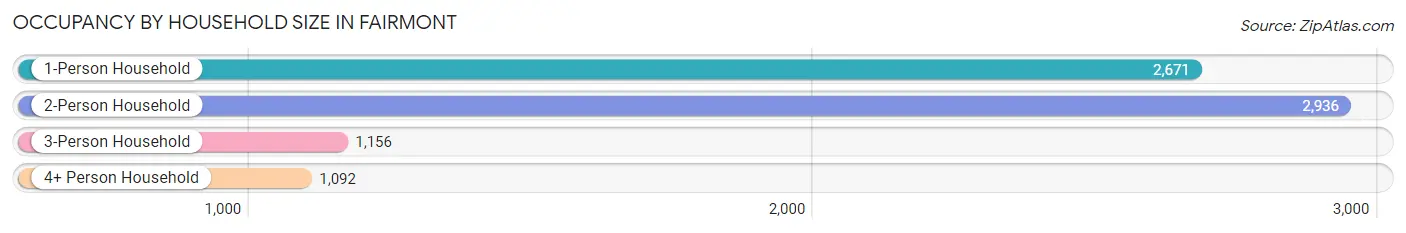
| Household Size | # Housing Units | % Housing Units |
| 1-Person Household | 2,671 | 34.0% |
| 2-Person Household | 2,936 | 37.4% |
| 3-Person Household | 1,156 | 14.7% |
| 4+ Person Household | 1,092 | 13.9% |
| Total Housing Units | 7,855 | 100.0% |
Occupancy by Ownership by Household Size in Fairmont
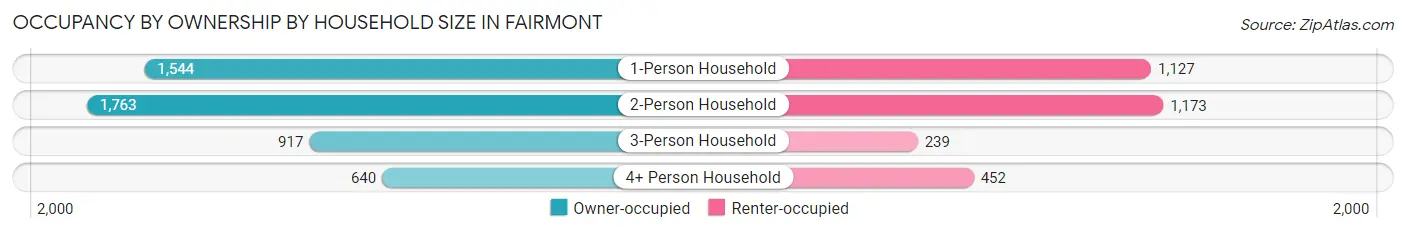
| Household Size | Owner-occupied | Renter-occupied |
| 1-Person Household | 1,544 (57.8%) | 1,127 (42.2%) |
| 2-Person Household | 1,763 (60.1%) | 1,173 (40.0%) |
| 3-Person Household | 917 (79.3%) | 239 (20.7%) |
| 4+ Person Household | 640 (58.6%) | 452 (41.4%) |
| Total Housing Units | 4,864 (61.9%) | 2,991 (38.1%) |
Occupancy by Educational Attainment in Fairmont
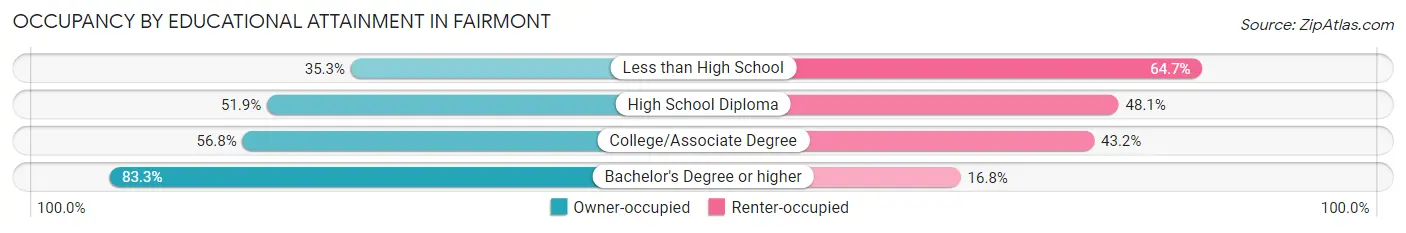
| Household Size | Owner-occupied | Renter-occupied |
| Less than High School | 189 (35.3%) | 346 (64.7%) |
| High School Diploma | 1,386 (51.9%) | 1,283 (48.1%) |
| College/Associate Degree | 1,251 (56.8%) | 952 (43.2%) |
| Bachelor's Degree or higher | 2,038 (83.3%) | 410 (16.8%) |
Occupancy by Age of Householder in Fairmont
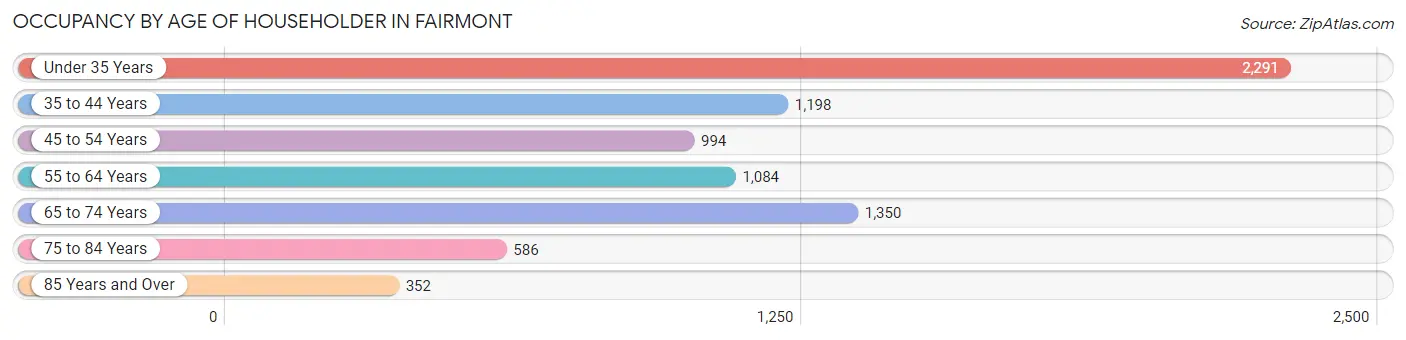
| Age Bracket | # Households | % Households |
| Under 35 Years | 2,291 | 29.2% |
| 35 to 44 Years | 1,198 | 15.2% |
| 45 to 54 Years | 994 | 12.7% |
| 55 to 64 Years | 1,084 | 13.8% |
| 65 to 74 Years | 1,350 | 17.2% |
| 75 to 84 Years | 586 | 7.5% |
| 85 Years and Over | 352 | 4.5% |
| Total | 7,855 | 100.0% |
Housing Finances in Fairmont
Median Income by Occupancy in Fairmont
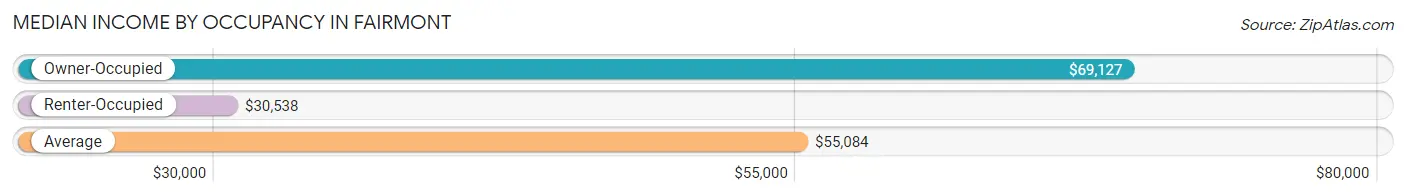
| Occupancy Type | # Households | Median Income |
| Owner-Occupied | 4,864 (61.9%) | $69,127 |
| Renter-Occupied | 2,991 (38.1%) | $30,538 |
| Average | 7,855 (100.0%) | $55,084 |
Occupancy by Householder Income Bracket in Fairmont
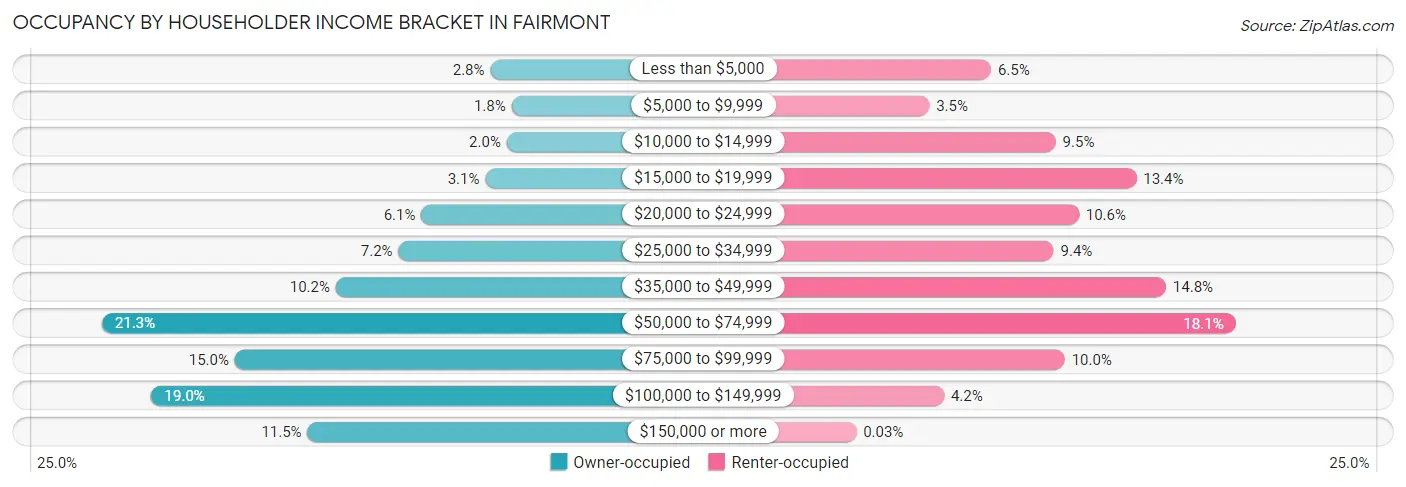
| Income Bracket | Owner-occupied | Renter-occupied |
| Less than $5,000 | 137 (2.8%) | 193 (6.5%) |
| $5,000 to $9,999 | 88 (1.8%) | 105 (3.5%) |
| $10,000 to $14,999 | 99 (2.0%) | 285 (9.5%) |
| $15,000 to $19,999 | 149 (3.1%) | 400 (13.4%) |
| $20,000 to $24,999 | 297 (6.1%) | 318 (10.6%) |
| $25,000 to $34,999 | 350 (7.2%) | 282 (9.4%) |
| $35,000 to $49,999 | 495 (10.2%) | 442 (14.8%) |
| $50,000 to $74,999 | 1,037 (21.3%) | 541 (18.1%) |
| $75,000 to $99,999 | 729 (15.0%) | 298 (10.0%) |
| $100,000 to $149,999 | 922 (19.0%) | 126 (4.2%) |
| $150,000 or more | 561 (11.5%) | 1 (0.0%) |
| Total | 4,864 (100.0%) | 2,991 (100.0%) |
Monthly Housing Cost Tiers in Fairmont
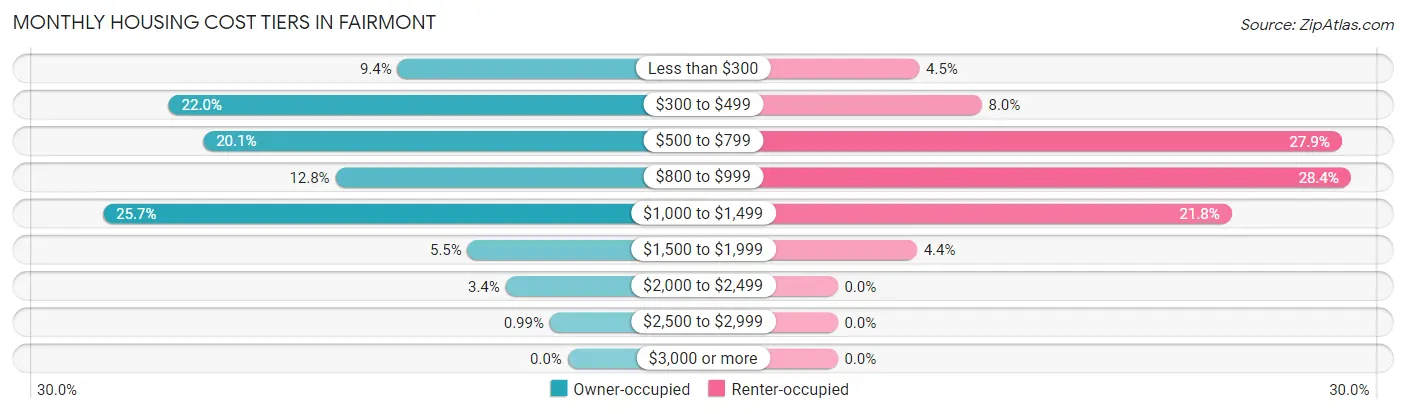
| Monthly Cost | Owner-occupied | Renter-occupied |
| Less than $300 | 457 (9.4%) | 135 (4.5%) |
| $300 to $499 | 1,072 (22.0%) | 238 (8.0%) |
| $500 to $799 | 979 (20.1%) | 833 (27.9%) |
| $800 to $999 | 624 (12.8%) | 848 (28.3%) |
| $1,000 to $1,499 | 1,248 (25.7%) | 651 (21.8%) |
| $1,500 to $1,999 | 269 (5.5%) | 131 (4.4%) |
| $2,000 to $2,499 | 167 (3.4%) | 0 (0.0%) |
| $2,500 to $2,999 | 48 (1.0%) | 0 (0.0%) |
| $3,000 or more | 0 (0.0%) | 0 (0.0%) |
| Total | 4,864 (100.0%) | 2,991 (100.0%) |
Physical Housing Characteristics in Fairmont
Housing Structures in Fairmont
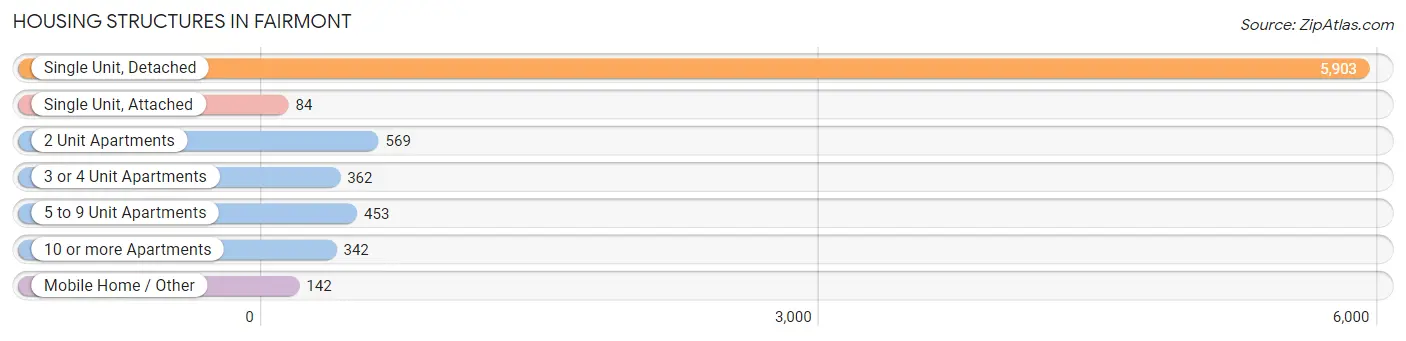
| Structure Type | # Housing Units | % Housing Units |
| Single Unit, Detached | 5,903 | 75.1% |
| Single Unit, Attached | 84 | 1.1% |
| 2 Unit Apartments | 569 | 7.2% |
| 3 or 4 Unit Apartments | 362 | 4.6% |
| 5 to 9 Unit Apartments | 453 | 5.8% |
| 10 or more Apartments | 342 | 4.3% |
| Mobile Home / Other | 142 | 1.8% |
| Total | 7,855 | 100.0% |
Housing Structures by Occupancy in Fairmont
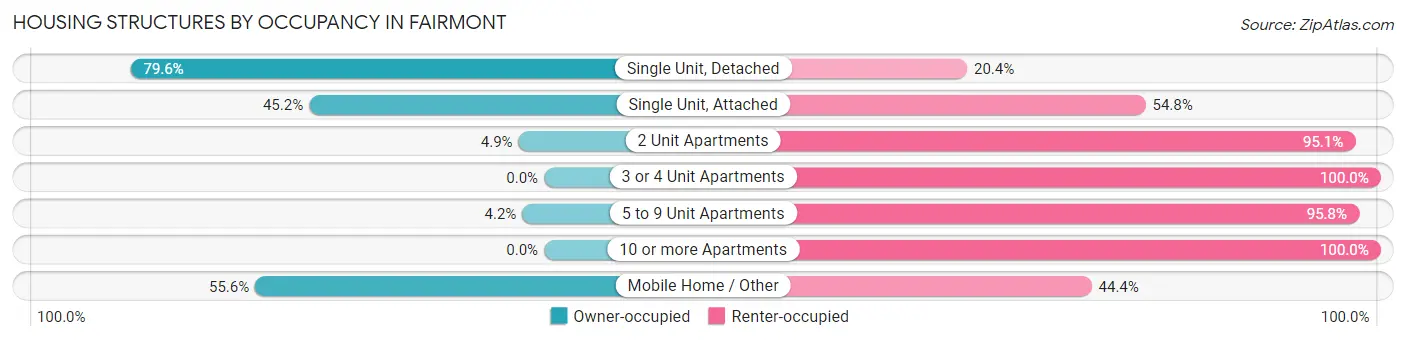
| Structure Type | Owner-occupied | Renter-occupied |
| Single Unit, Detached | 4,700 (79.6%) | 1,203 (20.4%) |
| Single Unit, Attached | 38 (45.2%) | 46 (54.8%) |
| 2 Unit Apartments | 28 (4.9%) | 541 (95.1%) |
| 3 or 4 Unit Apartments | 0 (0.0%) | 362 (100.0%) |
| 5 to 9 Unit Apartments | 19 (4.2%) | 434 (95.8%) |
| 10 or more Apartments | 0 (0.0%) | 342 (100.0%) |
| Mobile Home / Other | 79 (55.6%) | 63 (44.4%) |
| Total | 4,864 (61.9%) | 2,991 (38.1%) |
Housing Structures by Number of Rooms in Fairmont
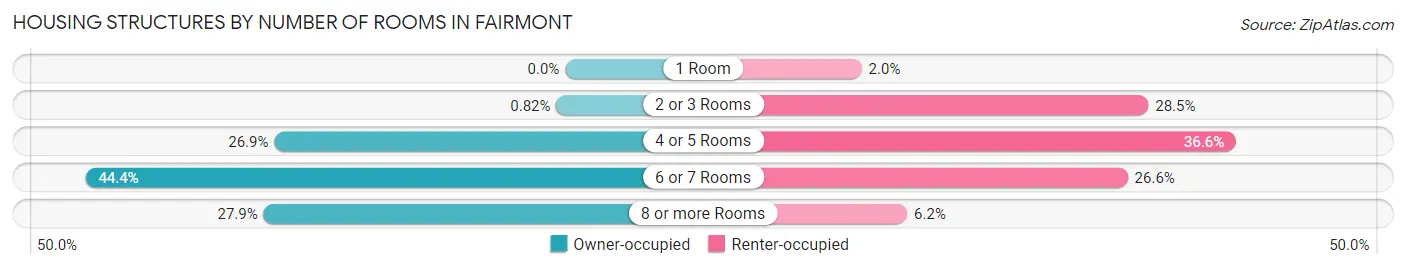
| Number of Rooms | Owner-occupied | Renter-occupied |
| 1 Room | 0 (0.0%) | 60 (2.0%) |
| 2 or 3 Rooms | 40 (0.8%) | 853 (28.5%) |
| 4 or 5 Rooms | 1,309 (26.9%) | 1,096 (36.6%) |
| 6 or 7 Rooms | 2,158 (44.4%) | 796 (26.6%) |
| 8 or more Rooms | 1,357 (27.9%) | 186 (6.2%) |
| Total | 4,864 (100.0%) | 2,991 (100.0%) |
Housing Structure by Heating Type in Fairmont
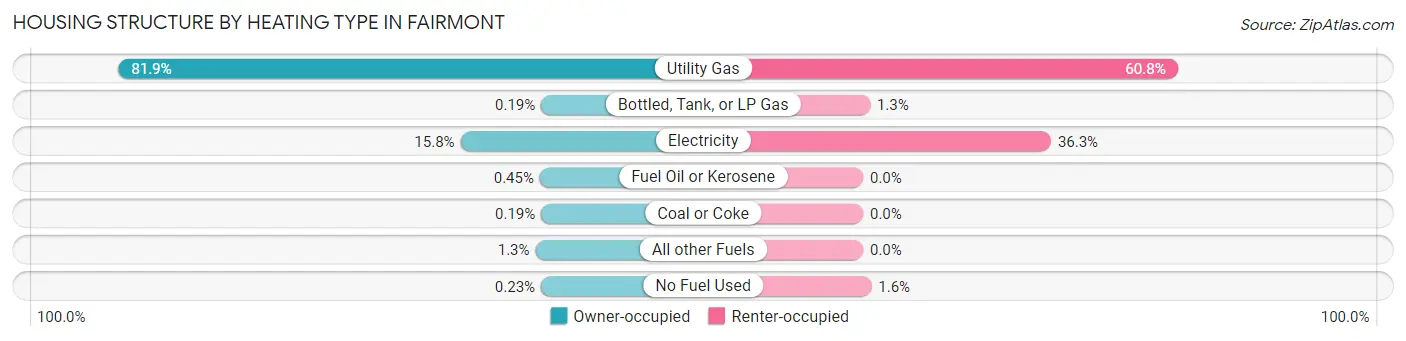
| Heating Type | Owner-occupied | Renter-occupied |
| Utility Gas | 3,982 (81.9%) | 1,817 (60.8%) |
| Bottled, Tank, or LP Gas | 9 (0.2%) | 40 (1.3%) |
| Electricity | 768 (15.8%) | 1,086 (36.3%) |
| Fuel Oil or Kerosene | 22 (0.4%) | 0 (0.0%) |
| Coal or Coke | 9 (0.2%) | 0 (0.0%) |
| All other Fuels | 63 (1.3%) | 0 (0.0%) |
| No Fuel Used | 11 (0.2%) | 48 (1.6%) |
| Total | 4,864 (100.0%) | 2,991 (100.0%) |
Household Vehicle Usage in Fairmont
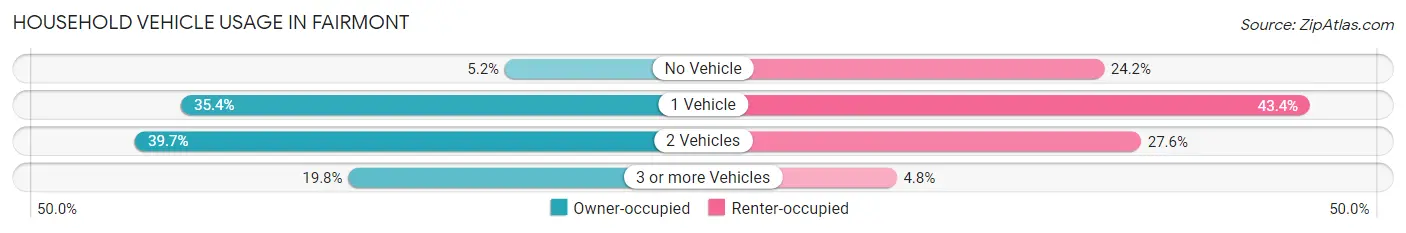
| Vehicles per Household | Owner-occupied | Renter-occupied |
| No Vehicle | 251 (5.2%) | 723 (24.2%) |
| 1 Vehicle | 1,721 (35.4%) | 1,298 (43.4%) |
| 2 Vehicles | 1,930 (39.7%) | 826 (27.6%) |
| 3 or more Vehicles | 962 (19.8%) | 144 (4.8%) |
| Total | 4,864 (100.0%) | 2,991 (100.0%) |
Real Estate & Mortgages in Fairmont
Real Estate and Mortgage Overview in Fairmont
| Characteristic | Without Mortgage | With Mortgage |
| Housing Units | 2,146 | 2,718 |
| Median Property Value | $128,100 | $152,000 |
| Median Household Income | $51,700 | $345 |
| Monthly Housing Costs | $436 | $0 |
| Real Estate Taxes | $841 | $100 |
Property Value by Mortgage Status in Fairmont
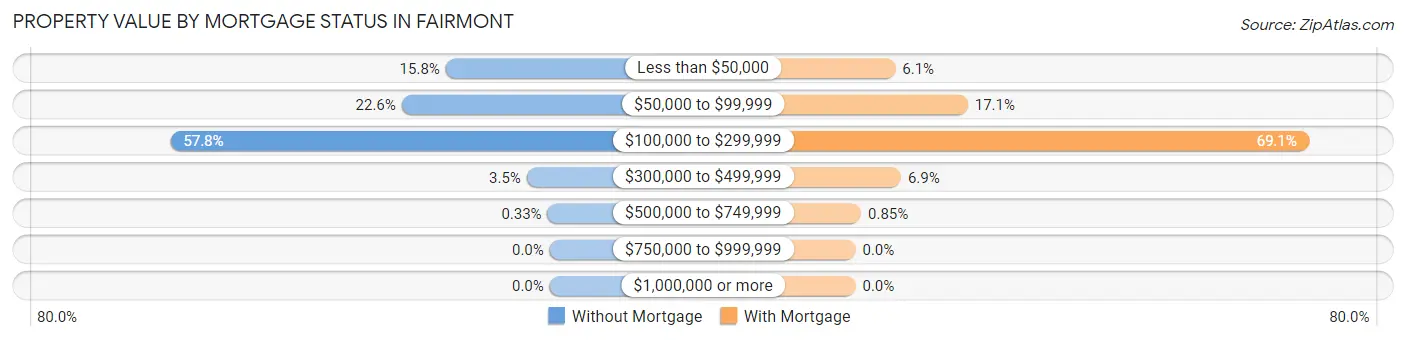
| Property Value | Without Mortgage | With Mortgage |
| Less than $50,000 | 340 (15.8%) | 165 (6.1%) |
| $50,000 to $99,999 | 484 (22.6%) | 465 (17.1%) |
| $100,000 to $299,999 | 1,240 (57.8%) | 1,877 (69.1%) |
| $300,000 to $499,999 | 75 (3.5%) | 188 (6.9%) |
| $500,000 to $749,999 | 7 (0.3%) | 23 (0.9%) |
| $750,000 to $999,999 | 0 (0.0%) | 0 (0.0%) |
| $1,000,000 or more | 0 (0.0%) | 0 (0.0%) |
| Total | 2,146 (100.0%) | 2,718 (100.0%) |
Household Income by Mortgage Status in Fairmont
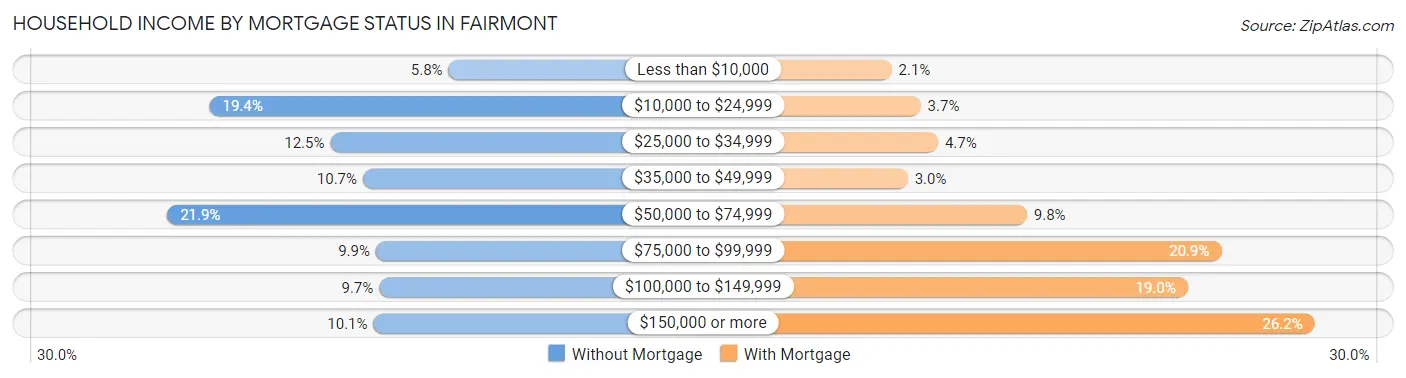
| Household Income | Without Mortgage | With Mortgage |
| Less than $10,000 | 124 (5.8%) | 56 (2.1%) |
| $10,000 to $24,999 | 417 (19.4%) | 101 (3.7%) |
| $25,000 to $34,999 | 269 (12.5%) | 128 (4.7%) |
| $35,000 to $49,999 | 229 (10.7%) | 81 (3.0%) |
| $50,000 to $74,999 | 469 (21.8%) | 266 (9.8%) |
| $75,000 to $99,999 | 213 (9.9%) | 568 (20.9%) |
| $100,000 to $149,999 | 209 (9.7%) | 516 (19.0%) |
| $150,000 or more | 216 (10.1%) | 713 (26.2%) |
| Total | 2,146 (100.0%) | 2,718 (100.0%) |
Property Value to Household Income Ratio in Fairmont
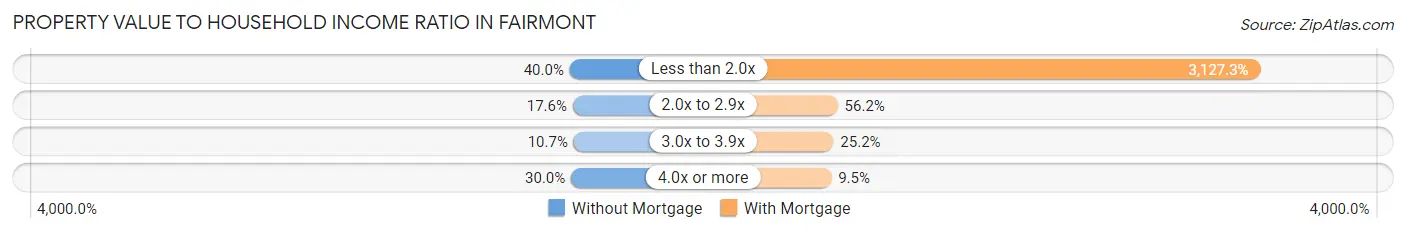
| Value-to-Income Ratio | Without Mortgage | With Mortgage |
| Less than 2.0x | 858 (40.0%) | 85,000 (3,127.3%) |
| 2.0x to 2.9x | 378 (17.6%) | 1,528 (56.2%) |
| 3.0x to 3.9x | 230 (10.7%) | 686 (25.2%) |
| 4.0x or more | 644 (30.0%) | 257 (9.5%) |
| Total | 2,146 (100.0%) | 2,718 (100.0%) |
Real Estate Taxes by Mortgage Status in Fairmont
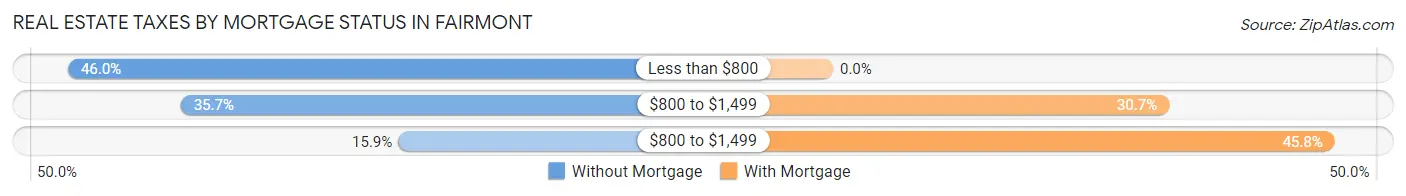
| Property Taxes | Without Mortgage | With Mortgage |
| Less than $800 | 988 (46.0%) | 0 (0.0%) |
| $800 to $1,499 | 767 (35.7%) | 834 (30.7%) |
| $800 to $1,499 | 341 (15.9%) | 1,245 (45.8%) |
| Total | 2,146 (100.0%) | 2,718 (100.0%) |
Health & Disability in Fairmont
Health Insurance Coverage by Age in Fairmont
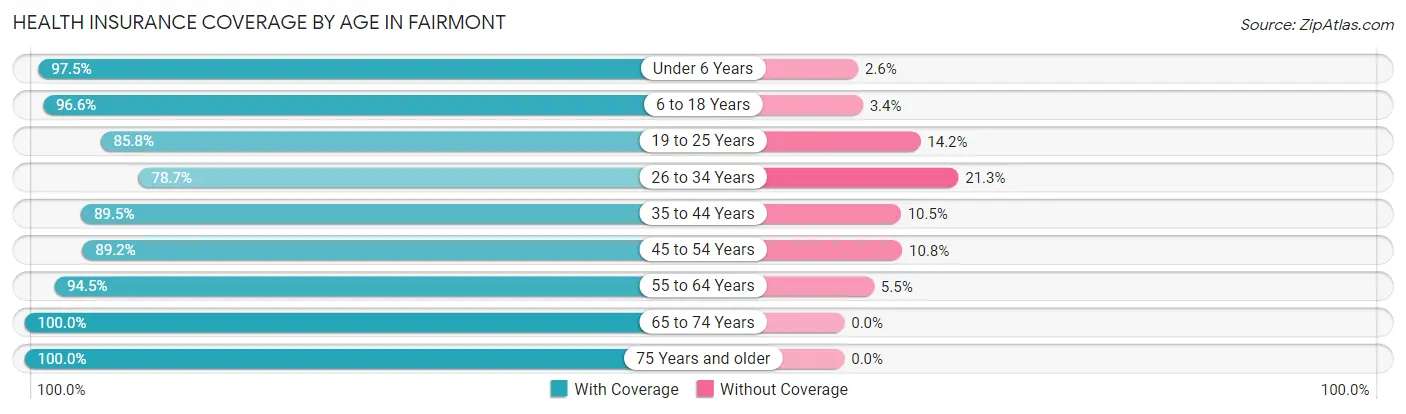
| Age Bracket | With Coverage | Without Coverage |
| Under 6 Years | 1,146 (97.5%) | 30 (2.5%) |
| 6 to 18 Years | 2,392 (96.6%) | 85 (3.4%) |
| 19 to 25 Years | 2,578 (85.8%) | 426 (14.2%) |
| 26 to 34 Years | 1,967 (78.7%) | 531 (21.3%) |
| 35 to 44 Years | 1,999 (89.5%) | 235 (10.5%) |
| 45 to 54 Years | 1,639 (89.2%) | 198 (10.8%) |
| 55 to 64 Years | 1,832 (94.5%) | 107 (5.5%) |
| 65 to 74 Years | 1,889 (100.0%) | 0 (0.0%) |
| 75 Years and older | 1,214 (100.0%) | 0 (0.0%) |
| Total | 16,656 (91.2%) | 1,612 (8.8%) |
Health Insurance Coverage by Citizenship Status in Fairmont
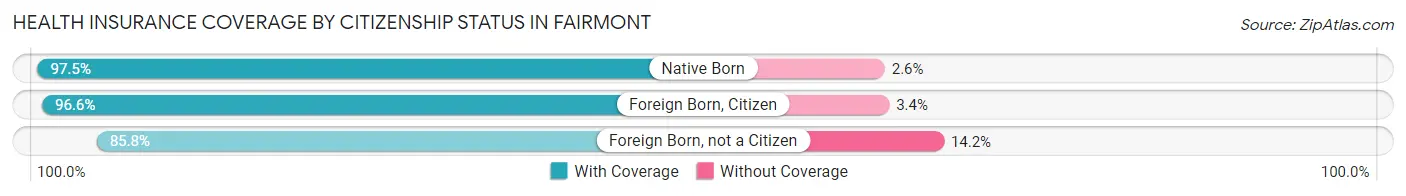
| Citizenship Status | With Coverage | Without Coverage |
| Native Born | 1,146 (97.5%) | 30 (2.5%) |
| Foreign Born, Citizen | 2,392 (96.6%) | 85 (3.4%) |
| Foreign Born, not a Citizen | 2,578 (85.8%) | 426 (14.2%) |
Health Insurance Coverage by Household Income in Fairmont
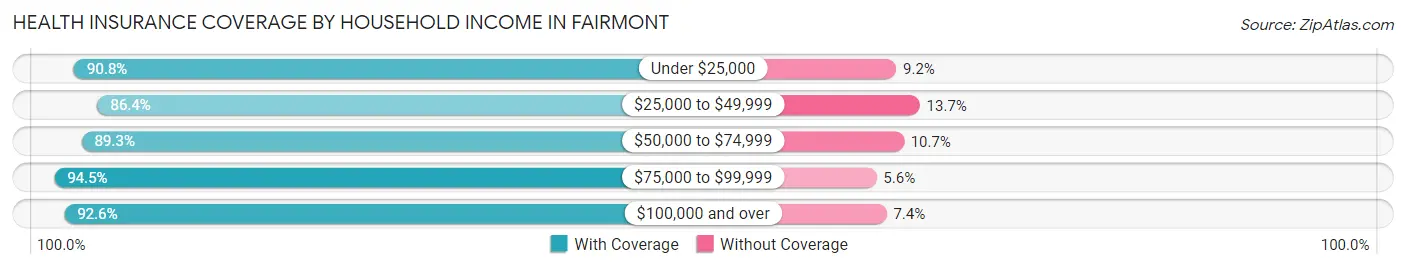
| Household Income | With Coverage | Without Coverage |
| Under $25,000 | 3,350 (90.8%) | 341 (9.2%) |
| $25,000 to $49,999 | 2,417 (86.4%) | 382 (13.7%) |
| $50,000 to $74,999 | 2,901 (89.3%) | 346 (10.7%) |
| $75,000 to $99,999 | 2,671 (94.5%) | 157 (5.6%) |
| $100,000 and over | 4,436 (92.6%) | 356 (7.4%) |
Public vs Private Health Insurance Coverage by Age in Fairmont
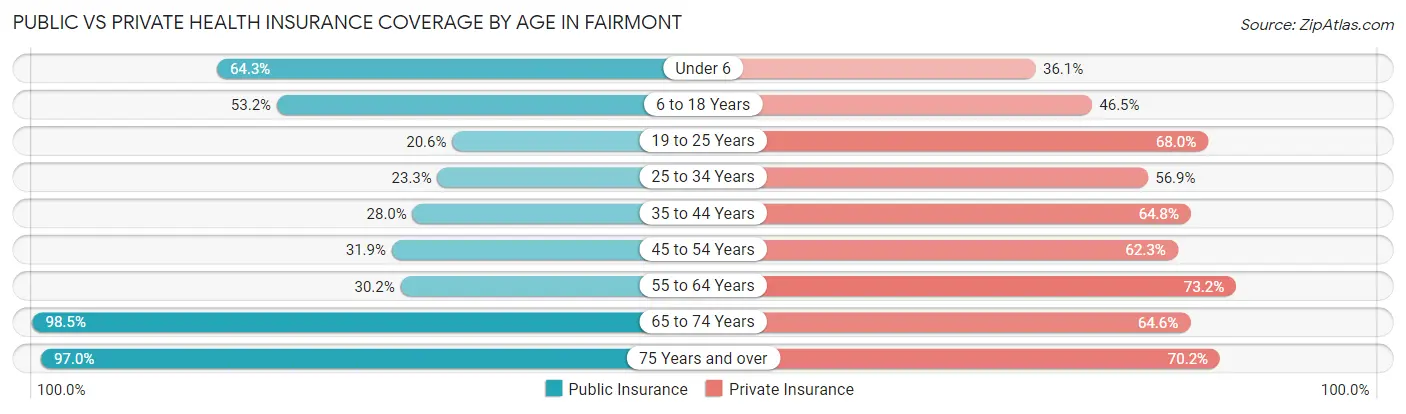
| Age Bracket | Public Insurance | Private Insurance |
| Under 6 | 756 (64.3%) | 424 (36.0%) |
| 6 to 18 Years | 1,317 (53.2%) | 1,152 (46.5%) |
| 19 to 25 Years | 619 (20.6%) | 2,042 (68.0%) |
| 25 to 34 Years | 583 (23.3%) | 1,421 (56.9%) |
| 35 to 44 Years | 625 (28.0%) | 1,447 (64.8%) |
| 45 to 54 Years | 585 (31.9%) | 1,145 (62.3%) |
| 55 to 64 Years | 586 (30.2%) | 1,419 (73.2%) |
| 65 to 74 Years | 1,861 (98.5%) | 1,221 (64.6%) |
| 75 Years and over | 1,177 (97.0%) | 852 (70.2%) |
| Total | 8,109 (44.4%) | 11,123 (60.9%) |
Disability Status by Sex by Age in Fairmont
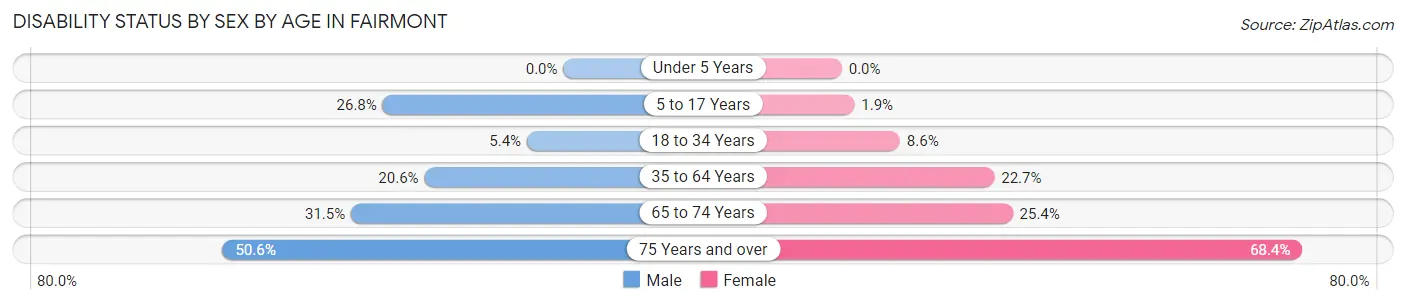
| Age Bracket | Male | Female |
| Under 5 Years | 0 (0.0%) | 0 (0.0%) |
| 5 to 17 Years | 350 (26.8%) | 17 (1.9%) |
| 18 to 34 Years | 156 (5.4%) | 257 (8.6%) |
| 35 to 64 Years | 604 (20.6%) | 698 (22.7%) |
| 65 to 74 Years | 286 (31.5%) | 249 (25.4%) |
| 75 Years and over | 248 (50.6%) | 495 (68.4%) |
Disability Class by Sex by Age in Fairmont
Disability Class: Hearing Difficulty
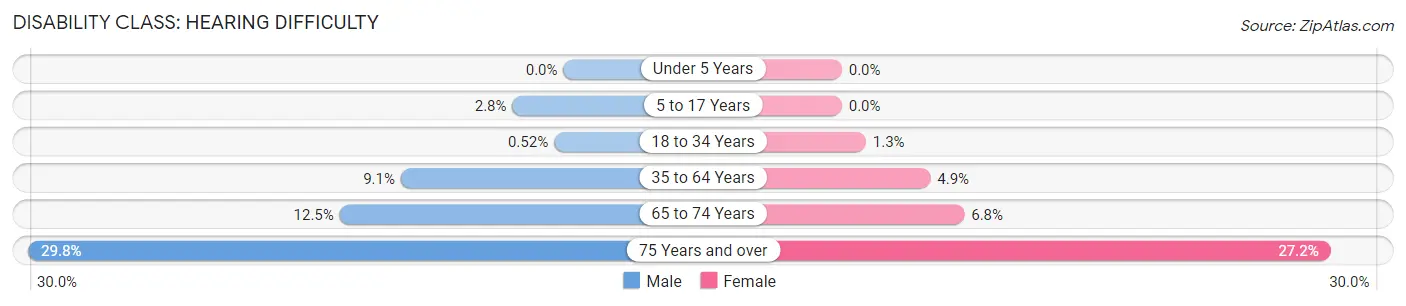
| Age Bracket | Male | Female |
| Under 5 Years | 0 (0.0%) | 0 (0.0%) |
| 5 to 17 Years | 37 (2.8%) | 0 (0.0%) |
| 18 to 34 Years | 15 (0.5%) | 40 (1.3%) |
| 35 to 64 Years | 265 (9.0%) | 152 (4.9%) |
| 65 to 74 Years | 113 (12.5%) | 67 (6.8%) |
| 75 Years and over | 146 (29.8%) | 197 (27.2%) |
Disability Class: Vision Difficulty
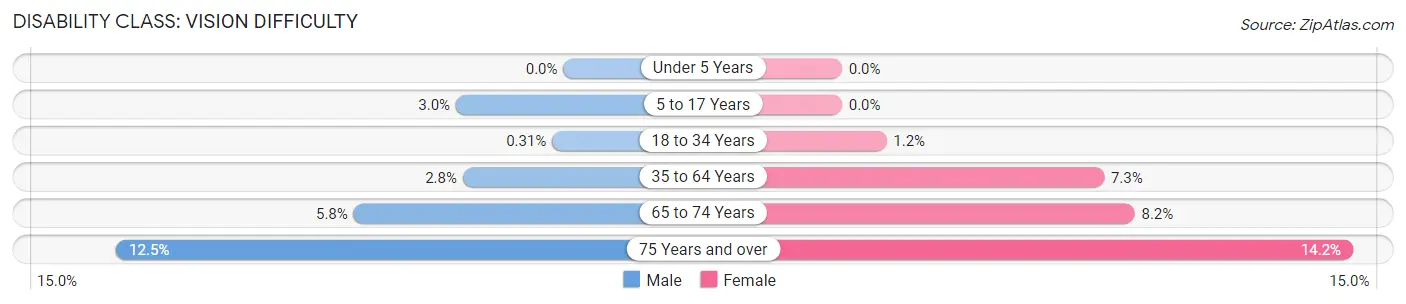
| Age Bracket | Male | Female |
| Under 5 Years | 0 (0.0%) | 0 (0.0%) |
| 5 to 17 Years | 39 (3.0%) | 0 (0.0%) |
| 18 to 34 Years | 9 (0.3%) | 37 (1.2%) |
| 35 to 64 Years | 82 (2.8%) | 225 (7.3%) |
| 65 to 74 Years | 53 (5.8%) | 80 (8.2%) |
| 75 Years and over | 61 (12.4%) | 103 (14.2%) |
Disability Class: Cognitive Difficulty
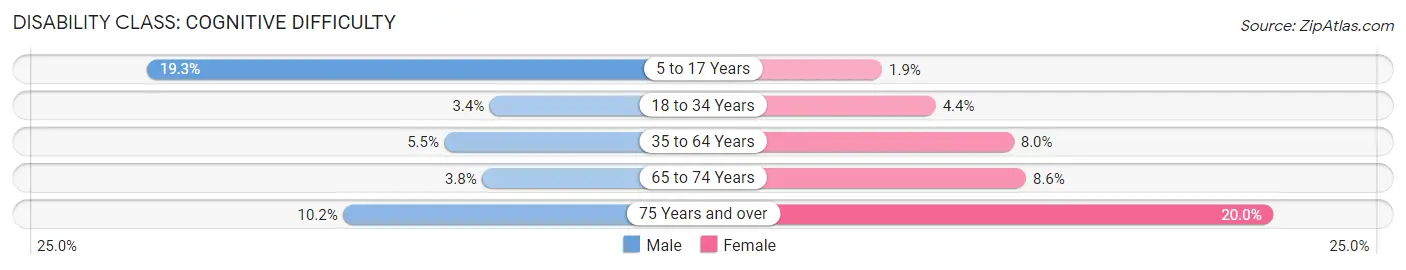
| Age Bracket | Male | Female |
| 5 to 17 Years | 252 (19.3%) | 17 (1.9%) |
| 18 to 34 Years | 98 (3.4%) | 130 (4.4%) |
| 35 to 64 Years | 161 (5.5%) | 246 (8.0%) |
| 65 to 74 Years | 34 (3.7%) | 84 (8.6%) |
| 75 Years and over | 50 (10.2%) | 145 (20.0%) |
Disability Class: Ambulatory Difficulty
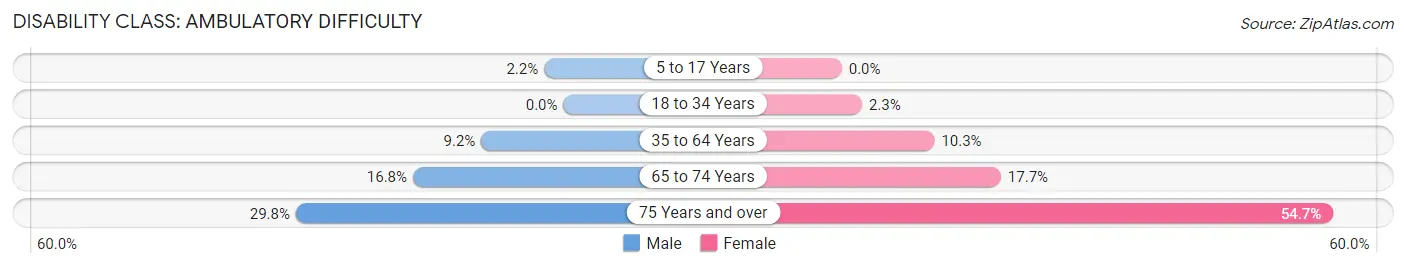
| Age Bracket | Male | Female |
| 5 to 17 Years | 28 (2.1%) | 0 (0.0%) |
| 18 to 34 Years | 0 (0.0%) | 67 (2.2%) |
| 35 to 64 Years | 268 (9.1%) | 318 (10.3%) |
| 65 to 74 Years | 152 (16.8%) | 174 (17.7%) |
| 75 Years and over | 146 (29.8%) | 396 (54.7%) |
Disability Class: Self-Care Difficulty
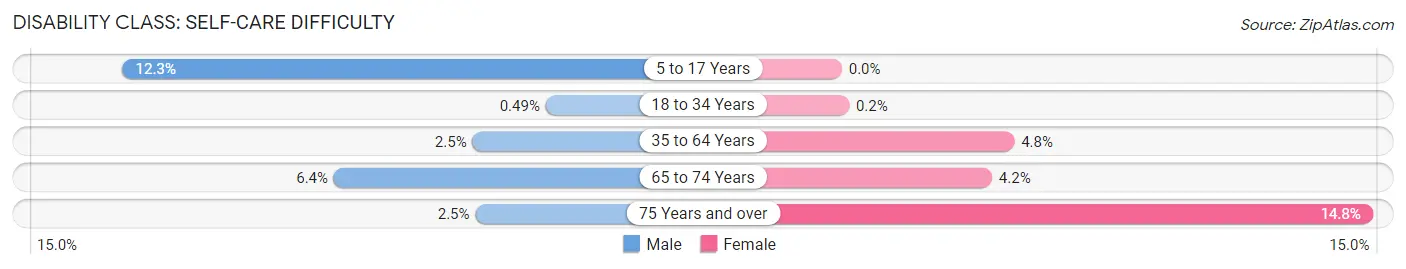
| Age Bracket | Male | Female |
| 5 to 17 Years | 160 (12.3%) | 0 (0.0%) |
| 18 to 34 Years | 14 (0.5%) | 6 (0.2%) |
| 35 to 64 Years | 74 (2.5%) | 148 (4.8%) |
| 65 to 74 Years | 58 (6.4%) | 41 (4.2%) |
| 75 Years and over | 12 (2.5%) | 107 (14.8%) |
Technology Access in Fairmont
Computing Device Access in Fairmont
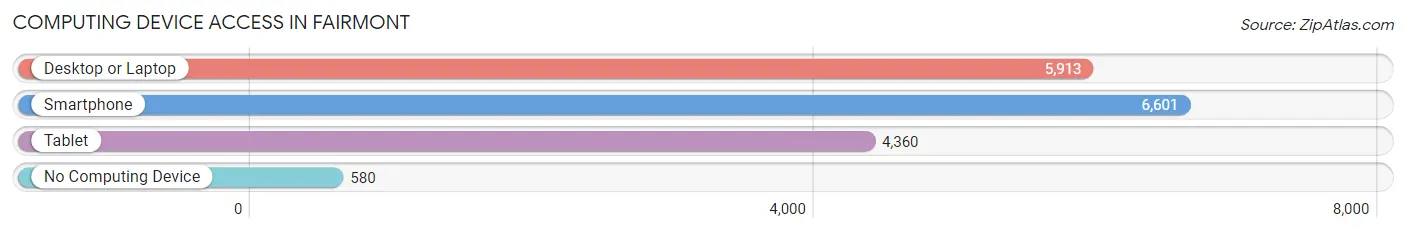
| Device Type | # Households | % Households |
| Desktop or Laptop | 5,913 | 75.3% |
| Smartphone | 6,601 | 84.0% |
| Tablet | 4,360 | 55.5% |
| No Computing Device | 580 | 7.4% |
| Total | 7,855 | 100.0% |
Internet Access in Fairmont
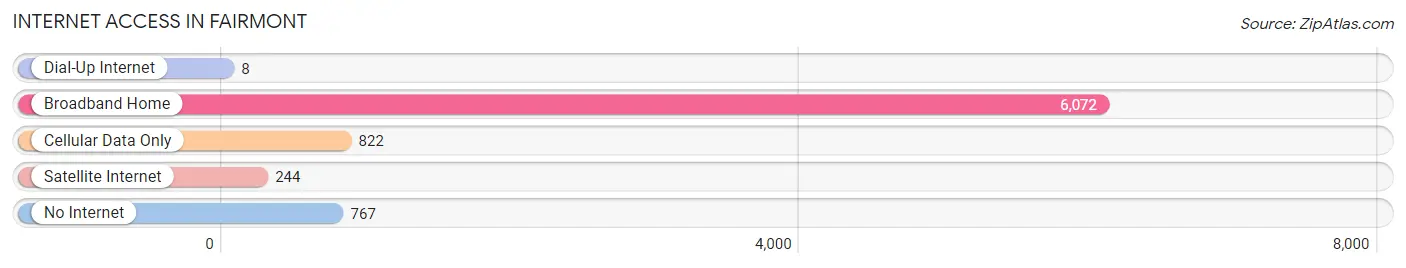
| Internet Type | # Households | % Households |
| Dial-Up Internet | 8 | 0.1% |
| Broadband Home | 6,072 | 77.3% |
| Cellular Data Only | 822 | 10.5% |
| Satellite Internet | 244 | 3.1% |
| No Internet | 767 | 9.8% |
| Total | 7,855 | 100.0% |
Fairmont Summary
History
The city of Fairmont, West Virginia is located in the northern part of the state, in Marion County. It is situated along the Monongahela River, and is the county seat of Marion County. The city was founded in 1820, and was originally known as Middletown. It was later renamed Fairmont in 1843, after the daughter of one of the city’s founders, Colonel Alexander Scott.
The city of Fairmont has a rich history, and has been home to many notable figures throughout its history. One of the most famous is General Thomas “Stonewall” Jackson, who was born in the city in 1824. He is best known for his service in the Confederate Army during the American Civil War.
The city of Fairmont has also been home to many other notable figures, including former U.S. Senator Robert C. Byrd, who was born in the city in 1917. Byrd served in the U.S. Senate for more than 50 years, and was the longest-serving senator in U.S. history.
The city of Fairmont has also been home to many other notable figures, including former U.S. Senator Robert C. Byrd, who was born in the city in 1917. Byrd served in the U.S. Senate for more than 50 years, and was the longest-serving senator in U.S. history.
The city of Fairmont has also been home to many other notable figures, including former U.S. Senator Robert C. Byrd, who was born in the city in 1917. Byrd served in the U.S. Senate for more than 50 years, and was the longest-serving senator in U.S. history.
The city of Fairmont has also been home to many other notable figures, including former U.S. Senator Robert C. Byrd, who was born in the city in 1917. Byrd served in the U.S. Senate for more than 50 years, and was the longest-serving senator in U.S. history.
The city of Fairmont has also been home to many other notable figures, including former U.S. Senator Robert C. Byrd, who was born in the city in 1917. Byrd served in the U.S. Senate for more than 50 years, and was the longest-serving senator in U.S. history.
The city of Fairmont has also been home to many other notable figures, including former U.S. Senator Robert C. Byrd, who was born in the city in 1917. Byrd served in the U.S. Senate for more than 50 years, and was the longest-serving senator in U.S. history.
The city of Fairmont has also been home to many other notable figures, including former U.S. Senator Robert C. Byrd, who was born in the city in 1917. Byrd served in the U.S. Senate for more than 50 years, and was the longest-serving senator in U.S. history.
Geography
Fairmont is located in the northern part of West Virginia, in Marion County. It is situated along the Monongahela River, and is the county seat of Marion County. The city is located at the intersection of Interstate 79 and U.S. Route 250. The city is located in the Appalachian Mountains, and is surrounded by rolling hills and forests. The city is located at an elevation of 1,000 feet above sea level.
The climate in Fairmont is humid continental, with hot summers and cold winters. The average temperature in the summer is around 75 degrees Fahrenheit, and the average temperature in the winter is around 30 degrees Fahrenheit. The city receives an average of 40 inches of precipitation per year.
Economy
The economy of Fairmont is largely based on the service industry, with many businesses providing services to the local population. The city is home to several large employers, including Fairmont State University, Fairmont General Hospital, and the West Virginia University Health System. The city is also home to several manufacturing companies, including the Fairmont Creamery Company, which produces ice cream and other dairy products.
The city of Fairmont is also home to several retail stores, including the Fairmont Mall, which is the largest shopping center in the city. The city is also home to several restaurants, bars, and other entertainment venues.
Demographics
As of the 2010 census, the population of Fairmont was 18,704. The racial makeup of the city was 91.3% White, 4.7% African American, 0.3% Native American, 0.7% Asian, 0.1% Pacific Islander, 1.2% from other races, and 1.9% from two or more races. Hispanic or Latino of any race were 2.7% of the population.
The median income for a household in the city was $30,945, and the median income for a family was $41,945. The per capita income for the city was $19,845. About 15.3% of families and 19.2% of the population were below the poverty line, including 28.2% of those under age 18 and 8.7% of those age 65 or over.
Common Questions
What is Per Capita Income in Fairmont?
Per Capita income in Fairmont is $29,445.
What is the Median Family Income in Fairmont?
Median Family Income in Fairmont is $74,850.
What is the Median Household income in Fairmont?
Median Household Income in Fairmont is $55,084.
What is Income or Wage Gap in Fairmont?
Income or Wage Gap in Fairmont is 21.5%.
Women in Fairmont earn 78.5 cents for every dollar earned by a man.
What is Family Income Deficit in Fairmont?
Family Income Deficit in Fairmont is $10,283.
Families that are below poverty line in Fairmont earn $10,283 less on average than the poverty threshold level.
What is Inequality or Gini Index in Fairmont?
Inequality or Gini Index in Fairmont is 0.44.
What is the Total Population of Fairmont?
Total Population of Fairmont is 18,402.
What is the Total Male Population of Fairmont?
Total Male Population of Fairmont is 9,167.
What is the Total Female Population of Fairmont?
Total Female Population of Fairmont is 9,235.
What is the Ratio of Males per 100 Females in Fairmont?
There are 99.26 Males per 100 Females in Fairmont.
What is the Ratio of Females per 100 Males in Fairmont?
There are 100.74 Females per 100 Males in Fairmont.
What is the Median Population Age in Fairmont?
Median Population Age in Fairmont is 35.2 Years.
What is the Average Family Size in Fairmont
Average Family Size in Fairmont is 2.9 People.
What is the Average Household Size in Fairmont
Average Household Size in Fairmont is 2.2 People.
How Large is the Labor Force in Fairmont?
There are 9,522 People in the Labor Forcein in Fairmont.
What is the Percentage of People in the Labor Force in Fairmont?
62.2% of People are in the Labor Force in Fairmont.
What is the Unemployment Rate in Fairmont?
Unemployment Rate in Fairmont is 7.9%.