Nitro, WV Map & Demographics
Nitro Map
Nitro Overview
$35,027
PER CAPITA INCOME
$70,688
AVG FAMILY INCOME
$49,742
AVG HOUSEHOLD INCOME
18.4%
WAGE / INCOME GAP [ % ]
81.6¢/ $1
WAGE / INCOME GAP [ $ ]
0.52
INEQUALITY / GINI INDEX
6,540
TOTAL POPULATION
3,037
MALE POPULATION
3,503
FEMALE POPULATION
86.70
MALES / 100 FEMALES
115.34
FEMALES / 100 MALES
45.1
MEDIAN AGE
3.0
AVG FAMILY SIZE
2.3
AVG HOUSEHOLD SIZE
3,012
LABOR FORCE [ PEOPLE ]
58.3%
PERCENT IN LABOR FORCE
8.3%
UNEMPLOYMENT RATE
Nitro Zip Codes
Nitro Area Codes
Income in Nitro
Income Overview in Nitro
Per Capita Income in Nitro is $35,027, while median incomes of families and households are $70,688 and $49,742 respectively.
| Characteristic | Number | Measure |
| Per Capita Income | 6,540 | $35,027 |
| Median Family Income | 1,736 | $70,688 |
| Mean Family Income | 1,736 | $97,059 |
| Median Household Income | 2,851 | $49,742 |
| Mean Household Income | 2,851 | $73,527 |
| Income Deficit | 1,736 | $0 |
| Wage / Income Gap (%) | 6,540 | 18.44% |
| Wage / Income Gap ($) | 6,540 | 81.56¢ per $1 |
| Gini / Inequality Index | 6,540 | 0.52 |
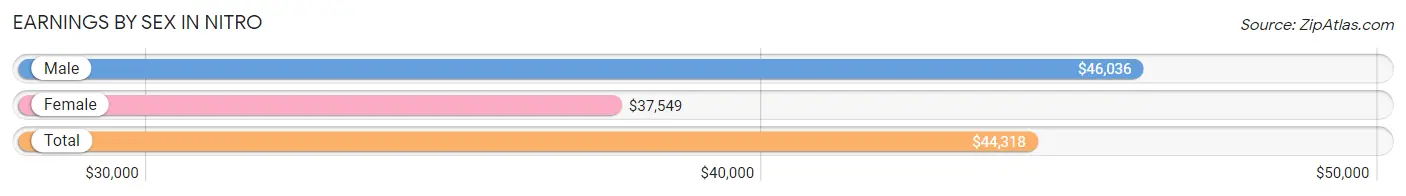
Earnings by Sex in Nitro
Average Earnings in Nitro are $44,318, $46,036 for men and $37,549 for women, a difference of 18.4%.
| Sex | Number | Average Earnings |
| Male | 1,703 (54.4%) | $46,036 |
| Female | 1,429 (45.6%) | $37,549 |
| Total | 3,132 (100.0%) | $44,318 |
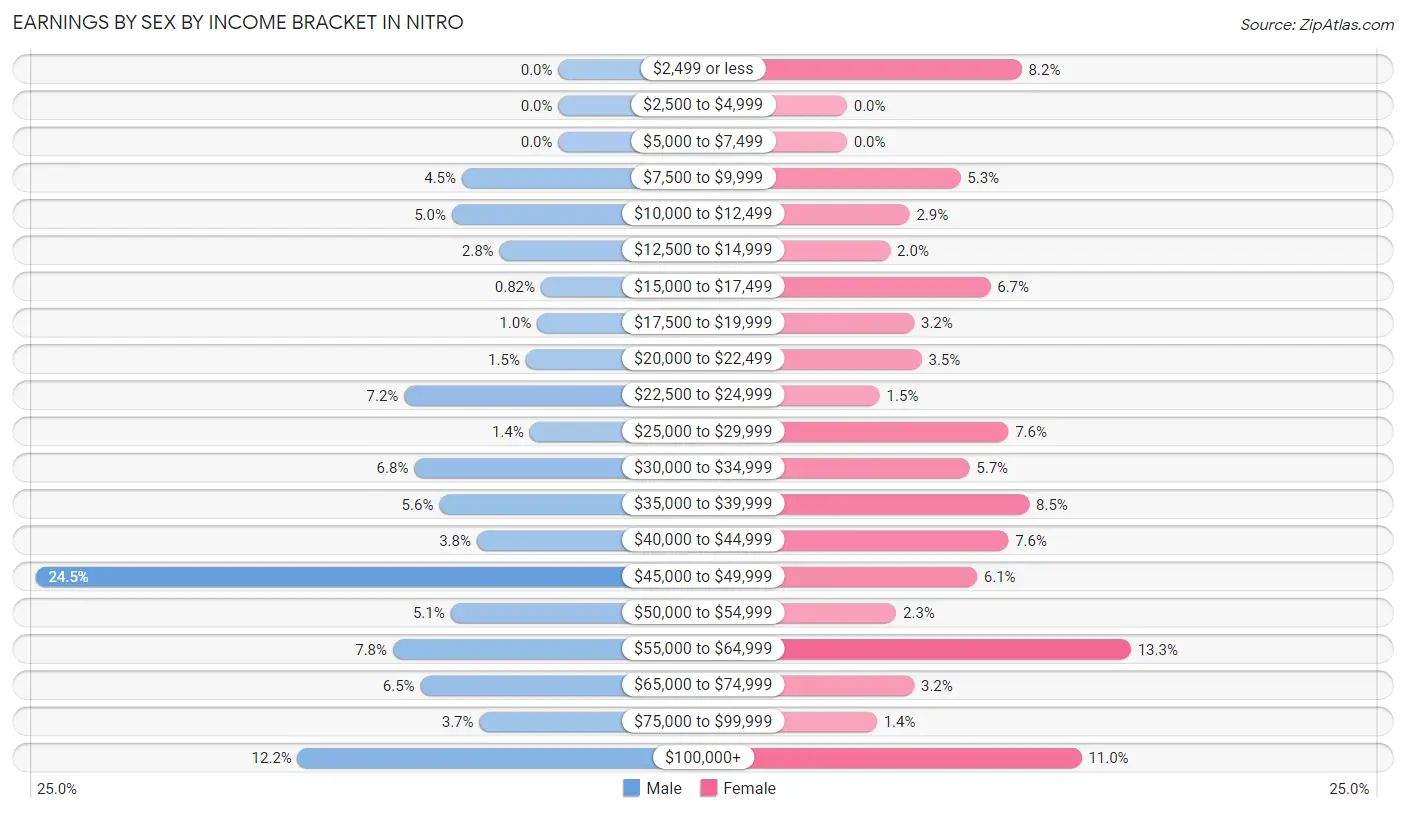
Earnings by Sex by Income Bracket in Nitro
The most common earnings brackets in Nitro are $45,000 to $49,999 for men (417 | 24.5%) and $55,000 to $64,999 for women (190 | 13.3%).
| Income | Male | Female |
| $2,499 or less | 0 (0.0%) | 117 (8.2%) |
| $2,500 to $4,999 | 0 (0.0%) | 0 (0.0%) |
| $5,000 to $7,499 | 0 (0.0%) | 0 (0.0%) |
| $7,500 to $9,999 | 77 (4.5%) | 76 (5.3%) |
| $10,000 to $12,499 | 85 (5.0%) | 42 (2.9%) |
| $12,500 to $14,999 | 47 (2.8%) | 29 (2.0%) |
| $15,000 to $17,499 | 14 (0.8%) | 96 (6.7%) |
| $17,500 to $19,999 | 17 (1.0%) | 45 (3.2%) |
| $20,000 to $22,499 | 26 (1.5%) | 50 (3.5%) |
| $22,500 to $24,999 | 123 (7.2%) | 22 (1.5%) |
| $25,000 to $29,999 | 23 (1.3%) | 108 (7.6%) |
| $30,000 to $34,999 | 115 (6.8%) | 82 (5.7%) |
| $35,000 to $39,999 | 95 (5.6%) | 122 (8.5%) |
| $40,000 to $44,999 | 65 (3.8%) | 108 (7.6%) |
| $45,000 to $49,999 | 417 (24.5%) | 87 (6.1%) |
| $50,000 to $54,999 | 86 (5.1%) | 33 (2.3%) |
| $55,000 to $64,999 | 132 (7.7%) | 190 (13.3%) |
| $65,000 to $74,999 | 110 (6.5%) | 45 (3.2%) |
| $75,000 to $99,999 | 63 (3.7%) | 20 (1.4%) |
| $100,000+ | 208 (12.2%) | 157 (11.0%) |
| Total | 1,703 (100.0%) | 1,429 (100.0%) |
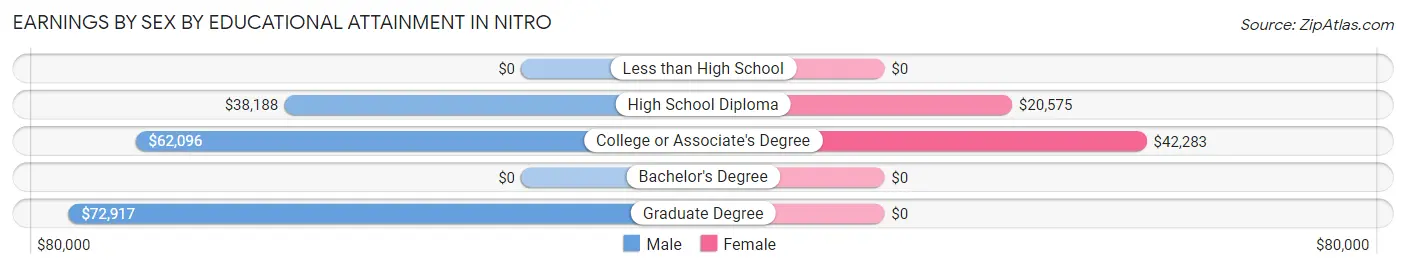
Earnings by Sex by Educational Attainment in Nitro
Average earnings in Nitro are $46,675 for men and $39,572 for women, a difference of 15.2%. Men with an educational attainment of graduate degree enjoy the highest average annual earnings of $72,917, while those with high school diploma education earn the least with $38,188. Women with an educational attainment of college or associate's degree earn the most with the average annual earnings of $42,283, while those with high school diploma education have the smallest earnings of $20,575.
| Educational Attainment | Male Income | Female Income |
| Less than High School | - | - |
| High School Diploma | $38,188 | $20,575 |
| College or Associate's Degree | $62,096 | $42,283 |
| Bachelor's Degree | - | - |
| Graduate Degree | $72,917 | $0 |
| Total | $46,675 | $39,572 |
Family Income in Nitro
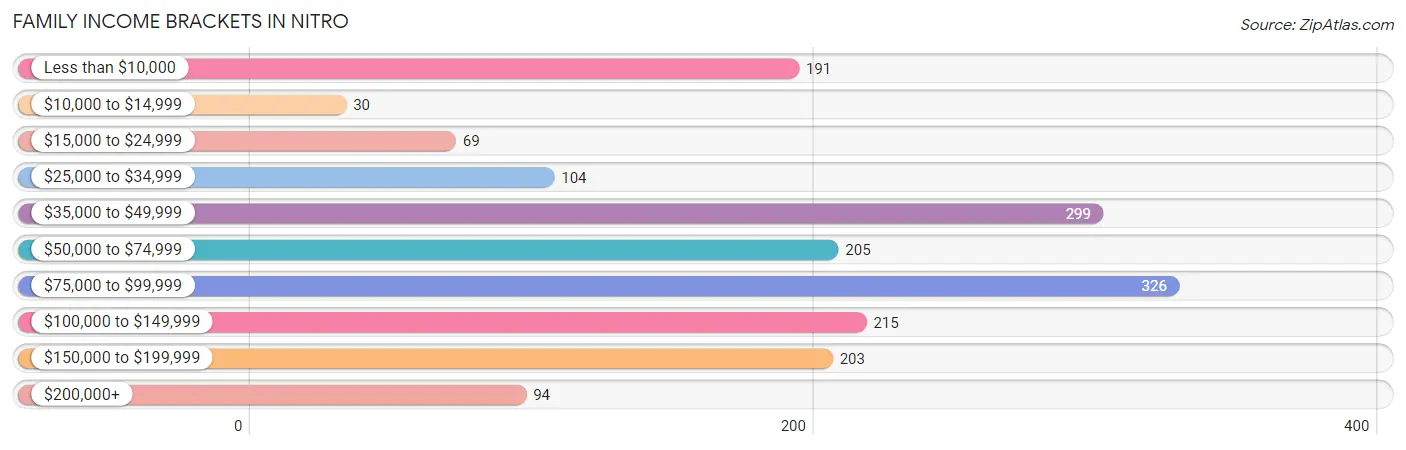
Family Income Brackets in Nitro
According to the Nitro family income data, there are 326 families falling into the $75,000 to $99,999 income range, which is the most common income bracket and makes up 18.8% of all families. Conversely, the $10,000 to $14,999 income bracket is the least frequent group with only 30 families (1.7%) belonging to this category.
| Income Bracket | # Families | % Families |
| Less than $10,000 | 191 | 11.0% |
| $10,000 to $14,999 | 30 | 1.7% |
| $15,000 to $24,999 | 69 | 4.0% |
| $25,000 to $34,999 | 104 | 6.0% |
| $35,000 to $49,999 | 299 | 17.2% |
| $50,000 to $74,999 | 205 | 11.8% |
| $75,000 to $99,999 | 326 | 18.8% |
| $100,000 to $149,999 | 215 | 12.4% |
| $150,000 to $199,999 | 203 | 11.7% |
| $200,000+ | 94 | 5.4% |
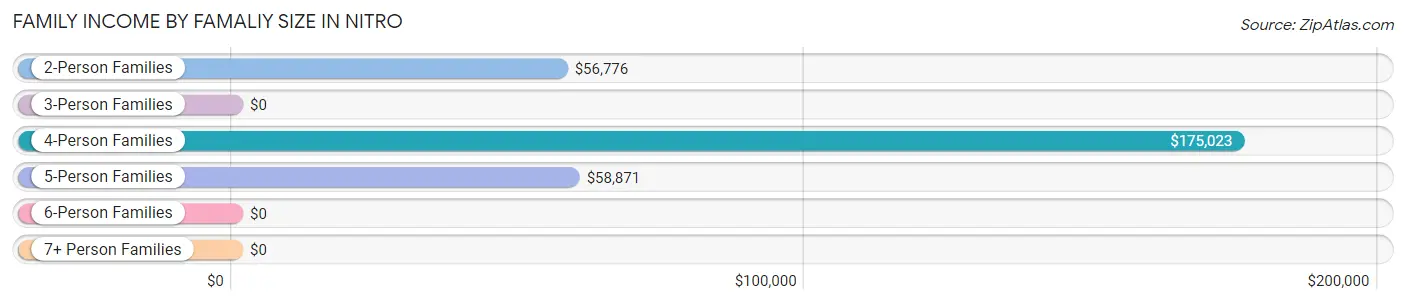
Family Income by Famaliy Size in Nitro
4-person families (212 | 12.2%) account for the highest median family income in Nitro with $175,023 per family, while 4-person families (212 | 12.2%) have the highest median income of $43,756 per family member.
| Income Bracket | # Families | Median Income |
| 2-Person Families | 977 (56.3%) | $56,776 |
| 3-Person Families | 441 (25.4%) | $0 |
| 4-Person Families | 212 (12.2%) | $175,023 |
| 5-Person Families | 64 (3.7%) | $58,871 |
| 6-Person Families | 42 (2.4%) | $0 |
| 7+ Person Families | 0 (0.0%) | $0 |
| Total | 1,736 (100.0%) | $70,688 |
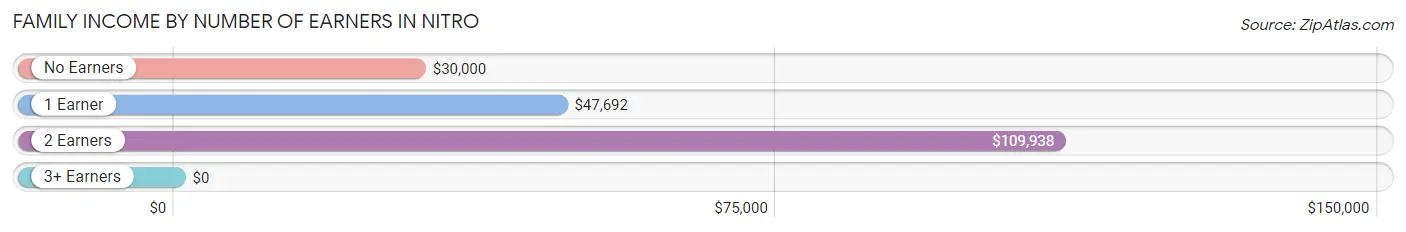
Family Income by Number of Earners in Nitro
| Number of Earners | # Families | Median Income |
| No Earners | 408 (23.5%) | $30,000 |
| 1 Earner | 520 (29.9%) | $47,692 |
| 2 Earners | 769 (44.3%) | $109,938 |
| 3+ Earners | 39 (2.2%) | $0 |
| Total | 1,736 (100.0%) | $70,688 |
Household Income in Nitro
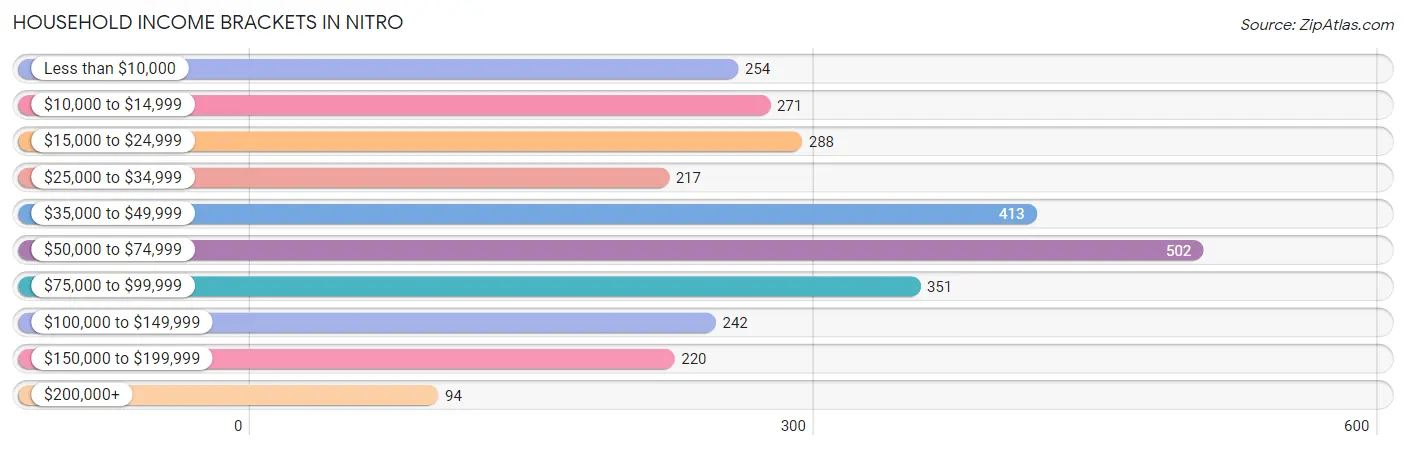
Household Income Brackets in Nitro
With 502 households falling in the category, the $50,000 to $74,999 income range is the most frequent in Nitro, accounting for 17.6% of all households. In contrast, only 94 households (3.3%) fall into the $200,000+ income bracket, making it the least populous group.
| Income Bracket | # Households | % Households |
| Less than $10,000 | 254 | 8.9% |
| $10,000 to $14,999 | 271 | 9.5% |
| $15,000 to $24,999 | 288 | 10.1% |
| $25,000 to $34,999 | 217 | 7.6% |
| $35,000 to $49,999 | 413 | 14.5% |
| $50,000 to $74,999 | 502 | 17.6% |
| $75,000 to $99,999 | 351 | 12.3% |
| $100,000 to $149,999 | 242 | 8.5% |
| $150,000 to $199,999 | 220 | 7.7% |
| $200,000+ | 94 | 3.3% |
Household Income by Householder Age in Nitro
The median household income in Nitro is $49,742, with the highest median household income of $69,226 found in the 25 to 44 years age bracket for the primary householder. A total of 776 households (27.2%) fall into this category. Meanwhile, the 15 to 24 years age bracket for the primary householder has the lowest median household income of $0, with 63 households (2.2%) in this group.
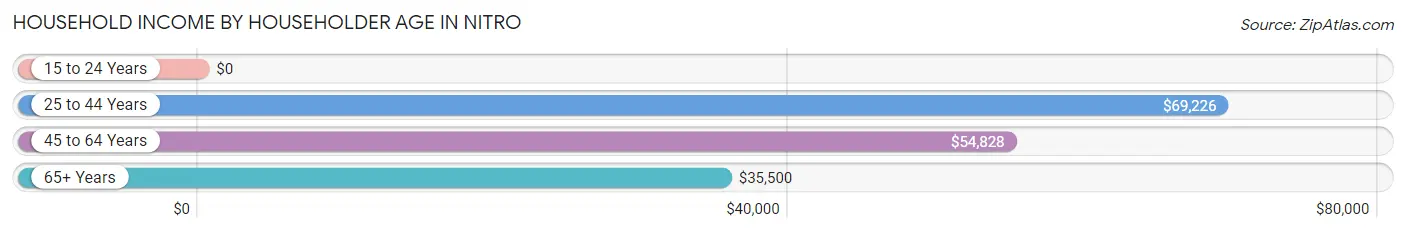
| Income Bracket | # Households | Median Income |
| 15 to 24 Years | 63 (2.2%) | $0 |
| 25 to 44 Years | 776 (27.2%) | $69,226 |
| 45 to 64 Years | 946 (33.2%) | $54,828 |
| 65+ Years | 1,066 (37.4%) | $35,500 |
| Total | 2,851 (100.0%) | $49,742 |
Poverty in Nitro
Income Below Poverty by Sex and Age in Nitro
With 11.7% poverty level for males and 24.6% for females among the residents of Nitro, 6 to 11 year old males and 12 to 14 year old females are the most vulnerable to poverty, with 288 males (72.0%) and 206 females (67.5%) in their respective age groups living below the poverty level.
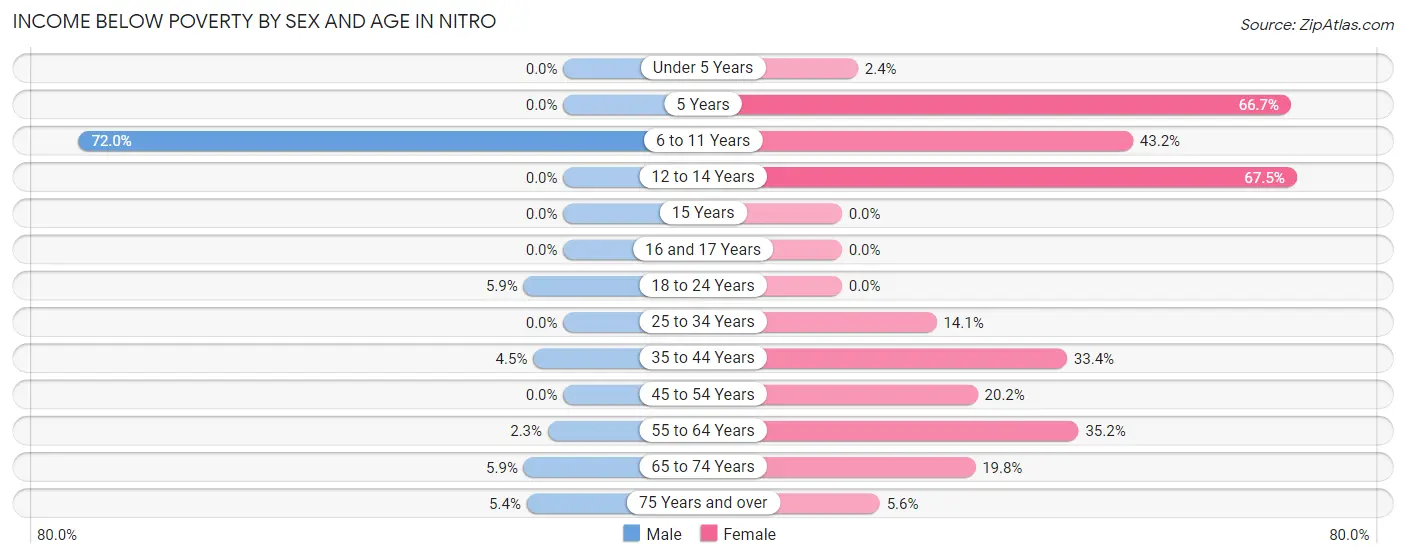
| Age Bracket | Male | Female |
| Under 5 Years | 0 (0.0%) | 5 (2.4%) |
| 5 Years | 0 (0.0%) | 16 (66.7%) |
| 6 to 11 Years | 288 (72.0%) | 115 (43.2%) |
| 12 to 14 Years | 0 (0.0%) | 206 (67.5%) |
| 15 Years | 0 (0.0%) | 0 (0.0%) |
| 16 and 17 Years | 0 (0.0%) | 0 (0.0%) |
| 18 to 24 Years | 12 (5.9%) | 0 (0.0%) |
| 25 to 34 Years | 0 (0.0%) | 54 (14.1%) |
| 35 to 44 Years | 14 (4.5%) | 118 (33.4%) |
| 45 to 54 Years | 0 (0.0%) | 70 (20.2%) |
| 55 to 64 Years | 16 (2.3%) | 148 (35.1%) |
| 65 to 74 Years | 12 (5.9%) | 104 (19.8%) |
| 75 Years and over | 13 (5.4%) | 25 (5.6%) |
| Total | 355 (11.7%) | 861 (24.6%) |
Income Above Poverty by Sex and Age in Nitro
According to the poverty statistics in Nitro, males aged under 5 years and females aged 16 and 17 years are the age groups that are most secure financially, with 100.0% of males and 100.0% of females in these age groups living above the poverty line.
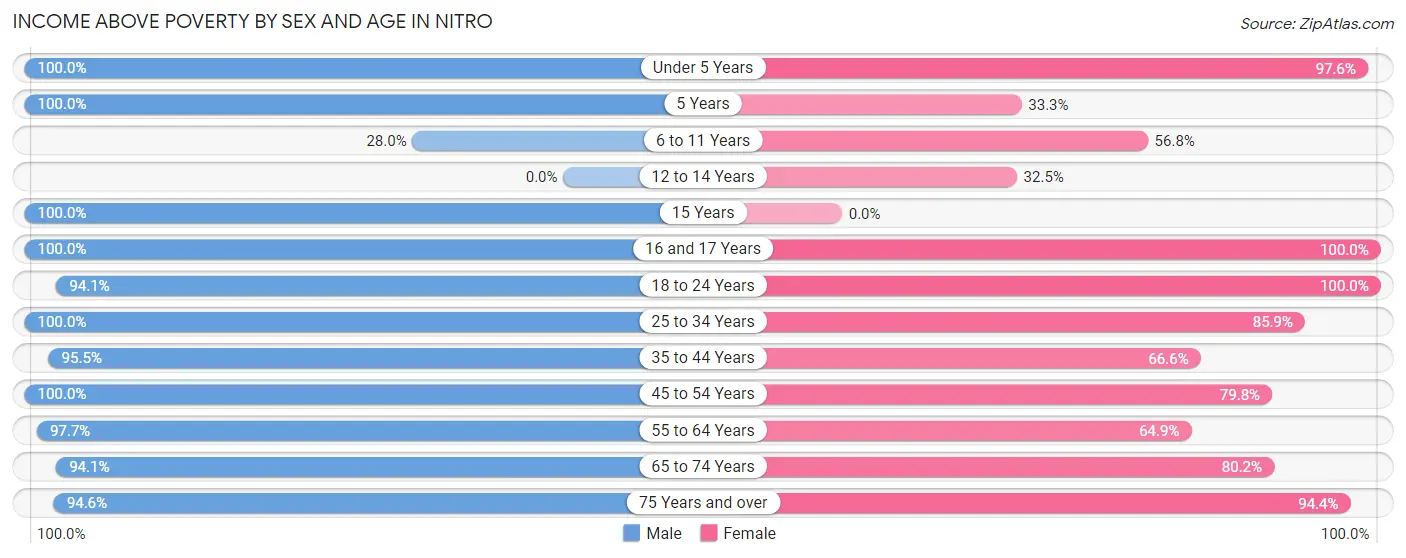
| Age Bracket | Male | Female |
| Under 5 Years | 98 (100.0%) | 205 (97.6%) |
| 5 Years | 51 (100.0%) | 8 (33.3%) |
| 6 to 11 Years | 112 (28.0%) | 151 (56.8%) |
| 12 to 14 Years | 0 (0.0%) | 99 (32.5%) |
| 15 Years | 20 (100.0%) | 0 (0.0%) |
| 16 and 17 Years | 32 (100.0%) | 101 (100.0%) |
| 18 to 24 Years | 191 (94.1%) | 123 (100.0%) |
| 25 to 34 Years | 369 (100.0%) | 330 (85.9%) |
| 35 to 44 Years | 299 (95.5%) | 235 (66.6%) |
| 45 to 54 Years | 412 (100.0%) | 277 (79.8%) |
| 55 to 64 Years | 680 (97.7%) | 273 (64.8%) |
| 65 to 74 Years | 192 (94.1%) | 421 (80.2%) |
| 75 Years and over | 226 (94.6%) | 419 (94.4%) |
| Total | 2,682 (88.3%) | 2,642 (75.4%) |
Income Below Poverty Among Married-Couple Families in Nitro
The poverty statistics for married-couple families in Nitro show that 2.4% or 28 of the total 1,178 families live below the poverty line. Families with 3 or 4 children have the highest poverty rate of 14.1%, comprising of 15 families. On the other hand, families with 1 or 2 children have the lowest poverty rate of 0.0%, which includes 0 families.
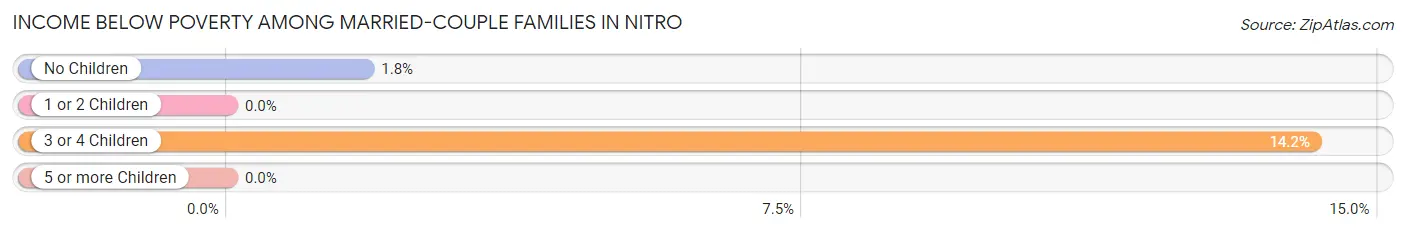
| Children | Above Poverty | Below Poverty |
| No Children | 719 (98.2%) | 13 (1.8%) |
| 1 or 2 Children | 340 (100.0%) | 0 (0.0%) |
| 3 or 4 Children | 91 (85.9%) | 15 (14.1%) |
| 5 or more Children | 0 (0.0%) | 0 (0.0%) |
| Total | 1,150 (97.6%) | 28 (2.4%) |
Income Below Poverty Among Single-Parent Households in Nitro
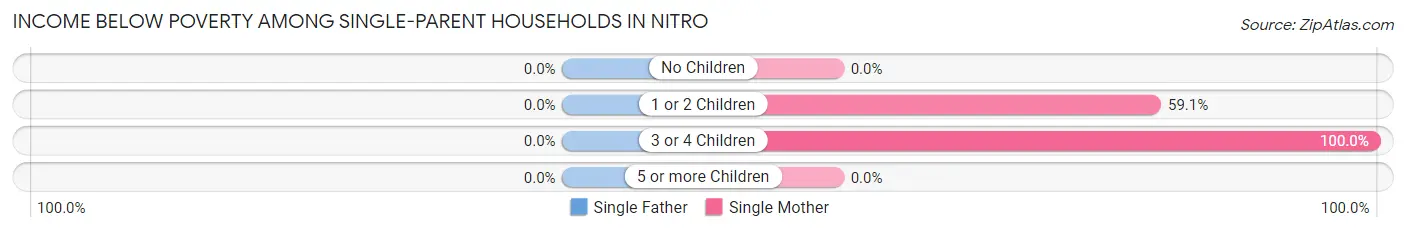
| Children | Single Father | Single Mother |
| No Children | 0 (0.0%) | 0 (0.0%) |
| 1 or 2 Children | 0 (0.0%) | 175 (59.1%) |
| 3 or 4 Children | 0 (0.0%) | 17 (100.0%) |
| 5 or more Children | 0 (0.0%) | 0 (0.0%) |
| Total | 0 (0.0%) | 192 (39.1%) |
Income Below Poverty Among Married-Couple vs Single-Parent Households in Nitro
The poverty data for Nitro shows that 28 of the married-couple family households (2.4%) and 192 of the single-parent households (34.4%) are living below the poverty level. Within the married-couple family households, those with 3 or 4 children have the highest poverty rate, with 15 households (14.1%) falling below the poverty line. Among the single-parent households, those with 3 or 4 children have the highest poverty rate, with 17 household (100.0%) living below poverty.
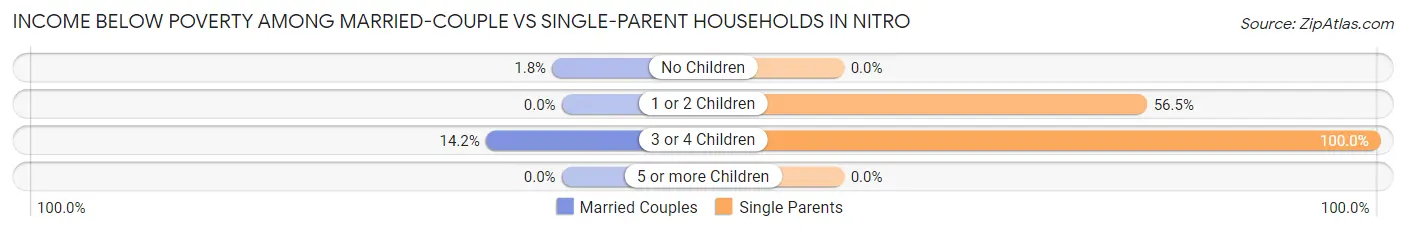
| Children | Married-Couple Families | Single-Parent Households |
| No Children | 13 (1.8%) | 0 (0.0%) |
| 1 or 2 Children | 0 (0.0%) | 175 (56.5%) |
| 3 or 4 Children | 15 (14.1%) | 17 (100.0%) |
| 5 or more Children | 0 (0.0%) | 0 (0.0%) |
| Total | 28 (2.4%) | 192 (34.4%) |
Race in Nitro
The most populous races in Nitro are White / Caucasian (6,063 | 92.7%), Two or more Races (364 | 5.6%), and Black / African American (92 | 1.4%).
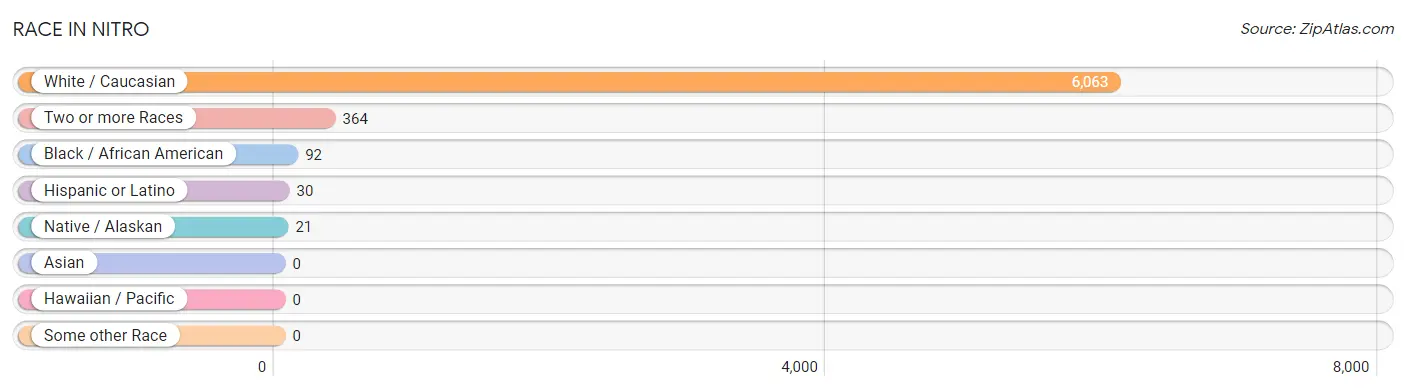
| Race | # Population | % Population |
| Asian | 0 | 0.0% |
| Black / African American | 92 | 1.4% |
| Hawaiian / Pacific | 0 | 0.0% |
| Hispanic or Latino | 30 | 0.5% |
| Native / Alaskan | 21 | 0.3% |
| White / Caucasian | 6,063 | 92.7% |
| Two or more Races | 364 | 5.6% |
| Some other Race | 0 | 0.0% |
| Total | 6,540 | 100.0% |
Ancestry in Nitro
The most populous ancestries reported in Nitro are German (768 | 11.7%), Irish (520 | 8.0%), American (476 | 7.3%), English (397 | 6.1%), and European (269 | 4.1%), together accounting for 37.2% of all Nitro residents.
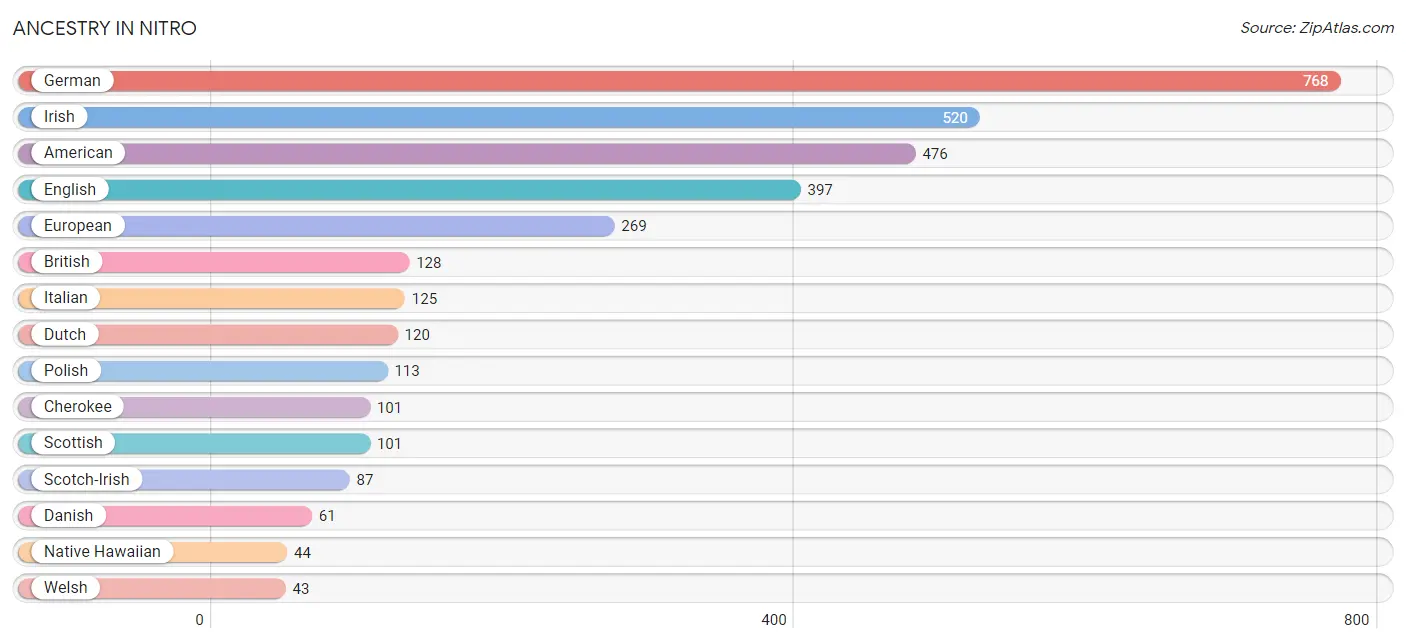
| Ancestry | # Population | % Population |
| African | 26 | 0.4% |
| American | 476 | 7.3% |
| British | 128 | 2.0% |
| Cherokee | 101 | 1.5% |
| Creek | 21 | 0.3% |
| Cuban | 30 | 0.5% |
| Czech | 20 | 0.3% |
| Danish | 61 | 0.9% |
| Dutch | 120 | 1.8% |
| English | 397 | 6.1% |
| European | 269 | 4.1% |
| Finnish | 18 | 0.3% |
| French | 14 | 0.2% |
| German | 768 | 11.7% |
| Irish | 520 | 8.0% |
| Italian | 125 | 1.9% |
| Native Hawaiian | 44 | 0.7% |
| Polish | 113 | 1.7% |
| Russian | 38 | 0.6% |
| Scotch-Irish | 87 | 1.3% |
| Scottish | 101 | 1.5% |
| Subsaharan African | 26 | 0.4% |
| Swedish | 42 | 0.6% |
| Swiss | 35 | 0.5% |
| Welsh | 43 | 0.7% | View All 25 Rows |
Immigrants in Nitro

| Immigration Origin | # Population | % Population | View All 0 Rows |
Sex and Age in Nitro
Sex and Age in Nitro
The most populous age groups in Nitro are 55 to 59 Years (539 | 17.7%) for men and 10 to 14 Years (361 | 10.3%) for women.
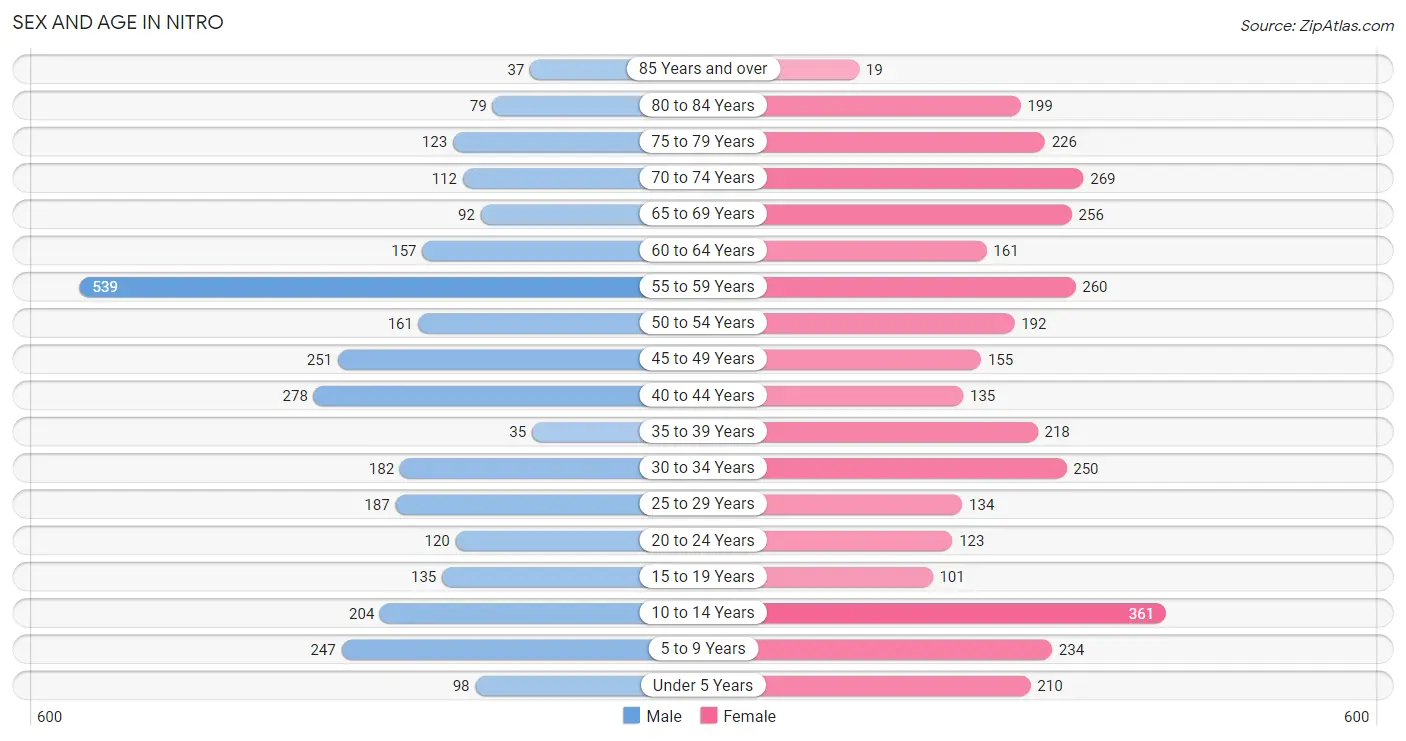
| Age Bracket | Male | Female |
| Under 5 Years | 98 (3.2%) | 210 (6.0%) |
| 5 to 9 Years | 247 (8.1%) | 234 (6.7%) |
| 10 to 14 Years | 204 (6.7%) | 361 (10.3%) |
| 15 to 19 Years | 135 (4.4%) | 101 (2.9%) |
| 20 to 24 Years | 120 (4.0%) | 123 (3.5%) |
| 25 to 29 Years | 187 (6.2%) | 134 (3.8%) |
| 30 to 34 Years | 182 (6.0%) | 250 (7.1%) |
| 35 to 39 Years | 35 (1.1%) | 218 (6.2%) |
| 40 to 44 Years | 278 (9.1%) | 135 (3.8%) |
| 45 to 49 Years | 251 (8.3%) | 155 (4.4%) |
| 50 to 54 Years | 161 (5.3%) | 192 (5.5%) |
| 55 to 59 Years | 539 (17.7%) | 260 (7.4%) |
| 60 to 64 Years | 157 (5.2%) | 161 (4.6%) |
| 65 to 69 Years | 92 (3.0%) | 256 (7.3%) |
| 70 to 74 Years | 112 (3.7%) | 269 (7.7%) |
| 75 to 79 Years | 123 (4.1%) | 226 (6.5%) |
| 80 to 84 Years | 79 (2.6%) | 199 (5.7%) |
| 85 Years and over | 37 (1.2%) | 19 (0.5%) |
| Total | 3,037 (100.0%) | 3,503 (100.0%) |
Families and Households in Nitro
Median Family Size in Nitro
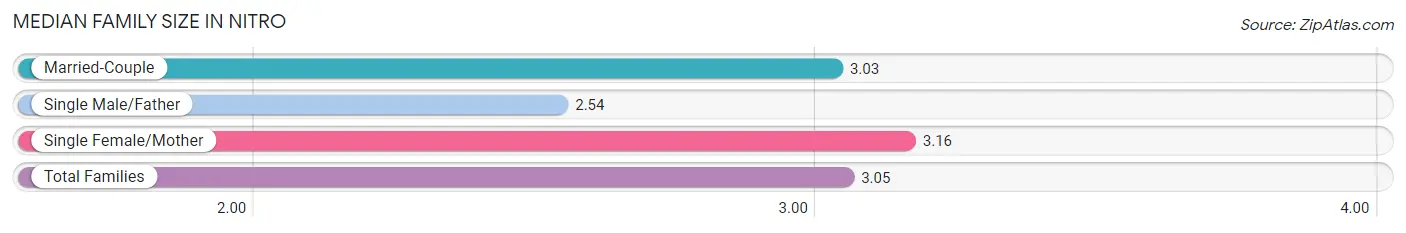
The median family size in Nitro is 3.05 persons per family, with single female/mother families (491 | 28.3%) accounting for the largest median family size of 3.16 persons per family. On the other hand, single male/father families (67 | 3.9%) represent the smallest median family size with 2.54 persons per family.
| Family Type | # Families | Family Size |
| Married-Couple | 1,178 (67.9%) | 3.03 |
| Single Male/Father | 67 (3.9%) | 2.54 |
| Single Female/Mother | 491 (28.3%) | 3.16 |
| Total Families | 1,736 (100.0%) | 3.05 |
Median Household Size in Nitro
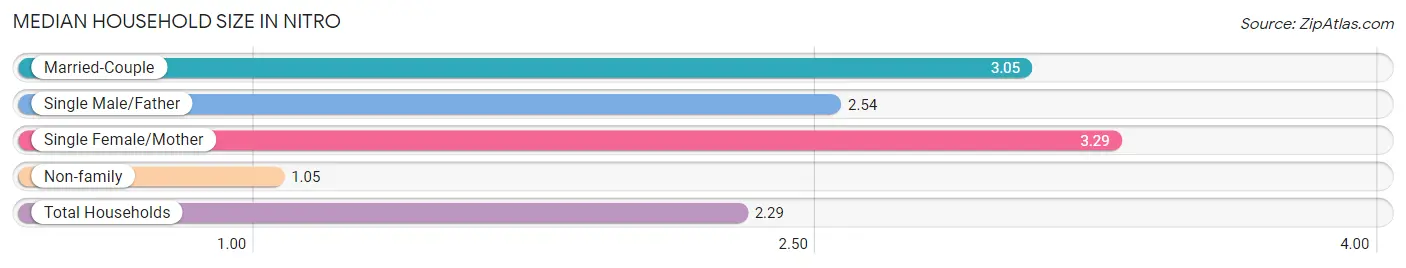
The median household size in Nitro is 2.29 persons per household, with single female/mother households (491 | 17.2%) accounting for the largest median household size of 3.29 persons per household. non-family households (1,115 | 39.1%) represent the smallest median household size with 1.05 persons per household.
| Household Type | # Households | Household Size |
| Married-Couple | 1,178 (41.3%) | 3.05 |
| Single Male/Father | 67 (2.4%) | 2.54 |
| Single Female/Mother | 491 (17.2%) | 3.29 |
| Non-family | 1,115 (39.1%) | 1.05 |
| Total Households | 2,851 (100.0%) | 2.29 |
Household Size by Marriage Status in Nitro
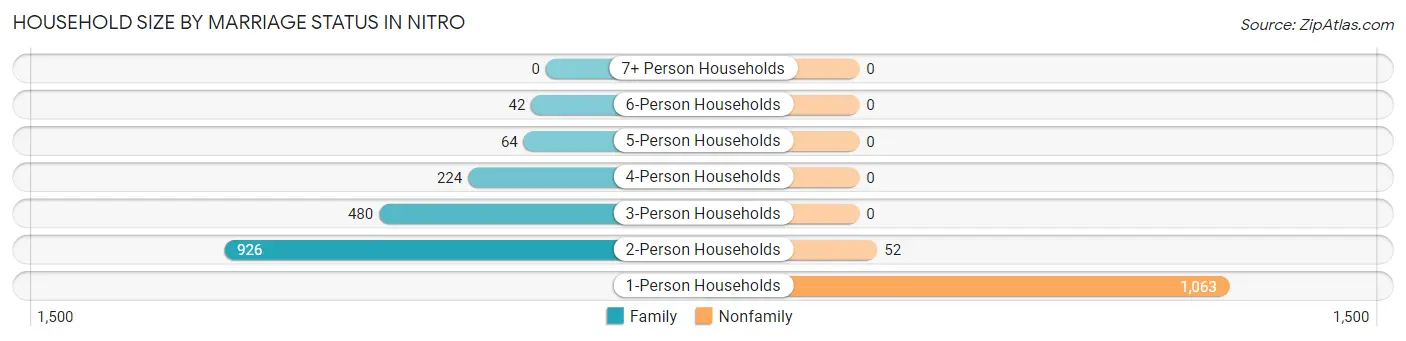
Out of a total of 2,851 households in Nitro, 1,736 (60.9%) are family households, while 1,115 (39.1%) are nonfamily households. The most numerous type of family households are 2-person households, comprising 926, and the most common type of nonfamily households are 1-person households, comprising 1,063.
| Household Size | Family Households | Nonfamily Households |
| 1-Person Households | - | 1,063 (37.3%) |
| 2-Person Households | 926 (32.5%) | 52 (1.8%) |
| 3-Person Households | 480 (16.8%) | 0 (0.0%) |
| 4-Person Households | 224 (7.9%) | 0 (0.0%) |
| 5-Person Households | 64 (2.2%) | 0 (0.0%) |
| 6-Person Households | 42 (1.5%) | 0 (0.0%) |
| 7+ Person Households | 0 (0.0%) | 0 (0.0%) |
| Total | 1,736 (60.9%) | 1,115 (39.1%) |
Female Fertility in Nitro
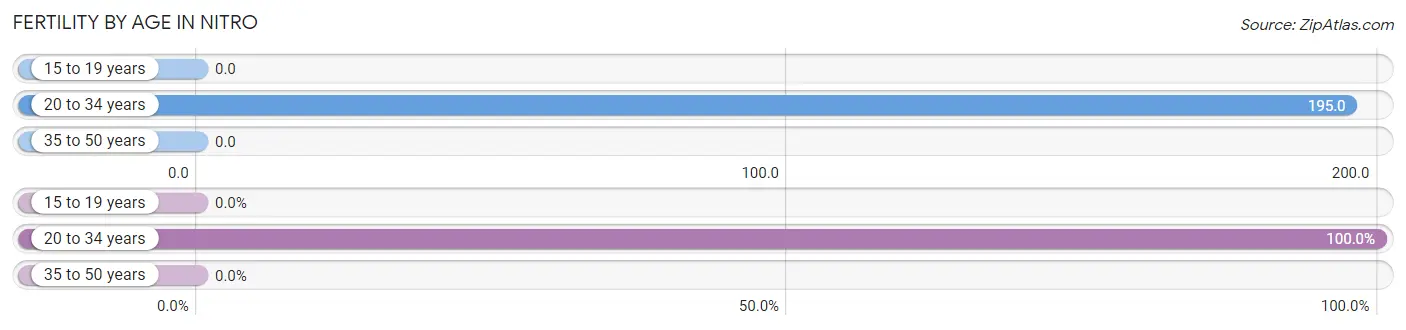
Fertility by Age in Nitro
Average fertility rate in Nitro is 85.0 births per 1,000 women. Women in the age bracket of 20 to 34 years have the highest fertility rate with 195.0 births per 1,000 women. Women in the age bracket of 20 to 34 years acount for 100.0% of all women with births.
| Age Bracket | Women with Births | Births / 1,000 Women |
| 15 to 19 years | 0 (0.0%) | 0.0 |
| 20 to 34 years | 99 (100.0%) | 195.0 |
| 35 to 50 years | 0 (0.0%) | 0.0 |
| Total | 99 (100.0%) | 85.0 |
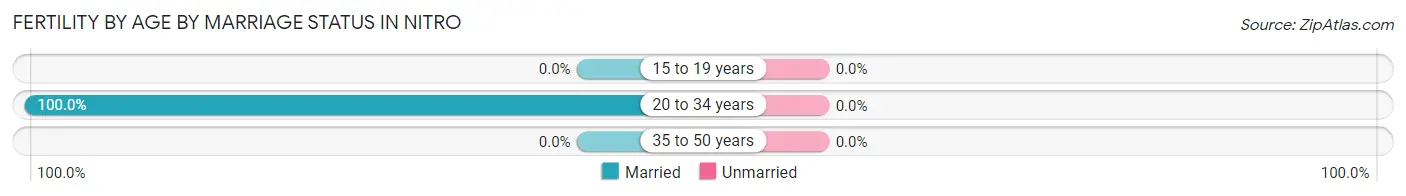
Fertility by Age by Marriage Status in Nitro
| Age Bracket | Married | Unmarried |
| 15 to 19 years | 0 (0.0%) | 0 (0.0%) |
| 20 to 34 years | 99 (100.0%) | 0 (0.0%) |
| 35 to 50 years | 0 (0.0%) | 0 (0.0%) |
| Total | 99 (100.0%) | 0 (0.0%) |
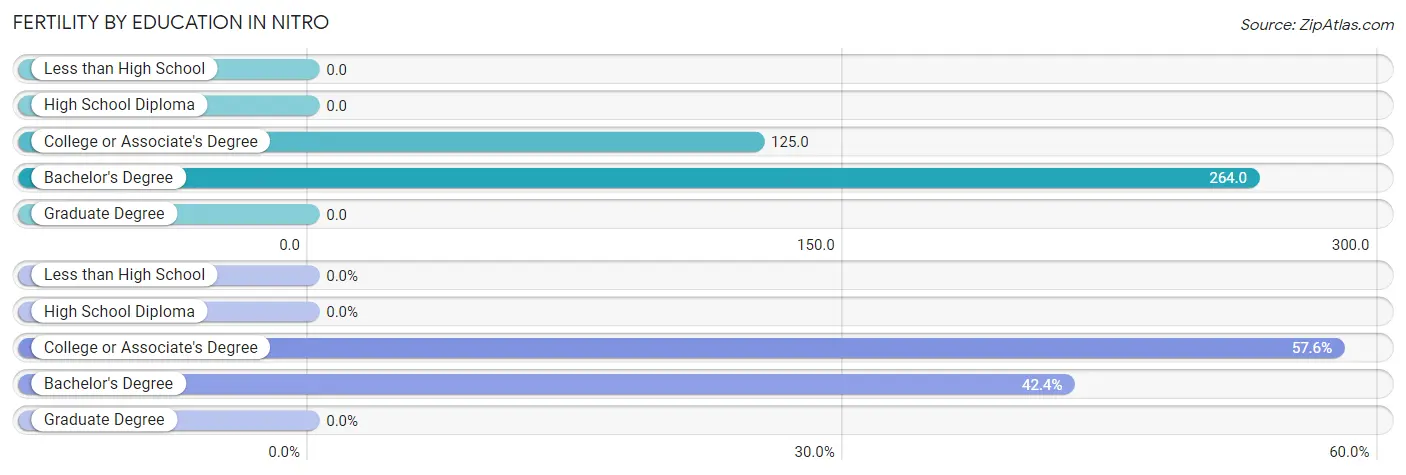
Fertility by Education in Nitro
| Educational Attainment | Women with Births | Births / 1,000 Women |
| Less than High School | 0 (0.0%) | 0.0 |
| High School Diploma | 0 (0.0%) | 0.0 |
| College or Associate's Degree | 57 (57.6%) | 125.0 |
| Bachelor's Degree | 42 (42.4%) | 264.0 |
| Graduate Degree | 0 (0.0%) | 0.0 |
| Total | 99 (100.0%) | 85.0 |
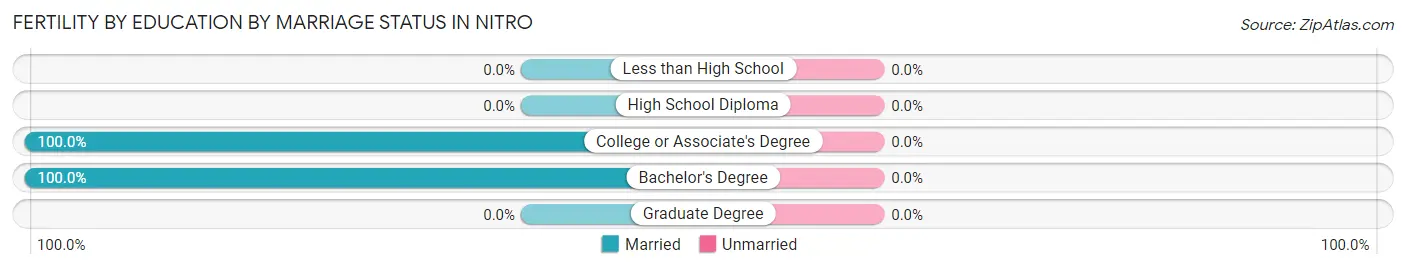
Fertility by Education by Marriage Status in Nitro
| Educational Attainment | Married | Unmarried |
| Less than High School | 0 (0.0%) | 0 (0.0%) |
| High School Diploma | 0 (0.0%) | 0 (0.0%) |
| College or Associate's Degree | 57 (100.0%) | 0 (0.0%) |
| Bachelor's Degree | 42 (100.0%) | 0 (0.0%) |
| Graduate Degree | 0 (0.0%) | 0 (0.0%) |
| Total | 99 (100.0%) | 0 (0.0%) |
Employment Characteristics in Nitro
Employment by Class of Employer in Nitro
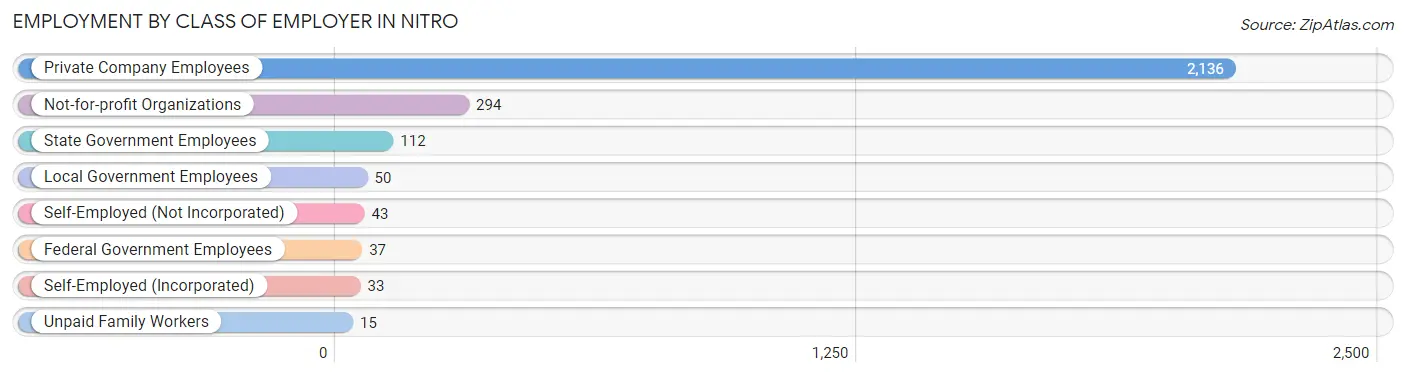
Among the 2,720 employed individuals in Nitro, private company employees (2,136 | 78.5%), not-for-profit organizations (294 | 10.8%), and state government employees (112 | 4.1%) make up the most common classes of employment.
| Employer Class | # Employees | % Employees |
| Private Company Employees | 2,136 | 78.5% |
| Self-Employed (Incorporated) | 33 | 1.2% |
| Self-Employed (Not Incorporated) | 43 | 1.6% |
| Not-for-profit Organizations | 294 | 10.8% |
| Local Government Employees | 50 | 1.8% |
| State Government Employees | 112 | 4.1% |
| Federal Government Employees | 37 | 1.4% |
| Unpaid Family Workers | 15 | 0.5% |
| Total | 2,720 | 100.0% |
Employment Status by Age in Nitro
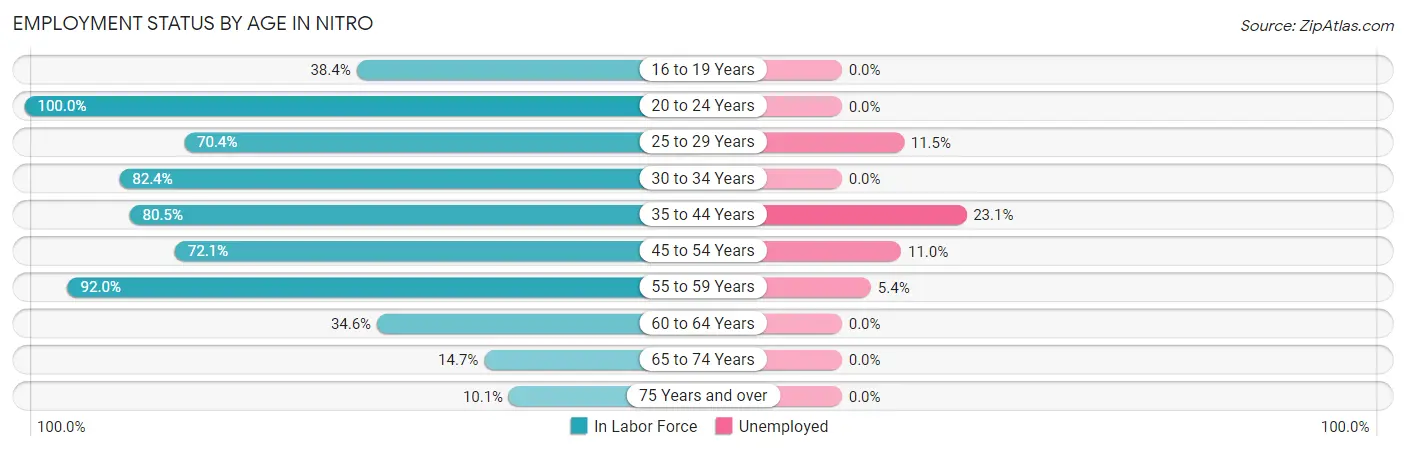
According to the labor force statistics for Nitro, out of the total population over 16 years of age (5,166), 58.3% or 3,012 individuals are in the labor force, with 8.3% or 250 of them unemployed. The age group with the highest labor force participation rate is 20 to 24 years, with 100.0% or 243 individuals in the labor force. Within the labor force, the 35 to 44 years age range has the highest percentage of unemployed individuals, with 23.1% or 124 of them being unemployed.
| Age Bracket | In Labor Force | Unemployed |
| 16 to 19 Years | 83 (38.4%) | 0 (0.0%) |
| 20 to 24 Years | 243 (100.0%) | 0 (0.0%) |
| 25 to 29 Years | 226 (70.4%) | 26 (11.5%) |
| 30 to 34 Years | 356 (82.4%) | 0 (0.0%) |
| 35 to 44 Years | 536 (80.5%) | 124 (23.1%) |
| 45 to 54 Years | 547 (72.1%) | 60 (11.0%) |
| 55 to 59 Years | 735 (92.0%) | 40 (5.4%) |
| 60 to 64 Years | 110 (34.6%) | 0 (0.0%) |
| 65 to 74 Years | 107 (14.7%) | 0 (0.0%) |
| 75 Years and over | 69 (10.1%) | 0 (0.0%) |
| Total | 3,012 (58.3%) | 250 (8.3%) |
Employment Status by Educational Attainment in Nitro
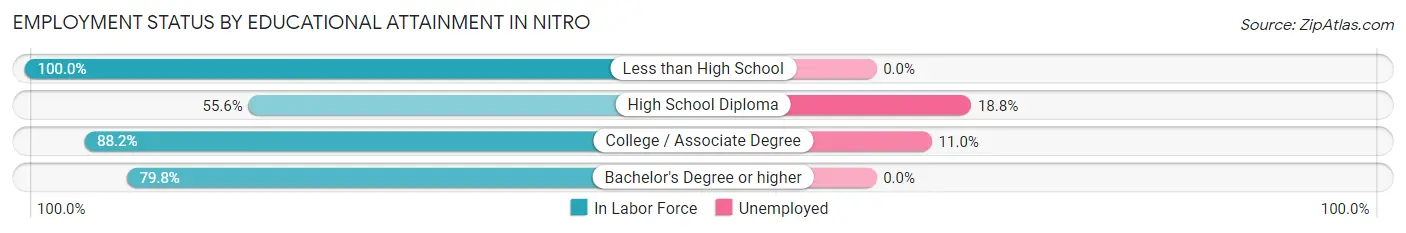
According to labor force statistics for Nitro, 76.2% of individuals (2,511) out of the total population between 25 and 64 years of age (3,295) are in the labor force, with 10.0% or 251 of them being unemployed. The group with the highest labor force participation rate are those with the educational attainment of less than high school, with 100.0% or 370 individuals in the labor force. Within the labor force, individuals with high school diploma education have the highest percentage of unemployment, with 18.8% or 129 of them being unemployed.
| Educational Attainment | In Labor Force | Unemployed |
| Less than High School | 370 (100.0%) | 0 (0.0%) |
| High School Diploma | 688 (55.6%) | 233 (18.8%) |
| College / Associate Degree | 1,095 (88.2%) | 137 (11.0%) |
| Bachelor's Degree or higher | 356 (79.8%) | 0 (0.0%) |
| Total | 2,511 (76.2%) | 330 (10.0%) |
Employment Occupations by Sex in Nitro
Management, Business, Science and Arts Occupations
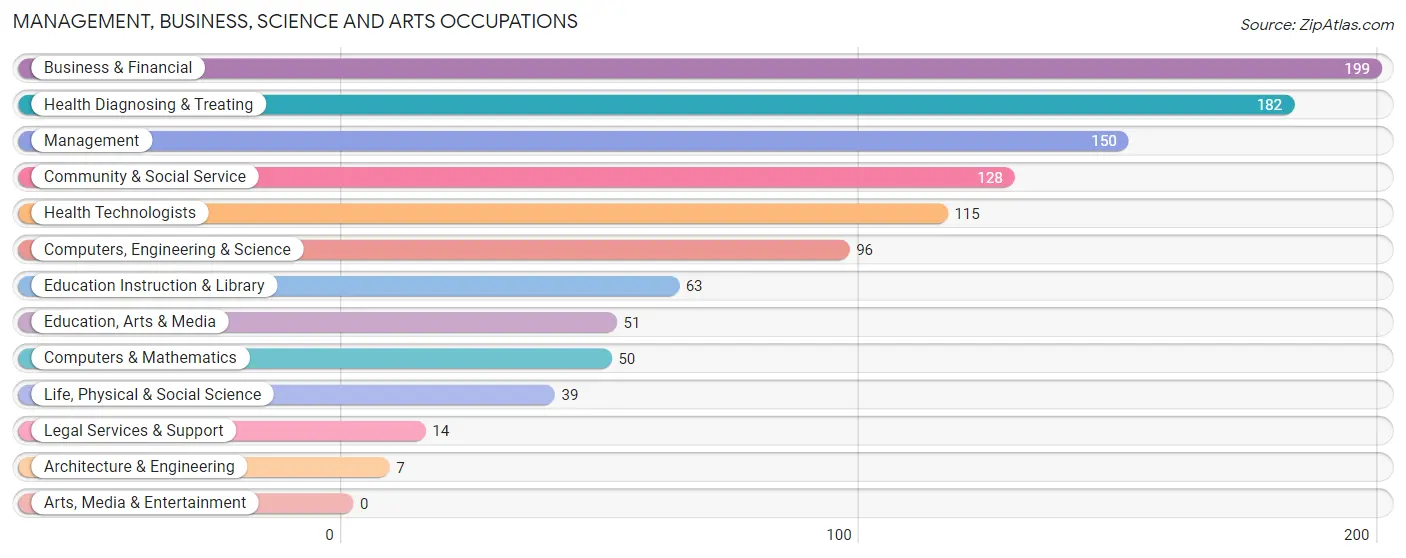
The most common Management, Business, Science and Arts occupations in Nitro are Business & Financial (199 | 7.2%), Health Diagnosing & Treating (182 | 6.6%), Management (150 | 5.4%), Community & Social Service (128 | 4.6%), and Health Technologists (115 | 4.2%).
Management, Business, Science and Arts Occupations by Sex
Within the Management, Business, Science and Arts occupations in Nitro, the most male-oriented occupations are Computers & Mathematics (100.0%), Education, Arts & Media (100.0%), and Legal Services & Support (100.0%), while the most female-oriented occupations are Architecture & Engineering (100.0%), Education Instruction & Library (100.0%), and Health Diagnosing & Treating (100.0%).
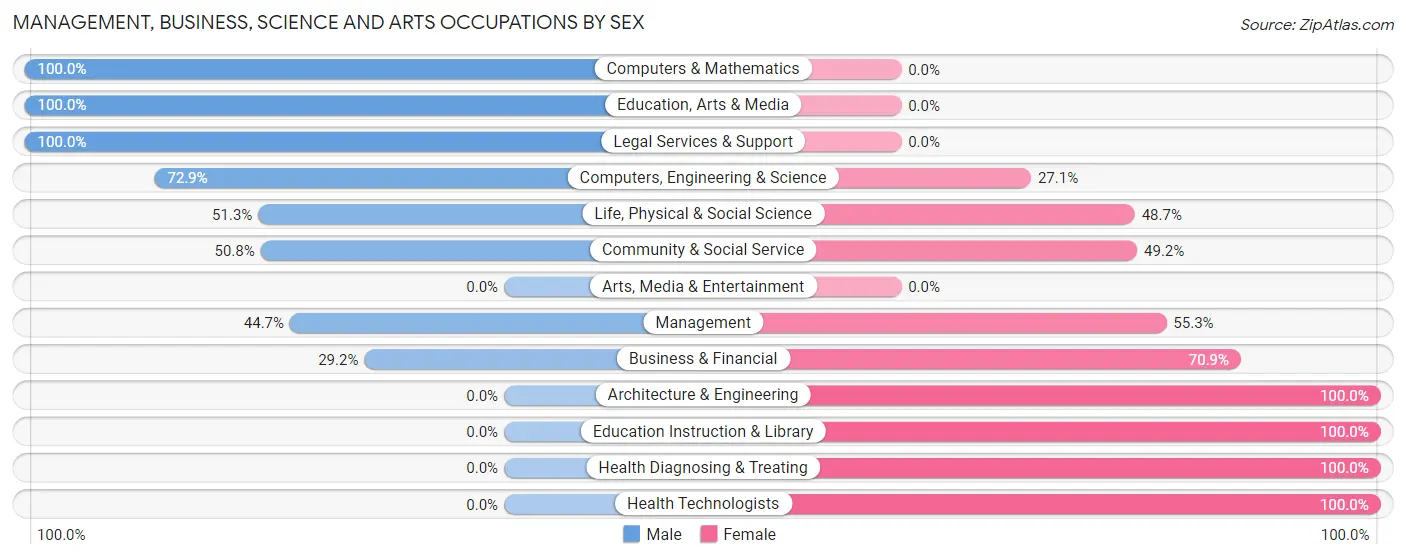
| Occupation | Male | Female |
| Management | 67 (44.7%) | 83 (55.3%) |
| Business & Financial | 58 (29.1%) | 141 (70.9%) |
| Computers, Engineering & Science | 70 (72.9%) | 26 (27.1%) |
| Computers & Mathematics | 50 (100.0%) | 0 (0.0%) |
| Architecture & Engineering | 0 (0.0%) | 7 (100.0%) |
| Life, Physical & Social Science | 20 (51.3%) | 19 (48.7%) |
| Community & Social Service | 65 (50.8%) | 63 (49.2%) |
| Education, Arts & Media | 51 (100.0%) | 0 (0.0%) |
| Legal Services & Support | 14 (100.0%) | 0 (0.0%) |
| Education Instruction & Library | 0 (0.0%) | 63 (100.0%) |
| Arts, Media & Entertainment | 0 (0.0%) | 0 (0.0%) |
| Health Diagnosing & Treating | 0 (0.0%) | 182 (100.0%) |
| Health Technologists | 0 (0.0%) | 115 (100.0%) |
| Total (Category) | 260 (34.4%) | 495 (65.6%) |
| Total (Overall) | 1,474 (53.4%) | 1,288 (46.6%) |
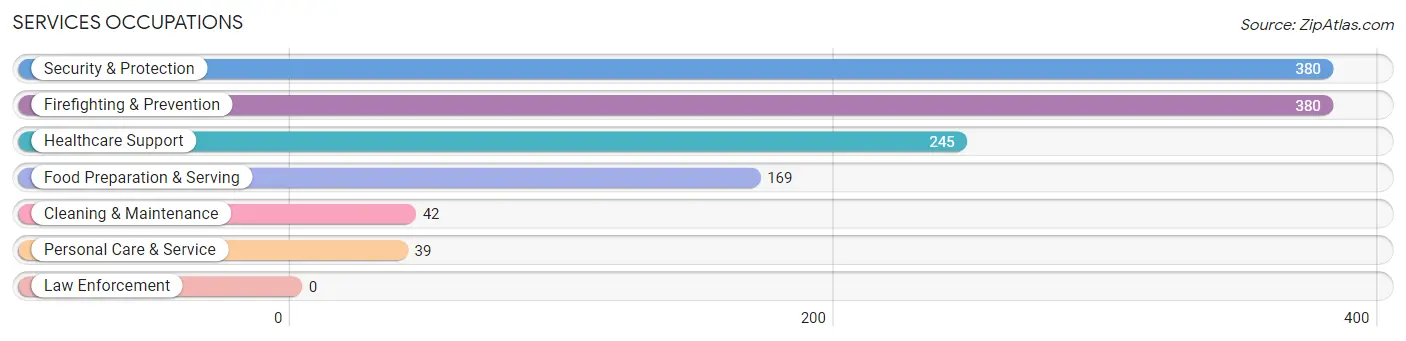
Services Occupations
The most common Services occupations in Nitro are Security & Protection (380 | 13.8%), Firefighting & Prevention (380 | 13.8%), Healthcare Support (245 | 8.9%), Food Preparation & Serving (169 | 6.1%), and Cleaning & Maintenance (42 | 1.5%).
Services Occupations by Sex
Within the Services occupations in Nitro, the most male-oriented occupations are Security & Protection (100.0%), Firefighting & Prevention (100.0%), and Food Preparation & Serving (76.3%), while the most female-oriented occupations are Healthcare Support (100.0%), Personal Care & Service (100.0%), and Cleaning & Maintenance (26.2%).
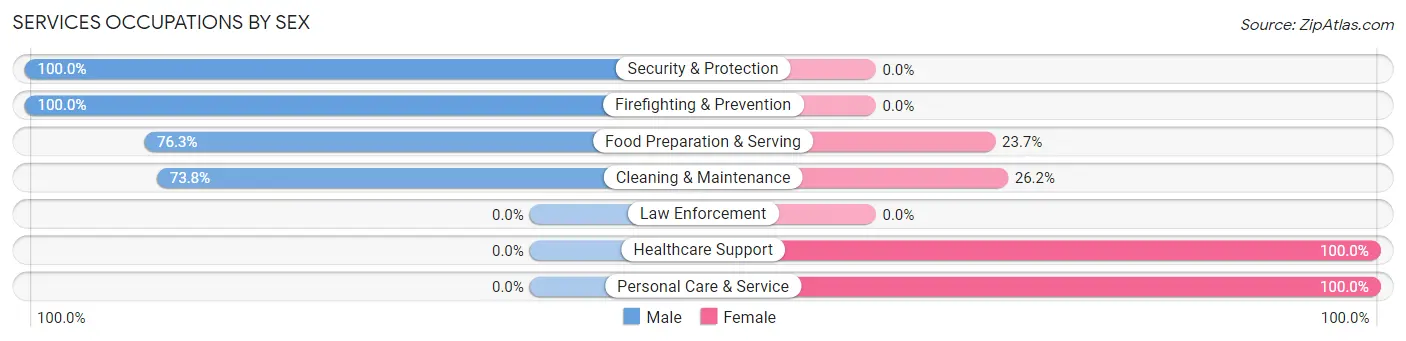
| Occupation | Male | Female |
| Healthcare Support | 0 (0.0%) | 245 (100.0%) |
| Security & Protection | 380 (100.0%) | 0 (0.0%) |
| Firefighting & Prevention | 380 (100.0%) | 0 (0.0%) |
| Law Enforcement | 0 (0.0%) | 0 (0.0%) |
| Food Preparation & Serving | 129 (76.3%) | 40 (23.7%) |
| Cleaning & Maintenance | 31 (73.8%) | 11 (26.2%) |
| Personal Care & Service | 0 (0.0%) | 39 (100.0%) |
| Total (Category) | 540 (61.7%) | 335 (38.3%) |
| Total (Overall) | 1,474 (53.4%) | 1,288 (46.6%) |
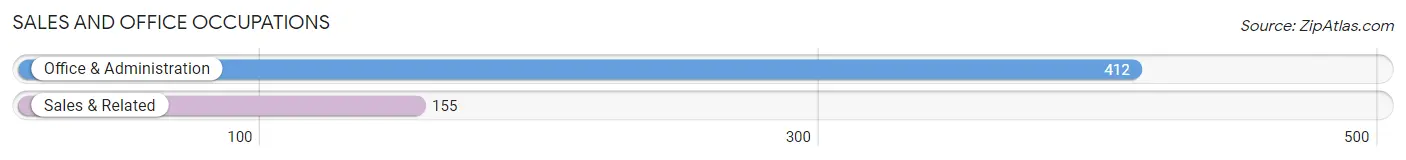
Sales and Office Occupations
The most common Sales and Office occupations in Nitro are Office & Administration (412 | 14.9%), and Sales & Related (155 | 5.6%).
Sales and Office Occupations by Sex
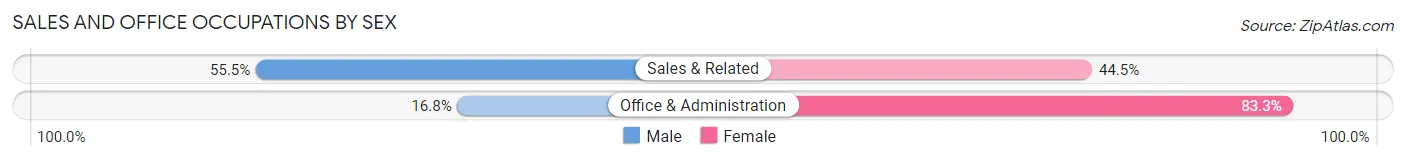
| Occupation | Male | Female |
| Sales & Related | 86 (55.5%) | 69 (44.5%) |
| Office & Administration | 69 (16.8%) | 343 (83.3%) |
| Total (Category) | 155 (27.3%) | 412 (72.7%) |
| Total (Overall) | 1,474 (53.4%) | 1,288 (46.6%) |
Natural Resources, Construction and Maintenance Occupations
The most common Natural Resources, Construction and Maintenance occupations in Nitro are Construction & Extraction (109 | 4.0%), and Installation, Maintenance & Repair (107 | 3.9%).
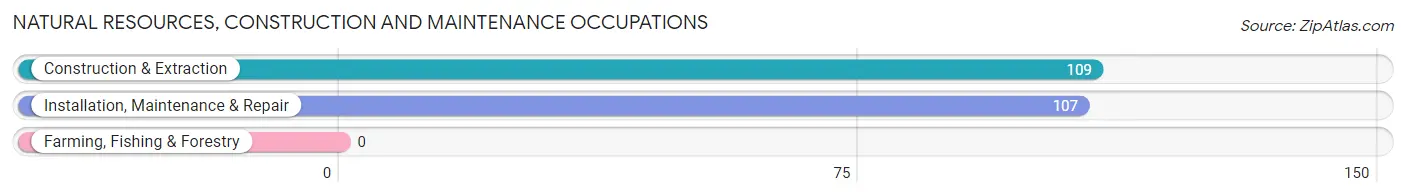
Natural Resources, Construction and Maintenance Occupations by Sex
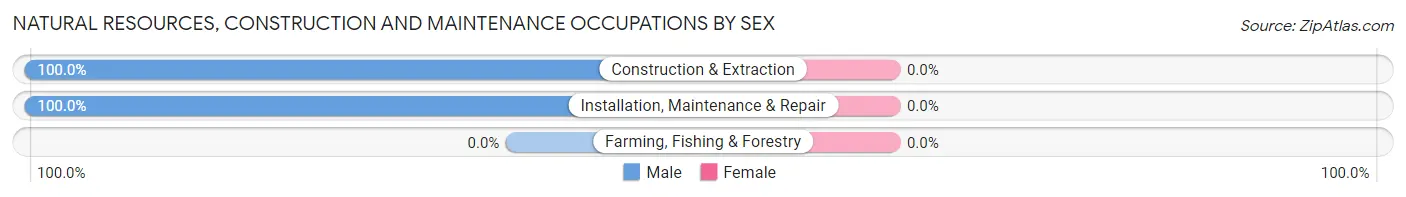
| Occupation | Male | Female |
| Farming, Fishing & Forestry | 0 (0.0%) | 0 (0.0%) |
| Construction & Extraction | 109 (100.0%) | 0 (0.0%) |
| Installation, Maintenance & Repair | 107 (100.0%) | 0 (0.0%) |
| Total (Category) | 216 (100.0%) | 0 (0.0%) |
| Total (Overall) | 1,474 (53.4%) | 1,288 (46.6%) |
Production, Transportation and Moving Occupations
The most common Production, Transportation and Moving occupations in Nitro are Transportation (165 | 6.0%), Production (114 | 4.1%), and Material Moving (70 | 2.5%).
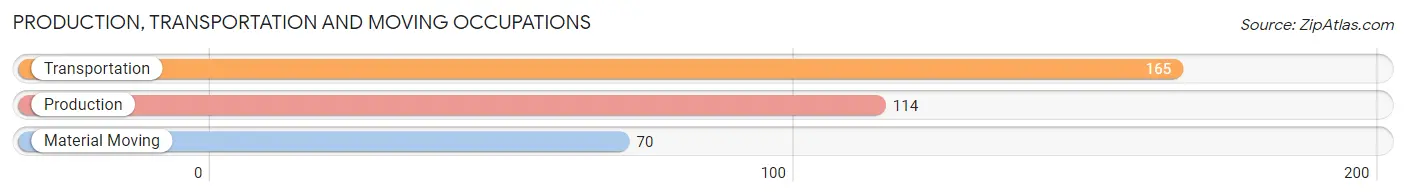
Production, Transportation and Moving Occupations by Sex
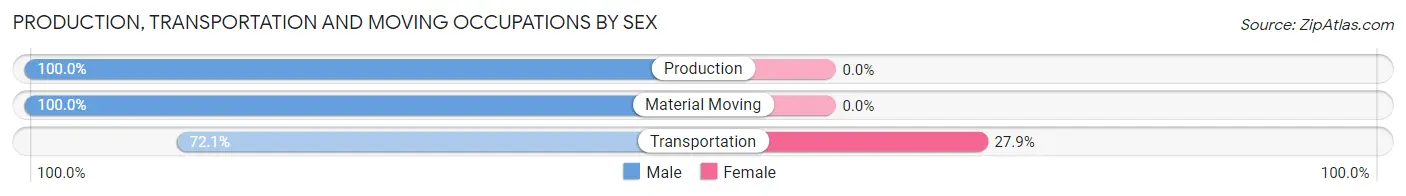
| Occupation | Male | Female |
| Production | 114 (100.0%) | 0 (0.0%) |
| Transportation | 119 (72.1%) | 46 (27.9%) |
| Material Moving | 70 (100.0%) | 0 (0.0%) |
| Total (Category) | 303 (86.8%) | 46 (13.2%) |
| Total (Overall) | 1,474 (53.4%) | 1,288 (46.6%) |
Employment Industries by Sex in Nitro
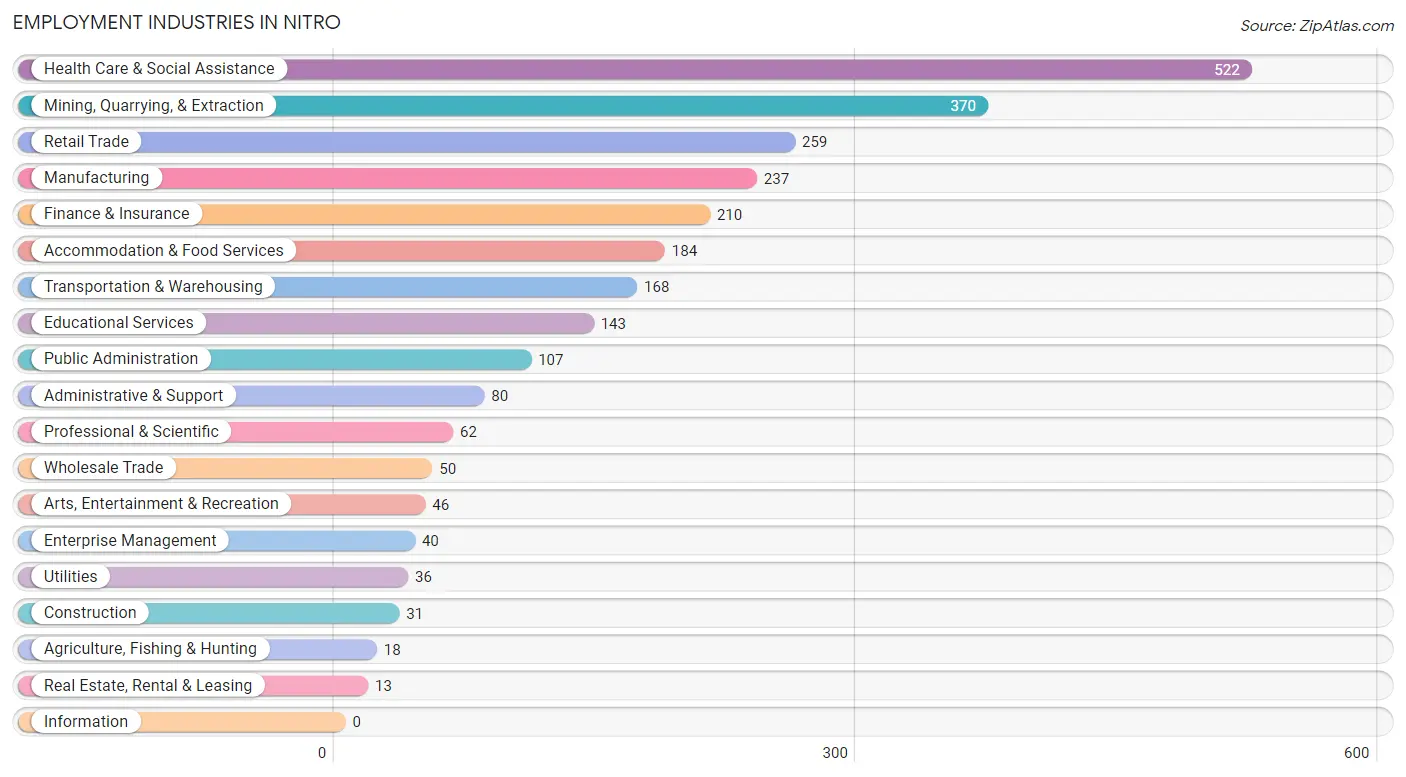
Employment Industries in Nitro
The major employment industries in Nitro include Health Care & Social Assistance (522 | 18.9%), Mining, Quarrying, & Extraction (370 | 13.4%), Retail Trade (259 | 9.4%), Manufacturing (237 | 8.6%), and Finance & Insurance (210 | 7.6%).
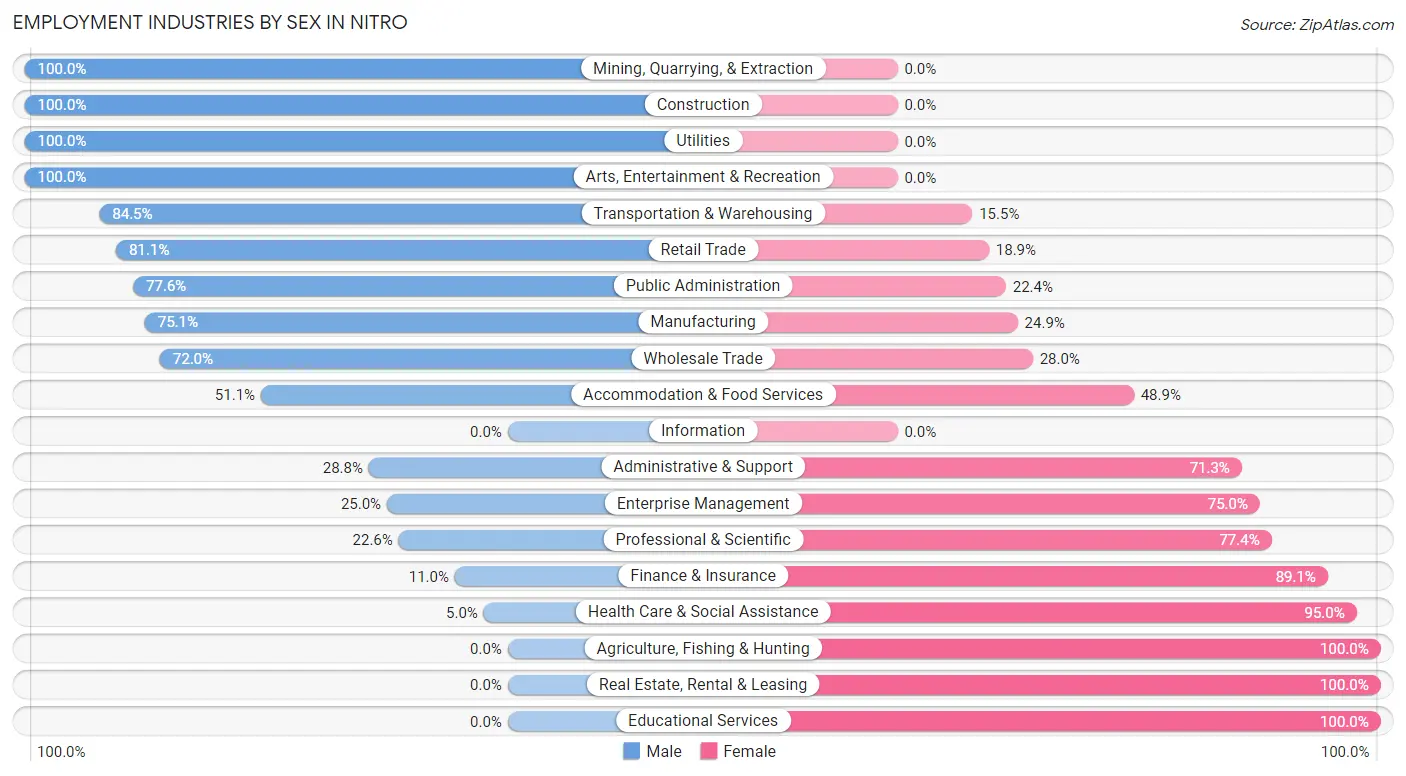
Employment Industries by Sex in Nitro
The Nitro industries that see more men than women are Mining, Quarrying, & Extraction (100.0%), Construction (100.0%), and Utilities (100.0%), whereas the industries that tend to have a higher number of women are Agriculture, Fishing & Hunting (100.0%), Real Estate, Rental & Leasing (100.0%), and Educational Services (100.0%).
| Industry | Male | Female |
| Agriculture, Fishing & Hunting | 0 (0.0%) | 18 (100.0%) |
| Mining, Quarrying, & Extraction | 370 (100.0%) | 0 (0.0%) |
| Construction | 31 (100.0%) | 0 (0.0%) |
| Manufacturing | 178 (75.1%) | 59 (24.9%) |
| Wholesale Trade | 36 (72.0%) | 14 (28.0%) |
| Retail Trade | 210 (81.1%) | 49 (18.9%) |
| Transportation & Warehousing | 142 (84.5%) | 26 (15.5%) |
| Utilities | 36 (100.0%) | 0 (0.0%) |
| Information | 0 (0.0%) | 0 (0.0%) |
| Finance & Insurance | 23 (11.0%) | 187 (89.0%) |
| Real Estate, Rental & Leasing | 0 (0.0%) | 13 (100.0%) |
| Professional & Scientific | 14 (22.6%) | 48 (77.4%) |
| Enterprise Management | 10 (25.0%) | 30 (75.0%) |
| Administrative & Support | 23 (28.7%) | 57 (71.3%) |
| Educational Services | 0 (0.0%) | 143 (100.0%) |
| Health Care & Social Assistance | 26 (5.0%) | 496 (95.0%) |
| Arts, Entertainment & Recreation | 46 (100.0%) | 0 (0.0%) |
| Accommodation & Food Services | 94 (51.1%) | 90 (48.9%) |
| Public Administration | 83 (77.6%) | 24 (22.4%) |
| Total | 1,474 (53.4%) | 1,288 (46.6%) |
Education in Nitro
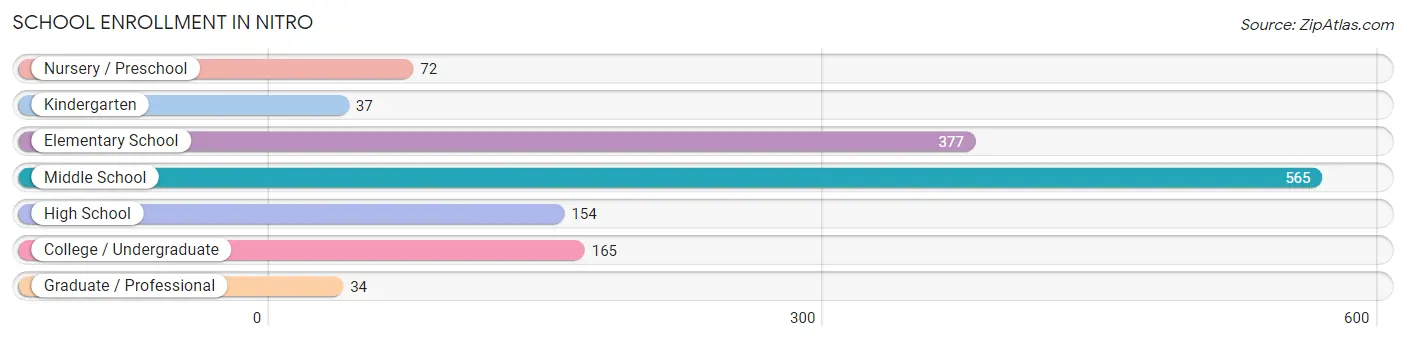
School Enrollment in Nitro
The most common levels of schooling among the 1,404 students in Nitro are middle school (565 | 40.2%), elementary school (377 | 26.9%), and college / undergraduate (165 | 11.7%).
| School Level | # Students | % Students |
| Nursery / Preschool | 72 | 5.1% |
| Kindergarten | 37 | 2.6% |
| Elementary School | 377 | 26.9% |
| Middle School | 565 | 40.2% |
| High School | 154 | 11.0% |
| College / Undergraduate | 165 | 11.7% |
| Graduate / Professional | 34 | 2.4% |
| Total | 1,404 | 100.0% |
School Enrollment by Age by Funding Source in Nitro
Out of a total of 1,404 students who are enrolled in schools in Nitro, 201 (14.3%) attend a private institution, while the remaining 1,203 (85.7%) are enrolled in public schools. The age group of 35 years and over has the highest likelihood of being enrolled in private schools, with 53 (77.9% in the age bracket) enrolled. Conversely, the age group of 3 to 4 year olds has the lowest likelihood of being enrolled in a private school, with 5 (100.0% in the age bracket) attending a public institution.
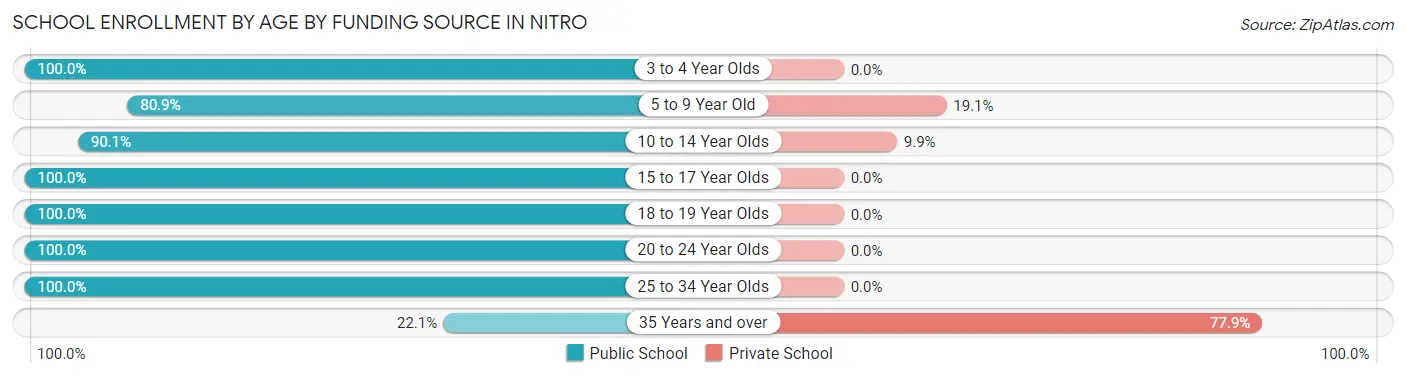
| Age Bracket | Public School | Private School |
| 3 to 4 Year Olds | 5 (100.0%) | 0 (0.0%) |
| 5 to 9 Year Old | 389 (80.9%) | 92 (19.1%) |
| 10 to 14 Year Olds | 509 (90.1%) | 56 (9.9%) |
| 15 to 17 Year Olds | 137 (100.0%) | 0 (0.0%) |
| 18 to 19 Year Olds | 17 (100.0%) | 0 (0.0%) |
| 20 to 24 Year Olds | 11 (100.0%) | 0 (0.0%) |
| 25 to 34 Year Olds | 120 (100.0%) | 0 (0.0%) |
| 35 Years and over | 15 (22.1%) | 53 (77.9%) |
| Total | 1,203 (85.7%) | 201 (14.3%) |
Educational Attainment by Field of Study in Nitro
Business (165 | 24.5%), education (164 | 24.4%), liberal arts & history (79 | 11.7%), science & technology (64 | 9.5%), and visual & performing arts (55 | 8.2%) are the most common fields of study among 673 individuals in Nitro who have obtained a bachelor's degree or higher.
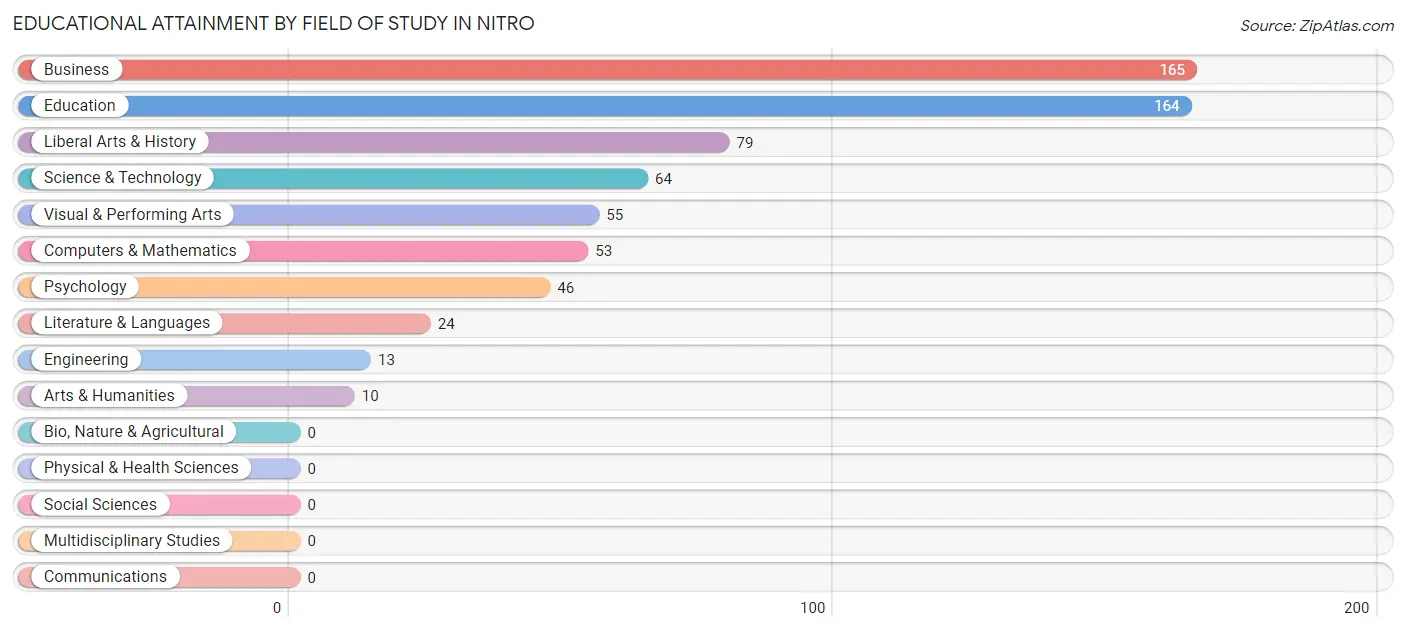
| Field of Study | # Graduates | % Graduates |
| Computers & Mathematics | 53 | 7.9% |
| Bio, Nature & Agricultural | 0 | 0.0% |
| Physical & Health Sciences | 0 | 0.0% |
| Psychology | 46 | 6.8% |
| Social Sciences | 0 | 0.0% |
| Engineering | 13 | 1.9% |
| Multidisciplinary Studies | 0 | 0.0% |
| Science & Technology | 64 | 9.5% |
| Business | 165 | 24.5% |
| Education | 164 | 24.4% |
| Literature & Languages | 24 | 3.6% |
| Liberal Arts & History | 79 | 11.7% |
| Visual & Performing Arts | 55 | 8.2% |
| Communications | 0 | 0.0% |
| Arts & Humanities | 10 | 1.5% |
| Total | 673 | 100.0% |
Transportation & Commute in Nitro
Vehicle Availability by Sex in Nitro
The most prevalent vehicle ownership categories in Nitro are males with 2 vehicles (673, accounting for 45.7%) and females with 2 vehicles (594, making up 54.0%).
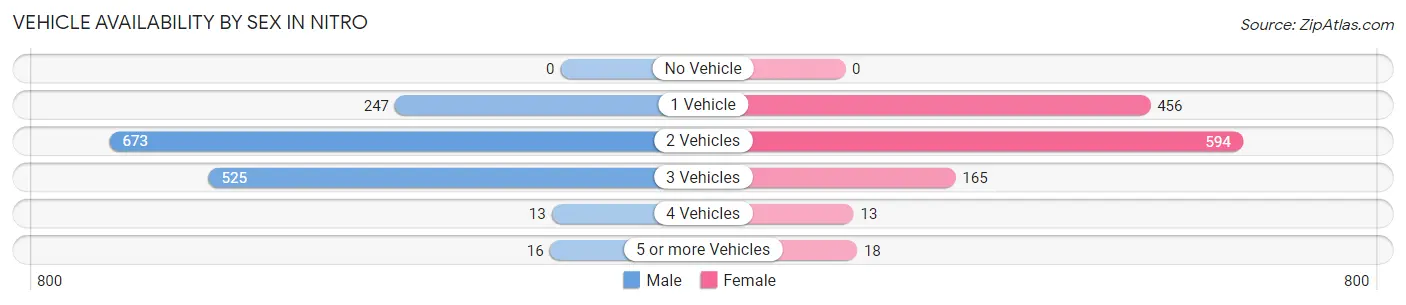
| Vehicles Available | Male | Female |
| No Vehicle | 0 (0.0%) | 0 (0.0%) |
| 1 Vehicle | 247 (16.8%) | 456 (36.6%) |
| 2 Vehicles | 673 (45.7%) | 594 (47.7%) |
| 3 Vehicles | 525 (35.6%) | 165 (13.2%) |
| 4 Vehicles | 13 (0.9%) | 13 (1.0%) |
| 5 or more Vehicles | 16 (1.1%) | 18 (1.4%) |
| Total | 1,474 (100.0%) | 1,246 (100.0%) |
Commute Time in Nitro
The most frequently occuring commute durations in Nitro are 20 to 24 minutes (960 commuters, 36.2%), 25 to 29 minutes (466 commuters, 17.6%), and 15 to 19 minutes (318 commuters, 12.0%).
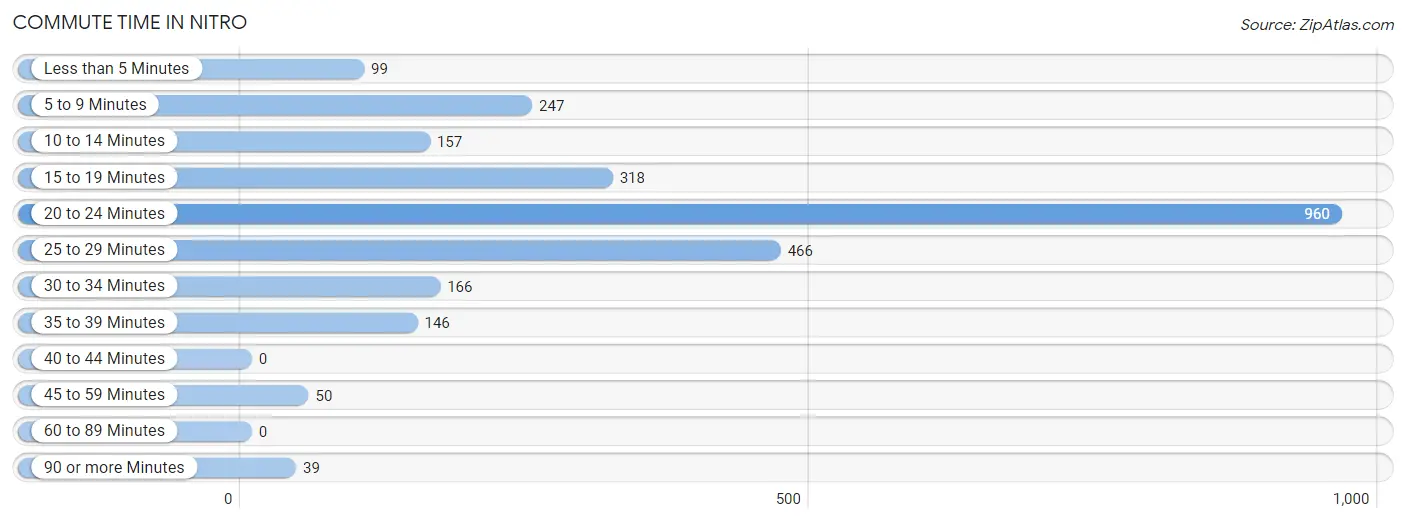
| Commute Time | # Commuters | % Commuters |
| Less than 5 Minutes | 99 | 3.7% |
| 5 to 9 Minutes | 247 | 9.3% |
| 10 to 14 Minutes | 157 | 5.9% |
| 15 to 19 Minutes | 318 | 12.0% |
| 20 to 24 Minutes | 960 | 36.2% |
| 25 to 29 Minutes | 466 | 17.6% |
| 30 to 34 Minutes | 166 | 6.3% |
| 35 to 39 Minutes | 146 | 5.5% |
| 40 to 44 Minutes | 0 | 0.0% |
| 45 to 59 Minutes | 50 | 1.9% |
| 60 to 89 Minutes | 0 | 0.0% |
| 90 or more Minutes | 39 | 1.5% |
Commute Time by Sex in Nitro
The most common commute times in Nitro are 20 to 24 minutes (730 commuters, 51.4%) for males and 25 to 29 minutes (342 commuters, 27.9%) for females.
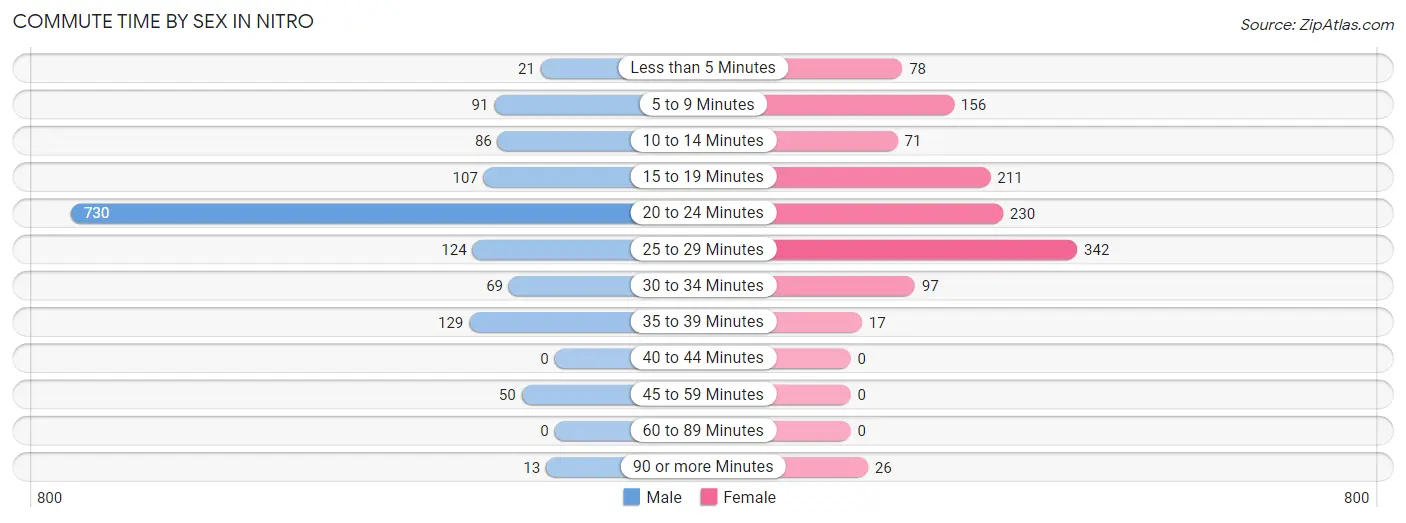
| Commute Time | Male | Female |
| Less than 5 Minutes | 21 (1.5%) | 78 (6.4%) |
| 5 to 9 Minutes | 91 (6.4%) | 156 (12.7%) |
| 10 to 14 Minutes | 86 (6.1%) | 71 (5.8%) |
| 15 to 19 Minutes | 107 (7.5%) | 211 (17.2%) |
| 20 to 24 Minutes | 730 (51.4%) | 230 (18.7%) |
| 25 to 29 Minutes | 124 (8.7%) | 342 (27.9%) |
| 30 to 34 Minutes | 69 (4.9%) | 97 (7.9%) |
| 35 to 39 Minutes | 129 (9.1%) | 17 (1.4%) |
| 40 to 44 Minutes | 0 (0.0%) | 0 (0.0%) |
| 45 to 59 Minutes | 50 (3.5%) | 0 (0.0%) |
| 60 to 89 Minutes | 0 (0.0%) | 0 (0.0%) |
| 90 or more Minutes | 13 (0.9%) | 26 (2.1%) |
Time of Departure to Work by Sex in Nitro
The most frequent times of departure to work in Nitro are 6:00 AM to 6:29 AM (382, 26.9%) for males and 6:00 AM to 6:29 AM (293, 23.9%) for females.
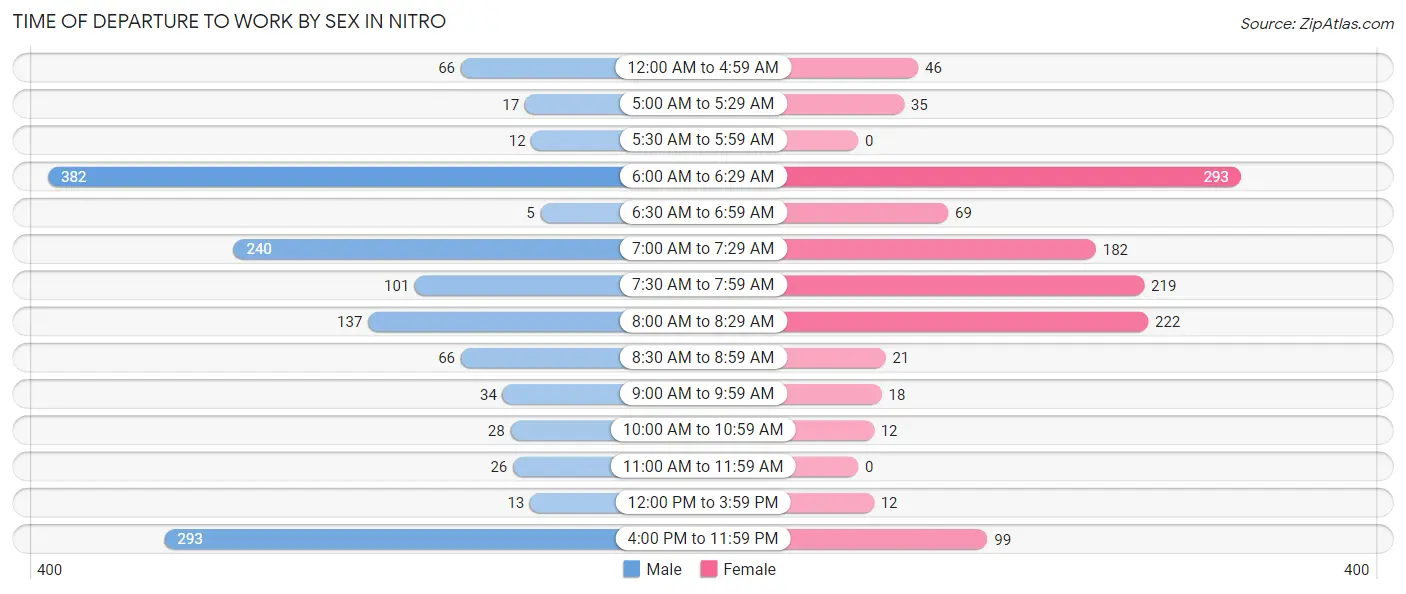
| Time of Departure | Male | Female |
| 12:00 AM to 4:59 AM | 66 (4.6%) | 46 (3.7%) |
| 5:00 AM to 5:29 AM | 17 (1.2%) | 35 (2.9%) |
| 5:30 AM to 5:59 AM | 12 (0.9%) | 0 (0.0%) |
| 6:00 AM to 6:29 AM | 382 (26.9%) | 293 (23.9%) |
| 6:30 AM to 6:59 AM | 5 (0.4%) | 69 (5.6%) |
| 7:00 AM to 7:29 AM | 240 (16.9%) | 182 (14.8%) |
| 7:30 AM to 7:59 AM | 101 (7.1%) | 219 (17.8%) |
| 8:00 AM to 8:29 AM | 137 (9.7%) | 222 (18.1%) |
| 8:30 AM to 8:59 AM | 66 (4.6%) | 21 (1.7%) |
| 9:00 AM to 9:59 AM | 34 (2.4%) | 18 (1.5%) |
| 10:00 AM to 10:59 AM | 28 (2.0%) | 12 (1.0%) |
| 11:00 AM to 11:59 AM | 26 (1.8%) | 0 (0.0%) |
| 12:00 PM to 3:59 PM | 13 (0.9%) | 12 (1.0%) |
| 4:00 PM to 11:59 PM | 293 (20.6%) | 99 (8.1%) |
| Total | 1,420 (100.0%) | 1,228 (100.0%) |
Housing Occupancy in Nitro
Occupancy by Ownership in Nitro
Of the total 2,851 dwellings in Nitro, owner-occupied units account for 1,929 (67.7%), while renter-occupied units make up 922 (32.3%).
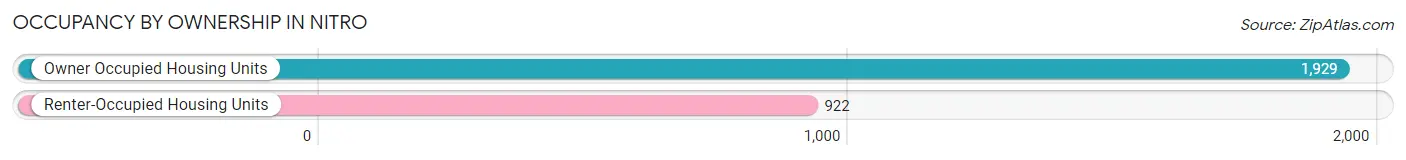
| Occupancy | # Housing Units | % Housing Units |
| Owner Occupied Housing Units | 1,929 | 67.7% |
| Renter-Occupied Housing Units | 922 | 32.3% |
| Total Occupied Housing Units | 2,851 | 100.0% |
Occupancy by Household Size in Nitro
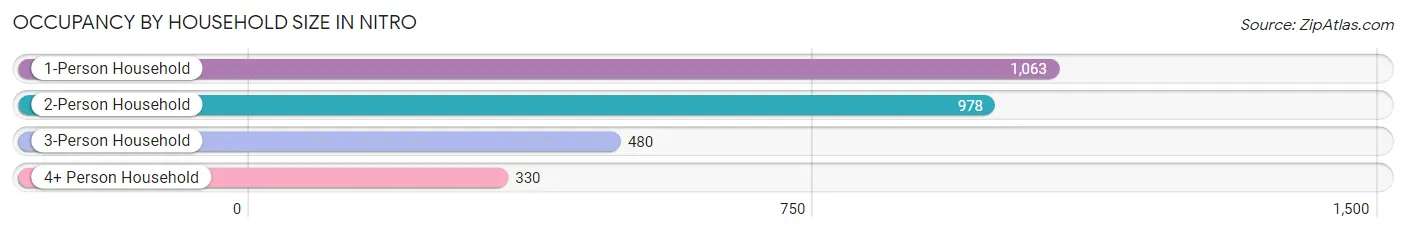
| Household Size | # Housing Units | % Housing Units |
| 1-Person Household | 1,063 | 37.3% |
| 2-Person Household | 978 | 34.3% |
| 3-Person Household | 480 | 16.8% |
| 4+ Person Household | 330 | 11.6% |
| Total Housing Units | 2,851 | 100.0% |
Occupancy by Ownership by Household Size in Nitro
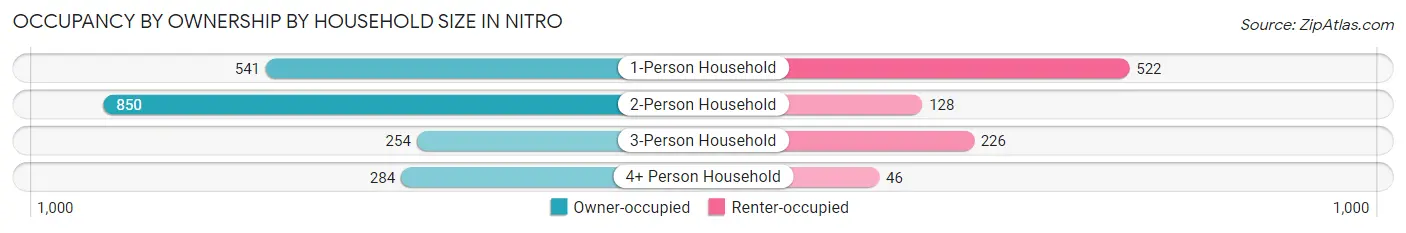
| Household Size | Owner-occupied | Renter-occupied |
| 1-Person Household | 541 (50.9%) | 522 (49.1%) |
| 2-Person Household | 850 (86.9%) | 128 (13.1%) |
| 3-Person Household | 254 (52.9%) | 226 (47.1%) |
| 4+ Person Household | 284 (86.1%) | 46 (13.9%) |
| Total Housing Units | 1,929 (67.7%) | 922 (32.3%) |
Occupancy by Educational Attainment in Nitro
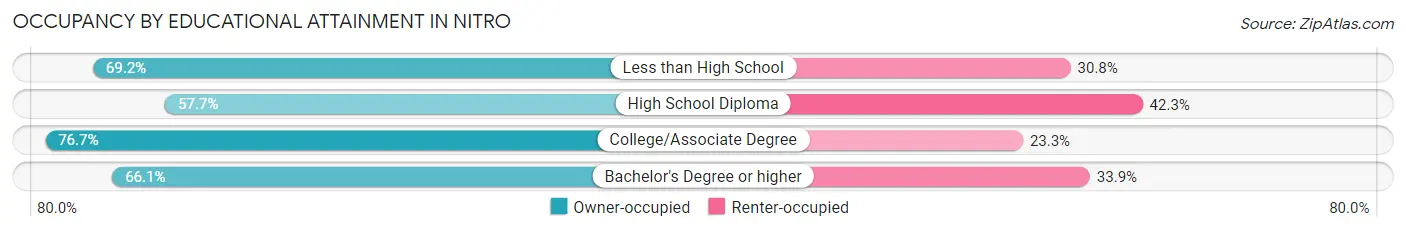
| Household Size | Owner-occupied | Renter-occupied |
| Less than High School | 74 (69.2%) | 33 (30.8%) |
| High School Diploma | 609 (57.7%) | 446 (42.3%) |
| College/Associate Degree | 936 (76.7%) | 284 (23.3%) |
| Bachelor's Degree or higher | 310 (66.1%) | 159 (33.9%) |
Occupancy by Age of Householder in Nitro
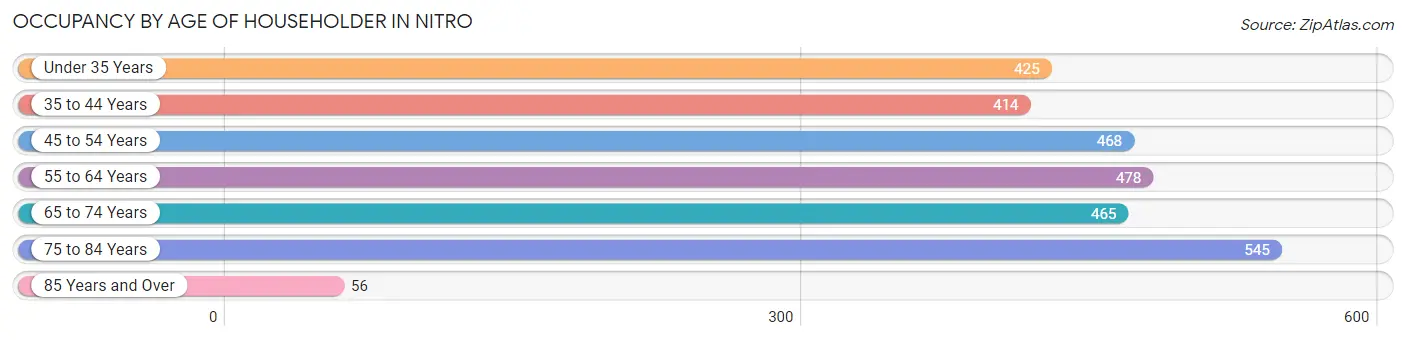
| Age Bracket | # Households | % Households |
| Under 35 Years | 425 | 14.9% |
| 35 to 44 Years | 414 | 14.5% |
| 45 to 54 Years | 468 | 16.4% |
| 55 to 64 Years | 478 | 16.8% |
| 65 to 74 Years | 465 | 16.3% |
| 75 to 84 Years | 545 | 19.1% |
| 85 Years and Over | 56 | 2.0% |
| Total | 2,851 | 100.0% |
Housing Finances in Nitro
Median Income by Occupancy in Nitro
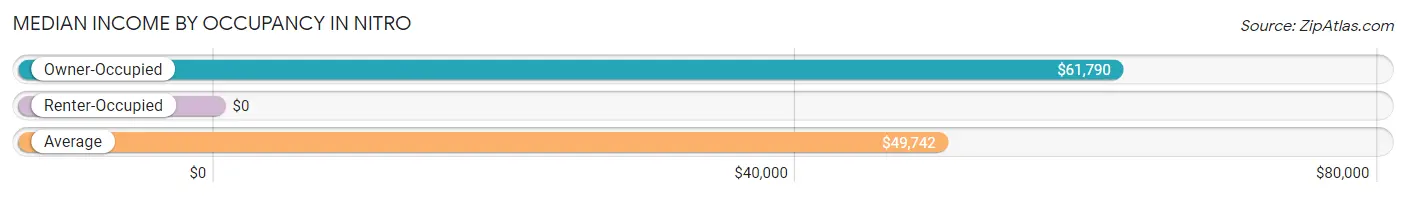
| Occupancy Type | # Households | Median Income |
| Owner-Occupied | 1,929 (67.7%) | $61,790 |
| Renter-Occupied | 922 (32.3%) | $0 |
| Average | 2,851 (100.0%) | $49,742 |
Occupancy by Householder Income Bracket in Nitro
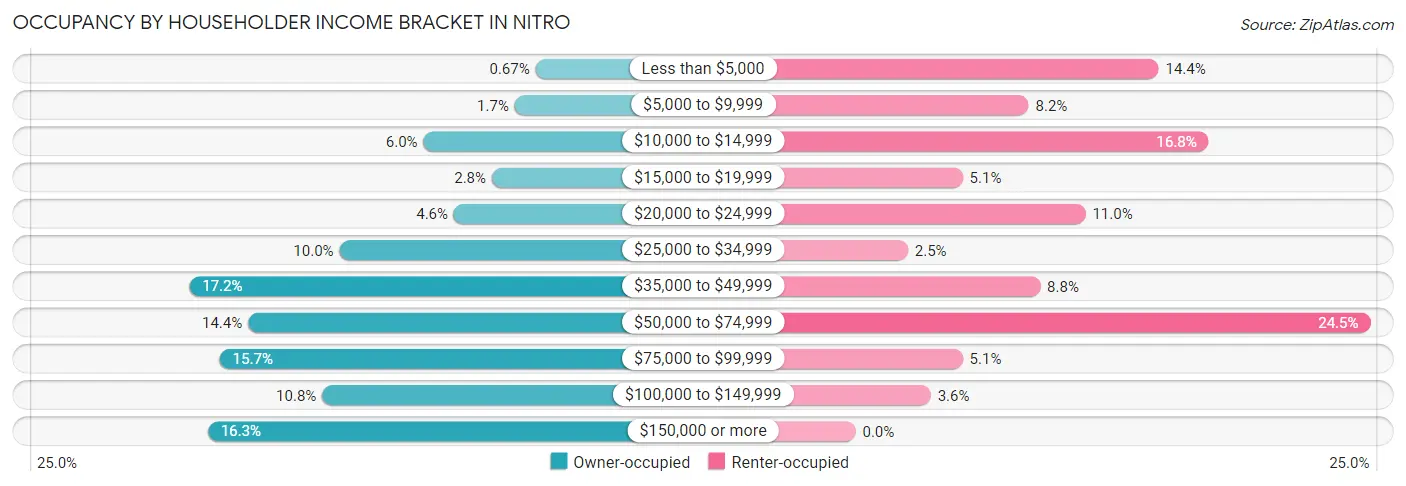
| Income Bracket | Owner-occupied | Renter-occupied |
| Less than $5,000 | 13 (0.7%) | 133 (14.4%) |
| $5,000 to $9,999 | 32 (1.7%) | 76 (8.2%) |
| $10,000 to $14,999 | 116 (6.0%) | 155 (16.8%) |
| $15,000 to $19,999 | 53 (2.8%) | 47 (5.1%) |
| $20,000 to $24,999 | 88 (4.6%) | 101 (11.0%) |
| $25,000 to $34,999 | 193 (10.0%) | 23 (2.5%) |
| $35,000 to $49,999 | 331 (17.2%) | 81 (8.8%) |
| $50,000 to $74,999 | 277 (14.4%) | 226 (24.5%) |
| $75,000 to $99,999 | 303 (15.7%) | 47 (5.1%) |
| $100,000 to $149,999 | 209 (10.8%) | 33 (3.6%) |
| $150,000 or more | 314 (16.3%) | 0 (0.0%) |
| Total | 1,929 (100.0%) | 922 (100.0%) |
Monthly Housing Cost Tiers in Nitro
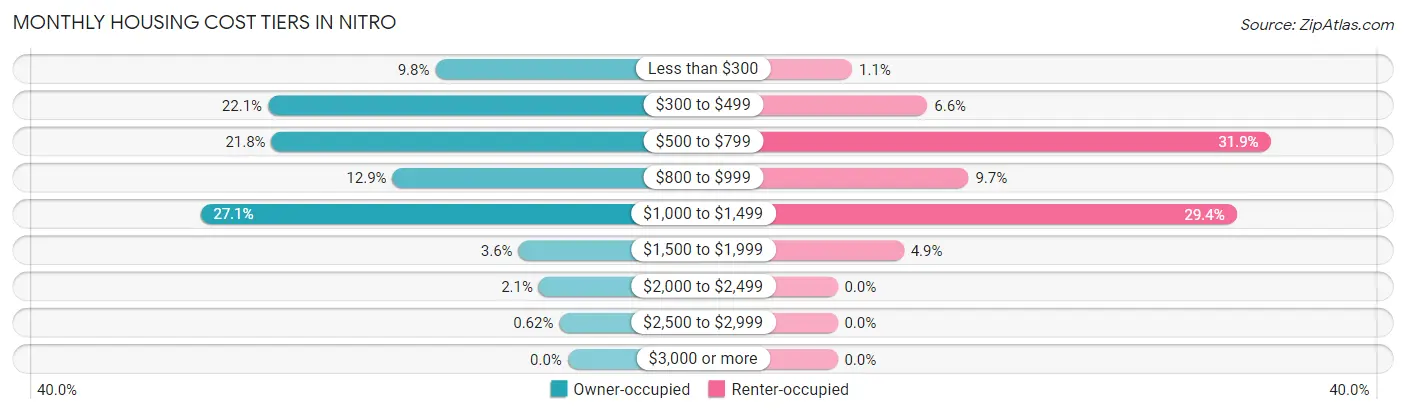
| Monthly Cost | Owner-occupied | Renter-occupied |
| Less than $300 | 188 (9.8%) | 10 (1.1%) |
| $300 to $499 | 426 (22.1%) | 61 (6.6%) |
| $500 to $799 | 421 (21.8%) | 294 (31.9%) |
| $800 to $999 | 249 (12.9%) | 89 (9.7%) |
| $1,000 to $1,499 | 522 (27.1%) | 271 (29.4%) |
| $1,500 to $1,999 | 70 (3.6%) | 45 (4.9%) |
| $2,000 to $2,499 | 41 (2.1%) | 0 (0.0%) |
| $2,500 to $2,999 | 12 (0.6%) | 0 (0.0%) |
| $3,000 or more | 0 (0.0%) | 0 (0.0%) |
| Total | 1,929 (100.0%) | 922 (100.0%) |
Physical Housing Characteristics in Nitro
Housing Structures in Nitro
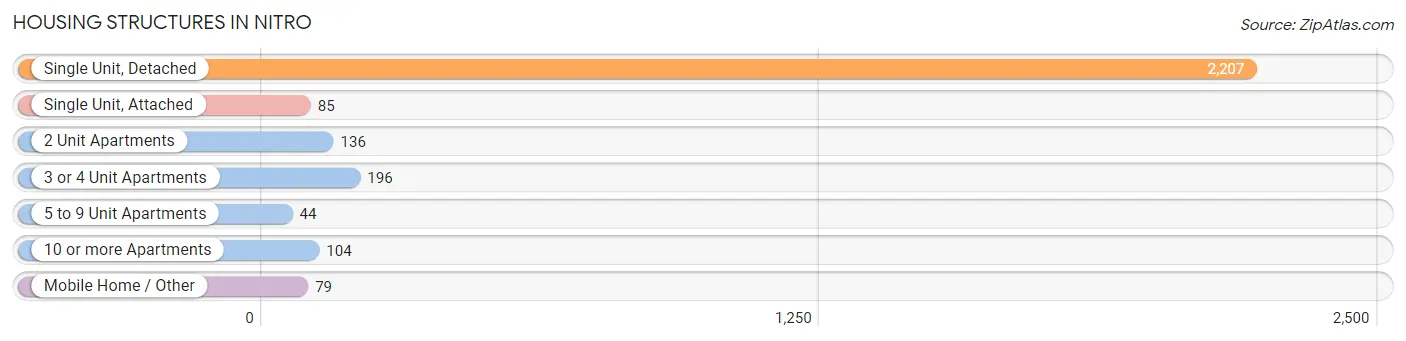
| Structure Type | # Housing Units | % Housing Units |
| Single Unit, Detached | 2,207 | 77.4% |
| Single Unit, Attached | 85 | 3.0% |
| 2 Unit Apartments | 136 | 4.8% |
| 3 or 4 Unit Apartments | 196 | 6.9% |
| 5 to 9 Unit Apartments | 44 | 1.5% |
| 10 or more Apartments | 104 | 3.6% |
| Mobile Home / Other | 79 | 2.8% |
| Total | 2,851 | 100.0% |
Housing Structures by Occupancy in Nitro
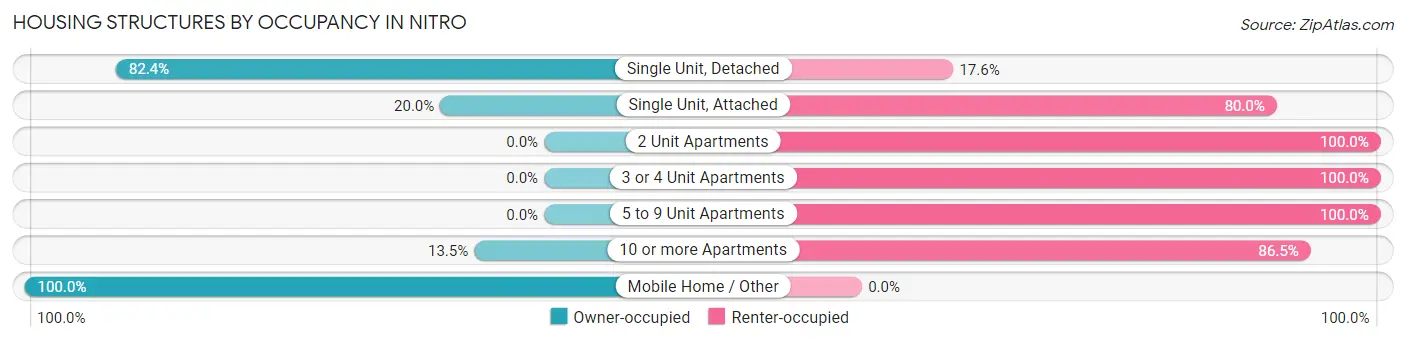
| Structure Type | Owner-occupied | Renter-occupied |
| Single Unit, Detached | 1,819 (82.4%) | 388 (17.6%) |
| Single Unit, Attached | 17 (20.0%) | 68 (80.0%) |
| 2 Unit Apartments | 0 (0.0%) | 136 (100.0%) |
| 3 or 4 Unit Apartments | 0 (0.0%) | 196 (100.0%) |
| 5 to 9 Unit Apartments | 0 (0.0%) | 44 (100.0%) |
| 10 or more Apartments | 14 (13.5%) | 90 (86.5%) |
| Mobile Home / Other | 79 (100.0%) | 0 (0.0%) |
| Total | 1,929 (67.7%) | 922 (32.3%) |
Housing Structures by Number of Rooms in Nitro
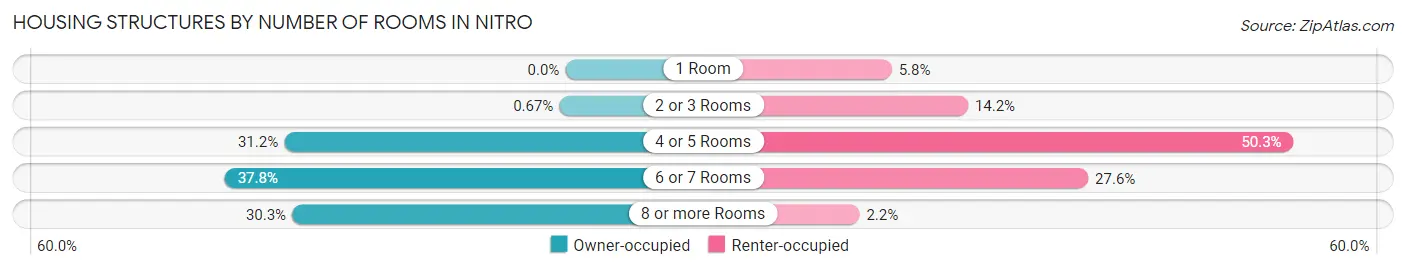
| Number of Rooms | Owner-occupied | Renter-occupied |
| 1 Room | 0 (0.0%) | 53 (5.8%) |
| 2 or 3 Rooms | 13 (0.7%) | 131 (14.2%) |
| 4 or 5 Rooms | 602 (31.2%) | 464 (50.3%) |
| 6 or 7 Rooms | 729 (37.8%) | 254 (27.6%) |
| 8 or more Rooms | 585 (30.3%) | 20 (2.2%) |
| Total | 1,929 (100.0%) | 922 (100.0%) |
Housing Structure by Heating Type in Nitro
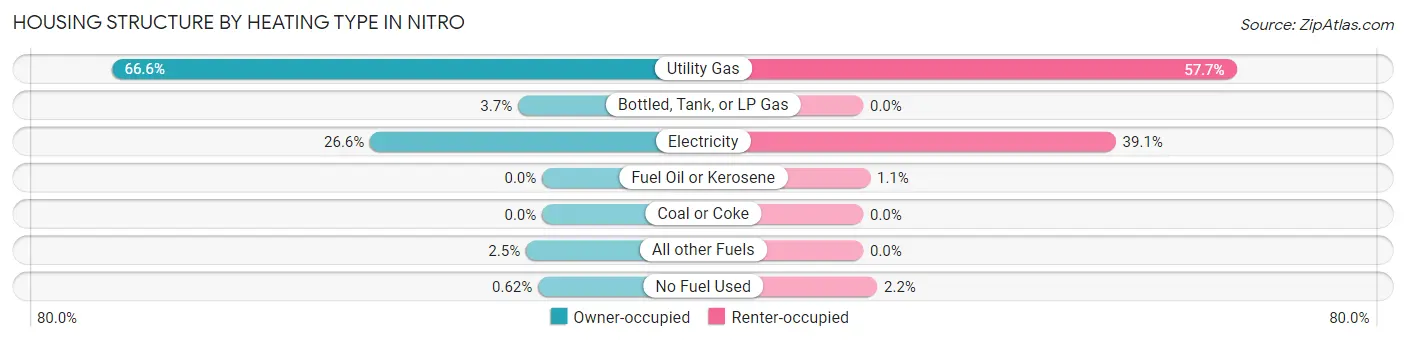
| Heating Type | Owner-occupied | Renter-occupied |
| Utility Gas | 1,284 (66.6%) | 532 (57.7%) |
| Bottled, Tank, or LP Gas | 72 (3.7%) | 0 (0.0%) |
| Electricity | 513 (26.6%) | 360 (39.1%) |
| Fuel Oil or Kerosene | 0 (0.0%) | 10 (1.1%) |
| Coal or Coke | 0 (0.0%) | 0 (0.0%) |
| All other Fuels | 48 (2.5%) | 0 (0.0%) |
| No Fuel Used | 12 (0.6%) | 20 (2.2%) |
| Total | 1,929 (100.0%) | 922 (100.0%) |
Household Vehicle Usage in Nitro
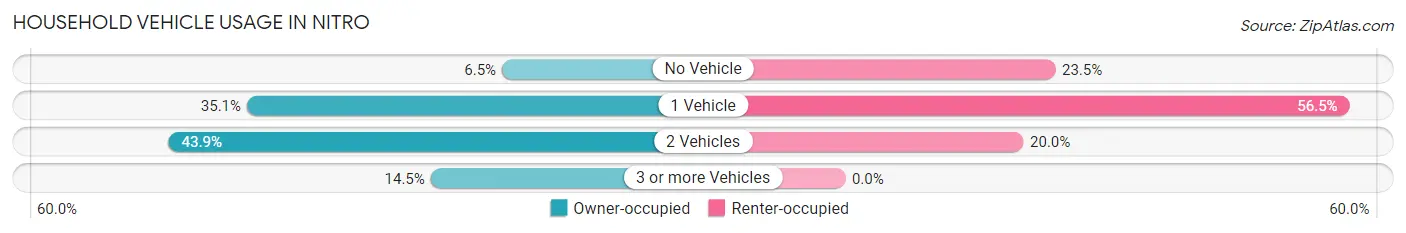
| Vehicles per Household | Owner-occupied | Renter-occupied |
| No Vehicle | 126 (6.5%) | 217 (23.5%) |
| 1 Vehicle | 677 (35.1%) | 521 (56.5%) |
| 2 Vehicles | 846 (43.9%) | 184 (20.0%) |
| 3 or more Vehicles | 280 (14.5%) | 0 (0.0%) |
| Total | 1,929 (100.0%) | 922 (100.0%) |
Real Estate & Mortgages in Nitro
Real Estate and Mortgage Overview in Nitro
| Characteristic | Without Mortgage | With Mortgage |
| Housing Units | 930 | 999 |
| Median Property Value | $98,800 | $115,200 |
| Median Household Income | $38,382 | $221 |
| Monthly Housing Costs | $415 | $0 |
| Real Estate Taxes | $617 | $37 |
Property Value by Mortgage Status in Nitro
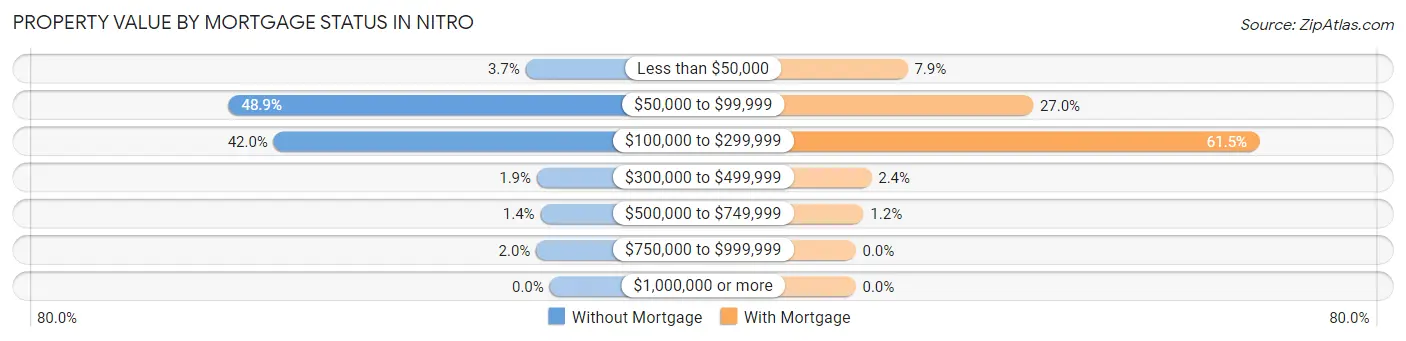
| Property Value | Without Mortgage | With Mortgage |
| Less than $50,000 | 34 (3.7%) | 79 (7.9%) |
| $50,000 to $99,999 | 455 (48.9%) | 270 (27.0%) |
| $100,000 to $299,999 | 391 (42.0%) | 614 (61.5%) |
| $300,000 to $499,999 | 18 (1.9%) | 24 (2.4%) |
| $500,000 to $749,999 | 13 (1.4%) | 12 (1.2%) |
| $750,000 to $999,999 | 19 (2.0%) | 0 (0.0%) |
| $1,000,000 or more | 0 (0.0%) | 0 (0.0%) |
| Total | 930 (100.0%) | 999 (100.0%) |
Household Income by Mortgage Status in Nitro
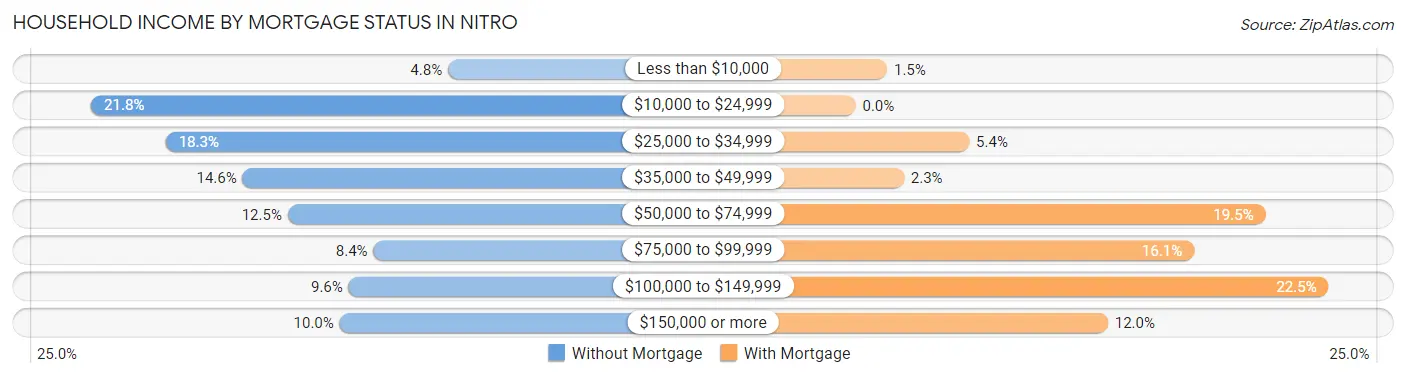
| Household Income | Without Mortgage | With Mortgage |
| Less than $10,000 | 45 (4.8%) | 15 (1.5%) |
| $10,000 to $24,999 | 203 (21.8%) | 0 (0.0%) |
| $25,000 to $34,999 | 170 (18.3%) | 54 (5.4%) |
| $35,000 to $49,999 | 136 (14.6%) | 23 (2.3%) |
| $50,000 to $74,999 | 116 (12.5%) | 195 (19.5%) |
| $75,000 to $99,999 | 78 (8.4%) | 161 (16.1%) |
| $100,000 to $149,999 | 89 (9.6%) | 225 (22.5%) |
| $150,000 or more | 93 (10.0%) | 120 (12.0%) |
| Total | 930 (100.0%) | 999 (100.0%) |
Property Value to Household Income Ratio in Nitro
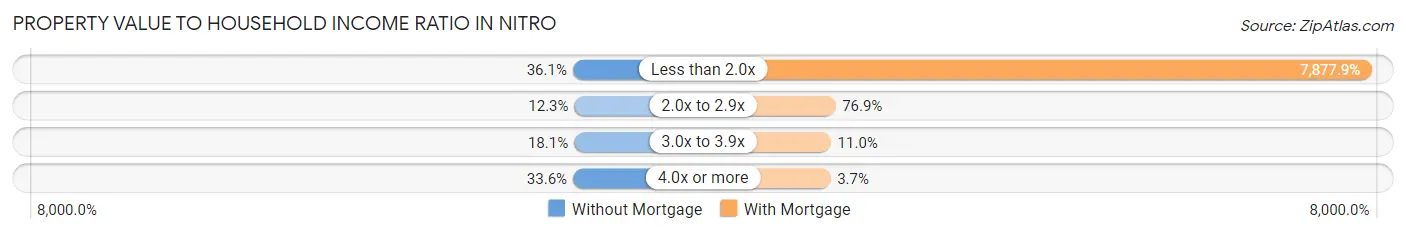
| Value-to-Income Ratio | Without Mortgage | With Mortgage |
| Less than 2.0x | 336 (36.1%) | 78,700 (7,877.9%) |
| 2.0x to 2.9x | 114 (12.3%) | 768 (76.9%) |
| 3.0x to 3.9x | 168 (18.1%) | 110 (11.0%) |
| 4.0x or more | 312 (33.6%) | 37 (3.7%) |
| Total | 930 (100.0%) | 999 (100.0%) |
Real Estate Taxes by Mortgage Status in Nitro
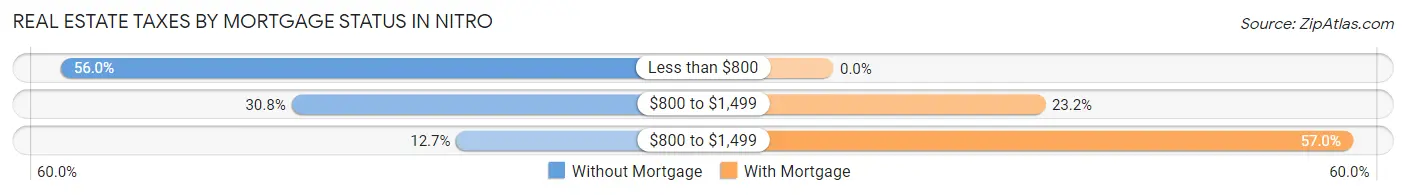
| Property Taxes | Without Mortgage | With Mortgage |
| Less than $800 | 521 (56.0%) | 0 (0.0%) |
| $800 to $1,499 | 286 (30.7%) | 232 (23.2%) |
| $800 to $1,499 | 118 (12.7%) | 569 (57.0%) |
| Total | 930 (100.0%) | 999 (100.0%) |
Health & Disability in Nitro
Health Insurance Coverage by Age in Nitro
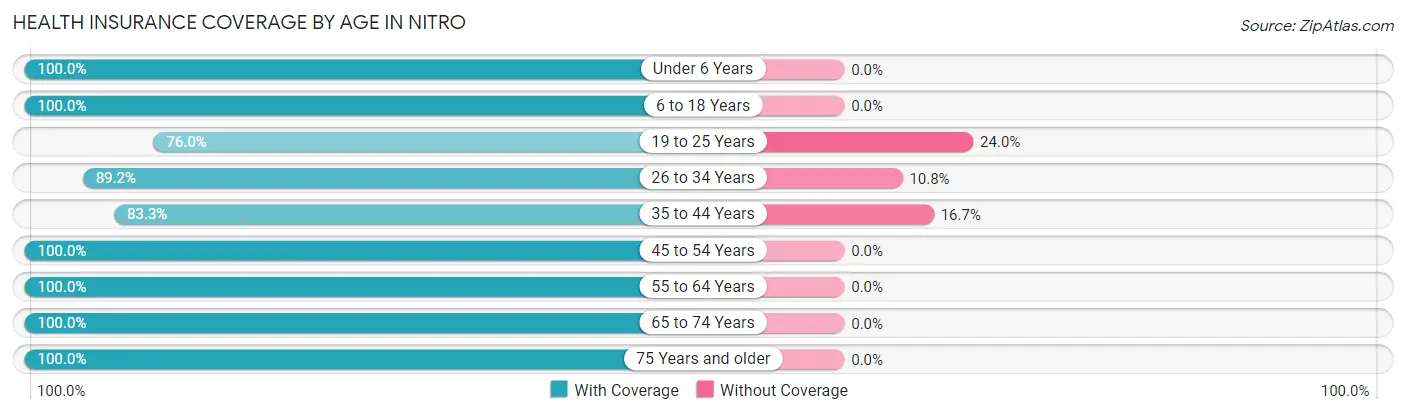
| Age Bracket | With Coverage | Without Coverage |
| Under 6 Years | 383 (100.0%) | 0 (0.0%) |
| 6 to 18 Years | 1,207 (100.0%) | 0 (0.0%) |
| 19 to 25 Years | 196 (76.0%) | 62 (24.0%) |
| 26 to 34 Years | 658 (89.2%) | 80 (10.8%) |
| 35 to 44 Years | 555 (83.3%) | 111 (16.7%) |
| 45 to 54 Years | 759 (100.0%) | 0 (0.0%) |
| 55 to 64 Years | 1,117 (100.0%) | 0 (0.0%) |
| 65 to 74 Years | 729 (100.0%) | 0 (0.0%) |
| 75 Years and older | 683 (100.0%) | 0 (0.0%) |
| Total | 6,287 (96.1%) | 253 (3.9%) |
Health Insurance Coverage by Citizenship Status in Nitro
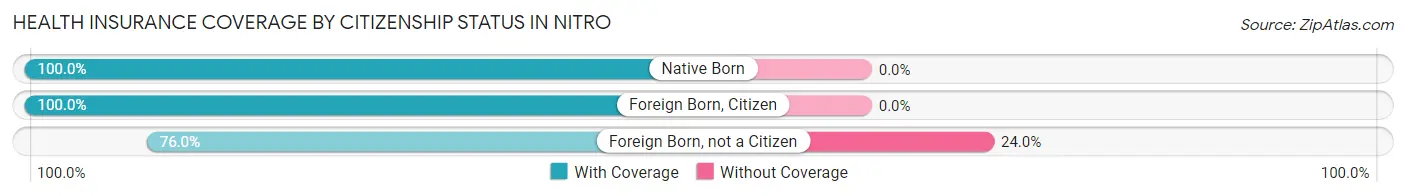
| Citizenship Status | With Coverage | Without Coverage |
| Native Born | 383 (100.0%) | 0 (0.0%) |
| Foreign Born, Citizen | 1,207 (100.0%) | 0 (0.0%) |
| Foreign Born, not a Citizen | 196 (76.0%) | 62 (24.0%) |
Health Insurance Coverage by Household Income in Nitro
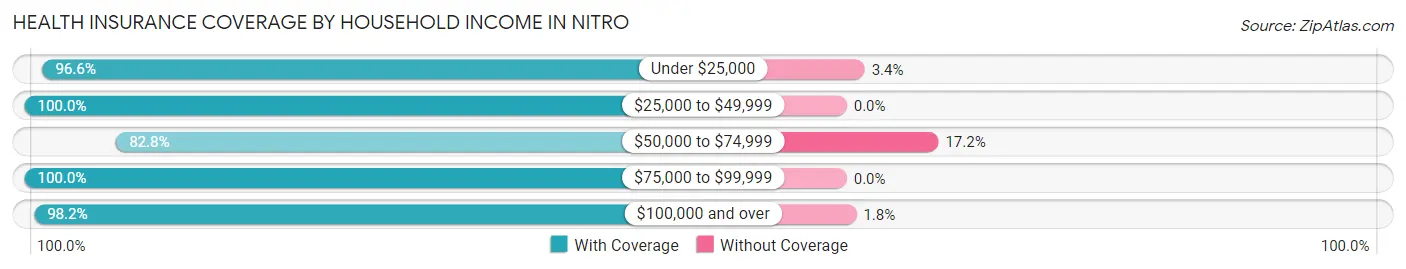
| Household Income | With Coverage | Without Coverage |
| Under $25,000 | 1,554 (96.6%) | 54 (3.4%) |
| $25,000 to $49,999 | 1,373 (100.0%) | 0 (0.0%) |
| $50,000 to $74,999 | 834 (82.8%) | 173 (17.2%) |
| $75,000 to $99,999 | 1,117 (100.0%) | 0 (0.0%) |
| $100,000 and over | 1,409 (98.2%) | 26 (1.8%) |
Public vs Private Health Insurance Coverage by Age in Nitro
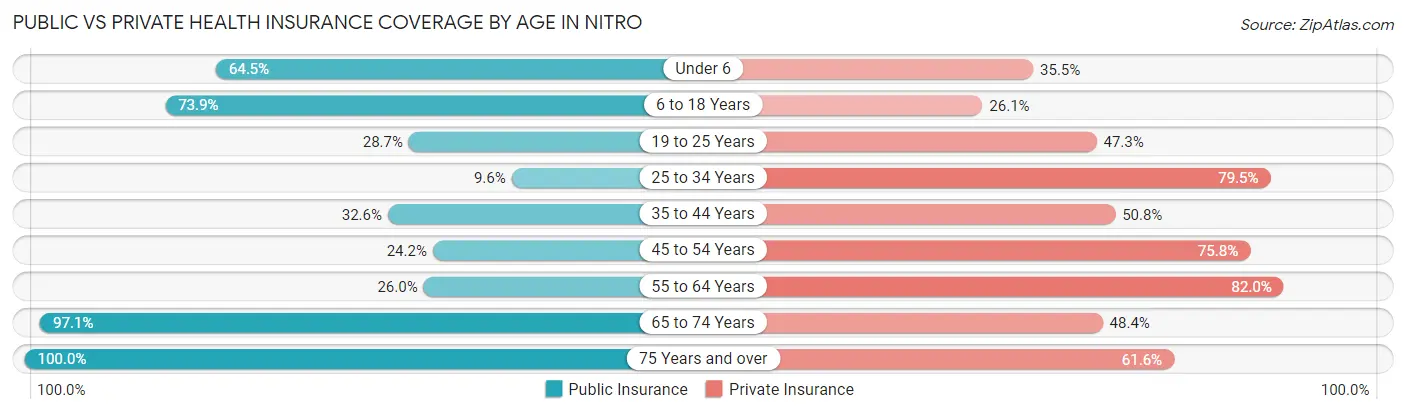
| Age Bracket | Public Insurance | Private Insurance |
| Under 6 | 247 (64.5%) | 136 (35.5%) |
| 6 to 18 Years | 892 (73.9%) | 315 (26.1%) |
| 19 to 25 Years | 74 (28.7%) | 122 (47.3%) |
| 25 to 34 Years | 71 (9.6%) | 587 (79.5%) |
| 35 to 44 Years | 217 (32.6%) | 338 (50.7%) |
| 45 to 54 Years | 184 (24.2%) | 575 (75.8%) |
| 55 to 64 Years | 290 (26.0%) | 916 (82.0%) |
| 65 to 74 Years | 708 (97.1%) | 353 (48.4%) |
| 75 Years and over | 683 (100.0%) | 421 (61.6%) |
| Total | 3,366 (51.5%) | 3,763 (57.5%) |
Disability Status by Sex by Age in Nitro
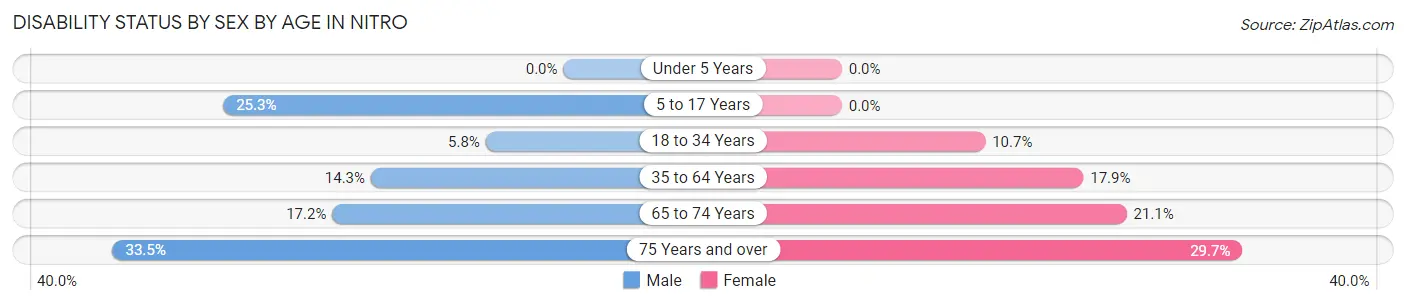
| Age Bracket | Male | Female |
| Under 5 Years | 0 (0.0%) | 0 (0.0%) |
| 5 to 17 Years | 127 (25.3%) | 0 (0.0%) |
| 18 to 34 Years | 33 (5.8%) | 54 (10.6%) |
| 35 to 64 Years | 203 (14.3%) | 201 (17.9%) |
| 65 to 74 Years | 35 (17.2%) | 111 (21.1%) |
| 75 Years and over | 80 (33.5%) | 132 (29.7%) |
Disability Class by Sex by Age in Nitro
Disability Class: Hearing Difficulty
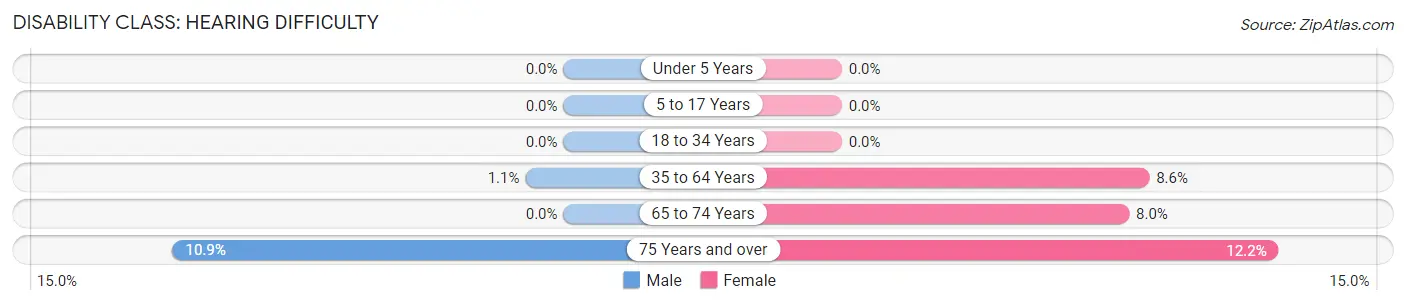
| Age Bracket | Male | Female |
| Under 5 Years | 0 (0.0%) | 0 (0.0%) |
| 5 to 17 Years | 0 (0.0%) | 0 (0.0%) |
| 18 to 34 Years | 0 (0.0%) | 0 (0.0%) |
| 35 to 64 Years | 15 (1.1%) | 96 (8.6%) |
| 65 to 74 Years | 0 (0.0%) | 42 (8.0%) |
| 75 Years and over | 26 (10.9%) | 54 (12.2%) |
Disability Class: Vision Difficulty
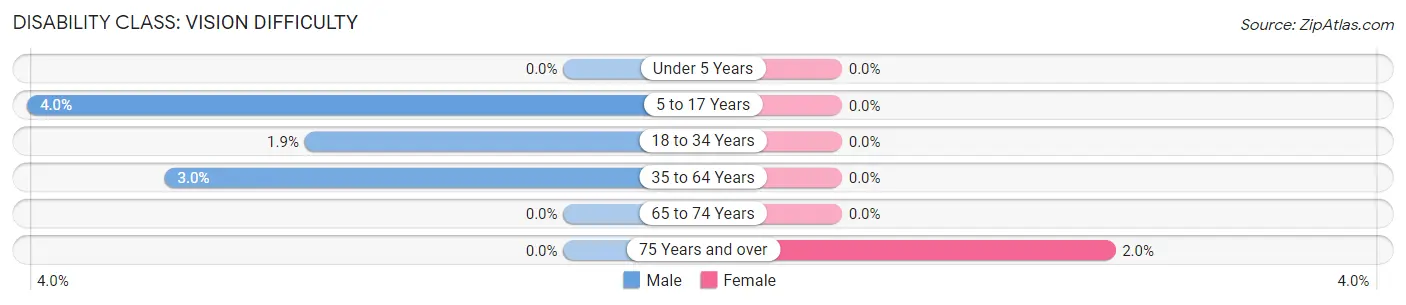
| Age Bracket | Male | Female |
| Under 5 Years | 0 (0.0%) | 0 (0.0%) |
| 5 to 17 Years | 20 (4.0%) | 0 (0.0%) |
| 18 to 34 Years | 11 (1.9%) | 0 (0.0%) |
| 35 to 64 Years | 42 (3.0%) | 0 (0.0%) |
| 65 to 74 Years | 0 (0.0%) | 0 (0.0%) |
| 75 Years and over | 0 (0.0%) | 9 (2.0%) |
Disability Class: Cognitive Difficulty
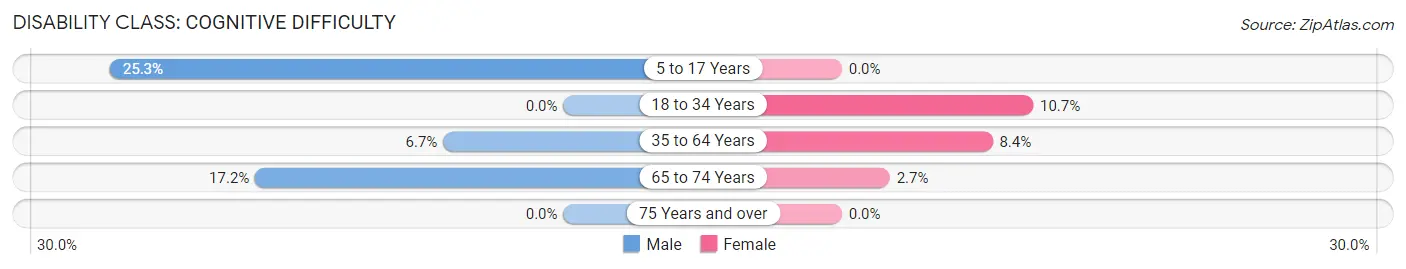
| Age Bracket | Male | Female |
| 5 to 17 Years | 127 (25.3%) | 0 (0.0%) |
| 18 to 34 Years | 0 (0.0%) | 54 (10.6%) |
| 35 to 64 Years | 95 (6.7%) | 94 (8.4%) |
| 65 to 74 Years | 35 (17.2%) | 14 (2.7%) |
| 75 Years and over | 0 (0.0%) | 0 (0.0%) |
Disability Class: Ambulatory Difficulty
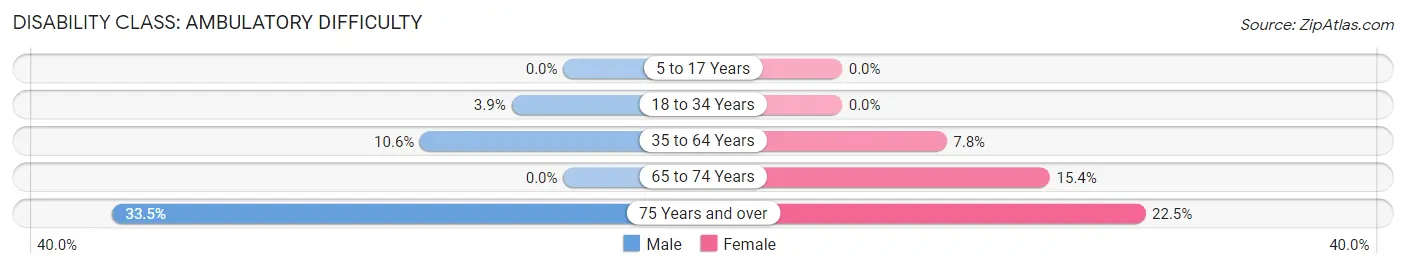
| Age Bracket | Male | Female |
| 5 to 17 Years | 0 (0.0%) | 0 (0.0%) |
| 18 to 34 Years | 22 (3.8%) | 0 (0.0%) |
| 35 to 64 Years | 151 (10.6%) | 87 (7.8%) |
| 65 to 74 Years | 0 (0.0%) | 81 (15.4%) |
| 75 Years and over | 80 (33.5%) | 100 (22.5%) |
Disability Class: Self-Care Difficulty
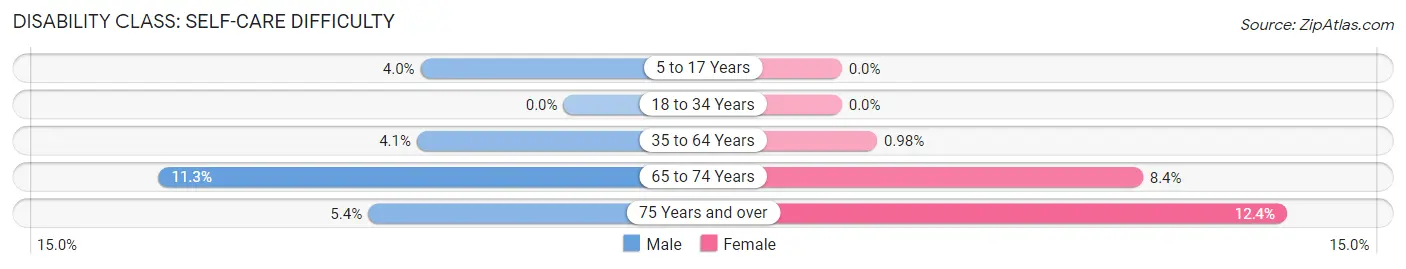
| Age Bracket | Male | Female |
| 5 to 17 Years | 20 (4.0%) | 0 (0.0%) |
| 18 to 34 Years | 0 (0.0%) | 0 (0.0%) |
| 35 to 64 Years | 58 (4.1%) | 11 (1.0%) |
| 65 to 74 Years | 23 (11.3%) | 44 (8.4%) |
| 75 Years and over | 13 (5.4%) | 55 (12.4%) |
Technology Access in Nitro
Computing Device Access in Nitro
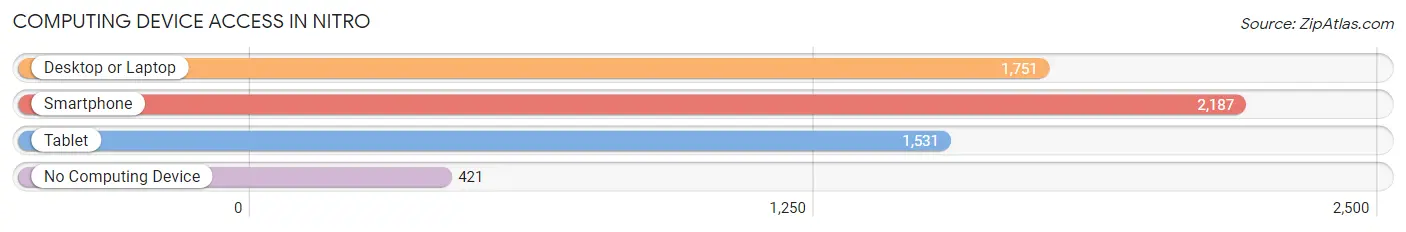
| Device Type | # Households | % Households |
| Desktop or Laptop | 1,751 | 61.4% |
| Smartphone | 2,187 | 76.7% |
| Tablet | 1,531 | 53.7% |
| No Computing Device | 421 | 14.8% |
| Total | 2,851 | 100.0% |
Internet Access in Nitro
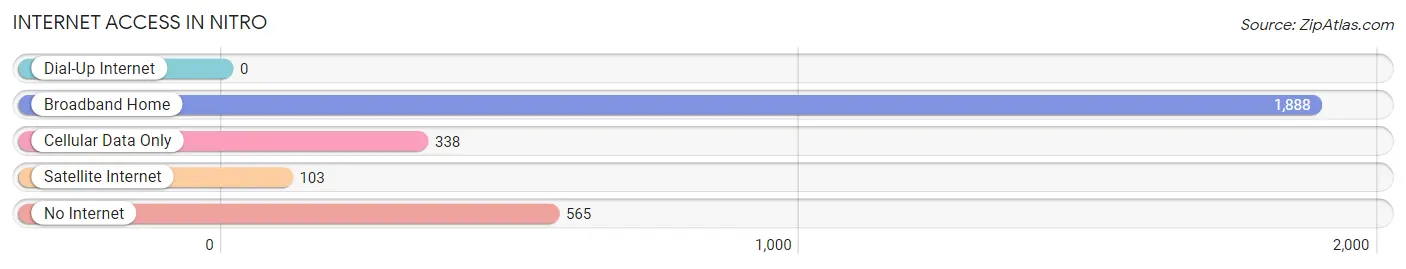
| Internet Type | # Households | % Households |
| Dial-Up Internet | 0 | 0.0% |
| Broadband Home | 1,888 | 66.2% |
| Cellular Data Only | 338 | 11.9% |
| Satellite Internet | 103 | 3.6% |
| No Internet | 565 | 19.8% |
| Total | 2,851 | 100.0% |
Nitro Summary
Nestled in the Appalachian Mountains of West Virginia, the small town of Nitro is a unique and vibrant community with a rich history, diverse geography, and a strong economy. With a population of just over 6,000 people, Nitro is a small town with a big heart.
History
Nitro was founded in 1917 by the Nitro Chemical Company, which was established to produce explosives for World War I. The town was named after the chemical nitroglycerin, which was used to make the explosives. The company was the largest employer in the area and provided jobs for many of the town’s residents.
In the 1920s, Nitro experienced a period of growth and prosperity. The town was home to several businesses, including a movie theater, a bowling alley, and a hotel. The town also had a thriving music scene, with several jazz clubs and a popular dance hall.
During World War II, Nitro was home to a large munitions plant. The plant employed thousands of people and produced millions of pounds of explosives for the war effort. After the war, the plant was closed and the town’s economy shifted to a more traditional manufacturing base.
In the 1950s, Nitro experienced a period of decline. The town’s population decreased and many of the businesses closed. In the 1960s, the town began to experience a resurgence. The Nitro Chemical Company was purchased by the Monsanto Corporation and the town was revitalized.
Today, Nitro is a vibrant and diverse community. The town is home to several businesses, including a shopping center, a movie theater, and a bowling alley. The town also has a thriving music scene, with several jazz clubs and a popular dance hall.
Geography
Nitro is located in the Appalachian Mountains of West Virginia. The town is situated on the banks of the Kanawha River, which flows through the town. The town is surrounded by rolling hills and lush forests.
The climate in Nitro is mild and temperate. The average temperature in the summer is around 75 degrees Fahrenheit and the average temperature in the winter is around 40 degrees Fahrenheit. The town receives an average of 40 inches of rain per year.
Economy
Nitro’s economy is largely based on manufacturing and services. The town is home to several manufacturing companies, including a plastics plant, a paper mill, and a steel mill. The town also has a thriving retail sector, with several shopping centers and a movie theater.
The town is also home to several government agencies, including the West Virginia Department of Transportation and the West Virginia Department of Environmental Protection. The town is also home to several educational institutions, including a community college and a technical school.
Demographics
As of the 2010 census, the population of Nitro was 6,072. The town is predominantly white, with a population that is 94.3% white and 5.7% other races. The median household income in Nitro is $37,941 and the median age is 38.7 years.
Nitro is a diverse and vibrant community with a rich history, diverse geography, and a strong economy. The town is home to several businesses, government agencies, and educational institutions. The town is also home to a thriving music scene and a popular dance hall. Nitro is a great place to live, work, and play.
Common Questions
What is Per Capita Income in Nitro?
Per Capita income in Nitro is $35,027.
What is the Median Family Income in Nitro?
Median Family Income in Nitro is $70,688.
What is the Median Household income in Nitro?
Median Household Income in Nitro is $49,742.
What is Income or Wage Gap in Nitro?
Income or Wage Gap in Nitro is 18.4%.
Women in Nitro earn 81.6 cents for every dollar earned by a man.
What is Inequality or Gini Index in Nitro?
Inequality or Gini Index in Nitro is 0.52.
What is the Total Population of Nitro?
Total Population of Nitro is 6,540.
What is the Total Male Population of Nitro?
Total Male Population of Nitro is 3,037.
What is the Total Female Population of Nitro?
Total Female Population of Nitro is 3,503.
What is the Ratio of Males per 100 Females in Nitro?
There are 86.70 Males per 100 Females in Nitro.
What is the Ratio of Females per 100 Males in Nitro?
There are 115.34 Females per 100 Males in Nitro.
What is the Median Population Age in Nitro?
Median Population Age in Nitro is 45.1 Years.
What is the Average Family Size in Nitro
Average Family Size in Nitro is 3.0 People.
What is the Average Household Size in Nitro
Average Household Size in Nitro is 2.3 People.
How Large is the Labor Force in Nitro?
There are 3,012 People in the Labor Forcein in Nitro.
What is the Percentage of People in the Labor Force in Nitro?
58.3% of People are in the Labor Force in Nitro.
What is the Unemployment Rate in Nitro?
Unemployment Rate in Nitro is 8.3%.