Elkins, WV Map & Demographics
Elkins Map
Elkins Overview
$25,823
PER CAPITA INCOME
$65,859
AVG FAMILY INCOME
$39,875
AVG HOUSEHOLD INCOME
17.7%
WAGE / INCOME GAP [ % ]
82.3¢/ $1
WAGE / INCOME GAP [ $ ]
0.50
INEQUALITY / GINI INDEX
6,935
TOTAL POPULATION
3,407
MALE POPULATION
3,528
FEMALE POPULATION
96.57
MALES / 100 FEMALES
103.55
FEMALES / 100 MALES
38.7
MEDIAN AGE
3.4
AVG FAMILY SIZE
2.4
AVG HOUSEHOLD SIZE
3,417
LABOR FORCE [ PEOPLE ]
59.3%
PERCENT IN LABOR FORCE
11.2%
UNEMPLOYMENT RATE
Elkins Zip Codes
Income in Elkins
Income Overview in Elkins
Per Capita Income in Elkins is $25,823, while median incomes of families and households are $65,859 and $39,875 respectively.
| Characteristic | Number | Measure |
| Per Capita Income | 6,935 | $25,823 |
| Median Family Income | 1,368 | $65,859 |
| Mean Family Income | 1,368 | $81,063 |
| Median Household Income | 2,758 | $39,875 |
| Mean Household Income | 2,758 | $58,287 |
| Income Deficit | 1,368 | $0 |
| Wage / Income Gap (%) | 6,935 | 17.74% |
| Wage / Income Gap ($) | 6,935 | 82.26¢ per $1 |
| Gini / Inequality Index | 6,935 | 0.50 |
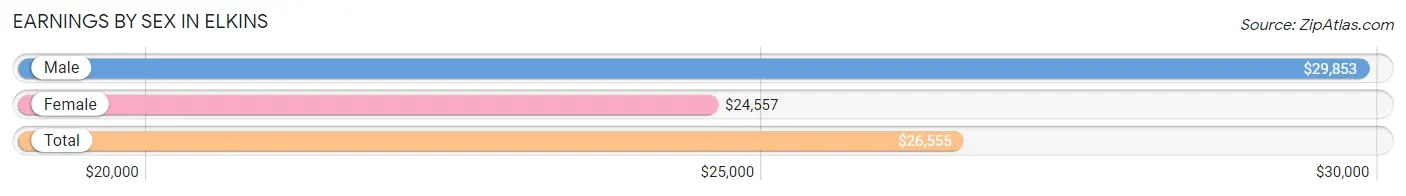
Earnings by Sex in Elkins
Average Earnings in Elkins are $26,555, $29,853 for men and $24,557 for women, a difference of 17.7%.
| Sex | Number | Average Earnings |
| Male | 1,906 (52.0%) | $29,853 |
| Female | 1,761 (48.0%) | $24,557 |
| Total | 3,667 (100.0%) | $26,555 |
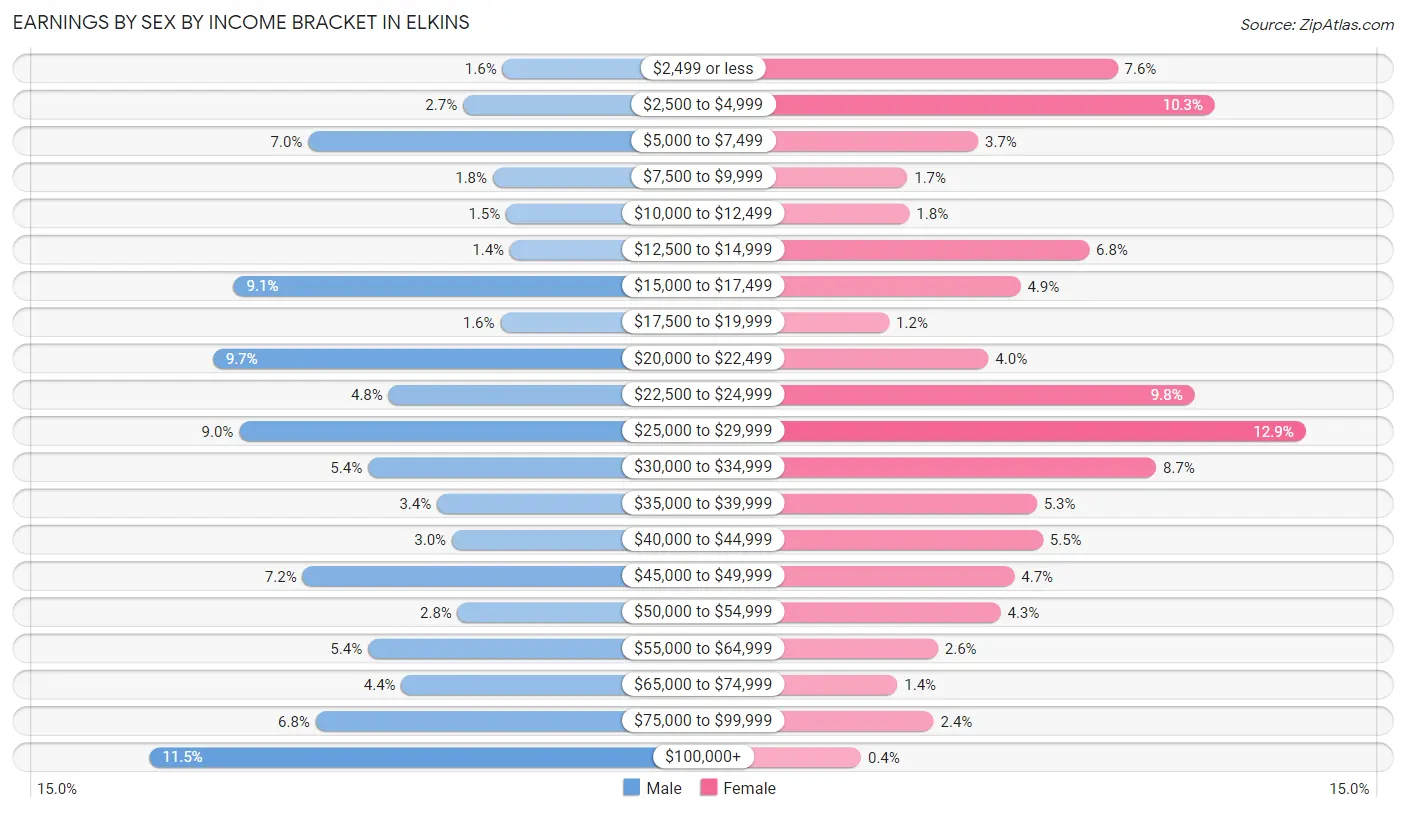
Earnings by Sex by Income Bracket in Elkins
The most common earnings brackets in Elkins are $100,000+ for men (219 | 11.5%) and $25,000 to $29,999 for women (227 | 12.9%).
| Income | Male | Female |
| $2,499 or less | 30 (1.6%) | 134 (7.6%) |
| $2,500 to $4,999 | 51 (2.7%) | 182 (10.3%) |
| $5,000 to $7,499 | 134 (7.0%) | 65 (3.7%) |
| $7,500 to $9,999 | 35 (1.8%) | 30 (1.7%) |
| $10,000 to $12,499 | 28 (1.5%) | 31 (1.8%) |
| $12,500 to $14,999 | 26 (1.4%) | 120 (6.8%) |
| $15,000 to $17,499 | 174 (9.1%) | 86 (4.9%) |
| $17,500 to $19,999 | 31 (1.6%) | 21 (1.2%) |
| $20,000 to $22,499 | 185 (9.7%) | 70 (4.0%) |
| $22,500 to $24,999 | 91 (4.8%) | 172 (9.8%) |
| $25,000 to $29,999 | 171 (9.0%) | 227 (12.9%) |
| $30,000 to $34,999 | 102 (5.3%) | 153 (8.7%) |
| $35,000 to $39,999 | 65 (3.4%) | 94 (5.3%) |
| $40,000 to $44,999 | 57 (3.0%) | 97 (5.5%) |
| $45,000 to $49,999 | 137 (7.2%) | 83 (4.7%) |
| $50,000 to $54,999 | 54 (2.8%) | 76 (4.3%) |
| $55,000 to $64,999 | 102 (5.3%) | 45 (2.6%) |
| $65,000 to $74,999 | 84 (4.4%) | 25 (1.4%) |
| $75,000 to $99,999 | 130 (6.8%) | 43 (2.4%) |
| $100,000+ | 219 (11.5%) | 7 (0.4%) |
| Total | 1,906 (100.0%) | 1,761 (100.0%) |
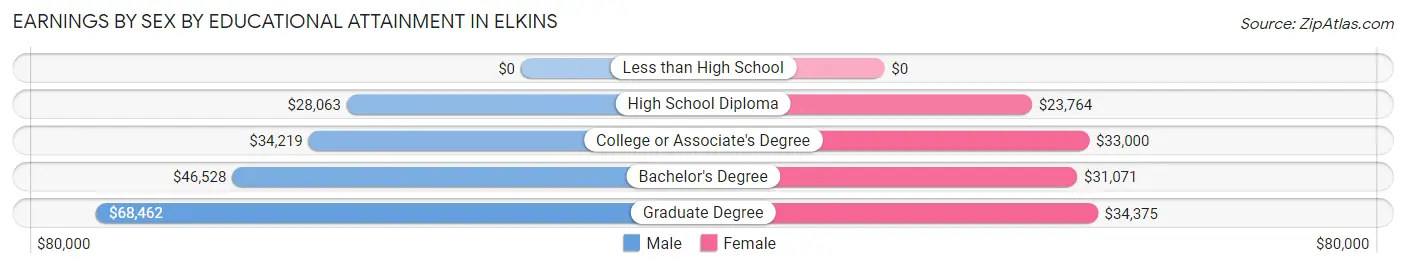
Earnings by Sex by Educational Attainment in Elkins
Average earnings in Elkins are $41,961 for men and $27,114 for women, a difference of 35.4%. Men with an educational attainment of graduate degree enjoy the highest average annual earnings of $68,462, while those with high school diploma education earn the least with $28,063. Women with an educational attainment of graduate degree earn the most with the average annual earnings of $34,375, while those with high school diploma education have the smallest earnings of $23,764.
| Educational Attainment | Male Income | Female Income |
| Less than High School | - | - |
| High School Diploma | $28,063 | $23,764 |
| College or Associate's Degree | $34,219 | $33,000 |
| Bachelor's Degree | $46,528 | $31,071 |
| Graduate Degree | $68,462 | $34,375 |
| Total | $41,961 | $27,114 |
Family Income in Elkins
Family Income Brackets in Elkins
According to the Elkins family income data, there are 248 families falling into the $100,000 to $149,999 income range, which is the most common income bracket and makes up 18.1% of all families. Conversely, the less than $10,000 income bracket is the least frequent group with only 36 families (2.6%) belonging to this category.
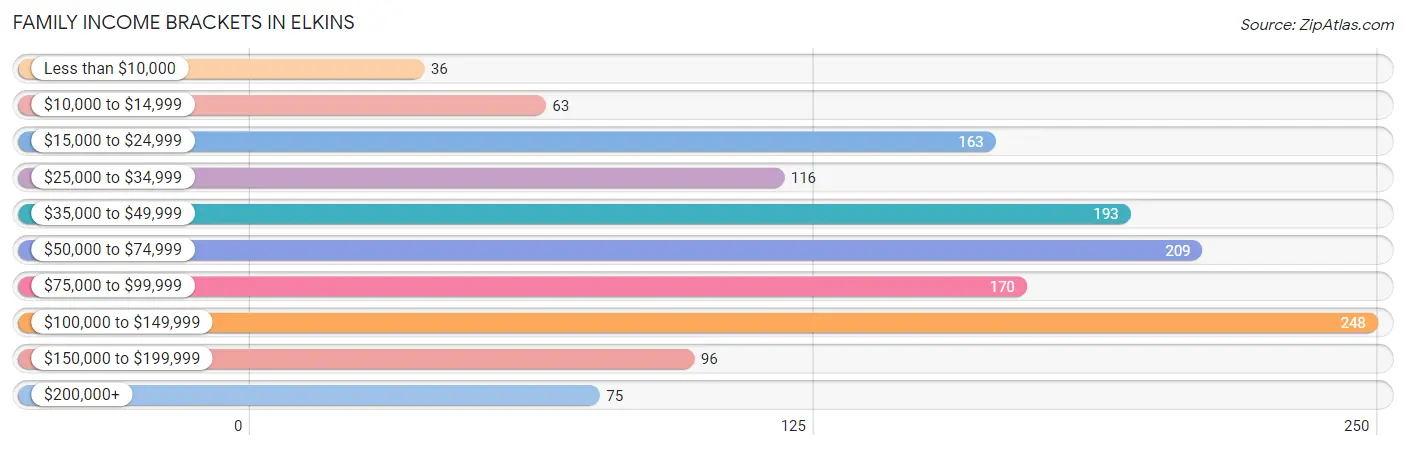
| Income Bracket | # Families | % Families |
| Less than $10,000 | 36 | 2.6% |
| $10,000 to $14,999 | 63 | 4.6% |
| $15,000 to $24,999 | 163 | 11.9% |
| $25,000 to $34,999 | 116 | 8.5% |
| $35,000 to $49,999 | 193 | 14.1% |
| $50,000 to $74,999 | 209 | 15.3% |
| $75,000 to $99,999 | 170 | 12.4% |
| $100,000 to $149,999 | 248 | 18.1% |
| $150,000 to $199,999 | 96 | 7.0% |
| $200,000+ | 75 | 5.5% |
Family Income by Famaliy Size in Elkins
4-person families (235 | 17.2%) account for the highest median family income in Elkins with $103,040 per family, while 3-person families (243 | 17.8%) have the highest median income of $26,964 per family member.
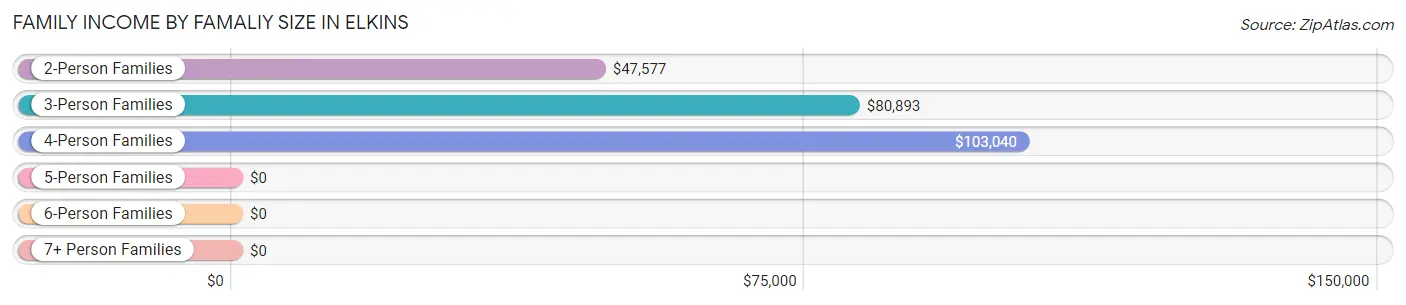
| Income Bracket | # Families | Median Income |
| 2-Person Families | 773 (56.5%) | $47,577 |
| 3-Person Families | 243 (17.8%) | $80,893 |
| 4-Person Families | 235 (17.2%) | $103,040 |
| 5-Person Families | 81 (5.9%) | $0 |
| 6-Person Families | 1 (0.1%) | $0 |
| 7+ Person Families | 35 (2.6%) | $0 |
| Total | 1,368 (100.0%) | $65,859 |
Family Income by Number of Earners in Elkins
The median family income in Elkins is $65,859, with families comprising 2 earners (402) having the highest median family income of $109,643, while families with no earners (303) have the lowest median family income of $32,452, accounting for 29.4% and 22.2% of families, respectively.
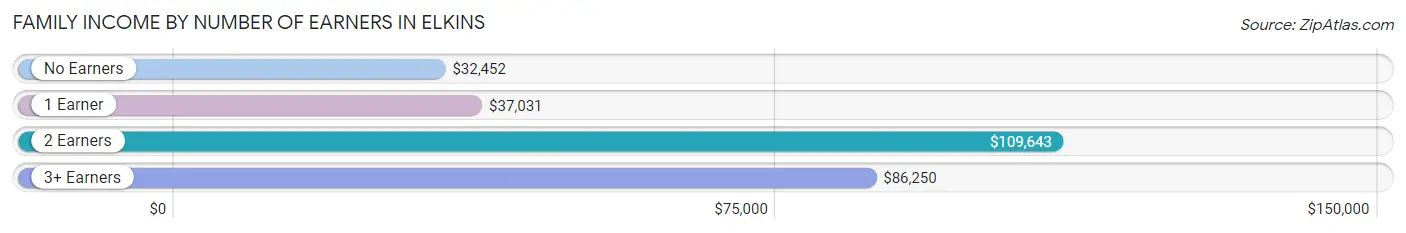
| Number of Earners | # Families | Median Income |
| No Earners | 303 (22.2%) | $32,452 |
| 1 Earner | 419 (30.6%) | $37,031 |
| 2 Earners | 402 (29.4%) | $109,643 |
| 3+ Earners | 244 (17.8%) | $86,250 |
| Total | 1,368 (100.0%) | $65,859 |
Household Income in Elkins
Household Income Brackets in Elkins
With 535 households falling in the category, the $15,000 to $24,999 income range is the most frequent in Elkins, accounting for 19.4% of all households. In contrast, only 74 households (2.7%) fall into the $200,000+ income bracket, making it the least populous group.
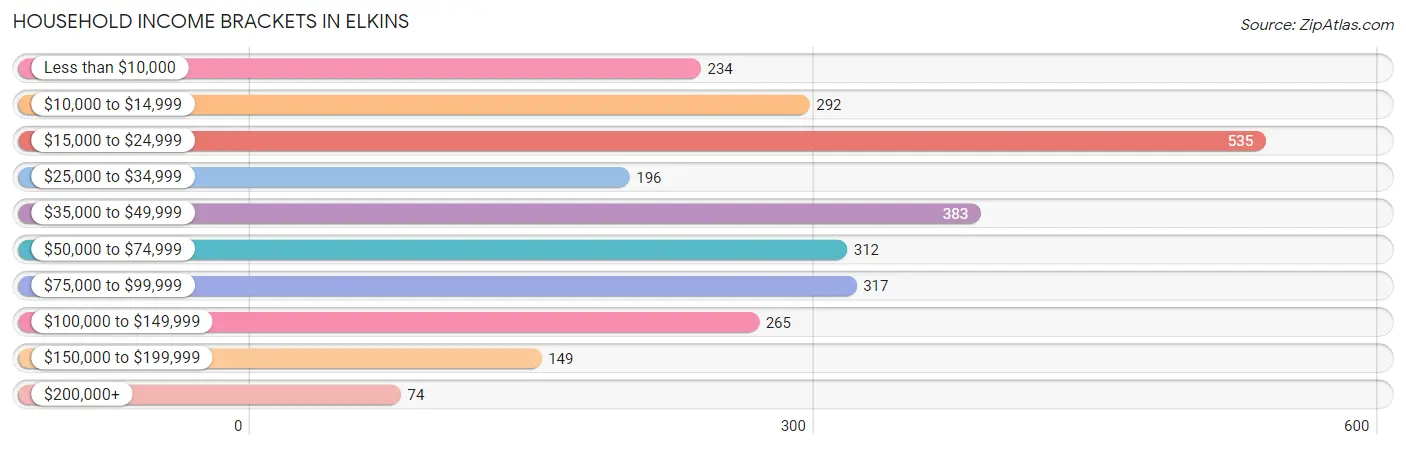
| Income Bracket | # Households | % Households |
| Less than $10,000 | 234 | 8.5% |
| $10,000 to $14,999 | 292 | 10.6% |
| $15,000 to $24,999 | 535 | 19.4% |
| $25,000 to $34,999 | 196 | 7.1% |
| $35,000 to $49,999 | 383 | 13.9% |
| $50,000 to $74,999 | 312 | 11.3% |
| $75,000 to $99,999 | 317 | 11.5% |
| $100,000 to $149,999 | 265 | 9.6% |
| $150,000 to $199,999 | 149 | 5.4% |
| $200,000+ | 74 | 2.7% |
Household Income by Householder Age in Elkins
The median household income in Elkins is $39,875, with the highest median household income of $65,164 found in the 25 to 44 years age bracket for the primary householder. A total of 755 households (27.4%) fall into this category. Meanwhile, the 15 to 24 years age bracket for the primary householder has the lowest median household income of $25,147, with 148 households (5.4%) in this group.
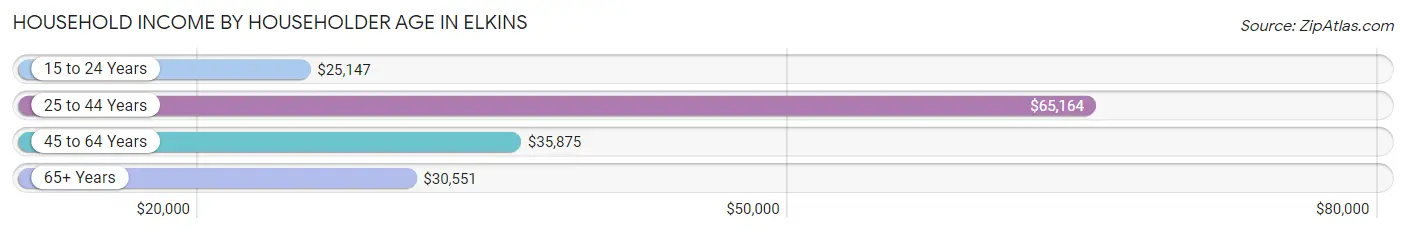
| Income Bracket | # Households | Median Income |
| 15 to 24 Years | 148 (5.4%) | $25,147 |
| 25 to 44 Years | 755 (27.4%) | $65,164 |
| 45 to 64 Years | 974 (35.3%) | $35,875 |
| 65+ Years | 881 (31.9%) | $30,551 |
| Total | 2,758 (100.0%) | $39,875 |
Poverty in Elkins
Income Below Poverty by Sex and Age in Elkins
With 10.7% poverty level for males and 23.1% for females among the residents of Elkins, 65 to 74 year old males and 6 to 11 year old females are the most vulnerable to poverty, with 68 males (28.2%) and 34 females (47.9%) in their respective age groups living below the poverty level.
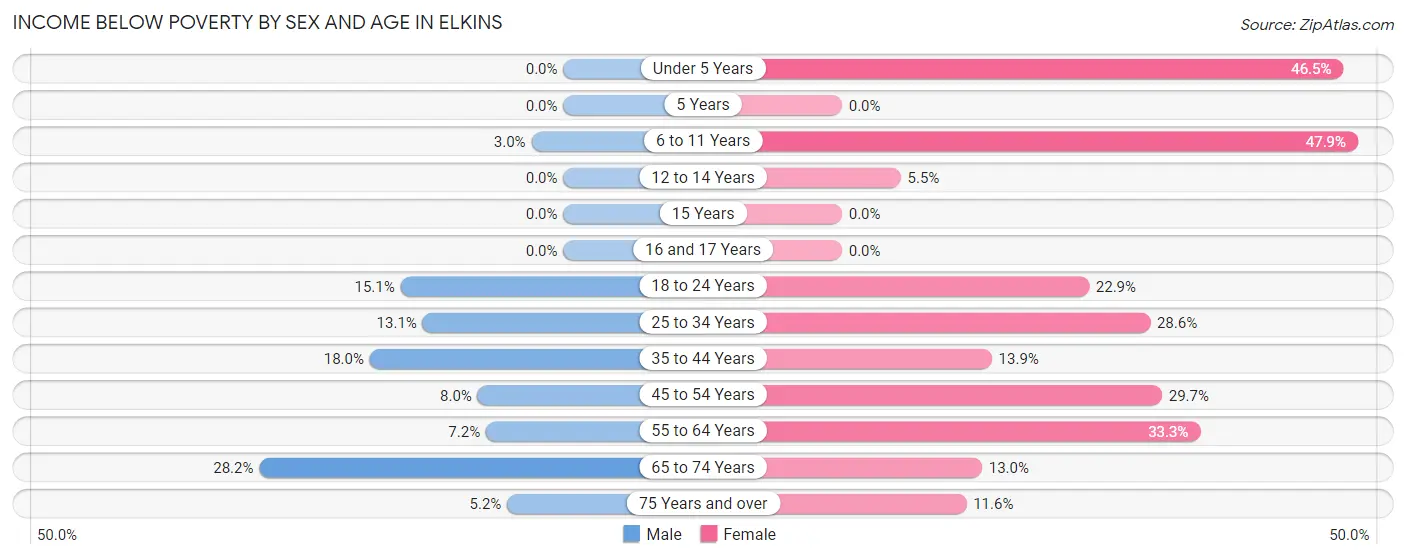
| Age Bracket | Male | Female |
| Under 5 Years | 0 (0.0%) | 121 (46.5%) |
| 5 Years | 0 (0.0%) | 0 (0.0%) |
| 6 to 11 Years | 8 (3.0%) | 34 (47.9%) |
| 12 to 14 Years | 0 (0.0%) | 10 (5.5%) |
| 15 Years | 0 (0.0%) | 0 (0.0%) |
| 16 and 17 Years | 0 (0.0%) | 0 (0.0%) |
| 18 to 24 Years | 50 (15.1%) | 72 (22.9%) |
| 25 to 34 Years | 44 (13.1%) | 133 (28.6%) |
| 35 to 44 Years | 88 (18.0%) | 48 (13.9%) |
| 45 to 54 Years | 38 (8.0%) | 109 (29.7%) |
| 55 to 64 Years | 30 (7.2%) | 155 (33.3%) |
| 65 to 74 Years | 68 (28.2%) | 56 (13.0%) |
| 75 Years and over | 10 (5.2%) | 38 (11.6%) |
| Total | 336 (10.7%) | 776 (23.1%) |
Income Above Poverty by Sex and Age in Elkins
According to the poverty statistics in Elkins, males aged under 5 years and females aged 5 years are the age groups that are most secure financially, with 100.0% of males and 100.0% of females in these age groups living above the poverty line.
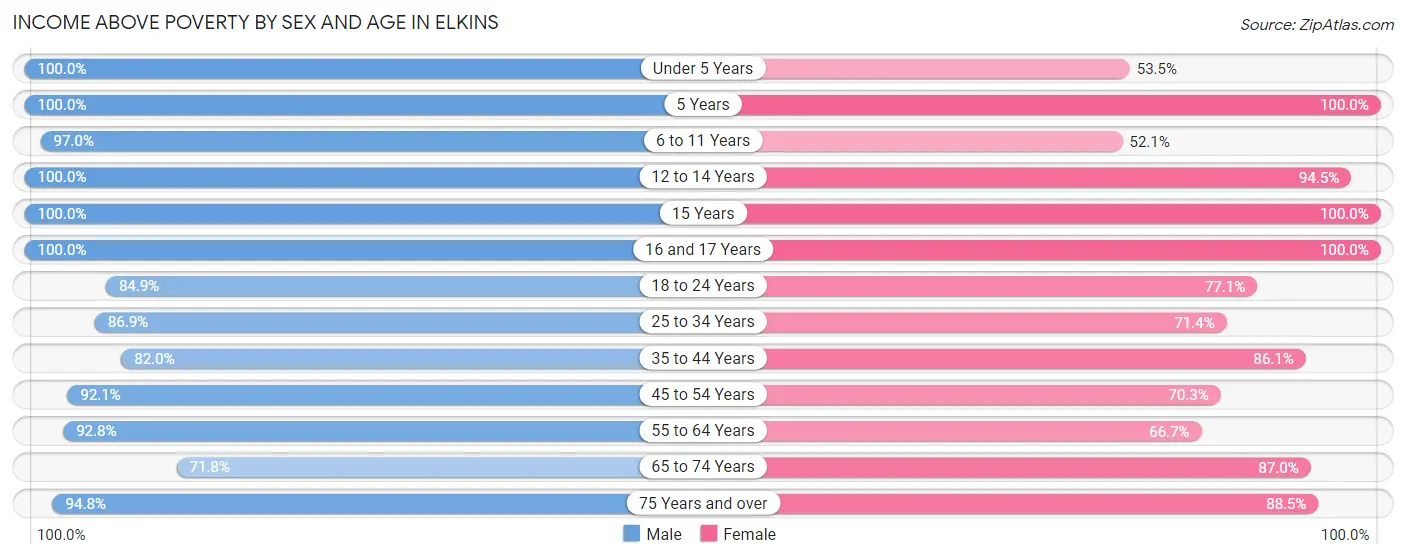
| Age Bracket | Male | Female |
| Under 5 Years | 152 (100.0%) | 139 (53.5%) |
| 5 Years | 10 (100.0%) | 24 (100.0%) |
| 6 to 11 Years | 262 (97.0%) | 37 (52.1%) |
| 12 to 14 Years | 66 (100.0%) | 173 (94.5%) |
| 15 Years | 91 (100.0%) | 10 (100.0%) |
| 16 and 17 Years | 63 (100.0%) | 88 (100.0%) |
| 18 to 24 Years | 281 (84.9%) | 242 (77.1%) |
| 25 to 34 Years | 293 (86.9%) | 332 (71.4%) |
| 35 to 44 Years | 402 (82.0%) | 297 (86.1%) |
| 45 to 54 Years | 440 (92.0%) | 258 (70.3%) |
| 55 to 64 Years | 388 (92.8%) | 311 (66.7%) |
| 65 to 74 Years | 173 (71.8%) | 375 (87.0%) |
| 75 Years and over | 182 (94.8%) | 291 (88.4%) |
| Total | 2,803 (89.3%) | 2,577 (76.9%) |
Income Below Poverty Among Married-Couple Families in Elkins
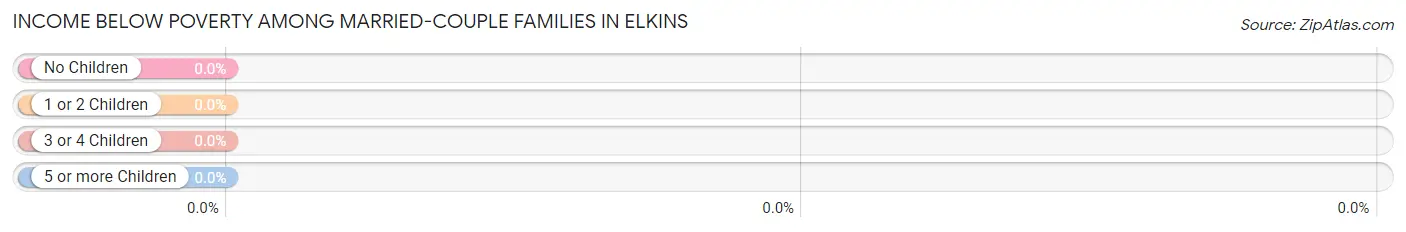
| Children | Above Poverty | Below Poverty |
| No Children | 460 (100.0%) | 0 (0.0%) |
| 1 or 2 Children | 379 (100.0%) | 0 (0.0%) |
| 3 or 4 Children | 26 (100.0%) | 0 (0.0%) |
| 5 or more Children | 10 (100.0%) | 0 (0.0%) |
| Total | 875 (100.0%) | 0 (0.0%) |
Income Below Poverty Among Single-Parent Households in Elkins
According to the poverty data in Elkins, 25.0% or 37 single-father households and 38.0% or 131 single-mother households are living below the poverty line. Among single-father households, those with no children have the highest poverty rate, with 23 households (26.1%) experiencing poverty. Likewise, among single-mother households, those with 1 or 2 children have the highest poverty rate, with 91 households (45.1%) falling below the poverty line.
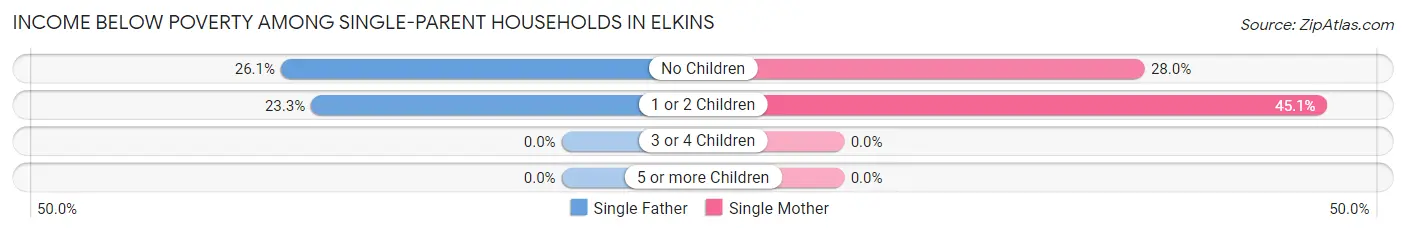
| Children | Single Father | Single Mother |
| No Children | 23 (26.1%) | 40 (28.0%) |
| 1 or 2 Children | 14 (23.3%) | 91 (45.1%) |
| 3 or 4 Children | 0 (0.0%) | 0 (0.0%) |
| 5 or more Children | 0 (0.0%) | 0 (0.0%) |
| Total | 37 (25.0%) | 131 (38.0%) |
Income Below Poverty Among Married-Couple vs Single-Parent Households in Elkins
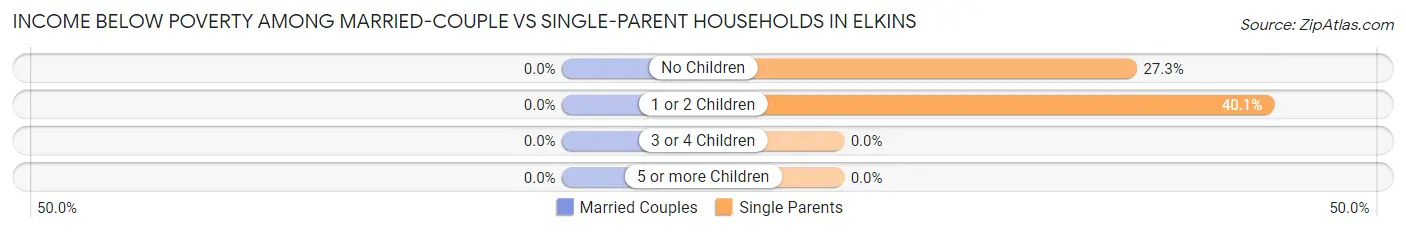
| Children | Married-Couple Families | Single-Parent Households |
| No Children | 0 (0.0%) | 63 (27.3%) |
| 1 or 2 Children | 0 (0.0%) | 105 (40.1%) |
| 3 or 4 Children | 0 (0.0%) | 0 (0.0%) |
| 5 or more Children | 0 (0.0%) | 0 (0.0%) |
| Total | 0 (0.0%) | 168 (34.1%) |
Race in Elkins
The most populous races in Elkins are White / Caucasian (6,335 | 91.3%), Two or more Races (285 | 4.1%), and Black / African American (211 | 3.0%).
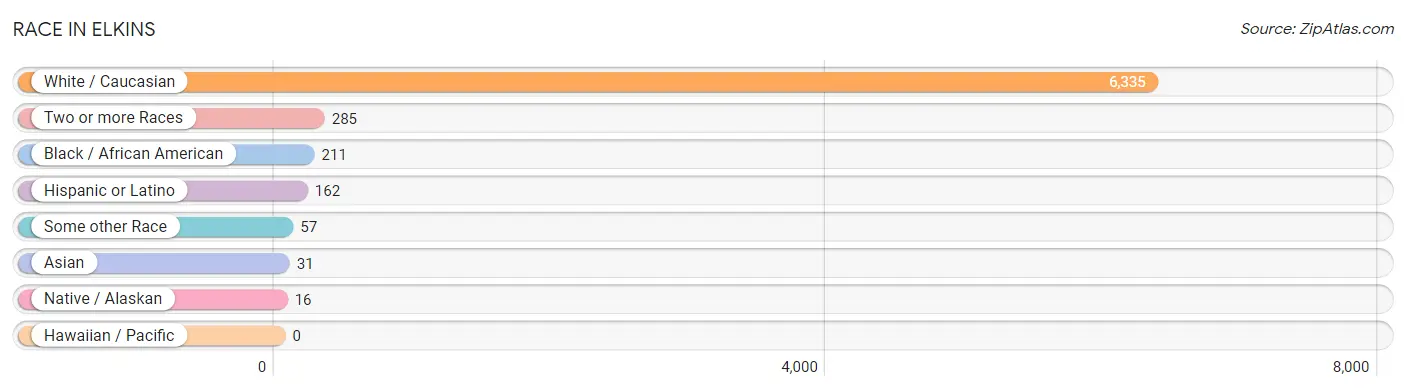
| Race | # Population | % Population |
| Asian | 31 | 0.4% |
| Black / African American | 211 | 3.0% |
| Hawaiian / Pacific | 0 | 0.0% |
| Hispanic or Latino | 162 | 2.3% |
| Native / Alaskan | 16 | 0.2% |
| White / Caucasian | 6,335 | 91.3% |
| Two or more Races | 285 | 4.1% |
| Some other Race | 57 | 0.8% |
| Total | 6,935 | 100.0% |
Ancestry in Elkins
The most populous ancestries reported in Elkins are German (1,550 | 22.4%), Irish (1,014 | 14.6%), English (659 | 9.5%), American (608 | 8.8%), and Scottish (414 | 6.0%), together accounting for 61.2% of all Elkins residents.
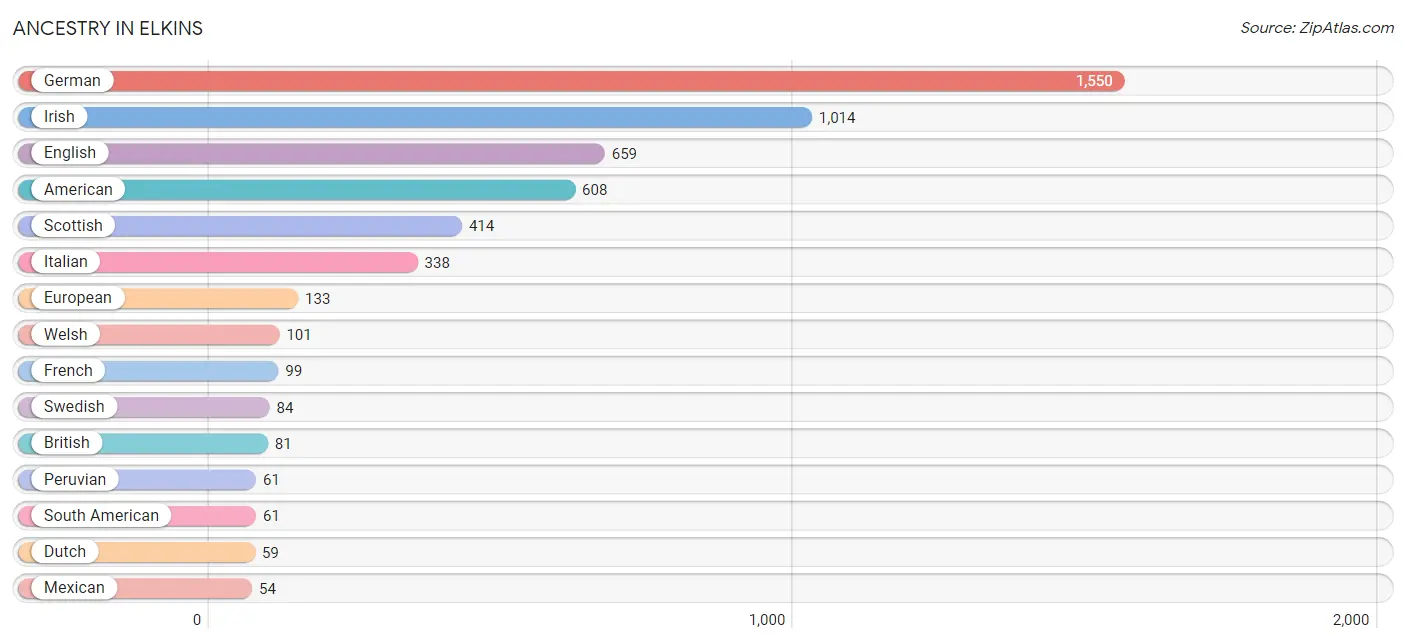
| Ancestry | # Population | % Population |
| American | 608 | 8.8% |
| Arab | 11 | 0.2% |
| Austrian | 6 | 0.1% |
| Bhutanese | 6 | 0.1% |
| British | 81 | 1.2% |
| Central American | 8 | 0.1% |
| Central American Indian | 8 | 0.1% |
| Cherokee | 19 | 0.3% |
| Dutch | 59 | 0.9% |
| Eastern European | 14 | 0.2% |
| English | 659 | 9.5% |
| European | 133 | 1.9% |
| French | 99 | 1.4% |
| French Canadian | 11 | 0.2% |
| German | 1,550 | 22.4% |
| Guatemalan | 8 | 0.1% |
| Hungarian | 16 | 0.2% |
| Indian (Asian) | 21 | 0.3% |
| Irish | 1,014 | 14.6% |
| Italian | 338 | 4.9% |
| Korean | 37 | 0.5% |
| Lebanese | 11 | 0.2% |
| Mexican | 54 | 0.8% |
| Northern European | 35 | 0.5% |
| Norwegian | 14 | 0.2% |
| Peruvian | 61 | 0.9% |
| Polish | 32 | 0.5% |
| Portuguese | 2 | 0.0% |
| Russian | 6 | 0.1% |
| Scandinavian | 12 | 0.2% |
| Scotch-Irish | 16 | 0.2% |
| Scottish | 414 | 6.0% |
| South American | 61 | 0.9% |
| Spaniard | 7 | 0.1% |
| Swedish | 84 | 1.2% |
| Swiss | 14 | 0.2% |
| Welsh | 101 | 1.5% | View All 37 Rows |
Immigrants in Elkins
The most numerous immigrant groups reported in Elkins came from Latin America (43 | 0.6%), Peru (43 | 0.6%), South America (43 | 0.6%), Europe (31 | 0.4%), and Northern Europe (22 | 0.3%), together accounting for 2.6% of all Elkins residents.
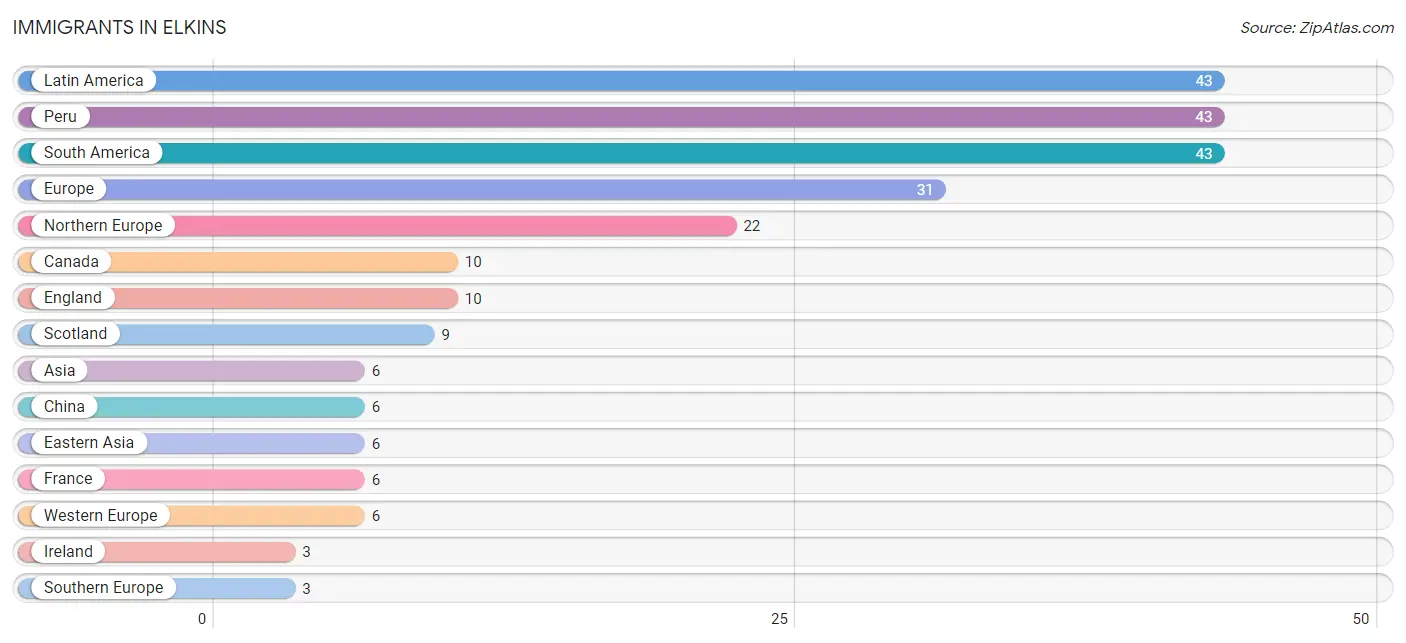
| Immigration Origin | # Population | % Population |
| Asia | 6 | 0.1% |
| Canada | 10 | 0.1% |
| China | 6 | 0.1% |
| Eastern Asia | 6 | 0.1% |
| England | 10 | 0.1% |
| Europe | 31 | 0.4% |
| France | 6 | 0.1% |
| Ireland | 3 | 0.0% |
| Latin America | 43 | 0.6% |
| Northern Europe | 22 | 0.3% |
| Peru | 43 | 0.6% |
| Scotland | 9 | 0.1% |
| South America | 43 | 0.6% |
| Southern Europe | 3 | 0.0% |
| Spain | 3 | 0.0% |
| Western Europe | 6 | 0.1% | View All 16 Rows |
Sex and Age in Elkins
Sex and Age in Elkins
The most populous age groups in Elkins are 15 to 19 Years (406 | 11.9%) for men and 20 to 24 Years (350 | 9.9%) for women.
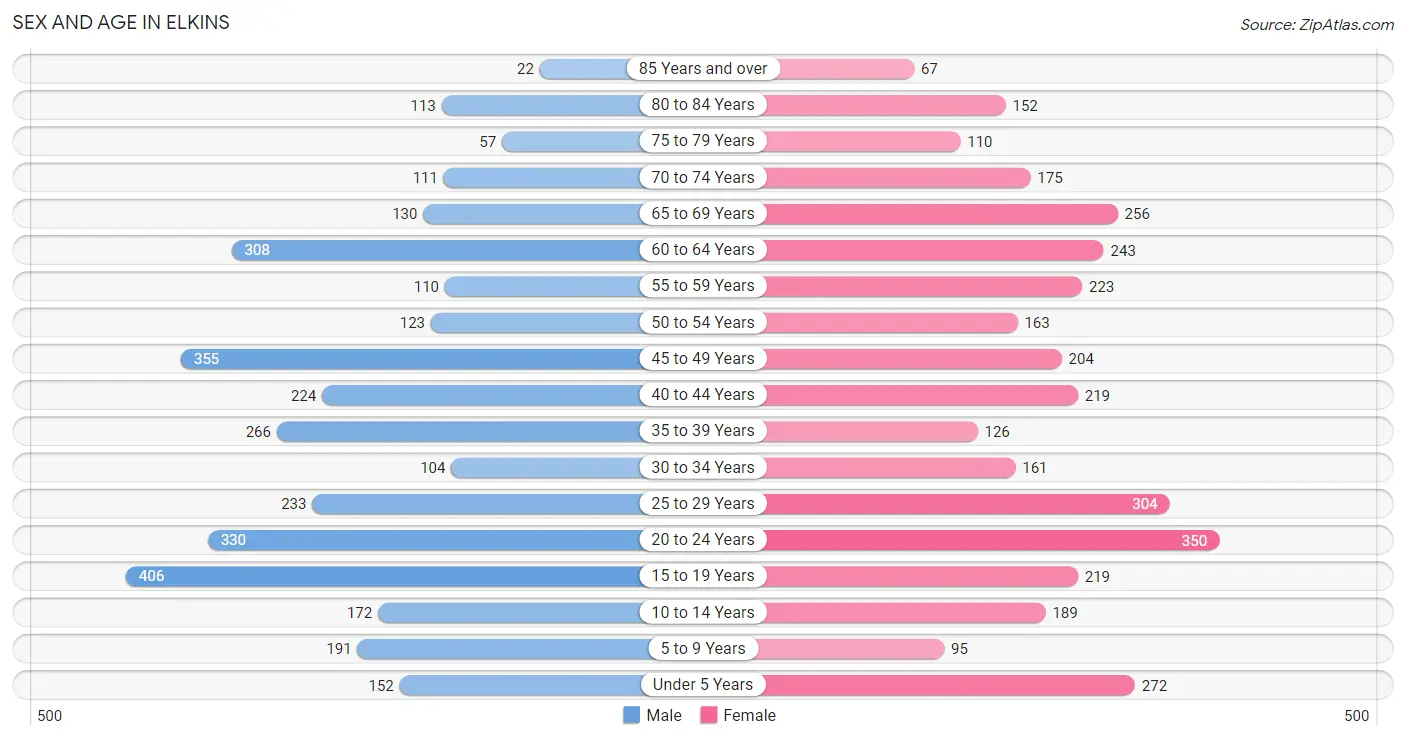
| Age Bracket | Male | Female |
| Under 5 Years | 152 (4.5%) | 272 (7.7%) |
| 5 to 9 Years | 191 (5.6%) | 95 (2.7%) |
| 10 to 14 Years | 172 (5.1%) | 189 (5.4%) |
| 15 to 19 Years | 406 (11.9%) | 219 (6.2%) |
| 20 to 24 Years | 330 (9.7%) | 350 (9.9%) |
| 25 to 29 Years | 233 (6.8%) | 304 (8.6%) |
| 30 to 34 Years | 104 (3.0%) | 161 (4.6%) |
| 35 to 39 Years | 266 (7.8%) | 126 (3.6%) |
| 40 to 44 Years | 224 (6.6%) | 219 (6.2%) |
| 45 to 49 Years | 355 (10.4%) | 204 (5.8%) |
| 50 to 54 Years | 123 (3.6%) | 163 (4.6%) |
| 55 to 59 Years | 110 (3.2%) | 223 (6.3%) |
| 60 to 64 Years | 308 (9.0%) | 243 (6.9%) |
| 65 to 69 Years | 130 (3.8%) | 256 (7.3%) |
| 70 to 74 Years | 111 (3.3%) | 175 (5.0%) |
| 75 to 79 Years | 57 (1.7%) | 110 (3.1%) |
| 80 to 84 Years | 113 (3.3%) | 152 (4.3%) |
| 85 Years and over | 22 (0.6%) | 67 (1.9%) |
| Total | 3,407 (100.0%) | 3,528 (100.0%) |
Families and Households in Elkins
Median Family Size in Elkins
The median family size in Elkins is 3.37 persons per family, with married-couple families (875 | 64.0%) accounting for the largest median family size of 3.6 persons per family. On the other hand, single male/father families (148 | 10.8%) represent the smallest median family size with 2.68 persons per family.
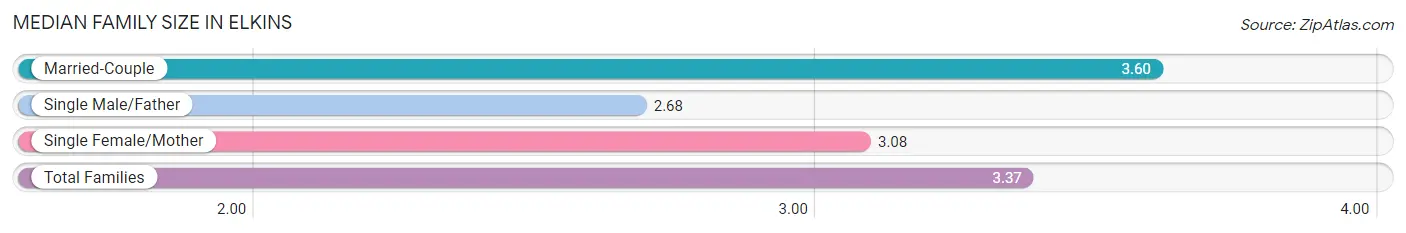
| Family Type | # Families | Family Size |
| Married-Couple | 875 (64.0%) | 3.60 |
| Single Male/Father | 148 (10.8%) | 2.68 |
| Single Female/Mother | 345 (25.2%) | 3.08 |
| Total Families | 1,368 (100.0%) | 3.37 |
Median Household Size in Elkins
The median household size in Elkins is 2.36 persons per household, with married-couple households (875 | 31.7%) accounting for the largest median household size of 3.62 persons per household. non-family households (1,390 | 50.4%) represent the smallest median household size with 1.23 persons per household.
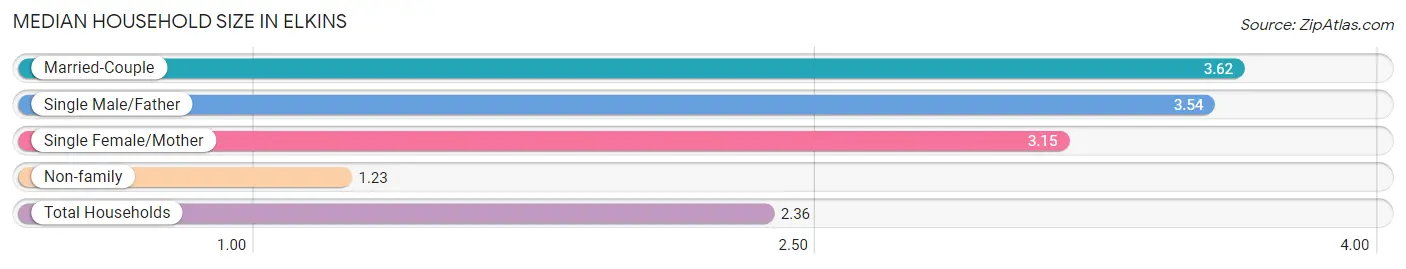
| Household Type | # Households | Household Size |
| Married-Couple | 875 (31.7%) | 3.62 |
| Single Male/Father | 148 (5.4%) | 3.54 |
| Single Female/Mother | 345 (12.5%) | 3.15 |
| Non-family | 1,390 (50.4%) | 1.23 |
| Total Households | 2,758 (100.0%) | 2.36 |
Household Size by Marriage Status in Elkins
Out of a total of 2,758 households in Elkins, 1,368 (49.6%) are family households, while 1,390 (50.4%) are nonfamily households. The most numerous type of family households are 2-person households, comprising 678, and the most common type of nonfamily households are 1-person households, comprising 1,135.
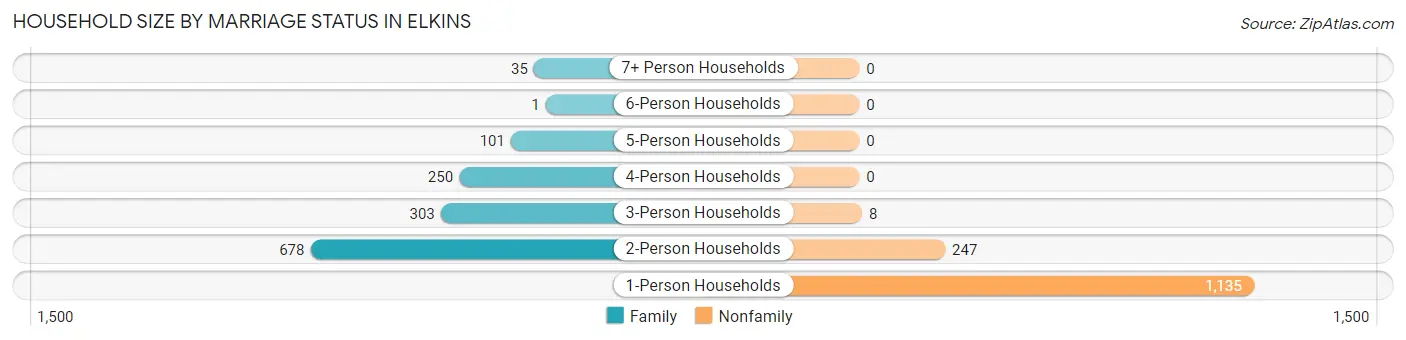
| Household Size | Family Households | Nonfamily Households |
| 1-Person Households | - | 1,135 (41.1%) |
| 2-Person Households | 678 (24.6%) | 247 (9.0%) |
| 3-Person Households | 303 (11.0%) | 8 (0.3%) |
| 4-Person Households | 250 (9.1%) | 0 (0.0%) |
| 5-Person Households | 101 (3.7%) | 0 (0.0%) |
| 6-Person Households | 1 (0.0%) | 0 (0.0%) |
| 7+ Person Households | 35 (1.3%) | 0 (0.0%) |
| Total | 1,368 (49.6%) | 1,390 (50.4%) |
Female Fertility in Elkins
Fertility by Age in Elkins
Average fertility rate in Elkins is 35.0 births per 1,000 women. Women in the age bracket of 20 to 34 years have the highest fertility rate with 44.0 births per 1,000 women. Women in the age bracket of 20 to 34 years acount for 64.3% of all women with births.
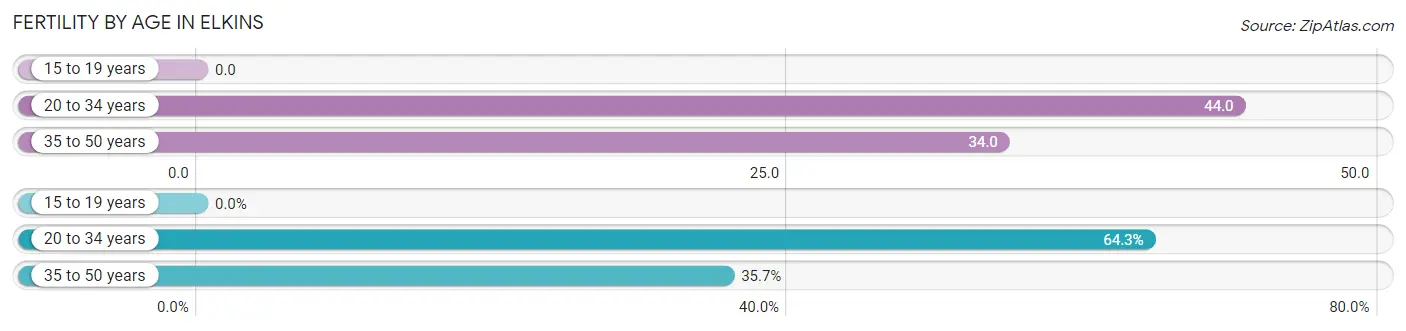
| Age Bracket | Women with Births | Births / 1,000 Women |
| 15 to 19 years | 0 (0.0%) | 0.0 |
| 20 to 34 years | 36 (64.3%) | 44.0 |
| 35 to 50 years | 20 (35.7%) | 34.0 |
| Total | 56 (100.0%) | 35.0 |
Fertility by Age by Marriage Status in Elkins
35.7% of women with births (56) in Elkins are married. The highest percentage of unmarried women with births falls into 20 to 34 years age bracket with 100.0% of them unmarried at the time of birth, while the lowest percentage of unmarried women with births belong to 35 to 50 years age bracket with 0.0% of them unmarried.
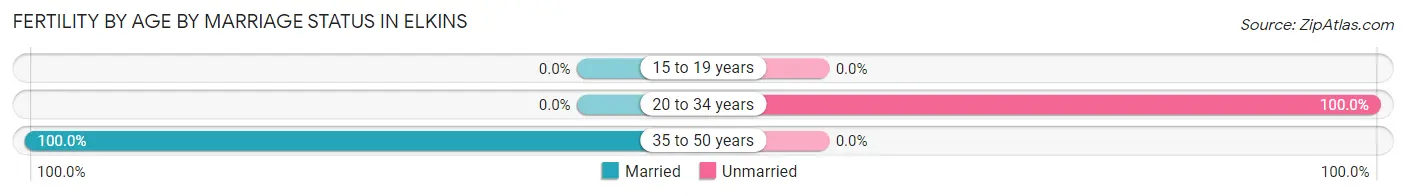
| Age Bracket | Married | Unmarried |
| 15 to 19 years | 0 (0.0%) | 0 (0.0%) |
| 20 to 34 years | 0 (0.0%) | 36 (100.0%) |
| 35 to 50 years | 20 (100.0%) | 0 (0.0%) |
| Total | 20 (35.7%) | 36 (64.3%) |
Fertility by Education in Elkins
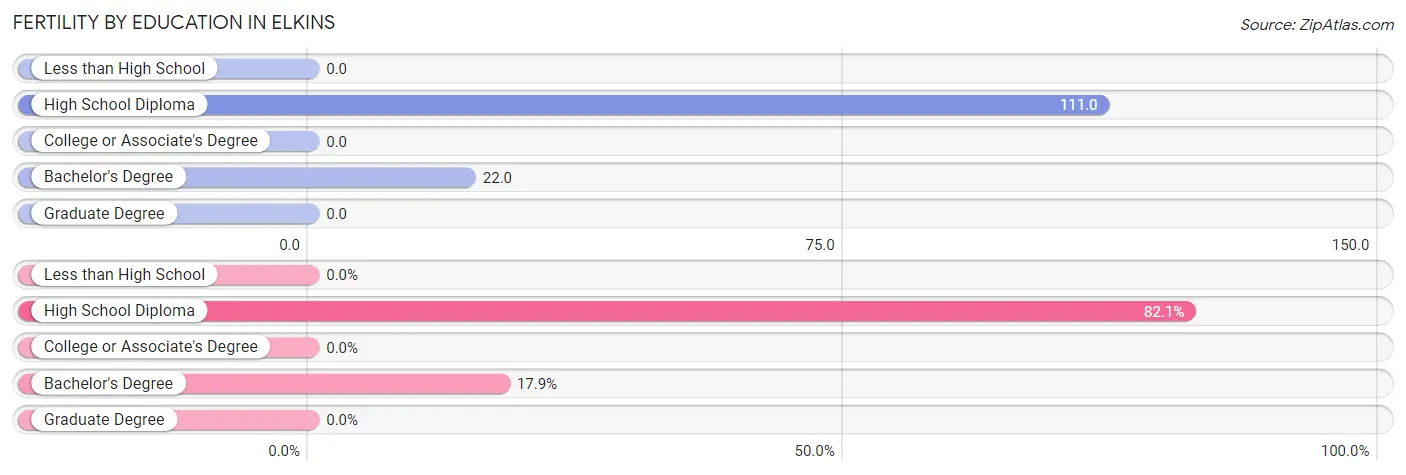
| Educational Attainment | Women with Births | Births / 1,000 Women |
| Less than High School | 0 (0.0%) | 0.0 |
| High School Diploma | 46 (82.1%) | 111.0 |
| College or Associate's Degree | 0 (0.0%) | 0.0 |
| Bachelor's Degree | 10 (17.9%) | 22.0 |
| Graduate Degree | 0 (0.0%) | 0.0 |
| Total | 56 (100.0%) | 35.0 |
Fertility by Education by Marriage Status in Elkins
64.3% of women with births in Elkins are unmarried. Women with the educational attainment of bachelor's degree are most likely to be married with 100.0% of them married at childbirth, while women with the educational attainment of high school diploma are least likely to be married with 78.3% of them unmarried at childbirth.
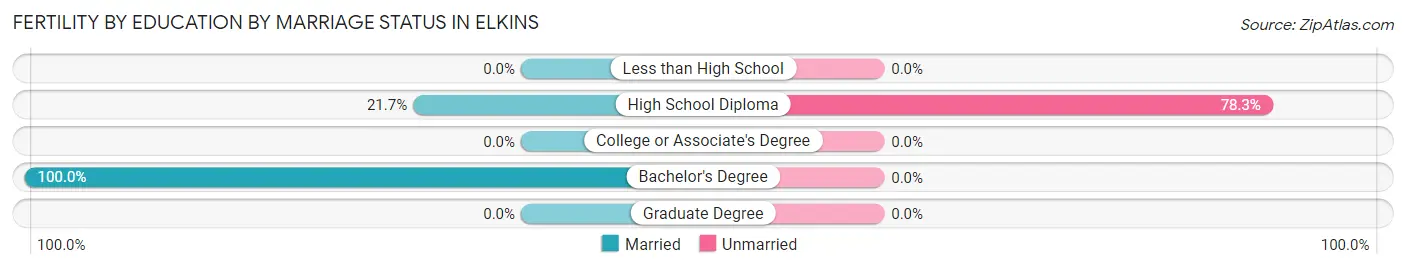
| Educational Attainment | Married | Unmarried |
| Less than High School | 0 (0.0%) | 0 (0.0%) |
| High School Diploma | 10 (21.7%) | 36 (78.3%) |
| College or Associate's Degree | 0 (0.0%) | 0 (0.0%) |
| Bachelor's Degree | 10 (100.0%) | 0 (0.0%) |
| Graduate Degree | 0 (0.0%) | 0 (0.0%) |
| Total | 20 (35.7%) | 36 (64.3%) |
Employment Characteristics in Elkins
Employment by Class of Employer in Elkins
Among the 3,016 employed individuals in Elkins, private company employees (1,902 | 63.1%), not-for-profit organizations (385 | 12.8%), and local government employees (264 | 8.7%) make up the most common classes of employment.
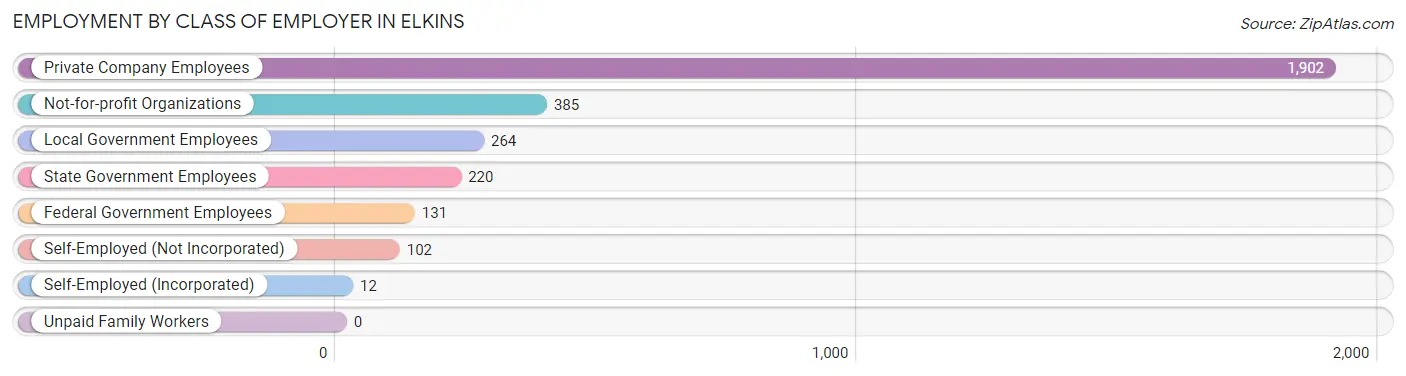
| Employer Class | # Employees | % Employees |
| Private Company Employees | 1,902 | 63.1% |
| Self-Employed (Incorporated) | 12 | 0.4% |
| Self-Employed (Not Incorporated) | 102 | 3.4% |
| Not-for-profit Organizations | 385 | 12.8% |
| Local Government Employees | 264 | 8.7% |
| State Government Employees | 220 | 7.3% |
| Federal Government Employees | 131 | 4.3% |
| Unpaid Family Workers | 0 | 0.0% |
| Total | 3,016 | 100.0% |
Employment Status by Age in Elkins
According to the labor force statistics for Elkins, out of the total population over 16 years of age (5,763), 59.3% or 3,417 individuals are in the labor force, with 11.2% or 383 of them unemployed. The age group with the highest labor force participation rate is 20 to 24 years, with 80.0% or 544 individuals in the labor force. Within the labor force, the 35 to 44 years age range has the highest percentage of unemployed individuals, with 29.4% or 193 of them being unemployed.
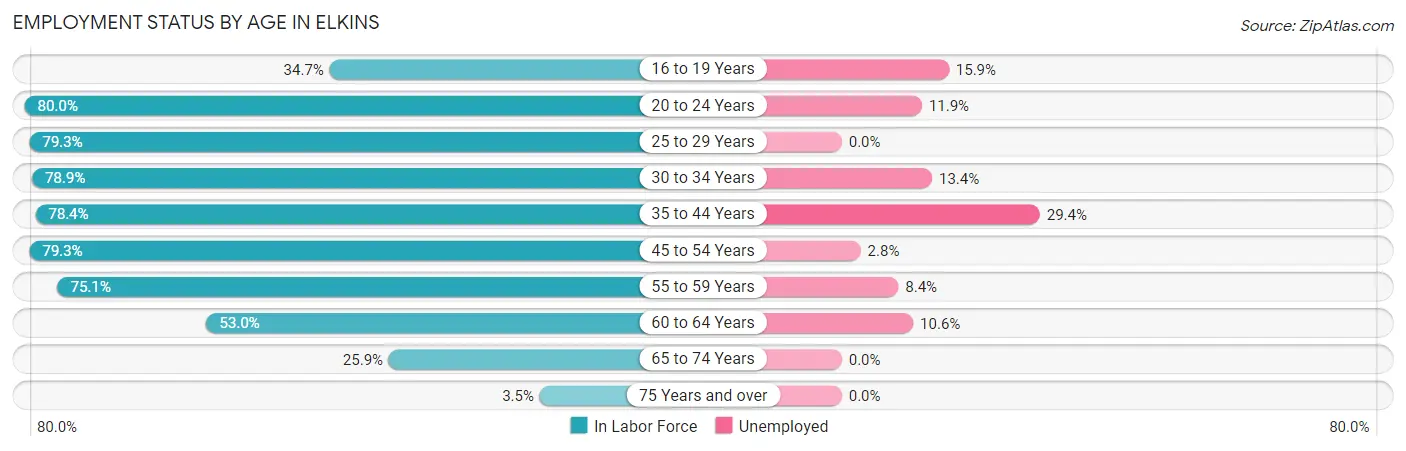
| Age Bracket | In Labor Force | Unemployed |
| 16 to 19 Years | 182 (34.7%) | 29 (15.9%) |
| 20 to 24 Years | 544 (80.0%) | 65 (11.9%) |
| 25 to 29 Years | 426 (79.3%) | 0 (0.0%) |
| 30 to 34 Years | 209 (78.9%) | 28 (13.4%) |
| 35 to 44 Years | 655 (78.4%) | 193 (29.4%) |
| 45 to 54 Years | 670 (79.3%) | 19 (2.8%) |
| 55 to 59 Years | 250 (75.1%) | 21 (8.4%) |
| 60 to 64 Years | 292 (53.0%) | 31 (10.6%) |
| 65 to 74 Years | 174 (25.9%) | 0 (0.0%) |
| 75 Years and over | 18 (3.5%) | 0 (0.0%) |
| Total | 3,417 (59.3%) | 383 (11.2%) |
Employment Status by Educational Attainment in Elkins
According to labor force statistics for Elkins, 74.3% of individuals (2,501) out of the total population between 25 and 64 years of age (3,366) are in the labor force, with 11.6% or 290 of them being unemployed. The group with the highest labor force participation rate are those with the educational attainment of bachelor's degree or higher, with 92.5% or 919 individuals in the labor force. Within the labor force, individuals with less than high school education have the highest percentage of unemployment, with 65.8% or 100 of them being unemployed.
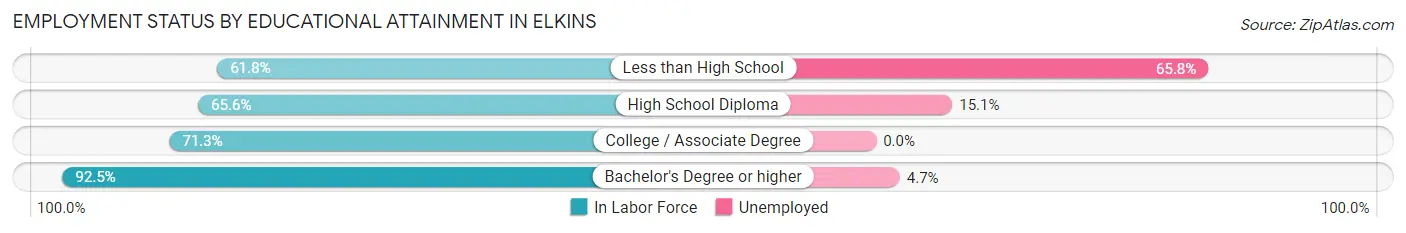
| Educational Attainment | In Labor Force | Unemployed |
| Less than High School | 152 (61.8%) | 162 (65.8%) |
| High School Diploma | 970 (65.6%) | 223 (15.1%) |
| College / Associate Degree | 461 (71.3%) | 0 (0.0%) |
| Bachelor's Degree or higher | 919 (92.5%) | 47 (4.7%) |
| Total | 2,501 (74.3%) | 390 (11.6%) |
Employment Occupations by Sex in Elkins
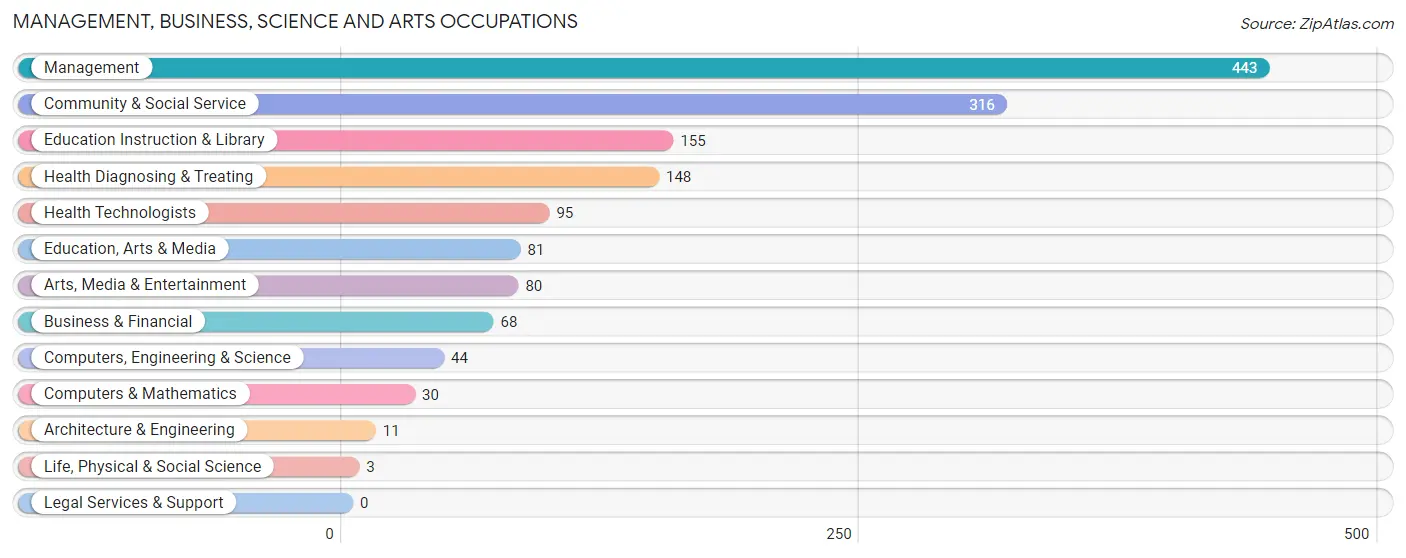
Management, Business, Science and Arts Occupations
The most common Management, Business, Science and Arts occupations in Elkins are Management (443 | 14.6%), Community & Social Service (316 | 10.4%), Education Instruction & Library (155 | 5.1%), Health Diagnosing & Treating (148 | 4.9%), and Health Technologists (95 | 3.1%).
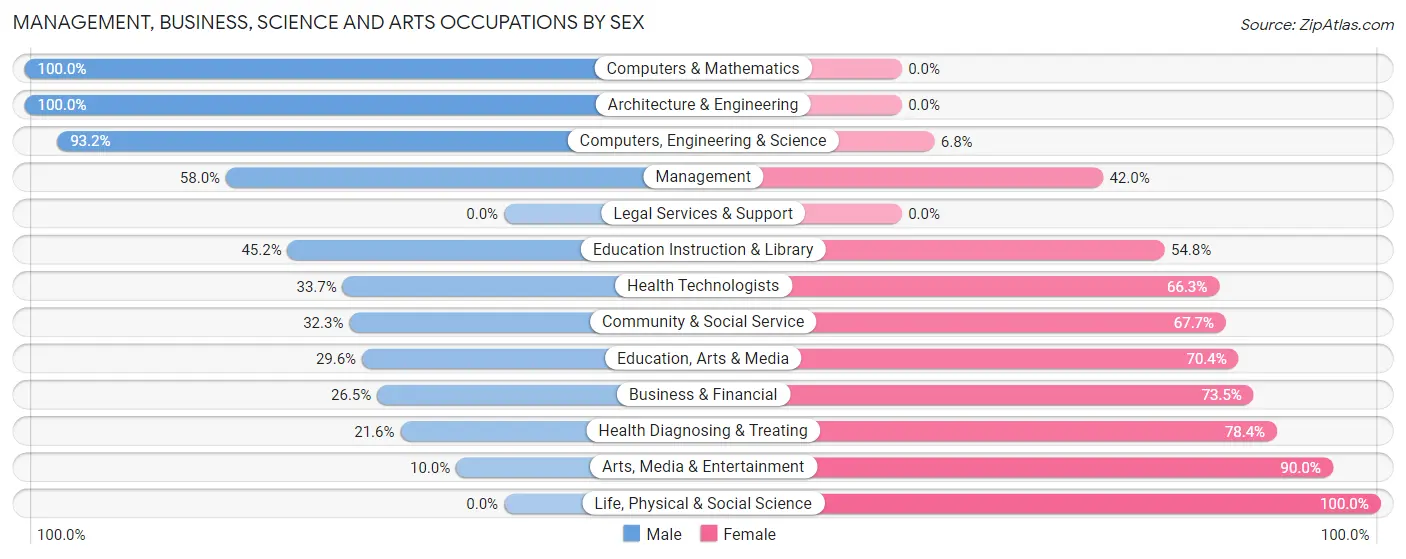
Management, Business, Science and Arts Occupations by Sex
Within the Management, Business, Science and Arts occupations in Elkins, the most male-oriented occupations are Computers & Mathematics (100.0%), Architecture & Engineering (100.0%), and Computers, Engineering & Science (93.2%), while the most female-oriented occupations are Life, Physical & Social Science (100.0%), Arts, Media & Entertainment (90.0%), and Health Diagnosing & Treating (78.4%).
| Occupation | Male | Female |
| Management | 257 (58.0%) | 186 (42.0%) |
| Business & Financial | 18 (26.5%) | 50 (73.5%) |
| Computers, Engineering & Science | 41 (93.2%) | 3 (6.8%) |
| Computers & Mathematics | 30 (100.0%) | 0 (0.0%) |
| Architecture & Engineering | 11 (100.0%) | 0 (0.0%) |
| Life, Physical & Social Science | 0 (0.0%) | 3 (100.0%) |
| Community & Social Service | 102 (32.3%) | 214 (67.7%) |
| Education, Arts & Media | 24 (29.6%) | 57 (70.4%) |
| Legal Services & Support | 0 (0.0%) | 0 (0.0%) |
| Education Instruction & Library | 70 (45.2%) | 85 (54.8%) |
| Arts, Media & Entertainment | 8 (10.0%) | 72 (90.0%) |
| Health Diagnosing & Treating | 32 (21.6%) | 116 (78.4%) |
| Health Technologists | 32 (33.7%) | 63 (66.3%) |
| Total (Category) | 450 (44.2%) | 569 (55.8%) |
| Total (Overall) | 1,607 (53.1%) | 1,421 (46.9%) |
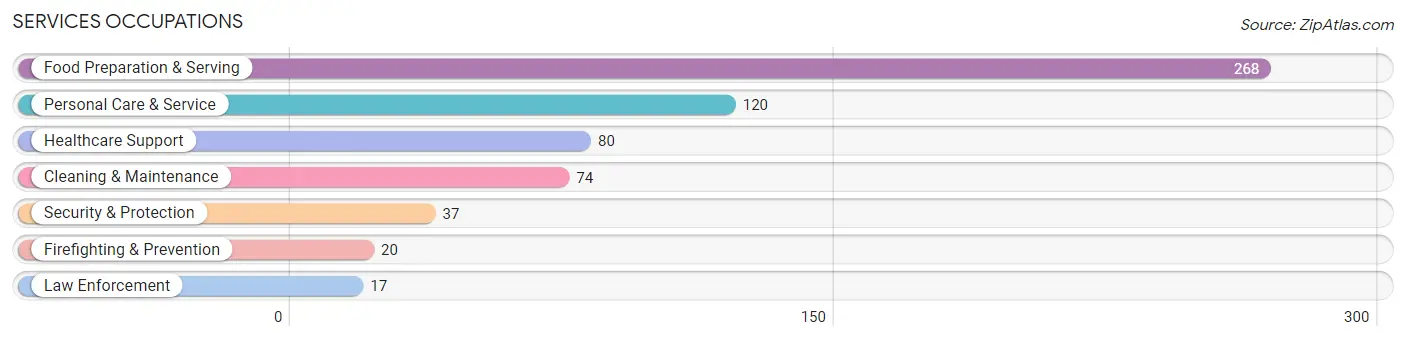
Services Occupations
The most common Services occupations in Elkins are Food Preparation & Serving (268 | 8.8%), Personal Care & Service (120 | 4.0%), Healthcare Support (80 | 2.6%), Cleaning & Maintenance (74 | 2.4%), and Security & Protection (37 | 1.2%).
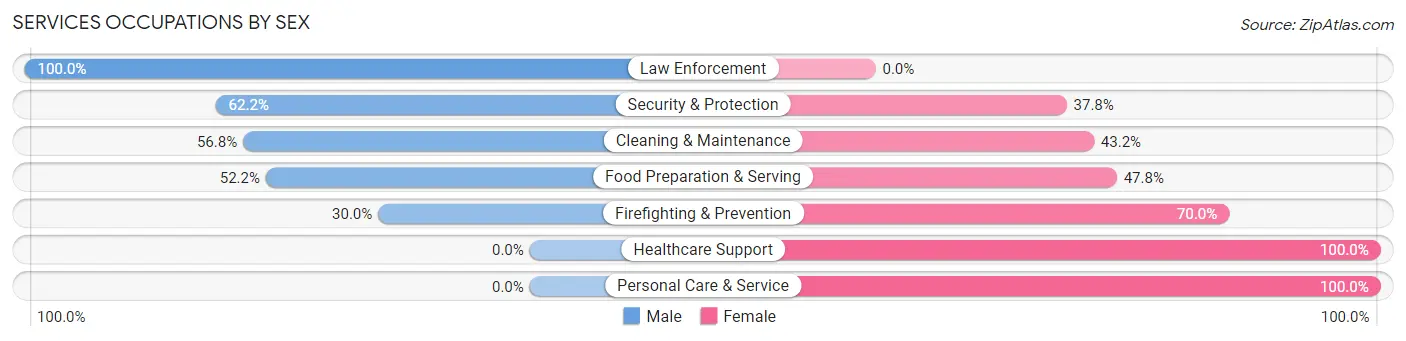
Services Occupations by Sex
Within the Services occupations in Elkins, the most male-oriented occupations are Law Enforcement (100.0%), Security & Protection (62.2%), and Cleaning & Maintenance (56.8%), while the most female-oriented occupations are Healthcare Support (100.0%), Personal Care & Service (100.0%), and Firefighting & Prevention (70.0%).
| Occupation | Male | Female |
| Healthcare Support | 0 (0.0%) | 80 (100.0%) |
| Security & Protection | 23 (62.2%) | 14 (37.8%) |
| Firefighting & Prevention | 6 (30.0%) | 14 (70.0%) |
| Law Enforcement | 17 (100.0%) | 0 (0.0%) |
| Food Preparation & Serving | 140 (52.2%) | 128 (47.8%) |
| Cleaning & Maintenance | 42 (56.8%) | 32 (43.2%) |
| Personal Care & Service | 0 (0.0%) | 120 (100.0%) |
| Total (Category) | 205 (35.4%) | 374 (64.6%) |
| Total (Overall) | 1,607 (53.1%) | 1,421 (46.9%) |
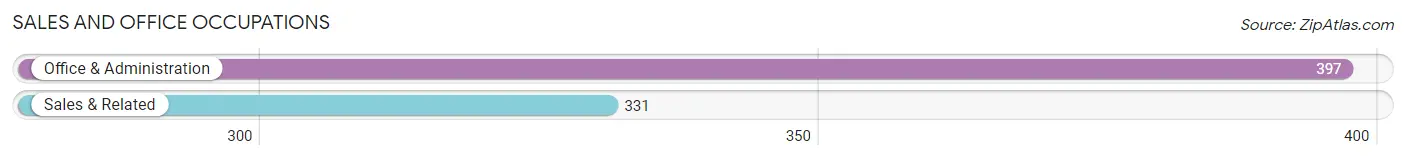
Sales and Office Occupations
The most common Sales and Office occupations in Elkins are Office & Administration (397 | 13.1%), and Sales & Related (331 | 10.9%).
Sales and Office Occupations by Sex
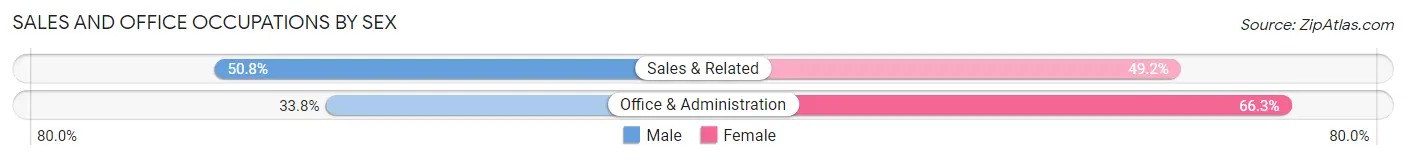
| Occupation | Male | Female |
| Sales & Related | 168 (50.8%) | 163 (49.2%) |
| Office & Administration | 134 (33.8%) | 263 (66.2%) |
| Total (Category) | 302 (41.5%) | 426 (58.5%) |
| Total (Overall) | 1,607 (53.1%) | 1,421 (46.9%) |
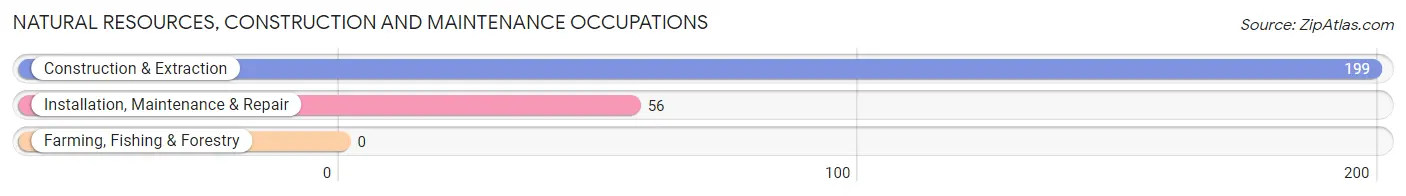
Natural Resources, Construction and Maintenance Occupations
The most common Natural Resources, Construction and Maintenance occupations in Elkins are Construction & Extraction (199 | 6.6%), and Installation, Maintenance & Repair (56 | 1.8%).
Natural Resources, Construction and Maintenance Occupations by Sex
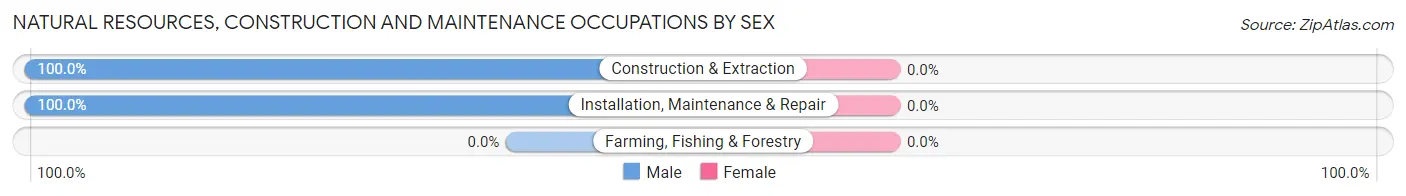
| Occupation | Male | Female |
| Farming, Fishing & Forestry | 0 (0.0%) | 0 (0.0%) |
| Construction & Extraction | 199 (100.0%) | 0 (0.0%) |
| Installation, Maintenance & Repair | 56 (100.0%) | 0 (0.0%) |
| Total (Category) | 255 (100.0%) | 0 (0.0%) |
| Total (Overall) | 1,607 (53.1%) | 1,421 (46.9%) |
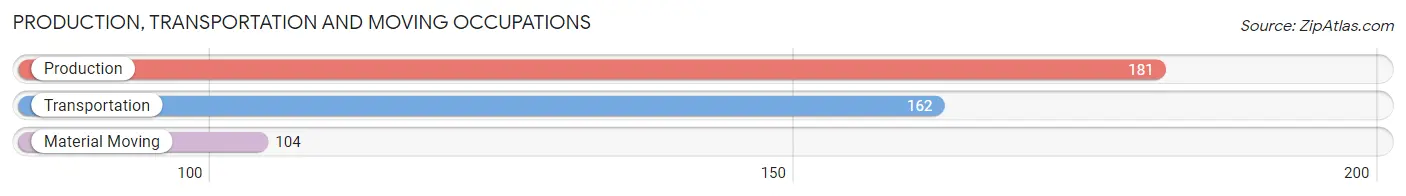
Production, Transportation and Moving Occupations
The most common Production, Transportation and Moving occupations in Elkins are Production (181 | 6.0%), Transportation (162 | 5.3%), and Material Moving (104 | 3.4%).
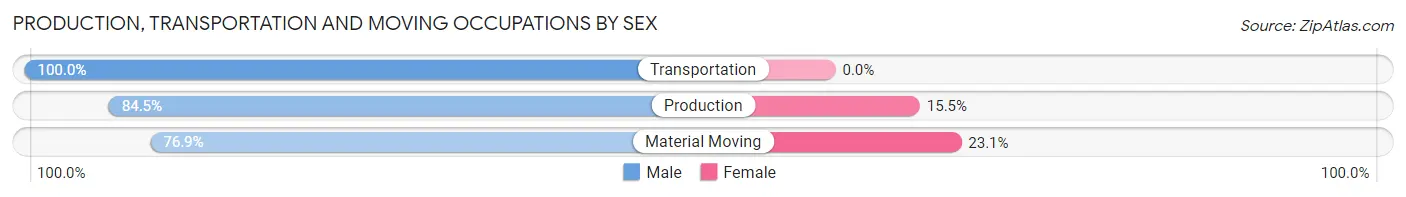
Production, Transportation and Moving Occupations by Sex
| Occupation | Male | Female |
| Production | 153 (84.5%) | 28 (15.5%) |
| Transportation | 162 (100.0%) | 0 (0.0%) |
| Material Moving | 80 (76.9%) | 24 (23.1%) |
| Total (Category) | 395 (88.4%) | 52 (11.6%) |
| Total (Overall) | 1,607 (53.1%) | 1,421 (46.9%) |
Employment Industries by Sex in Elkins
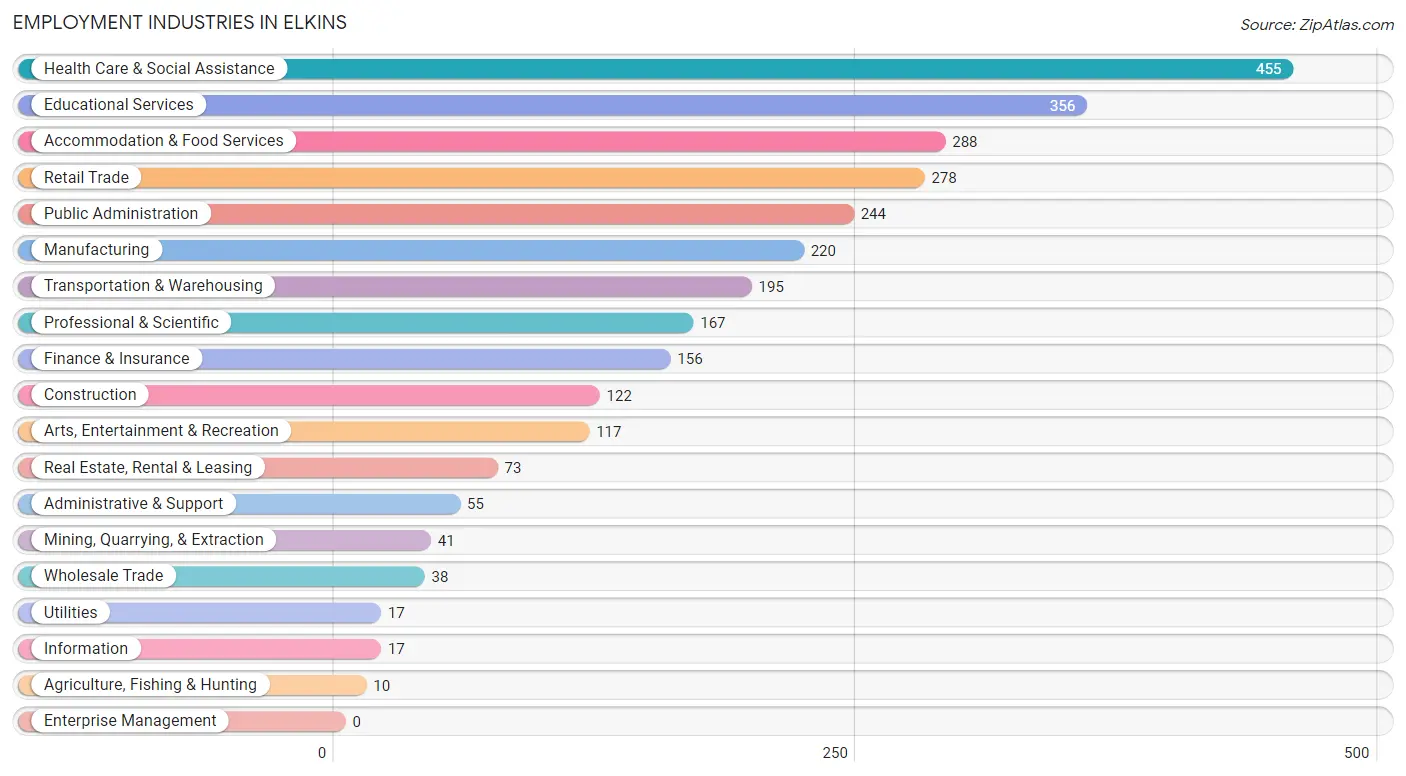
Employment Industries in Elkins
The major employment industries in Elkins include Health Care & Social Assistance (455 | 15.0%), Educational Services (356 | 11.8%), Accommodation & Food Services (288 | 9.5%), Retail Trade (278 | 9.2%), and Public Administration (244 | 8.1%).
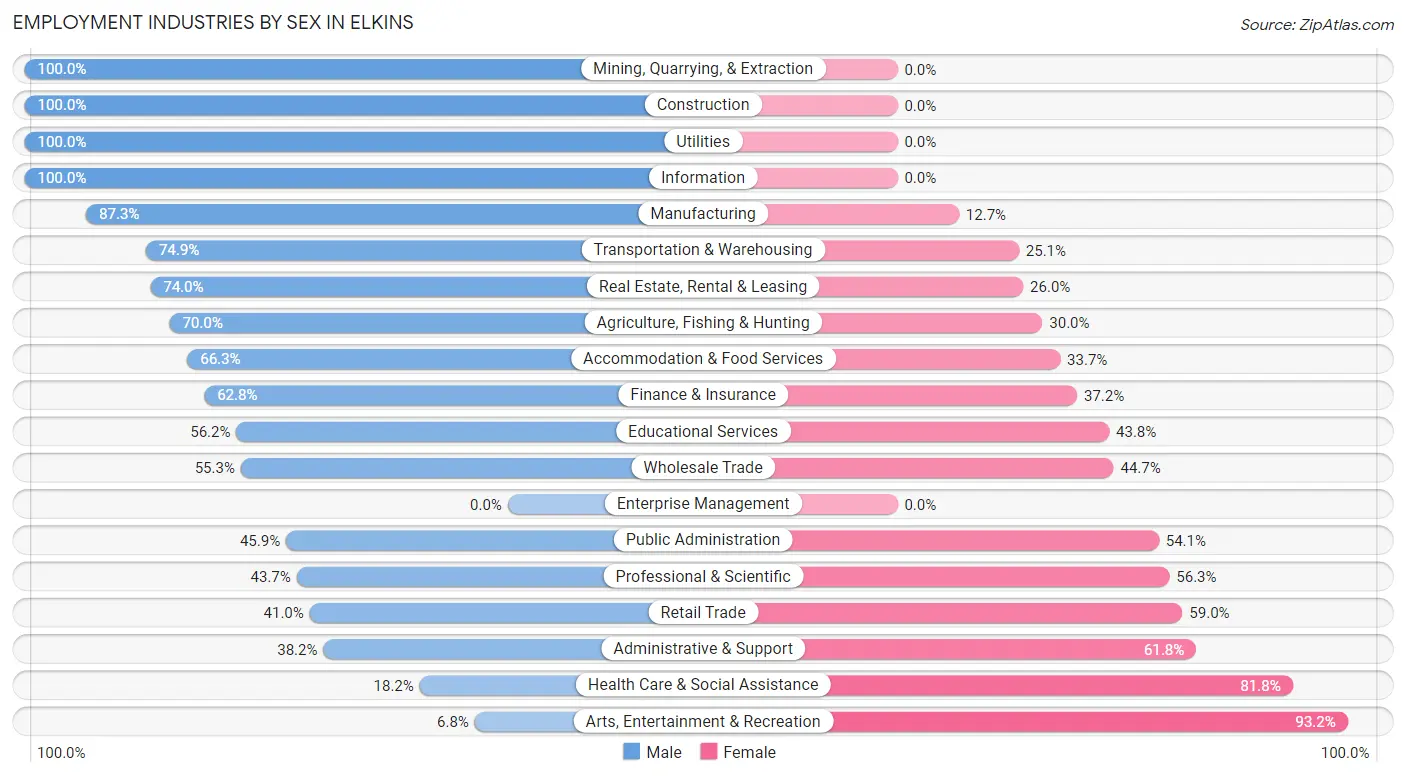
Employment Industries by Sex in Elkins
The Elkins industries that see more men than women are Mining, Quarrying, & Extraction (100.0%), Construction (100.0%), and Utilities (100.0%), whereas the industries that tend to have a higher number of women are Arts, Entertainment & Recreation (93.2%), Health Care & Social Assistance (81.8%), and Administrative & Support (61.8%).
| Industry | Male | Female |
| Agriculture, Fishing & Hunting | 7 (70.0%) | 3 (30.0%) |
| Mining, Quarrying, & Extraction | 41 (100.0%) | 0 (0.0%) |
| Construction | 122 (100.0%) | 0 (0.0%) |
| Manufacturing | 192 (87.3%) | 28 (12.7%) |
| Wholesale Trade | 21 (55.3%) | 17 (44.7%) |
| Retail Trade | 114 (41.0%) | 164 (59.0%) |
| Transportation & Warehousing | 146 (74.9%) | 49 (25.1%) |
| Utilities | 17 (100.0%) | 0 (0.0%) |
| Information | 17 (100.0%) | 0 (0.0%) |
| Finance & Insurance | 98 (62.8%) | 58 (37.2%) |
| Real Estate, Rental & Leasing | 54 (74.0%) | 19 (26.0%) |
| Professional & Scientific | 73 (43.7%) | 94 (56.3%) |
| Enterprise Management | 0 (0.0%) | 0 (0.0%) |
| Administrative & Support | 21 (38.2%) | 34 (61.8%) |
| Educational Services | 200 (56.2%) | 156 (43.8%) |
| Health Care & Social Assistance | 83 (18.2%) | 372 (81.8%) |
| Arts, Entertainment & Recreation | 8 (6.8%) | 109 (93.2%) |
| Accommodation & Food Services | 191 (66.3%) | 97 (33.7%) |
| Public Administration | 112 (45.9%) | 132 (54.1%) |
| Total | 1,607 (53.1%) | 1,421 (46.9%) |
Education in Elkins
School Enrollment in Elkins
The most common levels of schooling among the 1,583 students in Elkins are college / undergraduate (545 | 34.4%), elementary school (311 | 19.7%), and high school (303 | 19.1%).
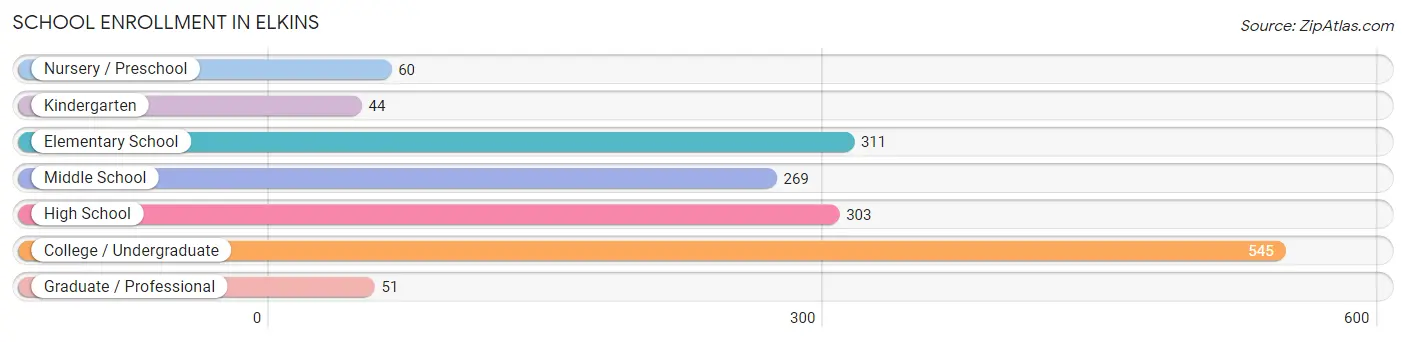
| School Level | # Students | % Students |
| Nursery / Preschool | 60 | 3.8% |
| Kindergarten | 44 | 2.8% |
| Elementary School | 311 | 19.7% |
| Middle School | 269 | 17.0% |
| High School | 303 | 19.1% |
| College / Undergraduate | 545 | 34.4% |
| Graduate / Professional | 51 | 3.2% |
| Total | 1,583 | 100.0% |
School Enrollment by Age by Funding Source in Elkins
Out of a total of 1,583 students who are enrolled in schools in Elkins, 400 (25.3%) attend a private institution, while the remaining 1,183 (74.7%) are enrolled in public schools. The age group of 25 to 34 year olds has the highest likelihood of being enrolled in private schools, with 42 (63.6% in the age bracket) enrolled. Conversely, the age group of 15 to 17 year olds has the lowest likelihood of being enrolled in a private school, with 249 (96.5% in the age bracket) attending a public institution.
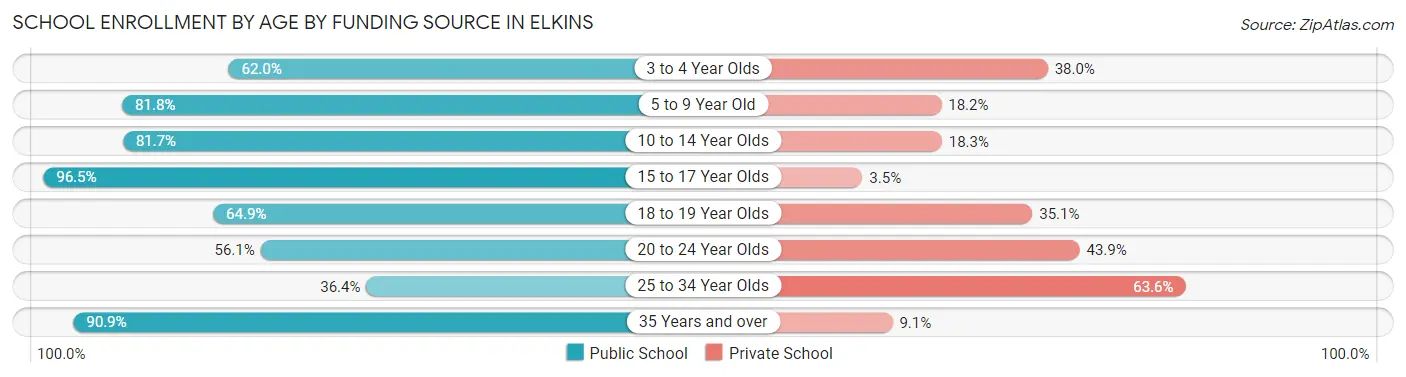
| Age Bracket | Public School | Private School |
| 3 to 4 Year Olds | 31 (62.0%) | 19 (38.0%) |
| 5 to 9 Year Old | 234 (81.8%) | 52 (18.2%) |
| 10 to 14 Year Olds | 295 (81.7%) | 66 (18.3%) |
| 15 to 17 Year Olds | 249 (96.5%) | 9 (3.5%) |
| 18 to 19 Year Olds | 229 (64.9%) | 124 (35.1%) |
| 20 to 24 Year Olds | 111 (56.1%) | 87 (43.9%) |
| 25 to 34 Year Olds | 24 (36.4%) | 42 (63.6%) |
| 35 Years and over | 10 (90.9%) | 1 (9.1%) |
| Total | 1,183 (74.7%) | 400 (25.3%) |
Educational Attainment by Field of Study in Elkins
Business (337 | 26.3%), visual & performing arts (149 | 11.6%), science & technology (133 | 10.4%), education (126 | 9.8%), and social sciences (113 | 8.8%) are the most common fields of study among 1,280 individuals in Elkins who have obtained a bachelor's degree or higher.
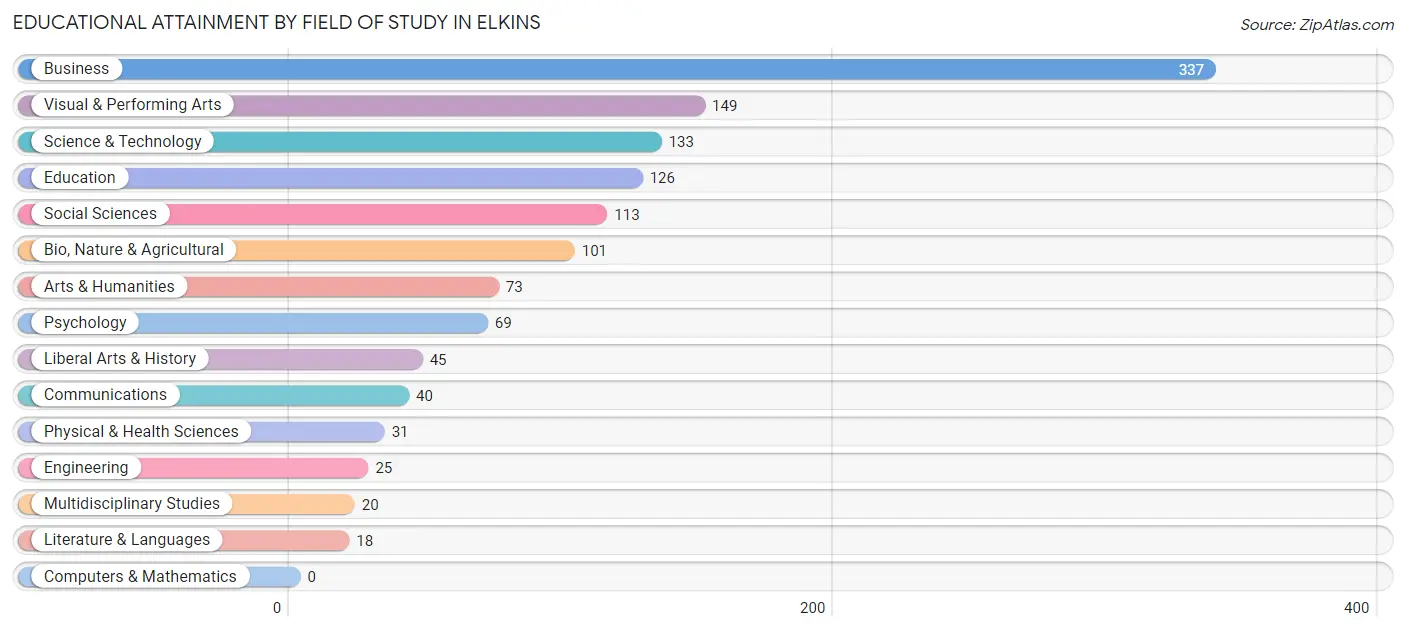
| Field of Study | # Graduates | % Graduates |
| Computers & Mathematics | 0 | 0.0% |
| Bio, Nature & Agricultural | 101 | 7.9% |
| Physical & Health Sciences | 31 | 2.4% |
| Psychology | 69 | 5.4% |
| Social Sciences | 113 | 8.8% |
| Engineering | 25 | 1.9% |
| Multidisciplinary Studies | 20 | 1.6% |
| Science & Technology | 133 | 10.4% |
| Business | 337 | 26.3% |
| Education | 126 | 9.8% |
| Literature & Languages | 18 | 1.4% |
| Liberal Arts & History | 45 | 3.5% |
| Visual & Performing Arts | 149 | 11.6% |
| Communications | 40 | 3.1% |
| Arts & Humanities | 73 | 5.7% |
| Total | 1,280 | 100.0% |
Transportation & Commute in Elkins
Vehicle Availability by Sex in Elkins
The most prevalent vehicle ownership categories in Elkins are males with 2 vehicles (942, accounting for 59.5%) and females with 2 vehicles (748, making up 69.3%).
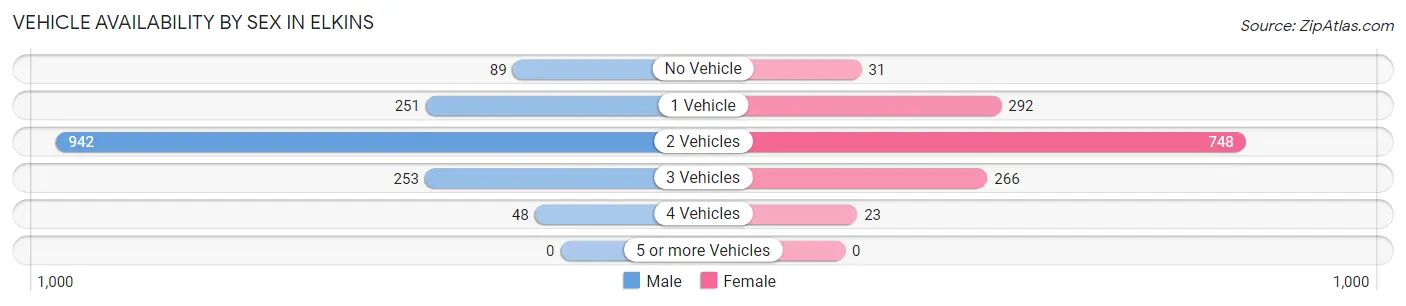
| Vehicles Available | Male | Female |
| No Vehicle | 89 (5.6%) | 31 (2.3%) |
| 1 Vehicle | 251 (15.9%) | 292 (21.5%) |
| 2 Vehicles | 942 (59.5%) | 748 (55.0%) |
| 3 Vehicles | 253 (16.0%) | 266 (19.6%) |
| 4 Vehicles | 48 (3.0%) | 23 (1.7%) |
| 5 or more Vehicles | 0 (0.0%) | 0 (0.0%) |
| Total | 1,583 (100.0%) | 1,360 (100.0%) |
Commute Time in Elkins
The most frequently occuring commute durations in Elkins are 5 to 9 minutes (1,286 commuters, 44.5%), 10 to 14 minutes (387 commuters, 13.4%), and 15 to 19 minutes (385 commuters, 13.3%).
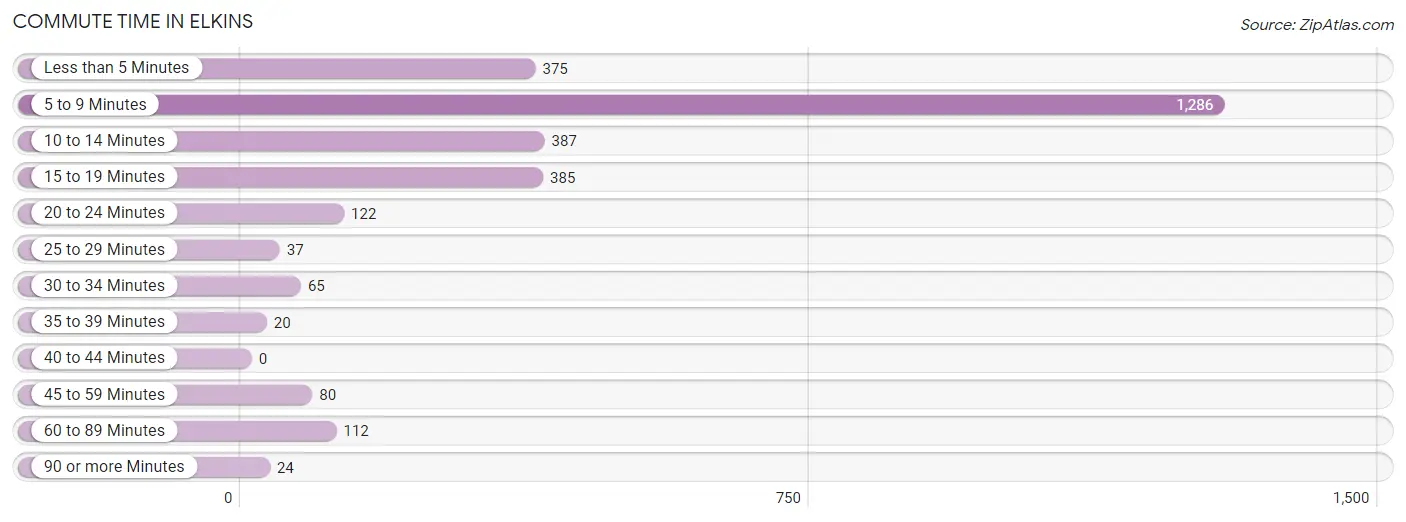
| Commute Time | # Commuters | % Commuters |
| Less than 5 Minutes | 375 | 13.0% |
| 5 to 9 Minutes | 1,286 | 44.5% |
| 10 to 14 Minutes | 387 | 13.4% |
| 15 to 19 Minutes | 385 | 13.3% |
| 20 to 24 Minutes | 122 | 4.2% |
| 25 to 29 Minutes | 37 | 1.3% |
| 30 to 34 Minutes | 65 | 2.2% |
| 35 to 39 Minutes | 20 | 0.7% |
| 40 to 44 Minutes | 0 | 0.0% |
| 45 to 59 Minutes | 80 | 2.8% |
| 60 to 89 Minutes | 112 | 3.9% |
| 90 or more Minutes | 24 | 0.8% |
Commute Time by Sex in Elkins
The most common commute times in Elkins are 5 to 9 minutes (594 commuters, 38.2%) for males and 5 to 9 minutes (692 commuters, 51.8%) for females.
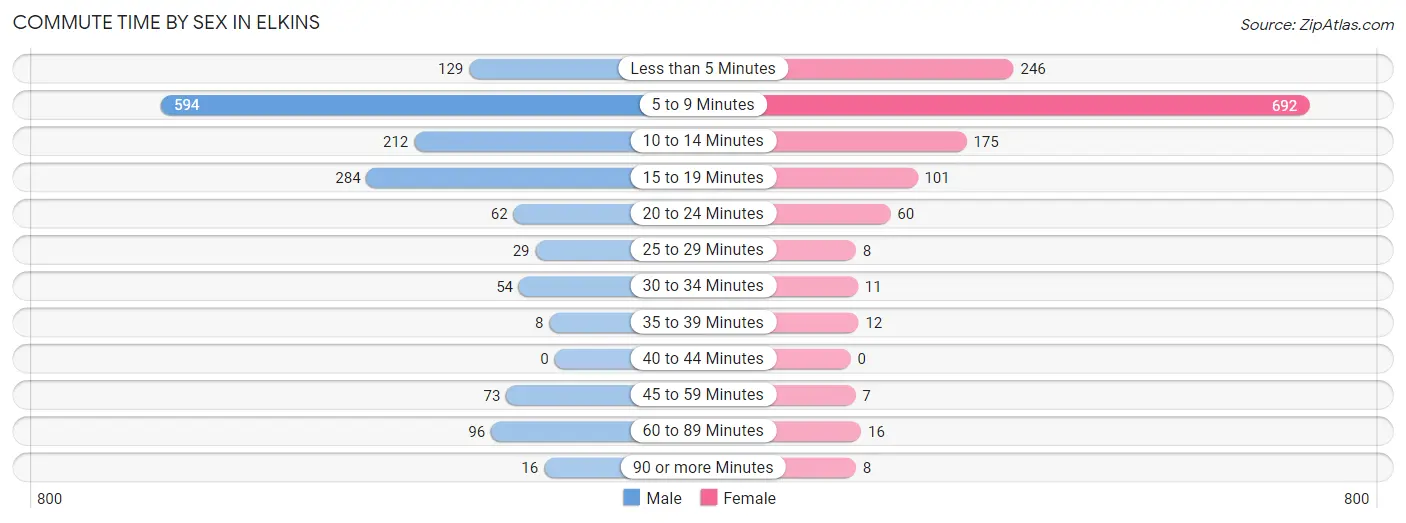
| Commute Time | Male | Female |
| Less than 5 Minutes | 129 (8.3%) | 246 (18.4%) |
| 5 to 9 Minutes | 594 (38.2%) | 692 (51.8%) |
| 10 to 14 Minutes | 212 (13.6%) | 175 (13.1%) |
| 15 to 19 Minutes | 284 (18.2%) | 101 (7.6%) |
| 20 to 24 Minutes | 62 (4.0%) | 60 (4.5%) |
| 25 to 29 Minutes | 29 (1.9%) | 8 (0.6%) |
| 30 to 34 Minutes | 54 (3.5%) | 11 (0.8%) |
| 35 to 39 Minutes | 8 (0.5%) | 12 (0.9%) |
| 40 to 44 Minutes | 0 (0.0%) | 0 (0.0%) |
| 45 to 59 Minutes | 73 (4.7%) | 7 (0.5%) |
| 60 to 89 Minutes | 96 (6.2%) | 16 (1.2%) |
| 90 or more Minutes | 16 (1.0%) | 8 (0.6%) |
Time of Departure to Work by Sex in Elkins
The most frequent times of departure to work in Elkins are 7:30 AM to 7:59 AM (288, 18.5%) for males and 7:30 AM to 7:59 AM (472, 35.3%) for females.
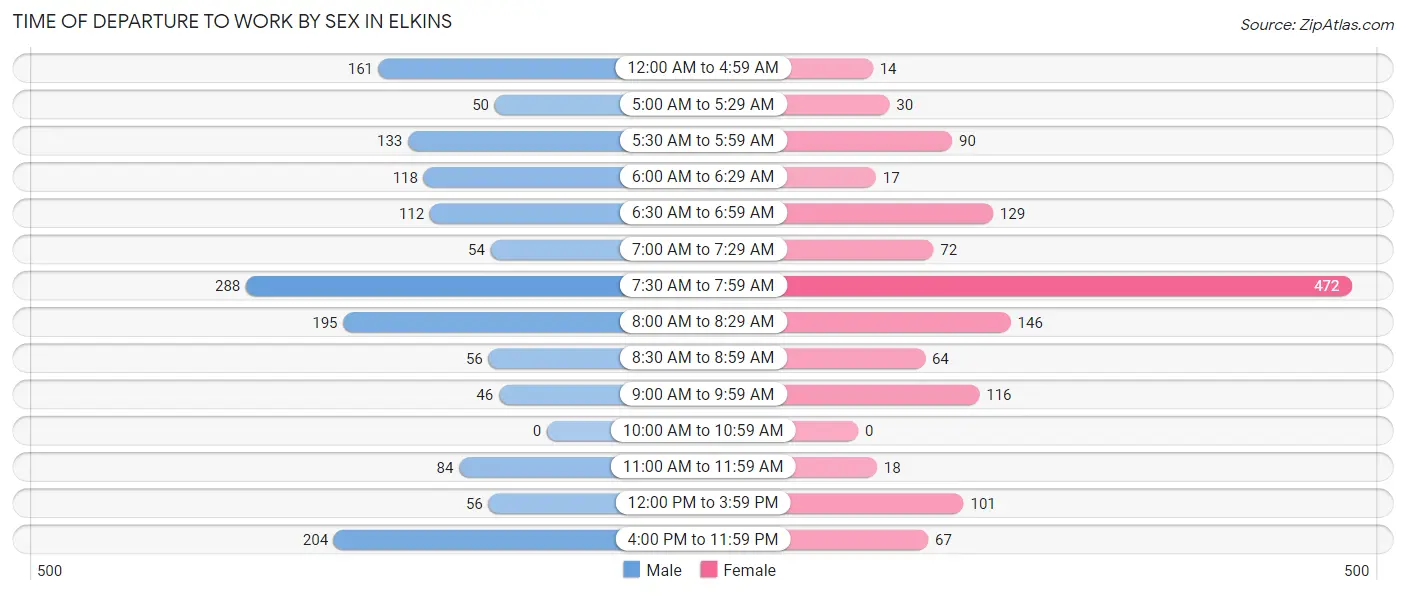
| Time of Departure | Male | Female |
| 12:00 AM to 4:59 AM | 161 (10.3%) | 14 (1.1%) |
| 5:00 AM to 5:29 AM | 50 (3.2%) | 30 (2.2%) |
| 5:30 AM to 5:59 AM | 133 (8.5%) | 90 (6.7%) |
| 6:00 AM to 6:29 AM | 118 (7.6%) | 17 (1.3%) |
| 6:30 AM to 6:59 AM | 112 (7.2%) | 129 (9.7%) |
| 7:00 AM to 7:29 AM | 54 (3.5%) | 72 (5.4%) |
| 7:30 AM to 7:59 AM | 288 (18.5%) | 472 (35.3%) |
| 8:00 AM to 8:29 AM | 195 (12.5%) | 146 (10.9%) |
| 8:30 AM to 8:59 AM | 56 (3.6%) | 64 (4.8%) |
| 9:00 AM to 9:59 AM | 46 (2.9%) | 116 (8.7%) |
| 10:00 AM to 10:59 AM | 0 (0.0%) | 0 (0.0%) |
| 11:00 AM to 11:59 AM | 84 (5.4%) | 18 (1.3%) |
| 12:00 PM to 3:59 PM | 56 (3.6%) | 101 (7.6%) |
| 4:00 PM to 11:59 PM | 204 (13.1%) | 67 (5.0%) |
| Total | 1,557 (100.0%) | 1,336 (100.0%) |
Housing Occupancy in Elkins
Occupancy by Ownership in Elkins
Of the total 2,758 dwellings in Elkins, owner-occupied units account for 1,623 (58.9%), while renter-occupied units make up 1,135 (41.1%).
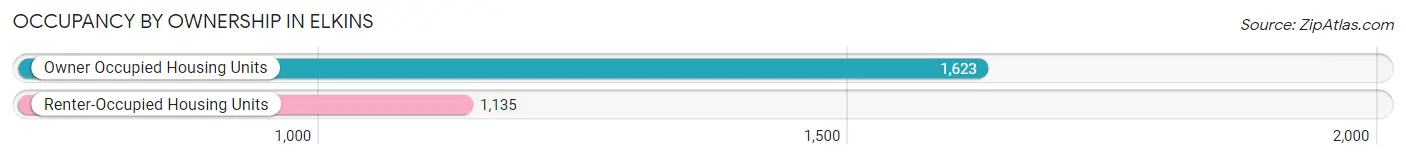
| Occupancy | # Housing Units | % Housing Units |
| Owner Occupied Housing Units | 1,623 | 58.9% |
| Renter-Occupied Housing Units | 1,135 | 41.1% |
| Total Occupied Housing Units | 2,758 | 100.0% |
Occupancy by Household Size in Elkins
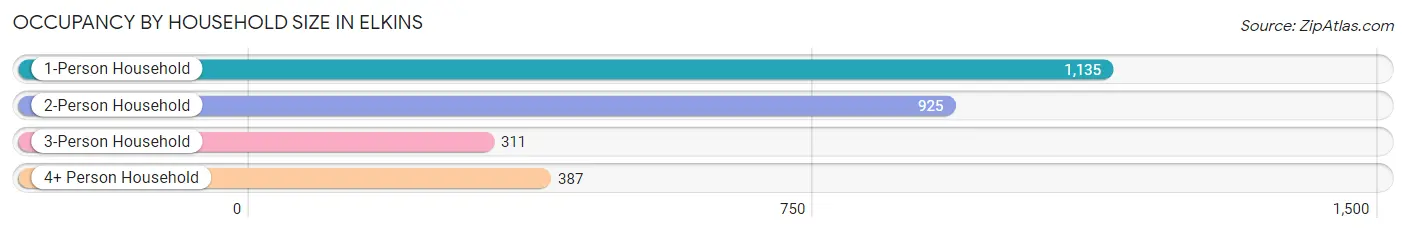
| Household Size | # Housing Units | % Housing Units |
| 1-Person Household | 1,135 | 41.1% |
| 2-Person Household | 925 | 33.5% |
| 3-Person Household | 311 | 11.3% |
| 4+ Person Household | 387 | 14.0% |
| Total Housing Units | 2,758 | 100.0% |
Occupancy by Ownership by Household Size in Elkins
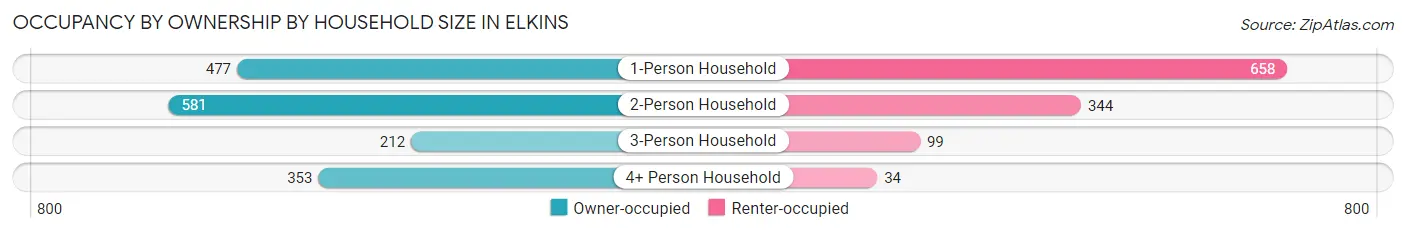
| Household Size | Owner-occupied | Renter-occupied |
| 1-Person Household | 477 (42.0%) | 658 (58.0%) |
| 2-Person Household | 581 (62.8%) | 344 (37.2%) |
| 3-Person Household | 212 (68.2%) | 99 (31.8%) |
| 4+ Person Household | 353 (91.2%) | 34 (8.8%) |
| Total Housing Units | 1,623 (58.9%) | 1,135 (41.1%) |
Occupancy by Educational Attainment in Elkins
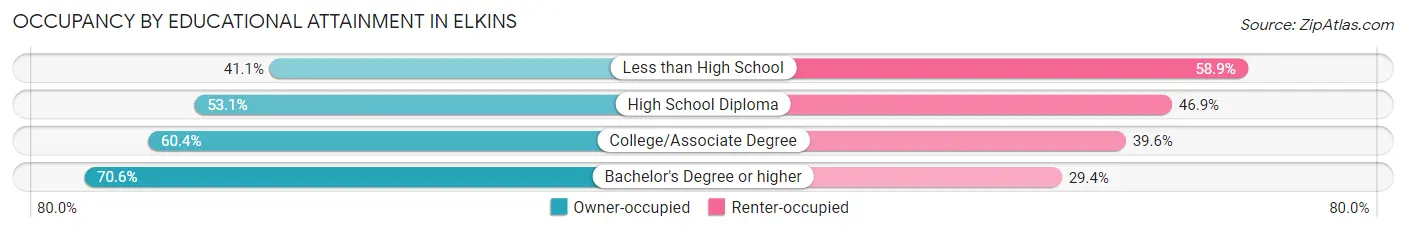
| Household Size | Owner-occupied | Renter-occupied |
| Less than High School | 104 (41.1%) | 149 (58.9%) |
| High School Diploma | 550 (53.1%) | 486 (46.9%) |
| College/Associate Degree | 403 (60.4%) | 264 (39.6%) |
| Bachelor's Degree or higher | 566 (70.6%) | 236 (29.4%) |
Occupancy by Age of Householder in Elkins
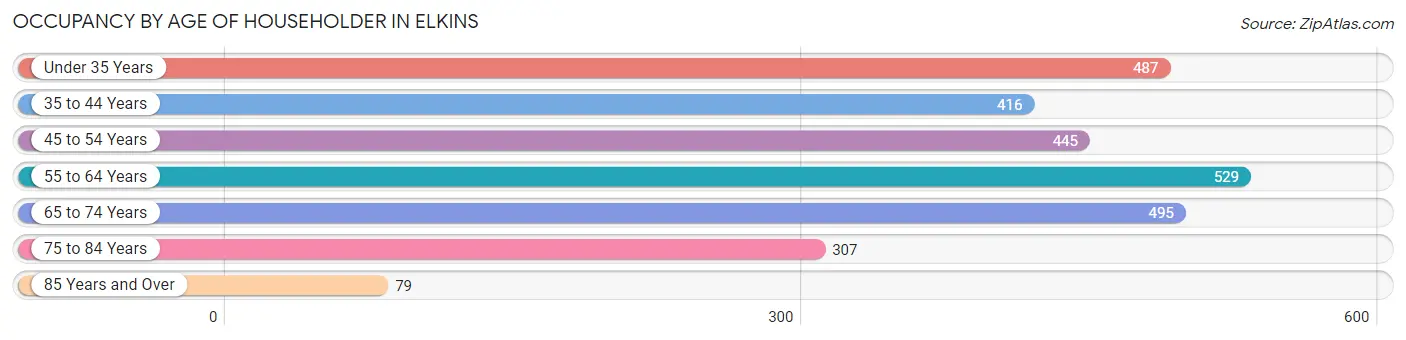
| Age Bracket | # Households | % Households |
| Under 35 Years | 487 | 17.7% |
| 35 to 44 Years | 416 | 15.1% |
| 45 to 54 Years | 445 | 16.1% |
| 55 to 64 Years | 529 | 19.2% |
| 65 to 74 Years | 495 | 17.9% |
| 75 to 84 Years | 307 | 11.1% |
| 85 Years and Over | 79 | 2.9% |
| Total | 2,758 | 100.0% |
Housing Finances in Elkins
Median Income by Occupancy in Elkins
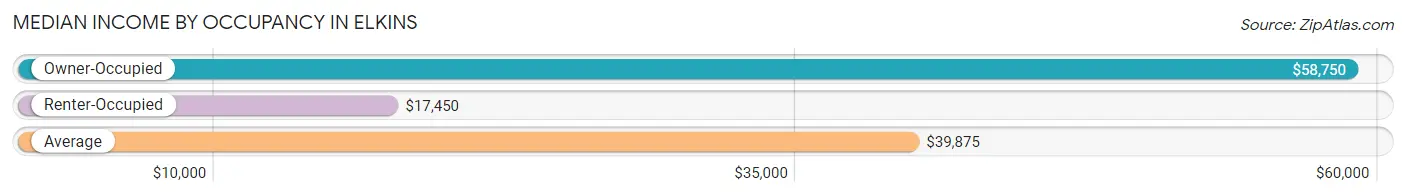
| Occupancy Type | # Households | Median Income |
| Owner-Occupied | 1,623 (58.9%) | $58,750 |
| Renter-Occupied | 1,135 (41.1%) | $17,450 |
| Average | 2,758 (100.0%) | $39,875 |
Occupancy by Householder Income Bracket in Elkins
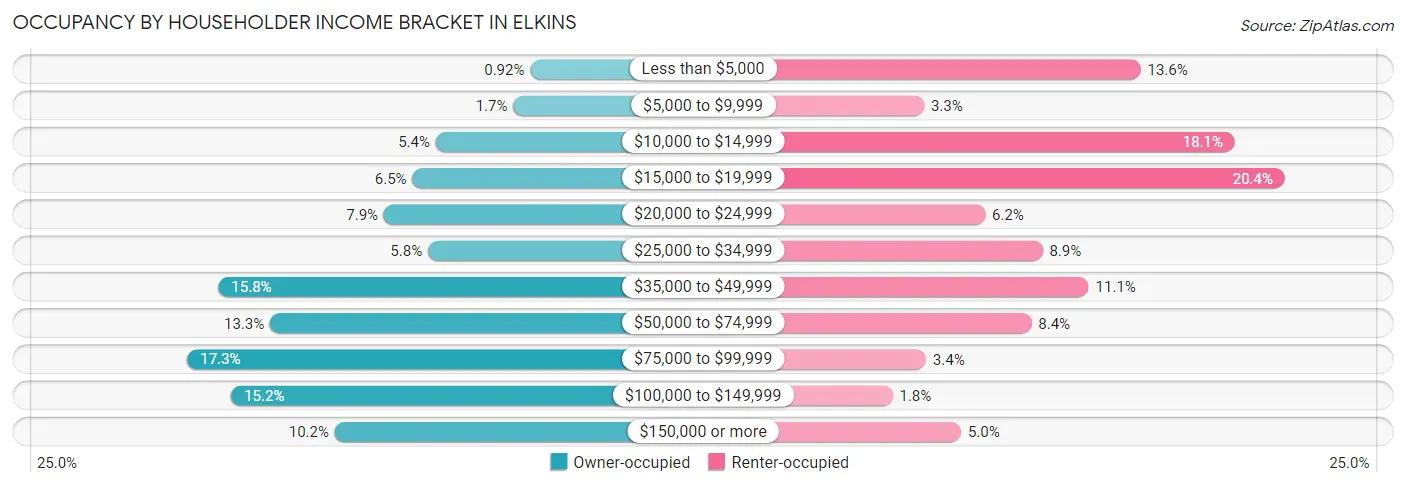
| Income Bracket | Owner-occupied | Renter-occupied |
| Less than $5,000 | 15 (0.9%) | 154 (13.6%) |
| $5,000 to $9,999 | 28 (1.7%) | 37 (3.3%) |
| $10,000 to $14,999 | 88 (5.4%) | 205 (18.1%) |
| $15,000 to $19,999 | 106 (6.5%) | 232 (20.4%) |
| $20,000 to $24,999 | 128 (7.9%) | 70 (6.2%) |
| $25,000 to $34,999 | 94 (5.8%) | 101 (8.9%) |
| $35,000 to $49,999 | 256 (15.8%) | 126 (11.1%) |
| $50,000 to $74,999 | 216 (13.3%) | 95 (8.4%) |
| $75,000 to $99,999 | 280 (17.2%) | 38 (3.4%) |
| $100,000 to $149,999 | 246 (15.2%) | 20 (1.8%) |
| $150,000 or more | 166 (10.2%) | 57 (5.0%) |
| Total | 1,623 (100.0%) | 1,135 (100.0%) |
Monthly Housing Cost Tiers in Elkins
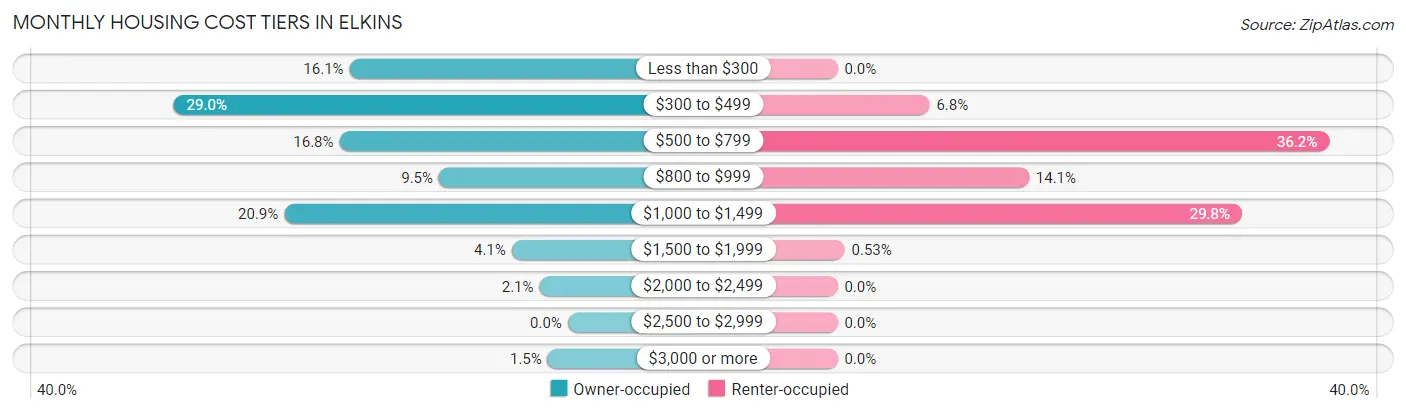
| Monthly Cost | Owner-occupied | Renter-occupied |
| Less than $300 | 261 (16.1%) | 0 (0.0%) |
| $300 to $499 | 471 (29.0%) | 77 (6.8%) |
| $500 to $799 | 273 (16.8%) | 411 (36.2%) |
| $800 to $999 | 154 (9.5%) | 160 (14.1%) |
| $1,000 to $1,499 | 339 (20.9%) | 338 (29.8%) |
| $1,500 to $1,999 | 67 (4.1%) | 6 (0.5%) |
| $2,000 to $2,499 | 34 (2.1%) | 0 (0.0%) |
| $2,500 to $2,999 | 0 (0.0%) | 0 (0.0%) |
| $3,000 or more | 24 (1.5%) | 0 (0.0%) |
| Total | 1,623 (100.0%) | 1,135 (100.0%) |
Physical Housing Characteristics in Elkins
Housing Structures in Elkins
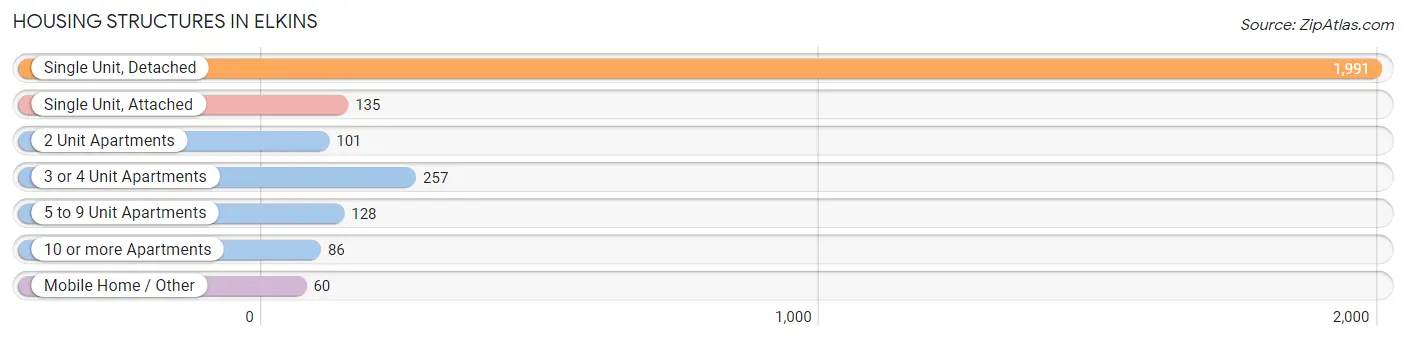
| Structure Type | # Housing Units | % Housing Units |
| Single Unit, Detached | 1,991 | 72.2% |
| Single Unit, Attached | 135 | 4.9% |
| 2 Unit Apartments | 101 | 3.7% |
| 3 or 4 Unit Apartments | 257 | 9.3% |
| 5 to 9 Unit Apartments | 128 | 4.6% |
| 10 or more Apartments | 86 | 3.1% |
| Mobile Home / Other | 60 | 2.2% |
| Total | 2,758 | 100.0% |
Housing Structures by Occupancy in Elkins
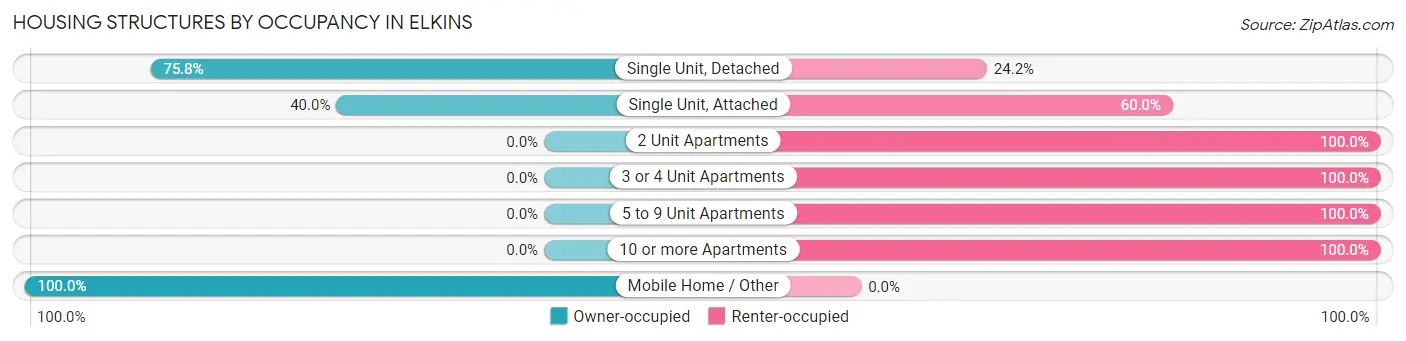
| Structure Type | Owner-occupied | Renter-occupied |
| Single Unit, Detached | 1,509 (75.8%) | 482 (24.2%) |
| Single Unit, Attached | 54 (40.0%) | 81 (60.0%) |
| 2 Unit Apartments | 0 (0.0%) | 101 (100.0%) |
| 3 or 4 Unit Apartments | 0 (0.0%) | 257 (100.0%) |
| 5 to 9 Unit Apartments | 0 (0.0%) | 128 (100.0%) |
| 10 or more Apartments | 0 (0.0%) | 86 (100.0%) |
| Mobile Home / Other | 60 (100.0%) | 0 (0.0%) |
| Total | 1,623 (58.9%) | 1,135 (41.1%) |
Housing Structures by Number of Rooms in Elkins
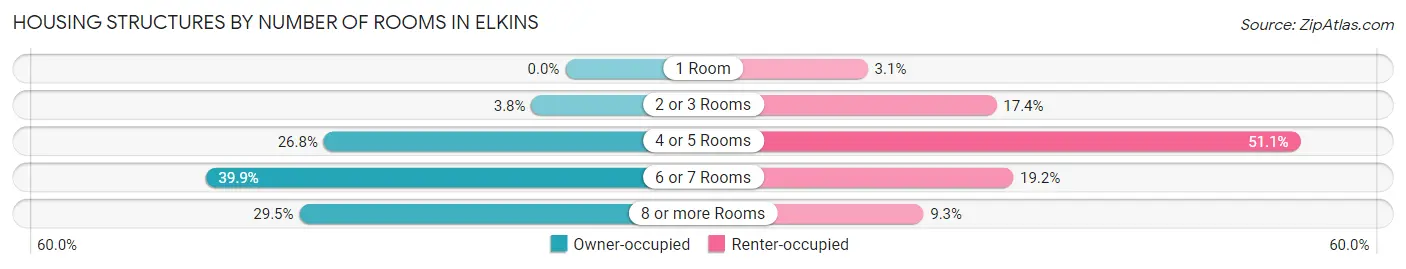
| Number of Rooms | Owner-occupied | Renter-occupied |
| 1 Room | 0 (0.0%) | 35 (3.1%) |
| 2 or 3 Rooms | 61 (3.8%) | 197 (17.4%) |
| 4 or 5 Rooms | 435 (26.8%) | 580 (51.1%) |
| 6 or 7 Rooms | 648 (39.9%) | 218 (19.2%) |
| 8 or more Rooms | 479 (29.5%) | 105 (9.2%) |
| Total | 1,623 (100.0%) | 1,135 (100.0%) |
Housing Structure by Heating Type in Elkins
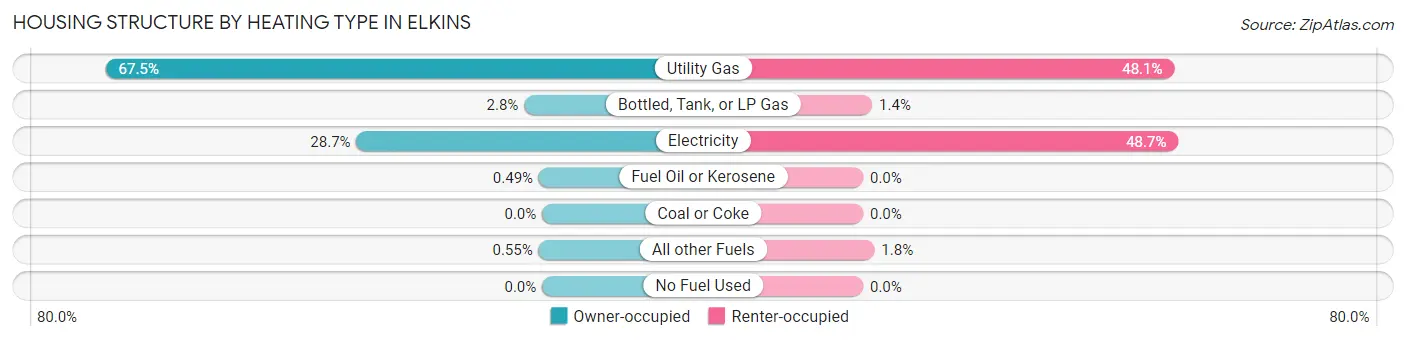
| Heating Type | Owner-occupied | Renter-occupied |
| Utility Gas | 1,095 (67.5%) | 546 (48.1%) |
| Bottled, Tank, or LP Gas | 45 (2.8%) | 16 (1.4%) |
| Electricity | 466 (28.7%) | 553 (48.7%) |
| Fuel Oil or Kerosene | 8 (0.5%) | 0 (0.0%) |
| Coal or Coke | 0 (0.0%) | 0 (0.0%) |
| All other Fuels | 9 (0.5%) | 20 (1.8%) |
| No Fuel Used | 0 (0.0%) | 0 (0.0%) |
| Total | 1,623 (100.0%) | 1,135 (100.0%) |
Household Vehicle Usage in Elkins
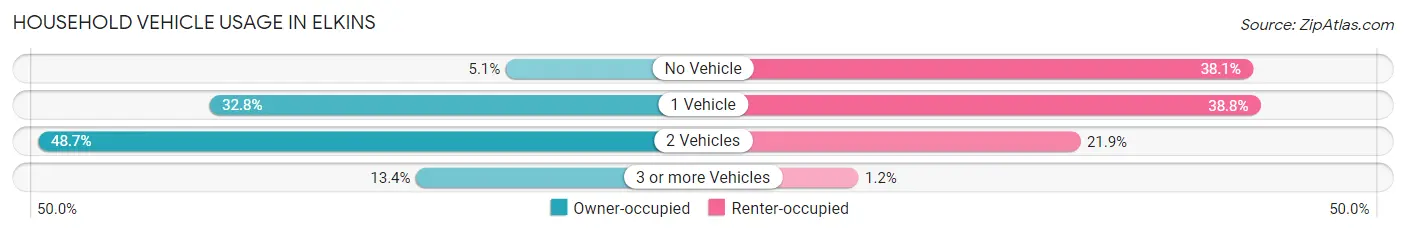
| Vehicles per Household | Owner-occupied | Renter-occupied |
| No Vehicle | 82 (5.1%) | 432 (38.1%) |
| 1 Vehicle | 532 (32.8%) | 440 (38.8%) |
| 2 Vehicles | 791 (48.7%) | 249 (21.9%) |
| 3 or more Vehicles | 218 (13.4%) | 14 (1.2%) |
| Total | 1,623 (100.0%) | 1,135 (100.0%) |
Real Estate & Mortgages in Elkins
Real Estate and Mortgage Overview in Elkins
| Characteristic | Without Mortgage | With Mortgage |
| Housing Units | 776 | 847 |
| Median Property Value | $112,400 | $150,100 |
| Median Household Income | $32,308 | $129 |
| Monthly Housing Costs | $359 | $24 |
| Real Estate Taxes | $571 | $19 |
Property Value by Mortgage Status in Elkins
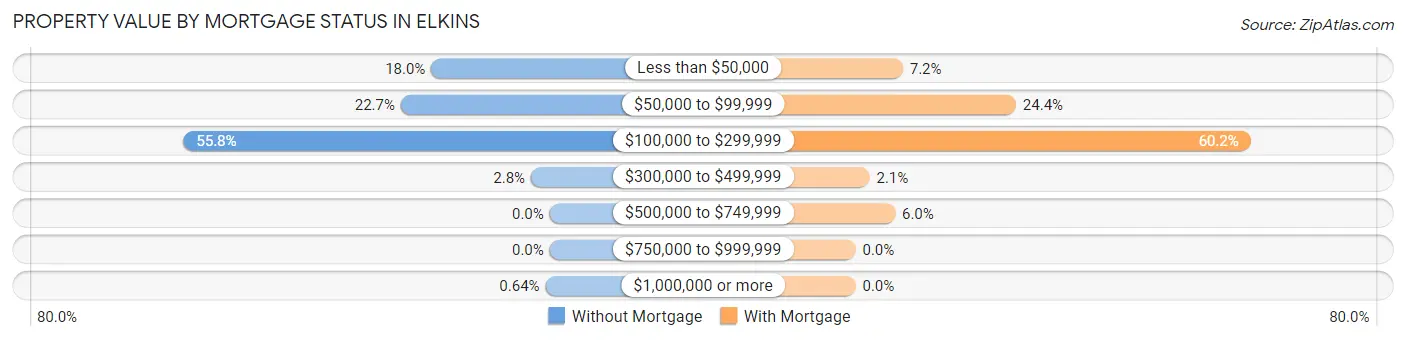
| Property Value | Without Mortgage | With Mortgage |
| Less than $50,000 | 140 (18.0%) | 61 (7.2%) |
| $50,000 to $99,999 | 176 (22.7%) | 207 (24.4%) |
| $100,000 to $299,999 | 433 (55.8%) | 510 (60.2%) |
| $300,000 to $499,999 | 22 (2.8%) | 18 (2.1%) |
| $500,000 to $749,999 | 0 (0.0%) | 51 (6.0%) |
| $750,000 to $999,999 | 0 (0.0%) | 0 (0.0%) |
| $1,000,000 or more | 5 (0.6%) | 0 (0.0%) |
| Total | 776 (100.0%) | 847 (100.0%) |
Household Income by Mortgage Status in Elkins
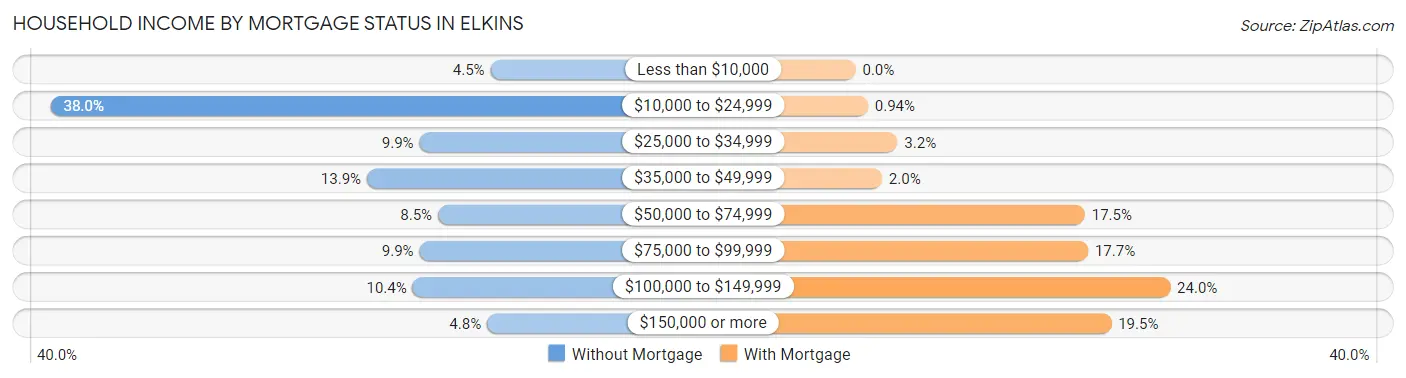
| Household Income | Without Mortgage | With Mortgage |
| Less than $10,000 | 35 (4.5%) | 0 (0.0%) |
| $10,000 to $24,999 | 295 (38.0%) | 8 (0.9%) |
| $25,000 to $34,999 | 77 (9.9%) | 27 (3.2%) |
| $35,000 to $49,999 | 108 (13.9%) | 17 (2.0%) |
| $50,000 to $74,999 | 66 (8.5%) | 148 (17.5%) |
| $75,000 to $99,999 | 77 (9.9%) | 150 (17.7%) |
| $100,000 to $149,999 | 81 (10.4%) | 203 (24.0%) |
| $150,000 or more | 37 (4.8%) | 165 (19.5%) |
| Total | 776 (100.0%) | 847 (100.0%) |
Property Value to Household Income Ratio in Elkins
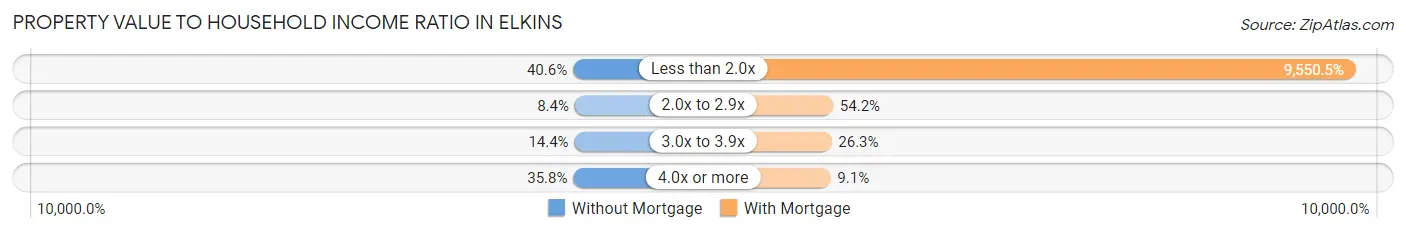
| Value-to-Income Ratio | Without Mortgage | With Mortgage |
| Less than 2.0x | 315 (40.6%) | 80,893 (9,550.5%) |
| 2.0x to 2.9x | 65 (8.4%) | 459 (54.2%) |
| 3.0x to 3.9x | 112 (14.4%) | 223 (26.3%) |
| 4.0x or more | 278 (35.8%) | 77 (9.1%) |
| Total | 776 (100.0%) | 847 (100.0%) |
Real Estate Taxes by Mortgage Status in Elkins
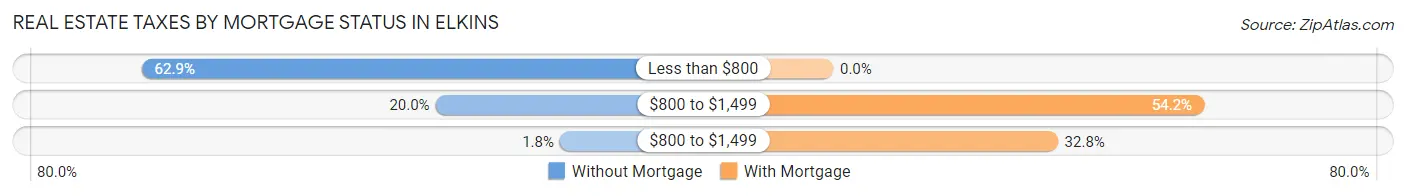
| Property Taxes | Without Mortgage | With Mortgage |
| Less than $800 | 488 (62.9%) | 0 (0.0%) |
| $800 to $1,499 | 155 (20.0%) | 459 (54.2%) |
| $800 to $1,499 | 14 (1.8%) | 278 (32.8%) |
| Total | 776 (100.0%) | 847 (100.0%) |
Health & Disability in Elkins
Health Insurance Coverage by Age in Elkins
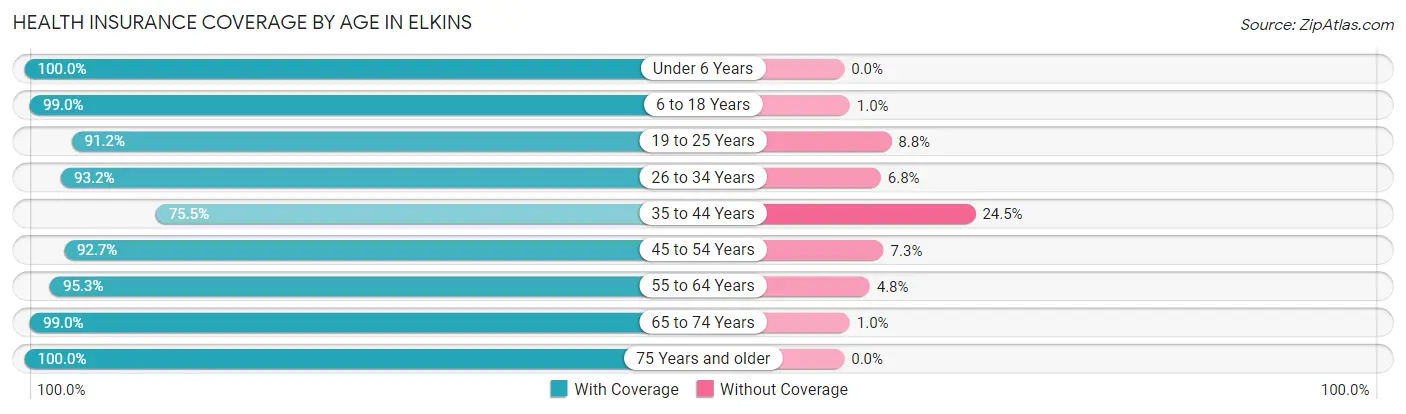
| Age Bracket | With Coverage | Without Coverage |
| Under 6 Years | 466 (100.0%) | 0 (0.0%) |
| 6 to 18 Years | 950 (99.0%) | 10 (1.0%) |
| 19 to 25 Years | 999 (91.2%) | 96 (8.8%) |
| 26 to 34 Years | 601 (93.2%) | 44 (6.8%) |
| 35 to 44 Years | 624 (75.5%) | 202 (24.5%) |
| 45 to 54 Years | 783 (92.7%) | 62 (7.3%) |
| 55 to 64 Years | 842 (95.3%) | 42 (4.8%) |
| 65 to 74 Years | 665 (99.0%) | 7 (1.0%) |
| 75 Years and older | 521 (100.0%) | 0 (0.0%) |
| Total | 6,451 (93.3%) | 463 (6.7%) |
Health Insurance Coverage by Citizenship Status in Elkins
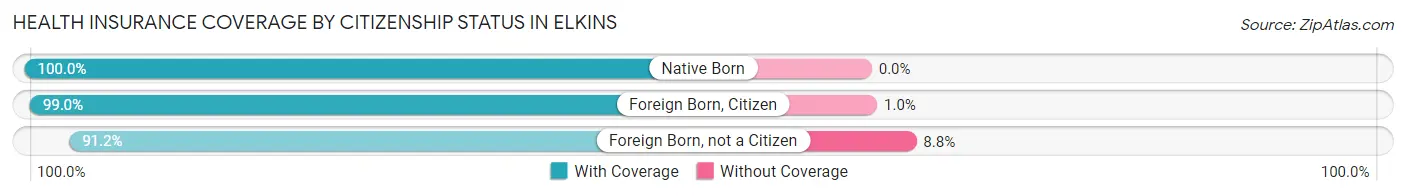
| Citizenship Status | With Coverage | Without Coverage |
| Native Born | 466 (100.0%) | 0 (0.0%) |
| Foreign Born, Citizen | 950 (99.0%) | 10 (1.0%) |
| Foreign Born, not a Citizen | 999 (91.2%) | 96 (8.8%) |
Health Insurance Coverage by Household Income in Elkins
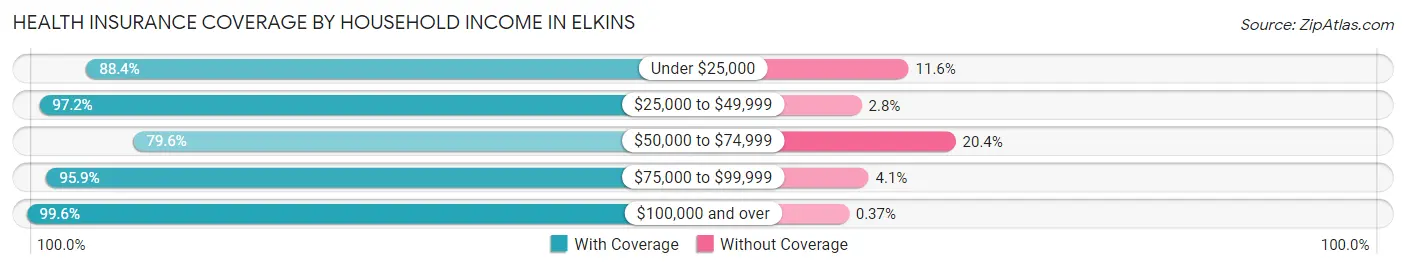
| Household Income | With Coverage | Without Coverage |
| Under $25,000 | 1,375 (88.4%) | 180 (11.6%) |
| $25,000 to $49,999 | 1,295 (97.2%) | 37 (2.8%) |
| $50,000 to $74,999 | 687 (79.6%) | 176 (20.4%) |
| $75,000 to $99,999 | 822 (95.9%) | 35 (4.1%) |
| $100,000 and over | 1,875 (99.6%) | 7 (0.4%) |
Public vs Private Health Insurance Coverage by Age in Elkins
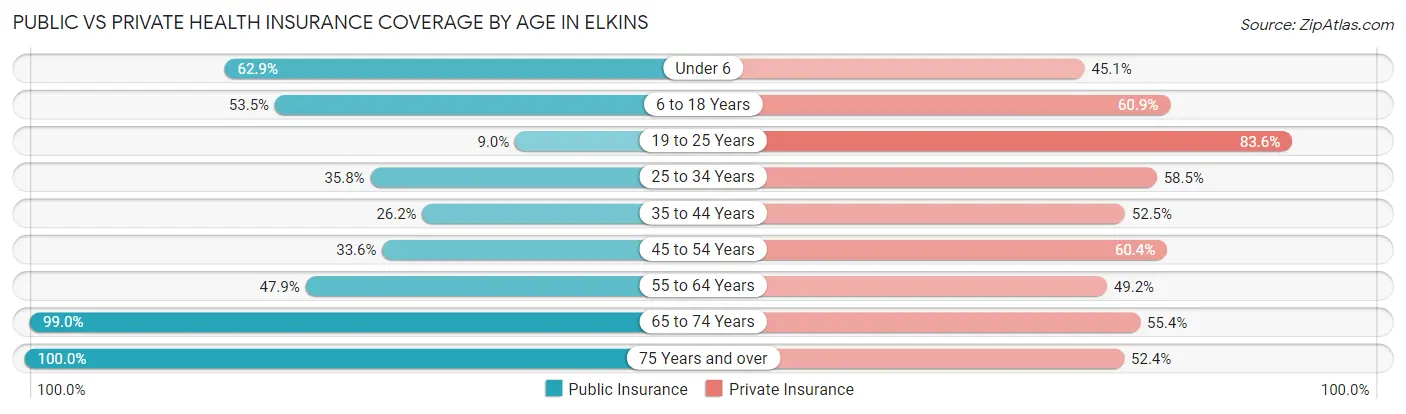
| Age Bracket | Public Insurance | Private Insurance |
| Under 6 | 293 (62.9%) | 210 (45.1%) |
| 6 to 18 Years | 514 (53.5%) | 585 (60.9%) |
| 19 to 25 Years | 98 (8.9%) | 915 (83.6%) |
| 25 to 34 Years | 231 (35.8%) | 377 (58.5%) |
| 35 to 44 Years | 216 (26.2%) | 434 (52.5%) |
| 45 to 54 Years | 284 (33.6%) | 510 (60.4%) |
| 55 to 64 Years | 423 (47.8%) | 435 (49.2%) |
| 65 to 74 Years | 665 (99.0%) | 372 (55.4%) |
| 75 Years and over | 521 (100.0%) | 273 (52.4%) |
| Total | 3,245 (46.9%) | 4,111 (59.5%) |
Disability Status by Sex by Age in Elkins
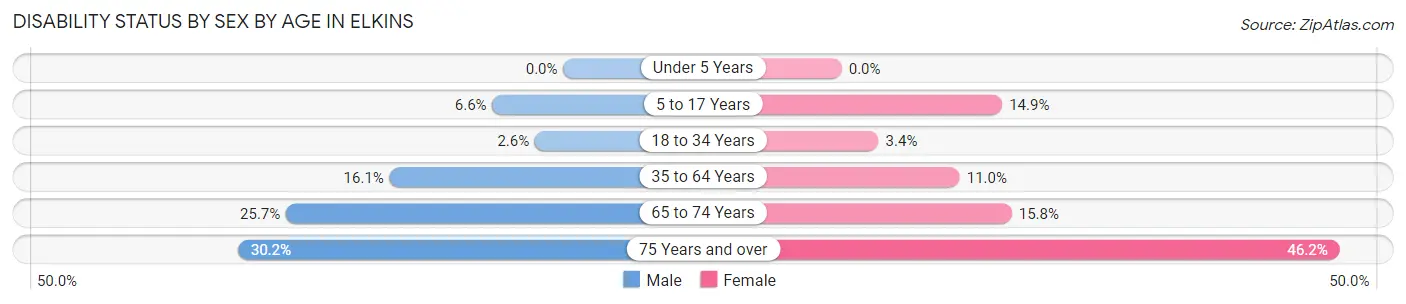
| Age Bracket | Male | Female |
| Under 5 Years | 0 (0.0%) | 0 (0.0%) |
| 5 to 17 Years | 34 (6.6%) | 56 (14.9%) |
| 18 to 34 Years | 24 (2.6%) | 32 (3.4%) |
| 35 to 64 Years | 222 (16.1%) | 129 (11.0%) |
| 65 to 74 Years | 62 (25.7%) | 68 (15.8%) |
| 75 Years and over | 58 (30.2%) | 152 (46.2%) |
Disability Class by Sex by Age in Elkins
Disability Class: Hearing Difficulty
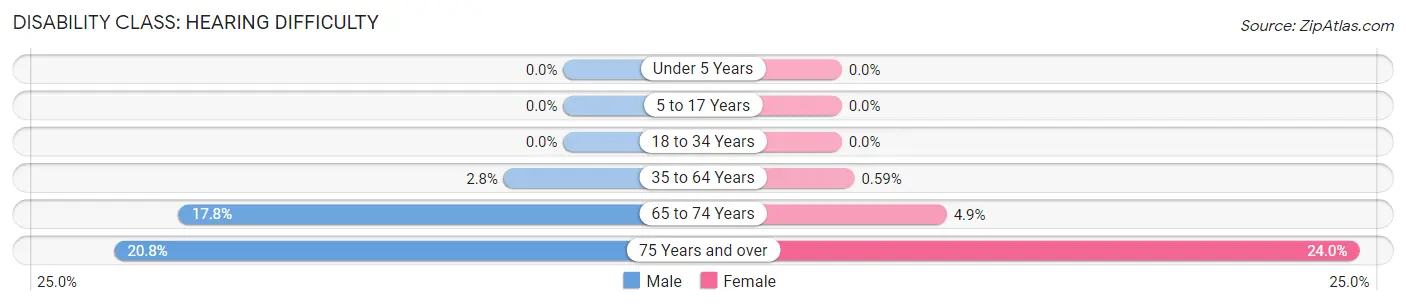
| Age Bracket | Male | Female |
| Under 5 Years | 0 (0.0%) | 0 (0.0%) |
| 5 to 17 Years | 0 (0.0%) | 0 (0.0%) |
| 18 to 34 Years | 0 (0.0%) | 0 (0.0%) |
| 35 to 64 Years | 38 (2.8%) | 7 (0.6%) |
| 65 to 74 Years | 43 (17.8%) | 21 (4.9%) |
| 75 Years and over | 40 (20.8%) | 79 (24.0%) |
Disability Class: Vision Difficulty
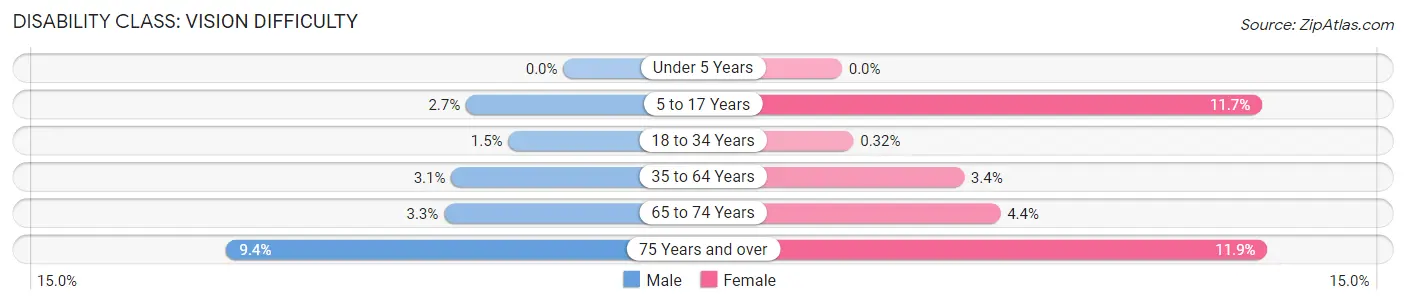
| Age Bracket | Male | Female |
| Under 5 Years | 0 (0.0%) | 0 (0.0%) |
| 5 to 17 Years | 14 (2.7%) | 44 (11.7%) |
| 18 to 34 Years | 14 (1.5%) | 3 (0.3%) |
| 35 to 64 Years | 43 (3.1%) | 40 (3.4%) |
| 65 to 74 Years | 8 (3.3%) | 19 (4.4%) |
| 75 Years and over | 18 (9.4%) | 39 (11.8%) |
Disability Class: Cognitive Difficulty
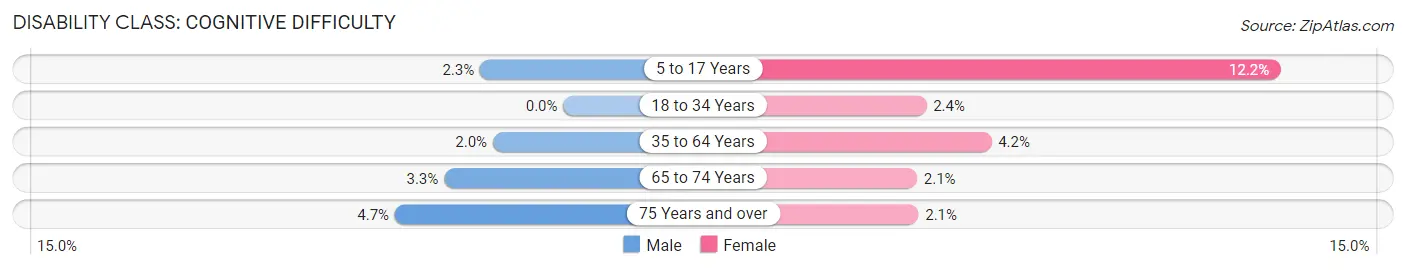
| Age Bracket | Male | Female |
| 5 to 17 Years | 12 (2.3%) | 46 (12.2%) |
| 18 to 34 Years | 0 (0.0%) | 22 (2.4%) |
| 35 to 64 Years | 27 (2.0%) | 49 (4.2%) |
| 65 to 74 Years | 8 (3.3%) | 9 (2.1%) |
| 75 Years and over | 9 (4.7%) | 7 (2.1%) |
Disability Class: Ambulatory Difficulty
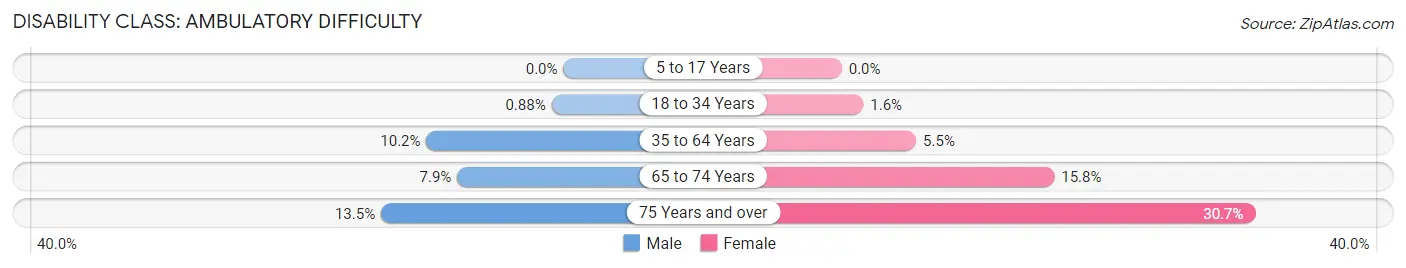
| Age Bracket | Male | Female |
| 5 to 17 Years | 0 (0.0%) | 0 (0.0%) |
| 18 to 34 Years | 8 (0.9%) | 15 (1.6%) |
| 35 to 64 Years | 140 (10.2%) | 65 (5.5%) |
| 65 to 74 Years | 19 (7.9%) | 68 (15.8%) |
| 75 Years and over | 26 (13.5%) | 101 (30.7%) |
Disability Class: Self-Care Difficulty
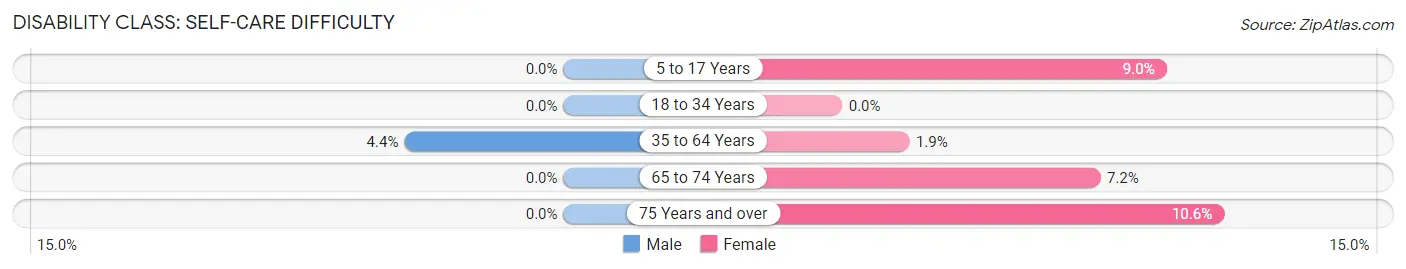
| Age Bracket | Male | Female |
| 5 to 17 Years | 0 (0.0%) | 34 (9.0%) |
| 18 to 34 Years | 0 (0.0%) | 0 (0.0%) |
| 35 to 64 Years | 61 (4.4%) | 22 (1.9%) |
| 65 to 74 Years | 0 (0.0%) | 31 (7.2%) |
| 75 Years and over | 0 (0.0%) | 35 (10.6%) |
Technology Access in Elkins
Computing Device Access in Elkins
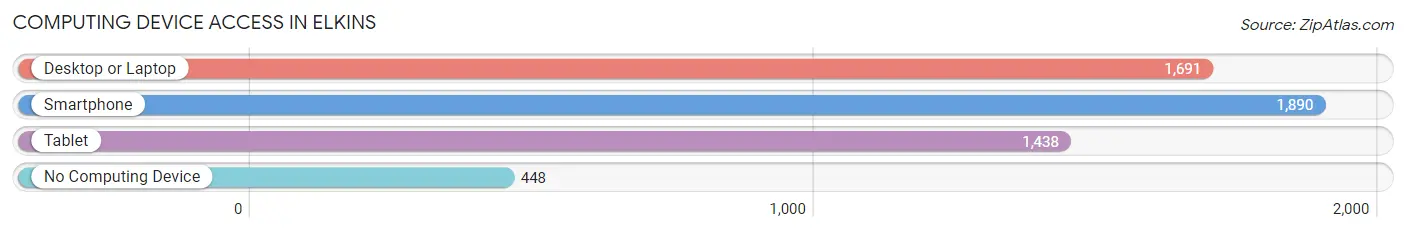
| Device Type | # Households | % Households |
| Desktop or Laptop | 1,691 | 61.3% |
| Smartphone | 1,890 | 68.5% |
| Tablet | 1,438 | 52.1% |
| No Computing Device | 448 | 16.2% |
| Total | 2,758 | 100.0% |
Internet Access in Elkins
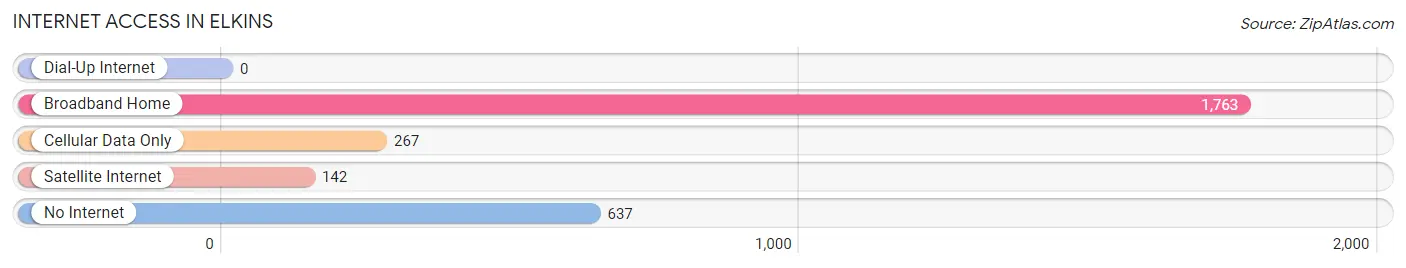
| Internet Type | # Households | % Households |
| Dial-Up Internet | 0 | 0.0% |
| Broadband Home | 1,763 | 63.9% |
| Cellular Data Only | 267 | 9.7% |
| Satellite Internet | 142 | 5.1% |
| No Internet | 637 | 23.1% |
| Total | 2,758 | 100.0% |
Elkins Summary
Elkins, West Virginia is a small city located in the Appalachian Mountains of Randolph County. It is the county seat and the largest city in Randolph County. The city was founded in 1890 and named after Stephen Benton Elkins, a U.S. Senator from West Virginia. Elkins is located in the Tygart Valley River Valley, which is part of the Monongahela River watershed. The city is situated at the intersection of U.S. Route 33 and U.S. Route 219.
History
The area that is now Elkins was originally inhabited by Native Americans, including the Monongahela and Shawnee tribes. The first European settlers arrived in the area in the late 1700s. The town of Elkins was founded in 1890 by Senator Stephen Benton Elkins and his brother-in-law, Henry Gassaway Davis. The two men purchased the land and developed it into a railroad town. The town was named after Senator Elkins and was incorporated in 1894.
The railroad was a major factor in the growth of Elkins. It allowed the city to become a major hub for the timber and coal industries. The railroad also allowed the city to become a major tourist destination. The city was home to several resorts, including the Elkins Inn and the Elkins Hotel.
The city was also home to several educational institutions, including Davis and Elkins College, which was founded in 1904. The college is still in operation today and is one of the oldest private colleges in West Virginia.
Geography
Elkins is located in the Appalachian Mountains of Randolph County. The city is situated at the intersection of U.S. Route 33 and U.S. Route 219. The city is located in the Tygart Valley River Valley, which is part of the Monongahela River watershed. The city is surrounded by the Monongahela National Forest and is located near the Cheat River.
The city has a total area of 4.2 square miles, all of which is land. The city has an elevation of 2,072 feet above sea level. The climate in Elkins is classified as humid continental, with hot summers and cold winters.
Economy
The economy of Elkins is largely based on tourism and the timber and coal industries. The city is home to several tourist attractions, including the Elkins Inn and the Elkins Hotel. The city is also home to several manufacturing companies, including the Elkins Manufacturing Company, which produces furniture and other wood products.
The city is also home to several educational institutions, including Davis and Elkins College. The college is a major employer in the city and provides jobs for many of the city’s residents.
Demographics
As of the 2010 census, the population of Elkins was 7,094. The racial makeup of the city was 95.3% White, 1.3% African American, 0.3% Native American, 0.7% Asian, 0.1% Pacific Islander, 0.7% from other races, and 1.9% from two or more races. Hispanic or Latino of any race were 1.9% of the population.
The median household income in Elkins was $30,938, and the median family income was $41,944. The per capita income in Elkins was $17,945. About 16.2% of the population was below the poverty line.
Common Questions
What is Per Capita Income in Elkins?
Per Capita income in Elkins is $25,823.
What is the Median Family Income in Elkins?
Median Family Income in Elkins is $65,859.
What is the Median Household income in Elkins?
Median Household Income in Elkins is $39,875.
What is Income or Wage Gap in Elkins?
Income or Wage Gap in Elkins is 17.7%.
Women in Elkins earn 82.3 cents for every dollar earned by a man.
What is Inequality or Gini Index in Elkins?
Inequality or Gini Index in Elkins is 0.50.
What is the Total Population of Elkins?
Total Population of Elkins is 6,935.
What is the Total Male Population of Elkins?
Total Male Population of Elkins is 3,407.
What is the Total Female Population of Elkins?
Total Female Population of Elkins is 3,528.
What is the Ratio of Males per 100 Females in Elkins?
There are 96.57 Males per 100 Females in Elkins.
What is the Ratio of Females per 100 Males in Elkins?
There are 103.55 Females per 100 Males in Elkins.
What is the Median Population Age in Elkins?
Median Population Age in Elkins is 38.7 Years.
What is the Average Family Size in Elkins
Average Family Size in Elkins is 3.4 People.
What is the Average Household Size in Elkins
Average Household Size in Elkins is 2.4 People.
How Large is the Labor Force in Elkins?
There are 3,417 People in the Labor Forcein in Elkins.
What is the Percentage of People in the Labor Force in Elkins?
59.3% of People are in the Labor Force in Elkins.
What is the Unemployment Rate in Elkins?
Unemployment Rate in Elkins is 11.2%.