Bridgeport, WV Map & Demographics
Bridgeport Map
Bridgeport Overview
$51,214
PER CAPITA INCOME
$129,508
AVG FAMILY INCOME
$96,063
AVG HOUSEHOLD INCOME
51.9%
WAGE / INCOME GAP [ % ]
48.1¢/ $1
WAGE / INCOME GAP [ $ ]
0.41
INEQUALITY / GINI INDEX
9,255
TOTAL POPULATION
4,128
MALE POPULATION
5,127
FEMALE POPULATION
80.51
MALES / 100 FEMALES
124.20
FEMALES / 100 MALES
45.1
MEDIAN AGE
3.1
AVG FAMILY SIZE
2.4
AVG HOUSEHOLD SIZE
4,709
LABOR FORCE [ PEOPLE ]
60.6%
PERCENT IN LABOR FORCE
1.6%
UNEMPLOYMENT RATE
Bridgeport Zip Codes
Income in Bridgeport
Income Overview in Bridgeport
Per Capita Income in Bridgeport is $51,214, while median incomes of families and households are $129,508 and $96,063 respectively.
| Characteristic | Number | Measure |
| Per Capita Income | 9,255 | $51,214 |
| Median Family Income | 2,322 | $129,508 |
| Mean Family Income | 2,322 | $150,412 |
| Median Household Income | 3,738 | $96,063 |
| Mean Household Income | 3,738 | $119,684 |
| Income Deficit | 2,322 | $0 |
| Wage / Income Gap (%) | 9,255 | 51.91% |
| Wage / Income Gap ($) | 9,255 | 48.09¢ per $1 |
| Gini / Inequality Index | 9,255 | 0.41 |
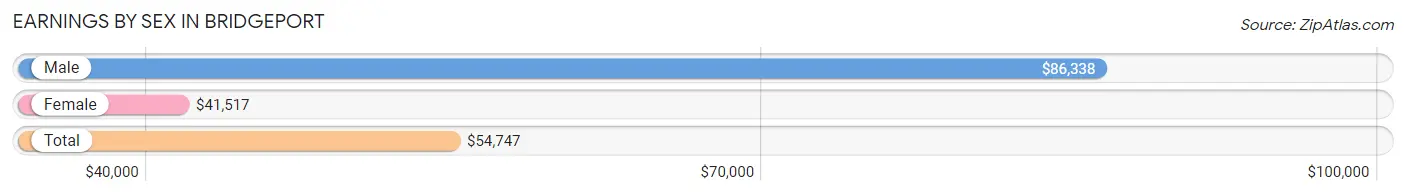
Earnings by Sex in Bridgeport
Average Earnings in Bridgeport are $54,747, $86,338 for men and $41,517 for women, a difference of 51.9%.
| Sex | Number | Average Earnings |
| Male | 2,511 (50.0%) | $86,338 |
| Female | 2,506 (49.9%) | $41,517 |
| Total | 5,017 (100.0%) | $54,747 |
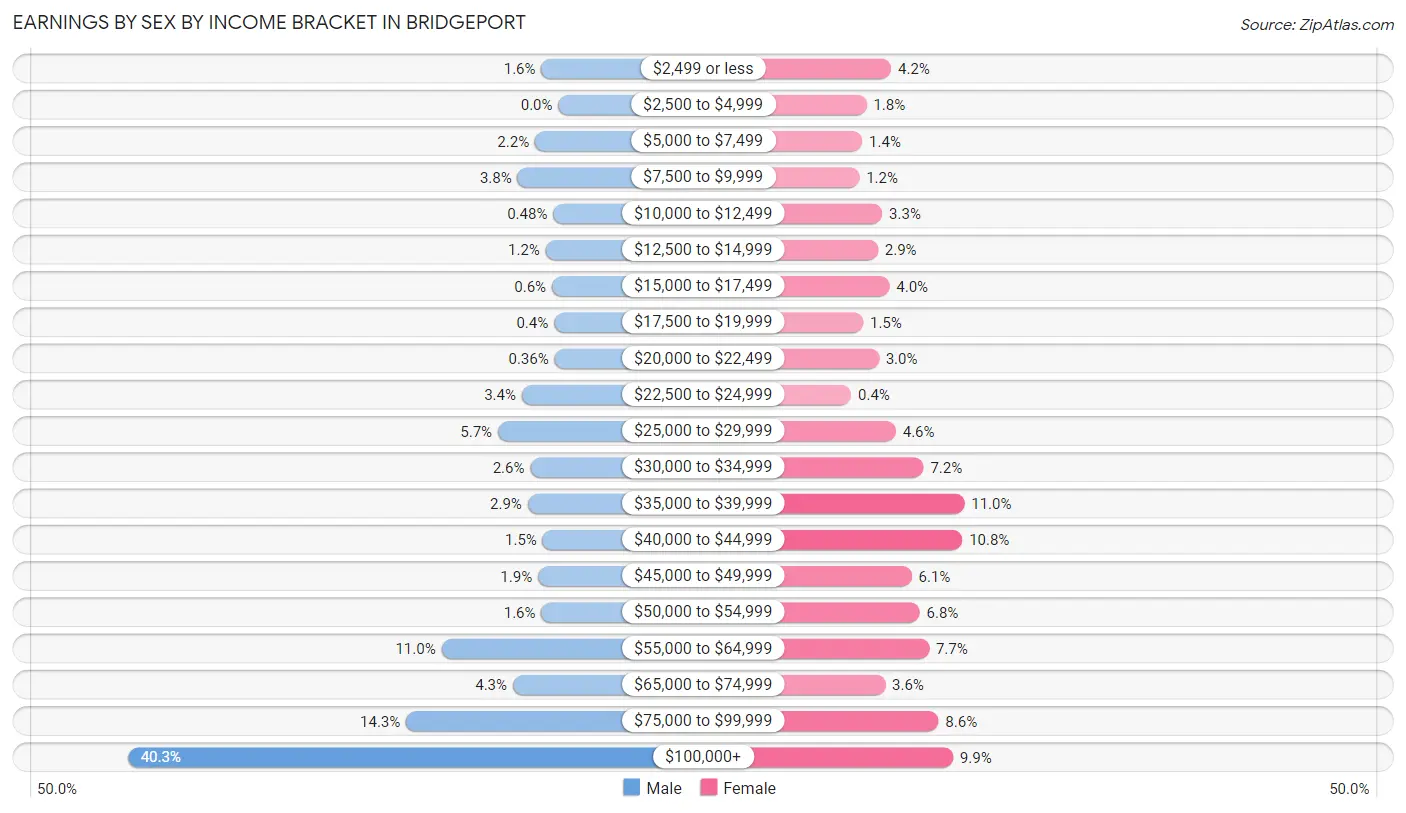
Earnings by Sex by Income Bracket in Bridgeport
The most common earnings brackets in Bridgeport are $100,000+ for men (1,013 | 40.3%) and $35,000 to $39,999 for women (276 | 11.0%).
| Income | Male | Female |
| $2,499 or less | 40 (1.6%) | 104 (4.2%) |
| $2,500 to $4,999 | 0 (0.0%) | 46 (1.8%) |
| $5,000 to $7,499 | 55 (2.2%) | 36 (1.4%) |
| $7,500 to $9,999 | 96 (3.8%) | 29 (1.2%) |
| $10,000 to $12,499 | 12 (0.5%) | 83 (3.3%) |
| $12,500 to $14,999 | 30 (1.2%) | 73 (2.9%) |
| $15,000 to $17,499 | 15 (0.6%) | 100 (4.0%) |
| $17,500 to $19,999 | 10 (0.4%) | 38 (1.5%) |
| $20,000 to $22,499 | 9 (0.4%) | 75 (3.0%) |
| $22,500 to $24,999 | 86 (3.4%) | 10 (0.4%) |
| $25,000 to $29,999 | 142 (5.7%) | 115 (4.6%) |
| $30,000 to $34,999 | 66 (2.6%) | 180 (7.2%) |
| $35,000 to $39,999 | 72 (2.9%) | 276 (11.0%) |
| $40,000 to $44,999 | 37 (1.5%) | 271 (10.8%) |
| $45,000 to $49,999 | 48 (1.9%) | 152 (6.1%) |
| $50,000 to $54,999 | 40 (1.6%) | 171 (6.8%) |
| $55,000 to $64,999 | 275 (11.0%) | 193 (7.7%) |
| $65,000 to $74,999 | 107 (4.3%) | 90 (3.6%) |
| $75,000 to $99,999 | 358 (14.3%) | 215 (8.6%) |
| $100,000+ | 1,013 (40.3%) | 249 (9.9%) |
| Total | 2,511 (100.0%) | 2,506 (100.0%) |
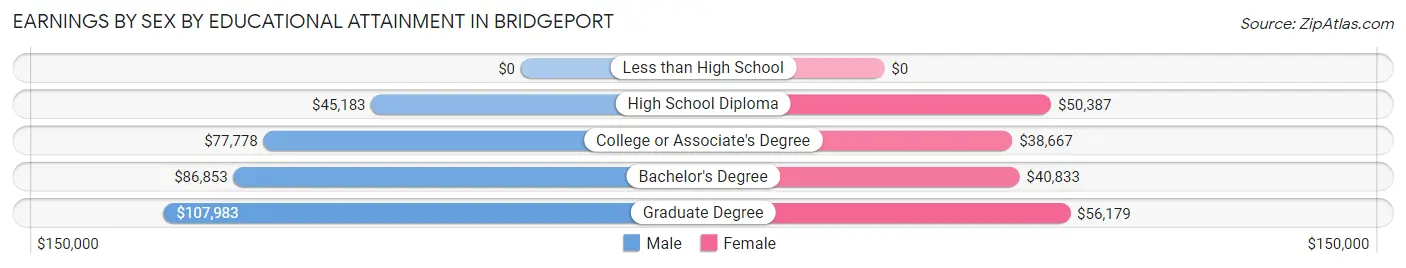
Earnings by Sex by Educational Attainment in Bridgeport
Average earnings in Bridgeport are $93,533 for men and $43,730 for women, a difference of 53.2%. Men with an educational attainment of graduate degree enjoy the highest average annual earnings of $107,983, while those with high school diploma education earn the least with $45,183. Women with an educational attainment of graduate degree earn the most with the average annual earnings of $56,179, while those with college or associate's degree education have the smallest earnings of $38,667.
| Educational Attainment | Male Income | Female Income |
| Less than High School | - | - |
| High School Diploma | $45,183 | $50,387 |
| College or Associate's Degree | $77,778 | $38,667 |
| Bachelor's Degree | $86,853 | $40,833 |
| Graduate Degree | $107,983 | $56,179 |
| Total | $93,533 | $43,730 |
Family Income in Bridgeport
Family Income Brackets in Bridgeport
According to the Bridgeport family income data, there are 543 families falling into the $200,000+ income range, which is the most common income bracket and makes up 23.4% of all families.
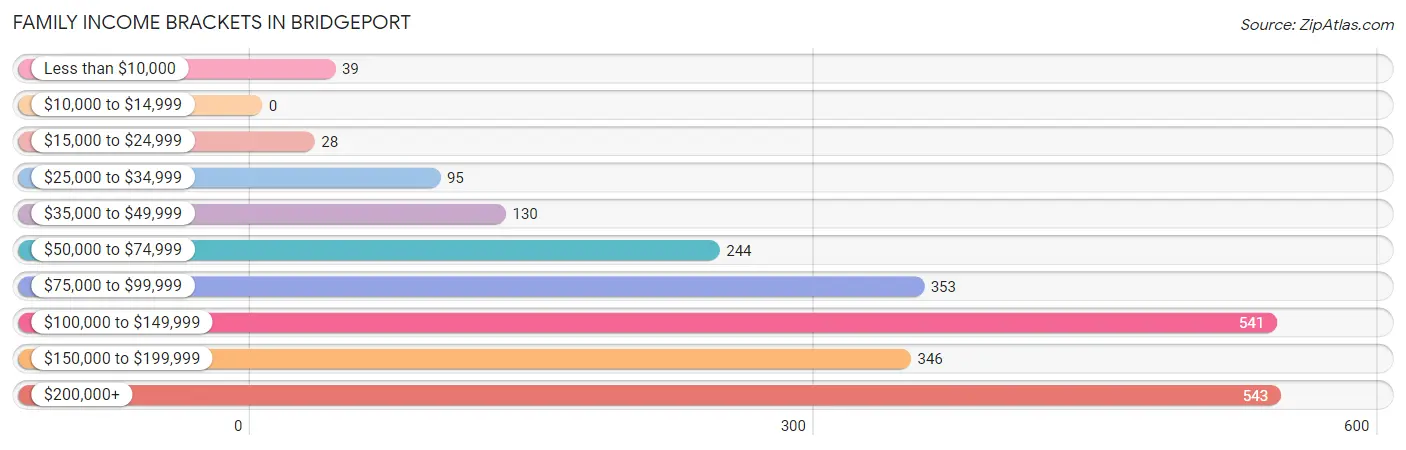
| Income Bracket | # Families | % Families |
| Less than $10,000 | 39 | 1.7% |
| $10,000 to $14,999 | 0 | 0.0% |
| $15,000 to $24,999 | 28 | 1.2% |
| $25,000 to $34,999 | 95 | 4.1% |
| $35,000 to $49,999 | 130 | 5.6% |
| $50,000 to $74,999 | 244 | 10.5% |
| $75,000 to $99,999 | 353 | 15.2% |
| $100,000 to $149,999 | 541 | 23.3% |
| $150,000 to $199,999 | 346 | 14.9% |
| $200,000+ | 543 | 23.4% |
Family Income by Famaliy Size in Bridgeport
6-person families (70 | 3.0%) account for the highest median family income in Bridgeport with $250,001 per family, while 2-person families (1,105 | 47.6%) have the highest median income of $50,590 per family member.
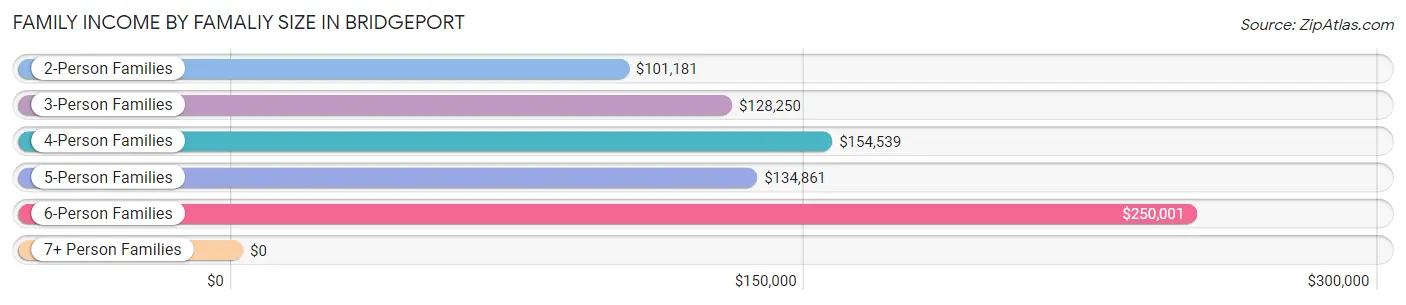
| Income Bracket | # Families | Median Income |
| 2-Person Families | 1,105 (47.6%) | $101,181 |
| 3-Person Families | 607 (26.1%) | $128,250 |
| 4-Person Families | 421 (18.1%) | $154,539 |
| 5-Person Families | 119 (5.1%) | $134,861 |
| 6-Person Families | 70 (3.0%) | $250,001 |
| 7+ Person Families | 0 (0.0%) | $0 |
| Total | 2,322 (100.0%) | $129,508 |
Family Income by Number of Earners in Bridgeport
The median family income in Bridgeport is $129,508, with families comprising 3+ earners (269) having the highest median family income of $154,926, while families with no earners (318) have the lowest median family income of $62,708, accounting for 11.6% and 13.7% of families, respectively.
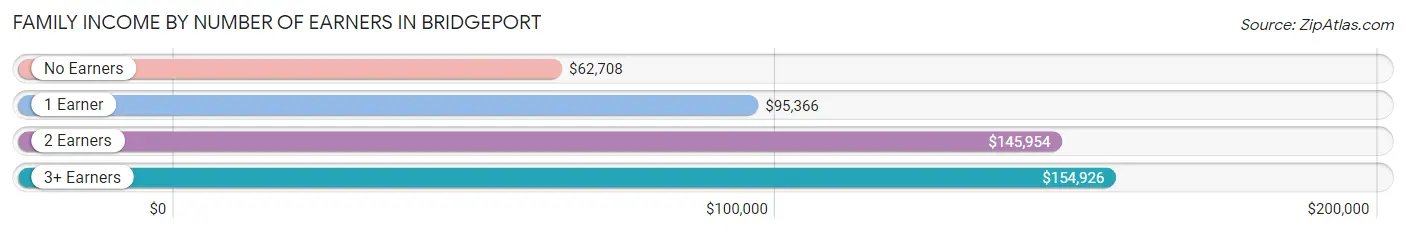
| Number of Earners | # Families | Median Income |
| No Earners | 318 (13.7%) | $62,708 |
| 1 Earner | 558 (24.0%) | $95,366 |
| 2 Earners | 1,177 (50.7%) | $145,954 |
| 3+ Earners | 269 (11.6%) | $154,926 |
| Total | 2,322 (100.0%) | $129,508 |
Household Income in Bridgeport
Household Income Brackets in Bridgeport
With 796 households falling in the category, the $100,000 to $149,999 income range is the most frequent in Bridgeport, accounting for 21.3% of all households. In contrast, only 64 households (1.7%) fall into the $10,000 to $14,999 income bracket, making it the least populous group.
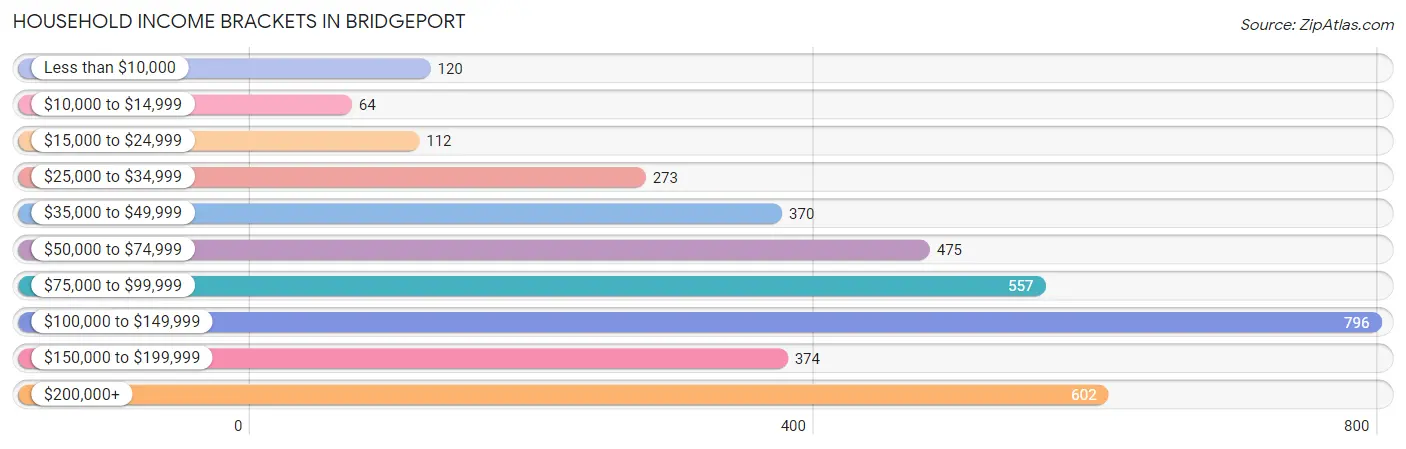
| Income Bracket | # Households | % Households |
| Less than $10,000 | 120 | 3.2% |
| $10,000 to $14,999 | 64 | 1.7% |
| $15,000 to $24,999 | 112 | 3.0% |
| $25,000 to $34,999 | 273 | 7.3% |
| $35,000 to $49,999 | 370 | 9.9% |
| $50,000 to $74,999 | 475 | 12.7% |
| $75,000 to $99,999 | 557 | 14.9% |
| $100,000 to $149,999 | 796 | 21.3% |
| $150,000 to $199,999 | 374 | 10.0% |
| $200,000+ | 602 | 16.1% |
Household Income by Householder Age in Bridgeport
The median household income in Bridgeport is $96,063, with the highest median household income of $131,333 found in the 45 to 64 years age bracket for the primary householder. A total of 1,312 households (35.1%) fall into this category. Meanwhile, the 15 to 24 years age bracket for the primary householder has the lowest median household income of $0, with 16 households (0.4%) in this group.
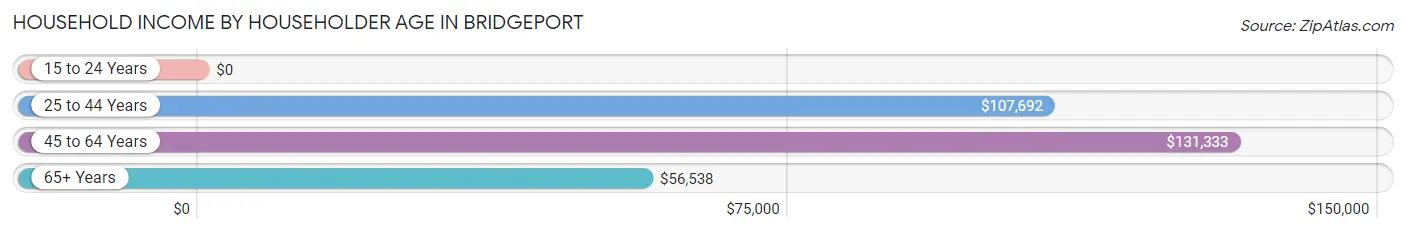
| Income Bracket | # Households | Median Income |
| 15 to 24 Years | 16 (0.4%) | $0 |
| 25 to 44 Years | 1,132 (30.3%) | $107,692 |
| 45 to 64 Years | 1,312 (35.1%) | $131,333 |
| 65+ Years | 1,278 (34.2%) | $56,538 |
| Total | 3,738 (100.0%) | $96,063 |
Poverty in Bridgeport
Income Below Poverty by Sex and Age in Bridgeport
With 5.4% poverty level for males and 5.7% for females among the residents of Bridgeport, 25 to 34 year old males and 12 to 14 year old females are the most vulnerable to poverty, with 137 males (24.8%) and 41 females (30.8%) in their respective age groups living below the poverty level.
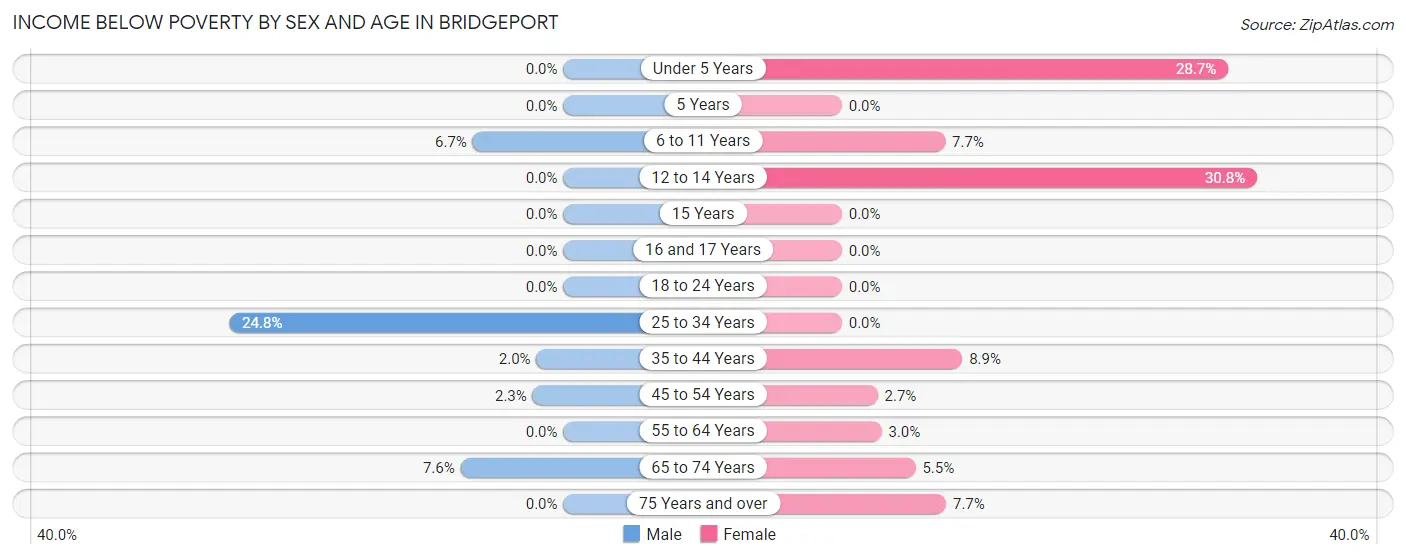
| Age Bracket | Male | Female |
| Under 5 Years | 0 (0.0%) | 37 (28.7%) |
| 5 Years | 0 (0.0%) | 0 (0.0%) |
| 6 to 11 Years | 15 (6.7%) | 29 (7.7%) |
| 12 to 14 Years | 0 (0.0%) | 41 (30.8%) |
| 15 Years | 0 (0.0%) | 0 (0.0%) |
| 16 and 17 Years | 0 (0.0%) | 0 (0.0%) |
| 18 to 24 Years | 0 (0.0%) | 0 (0.0%) |
| 25 to 34 Years | 137 (24.8%) | 0 (0.0%) |
| 35 to 44 Years | 10 (2.0%) | 63 (8.9%) |
| 45 to 54 Years | 18 (2.3%) | 14 (2.7%) |
| 55 to 64 Years | 0 (0.0%) | 19 (2.9%) |
| 65 to 74 Years | 39 (7.6%) | 28 (5.5%) |
| 75 Years and over | 0 (0.0%) | 55 (7.7%) |
| Total | 219 (5.4%) | 286 (5.7%) |
Income Above Poverty by Sex and Age in Bridgeport
According to the poverty statistics in Bridgeport, males aged under 5 years and females aged 5 years are the age groups that are most secure financially, with 100.0% of males and 100.0% of females in these age groups living above the poverty line.
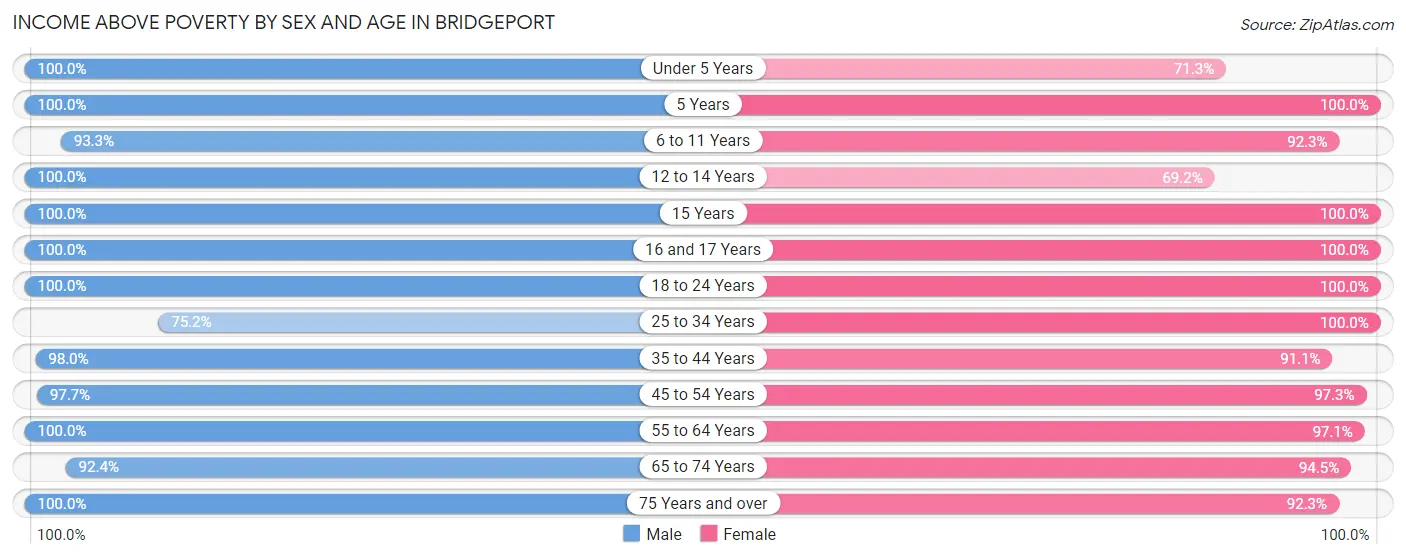
| Age Bracket | Male | Female |
| Under 5 Years | 306 (100.0%) | 92 (71.3%) |
| 5 Years | 11 (100.0%) | 42 (100.0%) |
| 6 to 11 Years | 208 (93.3%) | 349 (92.3%) |
| 12 to 14 Years | 92 (100.0%) | 92 (69.2%) |
| 15 Years | 49 (100.0%) | 121 (100.0%) |
| 16 and 17 Years | 92 (100.0%) | 93 (100.0%) |
| 18 to 24 Years | 161 (100.0%) | 264 (100.0%) |
| 25 to 34 Years | 415 (75.2%) | 760 (100.0%) |
| 35 to 44 Years | 489 (98.0%) | 642 (91.1%) |
| 45 to 54 Years | 771 (97.7%) | 512 (97.3%) |
| 55 to 64 Years | 564 (100.0%) | 624 (97.1%) |
| 65 to 74 Years | 472 (92.4%) | 484 (94.5%) |
| 75 Years and over | 216 (100.0%) | 656 (92.3%) |
| Total | 3,846 (94.6%) | 4,731 (94.3%) |
Income Below Poverty Among Married-Couple Families in Bridgeport
The poverty statistics for married-couple families in Bridgeport show that 2.8% or 55 of the total 1,998 families live below the poverty line. Families with 1 or 2 children have the highest poverty rate of 5.3%, comprising of 39 families. On the other hand, families with 3 or 4 children have the lowest poverty rate of 0.0%, which includes 0 families.
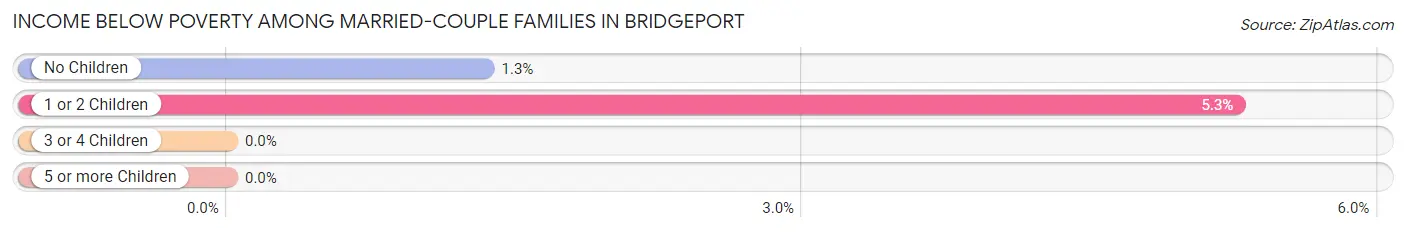
| Children | Above Poverty | Below Poverty |
| No Children | 1,174 (98.7%) | 16 (1.3%) |
| 1 or 2 Children | 702 (94.7%) | 39 (5.3%) |
| 3 or 4 Children | 67 (100.0%) | 0 (0.0%) |
| 5 or more Children | 0 (0.0%) | 0 (0.0%) |
| Total | 1,943 (97.3%) | 55 (2.8%) |
Income Below Poverty Among Single-Parent Households in Bridgeport
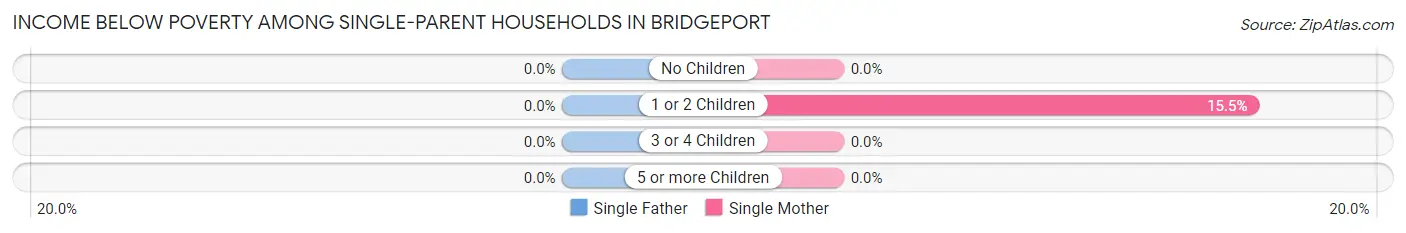
| Children | Single Father | Single Mother |
| No Children | 0 (0.0%) | 0 (0.0%) |
| 1 or 2 Children | 0 (0.0%) | 24 (15.5%) |
| 3 or 4 Children | 0 (0.0%) | 0 (0.0%) |
| 5 or more Children | 0 (0.0%) | 0 (0.0%) |
| Total | 0 (0.0%) | 24 (10.3%) |
Income Below Poverty Among Married-Couple vs Single-Parent Households in Bridgeport
The poverty data for Bridgeport shows that 55 of the married-couple family households (2.8%) and 24 of the single-parent households (7.4%) are living below the poverty level. Within the married-couple family households, those with 1 or 2 children have the highest poverty rate, with 39 households (5.3%) falling below the poverty line. Among the single-parent households, those with 1 or 2 children have the highest poverty rate, with 24 household (14.8%) living below poverty.
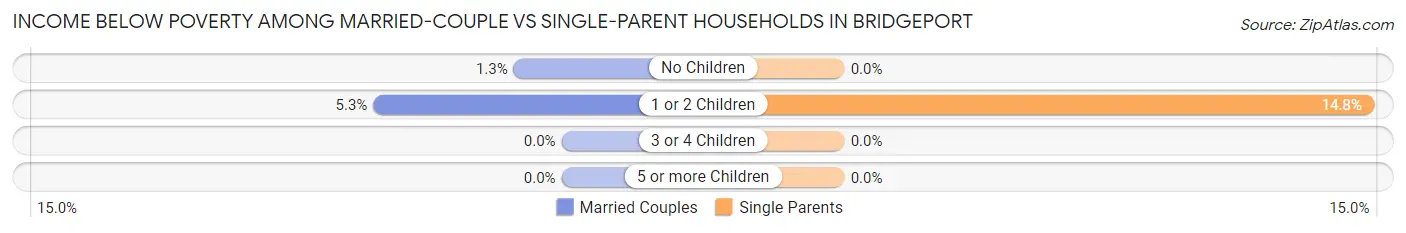
| Children | Married-Couple Families | Single-Parent Households |
| No Children | 16 (1.3%) | 0 (0.0%) |
| 1 or 2 Children | 39 (5.3%) | 24 (14.8%) |
| 3 or 4 Children | 0 (0.0%) | 0 (0.0%) |
| 5 or more Children | 0 (0.0%) | 0 (0.0%) |
| Total | 55 (2.8%) | 24 (7.4%) |
Race in Bridgeport
The most populous races in Bridgeport are White / Caucasian (8,487 | 91.7%), Asian (321 | 3.5%), and Hispanic or Latino (284 | 3.1%).
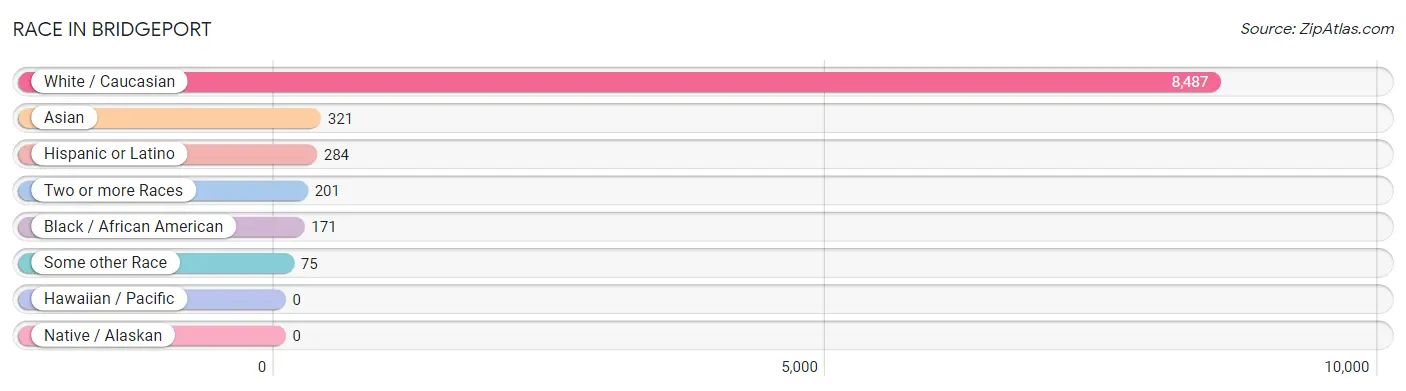
| Race | # Population | % Population |
| Asian | 321 | 3.5% |
| Black / African American | 171 | 1.8% |
| Hawaiian / Pacific | 0 | 0.0% |
| Hispanic or Latino | 284 | 3.1% |
| Native / Alaskan | 0 | 0.0% |
| White / Caucasian | 8,487 | 91.7% |
| Two or more Races | 201 | 2.2% |
| Some other Race | 75 | 0.8% |
| Total | 9,255 | 100.0% |
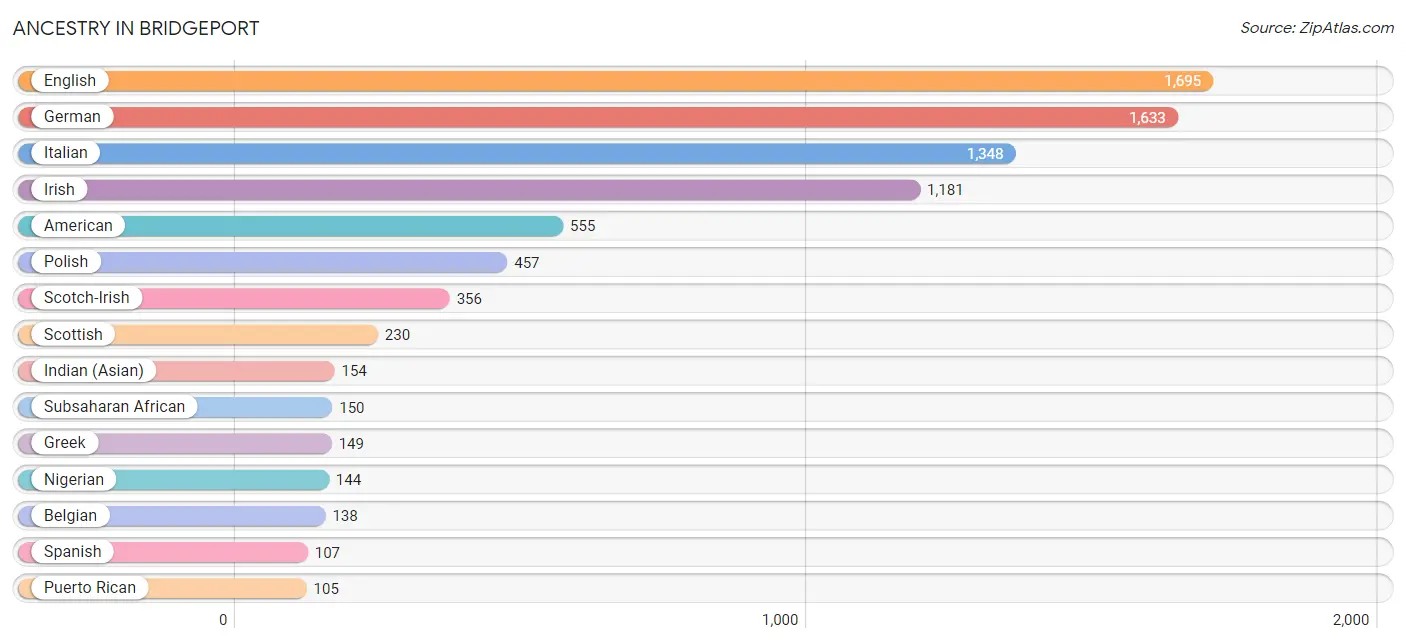
Ancestry in Bridgeport
The most populous ancestries reported in Bridgeport are English (1,695 | 18.3%), German (1,633 | 17.6%), Italian (1,348 | 14.6%), Irish (1,181 | 12.8%), and American (555 | 6.0%), together accounting for 69.3% of all Bridgeport residents.
| Ancestry | # Population | % Population |
| African | 6 | 0.1% |
| American | 555 | 6.0% |
| Arab | 80 | 0.9% |
| Austrian | 18 | 0.2% |
| Belgian | 138 | 1.5% |
| Blackfeet | 6 | 0.1% |
| British | 13 | 0.1% |
| Burmese | 61 | 0.7% |
| Cherokee | 12 | 0.1% |
| Croatian | 19 | 0.2% |
| Czech | 11 | 0.1% |
| Czechoslovakian | 22 | 0.2% |
| Dutch | 70 | 0.8% |
| Eastern European | 16 | 0.2% |
| English | 1,695 | 18.3% |
| European | 91 | 1.0% |
| French | 41 | 0.4% |
| German | 1,633 | 17.6% |
| Greek | 149 | 1.6% |
| Hungarian | 85 | 0.9% |
| Indian (Asian) | 154 | 1.7% |
| Irish | 1,181 | 12.8% |
| Italian | 1,348 | 14.6% |
| Korean | 81 | 0.9% |
| Lebanese | 45 | 0.5% |
| Lithuanian | 32 | 0.4% |
| Mexican | 18 | 0.2% |
| Native Hawaiian | 28 | 0.3% |
| Nigerian | 144 | 1.6% |
| Northern European | 29 | 0.3% |
| Polish | 457 | 4.9% |
| Puerto Rican | 105 | 1.1% |
| Russian | 30 | 0.3% |
| Scotch-Irish | 356 | 3.8% |
| Scottish | 230 | 2.5% |
| Slovak | 72 | 0.8% |
| Slovene | 10 | 0.1% |
| Spaniard | 54 | 0.6% |
| Spanish | 107 | 1.2% |
| Subsaharan African | 150 | 1.6% |
| Swedish | 41 | 0.4% |
| Swiss | 29 | 0.3% |
| Syrian | 5 | 0.1% |
| Thai | 73 | 0.8% |
| Ukrainian | 7 | 0.1% |
| Welsh | 7 | 0.1% |
| Yugoslavian | 17 | 0.2% | View All 47 Rows |
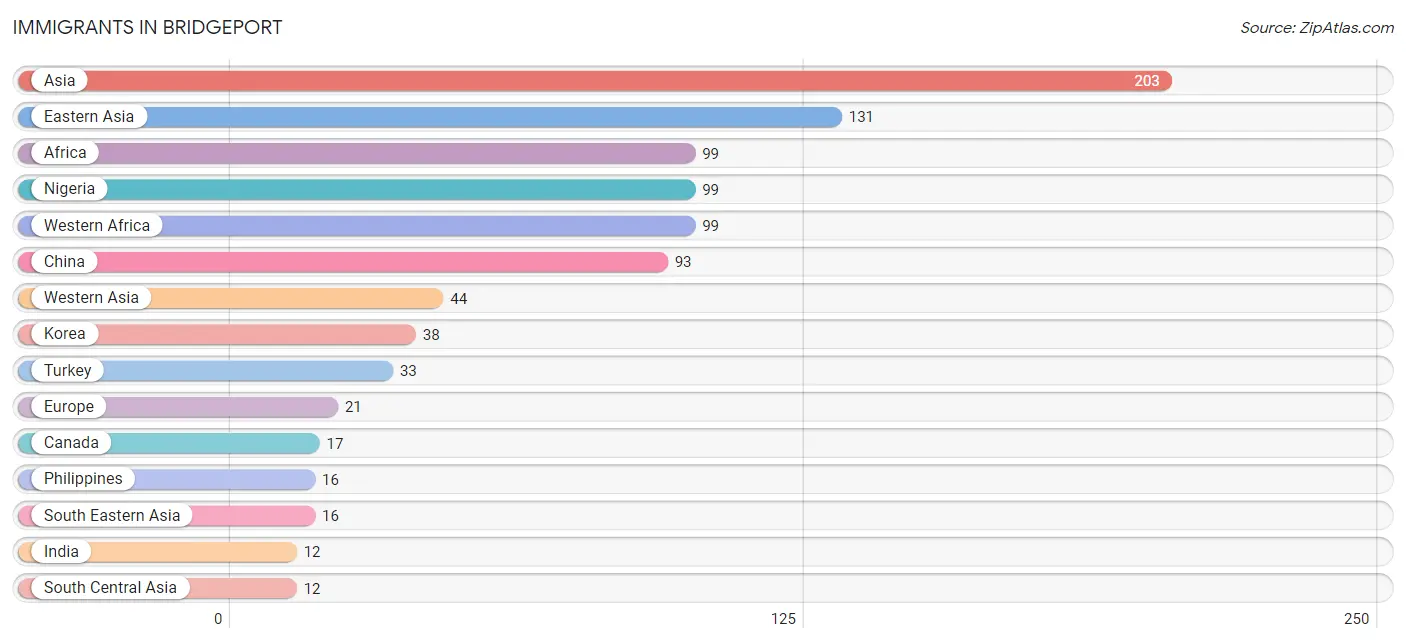
Immigrants in Bridgeport
The most numerous immigrant groups reported in Bridgeport came from Asia (203 | 2.2%), Eastern Asia (131 | 1.4%), Africa (99 | 1.1%), Nigeria (99 | 1.1%), and Western Africa (99 | 1.1%), together accounting for 6.8% of all Bridgeport residents.
| Immigration Origin | # Population | % Population |
| Africa | 99 | 1.1% |
| Asia | 203 | 2.2% |
| Canada | 17 | 0.2% |
| China | 93 | 1.0% |
| Eastern Asia | 131 | 1.4% |
| Eastern Europe | 10 | 0.1% |
| England | 11 | 0.1% |
| Europe | 21 | 0.2% |
| India | 12 | 0.1% |
| Korea | 38 | 0.4% |
| Nigeria | 99 | 1.1% |
| Northern Europe | 11 | 0.1% |
| Philippines | 16 | 0.2% |
| Russia | 10 | 0.1% |
| South Central Asia | 12 | 0.1% |
| South Eastern Asia | 16 | 0.2% |
| Syria | 11 | 0.1% |
| Turkey | 33 | 0.4% |
| Western Africa | 99 | 1.1% |
| Western Asia | 44 | 0.5% | View All 20 Rows |
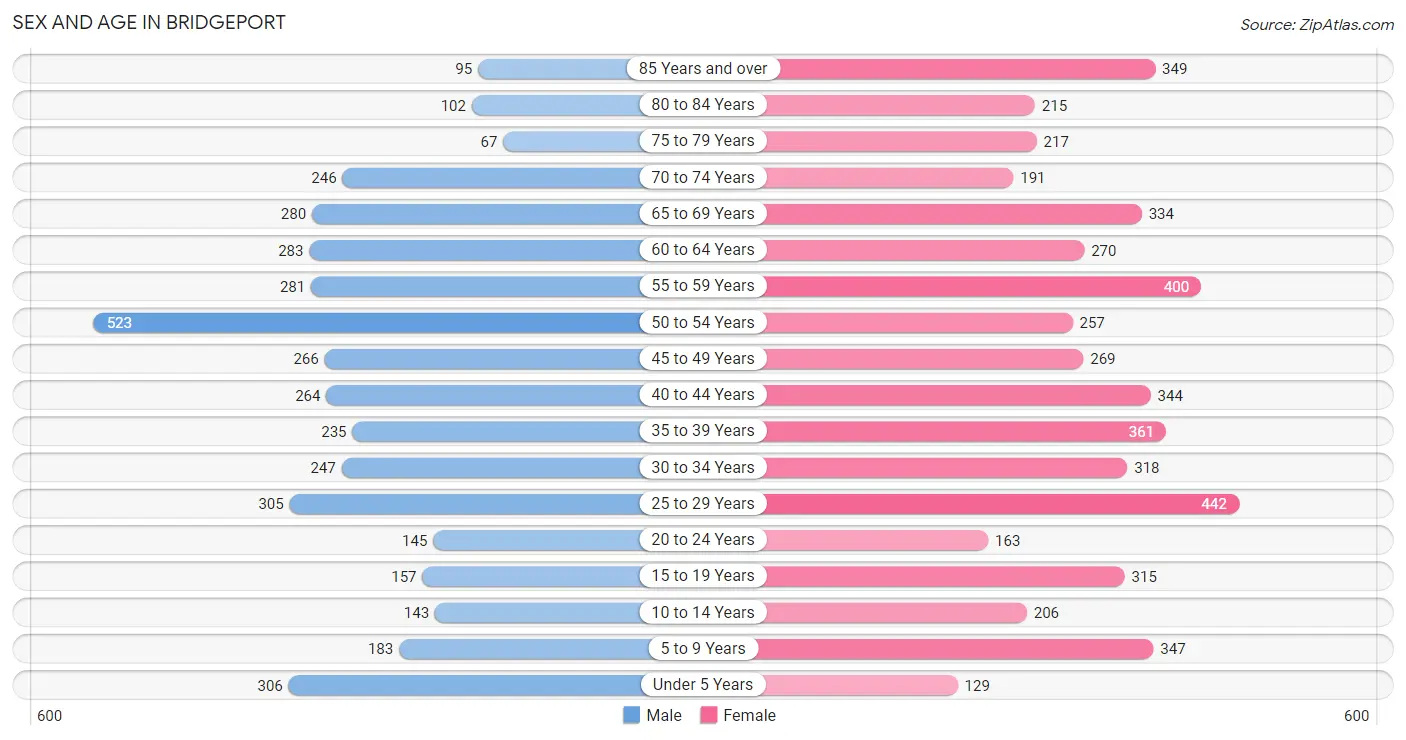
Sex and Age in Bridgeport
Sex and Age in Bridgeport
The most populous age groups in Bridgeport are 50 to 54 Years (523 | 12.7%) for men and 25 to 29 Years (442 | 8.6%) for women.
| Age Bracket | Male | Female |
| Under 5 Years | 306 (7.4%) | 129 (2.5%) |
| 5 to 9 Years | 183 (4.4%) | 347 (6.8%) |
| 10 to 14 Years | 143 (3.5%) | 206 (4.0%) |
| 15 to 19 Years | 157 (3.8%) | 315 (6.1%) |
| 20 to 24 Years | 145 (3.5%) | 163 (3.2%) |
| 25 to 29 Years | 305 (7.4%) | 442 (8.6%) |
| 30 to 34 Years | 247 (6.0%) | 318 (6.2%) |
| 35 to 39 Years | 235 (5.7%) | 361 (7.0%) |
| 40 to 44 Years | 264 (6.4%) | 344 (6.7%) |
| 45 to 49 Years | 266 (6.4%) | 269 (5.2%) |
| 50 to 54 Years | 523 (12.7%) | 257 (5.0%) |
| 55 to 59 Years | 281 (6.8%) | 400 (7.8%) |
| 60 to 64 Years | 283 (6.9%) | 270 (5.3%) |
| 65 to 69 Years | 280 (6.8%) | 334 (6.5%) |
| 70 to 74 Years | 246 (6.0%) | 191 (3.7%) |
| 75 to 79 Years | 67 (1.6%) | 217 (4.2%) |
| 80 to 84 Years | 102 (2.5%) | 215 (4.2%) |
| 85 Years and over | 95 (2.3%) | 349 (6.8%) |
| Total | 4,128 (100.0%) | 5,127 (100.0%) |
Families and Households in Bridgeport
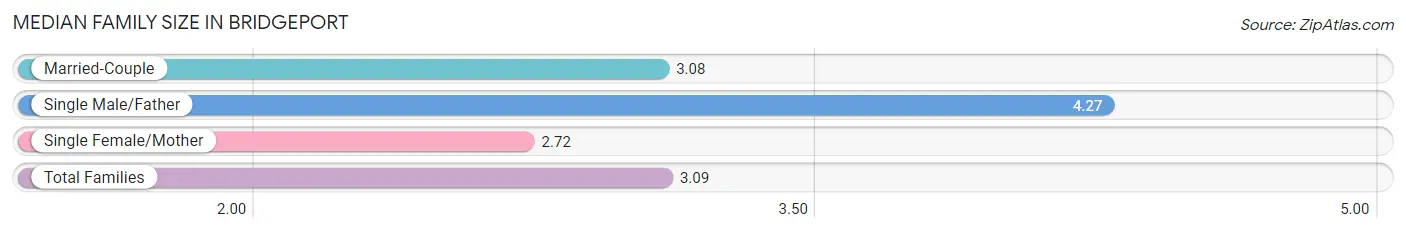
Median Family Size in Bridgeport
The median family size in Bridgeport is 3.09 persons per family, with single male/father families (91 | 3.9%) accounting for the largest median family size of 4.27 persons per family. On the other hand, single female/mother families (233 | 10.0%) represent the smallest median family size with 2.72 persons per family.
| Family Type | # Families | Family Size |
| Married-Couple | 1,998 (86.1%) | 3.08 |
| Single Male/Father | 91 (3.9%) | 4.27 |
| Single Female/Mother | 233 (10.0%) | 2.72 |
| Total Families | 2,322 (100.0%) | 3.09 |
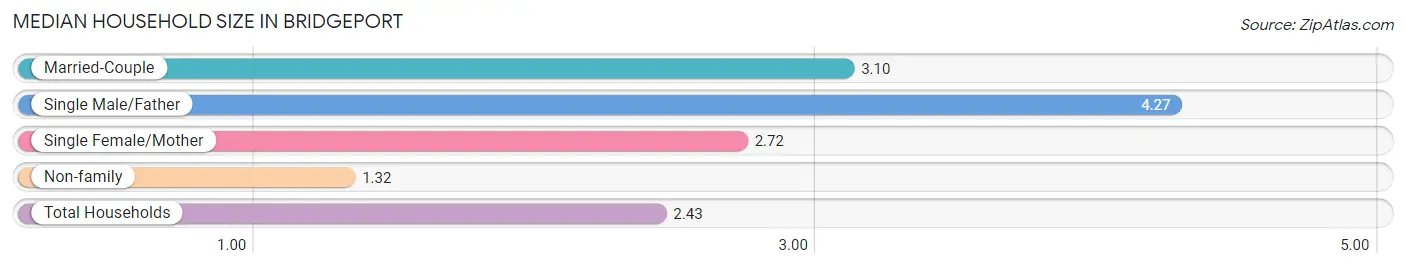
Median Household Size in Bridgeport
The median household size in Bridgeport is 2.43 persons per household, with single male/father households (91 | 2.4%) accounting for the largest median household size of 4.27 persons per household. non-family households (1,416 | 37.9%) represent the smallest median household size with 1.32 persons per household.
| Household Type | # Households | Household Size |
| Married-Couple | 1,998 (53.4%) | 3.10 |
| Single Male/Father | 91 (2.4%) | 4.27 |
| Single Female/Mother | 233 (6.2%) | 2.72 |
| Non-family | 1,416 (37.9%) | 1.32 |
| Total Households | 3,738 (100.0%) | 2.43 |
Household Size by Marriage Status in Bridgeport
Out of a total of 3,738 households in Bridgeport, 2,322 (62.1%) are family households, while 1,416 (37.9%) are nonfamily households. The most numerous type of family households are 2-person households, comprising 1,096, and the most common type of nonfamily households are 1-person households, comprising 1,154.
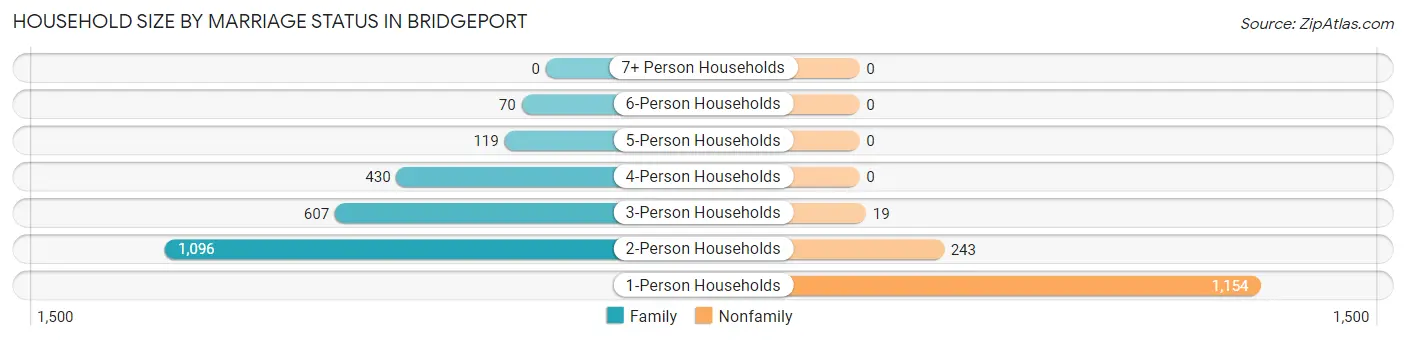
| Household Size | Family Households | Nonfamily Households |
| 1-Person Households | - | 1,154 (30.9%) |
| 2-Person Households | 1,096 (29.3%) | 243 (6.5%) |
| 3-Person Households | 607 (16.2%) | 19 (0.5%) |
| 4-Person Households | 430 (11.5%) | 0 (0.0%) |
| 5-Person Households | 119 (3.2%) | 0 (0.0%) |
| 6-Person Households | 70 (1.9%) | 0 (0.0%) |
| 7+ Person Households | 0 (0.0%) | 0 (0.0%) |
| Total | 2,322 (62.1%) | 1,416 (37.9%) |
Female Fertility in Bridgeport
Fertility by Age in Bridgeport
Average fertility rate in Bridgeport is 35.0 births per 1,000 women. Women in the age bracket of 20 to 34 years have the highest fertility rate with 59.0 births per 1,000 women. Women in the age bracket of 20 to 34 years acount for 70.1% of all women with births.
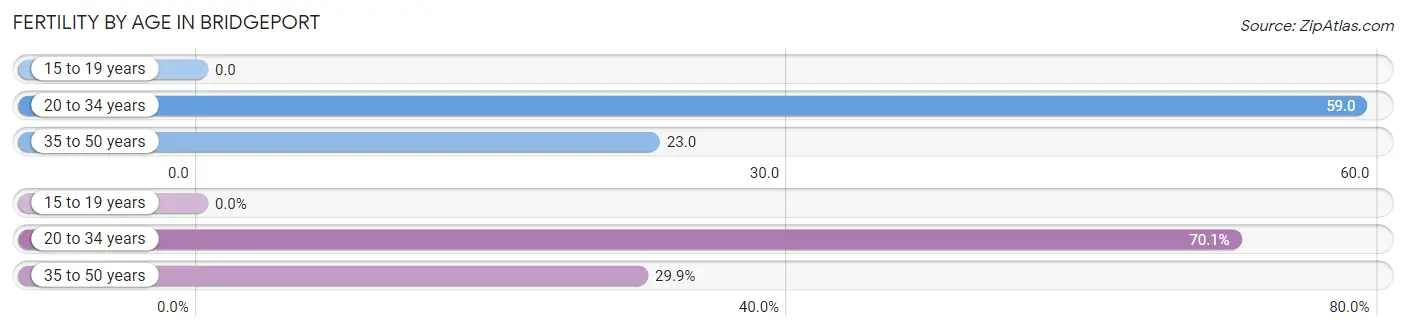
| Age Bracket | Women with Births | Births / 1,000 Women |
| 15 to 19 years | 0 (0.0%) | 0.0 |
| 20 to 34 years | 54 (70.1%) | 59.0 |
| 35 to 50 years | 23 (29.9%) | 23.0 |
| Total | 77 (100.0%) | 35.0 |
Fertility by Age by Marriage Status in Bridgeport
51.9% of women with births (77) in Bridgeport are married. The highest percentage of unmarried women with births falls into 20 to 34 years age bracket with 68.5% of them unmarried at the time of birth, while the lowest percentage of unmarried women with births belong to 35 to 50 years age bracket with 0.0% of them unmarried.
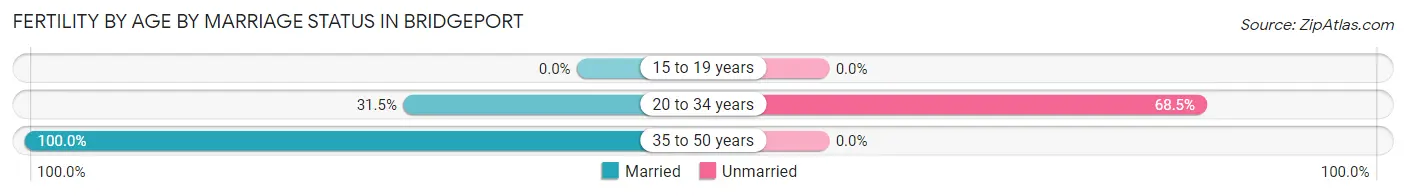
| Age Bracket | Married | Unmarried |
| 15 to 19 years | 0 (0.0%) | 0 (0.0%) |
| 20 to 34 years | 17 (31.5%) | 37 (68.5%) |
| 35 to 50 years | 23 (100.0%) | 0 (0.0%) |
| Total | 40 (51.9%) | 37 (48.0%) |
Fertility by Education in Bridgeport
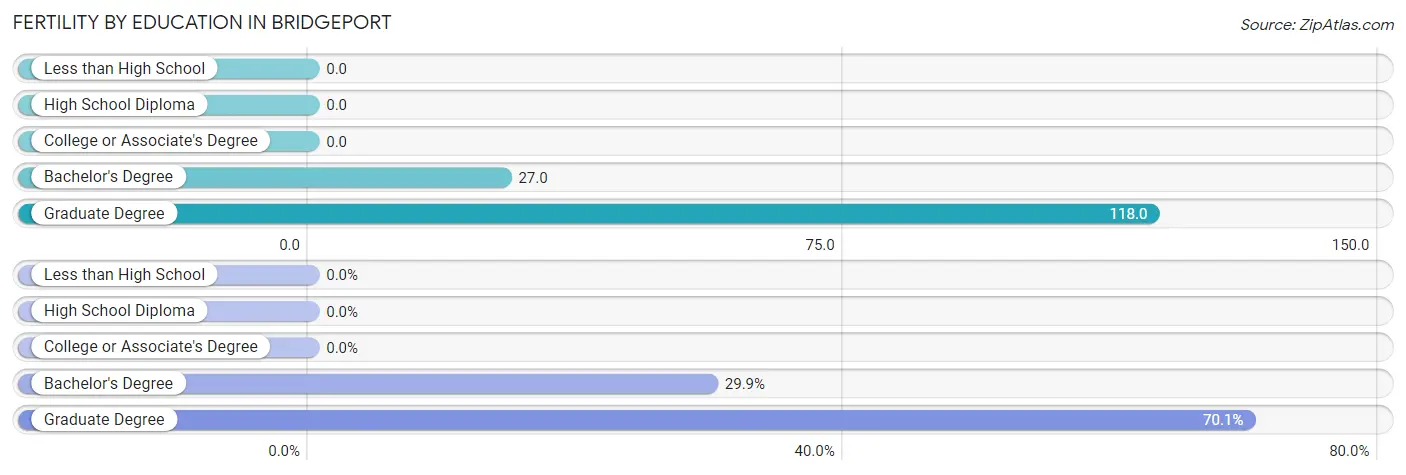
| Educational Attainment | Women with Births | Births / 1,000 Women |
| Less than High School | 0 (0.0%) | 0.0 |
| High School Diploma | 0 (0.0%) | 0.0 |
| College or Associate's Degree | 0 (0.0%) | 0.0 |
| Bachelor's Degree | 23 (29.9%) | 27.0 |
| Graduate Degree | 54 (70.1%) | 118.0 |
| Total | 77 (100.0%) | 35.0 |
Fertility by Education by Marriage Status in Bridgeport
48.0% of women with births in Bridgeport are unmarried. Women with the educational attainment of bachelor's degree are most likely to be married with 100.0% of them married at childbirth, while women with the educational attainment of graduate degree are least likely to be married with 68.5% of them unmarried at childbirth.
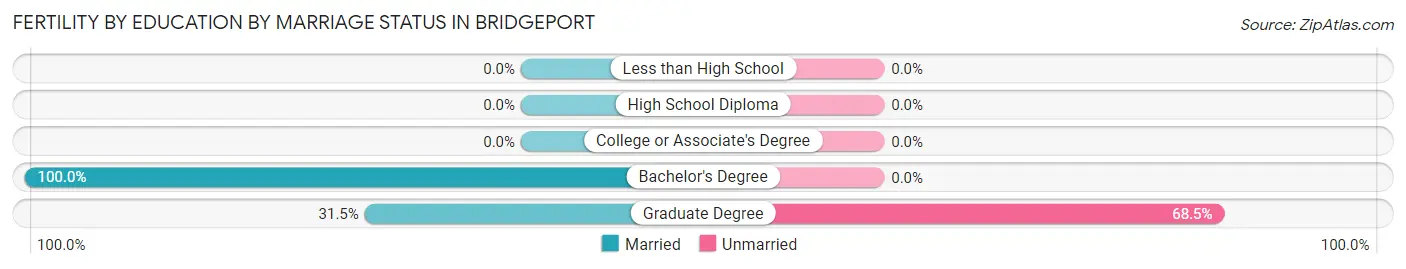
| Educational Attainment | Married | Unmarried |
| Less than High School | 0 (0.0%) | 0 (0.0%) |
| High School Diploma | 0 (0.0%) | 0 (0.0%) |
| College or Associate's Degree | 0 (0.0%) | 0 (0.0%) |
| Bachelor's Degree | 23 (100.0%) | 0 (0.0%) |
| Graduate Degree | 17 (31.5%) | 37 (68.5%) |
| Total | 40 (51.9%) | 37 (48.0%) |
Employment Characteristics in Bridgeport
Employment by Class of Employer in Bridgeport
Among the 4,599 employed individuals in Bridgeport, private company employees (2,461 | 53.5%), federal government employees (562 | 12.2%), and not-for-profit organizations (453 | 9.9%) make up the most common classes of employment.
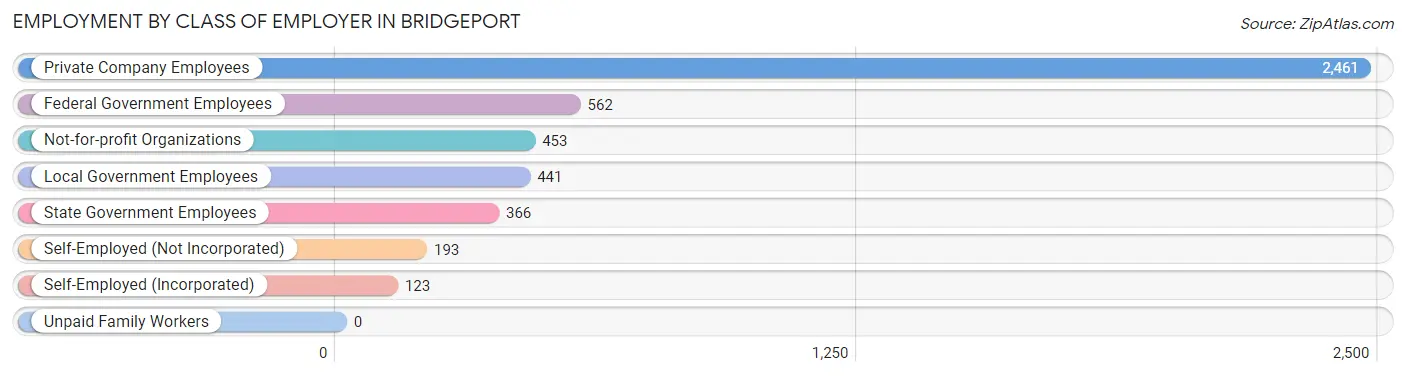
| Employer Class | # Employees | % Employees |
| Private Company Employees | 2,461 | 53.5% |
| Self-Employed (Incorporated) | 123 | 2.7% |
| Self-Employed (Not Incorporated) | 193 | 4.2% |
| Not-for-profit Organizations | 453 | 9.9% |
| Local Government Employees | 441 | 9.6% |
| State Government Employees | 366 | 8.0% |
| Federal Government Employees | 562 | 12.2% |
| Unpaid Family Workers | 0 | 0.0% |
| Total | 4,599 | 100.0% |
Employment Status by Age in Bridgeport
According to the labor force statistics for Bridgeport, out of the total population over 16 years of age (7,771), 60.6% or 4,709 individuals are in the labor force, with 1.6% or 75 of them unemployed. The age group with the highest labor force participation rate is 35 to 44 years, with 86.5% or 1,041 individuals in the labor force. Within the labor force, the 65 to 74 years age range has the highest percentage of unemployed individuals, with 8.0% or 26 of them being unemployed.
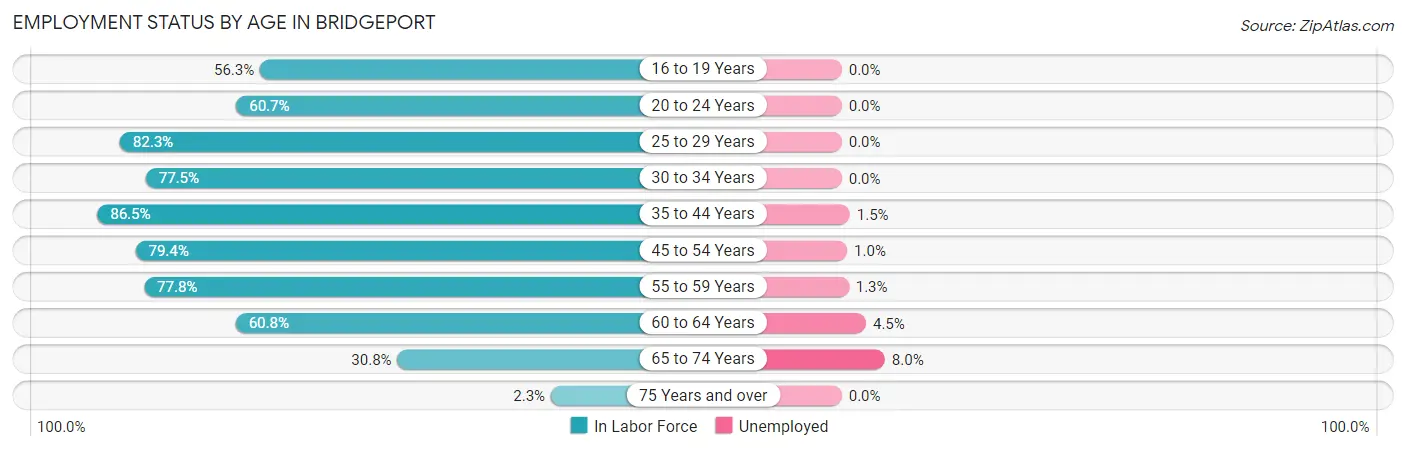
| Age Bracket | In Labor Force | Unemployed |
| 16 to 19 Years | 170 (56.3%) | 0 (0.0%) |
| 20 to 24 Years | 187 (60.7%) | 0 (0.0%) |
| 25 to 29 Years | 615 (82.3%) | 0 (0.0%) |
| 30 to 34 Years | 438 (77.5%) | 0 (0.0%) |
| 35 to 44 Years | 1,041 (86.5%) | 16 (1.5%) |
| 45 to 54 Years | 1,044 (79.4%) | 10 (1.0%) |
| 55 to 59 Years | 530 (77.8%) | 7 (1.3%) |
| 60 to 64 Years | 336 (60.8%) | 15 (4.5%) |
| 65 to 74 Years | 324 (30.8%) | 26 (8.0%) |
| 75 Years and over | 24 (2.3%) | 0 (0.0%) |
| Total | 4,709 (60.6%) | 75 (1.6%) |
Employment Status by Educational Attainment in Bridgeport
According to labor force statistics for Bridgeport, 79.1% of individuals (4,006) out of the total population between 25 and 64 years of age (5,065) are in the labor force, with 1.2% or 48 of them being unemployed. The group with the highest labor force participation rate are those with the educational attainment of bachelor's degree or higher, with 86.9% or 2,721 individuals in the labor force. Within the labor force, individuals with high school diploma education have the highest percentage of unemployment, with 2.7% or 10 of them being unemployed.
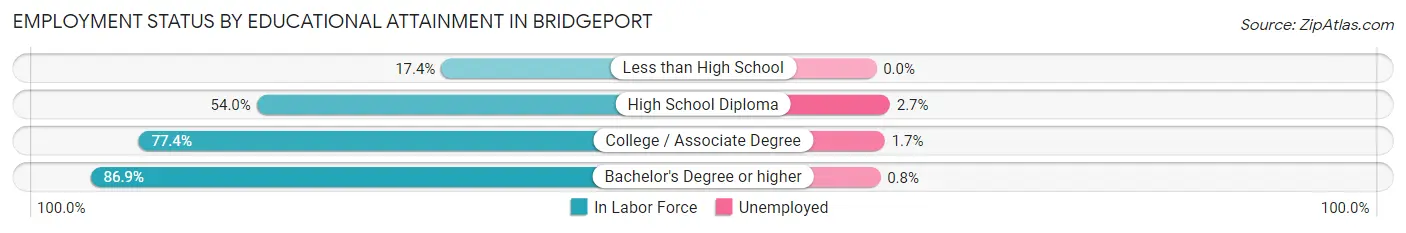
| Educational Attainment | In Labor Force | Unemployed |
| Less than High School | 16 (17.4%) | 0 (0.0%) |
| High School Diploma | 364 (54.0%) | 18 (2.7%) |
| College / Associate Degree | 904 (77.4%) | 20 (1.7%) |
| Bachelor's Degree or higher | 2,721 (86.9%) | 25 (0.8%) |
| Total | 4,006 (79.1%) | 61 (1.2%) |
Employment Occupations by Sex in Bridgeport
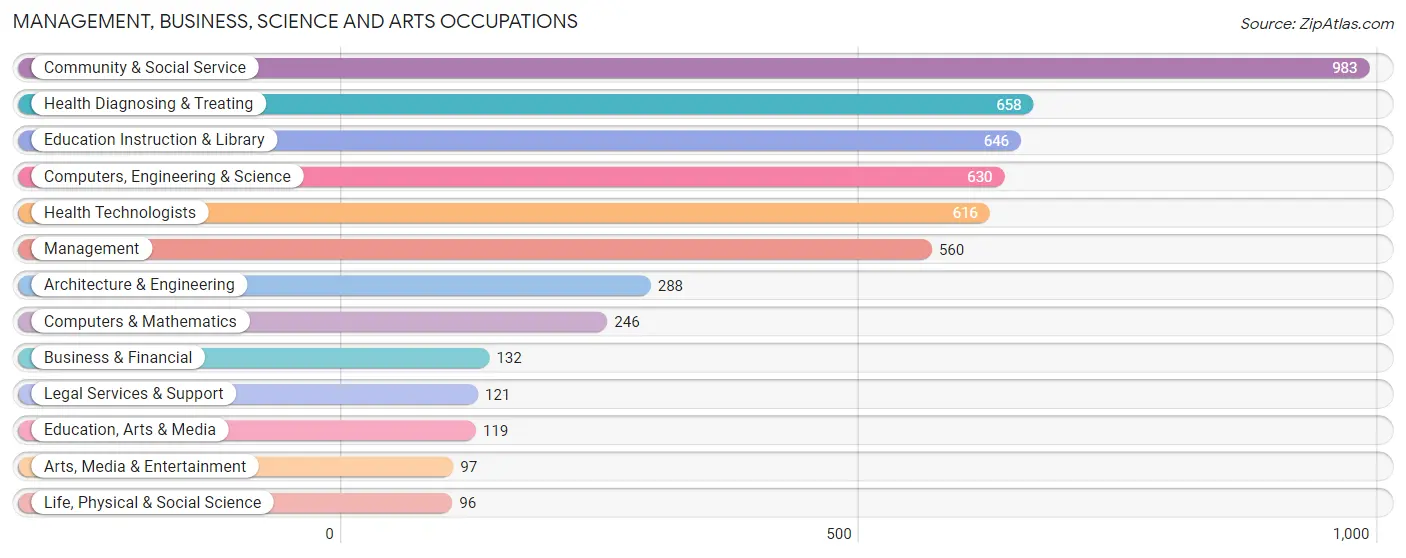
Management, Business, Science and Arts Occupations
The most common Management, Business, Science and Arts occupations in Bridgeport are Community & Social Service (983 | 21.2%), Health Diagnosing & Treating (658 | 14.2%), Education Instruction & Library (646 | 13.9%), Computers, Engineering & Science (630 | 13.6%), and Health Technologists (616 | 13.3%).
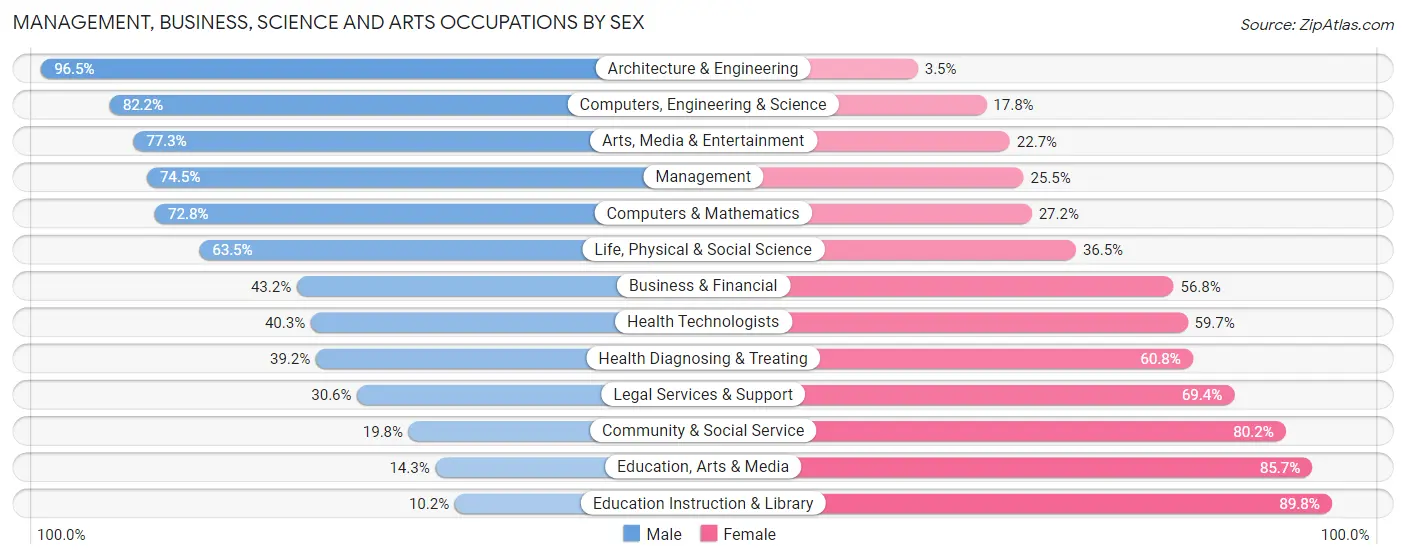
Management, Business, Science and Arts Occupations by Sex
Within the Management, Business, Science and Arts occupations in Bridgeport, the most male-oriented occupations are Architecture & Engineering (96.5%), Computers, Engineering & Science (82.2%), and Arts, Media & Entertainment (77.3%), while the most female-oriented occupations are Education Instruction & Library (89.8%), Education, Arts & Media (85.7%), and Community & Social Service (80.2%).
| Occupation | Male | Female |
| Management | 417 (74.5%) | 143 (25.5%) |
| Business & Financial | 57 (43.2%) | 75 (56.8%) |
| Computers, Engineering & Science | 518 (82.2%) | 112 (17.8%) |
| Computers & Mathematics | 179 (72.8%) | 67 (27.2%) |
| Architecture & Engineering | 278 (96.5%) | 10 (3.5%) |
| Life, Physical & Social Science | 61 (63.5%) | 35 (36.5%) |
| Community & Social Service | 195 (19.8%) | 788 (80.2%) |
| Education, Arts & Media | 17 (14.3%) | 102 (85.7%) |
| Legal Services & Support | 37 (30.6%) | 84 (69.4%) |
| Education Instruction & Library | 66 (10.2%) | 580 (89.8%) |
| Arts, Media & Entertainment | 75 (77.3%) | 22 (22.7%) |
| Health Diagnosing & Treating | 258 (39.2%) | 400 (60.8%) |
| Health Technologists | 248 (40.3%) | 368 (59.7%) |
| Total (Category) | 1,445 (48.8%) | 1,518 (51.2%) |
| Total (Overall) | 2,279 (49.2%) | 2,357 (50.8%) |
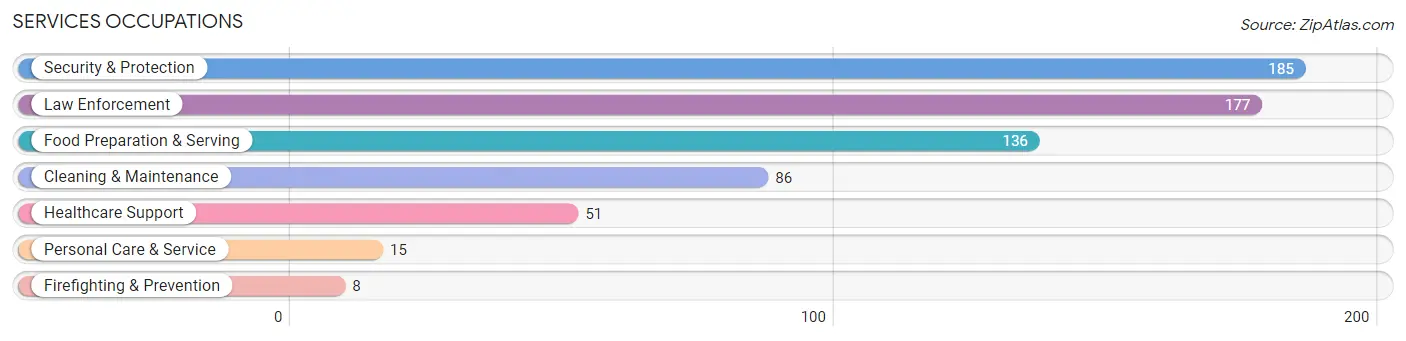
Services Occupations
The most common Services occupations in Bridgeport are Security & Protection (185 | 4.0%), Law Enforcement (177 | 3.8%), Food Preparation & Serving (136 | 2.9%), Cleaning & Maintenance (86 | 1.9%), and Healthcare Support (51 | 1.1%).
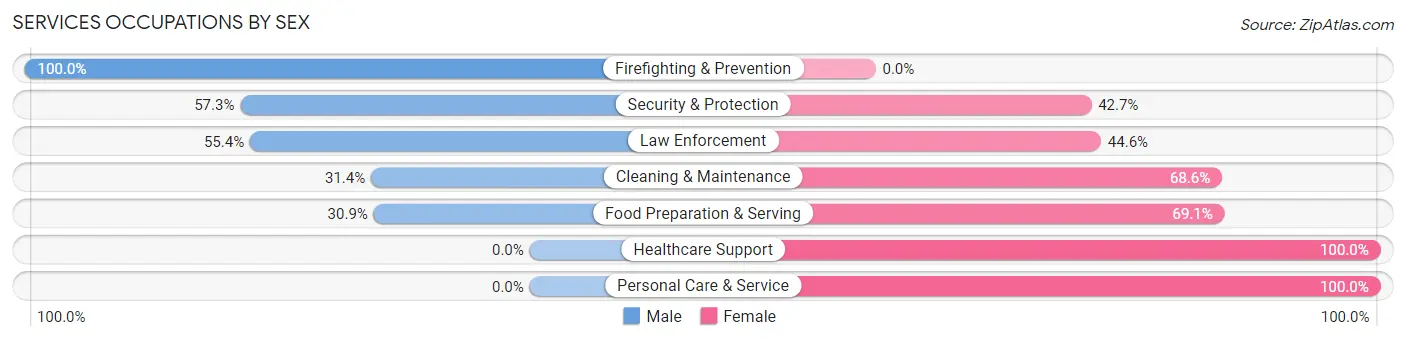
Services Occupations by Sex
Within the Services occupations in Bridgeport, the most male-oriented occupations are Firefighting & Prevention (100.0%), Security & Protection (57.3%), and Law Enforcement (55.4%), while the most female-oriented occupations are Healthcare Support (100.0%), Personal Care & Service (100.0%), and Food Preparation & Serving (69.1%).
| Occupation | Male | Female |
| Healthcare Support | 0 (0.0%) | 51 (100.0%) |
| Security & Protection | 106 (57.3%) | 79 (42.7%) |
| Firefighting & Prevention | 8 (100.0%) | 0 (0.0%) |
| Law Enforcement | 98 (55.4%) | 79 (44.6%) |
| Food Preparation & Serving | 42 (30.9%) | 94 (69.1%) |
| Cleaning & Maintenance | 27 (31.4%) | 59 (68.6%) |
| Personal Care & Service | 0 (0.0%) | 15 (100.0%) |
| Total (Category) | 175 (37.0%) | 298 (63.0%) |
| Total (Overall) | 2,279 (49.2%) | 2,357 (50.8%) |
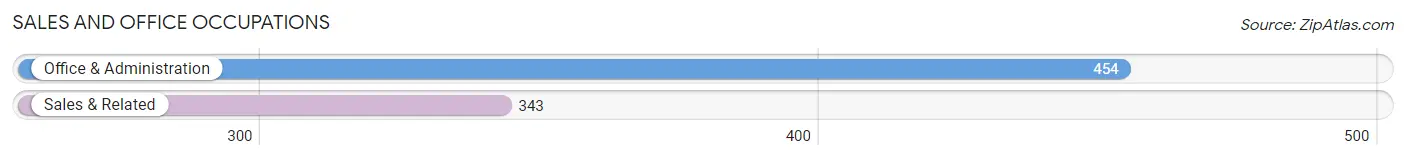
Sales and Office Occupations
The most common Sales and Office occupations in Bridgeport are Office & Administration (454 | 9.8%), and Sales & Related (343 | 7.4%).
Sales and Office Occupations by Sex
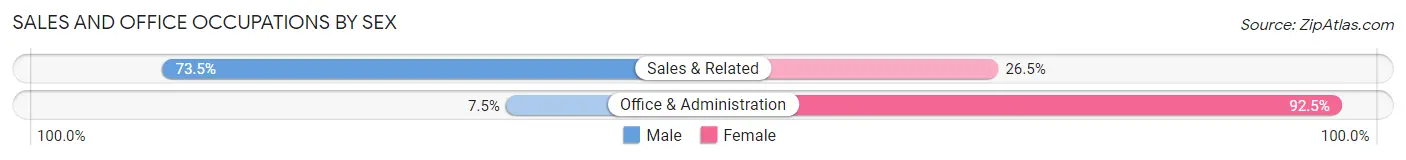
| Occupation | Male | Female |
| Sales & Related | 252 (73.5%) | 91 (26.5%) |
| Office & Administration | 34 (7.5%) | 420 (92.5%) |
| Total (Category) | 286 (35.9%) | 511 (64.1%) |
| Total (Overall) | 2,279 (49.2%) | 2,357 (50.8%) |
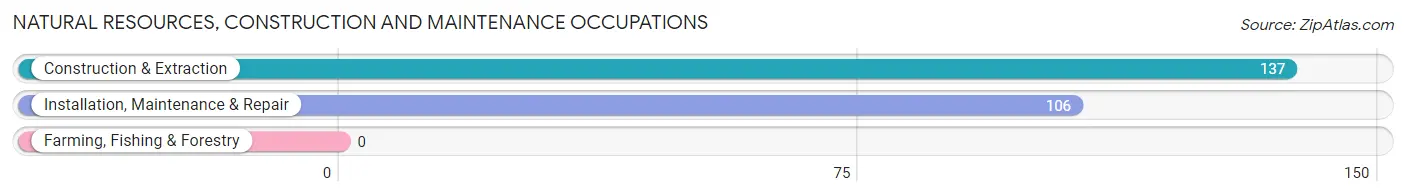
Natural Resources, Construction and Maintenance Occupations
The most common Natural Resources, Construction and Maintenance occupations in Bridgeport are Construction & Extraction (137 | 3.0%), and Installation, Maintenance & Repair (106 | 2.3%).
Natural Resources, Construction and Maintenance Occupations by Sex
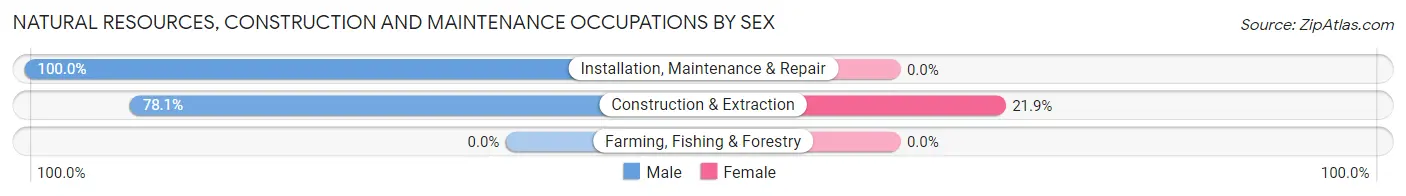
| Occupation | Male | Female |
| Farming, Fishing & Forestry | 0 (0.0%) | 0 (0.0%) |
| Construction & Extraction | 107 (78.1%) | 30 (21.9%) |
| Installation, Maintenance & Repair | 106 (100.0%) | 0 (0.0%) |
| Total (Category) | 213 (87.6%) | 30 (12.3%) |
| Total (Overall) | 2,279 (49.2%) | 2,357 (50.8%) |
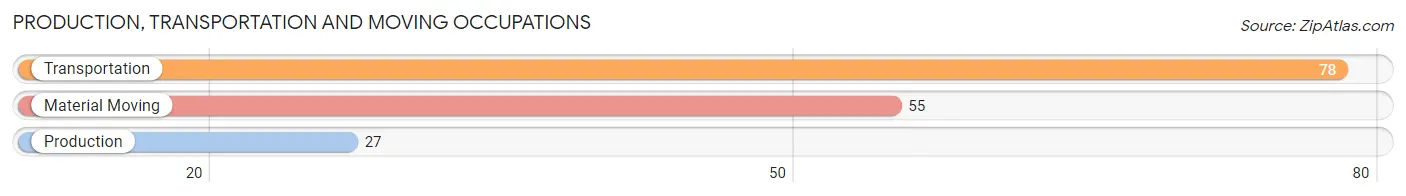
Production, Transportation and Moving Occupations
The most common Production, Transportation and Moving occupations in Bridgeport are Transportation (78 | 1.7%), Material Moving (55 | 1.2%), and Production (27 | 0.6%).
Production, Transportation and Moving Occupations by Sex
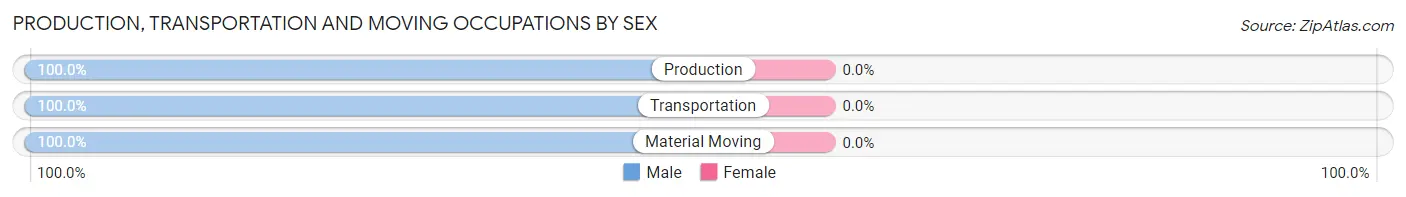
| Occupation | Male | Female |
| Production | 27 (100.0%) | 0 (0.0%) |
| Transportation | 78 (100.0%) | 0 (0.0%) |
| Material Moving | 55 (100.0%) | 0 (0.0%) |
| Total (Category) | 160 (100.0%) | 0 (0.0%) |
| Total (Overall) | 2,279 (49.2%) | 2,357 (50.8%) |
Employment Industries by Sex in Bridgeport
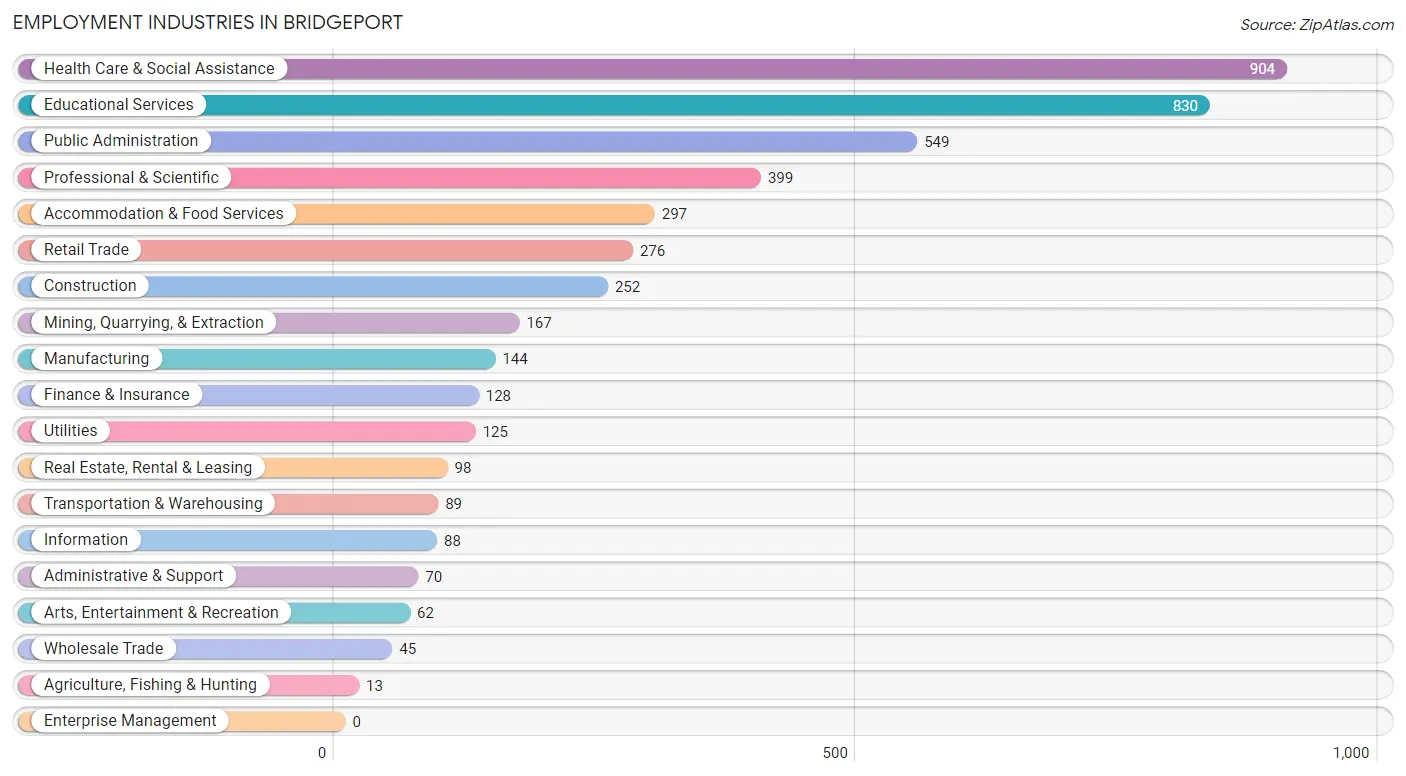
Employment Industries in Bridgeport
The major employment industries in Bridgeport include Health Care & Social Assistance (904 | 19.5%), Educational Services (830 | 17.9%), Public Administration (549 | 11.8%), Professional & Scientific (399 | 8.6%), and Accommodation & Food Services (297 | 6.4%).
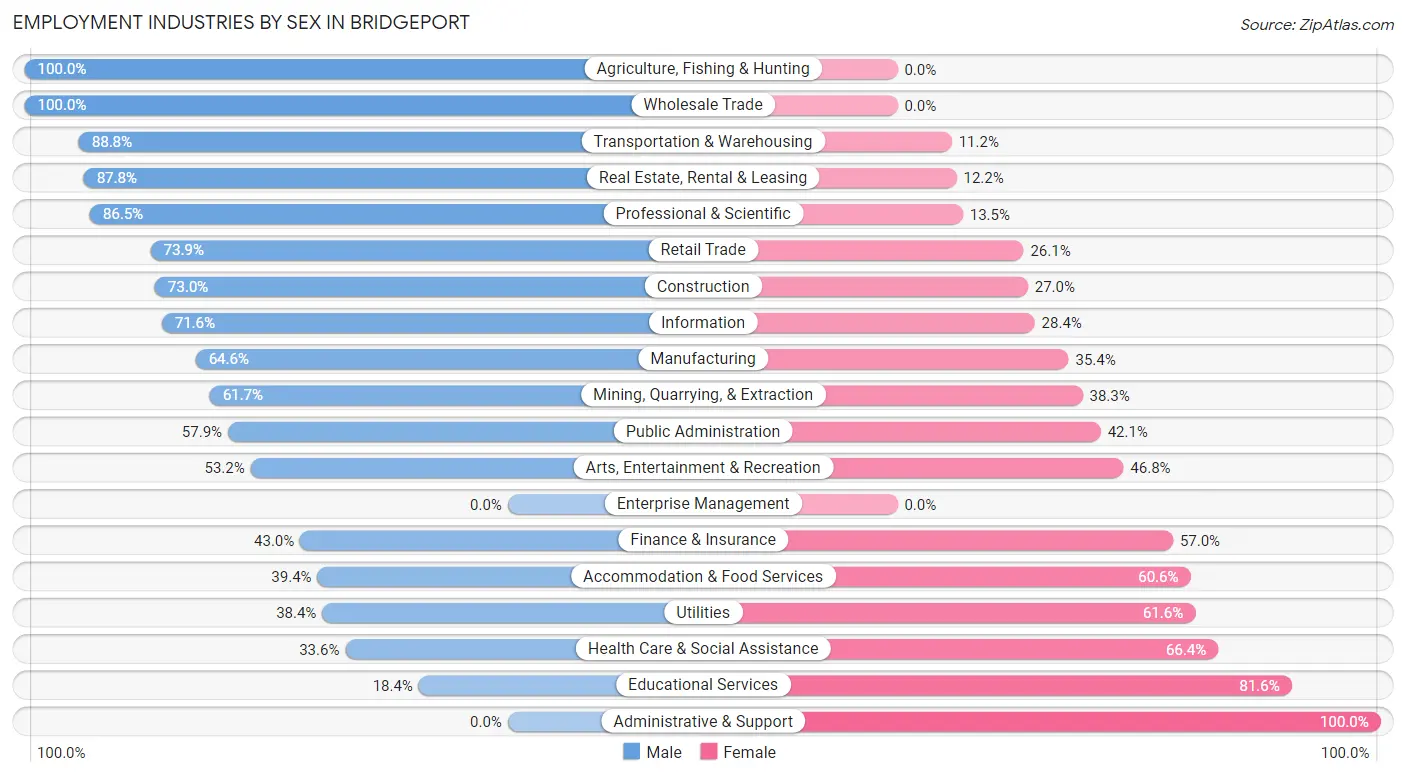
Employment Industries by Sex in Bridgeport
The Bridgeport industries that see more men than women are Agriculture, Fishing & Hunting (100.0%), Wholesale Trade (100.0%), and Transportation & Warehousing (88.8%), whereas the industries that tend to have a higher number of women are Administrative & Support (100.0%), Educational Services (81.6%), and Health Care & Social Assistance (66.4%).
| Industry | Male | Female |
| Agriculture, Fishing & Hunting | 13 (100.0%) | 0 (0.0%) |
| Mining, Quarrying, & Extraction | 103 (61.7%) | 64 (38.3%) |
| Construction | 184 (73.0%) | 68 (27.0%) |
| Manufacturing | 93 (64.6%) | 51 (35.4%) |
| Wholesale Trade | 45 (100.0%) | 0 (0.0%) |
| Retail Trade | 204 (73.9%) | 72 (26.1%) |
| Transportation & Warehousing | 79 (88.8%) | 10 (11.2%) |
| Utilities | 48 (38.4%) | 77 (61.6%) |
| Information | 63 (71.6%) | 25 (28.4%) |
| Finance & Insurance | 55 (43.0%) | 73 (57.0%) |
| Real Estate, Rental & Leasing | 86 (87.8%) | 12 (12.2%) |
| Professional & Scientific | 345 (86.5%) | 54 (13.5%) |
| Enterprise Management | 0 (0.0%) | 0 (0.0%) |
| Administrative & Support | 0 (0.0%) | 70 (100.0%) |
| Educational Services | 153 (18.4%) | 677 (81.6%) |
| Health Care & Social Assistance | 304 (33.6%) | 600 (66.4%) |
| Arts, Entertainment & Recreation | 33 (53.2%) | 29 (46.8%) |
| Accommodation & Food Services | 117 (39.4%) | 180 (60.6%) |
| Public Administration | 318 (57.9%) | 231 (42.1%) |
| Total | 2,279 (49.2%) | 2,357 (50.8%) |
Education in Bridgeport
School Enrollment in Bridgeport
The most common levels of schooling among the 1,645 students in Bridgeport are high school (449 | 27.3%), elementary school (343 | 20.8%), and middle school (284 | 17.3%).
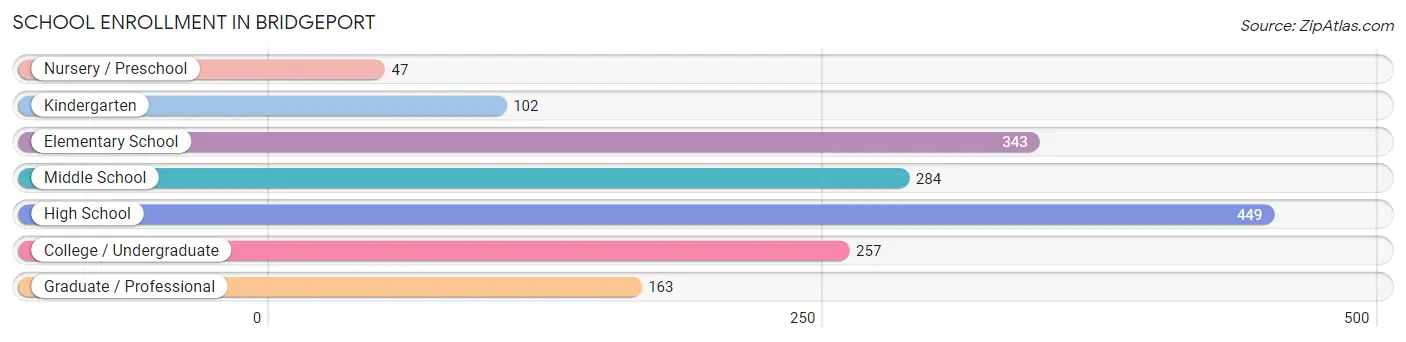
| School Level | # Students | % Students |
| Nursery / Preschool | 47 | 2.9% |
| Kindergarten | 102 | 6.2% |
| Elementary School | 343 | 20.8% |
| Middle School | 284 | 17.3% |
| High School | 449 | 27.3% |
| College / Undergraduate | 257 | 15.6% |
| Graduate / Professional | 163 | 9.9% |
| Total | 1,645 | 100.0% |
School Enrollment by Age by Funding Source in Bridgeport
Out of a total of 1,645 students who are enrolled in schools in Bridgeport, 160 (9.7%) attend a private institution, while the remaining 1,485 (90.3%) are enrolled in public schools. The age group of 35 years and over has the highest likelihood of being enrolled in private schools, with 23 (46.0% in the age bracket) enrolled. Conversely, the age group of 3 to 4 year olds has the lowest likelihood of being enrolled in a private school, with 32 (100.0% in the age bracket) attending a public institution.
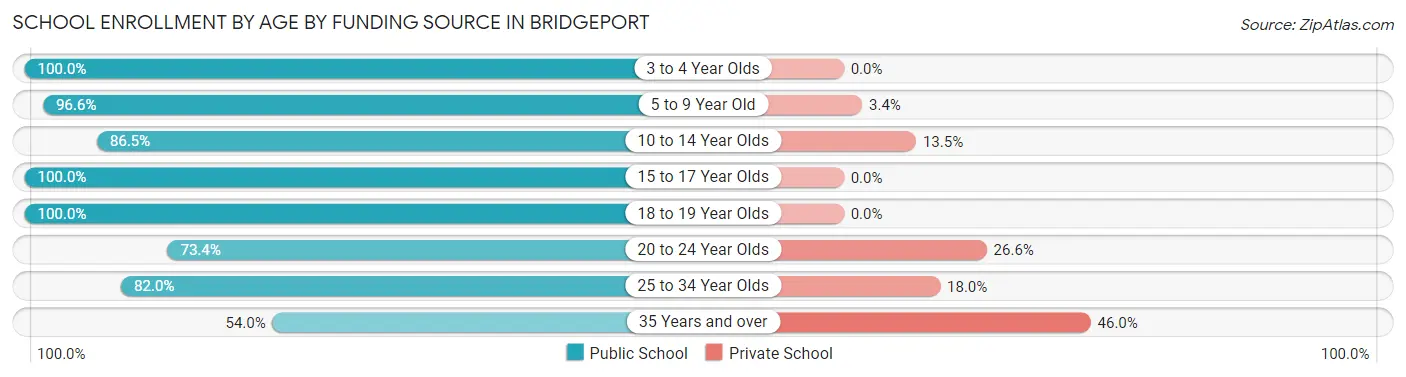
| Age Bracket | Public School | Private School |
| 3 to 4 Year Olds | 32 (100.0%) | 0 (0.0%) |
| 5 to 9 Year Old | 422 (96.6%) | 15 (3.4%) |
| 10 to 14 Year Olds | 302 (86.5%) | 47 (13.5%) |
| 15 to 17 Year Olds | 355 (100.0%) | 0 (0.0%) |
| 18 to 19 Year Olds | 86 (100.0%) | 0 (0.0%) |
| 20 to 24 Year Olds | 124 (73.4%) | 45 (26.6%) |
| 25 to 34 Year Olds | 137 (82.0%) | 30 (18.0%) |
| 35 Years and over | 27 (54.0%) | 23 (46.0%) |
| Total | 1,485 (90.3%) | 160 (9.7%) |
Educational Attainment by Field of Study in Bridgeport
Education (1,113 | 27.4%), business (751 | 18.4%), science & technology (597 | 14.7%), engineering (461 | 11.3%), and arts & humanities (241 | 5.9%) are the most common fields of study among 4,070 individuals in Bridgeport who have obtained a bachelor's degree or higher.
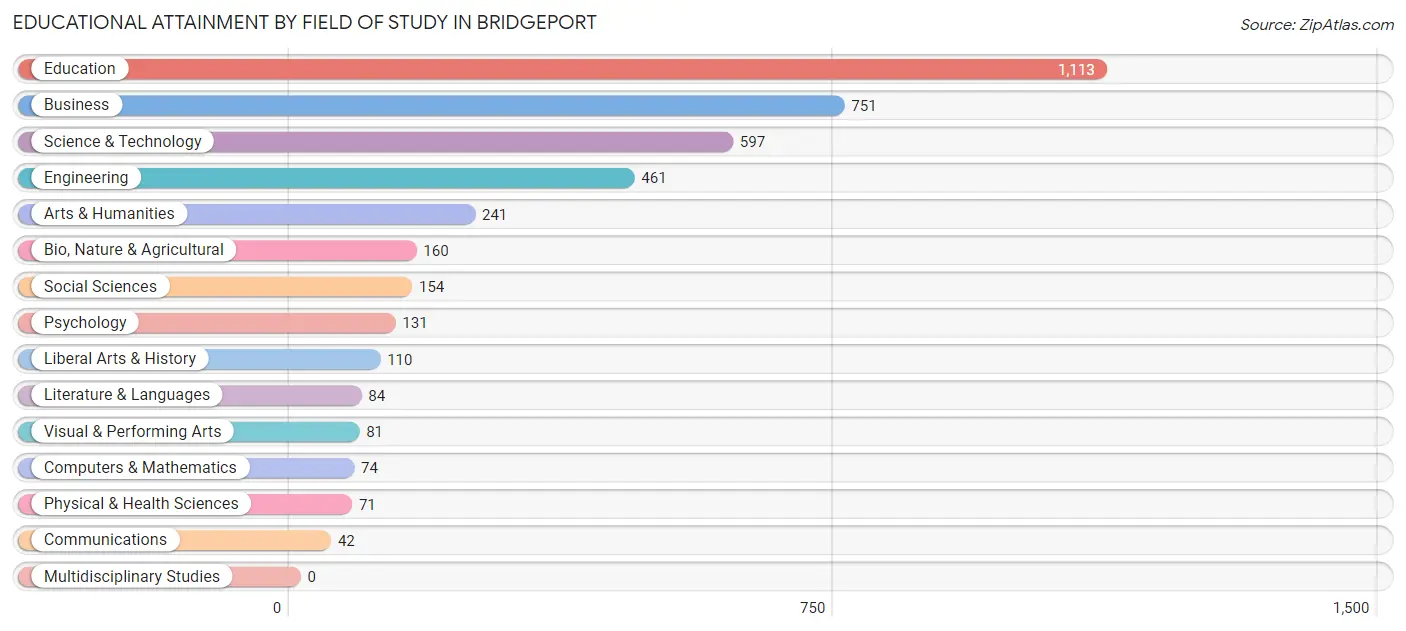
| Field of Study | # Graduates | % Graduates |
| Computers & Mathematics | 74 | 1.8% |
| Bio, Nature & Agricultural | 160 | 3.9% |
| Physical & Health Sciences | 71 | 1.7% |
| Psychology | 131 | 3.2% |
| Social Sciences | 154 | 3.8% |
| Engineering | 461 | 11.3% |
| Multidisciplinary Studies | 0 | 0.0% |
| Science & Technology | 597 | 14.7% |
| Business | 751 | 18.4% |
| Education | 1,113 | 27.4% |
| Literature & Languages | 84 | 2.1% |
| Liberal Arts & History | 110 | 2.7% |
| Visual & Performing Arts | 81 | 2.0% |
| Communications | 42 | 1.0% |
| Arts & Humanities | 241 | 5.9% |
| Total | 4,070 | 100.0% |
Transportation & Commute in Bridgeport
Vehicle Availability by Sex in Bridgeport
The most prevalent vehicle ownership categories in Bridgeport are males with 2 vehicles (1,115, accounting for 49.0%) and females with 2 vehicles (1,002, making up 48.0%).
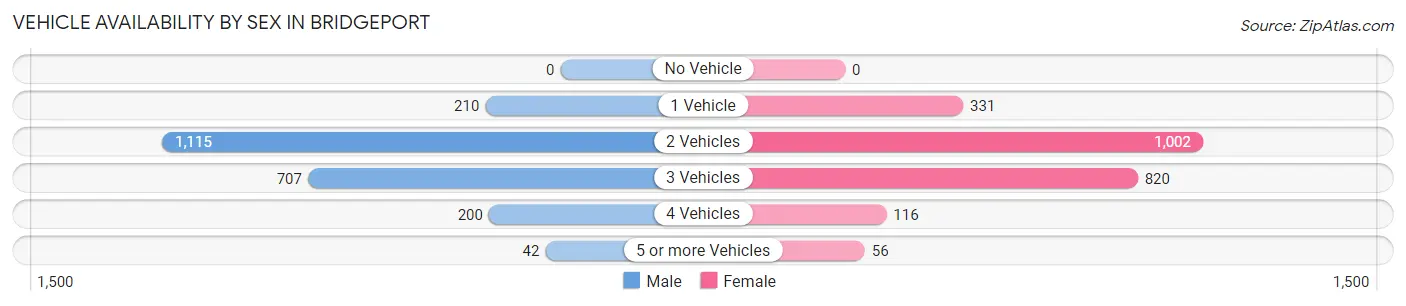
| Vehicles Available | Male | Female |
| No Vehicle | 0 (0.0%) | 0 (0.0%) |
| 1 Vehicle | 210 (9.2%) | 331 (14.2%) |
| 2 Vehicles | 1,115 (49.0%) | 1,002 (43.1%) |
| 3 Vehicles | 707 (31.1%) | 820 (35.3%) |
| 4 Vehicles | 200 (8.8%) | 116 (5.0%) |
| 5 or more Vehicles | 42 (1.8%) | 56 (2.4%) |
| Total | 2,274 (100.0%) | 2,325 (100.0%) |
Commute Time in Bridgeport
The most frequently occuring commute durations in Bridgeport are 10 to 14 minutes (1,058 commuters, 24.9%), 15 to 19 minutes (909 commuters, 21.4%), and 5 to 9 minutes (720 commuters, 16.9%).
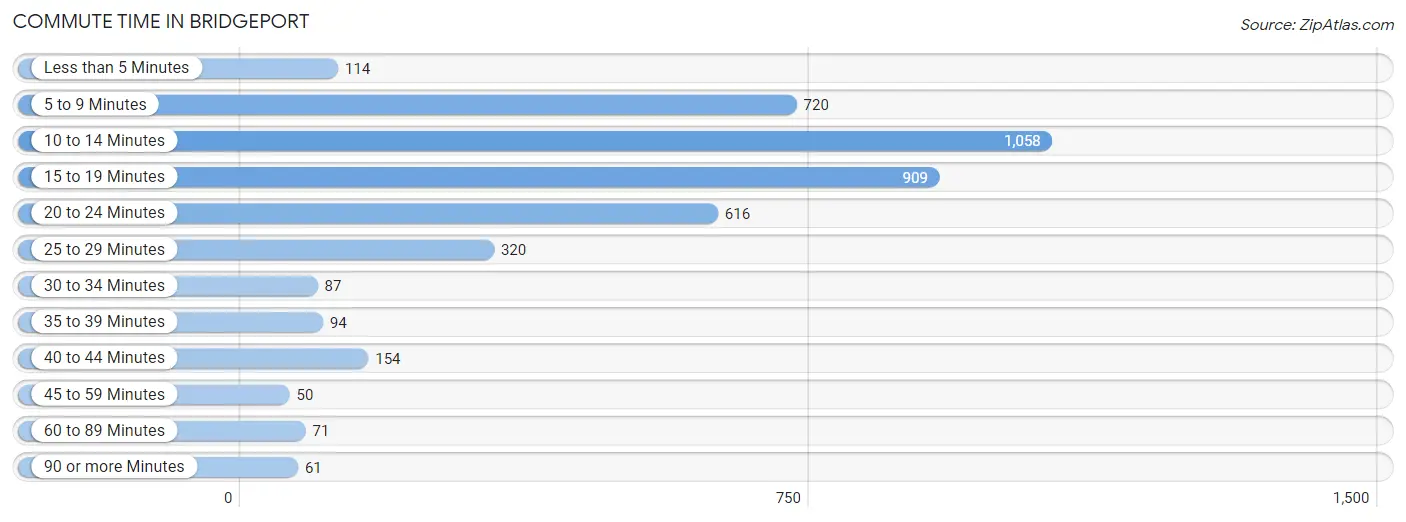
| Commute Time | # Commuters | % Commuters |
| Less than 5 Minutes | 114 | 2.7% |
| 5 to 9 Minutes | 720 | 16.9% |
| 10 to 14 Minutes | 1,058 | 24.9% |
| 15 to 19 Minutes | 909 | 21.4% |
| 20 to 24 Minutes | 616 | 14.5% |
| 25 to 29 Minutes | 320 | 7.5% |
| 30 to 34 Minutes | 87 | 2.1% |
| 35 to 39 Minutes | 94 | 2.2% |
| 40 to 44 Minutes | 154 | 3.6% |
| 45 to 59 Minutes | 50 | 1.2% |
| 60 to 89 Minutes | 71 | 1.7% |
| 90 or more Minutes | 61 | 1.4% |
Commute Time by Sex in Bridgeport
The most common commute times in Bridgeport are 10 to 14 minutes (580 commuters, 27.3%) for males and 10 to 14 minutes (478 commuters, 22.4%) for females.
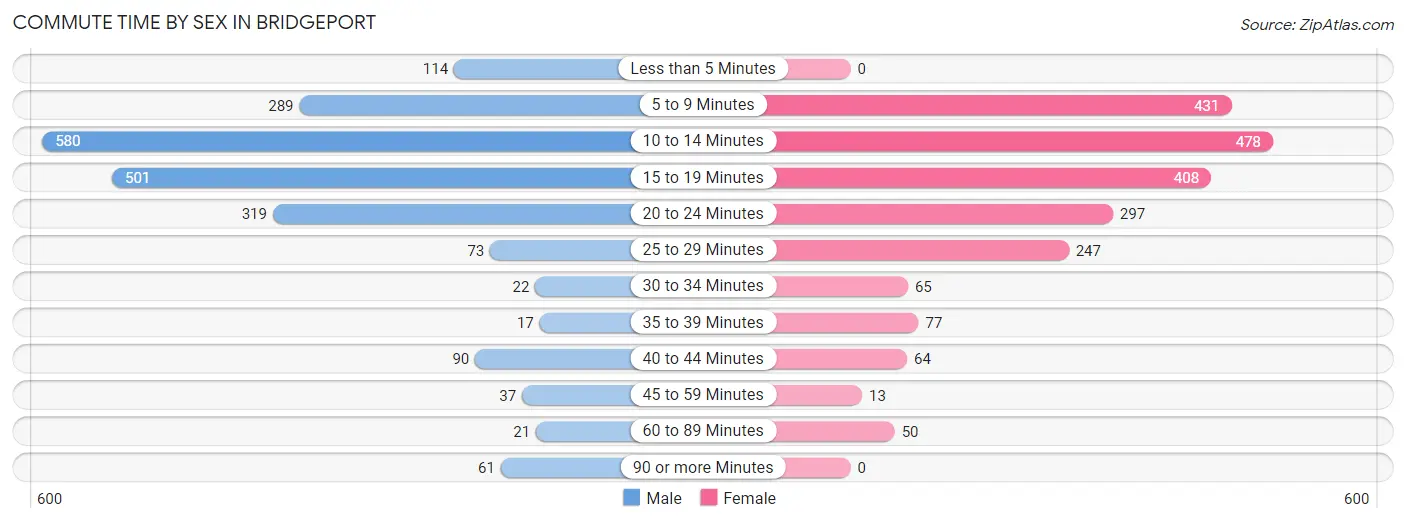
| Commute Time | Male | Female |
| Less than 5 Minutes | 114 (5.4%) | 0 (0.0%) |
| 5 to 9 Minutes | 289 (13.6%) | 431 (20.2%) |
| 10 to 14 Minutes | 580 (27.3%) | 478 (22.4%) |
| 15 to 19 Minutes | 501 (23.6%) | 408 (19.2%) |
| 20 to 24 Minutes | 319 (15.0%) | 297 (13.9%) |
| 25 to 29 Minutes | 73 (3.4%) | 247 (11.6%) |
| 30 to 34 Minutes | 22 (1.0%) | 65 (3.0%) |
| 35 to 39 Minutes | 17 (0.8%) | 77 (3.6%) |
| 40 to 44 Minutes | 90 (4.2%) | 64 (3.0%) |
| 45 to 59 Minutes | 37 (1.7%) | 13 (0.6%) |
| 60 to 89 Minutes | 21 (1.0%) | 50 (2.4%) |
| 90 or more Minutes | 61 (2.9%) | 0 (0.0%) |
Time of Departure to Work by Sex in Bridgeport
The most frequent times of departure to work in Bridgeport are 7:30 AM to 7:59 AM (417, 19.6%) for males and 7:00 AM to 7:29 AM (637, 29.9%) for females.
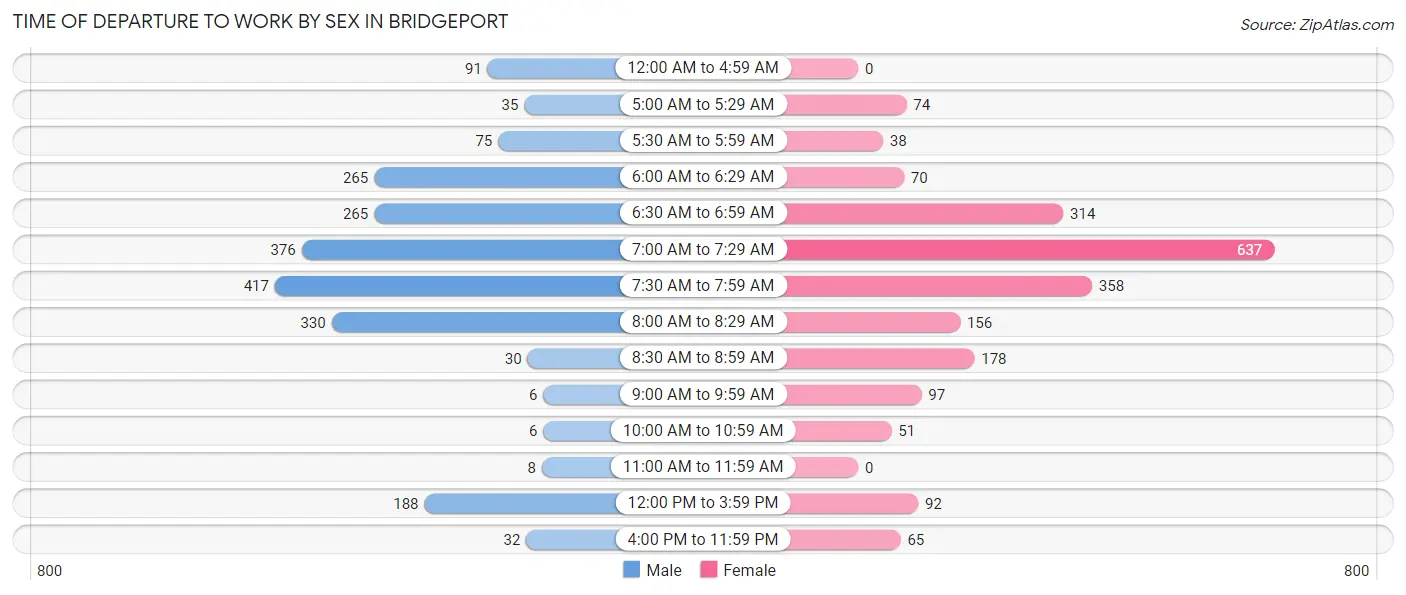
| Time of Departure | Male | Female |
| 12:00 AM to 4:59 AM | 91 (4.3%) | 0 (0.0%) |
| 5:00 AM to 5:29 AM | 35 (1.7%) | 74 (3.5%) |
| 5:30 AM to 5:59 AM | 75 (3.5%) | 38 (1.8%) |
| 6:00 AM to 6:29 AM | 265 (12.5%) | 70 (3.3%) |
| 6:30 AM to 6:59 AM | 265 (12.5%) | 314 (14.7%) |
| 7:00 AM to 7:29 AM | 376 (17.7%) | 637 (29.9%) |
| 7:30 AM to 7:59 AM | 417 (19.6%) | 358 (16.8%) |
| 8:00 AM to 8:29 AM | 330 (15.5%) | 156 (7.3%) |
| 8:30 AM to 8:59 AM | 30 (1.4%) | 178 (8.4%) |
| 9:00 AM to 9:59 AM | 6 (0.3%) | 97 (4.5%) |
| 10:00 AM to 10:59 AM | 6 (0.3%) | 51 (2.4%) |
| 11:00 AM to 11:59 AM | 8 (0.4%) | 0 (0.0%) |
| 12:00 PM to 3:59 PM | 188 (8.8%) | 92 (4.3%) |
| 4:00 PM to 11:59 PM | 32 (1.5%) | 65 (3.0%) |
| Total | 2,124 (100.0%) | 2,130 (100.0%) |
Housing Occupancy in Bridgeport
Occupancy by Ownership in Bridgeport
Of the total 3,738 dwellings in Bridgeport, owner-occupied units account for 2,781 (74.4%), while renter-occupied units make up 957 (25.6%).
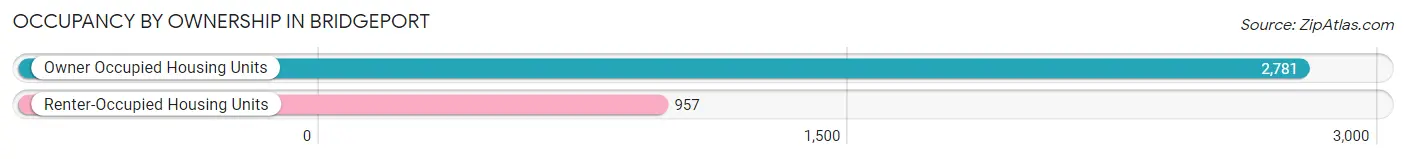
| Occupancy | # Housing Units | % Housing Units |
| Owner Occupied Housing Units | 2,781 | 74.4% |
| Renter-Occupied Housing Units | 957 | 25.6% |
| Total Occupied Housing Units | 3,738 | 100.0% |
Occupancy by Household Size in Bridgeport
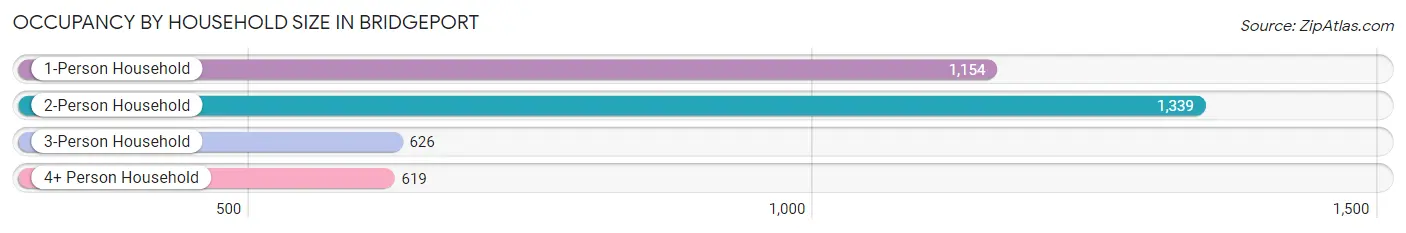
| Household Size | # Housing Units | % Housing Units |
| 1-Person Household | 1,154 | 30.9% |
| 2-Person Household | 1,339 | 35.8% |
| 3-Person Household | 626 | 16.8% |
| 4+ Person Household | 619 | 16.6% |
| Total Housing Units | 3,738 | 100.0% |
Occupancy by Ownership by Household Size in Bridgeport
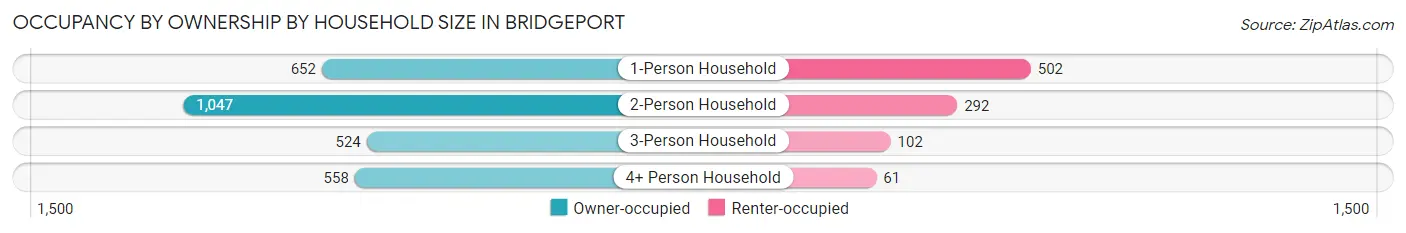
| Household Size | Owner-occupied | Renter-occupied |
| 1-Person Household | 652 (56.5%) | 502 (43.5%) |
| 2-Person Household | 1,047 (78.2%) | 292 (21.8%) |
| 3-Person Household | 524 (83.7%) | 102 (16.3%) |
| 4+ Person Household | 558 (90.1%) | 61 (9.9%) |
| Total Housing Units | 2,781 (74.4%) | 957 (25.6%) |
Occupancy by Educational Attainment in Bridgeport
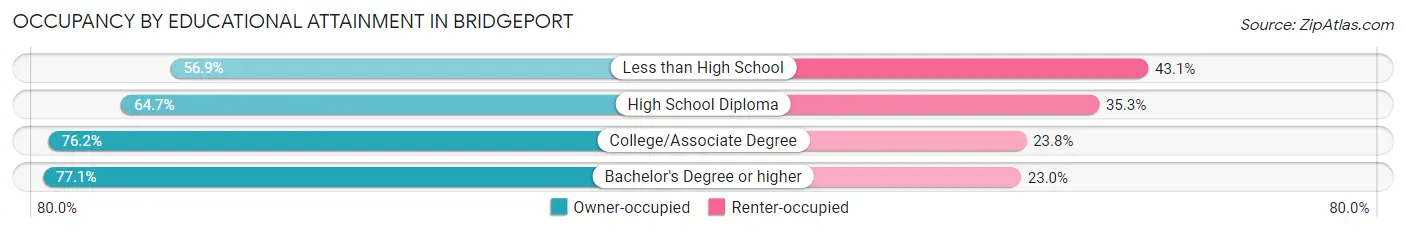
| Household Size | Owner-occupied | Renter-occupied |
| Less than High School | 58 (56.9%) | 44 (43.1%) |
| High School Diploma | 366 (64.7%) | 200 (35.3%) |
| College/Associate Degree | 749 (76.2%) | 234 (23.8%) |
| Bachelor's Degree or higher | 1,608 (77.0%) | 479 (23.0%) |
Occupancy by Age of Householder in Bridgeport
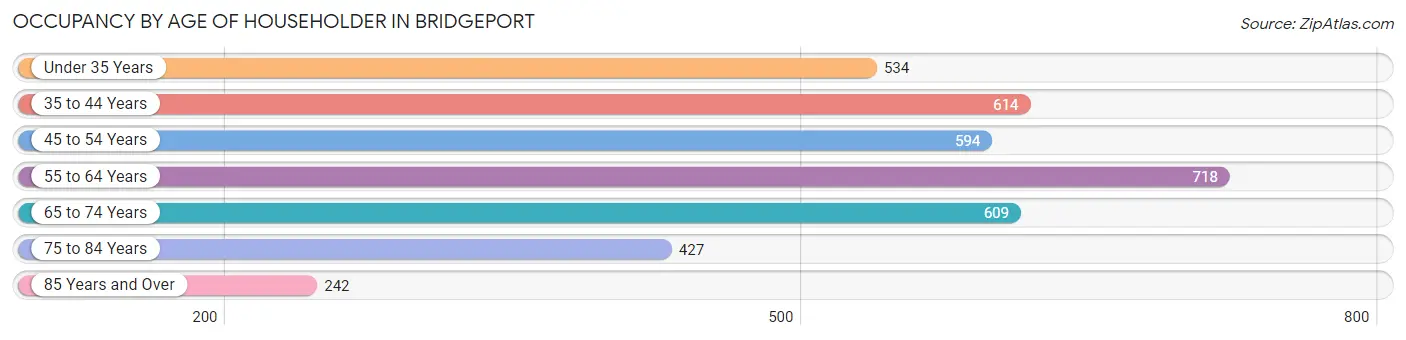
| Age Bracket | # Households | % Households |
| Under 35 Years | 534 | 14.3% |
| 35 to 44 Years | 614 | 16.4% |
| 45 to 54 Years | 594 | 15.9% |
| 55 to 64 Years | 718 | 19.2% |
| 65 to 74 Years | 609 | 16.3% |
| 75 to 84 Years | 427 | 11.4% |
| 85 Years and Over | 242 | 6.5% |
| Total | 3,738 | 100.0% |
Housing Finances in Bridgeport
Median Income by Occupancy in Bridgeport
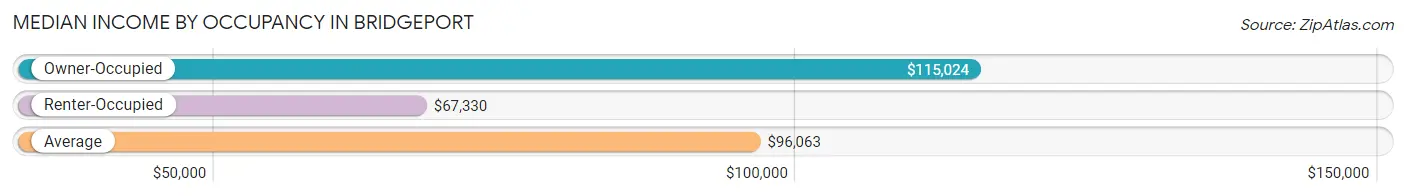
| Occupancy Type | # Households | Median Income |
| Owner-Occupied | 2,781 (74.4%) | $115,024 |
| Renter-Occupied | 957 (25.6%) | $67,330 |
| Average | 3,738 (100.0%) | $96,063 |
Occupancy by Householder Income Bracket in Bridgeport
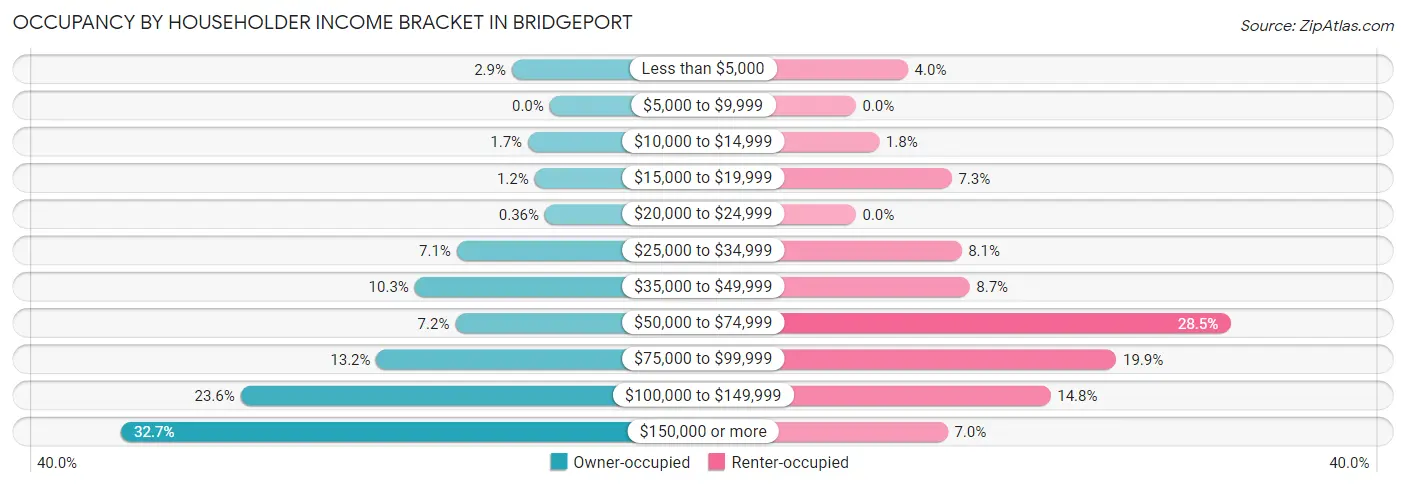
| Income Bracket | Owner-occupied | Renter-occupied |
| Less than $5,000 | 80 (2.9%) | 38 (4.0%) |
| $5,000 to $9,999 | 0 (0.0%) | 0 (0.0%) |
| $10,000 to $14,999 | 46 (1.7%) | 17 (1.8%) |
| $15,000 to $19,999 | 32 (1.1%) | 70 (7.3%) |
| $20,000 to $24,999 | 10 (0.4%) | 0 (0.0%) |
| $25,000 to $34,999 | 197 (7.1%) | 77 (8.1%) |
| $35,000 to $49,999 | 286 (10.3%) | 83 (8.7%) |
| $50,000 to $74,999 | 200 (7.2%) | 273 (28.5%) |
| $75,000 to $99,999 | 367 (13.2%) | 190 (19.9%) |
| $100,000 to $149,999 | 655 (23.5%) | 142 (14.8%) |
| $150,000 or more | 908 (32.7%) | 67 (7.0%) |
| Total | 2,781 (100.0%) | 957 (100.0%) |
Monthly Housing Cost Tiers in Bridgeport
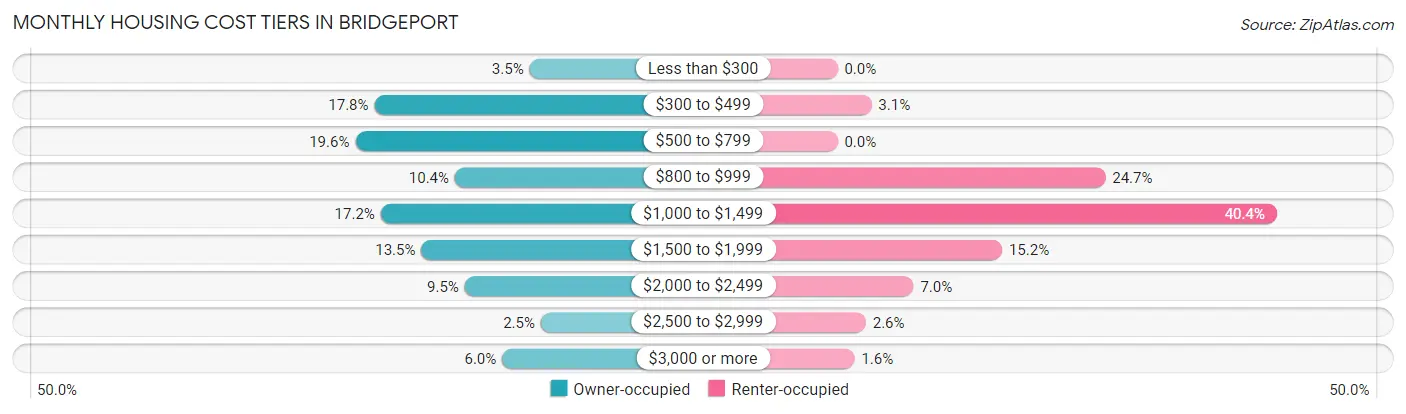
| Monthly Cost | Owner-occupied | Renter-occupied |
| Less than $300 | 98 (3.5%) | 0 (0.0%) |
| $300 to $499 | 495 (17.8%) | 30 (3.1%) |
| $500 to $799 | 544 (19.6%) | 0 (0.0%) |
| $800 to $999 | 289 (10.4%) | 236 (24.7%) |
| $1,000 to $1,499 | 479 (17.2%) | 387 (40.4%) |
| $1,500 to $1,999 | 375 (13.5%) | 145 (15.1%) |
| $2,000 to $2,499 | 264 (9.5%) | 67 (7.0%) |
| $2,500 to $2,999 | 69 (2.5%) | 25 (2.6%) |
| $3,000 or more | 168 (6.0%) | 15 (1.6%) |
| Total | 2,781 (100.0%) | 957 (100.0%) |
Physical Housing Characteristics in Bridgeport
Housing Structures in Bridgeport
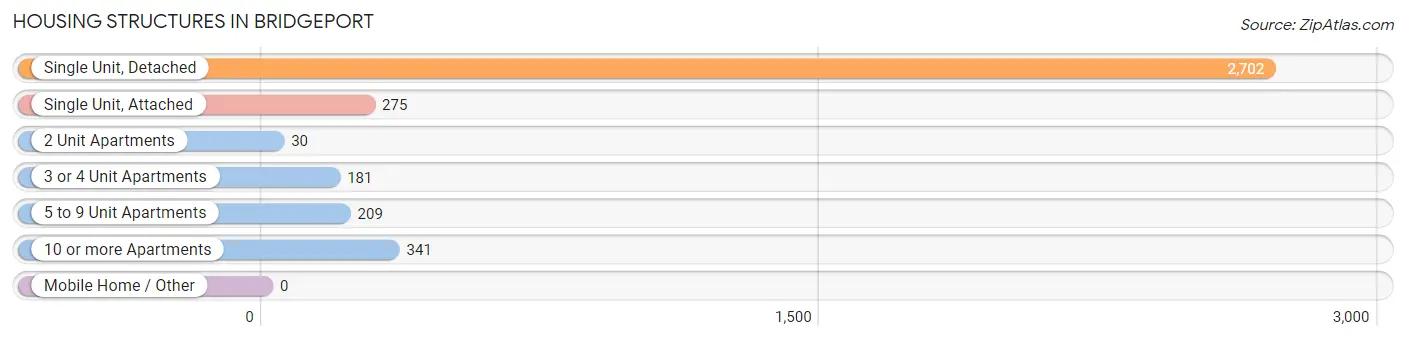
| Structure Type | # Housing Units | % Housing Units |
| Single Unit, Detached | 2,702 | 72.3% |
| Single Unit, Attached | 275 | 7.4% |
| 2 Unit Apartments | 30 | 0.8% |
| 3 or 4 Unit Apartments | 181 | 4.8% |
| 5 to 9 Unit Apartments | 209 | 5.6% |
| 10 or more Apartments | 341 | 9.1% |
| Mobile Home / Other | 0 | 0.0% |
| Total | 3,738 | 100.0% |
Housing Structures by Occupancy in Bridgeport
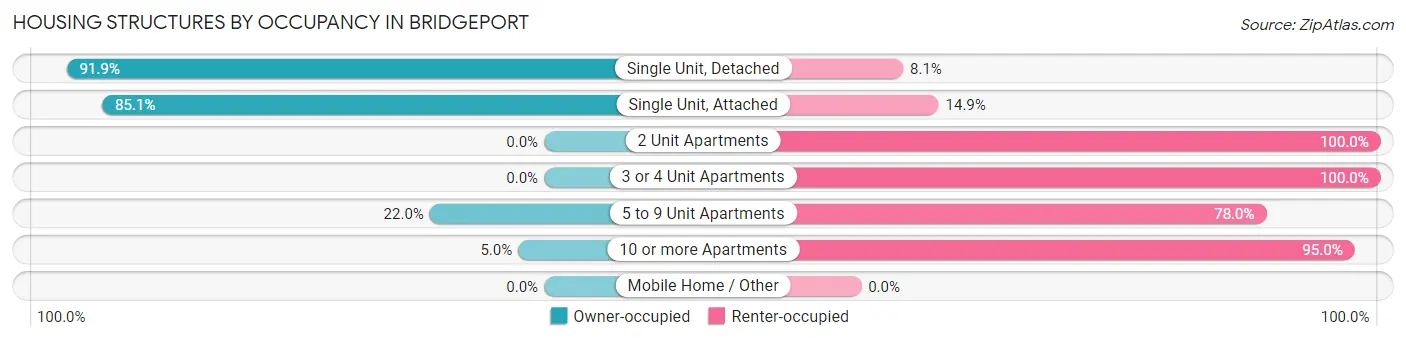
| Structure Type | Owner-occupied | Renter-occupied |
| Single Unit, Detached | 2,484 (91.9%) | 218 (8.1%) |
| Single Unit, Attached | 234 (85.1%) | 41 (14.9%) |
| 2 Unit Apartments | 0 (0.0%) | 30 (100.0%) |
| 3 or 4 Unit Apartments | 0 (0.0%) | 181 (100.0%) |
| 5 to 9 Unit Apartments | 46 (22.0%) | 163 (78.0%) |
| 10 or more Apartments | 17 (5.0%) | 324 (95.0%) |
| Mobile Home / Other | 0 (0.0%) | 0 (0.0%) |
| Total | 2,781 (74.4%) | 957 (25.6%) |
Housing Structures by Number of Rooms in Bridgeport
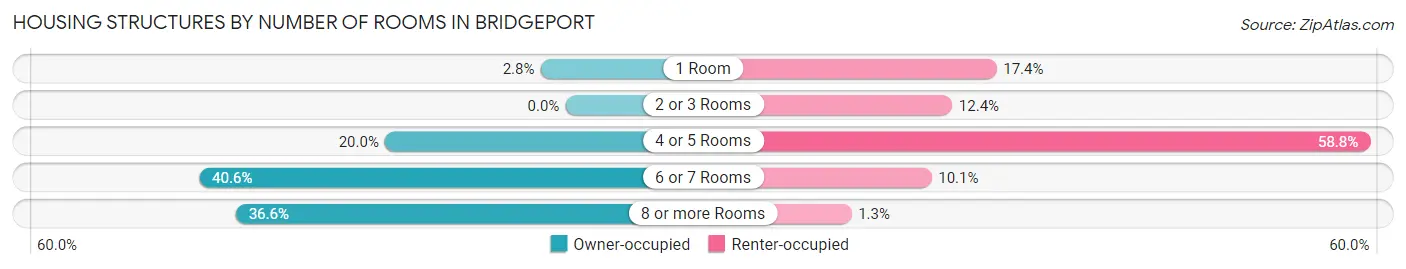
| Number of Rooms | Owner-occupied | Renter-occupied |
| 1 Room | 77 (2.8%) | 166 (17.3%) |
| 2 or 3 Rooms | 0 (0.0%) | 119 (12.4%) |
| 4 or 5 Rooms | 557 (20.0%) | 563 (58.8%) |
| 6 or 7 Rooms | 1,130 (40.6%) | 97 (10.1%) |
| 8 or more Rooms | 1,017 (36.6%) | 12 (1.3%) |
| Total | 2,781 (100.0%) | 957 (100.0%) |
Housing Structure by Heating Type in Bridgeport
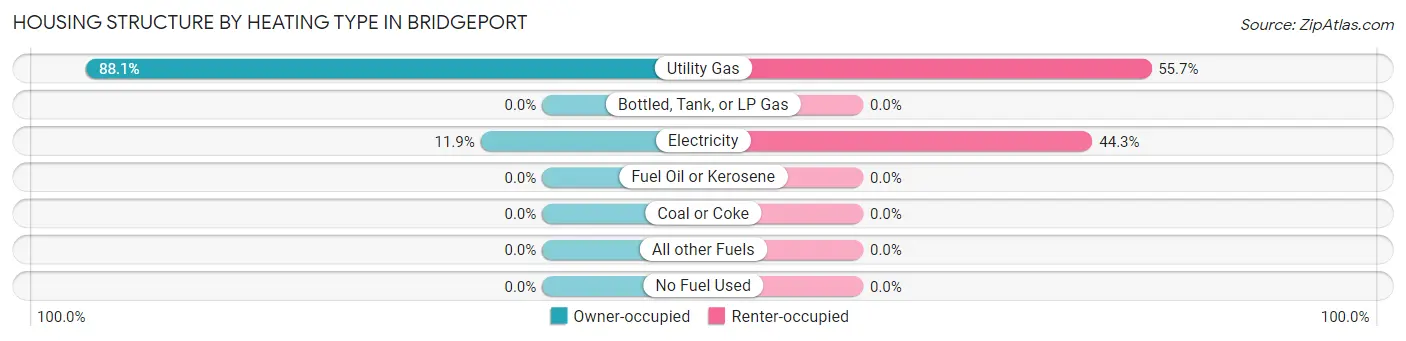
| Heating Type | Owner-occupied | Renter-occupied |
| Utility Gas | 2,450 (88.1%) | 533 (55.7%) |
| Bottled, Tank, or LP Gas | 0 (0.0%) | 0 (0.0%) |
| Electricity | 331 (11.9%) | 424 (44.3%) |
| Fuel Oil or Kerosene | 0 (0.0%) | 0 (0.0%) |
| Coal or Coke | 0 (0.0%) | 0 (0.0%) |
| All other Fuels | 0 (0.0%) | 0 (0.0%) |
| No Fuel Used | 0 (0.0%) | 0 (0.0%) |
| Total | 2,781 (100.0%) | 957 (100.0%) |
Household Vehicle Usage in Bridgeport
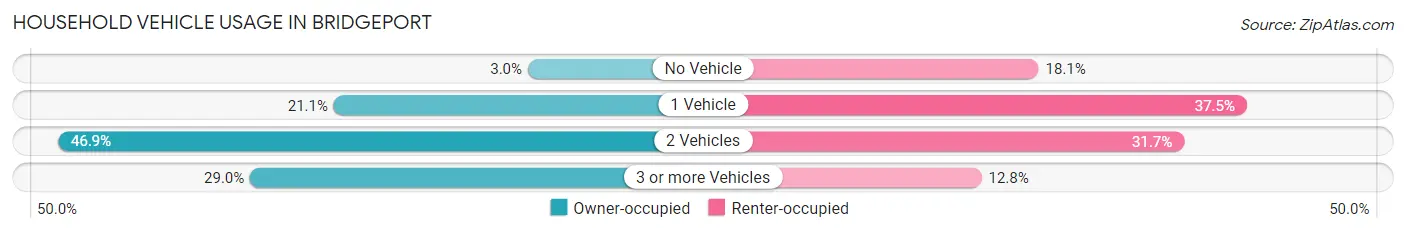
| Vehicles per Household | Owner-occupied | Renter-occupied |
| No Vehicle | 84 (3.0%) | 173 (18.1%) |
| 1 Vehicle | 588 (21.1%) | 359 (37.5%) |
| 2 Vehicles | 1,304 (46.9%) | 303 (31.7%) |
| 3 or more Vehicles | 805 (28.9%) | 122 (12.8%) |
| Total | 2,781 (100.0%) | 957 (100.0%) |
Real Estate & Mortgages in Bridgeport
Real Estate and Mortgage Overview in Bridgeport
| Characteristic | Without Mortgage | With Mortgage |
| Housing Units | 1,251 | 1,530 |
| Median Property Value | $240,300 | $274,200 |
| Median Household Income | $113,381 | $556 |
| Monthly Housing Costs | $515 | $168 |
| Real Estate Taxes | $1,614 | $51 |
Property Value by Mortgage Status in Bridgeport
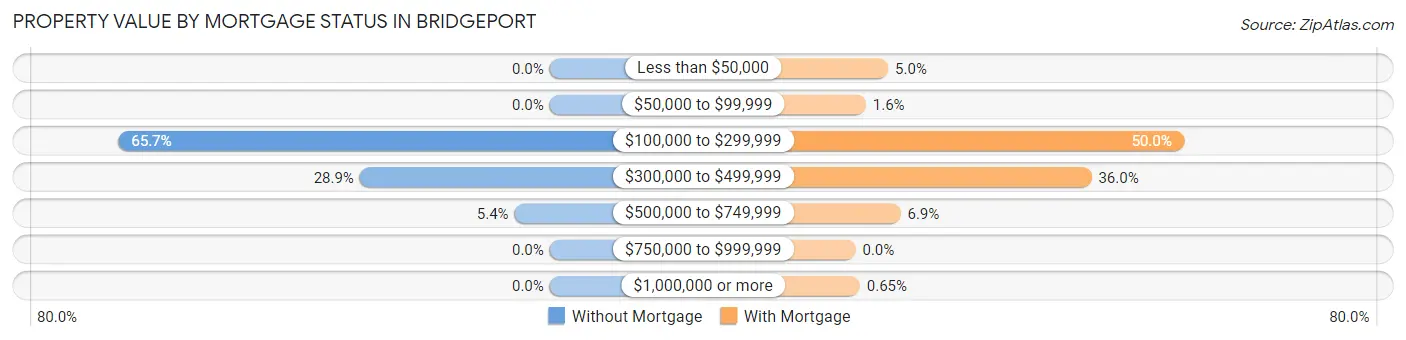
| Property Value | Without Mortgage | With Mortgage |
| Less than $50,000 | 0 (0.0%) | 76 (5.0%) |
| $50,000 to $99,999 | 0 (0.0%) | 24 (1.6%) |
| $100,000 to $299,999 | 822 (65.7%) | 765 (50.0%) |
| $300,000 to $499,999 | 362 (28.9%) | 550 (35.9%) |
| $500,000 to $749,999 | 67 (5.4%) | 105 (6.9%) |
| $750,000 to $999,999 | 0 (0.0%) | 0 (0.0%) |
| $1,000,000 or more | 0 (0.0%) | 10 (0.6%) |
| Total | 1,251 (100.0%) | 1,530 (100.0%) |
Household Income by Mortgage Status in Bridgeport
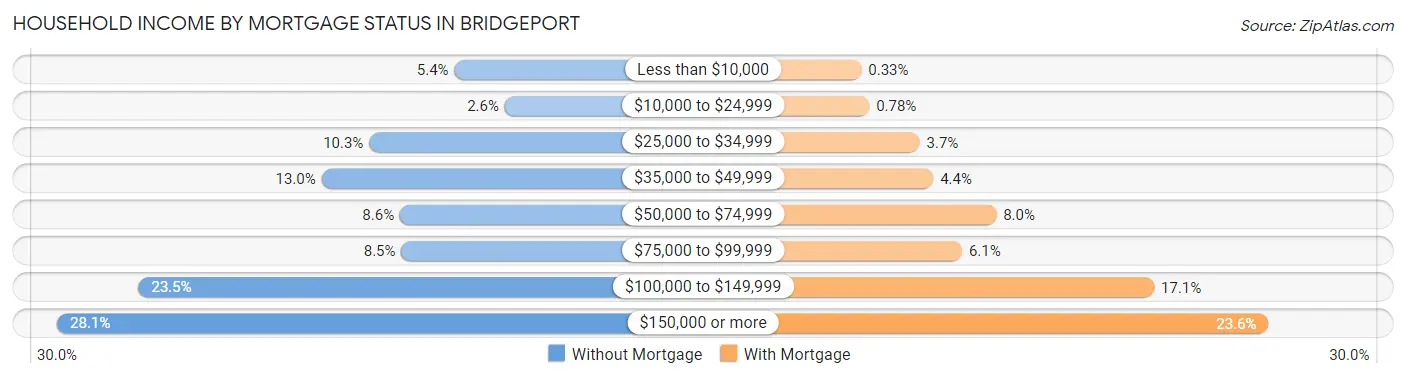
| Household Income | Without Mortgage | With Mortgage |
| Less than $10,000 | 68 (5.4%) | 5 (0.3%) |
| $10,000 to $24,999 | 32 (2.6%) | 12 (0.8%) |
| $25,000 to $34,999 | 129 (10.3%) | 56 (3.7%) |
| $35,000 to $49,999 | 163 (13.0%) | 68 (4.4%) |
| $50,000 to $74,999 | 107 (8.6%) | 123 (8.0%) |
| $75,000 to $99,999 | 106 (8.5%) | 93 (6.1%) |
| $100,000 to $149,999 | 294 (23.5%) | 261 (17.1%) |
| $150,000 or more | 352 (28.1%) | 361 (23.6%) |
| Total | 1,251 (100.0%) | 1,530 (100.0%) |
Property Value to Household Income Ratio in Bridgeport
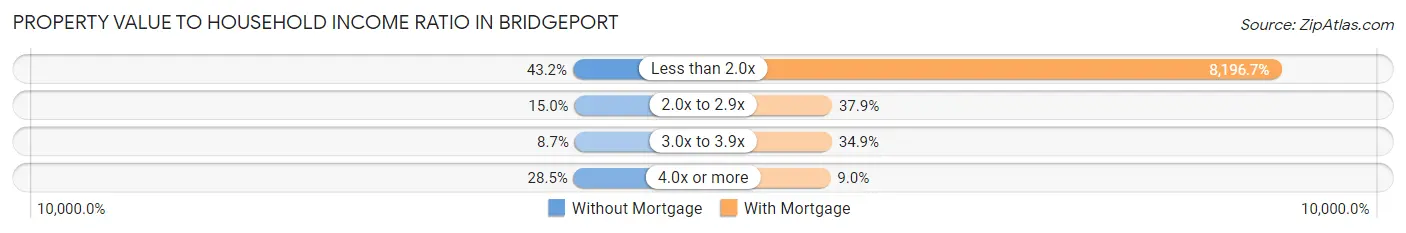
| Value-to-Income Ratio | Without Mortgage | With Mortgage |
| Less than 2.0x | 540 (43.2%) | 125,410 (8,196.7%) |
| 2.0x to 2.9x | 188 (15.0%) | 580 (37.9%) |
| 3.0x to 3.9x | 109 (8.7%) | 534 (34.9%) |
| 4.0x or more | 356 (28.5%) | 137 (8.9%) |
| Total | 1,251 (100.0%) | 1,530 (100.0%) |
Real Estate Taxes by Mortgage Status in Bridgeport
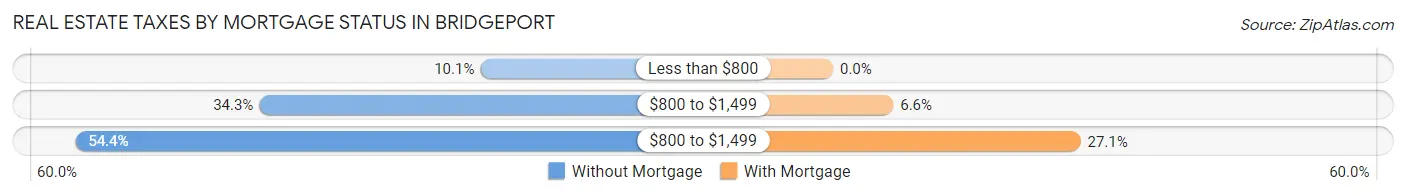
| Property Taxes | Without Mortgage | With Mortgage |
| Less than $800 | 126 (10.1%) | 0 (0.0%) |
| $800 to $1,499 | 429 (34.3%) | 101 (6.6%) |
| $800 to $1,499 | 681 (54.4%) | 415 (27.1%) |
| Total | 1,251 (100.0%) | 1,530 (100.0%) |
Health & Disability in Bridgeport
Health Insurance Coverage by Age in Bridgeport
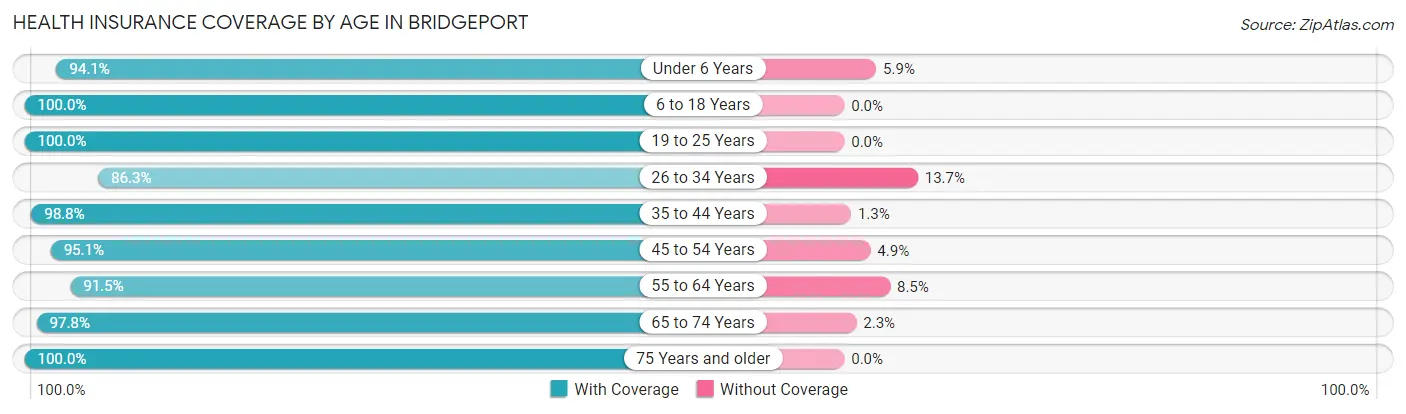
| Age Bracket | With Coverage | Without Coverage |
| Under 6 Years | 459 (94.1%) | 29 (5.9%) |
| 6 to 18 Years | 1,233 (100.0%) | 0 (0.0%) |
| 19 to 25 Years | 590 (100.0%) | 0 (0.0%) |
| 26 to 34 Years | 945 (86.3%) | 150 (13.7%) |
| 35 to 44 Years | 1,189 (98.8%) | 15 (1.3%) |
| 45 to 54 Years | 1,251 (95.1%) | 64 (4.9%) |
| 55 to 64 Years | 1,104 (91.5%) | 103 (8.5%) |
| 65 to 74 Years | 1,000 (97.8%) | 23 (2.2%) |
| 75 Years and older | 927 (100.0%) | 0 (0.0%) |
| Total | 8,698 (95.8%) | 384 (4.2%) |
Health Insurance Coverage by Citizenship Status in Bridgeport
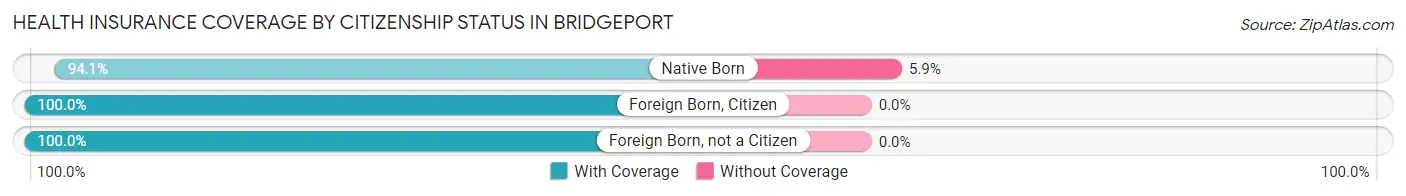
| Citizenship Status | With Coverage | Without Coverage |
| Native Born | 459 (94.1%) | 29 (5.9%) |
| Foreign Born, Citizen | 1,233 (100.0%) | 0 (0.0%) |
| Foreign Born, not a Citizen | 590 (100.0%) | 0 (0.0%) |
Health Insurance Coverage by Household Income in Bridgeport
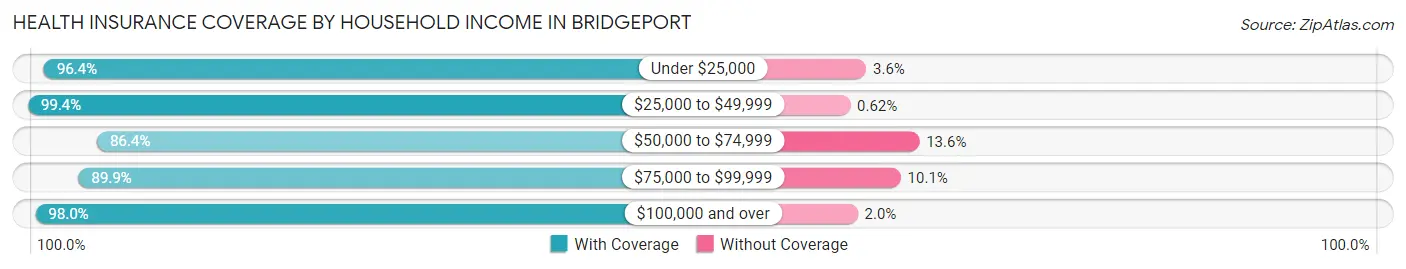
| Household Income | With Coverage | Without Coverage |
| Under $25,000 | 400 (96.4%) | 15 (3.6%) |
| $25,000 to $49,999 | 1,118 (99.4%) | 7 (0.6%) |
| $50,000 to $74,999 | 764 (86.4%) | 120 (13.6%) |
| $75,000 to $99,999 | 1,194 (89.9%) | 134 (10.1%) |
| $100,000 and over | 5,222 (98.0%) | 108 (2.0%) |
Public vs Private Health Insurance Coverage by Age in Bridgeport
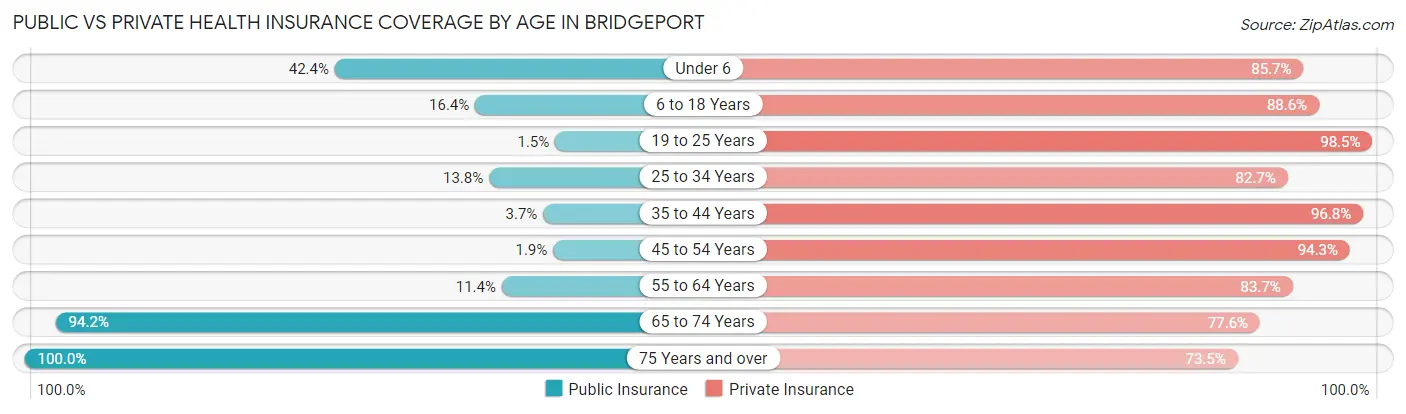
| Age Bracket | Public Insurance | Private Insurance |
| Under 6 | 207 (42.4%) | 418 (85.7%) |
| 6 to 18 Years | 202 (16.4%) | 1,092 (88.6%) |
| 19 to 25 Years | 9 (1.5%) | 581 (98.5%) |
| 25 to 34 Years | 151 (13.8%) | 906 (82.7%) |
| 35 to 44 Years | 45 (3.7%) | 1,165 (96.8%) |
| 45 to 54 Years | 25 (1.9%) | 1,240 (94.3%) |
| 55 to 64 Years | 138 (11.4%) | 1,010 (83.7%) |
| 65 to 74 Years | 964 (94.2%) | 794 (77.6%) |
| 75 Years and over | 927 (100.0%) | 681 (73.5%) |
| Total | 2,668 (29.4%) | 7,887 (86.8%) |
Disability Status by Sex by Age in Bridgeport
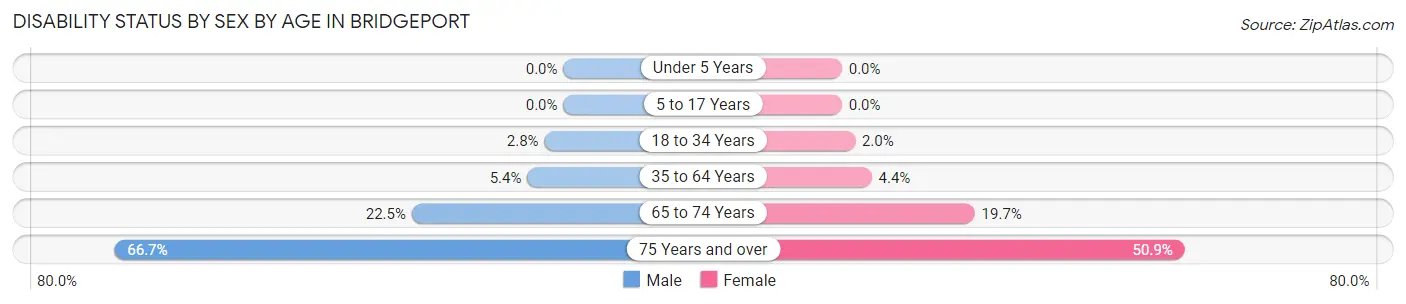
| Age Bracket | Male | Female |
| Under 5 Years | 0 (0.0%) | 0 (0.0%) |
| 5 to 17 Years | 0 (0.0%) | 0 (0.0%) |
| 18 to 34 Years | 20 (2.8%) | 20 (1.9%) |
| 35 to 64 Years | 99 (5.3%) | 83 (4.4%) |
| 65 to 74 Years | 115 (22.5%) | 101 (19.7%) |
| 75 Years and over | 144 (66.7%) | 362 (50.9%) |
Disability Class by Sex by Age in Bridgeport
Disability Class: Hearing Difficulty
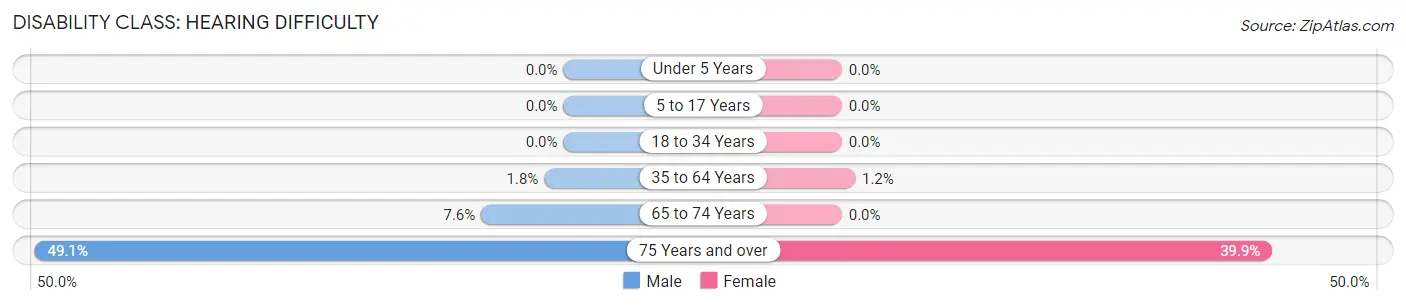
| Age Bracket | Male | Female |
| Under 5 Years | 0 (0.0%) | 0 (0.0%) |
| 5 to 17 Years | 0 (0.0%) | 0 (0.0%) |
| 18 to 34 Years | 0 (0.0%) | 0 (0.0%) |
| 35 to 64 Years | 33 (1.8%) | 23 (1.2%) |
| 65 to 74 Years | 39 (7.6%) | 0 (0.0%) |
| 75 Years and over | 106 (49.1%) | 284 (39.9%) |
Disability Class: Vision Difficulty
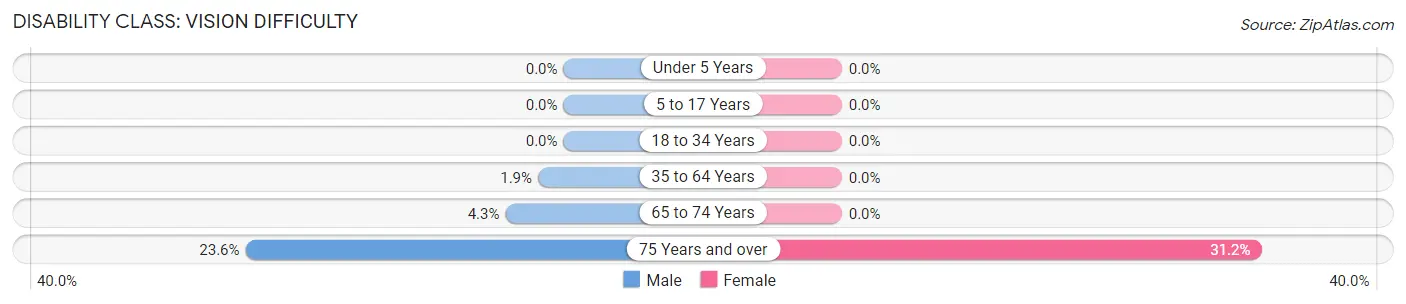
| Age Bracket | Male | Female |
| Under 5 Years | 0 (0.0%) | 0 (0.0%) |
| 5 to 17 Years | 0 (0.0%) | 0 (0.0%) |
| 18 to 34 Years | 0 (0.0%) | 0 (0.0%) |
| 35 to 64 Years | 35 (1.9%) | 0 (0.0%) |
| 65 to 74 Years | 22 (4.3%) | 0 (0.0%) |
| 75 Years and over | 51 (23.6%) | 222 (31.2%) |
Disability Class: Cognitive Difficulty
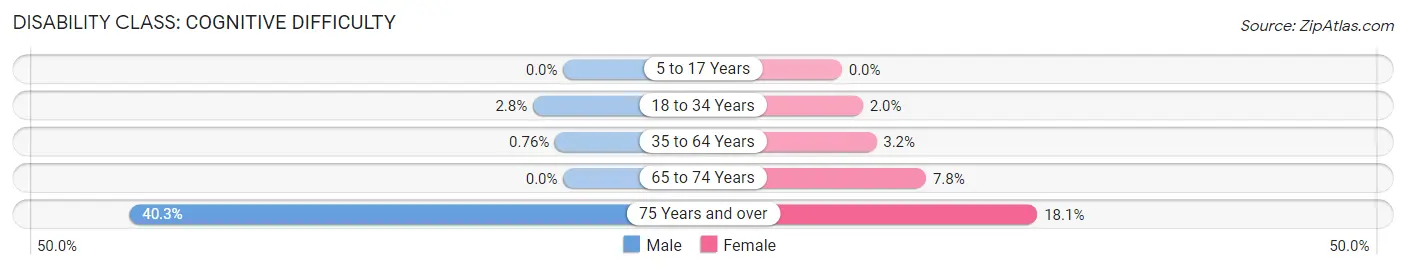
| Age Bracket | Male | Female |
| 5 to 17 Years | 0 (0.0%) | 0 (0.0%) |
| 18 to 34 Years | 20 (2.8%) | 20 (1.9%) |
| 35 to 64 Years | 14 (0.8%) | 60 (3.2%) |
| 65 to 74 Years | 0 (0.0%) | 40 (7.8%) |
| 75 Years and over | 87 (40.3%) | 129 (18.1%) |
Disability Class: Ambulatory Difficulty
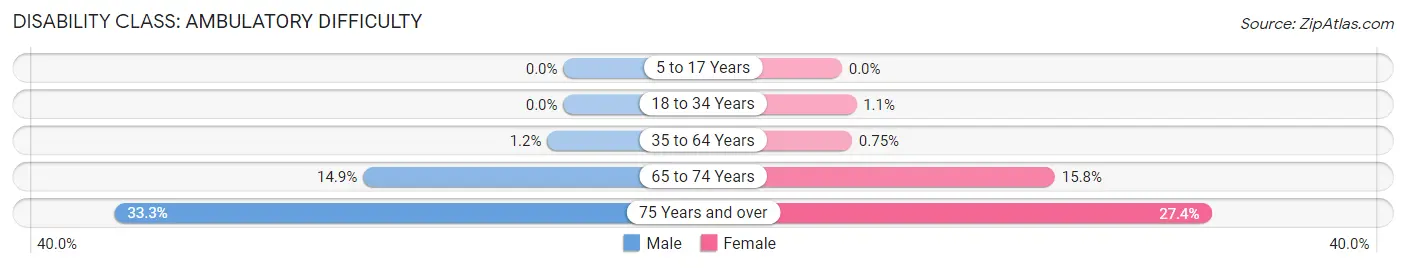
| Age Bracket | Male | Female |
| 5 to 17 Years | 0 (0.0%) | 0 (0.0%) |
| 18 to 34 Years | 0 (0.0%) | 11 (1.1%) |
| 35 to 64 Years | 22 (1.2%) | 14 (0.7%) |
| 65 to 74 Years | 76 (14.9%) | 81 (15.8%) |
| 75 Years and over | 72 (33.3%) | 195 (27.4%) |
Disability Class: Self-Care Difficulty
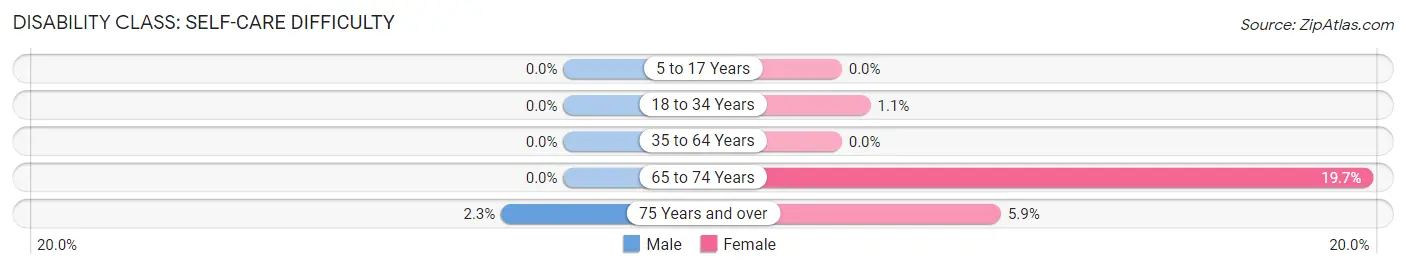
| Age Bracket | Male | Female |
| 5 to 17 Years | 0 (0.0%) | 0 (0.0%) |
| 18 to 34 Years | 0 (0.0%) | 11 (1.1%) |
| 35 to 64 Years | 0 (0.0%) | 0 (0.0%) |
| 65 to 74 Years | 0 (0.0%) | 101 (19.7%) |
| 75 Years and over | 5 (2.3%) | 42 (5.9%) |
Technology Access in Bridgeport
Computing Device Access in Bridgeport
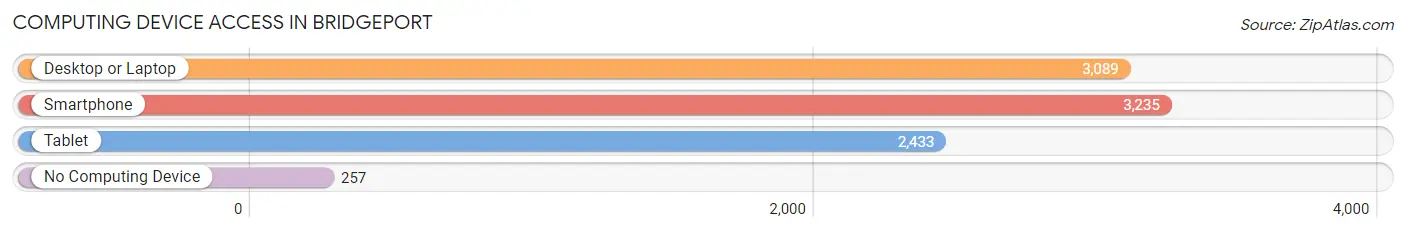
| Device Type | # Households | % Households |
| Desktop or Laptop | 3,089 | 82.6% |
| Smartphone | 3,235 | 86.5% |
| Tablet | 2,433 | 65.1% |
| No Computing Device | 257 | 6.9% |
| Total | 3,738 | 100.0% |
Internet Access in Bridgeport
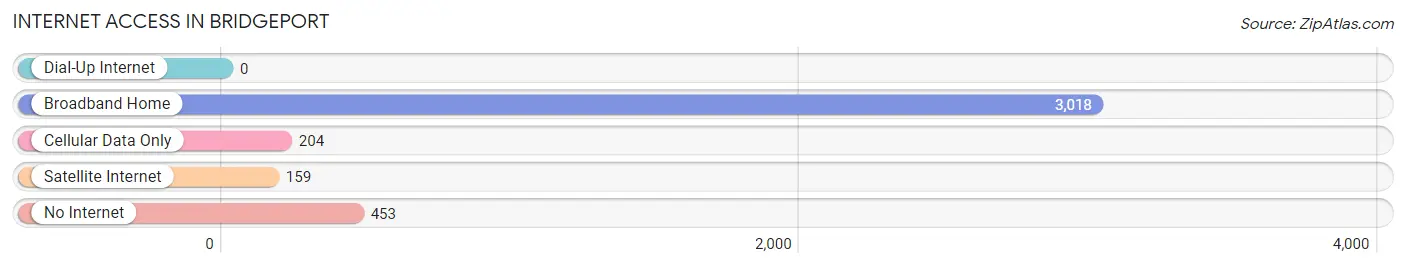
| Internet Type | # Households | % Households |
| Dial-Up Internet | 0 | 0.0% |
| Broadband Home | 3,018 | 80.7% |
| Cellular Data Only | 204 | 5.5% |
| Satellite Internet | 159 | 4.3% |
| No Internet | 453 | 12.1% |
| Total | 3,738 | 100.0% |
Bridgeport Summary
Bridgeport, West Virginia is a small city located in the northern panhandle of the state. It is the county seat of Harrison County and is part of the Clarksburg-Bridgeport Metropolitan Statistical Area. The city has a population of 8,149 as of the 2010 census, making it the largest city in the county.
History
The area that is now Bridgeport was first settled in 1764 by a group of settlers from Pennsylvania. The settlement was originally known as Charlestown, but was later renamed Bridgeport in 1816. The name was chosen to honor the bridge that was built across the West Fork River. The bridge was built by a local entrepreneur named John Simpson, who also built the first gristmill in the area.
The city was officially incorporated in 1871 and quickly became an important hub for the local economy. The city was home to several industries, including a glass factory, a brickyard, and a tannery. The city also had a thriving agricultural sector, with several farms located in the area.
The city experienced a period of growth in the late 19th and early 20th centuries, with the population increasing from 1,000 in 1880 to over 5,000 by 1910. The city was also home to several important businesses, including the Bridgeport Machine Company, which manufactured machine tools, and the Bridgeport Clay Products Company, which produced bricks and other clay products.
Geography
Bridgeport is located in the northern panhandle of West Virginia, in the Appalachian Mountains. The city is situated on the West Fork River, which flows through the city and is a tributary of the Monongahela River. The city is located approximately 30 miles south of Pittsburgh, Pennsylvania and 60 miles north of Charleston, West Virginia.
The city has a total area of 4.2 square miles, all of which is land. The city is located at an elevation of 1,068 feet above sea level. The climate in Bridgeport is classified as humid continental, with hot, humid summers and cold, snowy winters.
Economy
The economy of Bridgeport is largely based on the service sector, with the city being home to several retail stores, restaurants, and other businesses. The city is also home to several manufacturing companies, including the Bridgeport Machine Company and the Bridgeport Clay Products Company.
The city is also home to several educational institutions, including West Virginia University at Parkersburg, which is located just outside of the city limits. The city is also home to several medical facilities, including United Hospital Center and the Bridgeport Health Care Center.
Demographics
As of the 2010 census, the population of Bridgeport was 8,149. The racial makeup of the city was 94.2% White, 2.7% African American, 0.3% Native American, 0.7% Asian, 0.1% Pacific Islander, 0.7% from other races, and 1.3% from two or more races. Hispanic or Latino of any race were 1.7% of the population.
The median household income in Bridgeport was $37,917, and the median family income was $45,938. The per capita income for the city was $20,845. About 11.2% of families and 14.2% of the population were below the poverty line, including 19.2% of those under age 18 and 8.2% of those age 65 or over.
Common Questions
What is Per Capita Income in Bridgeport?
Per Capita income in Bridgeport is $51,214.
What is the Median Family Income in Bridgeport?
Median Family Income in Bridgeport is $129,508.
What is the Median Household income in Bridgeport?
Median Household Income in Bridgeport is $96,063.
What is Income or Wage Gap in Bridgeport?
Income or Wage Gap in Bridgeport is 51.9%.
Women in Bridgeport earn 48.1 cents for every dollar earned by a man.
What is Inequality or Gini Index in Bridgeport?
Inequality or Gini Index in Bridgeport is 0.41.
What is the Total Population of Bridgeport?
Total Population of Bridgeport is 9,255.
What is the Total Male Population of Bridgeport?
Total Male Population of Bridgeport is 4,128.
What is the Total Female Population of Bridgeport?
Total Female Population of Bridgeport is 5,127.
What is the Ratio of Males per 100 Females in Bridgeport?
There are 80.51 Males per 100 Females in Bridgeport.
What is the Ratio of Females per 100 Males in Bridgeport?
There are 124.20 Females per 100 Males in Bridgeport.
What is the Median Population Age in Bridgeport?
Median Population Age in Bridgeport is 45.1 Years.
What is the Average Family Size in Bridgeport
Average Family Size in Bridgeport is 3.1 People.
What is the Average Household Size in Bridgeport
Average Household Size in Bridgeport is 2.4 People.
How Large is the Labor Force in Bridgeport?
There are 4,709 People in the Labor Forcein in Bridgeport.
What is the Percentage of People in the Labor Force in Bridgeport?
60.6% of People are in the Labor Force in Bridgeport.
What is the Unemployment Rate in Bridgeport?
Unemployment Rate in Bridgeport is 1.6%.