West Hartford, CT Map & Demographics
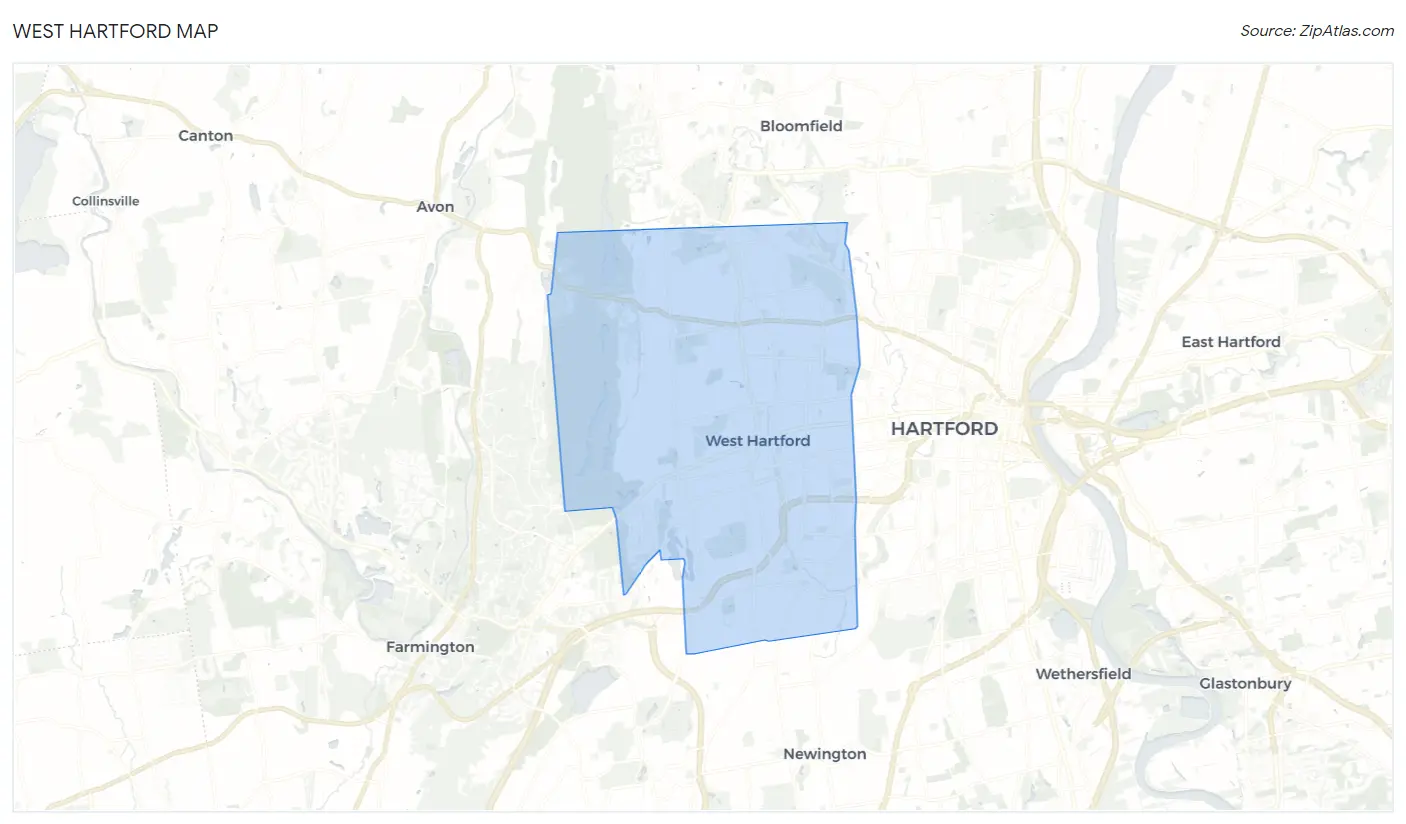
West Hartford Map
West Hartford Overview
$67,164
PER CAPITA INCOME
$159,480
AVG FAMILY INCOME
$124,150
AVG HOUSEHOLD INCOME
29.6%
WAGE / INCOME GAP [ % ]
70.4¢/ $1
WAGE / INCOME GAP [ $ ]
$11,835
FAMILY INCOME DEFICIT
0.46
INEQUALITY / GINI INDEX
64,088
TOTAL POPULATION
30,379
MALE POPULATION
33,709
FEMALE POPULATION
90.12
MALES / 100 FEMALES
110.96
FEMALES / 100 MALES
39.7
MEDIAN AGE
3.0
AVG FAMILY SIZE
2.4
AVG HOUSEHOLD SIZE
35,756
LABOR FORCE [ PEOPLE ]
68.9%
PERCENT IN LABOR FORCE
3.9%
UNEMPLOYMENT RATE
West Hartford Area Codes
Income in West Hartford
Income Overview in West Hartford
Per Capita Income in West Hartford is $67,164, while median incomes of families and households are $159,480 and $124,150 respectively.
| Characteristic | Number | Measure |
| Per Capita Income | 64,088 | $67,164 |
| Median Family Income | 16,084 | $159,480 |
| Mean Family Income | 16,084 | $201,964 |
| Median Household Income | 26,100 | $124,150 |
| Mean Household Income | 26,100 | $162,896 |
| Income Deficit | 16,084 | $11,835 |
| Wage / Income Gap (%) | 64,088 | 29.58% |
| Wage / Income Gap ($) | 64,088 | 70.42¢ per $1 |
| Gini / Inequality Index | 64,088 | 0.46 |
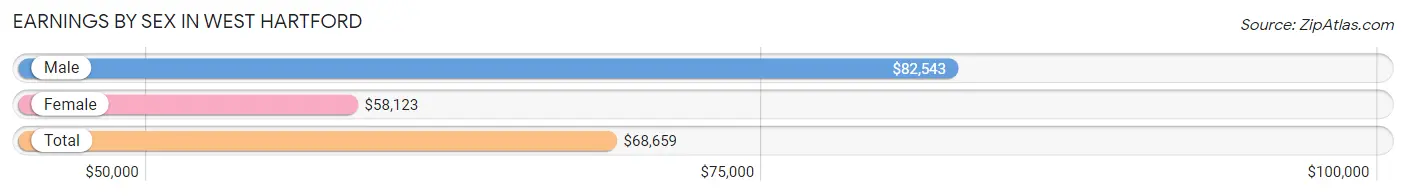
Earnings by Sex in West Hartford
Average Earnings in West Hartford are $68,659, $82,543 for men and $58,123 for women, a difference of 29.6%.
| Sex | Number | Average Earnings |
| Male | 18,920 (51.0%) | $82,543 |
| Female | 18,208 (49.0%) | $58,123 |
| Total | 37,128 (100.0%) | $68,659 |
Earnings by Sex by Income Bracket in West Hartford
The most common earnings brackets in West Hartford are $100,000+ for men (7,650 | 40.4%) and $100,000+ for women (4,348 | 23.9%).
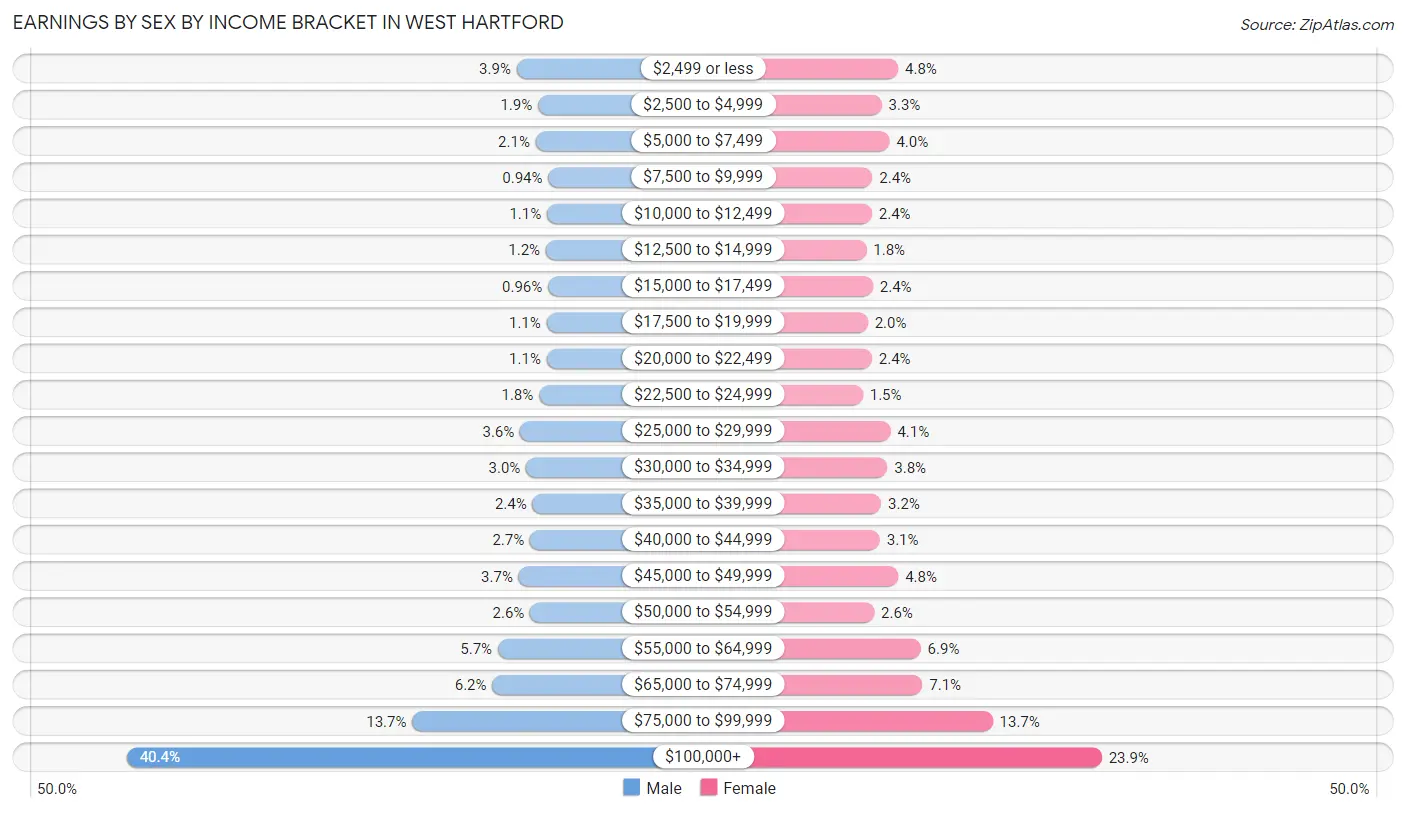
| Income | Male | Female |
| $2,499 or less | 738 (3.9%) | 876 (4.8%) |
| $2,500 to $4,999 | 360 (1.9%) | 593 (3.3%) |
| $5,000 to $7,499 | 401 (2.1%) | 729 (4.0%) |
| $7,500 to $9,999 | 177 (0.9%) | 435 (2.4%) |
| $10,000 to $12,499 | 201 (1.1%) | 427 (2.4%) |
| $12,500 to $14,999 | 220 (1.2%) | 334 (1.8%) |
| $15,000 to $17,499 | 182 (1.0%) | 445 (2.4%) |
| $17,500 to $19,999 | 208 (1.1%) | 356 (2.0%) |
| $20,000 to $22,499 | 206 (1.1%) | 428 (2.4%) |
| $22,500 to $24,999 | 341 (1.8%) | 274 (1.5%) |
| $25,000 to $29,999 | 678 (3.6%) | 745 (4.1%) |
| $30,000 to $34,999 | 569 (3.0%) | 691 (3.8%) |
| $35,000 to $39,999 | 457 (2.4%) | 585 (3.2%) |
| $40,000 to $44,999 | 502 (2.6%) | 562 (3.1%) |
| $45,000 to $49,999 | 702 (3.7%) | 878 (4.8%) |
| $50,000 to $54,999 | 500 (2.6%) | 466 (2.6%) |
| $55,000 to $64,999 | 1,070 (5.7%) | 1,260 (6.9%) |
| $65,000 to $74,999 | 1,169 (6.2%) | 1,289 (7.1%) |
| $75,000 to $99,999 | 2,589 (13.7%) | 2,487 (13.7%) |
| $100,000+ | 7,650 (40.4%) | 4,348 (23.9%) |
| Total | 18,920 (100.0%) | 18,208 (100.0%) |
Earnings by Sex by Educational Attainment in West Hartford
Average earnings in West Hartford are $90,435 for men and $65,128 for women, a difference of 28.0%. Men with an educational attainment of graduate degree enjoy the highest average annual earnings of $131,275, while those with less than high school education earn the least with $32,798. Women with an educational attainment of graduate degree earn the most with the average annual earnings of $86,816, while those with less than high school education have the smallest earnings of $29,631.
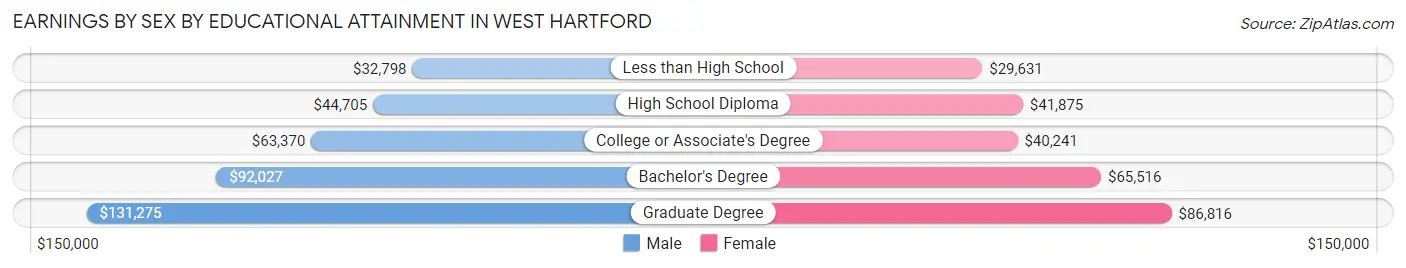
| Educational Attainment | Male Income | Female Income |
| Less than High School | $32,798 | $29,631 |
| High School Diploma | $44,705 | $41,875 |
| College or Associate's Degree | $63,370 | $40,241 |
| Bachelor's Degree | $92,027 | $65,516 |
| Graduate Degree | $131,275 | $86,816 |
| Total | $90,435 | $65,128 |
Family Income in West Hartford
Family Income Brackets in West Hartford
According to the West Hartford family income data, there are 5,951 families falling into the $200,000+ income range, which is the most common income bracket and makes up 37.0% of all families. Conversely, the $10,000 to $14,999 income bracket is the least frequent group with only 161 families (1.0%) belonging to this category.
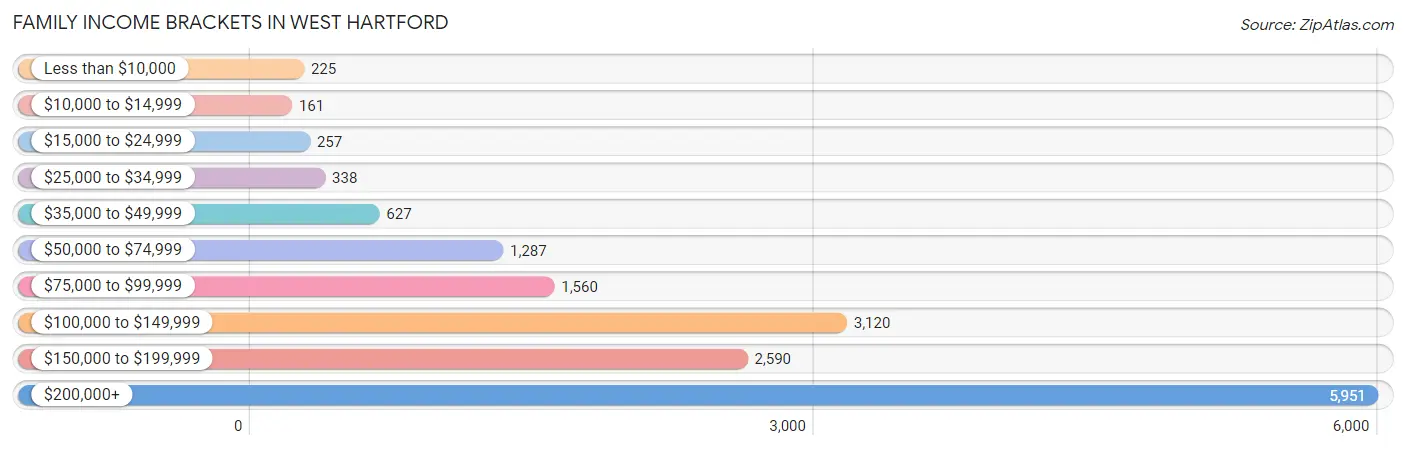
| Income Bracket | # Families | % Families |
| Less than $10,000 | 225 | 1.4% |
| $10,000 to $14,999 | 161 | 1.0% |
| $15,000 to $24,999 | 257 | 1.6% |
| $25,000 to $34,999 | 338 | 2.1% |
| $35,000 to $49,999 | 627 | 3.9% |
| $50,000 to $74,999 | 1,287 | 8.0% |
| $75,000 to $99,999 | 1,560 | 9.7% |
| $100,000 to $149,999 | 3,120 | 19.4% |
| $150,000 to $199,999 | 2,590 | 16.1% |
| $200,000+ | 5,951 | 37.0% |
Family Income by Famaliy Size in West Hartford
6-person families (197 | 1.2%) account for the highest median family income in West Hartford with $215,885 per family, while 2-person families (6,784 | 42.2%) have the highest median income of $68,243 per family member.
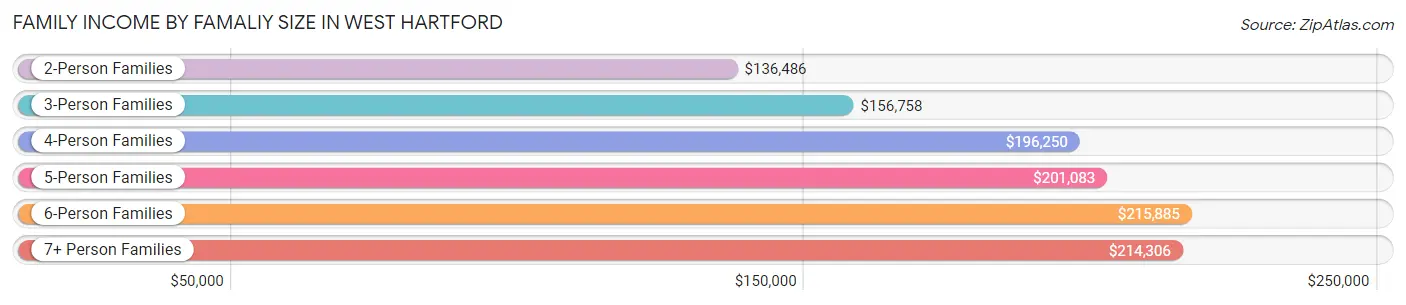
| Income Bracket | # Families | Median Income |
| 2-Person Families | 6,784 (42.2%) | $136,486 |
| 3-Person Families | 4,199 (26.1%) | $156,758 |
| 4-Person Families | 3,728 (23.2%) | $196,250 |
| 5-Person Families | 1,079 (6.7%) | $201,083 |
| 6-Person Families | 197 (1.2%) | $215,885 |
| 7+ Person Families | 97 (0.6%) | $214,306 |
| Total | 16,084 (100.0%) | $159,480 |
Family Income by Number of Earners in West Hartford
The median family income in West Hartford is $159,480, with families comprising 3+ earners (2,068) having the highest median family income of $193,372, while families with no earners (1,748) have the lowest median family income of $84,375, accounting for 12.9% and 10.9% of families, respectively.
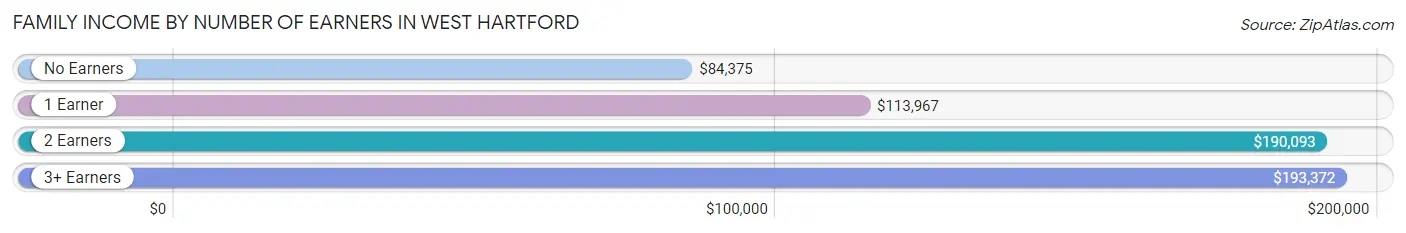
| Number of Earners | # Families | Median Income |
| No Earners | 1,748 (10.9%) | $84,375 |
| 1 Earner | 4,689 (29.1%) | $113,967 |
| 2 Earners | 7,579 (47.1%) | $190,093 |
| 3+ Earners | 2,068 (12.9%) | $193,372 |
| Total | 16,084 (100.0%) | $159,480 |
Household Income in West Hartford
Household Income Brackets in West Hartford
With 7,125 households falling in the category, the $200,000+ income range is the most frequent in West Hartford, accounting for 27.3% of all households. In contrast, only 861 households (3.3%) fall into the less than $10,000 income bracket, making it the least populous group.
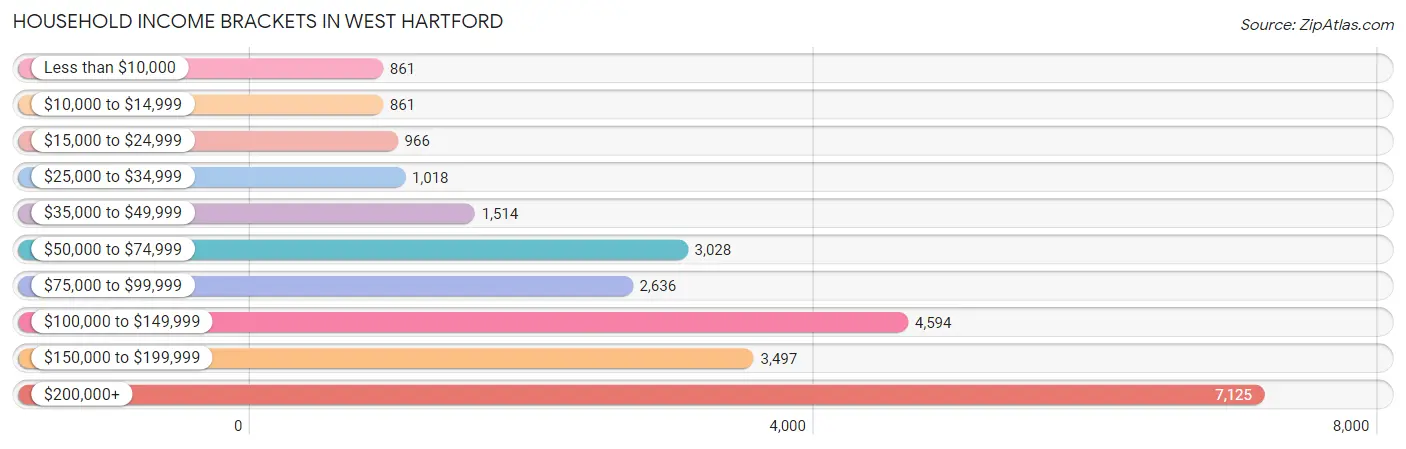
| Income Bracket | # Households | % Households |
| Less than $10,000 | 861 | 3.3% |
| $10,000 to $14,999 | 861 | 3.3% |
| $15,000 to $24,999 | 966 | 3.7% |
| $25,000 to $34,999 | 1,018 | 3.9% |
| $35,000 to $49,999 | 1,514 | 5.8% |
| $50,000 to $74,999 | 3,028 | 11.6% |
| $75,000 to $99,999 | 2,636 | 10.1% |
| $100,000 to $149,999 | 4,594 | 17.6% |
| $150,000 to $199,999 | 3,497 | 13.4% |
| $200,000+ | 7,125 | 27.3% |
Household Income by Householder Age in West Hartford
The median household income in West Hartford is $124,150, with the highest median household income of $152,424 found in the 45 to 64 years age bracket for the primary householder. A total of 9,459 households (36.2%) fall into this category. Meanwhile, the 15 to 24 years age bracket for the primary householder has the lowest median household income of $69,634, with 766 households (2.9%) in this group.
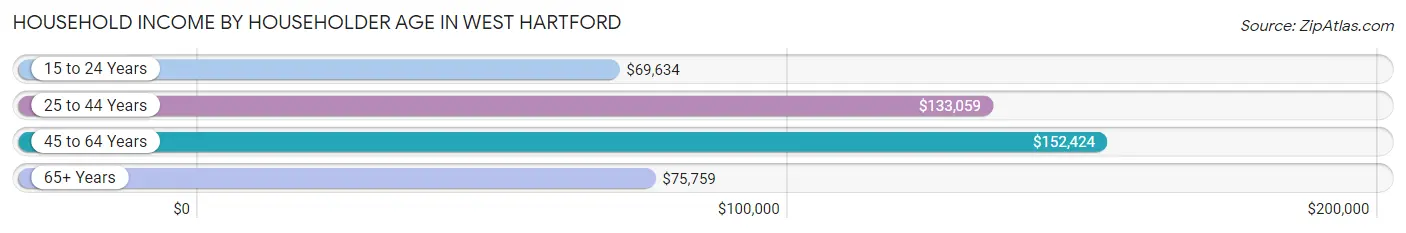
| Income Bracket | # Households | Median Income |
| 15 to 24 Years | 766 (2.9%) | $69,634 |
| 25 to 44 Years | 8,661 (33.2%) | $133,059 |
| 45 to 64 Years | 9,459 (36.2%) | $152,424 |
| 65+ Years | 7,214 (27.6%) | $75,759 |
| Total | 26,100 (100.0%) | $124,150 |
Poverty in West Hartford
Income Below Poverty by Sex and Age in West Hartford
With 4.1% poverty level for males and 7.6% for females among the residents of West Hartford, 6 to 11 year old males and 18 to 24 year old females are the most vulnerable to poverty, with 240 males (11.4%) and 392 females (18.5%) in their respective age groups living below the poverty level.
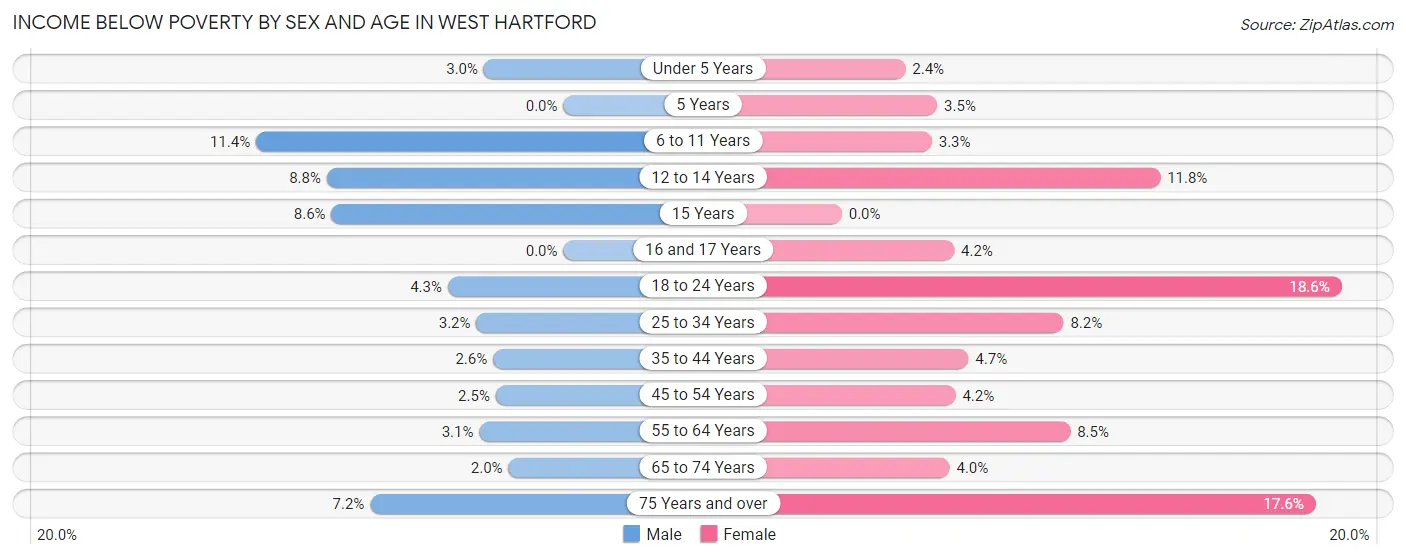
| Age Bracket | Male | Female |
| Under 5 Years | 51 (2.9%) | 36 (2.4%) |
| 5 Years | 0 (0.0%) | 13 (3.5%) |
| 6 to 11 Years | 240 (11.4%) | 86 (3.3%) |
| 12 to 14 Years | 130 (8.8%) | 115 (11.8%) |
| 15 Years | 44 (8.6%) | 0 (0.0%) |
| 16 and 17 Years | 0 (0.0%) | 39 (4.2%) |
| 18 to 24 Years | 90 (4.3%) | 392 (18.5%) |
| 25 to 34 Years | 148 (3.2%) | 370 (8.2%) |
| 35 to 44 Years | 98 (2.6%) | 201 (4.7%) |
| 45 to 54 Years | 88 (2.5%) | 172 (4.2%) |
| 55 to 64 Years | 131 (3.1%) | 372 (8.5%) |
| 65 to 74 Years | 60 (2.0%) | 125 (4.0%) |
| 75 Years and over | 142 (7.2%) | 586 (17.6%) |
| Total | 1,222 (4.1%) | 2,507 (7.6%) |
Income Above Poverty by Sex and Age in West Hartford
According to the poverty statistics in West Hartford, males aged 5 years and females aged 15 years are the age groups that are most secure financially, with 100.0% of males and 100.0% of females in these age groups living above the poverty line.
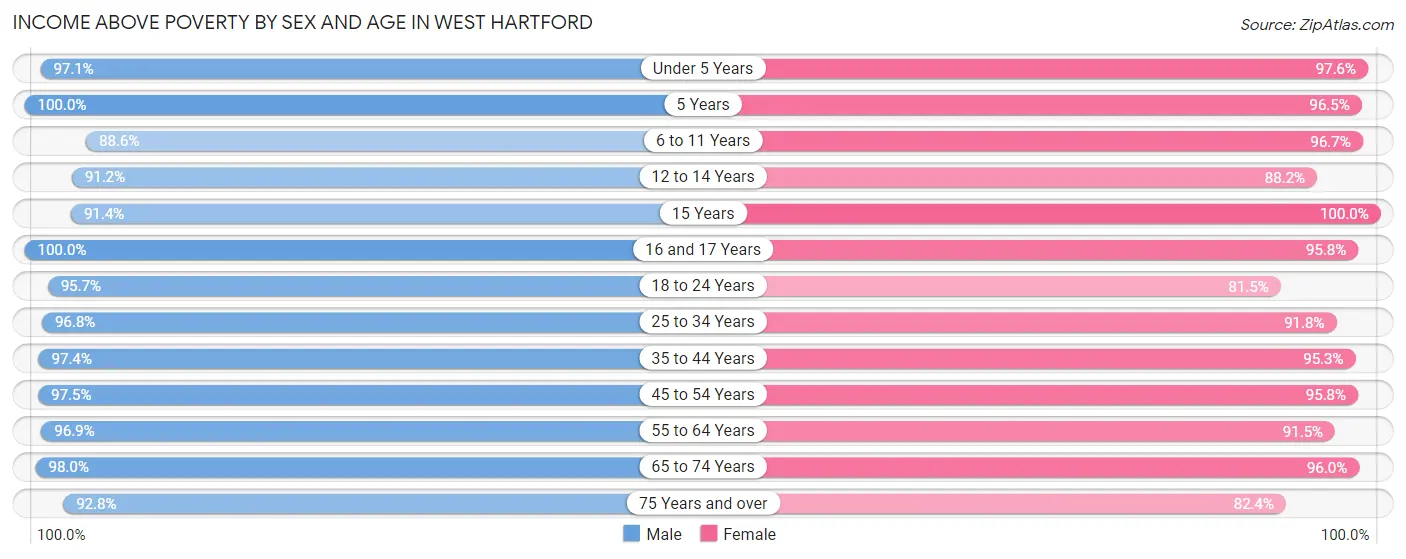
| Age Bracket | Male | Female |
| Under 5 Years | 1,676 (97.1%) | 1,487 (97.6%) |
| 5 Years | 220 (100.0%) | 354 (96.5%) |
| 6 to 11 Years | 1,864 (88.6%) | 2,492 (96.7%) |
| 12 to 14 Years | 1,350 (91.2%) | 858 (88.2%) |
| 15 Years | 467 (91.4%) | 670 (100.0%) |
| 16 and 17 Years | 907 (100.0%) | 897 (95.8%) |
| 18 to 24 Years | 2,008 (95.7%) | 1,721 (81.5%) |
| 25 to 34 Years | 4,435 (96.8%) | 4,126 (91.8%) |
| 35 to 44 Years | 3,653 (97.4%) | 4,077 (95.3%) |
| 45 to 54 Years | 3,414 (97.5%) | 3,905 (95.8%) |
| 55 to 64 Years | 4,070 (96.9%) | 4,017 (91.5%) |
| 65 to 74 Years | 2,879 (98.0%) | 2,999 (96.0%) |
| 75 Years and over | 1,839 (92.8%) | 2,746 (82.4%) |
| Total | 28,782 (95.9%) | 30,349 (92.4%) |
Income Below Poverty Among Married-Couple Families in West Hartford
The poverty statistics for married-couple families in West Hartford show that 0.7% or 84 of the total 12,522 families live below the poverty line. Families with 3 or 4 children have the highest poverty rate of 1.9%, comprising of 14 families. On the other hand, families with 5 or more children have the lowest poverty rate of 0.0%, which includes 0 families.
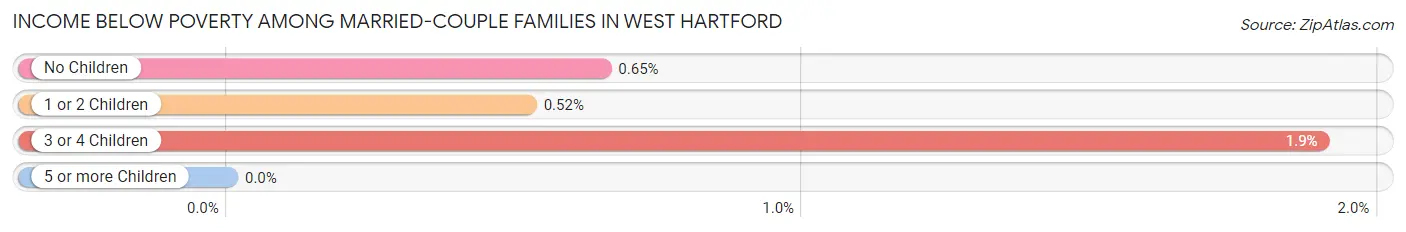
| Children | Above Poverty | Below Poverty |
| No Children | 6,840 (99.4%) | 45 (0.6%) |
| 1 or 2 Children | 4,822 (99.5%) | 25 (0.5%) |
| 3 or 4 Children | 724 (98.1%) | 14 (1.9%) |
| 5 or more Children | 52 (100.0%) | 0 (0.0%) |
| Total | 12,438 (99.3%) | 84 (0.7%) |
Income Below Poverty Among Single-Parent Households in West Hartford
According to the poverty data in West Hartford, 4.3% or 37 single-father households and 15.2% or 409 single-mother households are living below the poverty line. Among single-father households, those with 1 or 2 children have the highest poverty rate, with 37 households (9.7%) experiencing poverty. Likewise, among single-mother households, those with 3 or 4 children have the highest poverty rate, with 73 households (21.0%) falling below the poverty line.
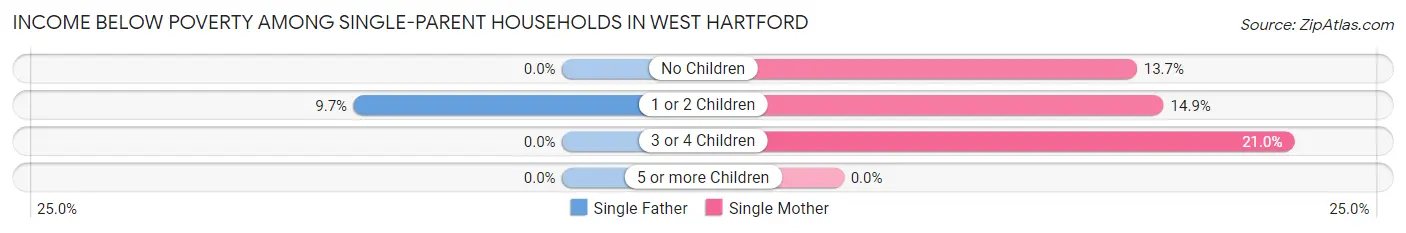
| Children | Single Father | Single Mother |
| No Children | 0 (0.0%) | 148 (13.7%) |
| 1 or 2 Children | 37 (9.7%) | 188 (14.9%) |
| 3 or 4 Children | 0 (0.0%) | 73 (21.0%) |
| 5 or more Children | 0 (0.0%) | 0 (0.0%) |
| Total | 37 (4.3%) | 409 (15.2%) |
Income Below Poverty Among Married-Couple vs Single-Parent Households in West Hartford
The poverty data for West Hartford shows that 84 of the married-couple family households (0.7%) and 446 of the single-parent households (12.5%) are living below the poverty level. Within the married-couple family households, those with 3 or 4 children have the highest poverty rate, with 14 households (1.9%) falling below the poverty line. Among the single-parent households, those with 3 or 4 children have the highest poverty rate, with 73 household (16.2%) living below poverty.
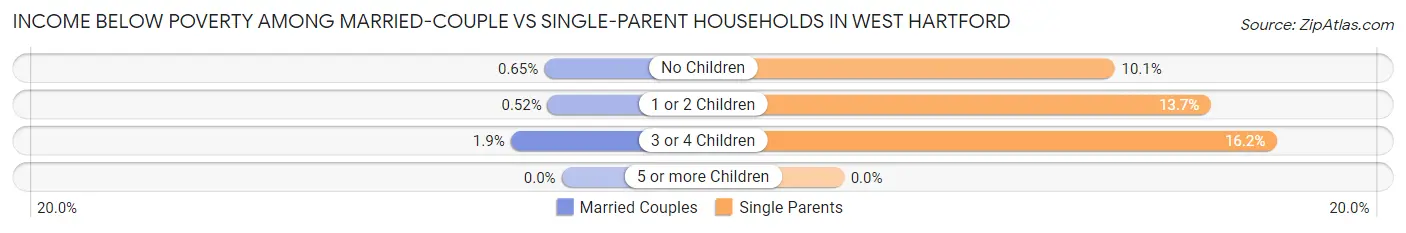
| Children | Married-Couple Families | Single-Parent Households |
| No Children | 45 (0.6%) | 148 (10.1%) |
| 1 or 2 Children | 25 (0.5%) | 225 (13.7%) |
| 3 or 4 Children | 14 (1.9%) | 73 (16.2%) |
| 5 or more Children | 0 (0.0%) | 0 (0.0%) |
| Total | 84 (0.7%) | 446 (12.5%) |
Race in West Hartford
The most populous races in West Hartford are White / Caucasian (48,085 | 75.0%), Hispanic or Latino (8,597 | 13.4%), and Black / African American (4,896 | 7.6%).
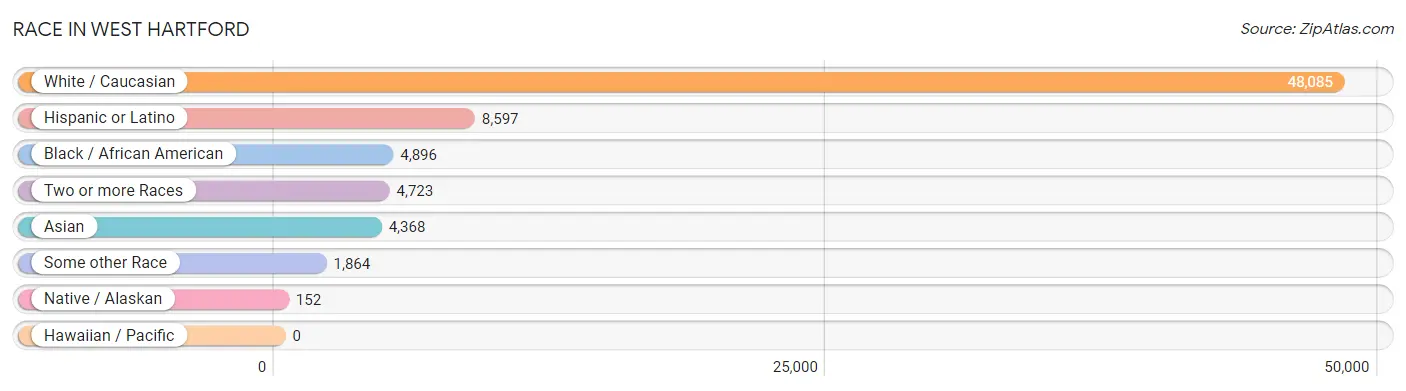
| Race | # Population | % Population |
| Asian | 4,368 | 6.8% |
| Black / African American | 4,896 | 7.6% |
| Hawaiian / Pacific | 0 | 0.0% |
| Hispanic or Latino | 8,597 | 13.4% |
| Native / Alaskan | 152 | 0.2% |
| White / Caucasian | 48,085 | 75.0% |
| Two or more Races | 4,723 | 7.4% |
| Some other Race | 1,864 | 2.9% |
| Total | 64,088 | 100.0% |
Ancestry in West Hartford
The most populous ancestries reported in West Hartford are Irish (10,469 | 16.3%), Italian (7,720 | 12.0%), English (6,467 | 10.1%), German (5,802 | 9.0%), and Polish (3,692 | 5.8%), together accounting for 53.3% of all West Hartford residents.
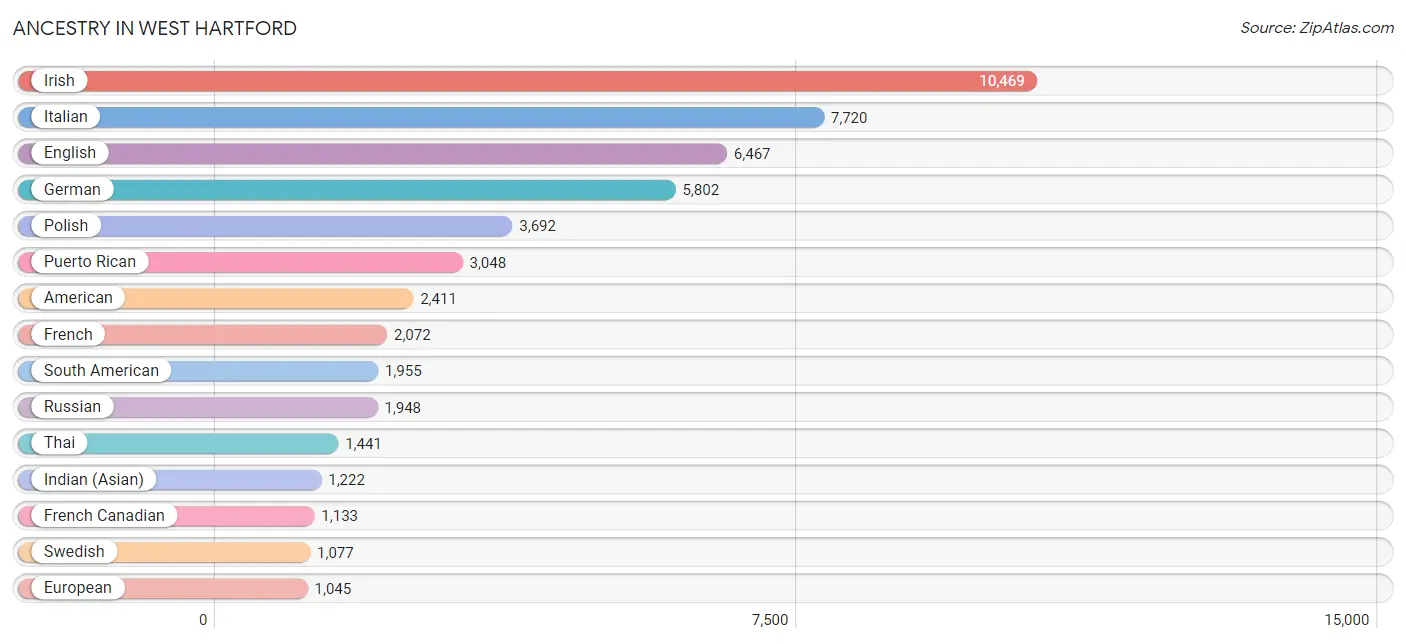
| Ancestry | # Population | % Population |
| Afghan | 58 | 0.1% |
| African | 106 | 0.2% |
| Albanian | 383 | 0.6% |
| Alsatian | 6 | 0.0% |
| American | 2,411 | 3.8% |
| Apache | 3 | 0.0% |
| Arab | 581 | 0.9% |
| Argentinean | 260 | 0.4% |
| Armenian | 266 | 0.4% |
| Assyrian / Chaldean / Syriac | 15 | 0.0% |
| Australian | 21 | 0.0% |
| Austrian | 304 | 0.5% |
| Barbadian | 42 | 0.1% |
| Belgian | 49 | 0.1% |
| Belizean | 106 | 0.2% |
| Bhutanese | 371 | 0.6% |
| Blackfeet | 36 | 0.1% |
| Bolivian | 21 | 0.0% |
| Brazilian | 276 | 0.4% |
| British | 359 | 0.6% |
| British West Indian | 60 | 0.1% |
| Bulgarian | 56 | 0.1% |
| Burmese | 136 | 0.2% |
| Canadian | 209 | 0.3% |
| Celtic | 16 | 0.0% |
| Central American | 881 | 1.4% |
| Central American Indian | 140 | 0.2% |
| Cherokee | 55 | 0.1% |
| Chickasaw | 34 | 0.1% |
| Chilean | 87 | 0.1% |
| Colombian | 632 | 1.0% |
| Comanche | 25 | 0.0% |
| Costa Rican | 187 | 0.3% |
| Creek | 89 | 0.1% |
| Croatian | 58 | 0.1% |
| Cuban | 339 | 0.5% |
| Czech | 156 | 0.2% |
| Czechoslovakian | 63 | 0.1% |
| Danish | 239 | 0.4% |
| Dominican | 863 | 1.3% |
| Dutch | 301 | 0.5% |
| Eastern European | 883 | 1.4% |
| Ecuadorian | 251 | 0.4% |
| English | 6,467 | 10.1% |
| Estonian | 30 | 0.1% |
| Ethiopian | 76 | 0.1% |
| European | 1,045 | 1.6% |
| Filipino | 91 | 0.1% |
| Finnish | 120 | 0.2% |
| French | 2,072 | 3.2% |
| French Canadian | 1,133 | 1.8% |
| German | 5,802 | 9.0% |
| Ghanaian | 44 | 0.1% |
| Greek | 741 | 1.2% |
| Guatemalan | 67 | 0.1% |
| Guyanese | 194 | 0.3% |
| Haitian | 454 | 0.7% |
| Honduran | 81 | 0.1% |
| Hungarian | 590 | 0.9% |
| Icelander | 10 | 0.0% |
| Indian (Asian) | 1,222 | 1.9% |
| Iranian | 104 | 0.2% |
| Irish | 10,469 | 16.3% |
| Iroquois | 3 | 0.0% |
| Israeli | 96 | 0.2% |
| Italian | 7,720 | 12.0% |
| Jamaican | 591 | 0.9% |
| Japanese | 15 | 0.0% |
| Korean | 253 | 0.4% |
| Laotian | 9 | 0.0% |
| Latvian | 6 | 0.0% |
| Lebanese | 160 | 0.3% |
| Lithuanian | 468 | 0.7% |
| Malaysian | 46 | 0.1% |
| Mexican | 1,007 | 1.6% |
| Mexican American Indian | 72 | 0.1% |
| Mongolian | 122 | 0.2% |
| Moroccan | 30 | 0.1% |
| Navajo | 23 | 0.0% |
| Nicaraguan | 85 | 0.1% |
| Nigerian | 166 | 0.3% |
| Northern European | 154 | 0.2% |
| Norwegian | 398 | 0.6% |
| Pakistani | 38 | 0.1% |
| Palestinian | 22 | 0.0% |
| Panamanian | 128 | 0.2% |
| Pennsylvania German | 10 | 0.0% |
| Peruvian | 596 | 0.9% |
| Polish | 3,692 | 5.8% |
| Portuguese | 1,007 | 1.6% |
| Puerto Rican | 3,048 | 4.8% |
| Romanian | 154 | 0.2% |
| Russian | 1,948 | 3.0% |
| Salvadoran | 275 | 0.4% |
| Scandinavian | 106 | 0.2% |
| Scotch-Irish | 273 | 0.4% |
| Scottish | 919 | 1.4% |
| Senegalese | 11 | 0.0% |
| Serbian | 76 | 0.1% |
| Slovak | 145 | 0.2% |
| Slovene | 13 | 0.0% |
| Somali | 164 | 0.3% |
| South African | 20 | 0.0% |
| South American | 1,955 | 3.0% |
| South American Indian | 58 | 0.1% |
| Spaniard | 362 | 0.6% |
| Spanish | 25 | 0.0% |
| Sri Lankan | 604 | 0.9% |
| Subsaharan African | 545 | 0.9% |
| Swedish | 1,077 | 1.7% |
| Swiss | 171 | 0.3% |
| Syrian | 57 | 0.1% |
| Thai | 1,441 | 2.2% |
| Trinidadian and Tobagonian | 88 | 0.1% |
| Turkish | 47 | 0.1% |
| Ukrainian | 752 | 1.2% |
| Uruguayan | 26 | 0.0% |
| Venezuelan | 82 | 0.1% |
| Vietnamese | 37 | 0.1% |
| Welsh | 210 | 0.3% |
| West Indian | 57 | 0.1% |
| Yugoslavian | 63 | 0.1% | View All 122 Rows |
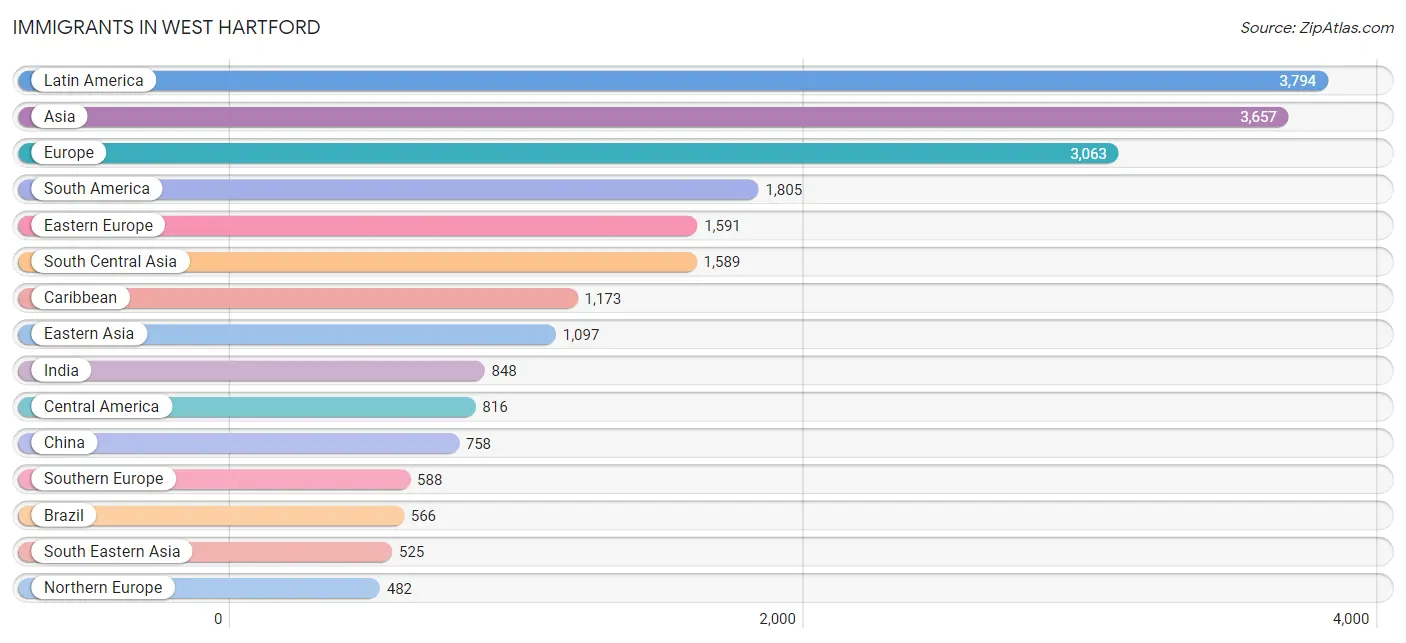
Immigrants in West Hartford
The most numerous immigrant groups reported in West Hartford came from Latin America (3,794 | 5.9%), Asia (3,657 | 5.7%), Europe (3,063 | 4.8%), South America (1,805 | 2.8%), and Eastern Europe (1,591 | 2.5%), together accounting for 21.7% of all West Hartford residents.
| Immigration Origin | # Population | % Population |
| Afghanistan | 81 | 0.1% |
| Africa | 372 | 0.6% |
| Albania | 235 | 0.4% |
| Argentina | 147 | 0.2% |
| Asia | 3,657 | 5.7% |
| Australia | 19 | 0.0% |
| Austria | 15 | 0.0% |
| Azores | 26 | 0.0% |
| Bangladesh | 24 | 0.0% |
| Barbados | 33 | 0.1% |
| Belarus | 133 | 0.2% |
| Belize | 95 | 0.2% |
| Bolivia | 10 | 0.0% |
| Bosnia and Herzegovina | 13 | 0.0% |
| Brazil | 566 | 0.9% |
| Bulgaria | 82 | 0.1% |
| Cambodia | 18 | 0.0% |
| Canada | 244 | 0.4% |
| Caribbean | 1,173 | 1.8% |
| Central America | 816 | 1.3% |
| Chile | 49 | 0.1% |
| China | 758 | 1.2% |
| Colombia | 294 | 0.5% |
| Costa Rica | 77 | 0.1% |
| Cuba | 95 | 0.2% |
| Dominica | 1 | 0.0% |
| Dominican Republic | 299 | 0.5% |
| Eastern Africa | 158 | 0.3% |
| Eastern Asia | 1,097 | 1.7% |
| Eastern Europe | 1,591 | 2.5% |
| Ecuador | 177 | 0.3% |
| Egypt | 7 | 0.0% |
| El Salvador | 114 | 0.2% |
| England | 182 | 0.3% |
| Ethiopia | 92 | 0.1% |
| Europe | 3,063 | 4.8% |
| France | 68 | 0.1% |
| Germany | 249 | 0.4% |
| Ghana | 13 | 0.0% |
| Greece | 45 | 0.1% |
| Guatemala | 59 | 0.1% |
| Guyana | 125 | 0.2% |
| Haiti | 153 | 0.2% |
| Honduras | 10 | 0.0% |
| Hong Kong | 19 | 0.0% |
| Hungary | 11 | 0.0% |
| India | 848 | 1.3% |
| Indonesia | 9 | 0.0% |
| Iran | 65 | 0.1% |
| Ireland | 115 | 0.2% |
| Israel | 89 | 0.1% |
| Italy | 141 | 0.2% |
| Jamaica | 435 | 0.7% |
| Japan | 297 | 0.5% |
| Jordan | 22 | 0.0% |
| Kazakhstan | 7 | 0.0% |
| Korea | 42 | 0.1% |
| Latin America | 3,794 | 5.9% |
| Lebanon | 18 | 0.0% |
| Lithuania | 42 | 0.1% |
| Malaysia | 73 | 0.1% |
| Mexico | 376 | 0.6% |
| Moldova | 6 | 0.0% |
| Morocco | 10 | 0.0% |
| Nepal | 278 | 0.4% |
| Netherlands | 23 | 0.0% |
| Nicaragua | 85 | 0.1% |
| Nigeria | 110 | 0.2% |
| North Macedonia | 14 | 0.0% |
| Northern Africa | 71 | 0.1% |
| Northern Europe | 482 | 0.7% |
| Oceania | 26 | 0.0% |
| Pakistan | 41 | 0.1% |
| Peru | 390 | 0.6% |
| Philippines | 55 | 0.1% |
| Poland | 287 | 0.4% |
| Portugal | 260 | 0.4% |
| Romania | 68 | 0.1% |
| Russia | 350 | 0.5% |
| Saudi Arabia | 45 | 0.1% |
| Scotland | 19 | 0.0% |
| Serbia | 31 | 0.1% |
| Singapore | 7 | 0.0% |
| Somalia | 38 | 0.1% |
| South Africa | 20 | 0.0% |
| South America | 1,805 | 2.8% |
| South Central Asia | 1,589 | 2.5% |
| South Eastern Asia | 525 | 0.8% |
| Southern Europe | 588 | 0.9% |
| Spain | 142 | 0.2% |
| Sri Lanka | 73 | 0.1% |
| St. Vincent and the Grenadines | 23 | 0.0% |
| Sudan | 54 | 0.1% |
| Sweden | 70 | 0.1% |
| Switzerland | 13 | 0.0% |
| Syria | 78 | 0.1% |
| Taiwan | 104 | 0.2% |
| Thailand | 21 | 0.0% |
| Trinidad and Tobago | 15 | 0.0% |
| Turkey | 97 | 0.2% |
| Ukraine | 265 | 0.4% |
| Uruguay | 26 | 0.0% |
| Uzbekistan | 17 | 0.0% |
| Venezuela | 21 | 0.0% |
| Vietnam | 342 | 0.5% |
| Western Africa | 123 | 0.2% |
| Western Asia | 429 | 0.7% |
| Western Europe | 368 | 0.6% |
| Yemen | 30 | 0.1% | View All 109 Rows |
Sex and Age in West Hartford
Sex and Age in West Hartford
The most populous age groups in West Hartford are 25 to 29 Years (2,623 | 8.6%) for men and 25 to 29 Years (2,762 | 8.2%) for women.
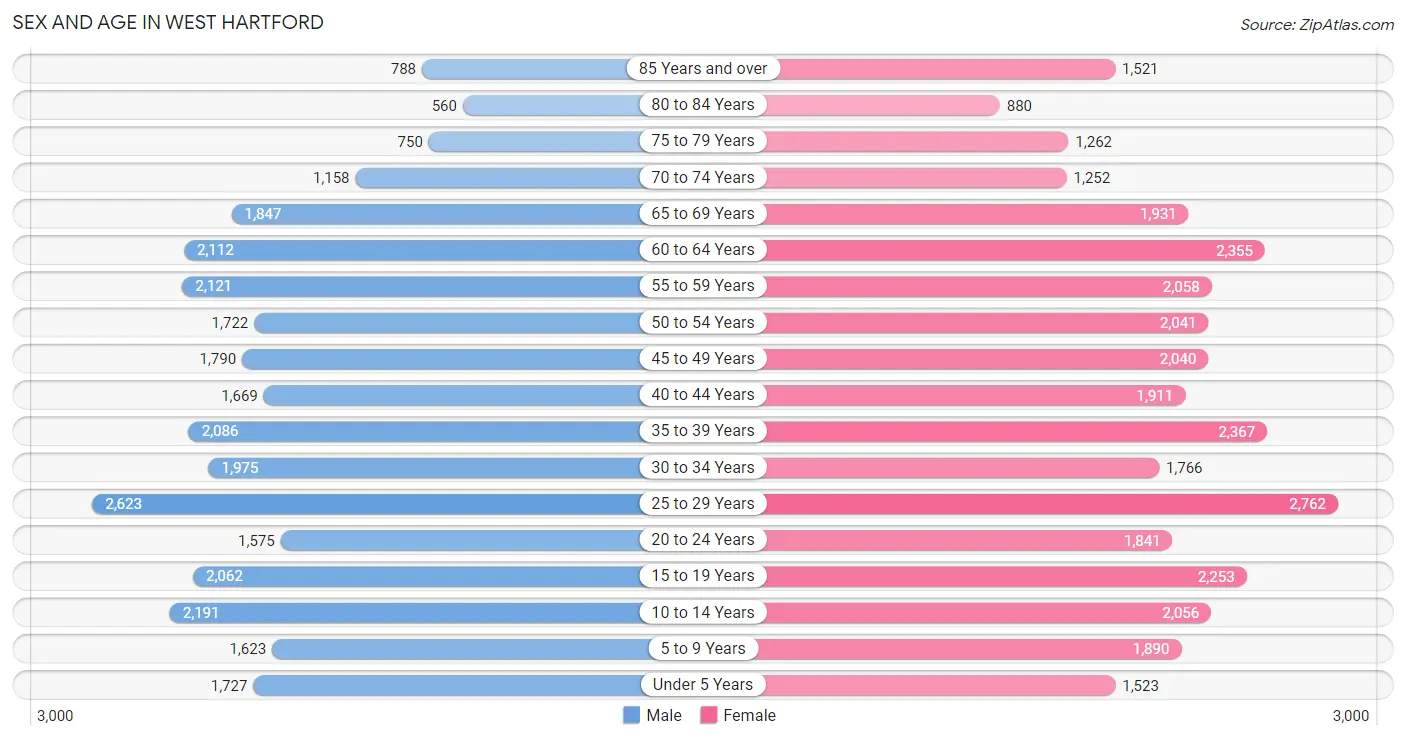
| Age Bracket | Male | Female |
| Under 5 Years | 1,727 (5.7%) | 1,523 (4.5%) |
| 5 to 9 Years | 1,623 (5.3%) | 1,890 (5.6%) |
| 10 to 14 Years | 2,191 (7.2%) | 2,056 (6.1%) |
| 15 to 19 Years | 2,062 (6.8%) | 2,253 (6.7%) |
| 20 to 24 Years | 1,575 (5.2%) | 1,841 (5.5%) |
| 25 to 29 Years | 2,623 (8.6%) | 2,762 (8.2%) |
| 30 to 34 Years | 1,975 (6.5%) | 1,766 (5.2%) |
| 35 to 39 Years | 2,086 (6.9%) | 2,367 (7.0%) |
| 40 to 44 Years | 1,669 (5.5%) | 1,911 (5.7%) |
| 45 to 49 Years | 1,790 (5.9%) | 2,040 (6.0%) |
| 50 to 54 Years | 1,722 (5.7%) | 2,041 (6.0%) |
| 55 to 59 Years | 2,121 (7.0%) | 2,058 (6.1%) |
| 60 to 64 Years | 2,112 (7.0%) | 2,355 (7.0%) |
| 65 to 69 Years | 1,847 (6.1%) | 1,931 (5.7%) |
| 70 to 74 Years | 1,158 (3.8%) | 1,252 (3.7%) |
| 75 to 79 Years | 750 (2.5%) | 1,262 (3.7%) |
| 80 to 84 Years | 560 (1.8%) | 880 (2.6%) |
| 85 Years and over | 788 (2.6%) | 1,521 (4.5%) |
| Total | 30,379 (100.0%) | 33,709 (100.0%) |
Families and Households in West Hartford
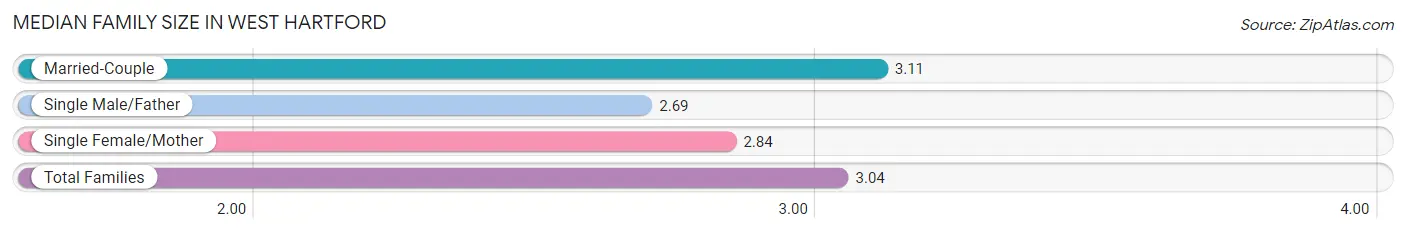
Median Family Size in West Hartford
The median family size in West Hartford is 3.04 persons per family, with married-couple families (12,522 | 77.8%) accounting for the largest median family size of 3.11 persons per family. On the other hand, single male/father families (868 | 5.4%) represent the smallest median family size with 2.69 persons per family.
| Family Type | # Families | Family Size |
| Married-Couple | 12,522 (77.8%) | 3.11 |
| Single Male/Father | 868 (5.4%) | 2.69 |
| Single Female/Mother | 2,694 (16.8%) | 2.84 |
| Total Families | 16,084 (100.0%) | 3.04 |
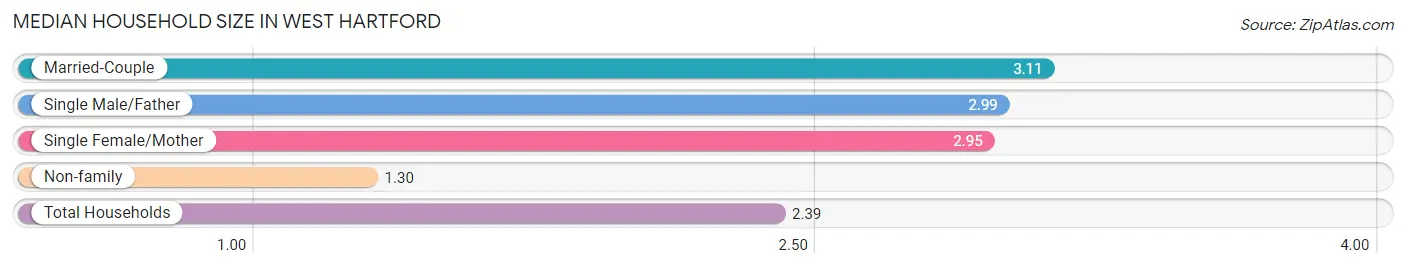
Median Household Size in West Hartford
The median household size in West Hartford is 2.39 persons per household, with married-couple households (12,522 | 48.0%) accounting for the largest median household size of 3.11 persons per household. non-family households (10,016 | 38.4%) represent the smallest median household size with 1.30 persons per household.
| Household Type | # Households | Household Size |
| Married-Couple | 12,522 (48.0%) | 3.11 |
| Single Male/Father | 868 (3.3%) | 2.99 |
| Single Female/Mother | 2,694 (10.3%) | 2.95 |
| Non-family | 10,016 (38.4%) | 1.30 |
| Total Households | 26,100 (100.0%) | 2.39 |
Household Size by Marriage Status in West Hartford
Out of a total of 26,100 households in West Hartford, 16,084 (61.6%) are family households, while 10,016 (38.4%) are nonfamily households. The most numerous type of family households are 2-person households, comprising 6,513, and the most common type of nonfamily households are 1-person households, comprising 7,724.
| Household Size | Family Households | Nonfamily Households |
| 1-Person Households | - | 7,724 (29.6%) |
| 2-Person Households | 6,513 (24.9%) | 1,987 (7.6%) |
| 3-Person Households | 4,231 (16.2%) | 200 (0.8%) |
| 4-Person Households | 3,927 (15.0%) | 66 (0.3%) |
| 5-Person Households | 1,073 (4.1%) | 27 (0.1%) |
| 6-Person Households | 243 (0.9%) | 0 (0.0%) |
| 7+ Person Households | 97 (0.4%) | 12 (0.1%) |
| Total | 16,084 (61.6%) | 10,016 (38.4%) |
Female Fertility in West Hartford
Fertility by Age in West Hartford
Average fertility rate in West Hartford is 38.0 births per 1,000 women. Women in the age bracket of 20 to 34 years have the highest fertility rate with 48.0 births per 1,000 women. Women in the age bracket of 20 to 34 years acount for 53.4% of all women with births.
| Age Bracket | Women with Births | Births / 1,000 Women |
| 15 to 19 years | 0 (0.0%) | 0.0 |
| 20 to 34 years | 308 (53.4%) | 48.0 |
| 35 to 50 years | 269 (46.6%) | 40.0 |
| Total | 577 (100.0%) | 38.0 |
Fertility by Age by Marriage Status in West Hartford
92.4% of women with births (577) in West Hartford are married. The highest percentage of unmarried women with births falls into 20 to 34 years age bracket with 14.3% of them unmarried at the time of birth, while the lowest percentage of unmarried women with births belong to 35 to 50 years age bracket with 0.0% of them unmarried.
| Age Bracket | Married | Unmarried |
| 15 to 19 years | 0 (0.0%) | 0 (0.0%) |
| 20 to 34 years | 264 (85.7%) | 44 (14.3%) |
| 35 to 50 years | 269 (100.0%) | 0 (0.0%) |
| Total | 533 (92.4%) | 44 (7.6%) |
Fertility by Education in West Hartford
Average fertility rate in West Hartford is 38.0 births per 1,000 women. Women with the education attainment of graduate degree have the highest fertility rate of 65.0 births per 1,000 women, while women with the education attainment of less than high school have the lowest fertility at 7.0 births per 1,000 women. Women with the education attainment of graduate degree represent 50.4% of all women with births.
| Educational Attainment | Women with Births | Births / 1,000 Women |
| Less than High School | 15 (2.6%) | 7.0 |
| High School Diploma | 20 (3.5%) | 13.0 |
| College or Associate's Degree | 74 (12.8%) | 29.0 |
| Bachelor's Degree | 177 (30.7%) | 37.0 |
| Graduate Degree | 291 (50.4%) | 65.0 |
| Total | 577 (100.0%) | 38.0 |
Fertility by Education by Marriage Status in West Hartford
7.6% of women with births in West Hartford are unmarried. Women with the educational attainment of graduate degree are most likely to be married with 100.0% of them married at childbirth, while women with the educational attainment of less than high school are least likely to be married with 46.7% of them unmarried at childbirth.
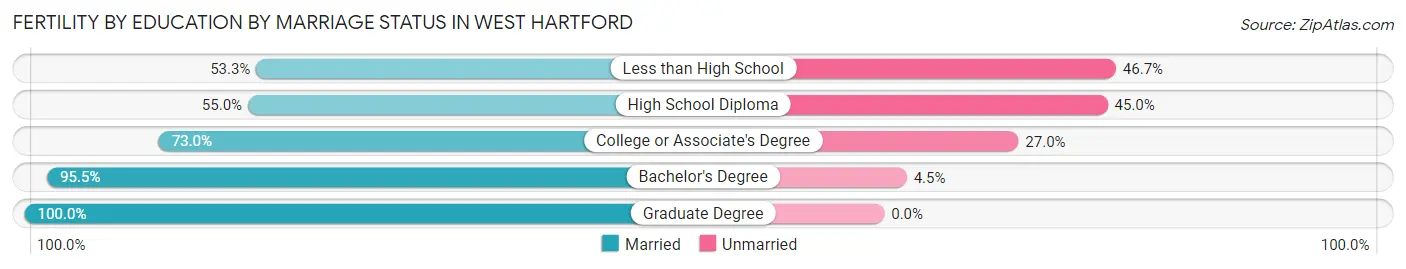
| Educational Attainment | Married | Unmarried |
| Less than High School | 8 (53.3%) | 7 (46.7%) |
| High School Diploma | 11 (55.0%) | 9 (45.0%) |
| College or Associate's Degree | 54 (73.0%) | 20 (27.0%) |
| Bachelor's Degree | 169 (95.5%) | 8 (4.5%) |
| Graduate Degree | 291 (100.0%) | 0 (0.0%) |
| Total | 533 (92.4%) | 44 (7.6%) |
Employment Characteristics in West Hartford
Employment by Class of Employer in West Hartford
Among the 33,756 employed individuals in West Hartford, private company employees (21,429 | 63.5%), not-for-profit organizations (3,941 | 11.7%), and local government employees (2,693 | 8.0%) make up the most common classes of employment.
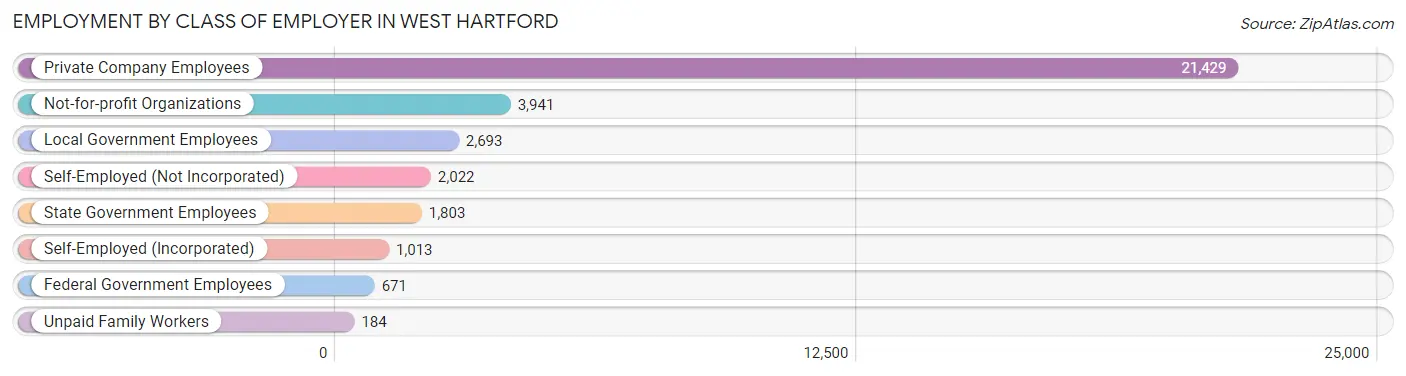
| Employer Class | # Employees | % Employees |
| Private Company Employees | 21,429 | 63.5% |
| Self-Employed (Incorporated) | 1,013 | 3.0% |
| Self-Employed (Not Incorporated) | 2,022 | 6.0% |
| Not-for-profit Organizations | 3,941 | 11.7% |
| Local Government Employees | 2,693 | 8.0% |
| State Government Employees | 1,803 | 5.3% |
| Federal Government Employees | 671 | 2.0% |
| Unpaid Family Workers | 184 | 0.5% |
| Total | 33,756 | 100.0% |
Employment Status by Age in West Hartford
According to the labor force statistics for West Hartford, out of the total population over 16 years of age (51,895), 68.9% or 35,756 individuals are in the labor force, with 3.9% or 1,394 of them unemployed. The age group with the highest labor force participation rate is 30 to 34 years, with 93.6% or 3,502 individuals in the labor force. Within the labor force, the 16 to 19 years age range has the highest percentage of unemployed individuals, with 8.8% or 90 of them being unemployed.
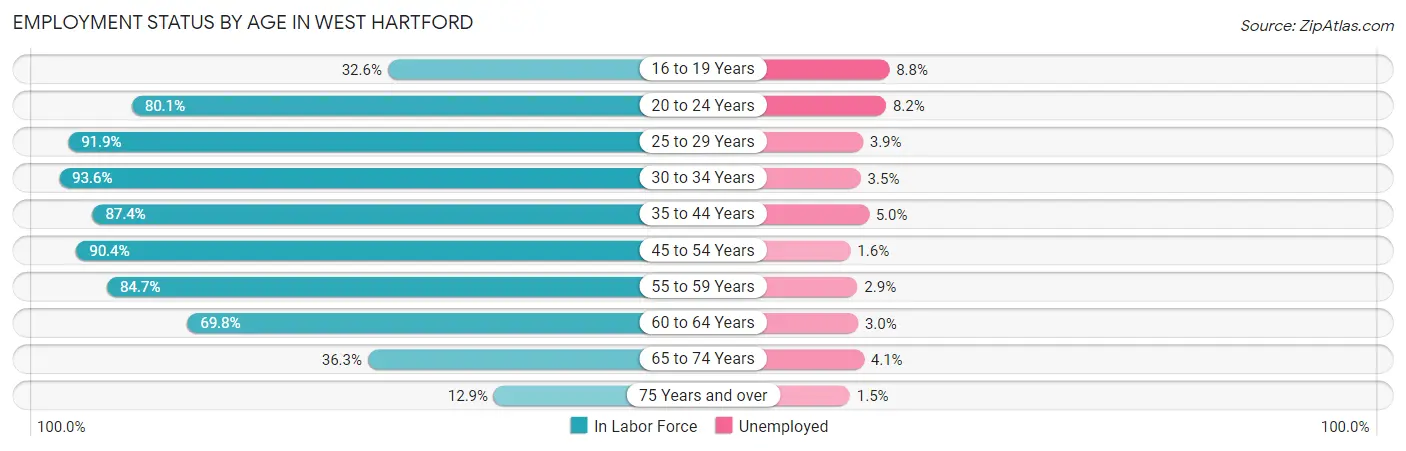
| Age Bracket | In Labor Force | Unemployed |
| 16 to 19 Years | 1,021 (32.6%) | 90 (8.8%) |
| 20 to 24 Years | 2,736 (80.1%) | 224 (8.2%) |
| 25 to 29 Years | 4,949 (91.9%) | 193 (3.9%) |
| 30 to 34 Years | 3,502 (93.6%) | 123 (3.5%) |
| 35 to 44 Years | 7,021 (87.4%) | 351 (5.0%) |
| 45 to 54 Years | 6,864 (90.4%) | 110 (1.6%) |
| 55 to 59 Years | 3,540 (84.7%) | 103 (2.9%) |
| 60 to 64 Years | 3,118 (69.8%) | 94 (3.0%) |
| 65 to 74 Years | 2,246 (36.3%) | 92 (4.1%) |
| 75 Years and over | 743 (12.9%) | 11 (1.5%) |
| Total | 35,756 (68.9%) | 1,394 (3.9%) |
Employment Status by Educational Attainment in West Hartford
According to labor force statistics for West Hartford, 86.8% of individuals (28,989) out of the total population between 25 and 64 years of age (33,398) are in the labor force, with 3.4% or 986 of them being unemployed. The group with the highest labor force participation rate are those with the educational attainment of bachelor's degree or higher, with 90.7% or 21,109 individuals in the labor force. Within the labor force, individuals with less than high school education have the highest percentage of unemployment, with 10.5% or 94 of them being unemployed.
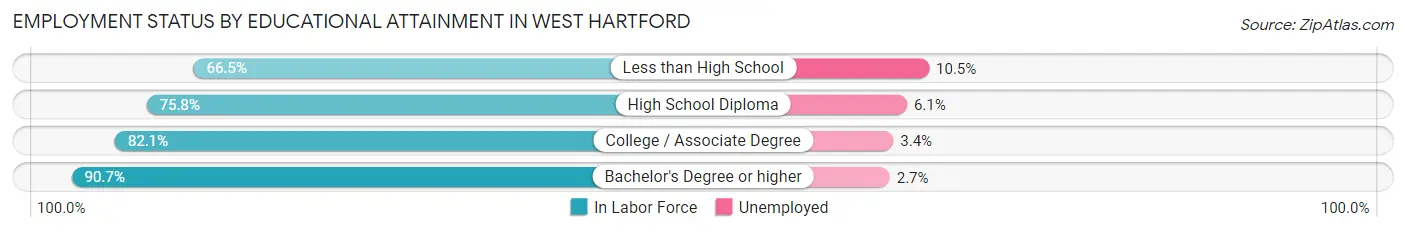
| Educational Attainment | In Labor Force | Unemployed |
| Less than High School | 894 (66.5%) | 141 (10.5%) |
| High School Diploma | 2,730 (75.8%) | 220 (6.1%) |
| College / Associate Degree | 4,253 (82.1%) | 176 (3.4%) |
| Bachelor's Degree or higher | 21,109 (90.7%) | 628 (2.7%) |
| Total | 28,989 (86.8%) | 1,136 (3.4%) |
Employment Occupations by Sex in West Hartford
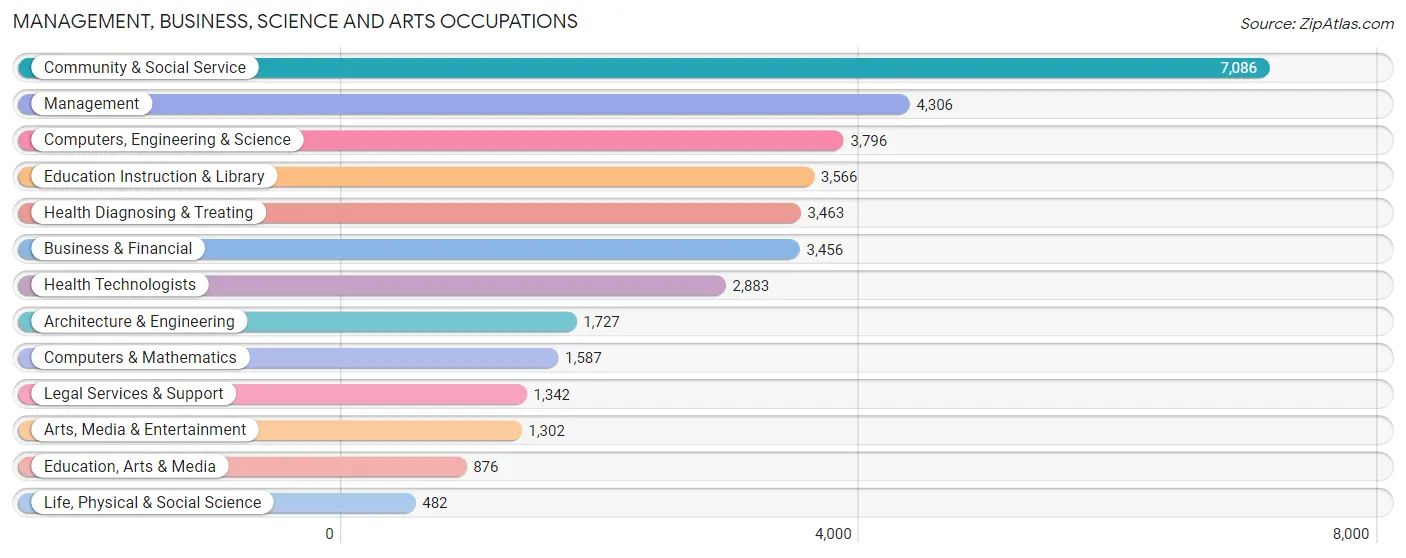
Management, Business, Science and Arts Occupations
The most common Management, Business, Science and Arts occupations in West Hartford are Community & Social Service (7,086 | 20.7%), Management (4,306 | 12.6%), Computers, Engineering & Science (3,796 | 11.1%), Education Instruction & Library (3,566 | 10.4%), and Health Diagnosing & Treating (3,463 | 10.1%).
Management, Business, Science and Arts Occupations by Sex
Within the Management, Business, Science and Arts occupations in West Hartford, the most male-oriented occupations are Architecture & Engineering (86.5%), Computers, Engineering & Science (71.4%), and Computers & Mathematics (64.0%), while the most female-oriented occupations are Education Instruction & Library (70.0%), Education, Arts & Media (68.7%), and Health Diagnosing & Treating (66.2%).
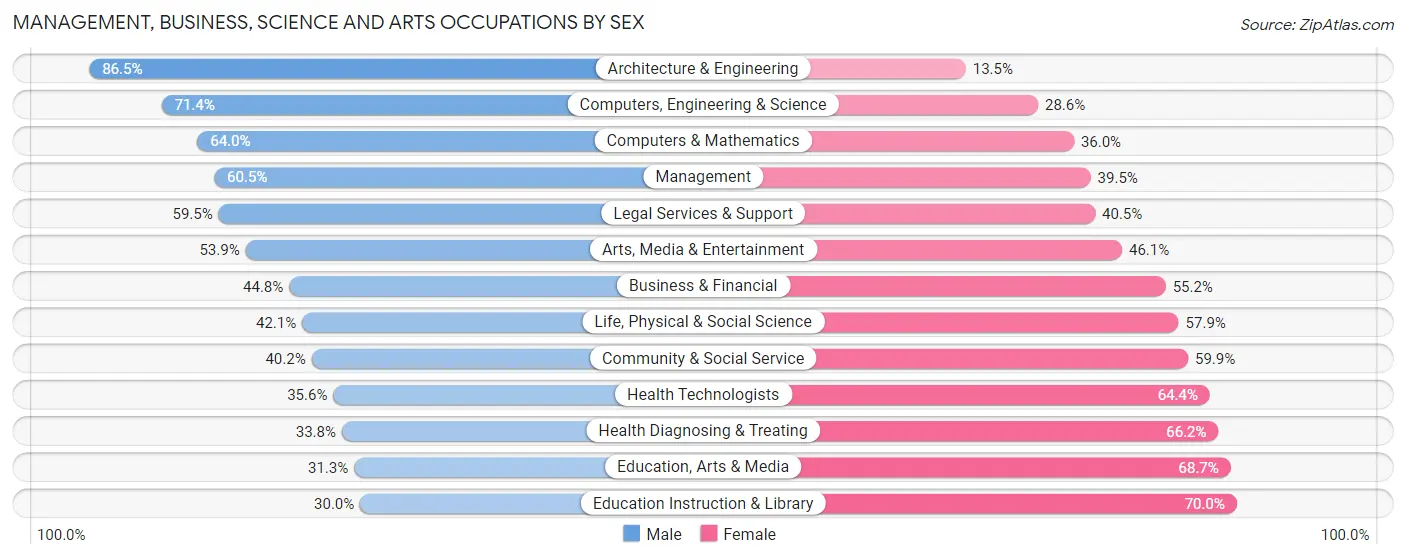
| Occupation | Male | Female |
| Management | 2,604 (60.5%) | 1,702 (39.5%) |
| Business & Financial | 1,549 (44.8%) | 1,907 (55.2%) |
| Computers, Engineering & Science | 2,712 (71.4%) | 1,084 (28.6%) |
| Computers & Mathematics | 1,015 (64.0%) | 572 (36.0%) |
| Architecture & Engineering | 1,494 (86.5%) | 233 (13.5%) |
| Life, Physical & Social Science | 203 (42.1%) | 279 (57.9%) |
| Community & Social Service | 2,845 (40.2%) | 4,241 (59.9%) |
| Education, Arts & Media | 274 (31.3%) | 602 (68.7%) |
| Legal Services & Support | 799 (59.5%) | 543 (40.5%) |
| Education Instruction & Library | 1,070 (30.0%) | 2,496 (70.0%) |
| Arts, Media & Entertainment | 702 (53.9%) | 600 (46.1%) |
| Health Diagnosing & Treating | 1,172 (33.8%) | 2,291 (66.2%) |
| Health Technologists | 1,027 (35.6%) | 1,856 (64.4%) |
| Total (Category) | 10,882 (49.2%) | 11,225 (50.8%) |
| Total (Overall) | 17,477 (51.1%) | 16,750 (48.9%) |
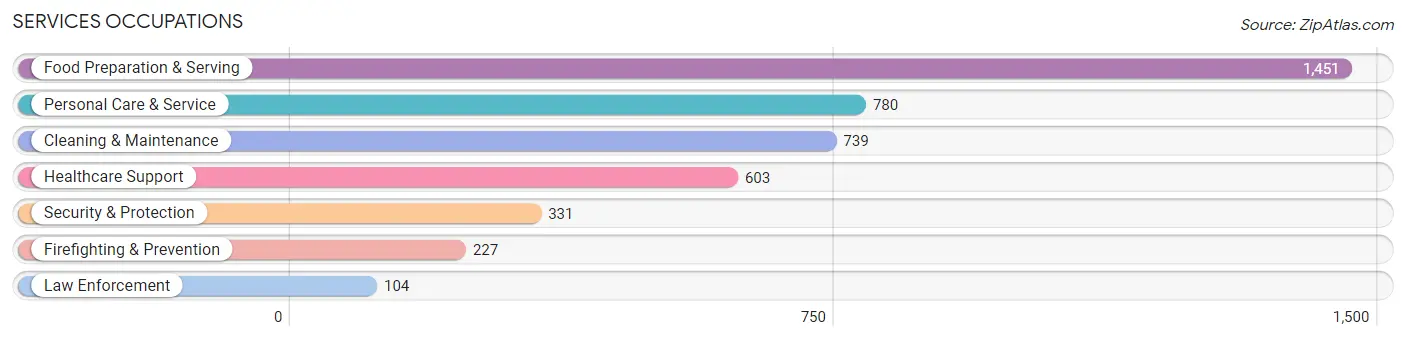
Services Occupations
The most common Services occupations in West Hartford are Food Preparation & Serving (1,451 | 4.2%), Personal Care & Service (780 | 2.3%), Cleaning & Maintenance (739 | 2.2%), Healthcare Support (603 | 1.8%), and Security & Protection (331 | 1.0%).
Services Occupations by Sex
Within the Services occupations in West Hartford, the most male-oriented occupations are Firefighting & Prevention (81.5%), Security & Protection (79.5%), and Law Enforcement (75.0%), while the most female-oriented occupations are Healthcare Support (80.1%), Personal Care & Service (70.3%), and Food Preparation & Serving (46.9%).
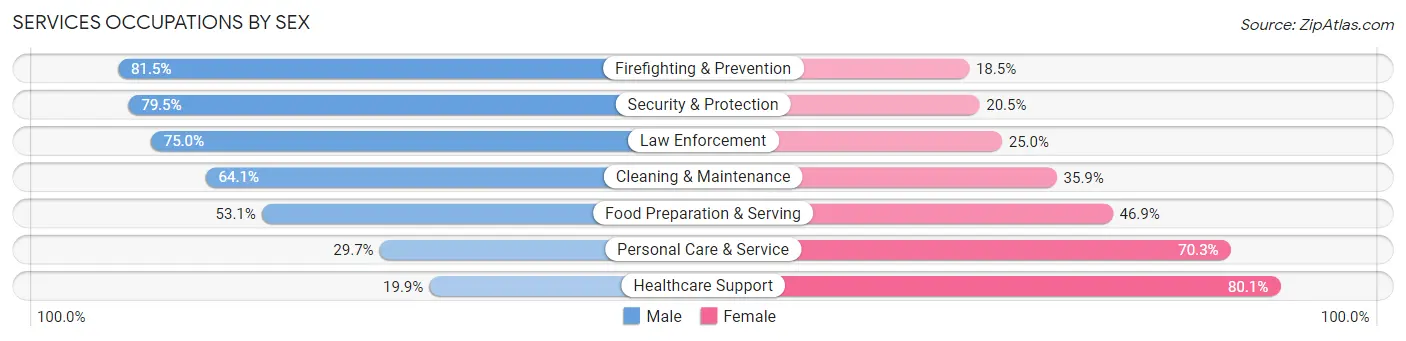
| Occupation | Male | Female |
| Healthcare Support | 120 (19.9%) | 483 (80.1%) |
| Security & Protection | 263 (79.5%) | 68 (20.5%) |
| Firefighting & Prevention | 185 (81.5%) | 42 (18.5%) |
| Law Enforcement | 78 (75.0%) | 26 (25.0%) |
| Food Preparation & Serving | 770 (53.1%) | 681 (46.9%) |
| Cleaning & Maintenance | 474 (64.1%) | 265 (35.9%) |
| Personal Care & Service | 232 (29.7%) | 548 (70.3%) |
| Total (Category) | 1,859 (47.6%) | 2,045 (52.4%) |
| Total (Overall) | 17,477 (51.1%) | 16,750 (48.9%) |
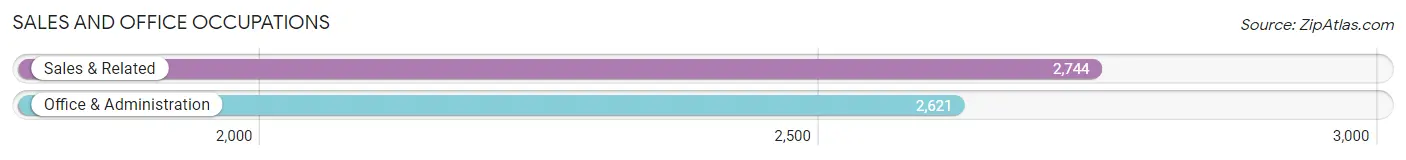
Sales and Office Occupations
The most common Sales and Office occupations in West Hartford are Sales & Related (2,744 | 8.0%), and Office & Administration (2,621 | 7.7%).
Sales and Office Occupations by Sex
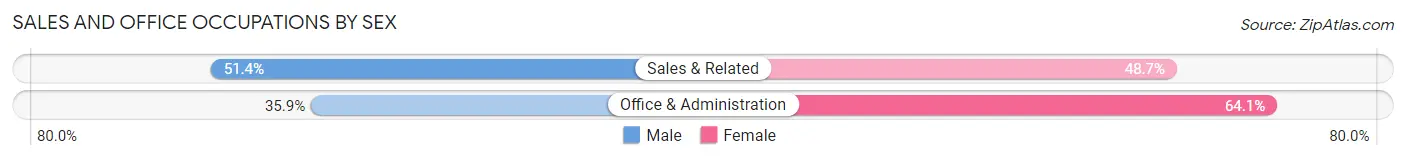
| Occupation | Male | Female |
| Sales & Related | 1,409 (51.3%) | 1,335 (48.6%) |
| Office & Administration | 942 (35.9%) | 1,679 (64.1%) |
| Total (Category) | 2,351 (43.8%) | 3,014 (56.2%) |
| Total (Overall) | 17,477 (51.1%) | 16,750 (48.9%) |
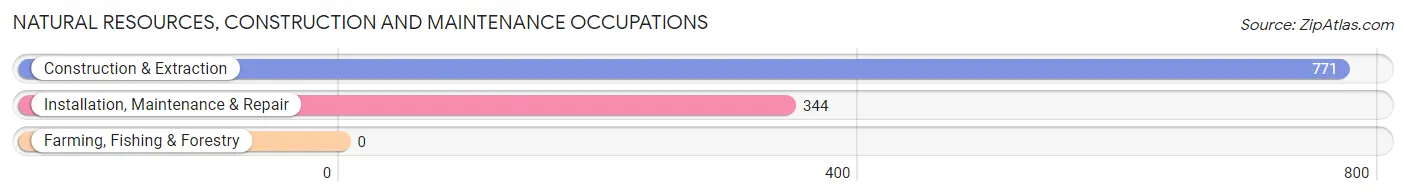
Natural Resources, Construction and Maintenance Occupations
The most common Natural Resources, Construction and Maintenance occupations in West Hartford are Construction & Extraction (771 | 2.2%), and Installation, Maintenance & Repair (344 | 1.0%).
Natural Resources, Construction and Maintenance Occupations by Sex
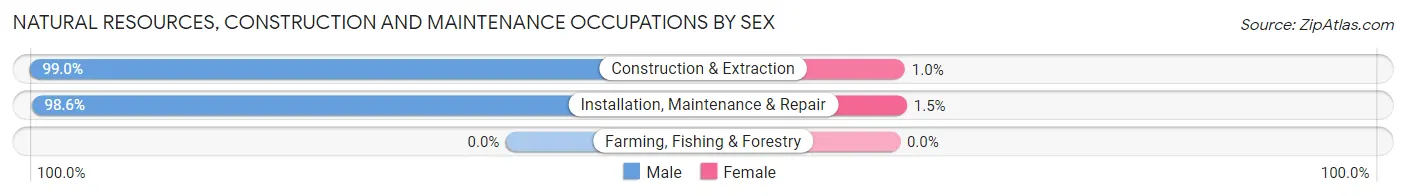
| Occupation | Male | Female |
| Farming, Fishing & Forestry | 0 (0.0%) | 0 (0.0%) |
| Construction & Extraction | 763 (99.0%) | 8 (1.0%) |
| Installation, Maintenance & Repair | 339 (98.6%) | 5 (1.5%) |
| Total (Category) | 1,102 (98.8%) | 13 (1.2%) |
| Total (Overall) | 17,477 (51.1%) | 16,750 (48.9%) |
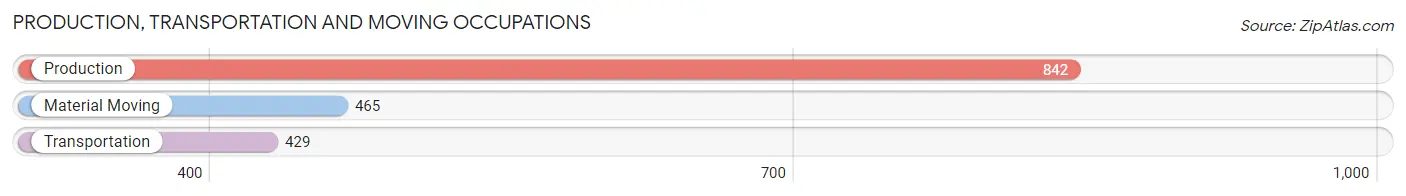
Production, Transportation and Moving Occupations
The most common Production, Transportation and Moving occupations in West Hartford are Production (842 | 2.5%), Material Moving (465 | 1.4%), and Transportation (429 | 1.3%).
Production, Transportation and Moving Occupations by Sex
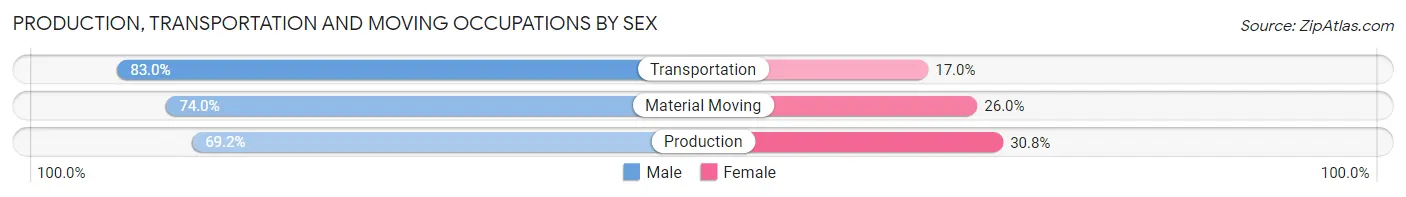
| Occupation | Male | Female |
| Production | 583 (69.2%) | 259 (30.8%) |
| Transportation | 356 (83.0%) | 73 (17.0%) |
| Material Moving | 344 (74.0%) | 121 (26.0%) |
| Total (Category) | 1,283 (73.9%) | 453 (26.1%) |
| Total (Overall) | 17,477 (51.1%) | 16,750 (48.9%) |
Employment Industries by Sex in West Hartford
Employment Industries in West Hartford
The major employment industries in West Hartford include Health Care & Social Assistance (6,048 | 17.7%), Educational Services (4,790 | 14.0%), Finance & Insurance (4,493 | 13.1%), Manufacturing (3,709 | 10.8%), and Professional & Scientific (3,297 | 9.6%).
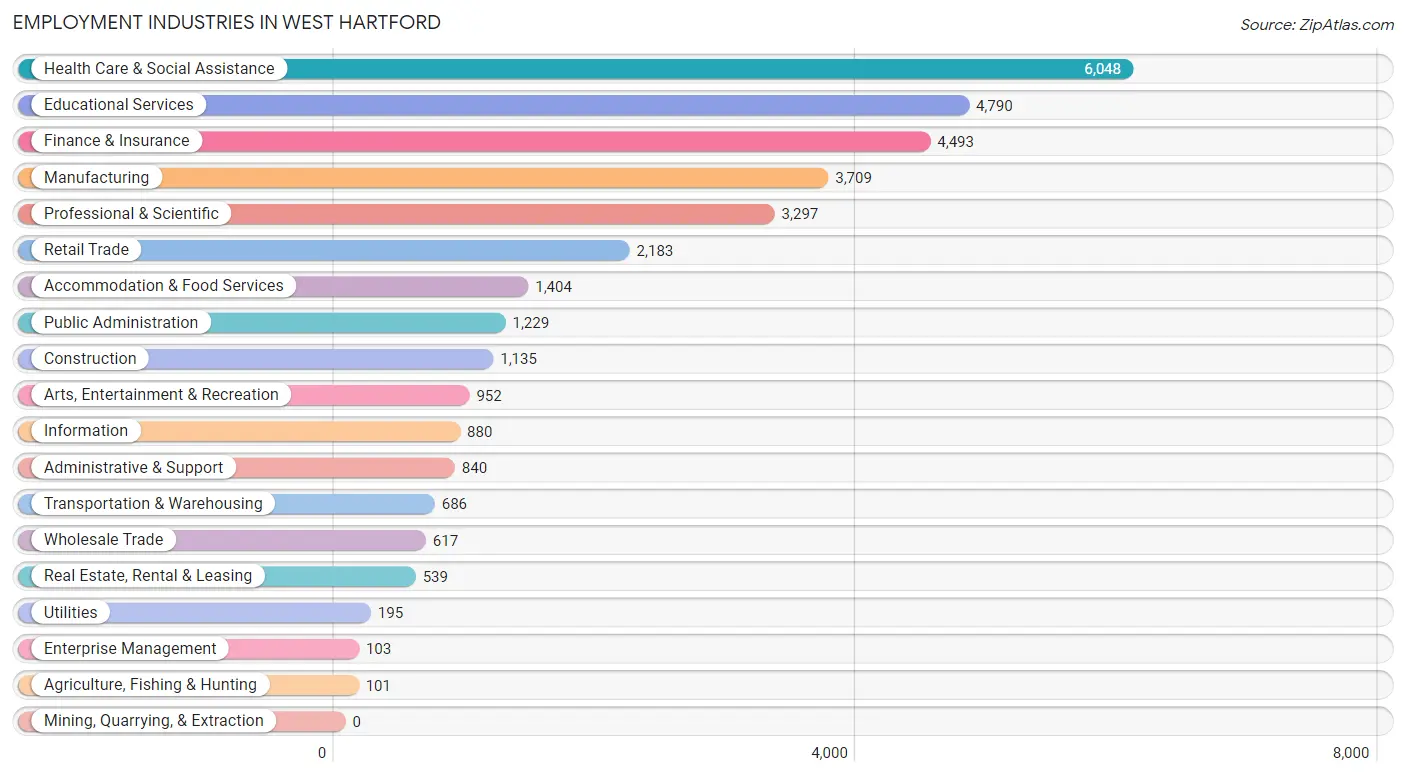
Employment Industries by Sex in West Hartford
The West Hartford industries that see more men than women are Agriculture, Fishing & Hunting (100.0%), Construction (85.8%), and Wholesale Trade (80.9%), whereas the industries that tend to have a higher number of women are Health Care & Social Assistance (67.2%), Educational Services (65.5%), and Retail Trade (56.6%).
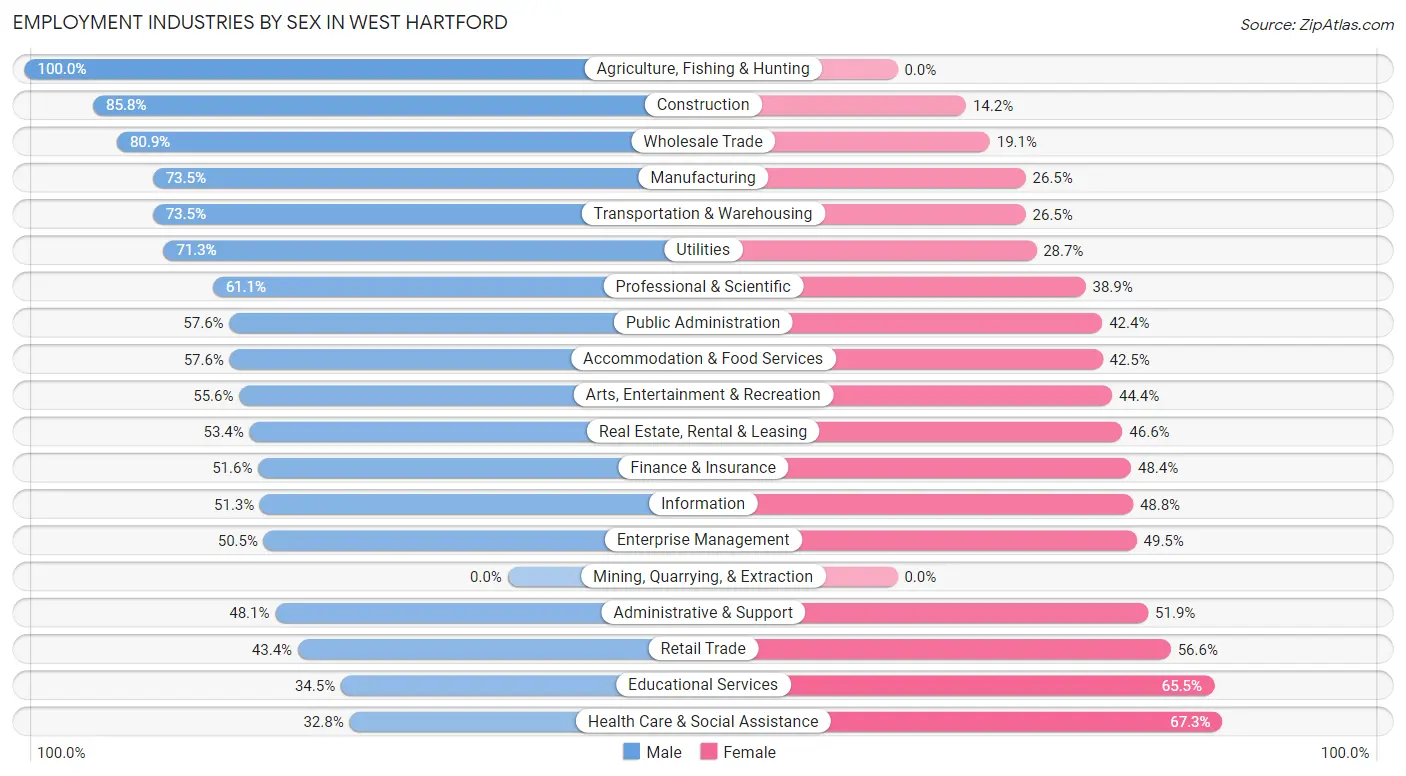
| Industry | Male | Female |
| Agriculture, Fishing & Hunting | 101 (100.0%) | 0 (0.0%) |
| Mining, Quarrying, & Extraction | 0 (0.0%) | 0 (0.0%) |
| Construction | 974 (85.8%) | 161 (14.2%) |
| Manufacturing | 2,725 (73.5%) | 984 (26.5%) |
| Wholesale Trade | 499 (80.9%) | 118 (19.1%) |
| Retail Trade | 948 (43.4%) | 1,235 (56.6%) |
| Transportation & Warehousing | 504 (73.5%) | 182 (26.5%) |
| Utilities | 139 (71.3%) | 56 (28.7%) |
| Information | 451 (51.2%) | 429 (48.7%) |
| Finance & Insurance | 2,320 (51.6%) | 2,173 (48.4%) |
| Real Estate, Rental & Leasing | 288 (53.4%) | 251 (46.6%) |
| Professional & Scientific | 2,013 (61.1%) | 1,284 (38.9%) |
| Enterprise Management | 52 (50.5%) | 51 (49.5%) |
| Administrative & Support | 404 (48.1%) | 436 (51.9%) |
| Educational Services | 1,653 (34.5%) | 3,137 (65.5%) |
| Health Care & Social Assistance | 1,981 (32.8%) | 4,067 (67.2%) |
| Arts, Entertainment & Recreation | 529 (55.6%) | 423 (44.4%) |
| Accommodation & Food Services | 808 (57.6%) | 596 (42.4%) |
| Public Administration | 708 (57.6%) | 521 (42.4%) |
| Total | 17,477 (51.1%) | 16,750 (48.9%) |
Education in West Hartford
School Enrollment in West Hartford
The most common levels of schooling among the 15,844 students in West Hartford are high school (3,806 | 24.0%), middle school (3,521 | 22.2%), and elementary school (3,011 | 19.0%).
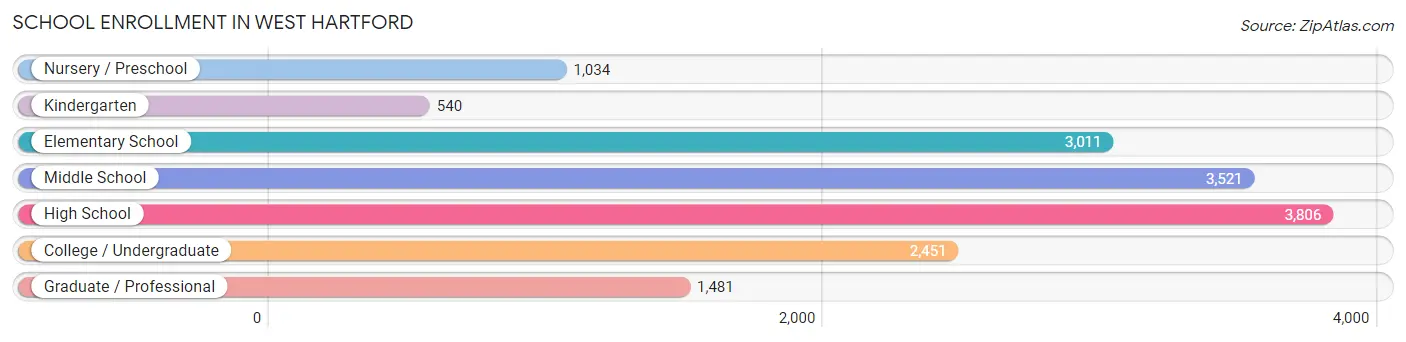
| School Level | # Students | % Students |
| Nursery / Preschool | 1,034 | 6.5% |
| Kindergarten | 540 | 3.4% |
| Elementary School | 3,011 | 19.0% |
| Middle School | 3,521 | 22.2% |
| High School | 3,806 | 24.0% |
| College / Undergraduate | 2,451 | 15.5% |
| Graduate / Professional | 1,481 | 9.3% |
| Total | 15,844 | 100.0% |
School Enrollment by Age by Funding Source in West Hartford
Out of a total of 15,844 students who are enrolled in schools in West Hartford, 3,074 (19.4%) attend a private institution, while the remaining 12,770 (80.6%) are enrolled in public schools. The age group of 35 years and over has the highest likelihood of being enrolled in private schools, with 393 (52.7% in the age bracket) enrolled. Conversely, the age group of 10 to 14 year olds has the lowest likelihood of being enrolled in a private school, with 3,837 (90.9% in the age bracket) attending a public institution.
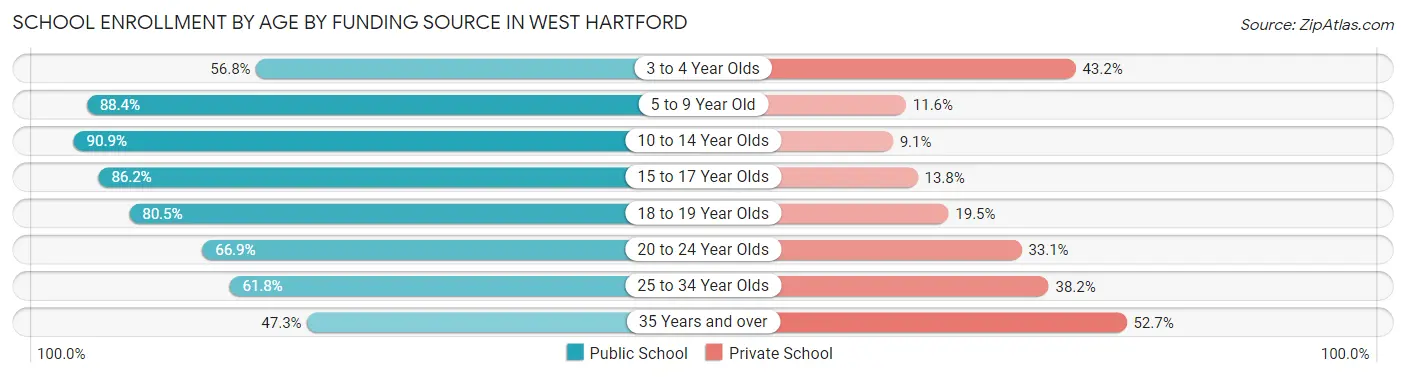
| Age Bracket | Public School | Private School |
| 3 to 4 Year Olds | 504 (56.8%) | 383 (43.2%) |
| 5 to 9 Year Old | 2,985 (88.4%) | 391 (11.6%) |
| 10 to 14 Year Olds | 3,837 (90.9%) | 386 (9.1%) |
| 15 to 17 Year Olds | 2,533 (86.2%) | 404 (13.8%) |
| 18 to 19 Year Olds | 937 (80.5%) | 227 (19.5%) |
| 20 to 24 Year Olds | 917 (66.9%) | 454 (33.1%) |
| 25 to 34 Year Olds | 705 (61.8%) | 435 (38.2%) |
| 35 Years and over | 353 (47.3%) | 393 (52.7%) |
| Total | 12,770 (80.6%) | 3,074 (19.4%) |
Educational Attainment by Field of Study in West Hartford
Business (5,789 | 17.6%), social sciences (4,484 | 13.7%), engineering (2,963 | 9.0%), education (2,634 | 8.0%), and science & technology (2,439 | 7.4%) are the most common fields of study among 32,843 individuals in West Hartford who have obtained a bachelor's degree or higher.
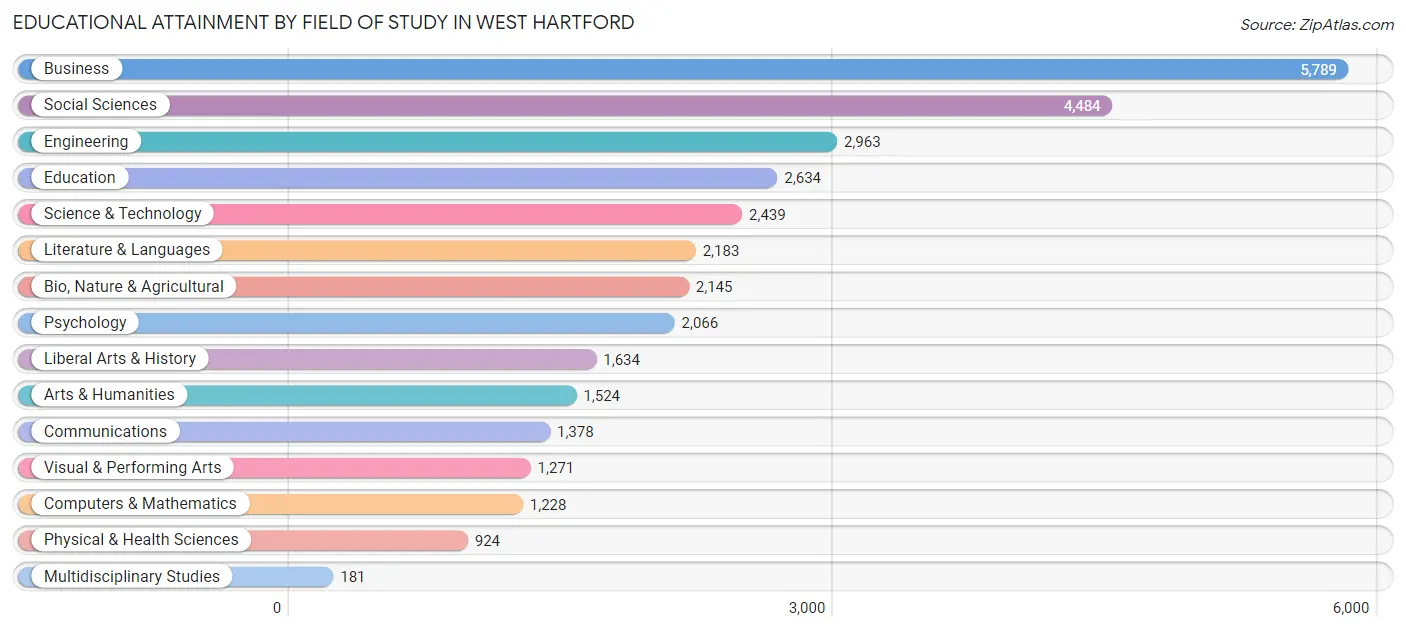
| Field of Study | # Graduates | % Graduates |
| Computers & Mathematics | 1,228 | 3.7% |
| Bio, Nature & Agricultural | 2,145 | 6.5% |
| Physical & Health Sciences | 924 | 2.8% |
| Psychology | 2,066 | 6.3% |
| Social Sciences | 4,484 | 13.7% |
| Engineering | 2,963 | 9.0% |
| Multidisciplinary Studies | 181 | 0.5% |
| Science & Technology | 2,439 | 7.4% |
| Business | 5,789 | 17.6% |
| Education | 2,634 | 8.0% |
| Literature & Languages | 2,183 | 6.7% |
| Liberal Arts & History | 1,634 | 5.0% |
| Visual & Performing Arts | 1,271 | 3.9% |
| Communications | 1,378 | 4.2% |
| Arts & Humanities | 1,524 | 4.6% |
| Total | 32,843 | 100.0% |
Transportation & Commute in West Hartford
Vehicle Availability by Sex in West Hartford
The most prevalent vehicle ownership categories in West Hartford are males with 2 vehicles (9,170, accounting for 52.9%) and females with 2 vehicles (7,787, making up 56.6%).
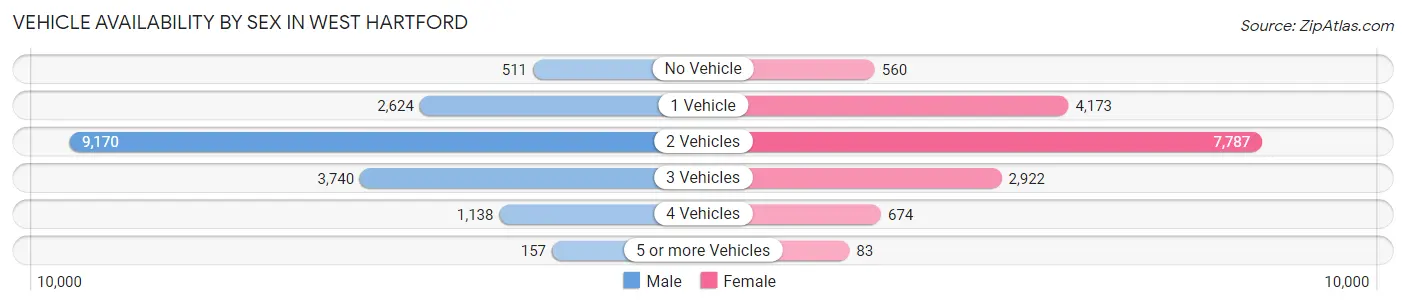
| Vehicles Available | Male | Female |
| No Vehicle | 511 (2.9%) | 560 (3.5%) |
| 1 Vehicle | 2,624 (15.1%) | 4,173 (25.8%) |
| 2 Vehicles | 9,170 (52.9%) | 7,787 (48.1%) |
| 3 Vehicles | 3,740 (21.6%) | 2,922 (18.0%) |
| 4 Vehicles | 1,138 (6.6%) | 674 (4.2%) |
| 5 or more Vehicles | 157 (0.9%) | 83 (0.5%) |
| Total | 17,340 (100.0%) | 16,199 (100.0%) |
Commute Time in West Hartford
The most frequently occuring commute durations in West Hartford are 10 to 14 minutes (5,979 commuters, 21.5%), 15 to 19 minutes (5,385 commuters, 19.4%), and 20 to 24 minutes (5,191 commuters, 18.7%).
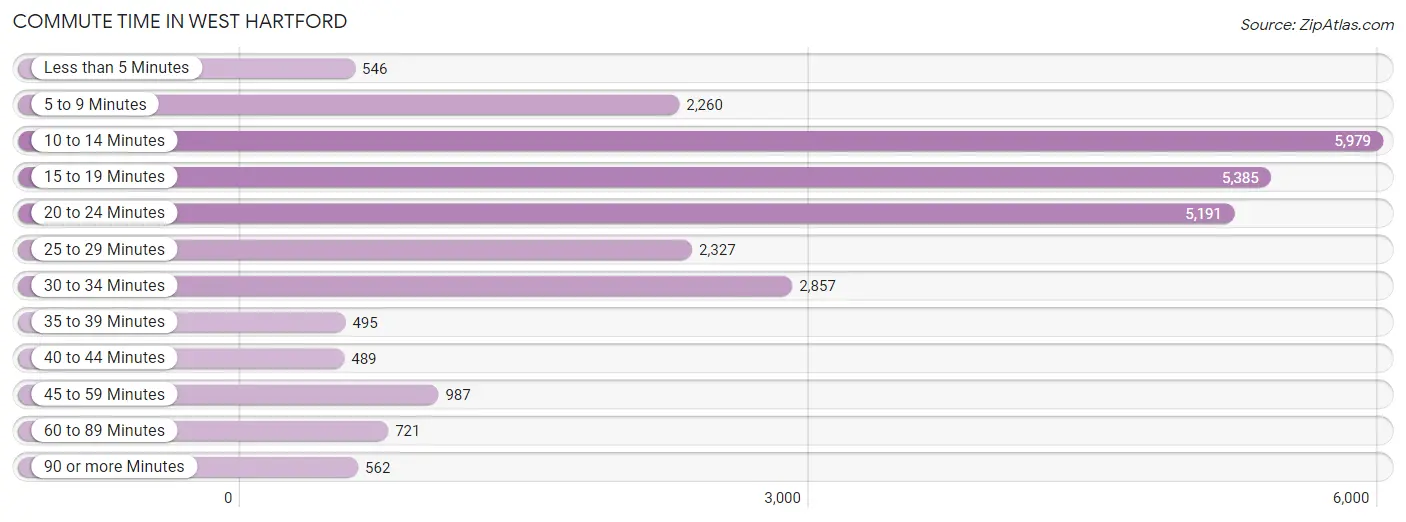
| Commute Time | # Commuters | % Commuters |
| Less than 5 Minutes | 546 | 2.0% |
| 5 to 9 Minutes | 2,260 | 8.1% |
| 10 to 14 Minutes | 5,979 | 21.5% |
| 15 to 19 Minutes | 5,385 | 19.4% |
| 20 to 24 Minutes | 5,191 | 18.7% |
| 25 to 29 Minutes | 2,327 | 8.4% |
| 30 to 34 Minutes | 2,857 | 10.3% |
| 35 to 39 Minutes | 495 | 1.8% |
| 40 to 44 Minutes | 489 | 1.8% |
| 45 to 59 Minutes | 987 | 3.5% |
| 60 to 89 Minutes | 721 | 2.6% |
| 90 or more Minutes | 562 | 2.0% |
Commute Time by Sex in West Hartford
The most common commute times in West Hartford are 20 to 24 minutes (3,075 commuters, 20.9%) for males and 10 to 14 minutes (3,048 commuters, 23.3%) for females.
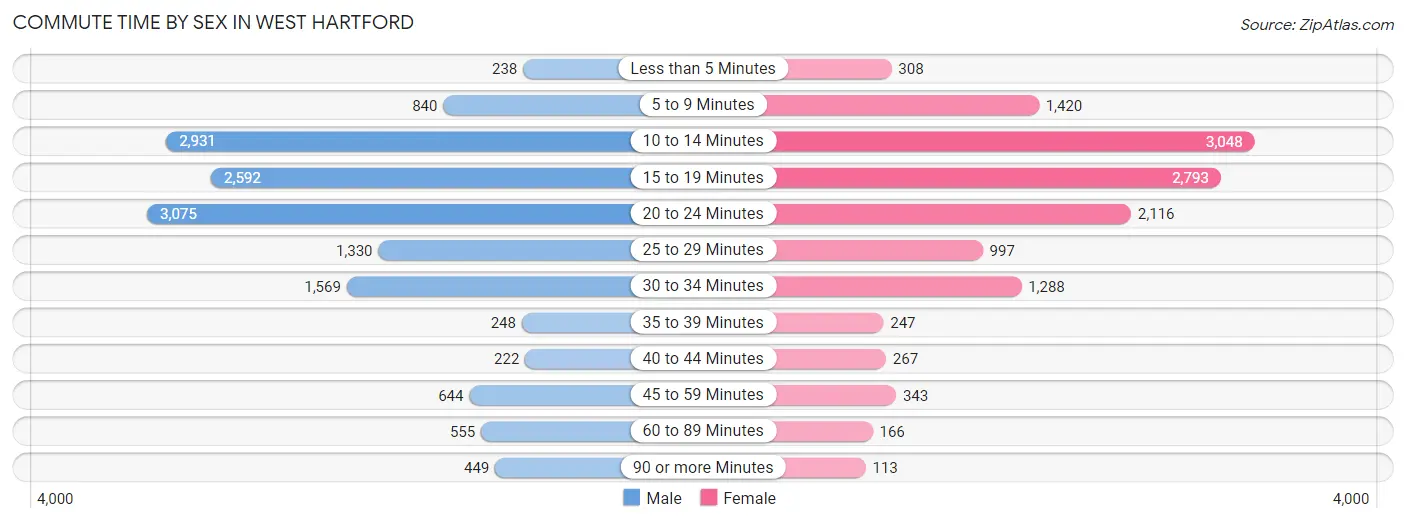
| Commute Time | Male | Female |
| Less than 5 Minutes | 238 (1.6%) | 308 (2.4%) |
| 5 to 9 Minutes | 840 (5.7%) | 1,420 (10.8%) |
| 10 to 14 Minutes | 2,931 (20.0%) | 3,048 (23.3%) |
| 15 to 19 Minutes | 2,592 (17.6%) | 2,793 (21.3%) |
| 20 to 24 Minutes | 3,075 (20.9%) | 2,116 (16.2%) |
| 25 to 29 Minutes | 1,330 (9.0%) | 997 (7.6%) |
| 30 to 34 Minutes | 1,569 (10.7%) | 1,288 (9.8%) |
| 35 to 39 Minutes | 248 (1.7%) | 247 (1.9%) |
| 40 to 44 Minutes | 222 (1.5%) | 267 (2.0%) |
| 45 to 59 Minutes | 644 (4.4%) | 343 (2.6%) |
| 60 to 89 Minutes | 555 (3.8%) | 166 (1.3%) |
| 90 or more Minutes | 449 (3.1%) | 113 (0.9%) |
Time of Departure to Work by Sex in West Hartford
The most frequent times of departure to work in West Hartford are 8:00 AM to 8:29 AM (2,983, 20.3%) for males and 8:00 AM to 8:29 AM (2,250, 17.2%) for females.
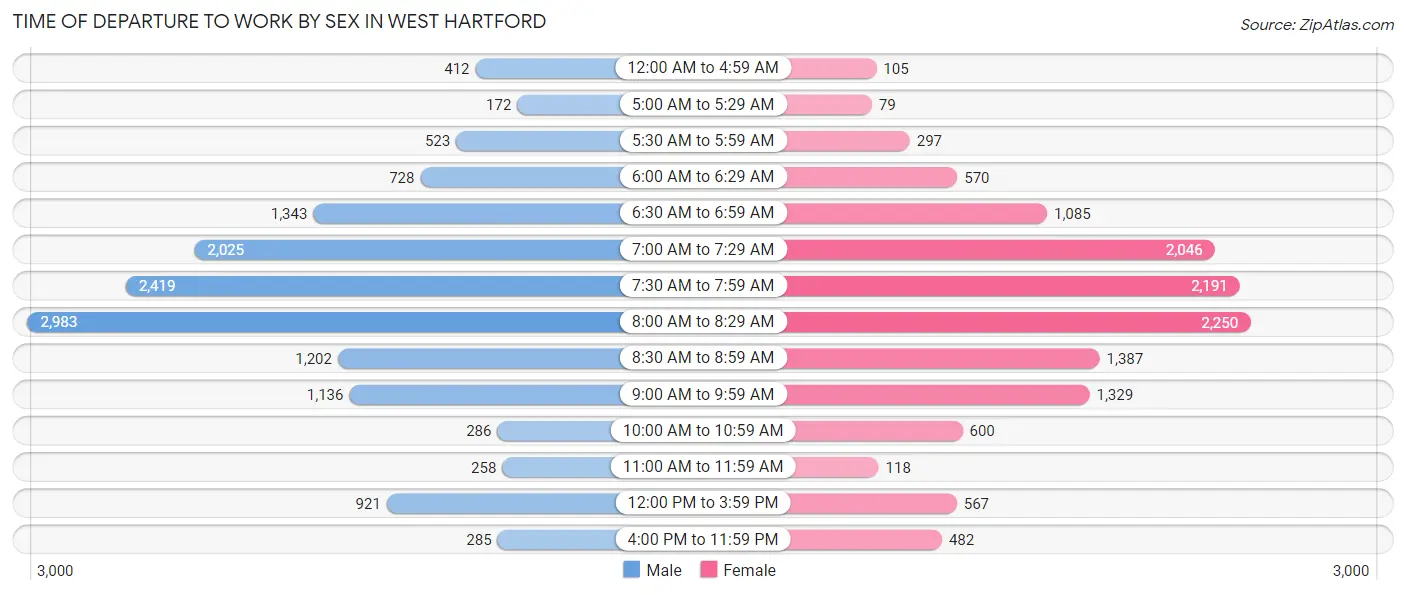
| Time of Departure | Male | Female |
| 12:00 AM to 4:59 AM | 412 (2.8%) | 105 (0.8%) |
| 5:00 AM to 5:29 AM | 172 (1.2%) | 79 (0.6%) |
| 5:30 AM to 5:59 AM | 523 (3.6%) | 297 (2.3%) |
| 6:00 AM to 6:29 AM | 728 (5.0%) | 570 (4.3%) |
| 6:30 AM to 6:59 AM | 1,343 (9.1%) | 1,085 (8.3%) |
| 7:00 AM to 7:29 AM | 2,025 (13.8%) | 2,046 (15.6%) |
| 7:30 AM to 7:59 AM | 2,419 (16.5%) | 2,191 (16.7%) |
| 8:00 AM to 8:29 AM | 2,983 (20.3%) | 2,250 (17.2%) |
| 8:30 AM to 8:59 AM | 1,202 (8.2%) | 1,387 (10.6%) |
| 9:00 AM to 9:59 AM | 1,136 (7.7%) | 1,329 (10.1%) |
| 10:00 AM to 10:59 AM | 286 (1.9%) | 600 (4.6%) |
| 11:00 AM to 11:59 AM | 258 (1.8%) | 118 (0.9%) |
| 12:00 PM to 3:59 PM | 921 (6.3%) | 567 (4.3%) |
| 4:00 PM to 11:59 PM | 285 (1.9%) | 482 (3.7%) |
| Total | 14,693 (100.0%) | 13,106 (100.0%) |
Housing Occupancy in West Hartford
Occupancy by Ownership in West Hartford
Of the total 26,100 dwellings in West Hartford, owner-occupied units account for 17,905 (68.6%), while renter-occupied units make up 8,195 (31.4%).
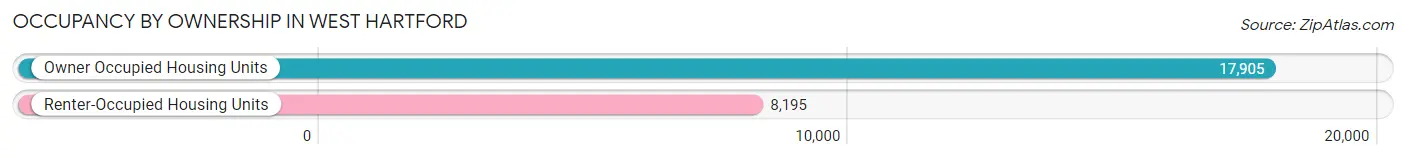
| Occupancy | # Housing Units | % Housing Units |
| Owner Occupied Housing Units | 17,905 | 68.6% |
| Renter-Occupied Housing Units | 8,195 | 31.4% |
| Total Occupied Housing Units | 26,100 | 100.0% |
Occupancy by Household Size in West Hartford
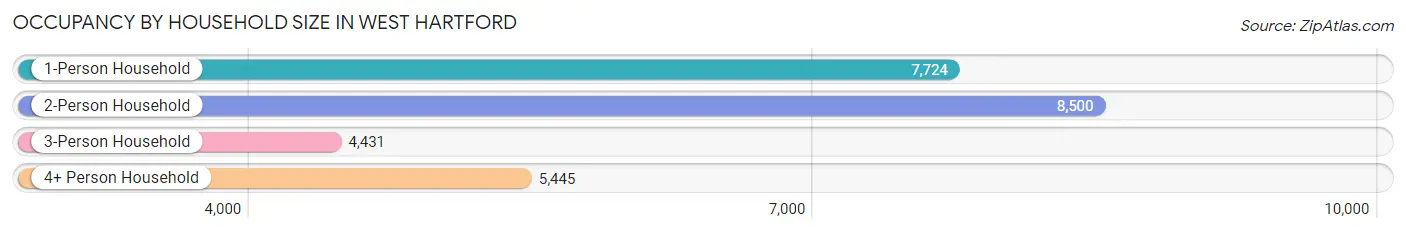
| Household Size | # Housing Units | % Housing Units |
| 1-Person Household | 7,724 | 29.6% |
| 2-Person Household | 8,500 | 32.6% |
| 3-Person Household | 4,431 | 17.0% |
| 4+ Person Household | 5,445 | 20.9% |
| Total Housing Units | 26,100 | 100.0% |
Occupancy by Ownership by Household Size in West Hartford
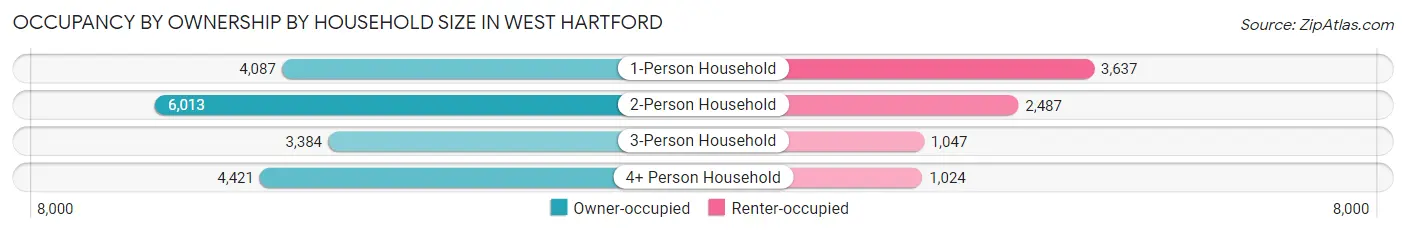
| Household Size | Owner-occupied | Renter-occupied |
| 1-Person Household | 4,087 (52.9%) | 3,637 (47.1%) |
| 2-Person Household | 6,013 (70.7%) | 2,487 (29.3%) |
| 3-Person Household | 3,384 (76.4%) | 1,047 (23.6%) |
| 4+ Person Household | 4,421 (81.2%) | 1,024 (18.8%) |
| Total Housing Units | 17,905 (68.6%) | 8,195 (31.4%) |
Occupancy by Educational Attainment in West Hartford
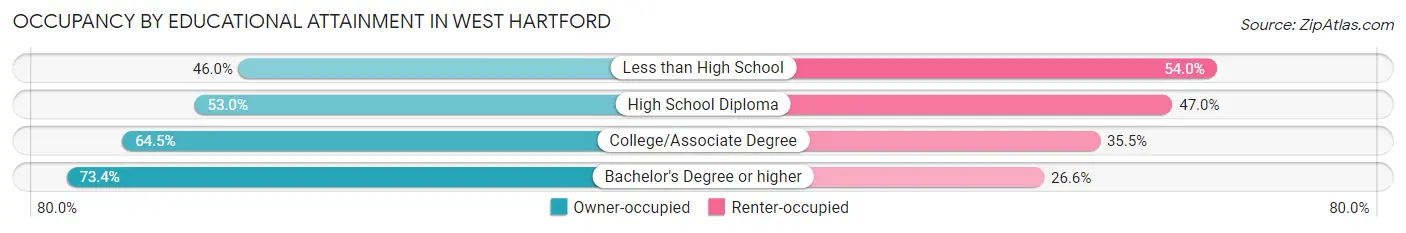
| Household Size | Owner-occupied | Renter-occupied |
| Less than High School | 551 (46.0%) | 646 (54.0%) |
| High School Diploma | 1,462 (53.0%) | 1,295 (47.0%) |
| College/Associate Degree | 2,588 (64.5%) | 1,424 (35.5%) |
| Bachelor's Degree or higher | 13,304 (73.4%) | 4,830 (26.6%) |
Occupancy by Age of Householder in West Hartford
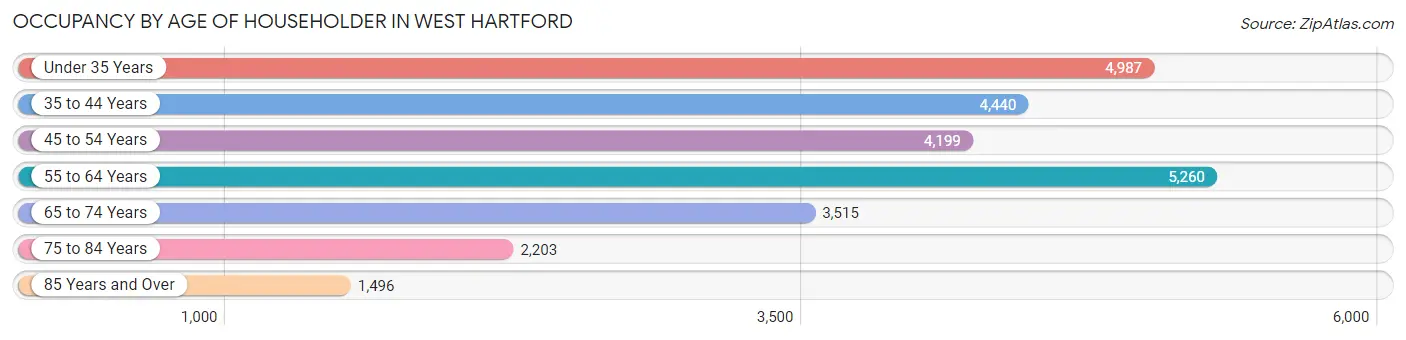
| Age Bracket | # Households | % Households |
| Under 35 Years | 4,987 | 19.1% |
| 35 to 44 Years | 4,440 | 17.0% |
| 45 to 54 Years | 4,199 | 16.1% |
| 55 to 64 Years | 5,260 | 20.2% |
| 65 to 74 Years | 3,515 | 13.5% |
| 75 to 84 Years | 2,203 | 8.4% |
| 85 Years and Over | 1,496 | 5.7% |
| Total | 26,100 | 100.0% |
Housing Finances in West Hartford
Median Income by Occupancy in West Hartford
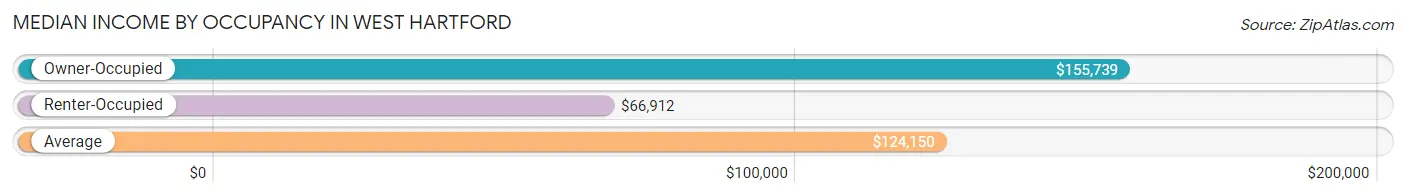
| Occupancy Type | # Households | Median Income |
| Owner-Occupied | 17,905 (68.6%) | $155,739 |
| Renter-Occupied | 8,195 (31.4%) | $66,912 |
| Average | 26,100 (100.0%) | $124,150 |
Occupancy by Householder Income Bracket in West Hartford

| Income Bracket | Owner-occupied | Renter-occupied |
| Less than $5,000 | 205 (1.1%) | 283 (3.5%) |
| $5,000 to $9,999 | 120 (0.7%) | 245 (3.0%) |
| $10,000 to $14,999 | 312 (1.7%) | 558 (6.8%) |
| $15,000 to $19,999 | 108 (0.6%) | 293 (3.6%) |
| $20,000 to $24,999 | 281 (1.6%) | 292 (3.6%) |
| $25,000 to $34,999 | 438 (2.5%) | 585 (7.1%) |
| $35,000 to $49,999 | 649 (3.6%) | 870 (10.6%) |
| $50,000 to $74,999 | 1,649 (9.2%) | 1,382 (16.9%) |
| $75,000 to $99,999 | 1,793 (10.0%) | 834 (10.2%) |
| $100,000 to $149,999 | 3,023 (16.9%) | 1,577 (19.2%) |
| $150,000 or more | 9,327 (52.1%) | 1,276 (15.6%) |
| Total | 17,905 (100.0%) | 8,195 (100.0%) |
Monthly Housing Cost Tiers in West Hartford
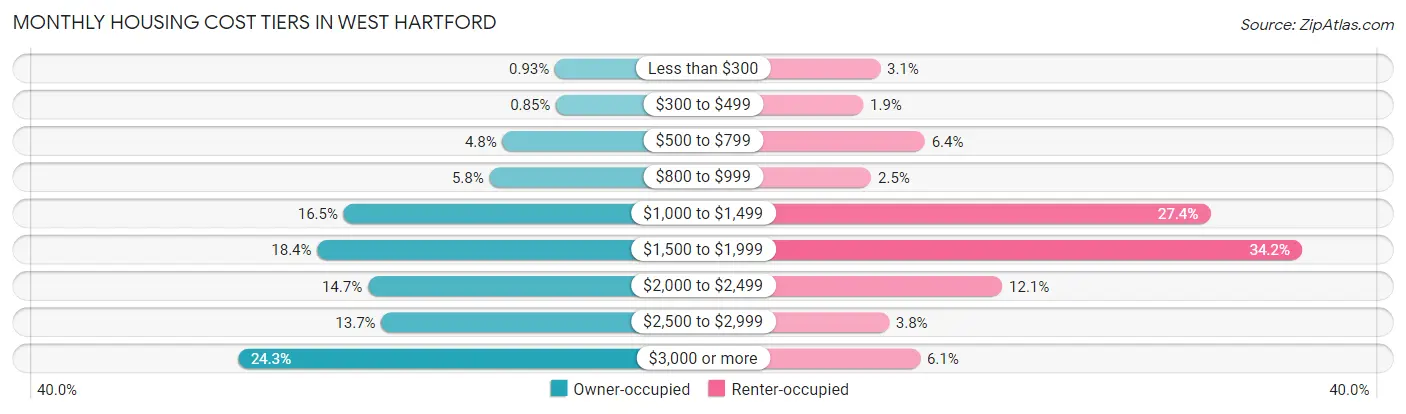
| Monthly Cost | Owner-occupied | Renter-occupied |
| Less than $300 | 166 (0.9%) | 257 (3.1%) |
| $300 to $499 | 153 (0.9%) | 155 (1.9%) |
| $500 to $799 | 860 (4.8%) | 527 (6.4%) |
| $800 to $999 | 1,032 (5.8%) | 203 (2.5%) |
| $1,000 to $1,499 | 2,952 (16.5%) | 2,249 (27.4%) |
| $1,500 to $1,999 | 3,302 (18.4%) | 2,803 (34.2%) |
| $2,000 to $2,499 | 2,633 (14.7%) | 994 (12.1%) |
| $2,500 to $2,999 | 2,456 (13.7%) | 311 (3.8%) |
| $3,000 or more | 4,351 (24.3%) | 498 (6.1%) |
| Total | 17,905 (100.0%) | 8,195 (100.0%) |
Physical Housing Characteristics in West Hartford
Housing Structures in West Hartford
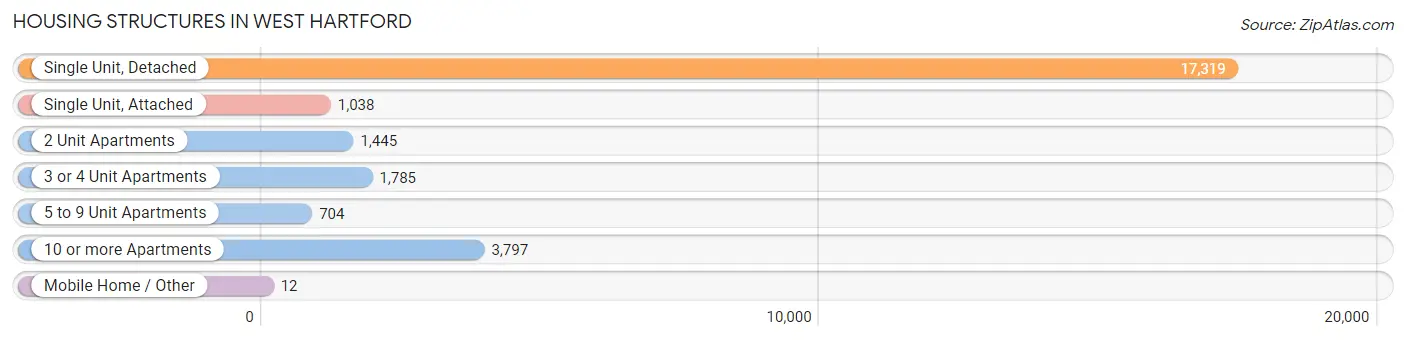
| Structure Type | # Housing Units | % Housing Units |
| Single Unit, Detached | 17,319 | 66.4% |
| Single Unit, Attached | 1,038 | 4.0% |
| 2 Unit Apartments | 1,445 | 5.5% |
| 3 or 4 Unit Apartments | 1,785 | 6.8% |
| 5 to 9 Unit Apartments | 704 | 2.7% |
| 10 or more Apartments | 3,797 | 14.5% |
| Mobile Home / Other | 12 | 0.1% |
| Total | 26,100 | 100.0% |
Housing Structures by Occupancy in West Hartford
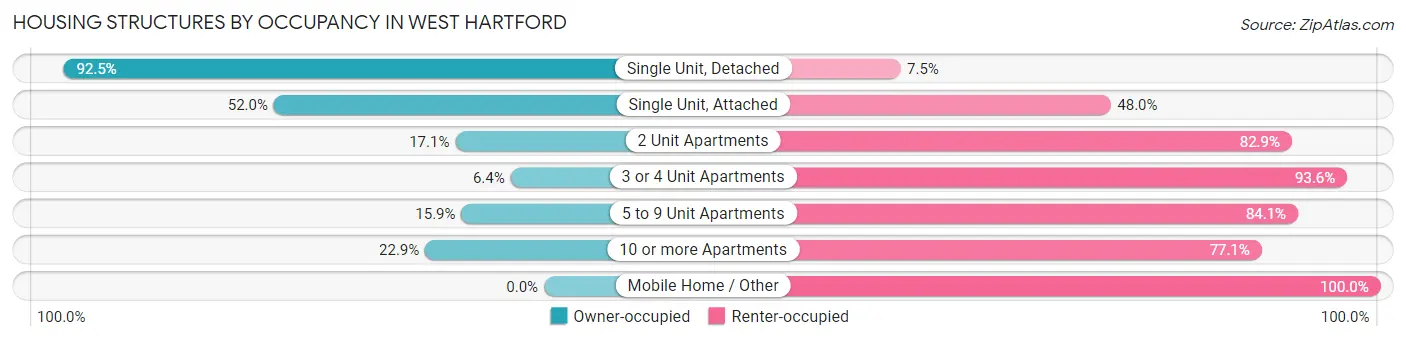
| Structure Type | Owner-occupied | Renter-occupied |
| Single Unit, Detached | 16,022 (92.5%) | 1,297 (7.5%) |
| Single Unit, Attached | 540 (52.0%) | 498 (48.0%) |
| 2 Unit Apartments | 247 (17.1%) | 1,198 (82.9%) |
| 3 or 4 Unit Apartments | 115 (6.4%) | 1,670 (93.6%) |
| 5 to 9 Unit Apartments | 112 (15.9%) | 592 (84.1%) |
| 10 or more Apartments | 869 (22.9%) | 2,928 (77.1%) |
| Mobile Home / Other | 0 (0.0%) | 12 (100.0%) |
| Total | 17,905 (68.6%) | 8,195 (31.4%) |
Housing Structures by Number of Rooms in West Hartford
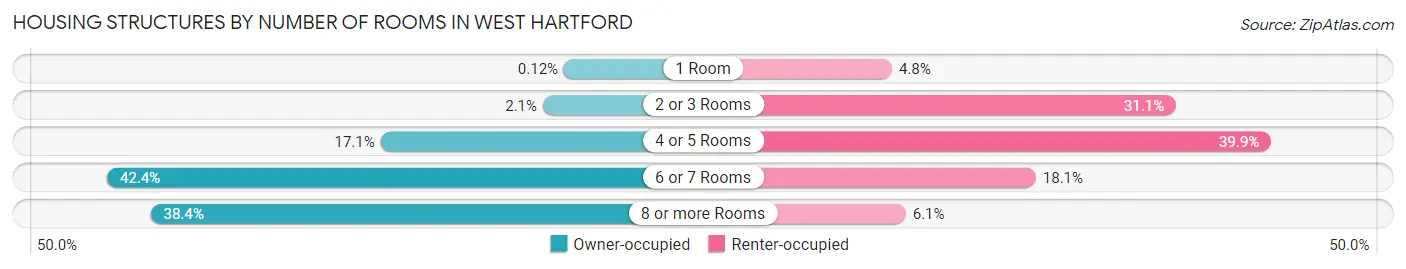
| Number of Rooms | Owner-occupied | Renter-occupied |
| 1 Room | 22 (0.1%) | 395 (4.8%) |
| 2 or 3 Rooms | 370 (2.1%) | 2,548 (31.1%) |
| 4 or 5 Rooms | 3,058 (17.1%) | 3,268 (39.9%) |
| 6 or 7 Rooms | 7,589 (42.4%) | 1,485 (18.1%) |
| 8 or more Rooms | 6,866 (38.4%) | 499 (6.1%) |
| Total | 17,905 (100.0%) | 8,195 (100.0%) |
Housing Structure by Heating Type in West Hartford
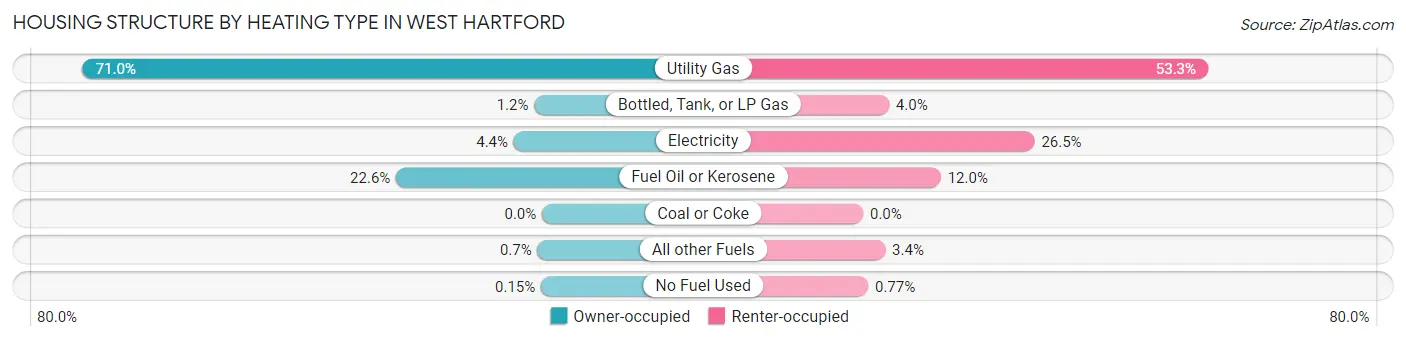
| Heating Type | Owner-occupied | Renter-occupied |
| Utility Gas | 12,717 (71.0%) | 4,368 (53.3%) |
| Bottled, Tank, or LP Gas | 215 (1.2%) | 328 (4.0%) |
| Electricity | 781 (4.4%) | 2,172 (26.5%) |
| Fuel Oil or Kerosene | 4,040 (22.6%) | 984 (12.0%) |
| Coal or Coke | 0 (0.0%) | 0 (0.0%) |
| All other Fuels | 125 (0.7%) | 280 (3.4%) |
| No Fuel Used | 27 (0.2%) | 63 (0.8%) |
| Total | 17,905 (100.0%) | 8,195 (100.0%) |
Household Vehicle Usage in West Hartford
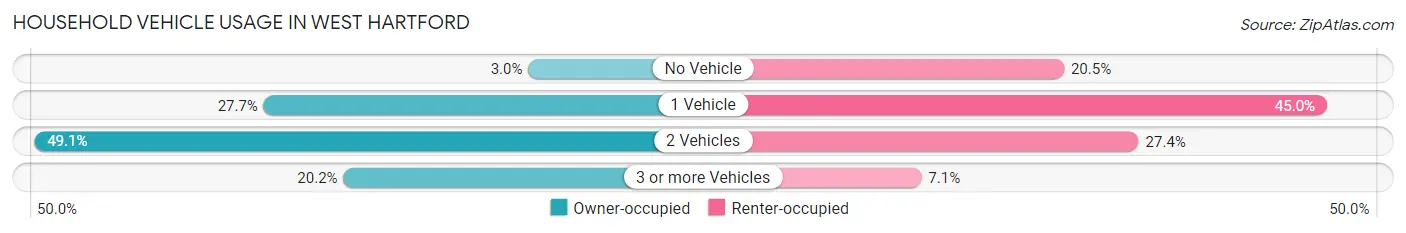
| Vehicles per Household | Owner-occupied | Renter-occupied |
| No Vehicle | 534 (3.0%) | 1,676 (20.4%) |
| 1 Vehicle | 4,956 (27.7%) | 3,687 (45.0%) |
| 2 Vehicles | 8,791 (49.1%) | 2,247 (27.4%) |
| 3 or more Vehicles | 3,624 (20.2%) | 585 (7.1%) |
| Total | 17,905 (100.0%) | 8,195 (100.0%) |
Real Estate & Mortgages in West Hartford
Real Estate and Mortgage Overview in West Hartford
| Characteristic | Without Mortgage | With Mortgage |
| Housing Units | 6,678 | 11,227 |
| Median Property Value | $353,300 | $379,200 |
| Median Household Income | $117,174 | $6,716 |
| Monthly Housing Costs | $1,205 | $4,298 |
| Real Estate Taxes | $8,964 | $49 |
Property Value by Mortgage Status in West Hartford
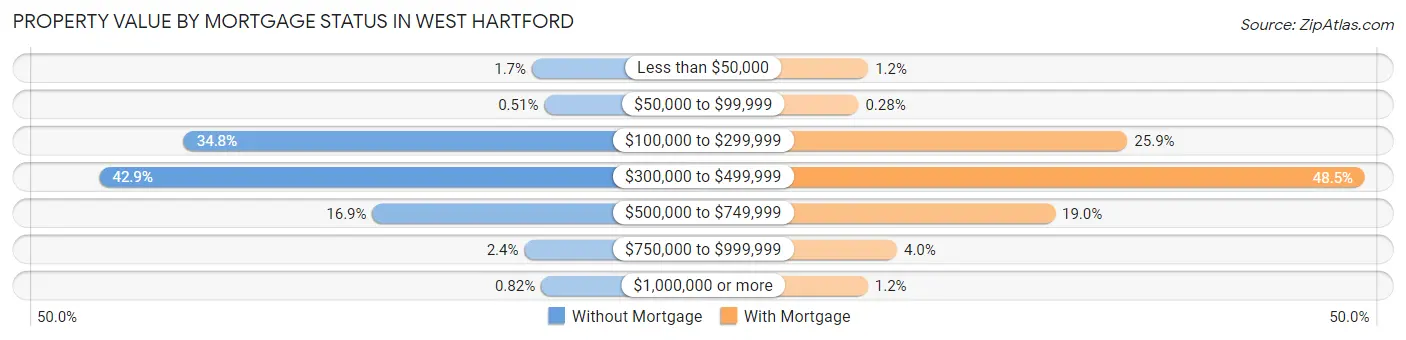
| Property Value | Without Mortgage | With Mortgage |
| Less than $50,000 | 113 (1.7%) | 136 (1.2%) |
| $50,000 to $99,999 | 34 (0.5%) | 31 (0.3%) |
| $100,000 to $299,999 | 2,326 (34.8%) | 2,907 (25.9%) |
| $300,000 to $499,999 | 2,862 (42.9%) | 5,446 (48.5%) |
| $500,000 to $749,999 | 1,127 (16.9%) | 2,133 (19.0%) |
| $750,000 to $999,999 | 161 (2.4%) | 443 (4.0%) |
| $1,000,000 or more | 55 (0.8%) | 131 (1.2%) |
| Total | 6,678 (100.0%) | 11,227 (100.0%) |
Household Income by Mortgage Status in West Hartford
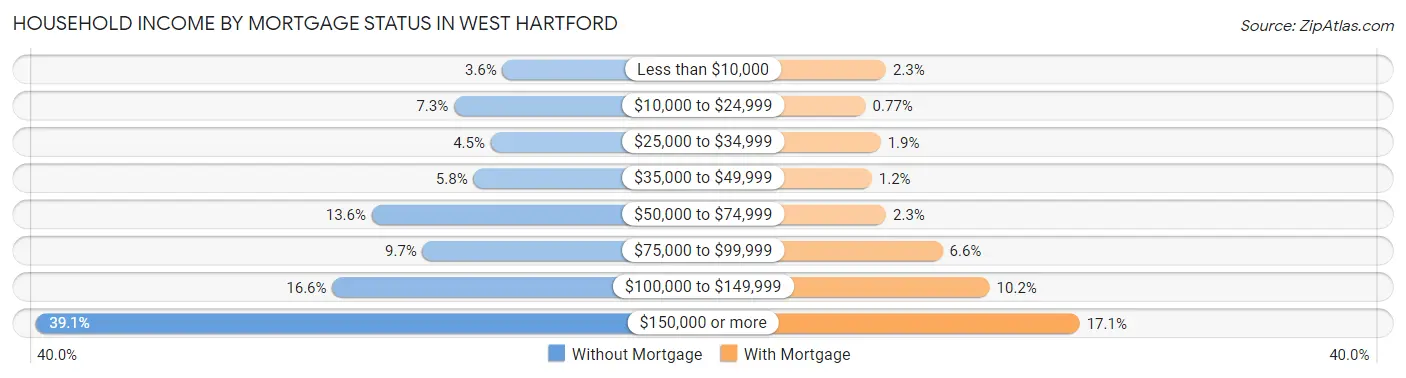
| Household Income | Without Mortgage | With Mortgage |
| Less than $10,000 | 239 (3.6%) | 260 (2.3%) |
| $10,000 to $24,999 | 486 (7.3%) | 86 (0.8%) |
| $25,000 to $34,999 | 299 (4.5%) | 215 (1.9%) |
| $35,000 to $49,999 | 387 (5.8%) | 139 (1.2%) |
| $50,000 to $74,999 | 905 (13.6%) | 262 (2.3%) |
| $75,000 to $99,999 | 646 (9.7%) | 744 (6.6%) |
| $100,000 to $149,999 | 1,105 (16.6%) | 1,147 (10.2%) |
| $150,000 or more | 2,611 (39.1%) | 1,918 (17.1%) |
| Total | 6,678 (100.0%) | 11,227 (100.0%) |
Property Value to Household Income Ratio in West Hartford
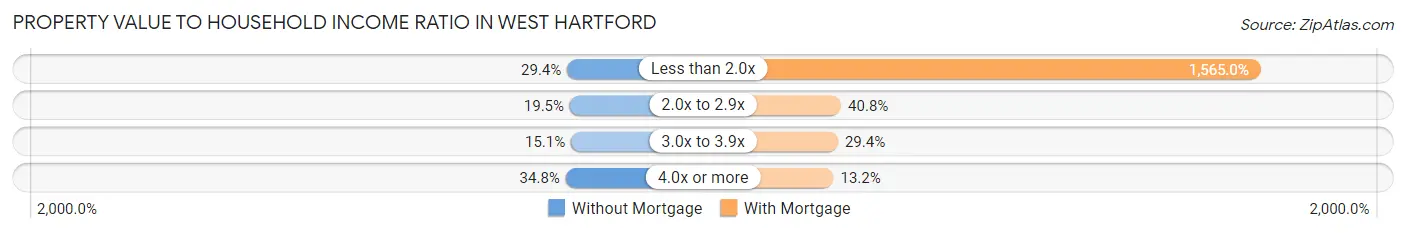
| Value-to-Income Ratio | Without Mortgage | With Mortgage |
| Less than 2.0x | 1,965 (29.4%) | 175,703 (1,565.0%) |
| 2.0x to 2.9x | 1,305 (19.5%) | 4,582 (40.8%) |
| 3.0x to 3.9x | 1,006 (15.1%) | 3,297 (29.4%) |
| 4.0x or more | 2,323 (34.8%) | 1,485 (13.2%) |
| Total | 6,678 (100.0%) | 11,227 (100.0%) |
Real Estate Taxes by Mortgage Status in West Hartford
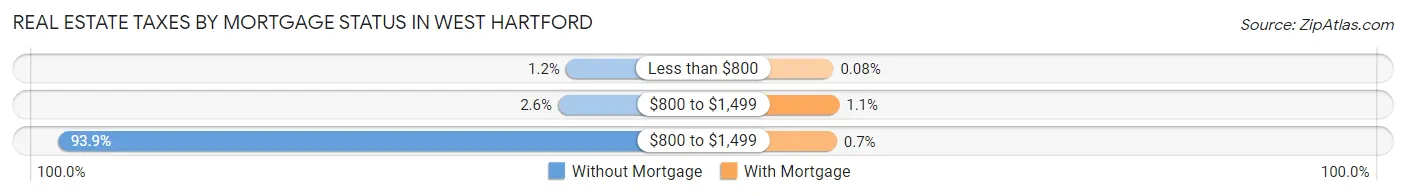
| Property Taxes | Without Mortgage | With Mortgage |
| Less than $800 | 78 (1.2%) | 9 (0.1%) |
| $800 to $1,499 | 174 (2.6%) | 128 (1.1%) |
| $800 to $1,499 | 6,273 (93.9%) | 79 (0.7%) |
| Total | 6,678 (100.0%) | 11,227 (100.0%) |
Health & Disability in West Hartford
Health Insurance Coverage by Age in West Hartford
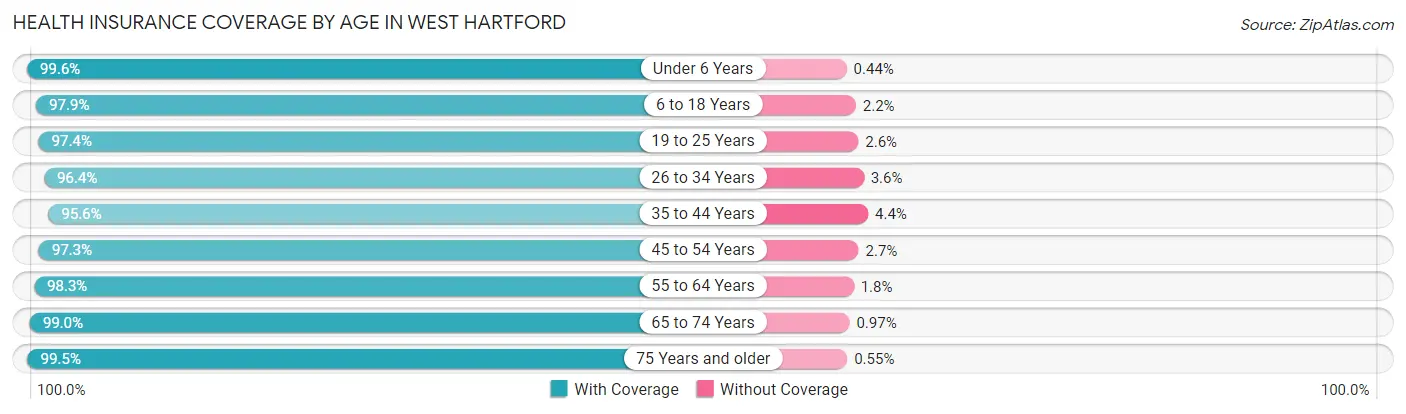
| Age Bracket | With Coverage | Without Coverage |
| Under 6 Years | 3,820 (99.6%) | 17 (0.4%) |
| 6 to 18 Years | 10,627 (97.9%) | 234 (2.1%) |
| 19 to 25 Years | 5,203 (97.4%) | 140 (2.6%) |
| 26 to 34 Years | 7,433 (96.4%) | 279 (3.6%) |
| 35 to 44 Years | 7,612 (95.6%) | 354 (4.4%) |
| 45 to 54 Years | 7,355 (97.3%) | 201 (2.7%) |
| 55 to 64 Years | 8,440 (98.3%) | 150 (1.8%) |
| 65 to 74 Years | 6,004 (99.0%) | 59 (1.0%) |
| 75 Years and older | 5,284 (99.5%) | 29 (0.5%) |
| Total | 61,778 (97.7%) | 1,463 (2.3%) |
Health Insurance Coverage by Citizenship Status in West Hartford
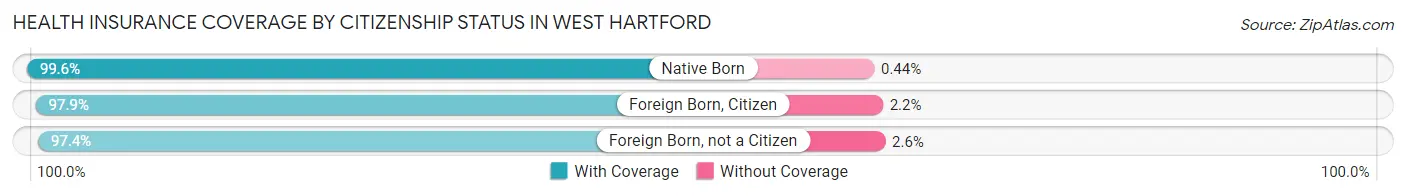
| Citizenship Status | With Coverage | Without Coverage |
| Native Born | 3,820 (99.6%) | 17 (0.4%) |
| Foreign Born, Citizen | 10,627 (97.9%) | 234 (2.1%) |
| Foreign Born, not a Citizen | 5,203 (97.4%) | 140 (2.6%) |
Health Insurance Coverage by Household Income in West Hartford
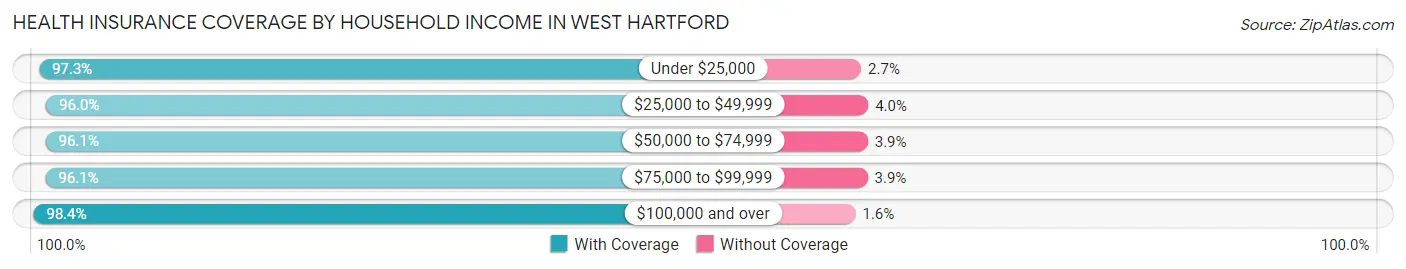
| Household Income | With Coverage | Without Coverage |
| Under $25,000 | 3,797 (97.3%) | 105 (2.7%) |
| $25,000 to $49,999 | 4,130 (96.0%) | 173 (4.0%) |
| $50,000 to $74,999 | 5,549 (96.1%) | 227 (3.9%) |
| $75,000 to $99,999 | 5,089 (96.1%) | 206 (3.9%) |
| $100,000 and over | 42,393 (98.4%) | 706 (1.6%) |
Public vs Private Health Insurance Coverage by Age in West Hartford
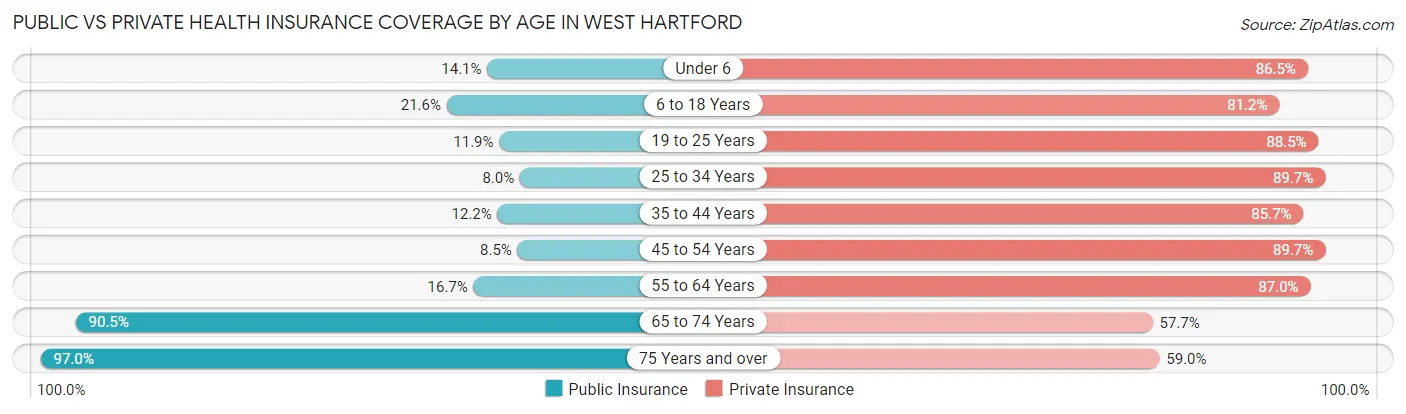
| Age Bracket | Public Insurance | Private Insurance |
| Under 6 | 541 (14.1%) | 3,318 (86.5%) |
| 6 to 18 Years | 2,349 (21.6%) | 8,820 (81.2%) |
| 19 to 25 Years | 635 (11.9%) | 4,727 (88.5%) |
| 25 to 34 Years | 620 (8.0%) | 6,916 (89.7%) |
| 35 to 44 Years | 972 (12.2%) | 6,825 (85.7%) |
| 45 to 54 Years | 641 (8.5%) | 6,777 (89.7%) |
| 55 to 64 Years | 1,430 (16.7%) | 7,472 (87.0%) |
| 65 to 74 Years | 5,488 (90.5%) | 3,497 (57.7%) |
| 75 Years and over | 5,155 (97.0%) | 3,132 (59.0%) |
| Total | 17,831 (28.2%) | 51,484 (81.4%) |
Disability Status by Sex by Age in West Hartford
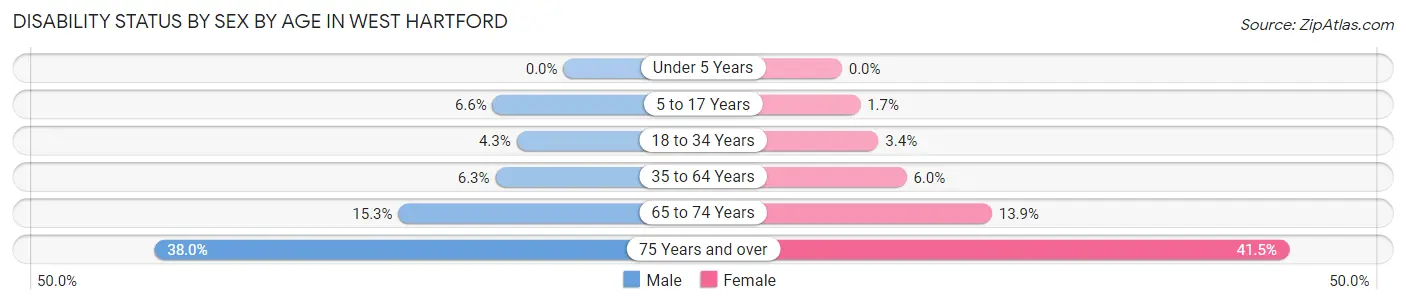
| Age Bracket | Male | Female |
| Under 5 Years | 0 (0.0%) | 0 (0.0%) |
| 5 to 17 Years | 344 (6.6%) | 95 (1.7%) |
| 18 to 34 Years | 293 (4.3%) | 237 (3.4%) |
| 35 to 64 Years | 717 (6.3%) | 765 (6.0%) |
| 65 to 74 Years | 450 (15.3%) | 435 (13.9%) |
| 75 Years and over | 752 (38.0%) | 1,382 (41.5%) |
Disability Class by Sex by Age in West Hartford
Disability Class: Hearing Difficulty
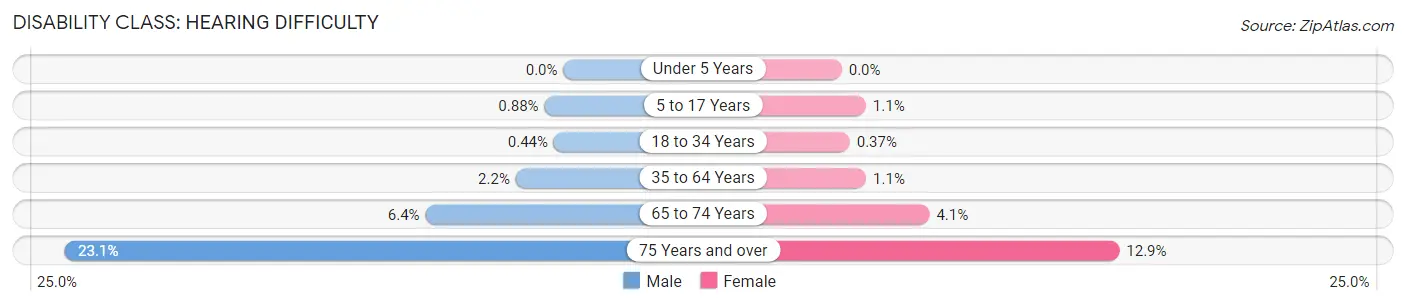
| Age Bracket | Male | Female |
| Under 5 Years | 0 (0.0%) | 0 (0.0%) |
| 5 to 17 Years | 46 (0.9%) | 62 (1.1%) |
| 18 to 34 Years | 30 (0.4%) | 26 (0.4%) |
| 35 to 64 Years | 251 (2.2%) | 144 (1.1%) |
| 65 to 74 Years | 188 (6.4%) | 127 (4.1%) |
| 75 Years and over | 458 (23.1%) | 429 (12.9%) |
Disability Class: Vision Difficulty
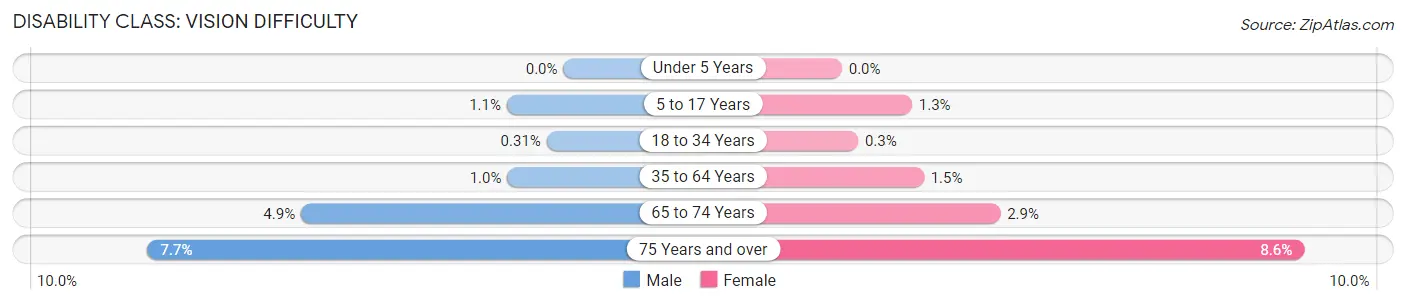
| Age Bracket | Male | Female |
| Under 5 Years | 0 (0.0%) | 0 (0.0%) |
| 5 to 17 Years | 55 (1.1%) | 72 (1.3%) |
| 18 to 34 Years | 21 (0.3%) | 21 (0.3%) |
| 35 to 64 Years | 118 (1.0%) | 194 (1.5%) |
| 65 to 74 Years | 143 (4.9%) | 92 (2.9%) |
| 75 Years and over | 153 (7.7%) | 286 (8.6%) |
Disability Class: Cognitive Difficulty
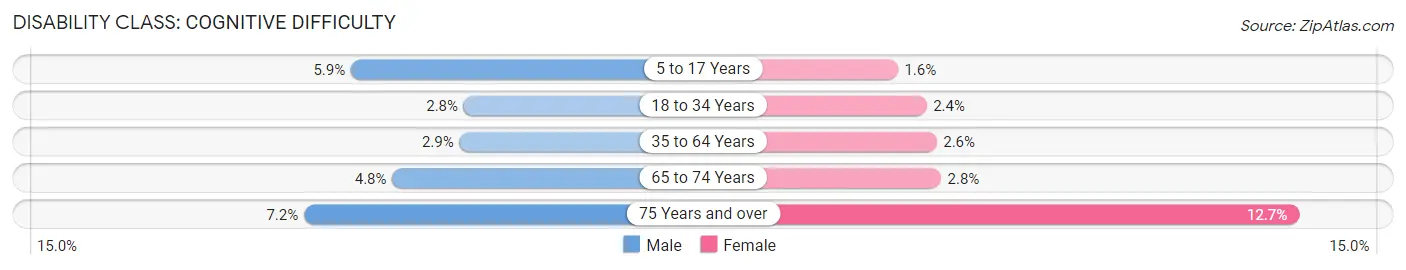
| Age Bracket | Male | Female |
| 5 to 17 Years | 309 (5.9%) | 86 (1.5%) |
| 18 to 34 Years | 187 (2.8%) | 164 (2.4%) |
| 35 to 64 Years | 329 (2.9%) | 335 (2.6%) |
| 65 to 74 Years | 140 (4.8%) | 86 (2.8%) |
| 75 Years and over | 143 (7.2%) | 424 (12.7%) |
Disability Class: Ambulatory Difficulty
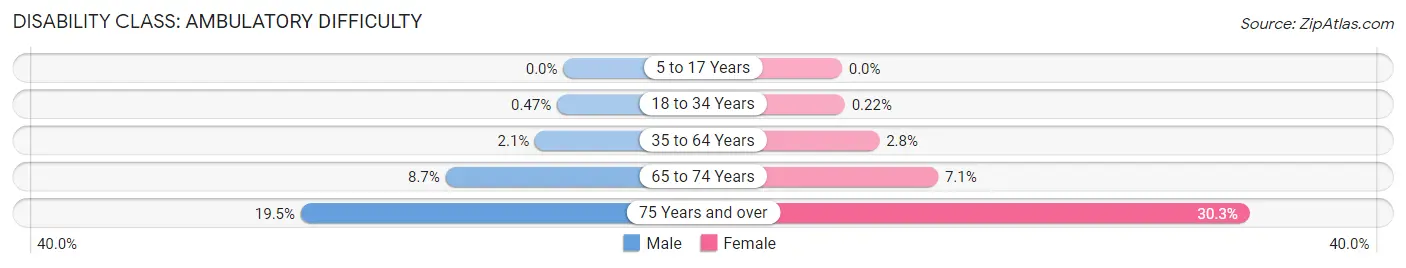
| Age Bracket | Male | Female |
| 5 to 17 Years | 0 (0.0%) | 0 (0.0%) |
| 18 to 34 Years | 32 (0.5%) | 15 (0.2%) |
| 35 to 64 Years | 238 (2.1%) | 354 (2.8%) |
| 65 to 74 Years | 257 (8.7%) | 223 (7.1%) |
| 75 Years and over | 386 (19.5%) | 1,009 (30.3%) |
Disability Class: Self-Care Difficulty
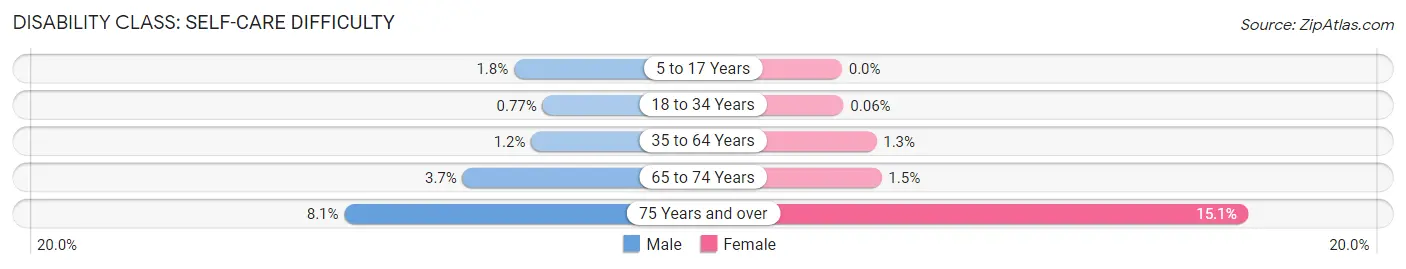
| Age Bracket | Male | Female |
| 5 to 17 Years | 96 (1.8%) | 0 (0.0%) |
| 18 to 34 Years | 52 (0.8%) | 4 (0.1%) |
| 35 to 64 Years | 135 (1.2%) | 163 (1.3%) |
| 65 to 74 Years | 110 (3.7%) | 46 (1.5%) |
| 75 Years and over | 161 (8.1%) | 503 (15.1%) |
Technology Access in West Hartford
Computing Device Access in West Hartford
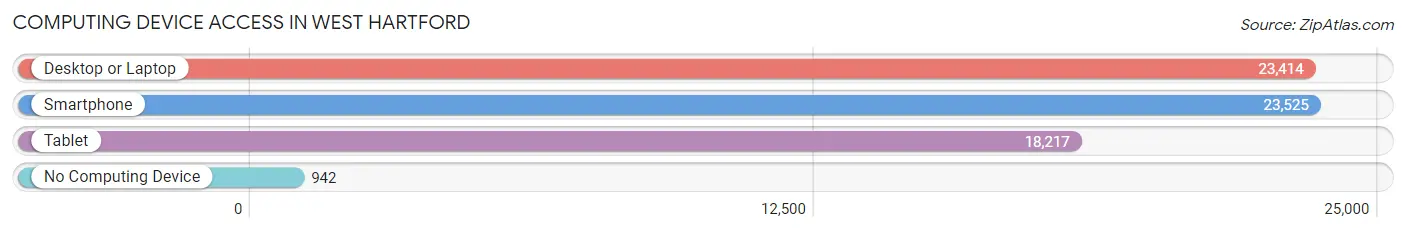
| Device Type | # Households | % Households |
| Desktop or Laptop | 23,414 | 89.7% |
| Smartphone | 23,525 | 90.1% |
| Tablet | 18,217 | 69.8% |
| No Computing Device | 942 | 3.6% |
| Total | 26,100 | 100.0% |
Internet Access in West Hartford
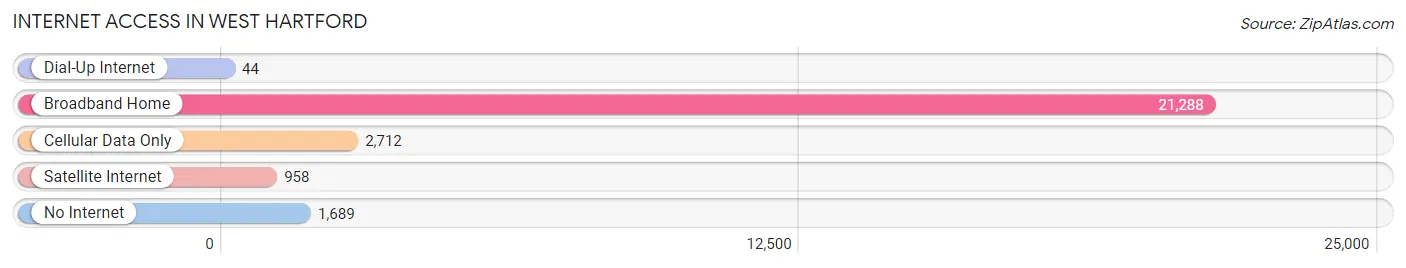
| Internet Type | # Households | % Households |
| Dial-Up Internet | 44 | 0.2% |
| Broadband Home | 21,288 | 81.6% |
| Cellular Data Only | 2,712 | 10.4% |
| Satellite Internet | 958 | 3.7% |
| No Internet | 1,689 | 6.5% |
| Total | 26,100 | 100.0% |
West Hartford Summary
Hartford, Connecticut is the capital of the state of Connecticut and is located in the north-central part of the state. It is the second largest city in the state and is part of the Greater Hartford metropolitan area. Hartford is a city of history, culture, and diversity. It is home to many historic sites, museums, and cultural attractions.
History
Hartford was founded in 1635 by Thomas Hooker and a group of settlers from the Massachusetts Bay Colony. The settlers were seeking religious freedom and a place to practice their Puritan faith. The city was named after Hertford, England, the hometown of Hooker's father. The city was incorporated in 1784 and became the state capital in 1875.
Hartford has a long and rich history. It was the site of the first public art museum in the United States, the Wadsworth Atheneum, which opened in 1844. It was also the home of the first insurance company in the United States, the Hartford Fire Insurance Company, which was founded in 1810. Hartford was an important center of the abolitionist movement and was home to many prominent abolitionists, including Harriet Beecher Stowe, who wrote Uncle Tom's Cabin in Hartford.
Geography
Hartford is located in north-central Connecticut, on the Connecticut River. It is bordered by the towns of West Hartford, East Hartford, Wethersfield, and Windsor. The city covers an area of 18.4 square miles and has an elevation of 33 feet.
The city is divided into several neighborhoods, including Downtown, the West End, the North End, and the South End. Downtown Hartford is the city's business and cultural center, and is home to many of the city's historic sites, museums, and attractions. The West End is a residential neighborhood, while the North End and South End are primarily industrial and commercial areas.
Economy
Hartford is the economic center of Connecticut and is home to many major corporations, including Aetna, The Hartford, Travelers, and United Technologies. The city is also home to several universities, including the University of Connecticut, Trinity College, and the University of Hartford.
The city's economy is largely based on the service industry, with many of the city's largest employers being in the healthcare, finance, and insurance sectors. Hartford is also home to several major cultural institutions, including the Wadsworth Atheneum, the Hartford Stage Company, and the Bushnell Center for the Performing Arts.
Demographics
As of the 2010 census, Hartford had a population of 124,775. The city is racially and ethnically diverse, with the largest racial groups being African American (41.3%), White (37.2%), Hispanic or Latino (17.2%), and Asian (3.2%). The median household income in Hartford is $33,845, and the median home value is $133,400.
Hartford is a city of culture and diversity. It is home to many historic sites, museums, and cultural attractions, and is the economic center of Connecticut. The city has a rich history and is home to many major corporations, universities, and cultural institutions. Hartford is a vibrant and diverse city, and is an important part of the state of Connecticut.
Common Questions
What is Per Capita Income in West Hartford?
Per Capita income in West Hartford is $67,164.
What is the Median Family Income in West Hartford?
Median Family Income in West Hartford is $159,480.
What is the Median Household income in West Hartford?
Median Household Income in West Hartford is $124,150.
What is Income or Wage Gap in West Hartford?
Income or Wage Gap in West Hartford is 29.6%.
Women in West Hartford earn 70.4 cents for every dollar earned by a man.
What is Family Income Deficit in West Hartford?
Family Income Deficit in West Hartford is $11,835.
Families that are below poverty line in West Hartford earn $11,835 less on average than the poverty threshold level.
What is Inequality or Gini Index in West Hartford?
Inequality or Gini Index in West Hartford is 0.46.
What is the Total Population of West Hartford?
Total Population of West Hartford is 64,088.
What is the Total Male Population of West Hartford?
Total Male Population of West Hartford is 30,379.
What is the Total Female Population of West Hartford?
Total Female Population of West Hartford is 33,709.
What is the Ratio of Males per 100 Females in West Hartford?
There are 90.12 Males per 100 Females in West Hartford.
What is the Ratio of Females per 100 Males in West Hartford?
There are 110.96 Females per 100 Males in West Hartford.
What is the Median Population Age in West Hartford?
Median Population Age in West Hartford is 39.7 Years.
What is the Average Family Size in West Hartford
Average Family Size in West Hartford is 3.0 People.
What is the Average Household Size in West Hartford
Average Household Size in West Hartford is 2.4 People.
How Large is the Labor Force in West Hartford?
There are 35,756 People in the Labor Forcein in West Hartford.
What is the Percentage of People in the Labor Force in West Hartford?
68.9% of People are in the Labor Force in West Hartford.
What is the Unemployment Rate in West Hartford?
Unemployment Rate in West Hartford is 3.9%.