Area Code 860 Map & Demographics
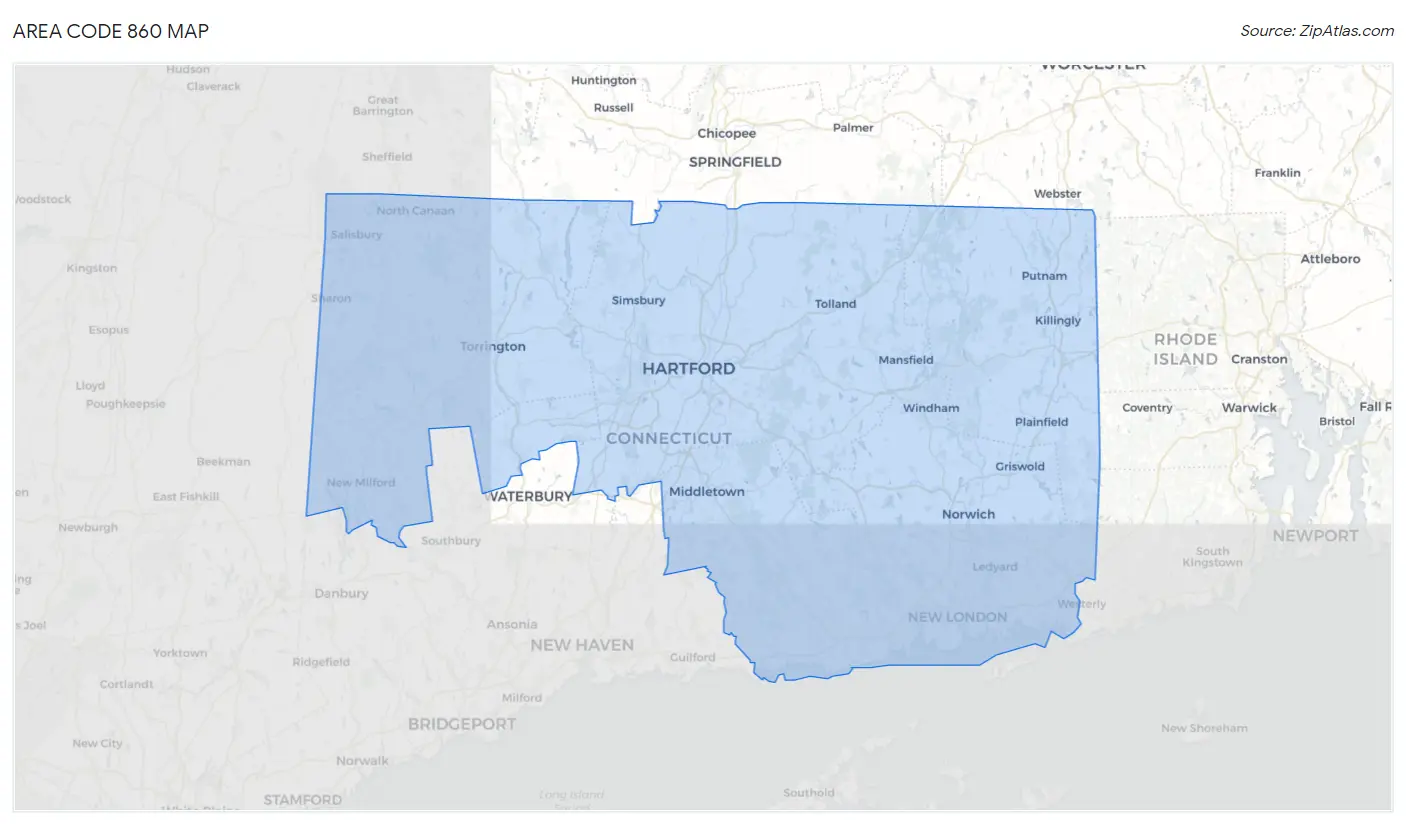
Area Code 860 Map
Area Code 860 Overview
$51,764
PER CAPITA INCOME
$121,142
AVG FAMILY INCOME
$99,712
AVG HOUSEHOLD INCOME
28.8%
WAGE / INCOME GAP [ % ]
71.2¢/ $1
WAGE / INCOME GAP [ $ ]
$10,439
FAMILY INCOME DEFICIT
72.53
INEQUALITY / GINI INDEX
1,740,563
TOTAL POPULATION
855,743
MALE POPULATION
884,820
FEMALE POPULATION
96.71
MALES / 100 FEMALES
103.40
FEMALES / 100 MALES
43.6
MEDIAN AGE
2.9
AVG FAMILY SIZE
2.5
AVG HOUSEHOLD SIZE
951,467
LABOR FORCE [ PEOPLE ]
66.2%
PERCENT IN LABOR FORCE
6.1%
UNEMPLOYMENT RATE
Income in Area Code 860
Income Overview in Area Code 860
Per Capita Income in Area Code 860 is $51,764, while median incomes of families and households are $121,142 and $99,712 respectively.
| Characteristic | Number | Measure |
| Per Capita Income | 1,740,563 | $51,764 |
| Median Family Income | 444,804 | $121,142 |
| Mean Family Income | 444,804 | $25,019,078 |
| Median Household Income | 696,851 | $99,712 |
| Mean Household Income | 696,851 | $21,872,713 |
| Income Deficit | 444,804 | $10,439 |
| Wage / Income Gap (%) | 1,740,563 | 28.82% |
| Wage / Income Gap ($) | 1,740,563 | 71.18¢ per $1 |
| Gini / Inequality Index | 1,740,563 | 72.53 |
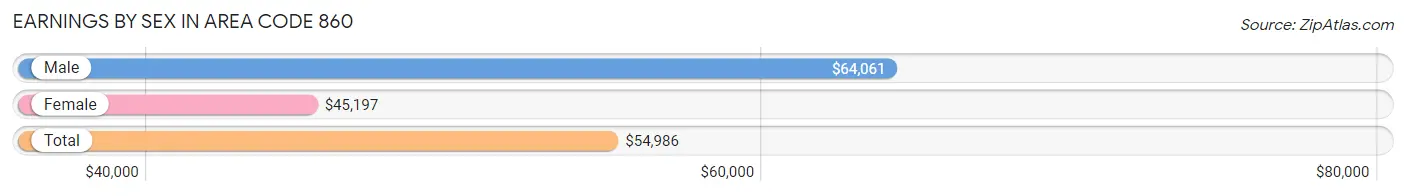
Earnings by Sex in Area Code 860
Average Earnings in Area Code 860 are $54,986, $64,061 for men and $45,197 for women, a difference of 29.4%.
| Sex | Number | Average Earnings |
| Male | 507,612 (51.6%) | $64,061 |
| Female | 475,644 (48.4%) | $45,197 |
| Total | 983,256 (100.0%) | $54,986 |
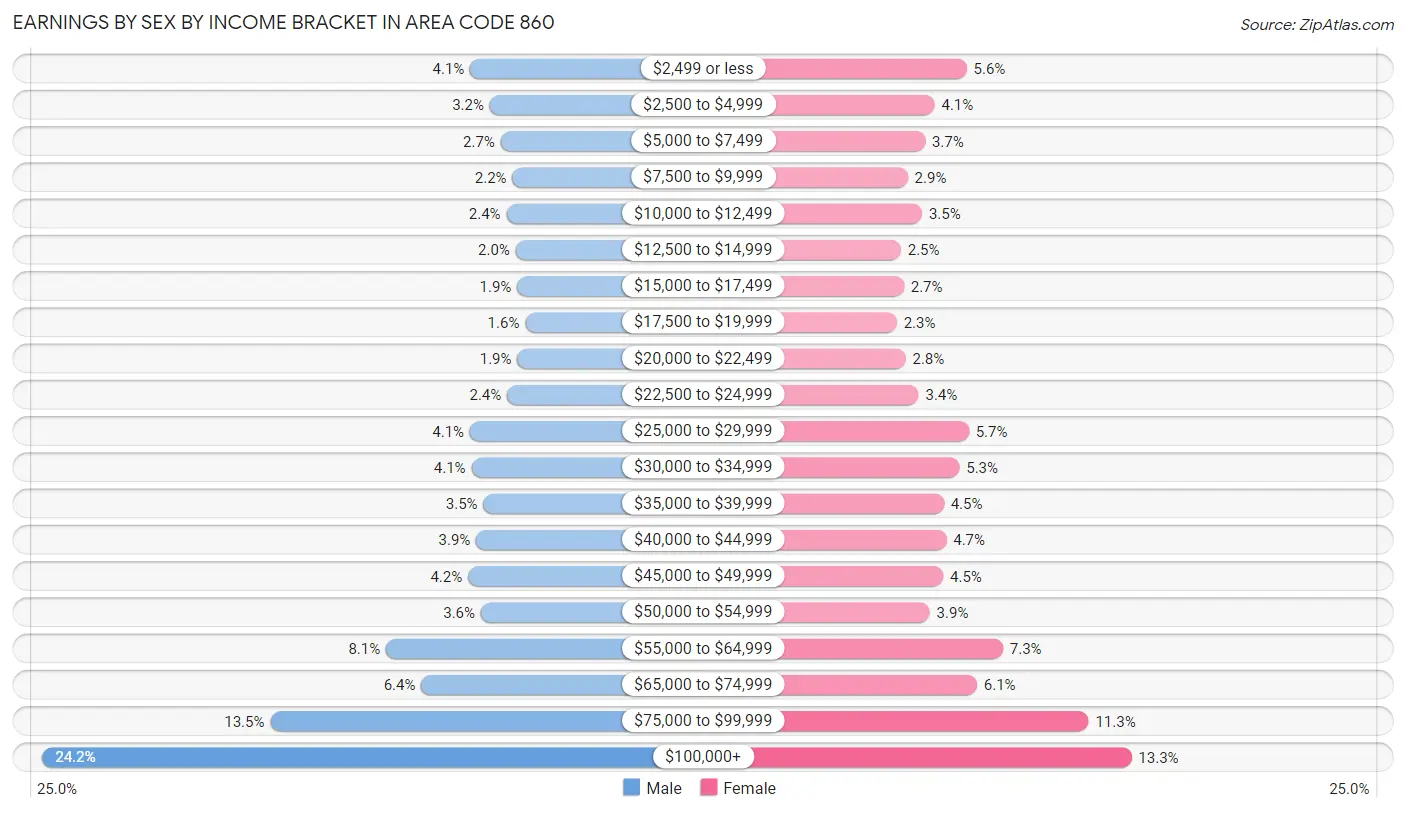
Earnings by Sex by Income Bracket in Area Code 860
The most common earnings brackets in Area Code 860 are $100,000+ for men (122,676 | 24.2%) and $100,000+ for women (63,402 | 13.3%).
| Income | Male | Female |
| $2,499 or less | 20,976 (4.1%) | 26,685 (5.6%) |
| $2,500 to $4,999 | 16,293 (3.2%) | 19,542 (4.1%) |
| $5,000 to $7,499 | 13,716 (2.7%) | 17,409 (3.7%) |
| $7,500 to $9,999 | 10,938 (2.1%) | 13,556 (2.9%) |
| $10,000 to $12,499 | 12,314 (2.4%) | 16,743 (3.5%) |
| $12,500 to $14,999 | 10,149 (2.0%) | 12,021 (2.5%) |
| $15,000 to $17,499 | 9,816 (1.9%) | 12,702 (2.7%) |
| $17,500 to $19,999 | 7,846 (1.5%) | 11,121 (2.3%) |
| $20,000 to $22,499 | 9,768 (1.9%) | 13,097 (2.8%) |
| $22,500 to $24,999 | 12,176 (2.4%) | 15,968 (3.4%) |
| $25,000 to $29,999 | 21,007 (4.1%) | 27,176 (5.7%) |
| $30,000 to $34,999 | 20,677 (4.1%) | 25,044 (5.3%) |
| $35,000 to $39,999 | 17,826 (3.5%) | 21,575 (4.5%) |
| $40,000 to $44,999 | 19,537 (3.8%) | 22,148 (4.7%) |
| $45,000 to $49,999 | 21,447 (4.2%) | 21,462 (4.5%) |
| $50,000 to $54,999 | 18,415 (3.6%) | 18,467 (3.9%) |
| $55,000 to $64,999 | 40,961 (8.1%) | 34,752 (7.3%) |
| $65,000 to $74,999 | 32,593 (6.4%) | 28,945 (6.1%) |
| $75,000 to $99,999 | 68,481 (13.5%) | 53,829 (11.3%) |
| $100,000+ | 122,676 (24.2%) | 63,402 (13.3%) |
| Total | 507,612 (100.0%) | 475,644 (100.0%) |
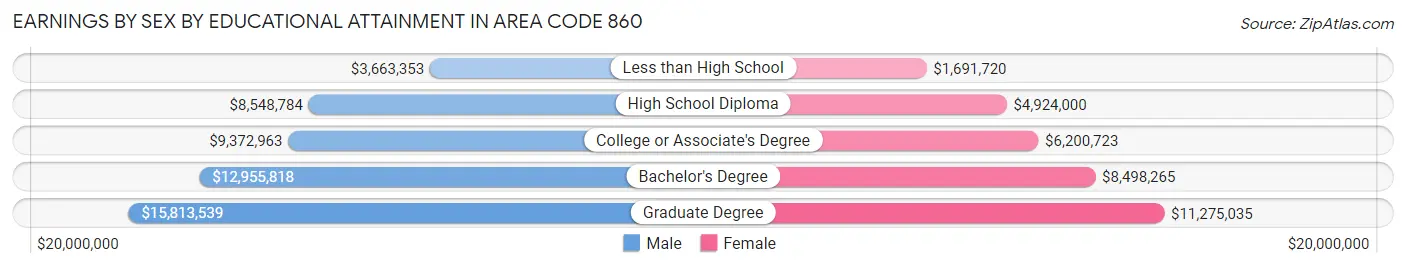
Earnings by Sex by Educational Attainment in Area Code 860
Average earnings in Area Code 860 are $12,399,469 for men and $8,209,250 for women, a difference of 33.8%. Men with an educational attainment of graduate degree enjoy the highest average annual earnings of $15,813,539, while those with less than high school education earn the least with $3,663,353. Women with an educational attainment of graduate degree earn the most with the average annual earnings of $11,275,035, while those with less than high school education have the smallest earnings of $1,691,720.
| Educational Attainment | Male Income | Female Income |
| Less than High School | $3,663,353 | $1,691,720 |
| High School Diploma | $8,548,784 | $4,924,000 |
| College or Associate's Degree | $9,372,963 | $6,200,723 |
| Bachelor's Degree | $12,955,818 | $8,498,265 |
| Graduate Degree | $15,813,539 | $11,275,035 |
| Total | $12,399,469 | $8,209,250 |
Family Income in Area Code 860
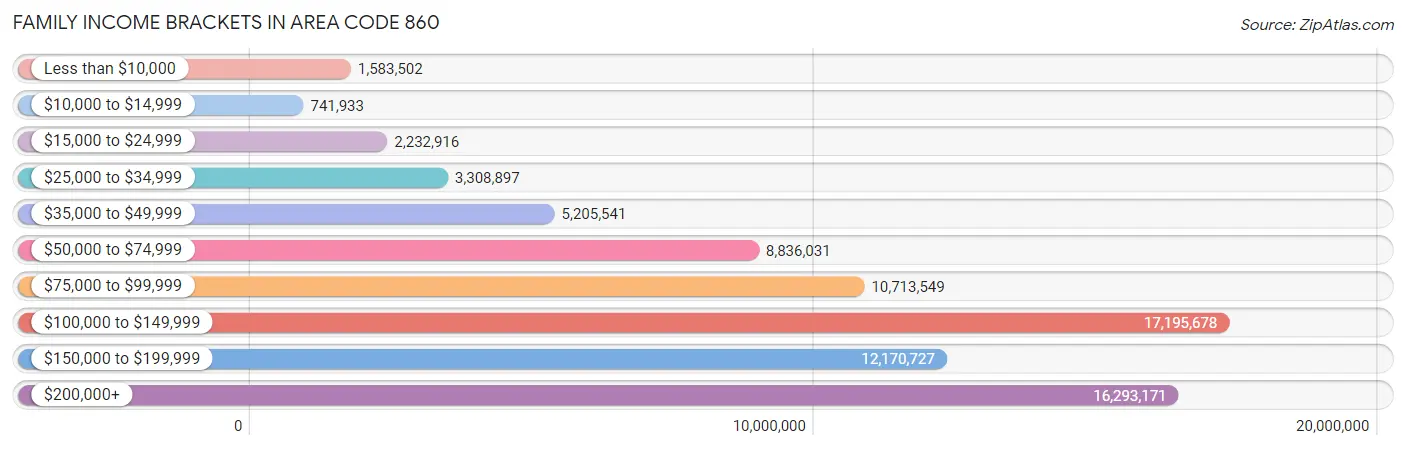
Family Income Brackets in Area Code 860
According to the Area Code 860 family income data, there are 17,195,678 families falling into the $100,000 to $149,999 income range, which is the most common income bracket and makes up 3,865.9% of all families. Conversely, the $10,000 to $14,999 income bracket is the least frequent group with only 741,933 families (166.8%) belonging to this category.
| Income Bracket | # Families | % Families |
| Less than $10,000 | 1,583,502 | 356.0% |
| $10,000 to $14,999 | 741,933 | 166.8% |
| $15,000 to $24,999 | 2,232,916 | 502.0% |
| $25,000 to $34,999 | 3,308,897 | 743.9% |
| $35,000 to $49,999 | 5,205,541 | 1,170.3% |
| $50,000 to $74,999 | 8,836,031 | 1,986.5% |
| $75,000 to $99,999 | 10,713,549 | 2,408.6% |
| $100,000 to $149,999 | 17,195,678 | 3,865.9% |
| $150,000 to $199,999 | 12,170,727 | 2,736.2% |
| $200,000+ | 16,293,171 | 3,663.0% |
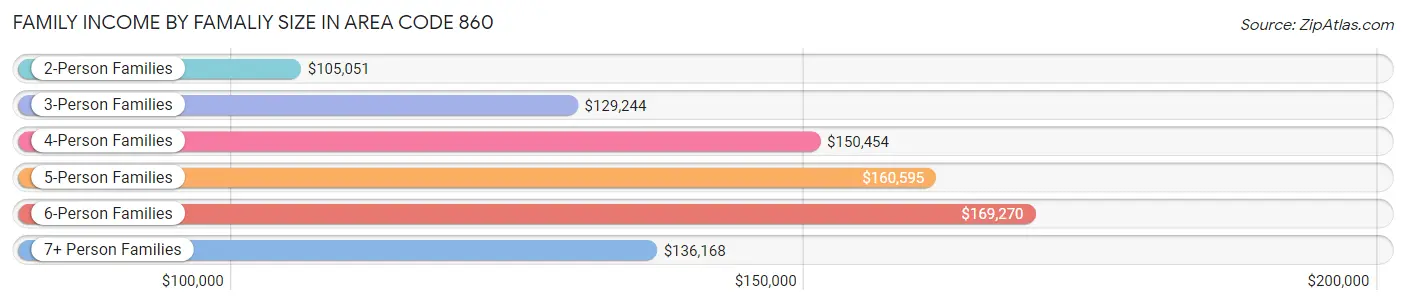
Family Income by Famaliy Size in Area Code 860
6-person families (8,651 | 1.9%) account for the highest median family income in Area Code 860 with $169,270 per family, while 2-person families (212,668 | 47.8%) have the highest median income of $52,526 per family member.
| Income Bracket | # Families | Median Income |
| 2-Person Families | 212,668 (47.8%) | $105,051 |
| 3-Person Families | 108,026 (24.3%) | $129,244 |
| 4-Person Families | 82,824 (18.6%) | $150,454 |
| 5-Person Families | 29,619 (6.7%) | $160,595 |
| 6-Person Families | 8,651 (1.9%) | $169,270 |
| 7+ Person Families | 3,016 (0.7%) | $136,168 |
| Total | 444,804 (100.0%) | $121,142 |
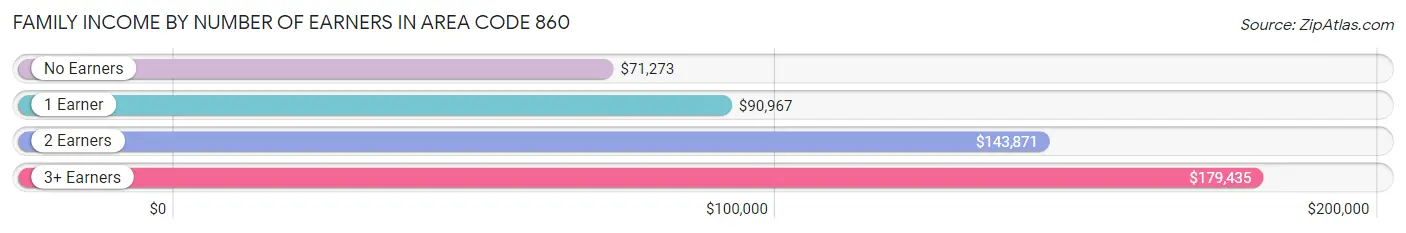
Family Income by Number of Earners in Area Code 860
The median family income in Area Code 860 is $121,142, with families comprising 3+ earners (57,790) having the highest median family income of $179,435, while families with no earners (61,579) have the lowest median family income of $71,273, accounting for 13.0% and 13.8% of families, respectively.
| Number of Earners | # Families | Median Income |
| No Earners | 61,579 (13.8%) | $71,273 |
| 1 Earner | 131,094 (29.5%) | $90,967 |
| 2 Earners | 194,341 (43.7%) | $143,871 |
| 3+ Earners | 57,790 (13.0%) | $179,435 |
| Total | 444,804 (100.0%) | $121,142 |
Household Income in Area Code 860
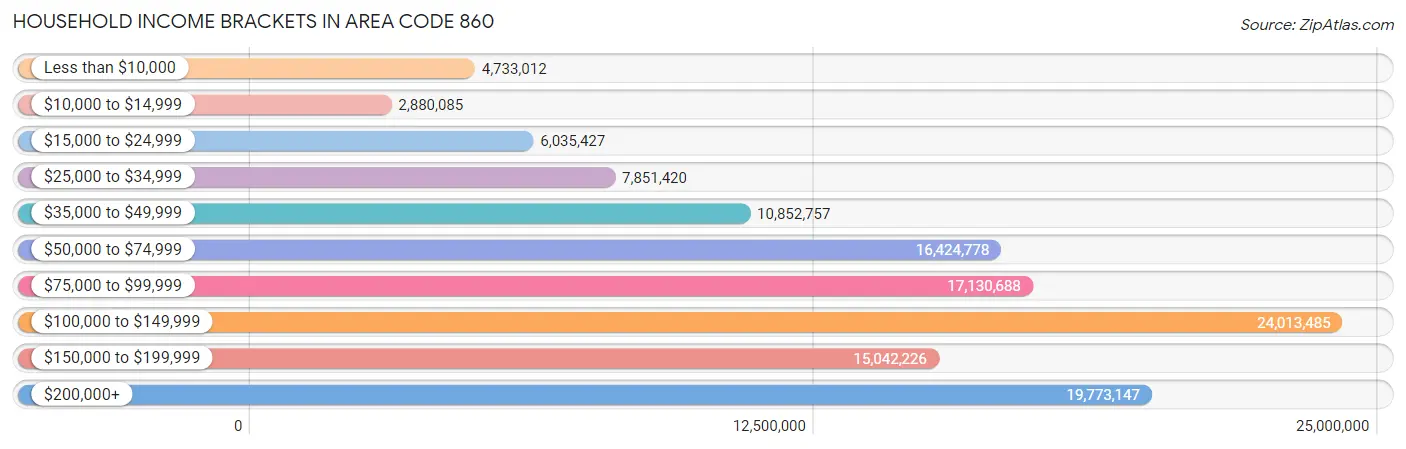
Household Income Brackets in Area Code 860
With 24,013,485 households falling in the category, the $100,000 to $149,999 income range is the most frequent in Area Code 860, accounting for 3,446.0% of all households. In contrast, only 2,880,085 households (413.3%) fall into the $10,000 to $14,999 income bracket, making it the least populous group.
| Income Bracket | # Households | % Households |
| Less than $10,000 | 4,733,012 | 679.2% |
| $10,000 to $14,999 | 2,880,085 | 413.3% |
| $15,000 to $24,999 | 6,035,427 | 866.1% |
| $25,000 to $34,999 | 7,851,420 | 1,126.7% |
| $35,000 to $49,999 | 10,852,757 | 1,557.4% |
| $50,000 to $74,999 | 16,424,778 | 2,357.0% |
| $75,000 to $99,999 | 17,130,688 | 2,458.3% |
| $100,000 to $149,999 | 24,013,485 | 3,446.0% |
| $150,000 to $199,999 | 15,042,226 | 2,158.6% |
| $200,000+ | 19,773,147 | 2,837.5% |
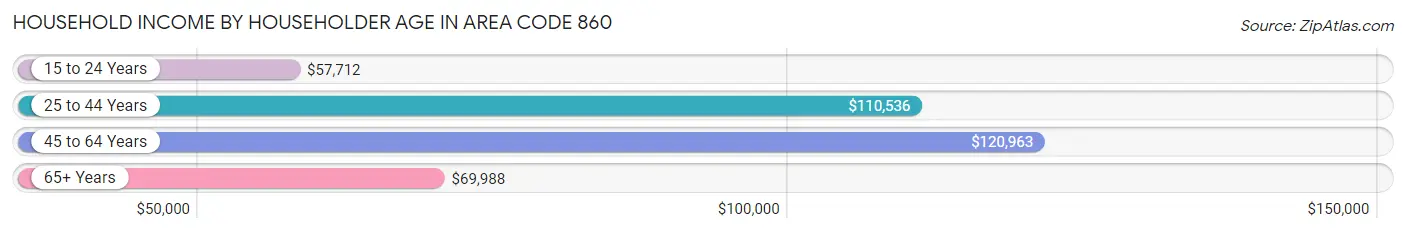
Household Income by Householder Age in Area Code 860
The median household income in Area Code 860 is $99,712, with the highest median household income of $120,963 found in the 45 to 64 years age bracket for the primary householder. A total of 270,647 households (38.8%) fall into this category. Meanwhile, the 15 to 24 years age bracket for the primary householder has the lowest median household income of $57,712, with 20,415 households (2.9%) in this group.
| Income Bracket | # Households | Median Income |
| 15 to 24 Years | 20,415 (2.9%) | $57,712 |
| 25 to 44 Years | 212,018 (30.4%) | $110,536 |
| 45 to 64 Years | 270,647 (38.8%) | $120,963 |
| 65+ Years | 193,771 (27.8%) | $69,988 |
| Total | 696,851 (100.0%) | $99,712 |
Poverty in Area Code 860
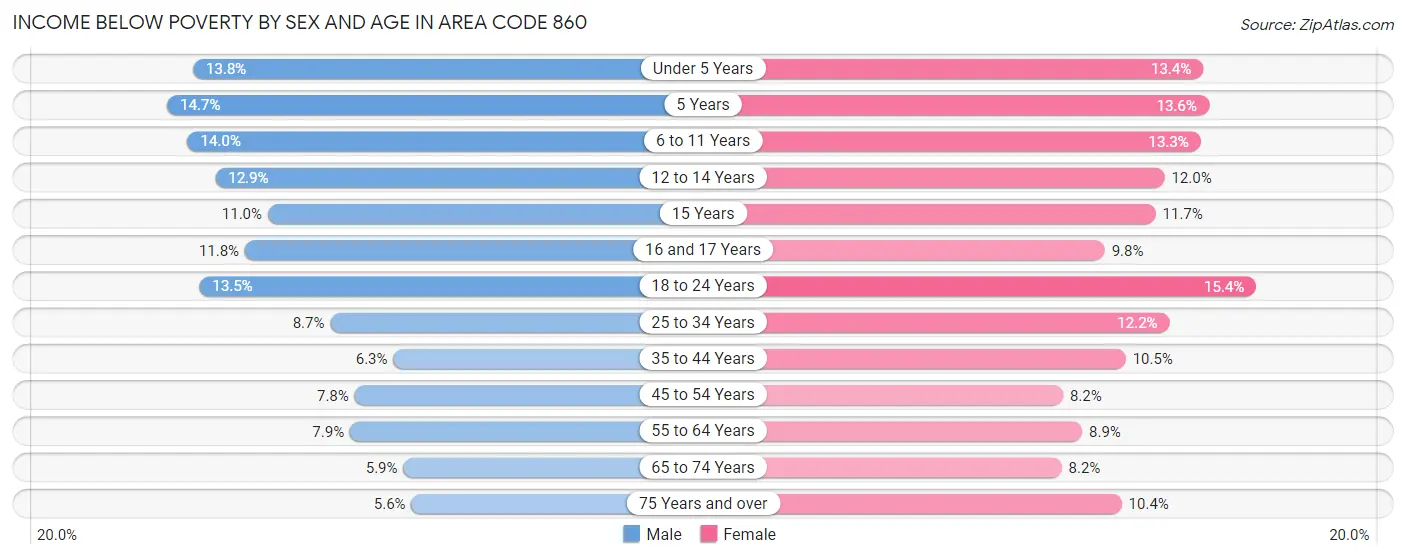
Income Below Poverty by Sex and Age in Area Code 860
With 9.1% poverty level for males and 10.7% for females among the residents of Area Code 860, 5 year old males and 18 to 24 year old females are the most vulnerable to poverty, with 1,194 males (14.7%) and 10,156 females (15.4%) in their respective age groups living below the poverty level.
| Age Bracket | Male | Female |
| Under 5 Years | 5,926 (13.8%) | 5,579 (13.4%) |
| 5 Years | 1,194 (14.7%) | 1,189 (13.6%) |
| 6 to 11 Years | 8,050 (14.0%) | 7,562 (13.3%) |
| 12 to 14 Years | 4,195 (12.9%) | 3,504 (12.0%) |
| 15 Years | 1,157 (11.0%) | 1,291 (11.7%) |
| 16 and 17 Years | 2,701 (11.8%) | 2,013 (9.8%) |
| 18 to 24 Years | 9,489 (13.5%) | 10,156 (15.4%) |
| 25 to 34 Years | 9,594 (8.6%) | 13,139 (12.2%) |
| 35 to 44 Years | 6,623 (6.3%) | 11,233 (10.5%) |
| 45 to 54 Years | 8,373 (7.7%) | 9,340 (8.2%) |
| 55 to 64 Years | 9,651 (7.9%) | 11,455 (8.9%) |
| 65 to 74 Years | 4,959 (5.9%) | 7,684 (8.2%) |
| 75 Years and over | 2,913 (5.6%) | 7,457 (10.4%) |
| Total | 74,825 (9.1%) | 91,602 (10.7%) |
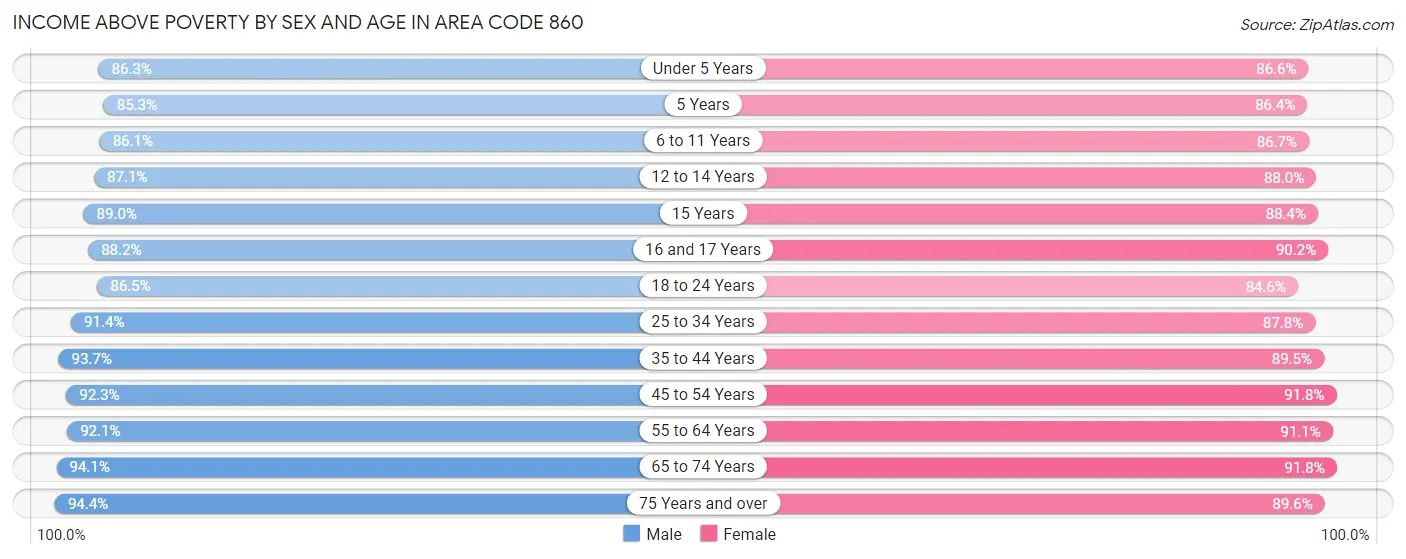
Income Above Poverty by Sex and Age in Area Code 860
According to the poverty statistics in Area Code 860, males aged 75 years and over and females aged 65 to 74 years are the age groups that are most secure financially, with 94.4% of males and 91.8% of females in these age groups living above the poverty line.
| Age Bracket | Male | Female |
| Under 5 Years | 37,185 (86.3%) | 36,017 (86.6%) |
| 5 Years | 6,921 (85.3%) | 7,541 (86.4%) |
| 6 to 11 Years | 49,659 (86.1%) | 49,228 (86.7%) |
| 12 to 14 Years | 28,285 (87.1%) | 25,741 (88.0%) |
| 15 Years | 9,391 (89.0%) | 9,790 (88.3%) |
| 16 and 17 Years | 20,151 (88.2%) | 18,608 (90.2%) |
| 18 to 24 Years | 60,746 (86.5%) | 55,874 (84.6%) |
| 25 to 34 Years | 101,360 (91.3%) | 94,874 (87.8%) |
| 35 to 44 Years | 98,264 (93.7%) | 95,375 (89.5%) |
| 45 to 54 Years | 99,735 (92.2%) | 104,374 (91.8%) |
| 55 to 64 Years | 112,131 (92.1%) | 116,938 (91.1%) |
| 65 to 74 Years | 78,562 (94.1%) | 86,428 (91.8%) |
| 75 Years and over | 48,700 (94.4%) | 64,325 (89.6%) |
| Total | 751,090 (90.9%) | 765,113 (89.3%) |
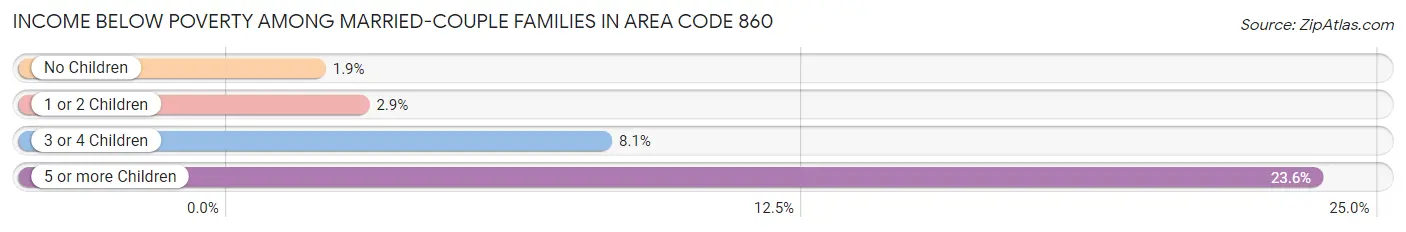
Income Below Poverty Among Married-Couple Families in Area Code 860
The poverty statistics for married-couple families in Area Code 860 show that 2.6% or 8,546 of the total 323,890 families live below the poverty line. Families with 5 or more children have the highest poverty rate of 23.6%, comprising of 182 families. On the other hand, families with no children have the lowest poverty rate of 1.9%, which includes 3,772 families.
| Children | Above Poverty | Below Poverty |
| No Children | 193,782 (98.1%) | 3,772 (1.9%) |
| 1 or 2 Children | 103,532 (97.1%) | 3,047 (2.9%) |
| 3 or 4 Children | 17,441 (91.9%) | 1,545 (8.1%) |
| 5 or more Children | 589 (76.4%) | 182 (23.6%) |
| Total | 315,344 (97.4%) | 8,546 (2.6%) |
Income Below Poverty Among Single-Parent Households in Area Code 860
According to the poverty data in Area Code 860, 9.0% or 3,122 single-father households and 20.3% or 17,569 single-mother households are living below the poverty line. Among single-father households, those with 3 or 4 children have the highest poverty rate, with 570 households (30.4%) experiencing poverty. Likewise, among single-mother households, those with 5 or more children have the highest poverty rate, with 281 households (72.4%) falling below the poverty line.
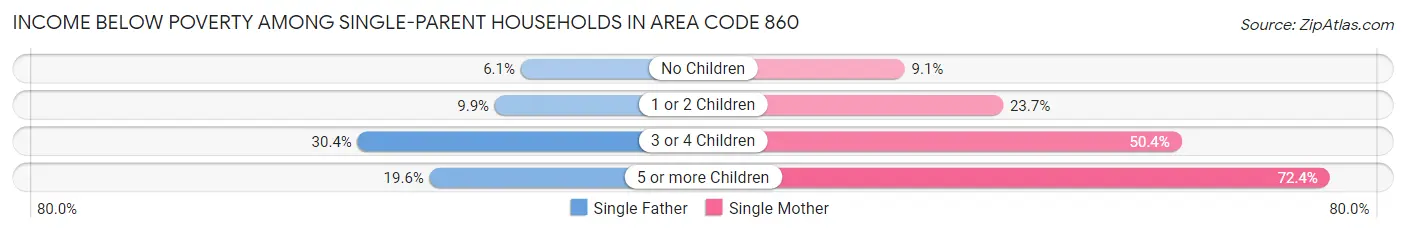
| Children | Single Father | Single Mother |
| No Children | 1,084 (6.1%) | 3,106 (9.1%) |
| 1 or 2 Children | 1,457 (9.9%) | 10,620 (23.7%) |
| 3 or 4 Children | 570 (30.4%) | 3,562 (50.3%) |
| 5 or more Children | 11 (19.6%) | 281 (72.4%) |
| Total | 3,122 (9.0%) | 17,569 (20.3%) |
Income Below Poverty Among Married-Couple vs Single-Parent Households in Area Code 860
The poverty data for Area Code 860 shows that 8,546 of the married-couple family households (2.6%) and 20,691 of the single-parent households (17.1%) are living below the poverty level. Within the married-couple family households, those with 5 or more children have the highest poverty rate, with 182 households (23.6%) falling below the poverty line. Among the single-parent households, those with 5 or more children have the highest poverty rate, with 292 household (65.8%) living below poverty.
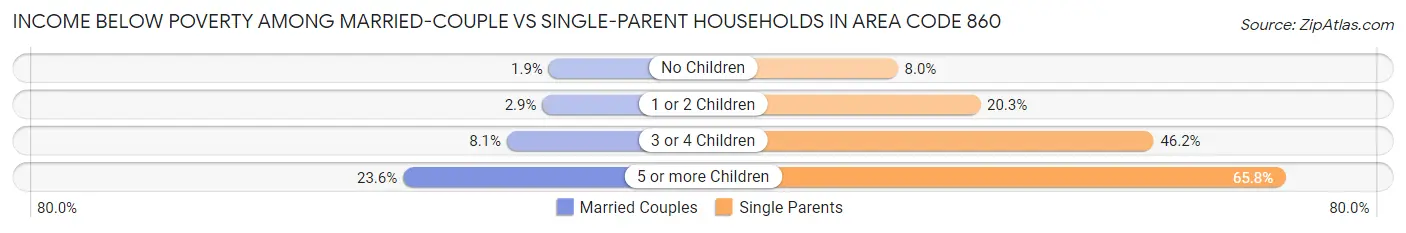
| Children | Married-Couple Families | Single-Parent Households |
| No Children | 3,772 (1.9%) | 4,190 (8.0%) |
| 1 or 2 Children | 3,047 (2.9%) | 12,077 (20.3%) |
| 3 or 4 Children | 1,545 (8.1%) | 4,132 (46.2%) |
| 5 or more Children | 182 (23.6%) | 292 (65.8%) |
| Total | 8,546 (2.6%) | 20,691 (17.1%) |
Race in Area Code 860
The most populous races in Area Code 860 are White / Caucasian (1,271,130 | 73.0%), Hispanic or Latino (259,779 | 14.9%), and Black / African American (161,662 | 9.3%).
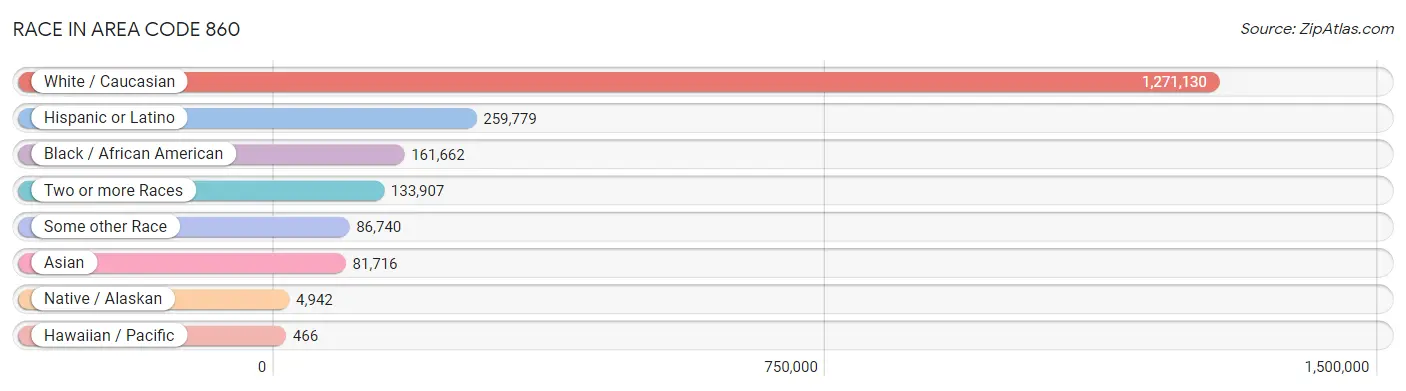
| Race | # Population | % Population |
| Asian | 81,716 | 4.7% |
| Black / African American | 161,662 | 9.3% |
| Hawaiian / Pacific | 466 | 0.0% |
| Hispanic or Latino | 259,779 | 14.9% |
| Native / Alaskan | 4,942 | 0.3% |
| White / Caucasian | 1,271,130 | 73.0% |
| Two or more Races | 133,907 | 7.7% |
| Some other Race | 86,740 | 5.0% |
| Total | 1,740,563 | 100.0% |
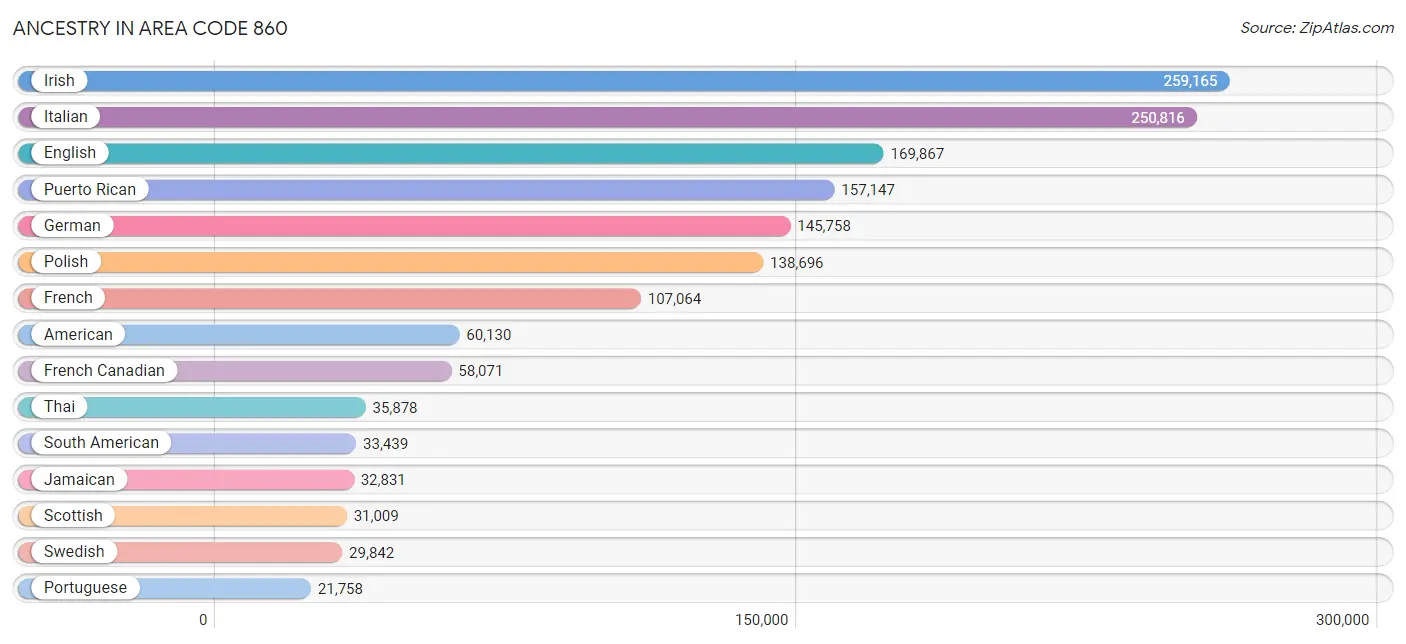
Ancestry in Area Code 860
The most populous ancestries reported in Area Code 860 are Irish (259,165 | 14.9%), Italian (250,816 | 14.4%), English (169,867 | 9.8%), Puerto Rican (157,147 | 9.0%), and German (145,758 | 8.4%), together accounting for 56.5% of all Area Code 860 residents.
| Ancestry | # Population | % Population |
| Afghan | 455 | 0.0% |
| African | 7,972 | 0.5% |
| Alaska Native | 20 | 0.0% |
| Albanian | 4,693 | 0.3% |
| Alsatian | 45 | 0.0% |
| American | 60,130 | 3.5% |
| Apache | 75 | 0.0% |
| Arab | 9,390 | 0.5% |
| Arapaho | 3 | 0.0% |
| Argentinean | 2,167 | 0.1% |
| Armenian | 2,175 | 0.1% |
| Assyrian / Chaldean / Syriac | 364 | 0.0% |
| Australian | 355 | 0.0% |
| Austrian | 5,121 | 0.3% |
| Bahamian | 72 | 0.0% |
| Bangladeshi | 81 | 0.0% |
| Barbadian | 664 | 0.0% |
| Basque | 27 | 0.0% |
| Belgian | 1,279 | 0.1% |
| Belizean | 155 | 0.0% |
| Bermudan | 40 | 0.0% |
| Bhutanese | 3,571 | 0.2% |
| Blackfeet | 1,586 | 0.1% |
| Bolivian | 481 | 0.0% |
| Brazilian | 5,246 | 0.3% |
| British | 8,362 | 0.5% |
| British West Indian | 1,084 | 0.1% |
| Bulgarian | 257 | 0.0% |
| Burmese | 6,061 | 0.4% |
| Cajun | 150 | 0.0% |
| Cambodian | 73 | 0.0% |
| Canadian | 7,578 | 0.4% |
| Cape Verdean | 821 | 0.1% |
| Carpatho Rusyn | 36 | 0.0% |
| Celtic | 279 | 0.0% |
| Central American | 12,996 | 0.7% |
| Central American Indian | 3,964 | 0.2% |
| Cherokee | 2,406 | 0.1% |
| Chickasaw | 48 | 0.0% |
| Chilean | 1,138 | 0.1% |
| Chinese | 18 | 0.0% |
| Chippewa | 205 | 0.0% |
| Choctaw | 320 | 0.0% |
| Colombian | 8,547 | 0.5% |
| Comanche | 25 | 0.0% |
| Costa Rican | 994 | 0.1% |
| Cree | 103 | 0.0% |
| Creek | 189 | 0.0% |
| Croatian | 1,031 | 0.1% |
| Cuban | 5,150 | 0.3% |
| Czech | 4,273 | 0.3% |
| Czechoslovakian | 2,241 | 0.1% |
| Danish | 4,640 | 0.3% |
| Delaware | 22 | 0.0% |
| Dominican | 17,352 | 1.0% |
| Dutch | 11,995 | 0.7% |
| Dutch West Indian | 42 | 0.0% |
| Eastern European | 7,196 | 0.4% |
| Ecuadorian | 7,532 | 0.4% |
| Egyptian | 1,190 | 0.1% |
| English | 169,867 | 9.8% |
| Estonian | 716 | 0.0% |
| Ethiopian | 577 | 0.0% |
| European | 18,755 | 1.1% |
| Filipino | 635 | 0.0% |
| Finnish | 3,285 | 0.2% |
| French | 107,064 | 6.1% |
| French American Indian | 384 | 0.0% |
| French Canadian | 58,071 | 3.3% |
| German | 145,758 | 8.4% |
| German Russian | 14 | 0.0% |
| Ghanaian | 3,083 | 0.2% |
| Greek | 11,379 | 0.6% |
| Guamanian / Chamorro | 192 | 0.0% |
| Guatemalan | 4,527 | 0.3% |
| Guyanese | 2,559 | 0.2% |
| Haitian | 5,598 | 0.3% |
| Hmong | 27 | 0.0% |
| Honduran | 2,659 | 0.2% |
| Hopi | 5 | 0.0% |
| Houma | 11 | 0.0% |
| Hungarian | 9,899 | 0.6% |
| Icelander | 160 | 0.0% |
| Indian (Asian) | 21,188 | 1.2% |
| Indonesian | 420 | 0.0% |
| Inupiat | 21 | 0.0% |
| Iranian | 1,198 | 0.1% |
| Iraqi | 148 | 0.0% |
| Irish | 259,165 | 14.9% |
| Iroquois | 848 | 0.1% |
| Israeli | 568 | 0.0% |
| Italian | 250,816 | 14.4% |
| Jamaican | 32,831 | 1.9% |
| Japanese | 1,484 | 0.1% |
| Jordanian | 203 | 0.0% |
| Kenyan | 247 | 0.0% |
| Korean | 10,835 | 0.6% |
| Laotian | 799 | 0.1% |
| Latvian | 918 | 0.1% |
| Lebanese | 4,018 | 0.2% |
| Liberian | 159 | 0.0% |
| Lithuanian | 13,567 | 0.8% |
| Lumbee | 63 | 0.0% |
| Luxembourger | 46 | 0.0% |
| Macedonian | 267 | 0.0% |
| Malaysian | 1,829 | 0.1% |
| Maltese | 97 | 0.0% |
| Mexican | 20,128 | 1.2% |
| Mexican American Indian | 581 | 0.0% |
| Mongolian | 254 | 0.0% |
| Moroccan | 745 | 0.0% |
| Native Hawaiian | 398 | 0.0% |
| Navajo | 268 | 0.0% |
| New Zealander | 53 | 0.0% |
| Nicaraguan | 431 | 0.0% |
| Nigerian | 2,030 | 0.1% |
| Northern European | 1,751 | 0.1% |
| Norwegian | 8,361 | 0.5% |
| Okinawan | 15 | 0.0% |
| Pakistani | 1,010 | 0.1% |
| Palestinian | 356 | 0.0% |
| Panamanian | 640 | 0.0% |
| Paraguayan | 203 | 0.0% |
| Pennsylvania German | 393 | 0.0% |
| Peruvian | 10,568 | 0.6% |
| Polish | 138,696 | 8.0% |
| Portuguese | 21,758 | 1.3% |
| Potawatomi | 16 | 0.0% |
| Pueblo | 48 | 0.0% |
| Puerto Rican | 157,147 | 9.0% |
| Romanian | 1,795 | 0.1% |
| Russian | 18,267 | 1.1% |
| Salvadoran | 3,546 | 0.2% |
| Samoan | 373 | 0.0% |
| Scandinavian | 3,261 | 0.2% |
| Scotch-Irish | 8,582 | 0.5% |
| Scottish | 31,009 | 1.8% |
| Senegalese | 134 | 0.0% |
| Serbian | 446 | 0.0% |
| Sierra Leonean | 14 | 0.0% |
| Sioux | 138 | 0.0% |
| Slavic | 867 | 0.1% |
| Slovak | 4,592 | 0.3% |
| Slovene | 434 | 0.0% |
| Somali | 399 | 0.0% |
| South African | 238 | 0.0% |
| South American | 33,439 | 1.9% |
| South American Indian | 583 | 0.0% |
| Soviet Union | 28 | 0.0% |
| Spaniard | 3,760 | 0.2% |
| Spanish | 3,423 | 0.2% |
| Spanish American | 69 | 0.0% |
| Sri Lankan | 6,376 | 0.4% |
| Subsaharan African | 17,522 | 1.0% |
| Sudanese | 318 | 0.0% |
| Swedish | 29,842 | 1.7% |
| Swiss | 4,035 | 0.2% |
| Syrian | 709 | 0.0% |
| Thai | 35,878 | 2.1% |
| Tlingit-Haida | 8 | 0.0% |
| Tongan | 102 | 0.0% |
| Trinidadian and Tobagonian | 1,267 | 0.1% |
| Tsimshian | 1 | 0.0% |
| Turkish | 1,112 | 0.1% |
| U.S. Virgin Islander | 77 | 0.0% |
| Ugandan | 219 | 0.0% |
| Ukrainian | 10,425 | 0.6% |
| Uruguayan | 261 | 0.0% |
| Venezuelan | 1,621 | 0.1% |
| Vietnamese | 885 | 0.1% |
| Welsh | 6,318 | 0.4% |
| West Indian | 1,728 | 0.1% |
| Yaqui | 30 | 0.0% |
| Yugoslavian | 3,252 | 0.2% | View All 174 Rows |
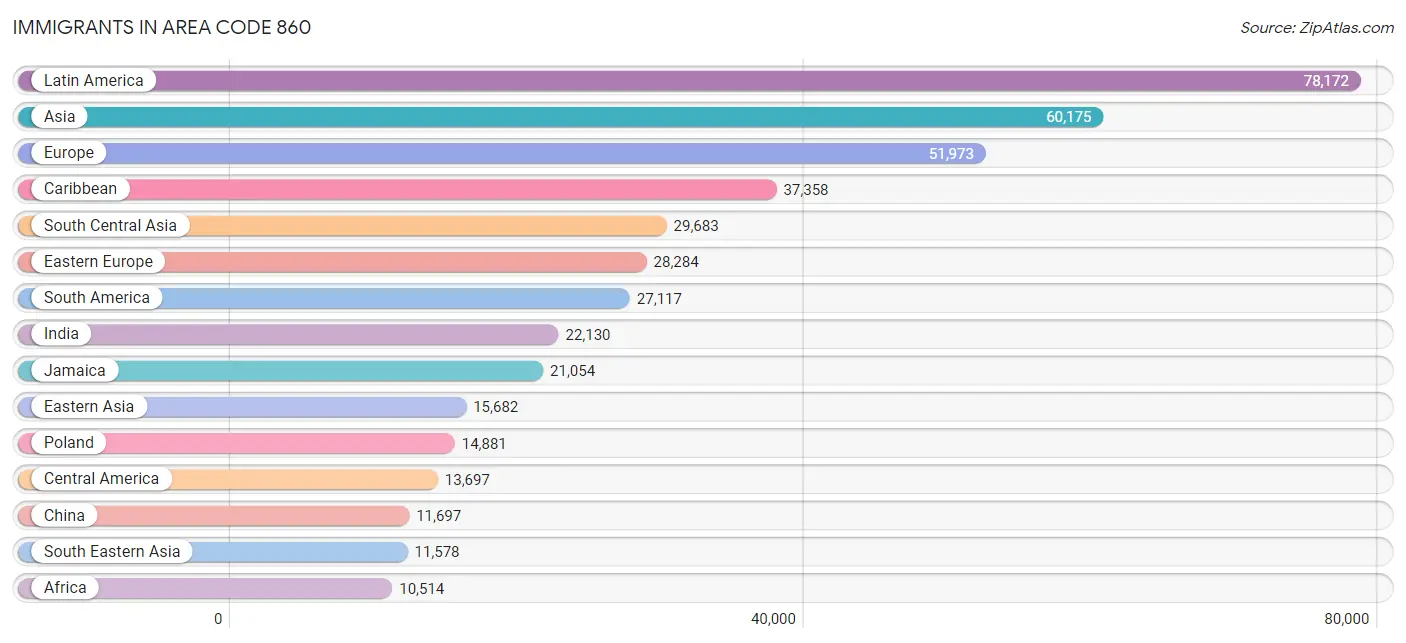
Immigrants in Area Code 860
The most numerous immigrant groups reported in Area Code 860 came from Latin America (78,172 | 4.5%), Asia (60,175 | 3.5%), Europe (51,973 | 3.0%), Caribbean (37,358 | 2.1%), and South Central Asia (29,683 | 1.7%), together accounting for 14.8% of all Area Code 860 residents.
| Immigration Origin | # Population | % Population |
| Afghanistan | 294 | 0.0% |
| Africa | 10,514 | 0.6% |
| Albania | 2,404 | 0.1% |
| Argentina | 926 | 0.1% |
| Armenia | 9 | 0.0% |
| Asia | 60,175 | 3.5% |
| Australia | 340 | 0.0% |
| Austria | 301 | 0.0% |
| Azores | 184 | 0.0% |
| Bahamas | 253 | 0.0% |
| Bangladesh | 1,369 | 0.1% |
| Barbados | 331 | 0.0% |
| Belarus | 429 | 0.0% |
| Belgium | 411 | 0.0% |
| Belize | 150 | 0.0% |
| Bolivia | 200 | 0.0% |
| Bosnia and Herzegovina | 2,374 | 0.1% |
| Brazil | 4,667 | 0.3% |
| Bulgaria | 273 | 0.0% |
| Cabo Verde | 304 | 0.0% |
| Cambodia | 736 | 0.0% |
| Cameroon | 670 | 0.0% |
| Canada | 5,816 | 0.3% |
| Caribbean | 37,358 | 2.1% |
| Central America | 13,697 | 0.8% |
| Chile | 640 | 0.0% |
| China | 11,697 | 0.7% |
| Colombia | 4,938 | 0.3% |
| Congo | 14 | 0.0% |
| Costa Rica | 458 | 0.0% |
| Croatia | 79 | 0.0% |
| Cuba | 1,386 | 0.1% |
| Czechoslovakia | 264 | 0.0% |
| Denmark | 114 | 0.0% |
| Dominica | 117 | 0.0% |
| Dominican Republic | 8,215 | 0.5% |
| Eastern Africa | 1,607 | 0.1% |
| Eastern Asia | 15,682 | 0.9% |
| Eastern Europe | 28,284 | 1.6% |
| Ecuador | 4,272 | 0.3% |
| Egypt | 538 | 0.0% |
| El Salvador | 1,987 | 0.1% |
| England | 2,851 | 0.2% |
| Eritrea | 10 | 0.0% |
| Ethiopia | 488 | 0.0% |
| Europe | 51,973 | 3.0% |
| France | 964 | 0.1% |
| Germany | 3,192 | 0.2% |
| Ghana | 2,755 | 0.2% |
| Greece | 901 | 0.1% |
| Grenada | 54 | 0.0% |
| Guatemala | 3,143 | 0.2% |
| Guyana | 3,009 | 0.2% |
| Haiti | 3,382 | 0.2% |
| Honduras | 1,728 | 0.1% |
| Hong Kong | 432 | 0.0% |
| Hungary | 374 | 0.0% |
| India | 22,130 | 1.3% |
| Indonesia | 318 | 0.0% |
| Iran | 690 | 0.0% |
| Iraq | 212 | 0.0% |
| Ireland | 1,205 | 0.1% |
| Israel | 325 | 0.0% |
| Italy | 5,932 | 0.3% |
| Jamaica | 21,054 | 1.2% |
| Japan | 864 | 0.1% |
| Jordan | 116 | 0.0% |
| Kazakhstan | 130 | 0.0% |
| Kenya | 362 | 0.0% |
| Korea | 3,083 | 0.2% |
| Kuwait | 134 | 0.0% |
| Laos | 989 | 0.1% |
| Latin America | 78,172 | 4.5% |
| Latvia | 147 | 0.0% |
| Lebanon | 350 | 0.0% |
| Liberia | 54 | 0.0% |
| Lithuania | 333 | 0.0% |
| Malaysia | 346 | 0.0% |
| Mexico | 5,782 | 0.3% |
| Middle Africa | 870 | 0.1% |
| Moldova | 180 | 0.0% |
| Morocco | 466 | 0.0% |
| Nepal | 514 | 0.0% |
| Netherlands | 414 | 0.0% |
| Nicaragua | 195 | 0.0% |
| Nigeria | 1,287 | 0.1% |
| North Macedonia | 389 | 0.0% |
| Northern Africa | 1,888 | 0.1% |
| Northern Europe | 7,786 | 0.4% |
| Norway | 117 | 0.0% |
| Oceania | 508 | 0.0% |
| Pakistan | 3,363 | 0.2% |
| Panama | 254 | 0.0% |
| Peru | 6,827 | 0.4% |
| Philippines | 4,961 | 0.3% |
| Poland | 14,881 | 0.9% |
| Portugal | 2,883 | 0.2% |
| Romania | 482 | 0.0% |
| Russia | 2,117 | 0.1% |
| Saudi Arabia | 380 | 0.0% |
| Scotland | 587 | 0.0% |
| Senegal | 28 | 0.0% |
| Serbia | 234 | 0.0% |
| Sierra Leone | 119 | 0.0% |
| Singapore | 87 | 0.0% |
| Somalia | 101 | 0.0% |
| South Africa | 370 | 0.0% |
| South America | 27,117 | 1.6% |
| South Central Asia | 29,683 | 1.7% |
| South Eastern Asia | 11,578 | 0.7% |
| Southern Europe | 10,326 | 0.6% |
| Spain | 600 | 0.0% |
| Sri Lanka | 789 | 0.1% |
| St. Vincent and the Grenadines | 104 | 0.0% |
| Sudan | 408 | 0.0% |
| Sweden | 474 | 0.0% |
| Switzerland | 155 | 0.0% |
| Syria | 223 | 0.0% |
| Taiwan | 942 | 0.1% |
| Thailand | 691 | 0.0% |
| Trinidad and Tobago | 985 | 0.1% |
| Turkey | 896 | 0.1% |
| Uganda | 190 | 0.0% |
| Ukraine | 2,235 | 0.1% |
| Uruguay | 183 | 0.0% |
| Uzbekistan | 195 | 0.0% |
| Venezuela | 1,230 | 0.1% |
| Vietnam | 3,213 | 0.2% |
| West Indies | 165 | 0.0% |
| Western Africa | 5,413 | 0.3% |
| Western Asia | 3,108 | 0.2% |
| Western Europe | 5,442 | 0.3% |
| Yemen | 250 | 0.0% |
| Zaire | 152 | 0.0% |
| Zimbabwe | 27 | 0.0% | View All 135 Rows |
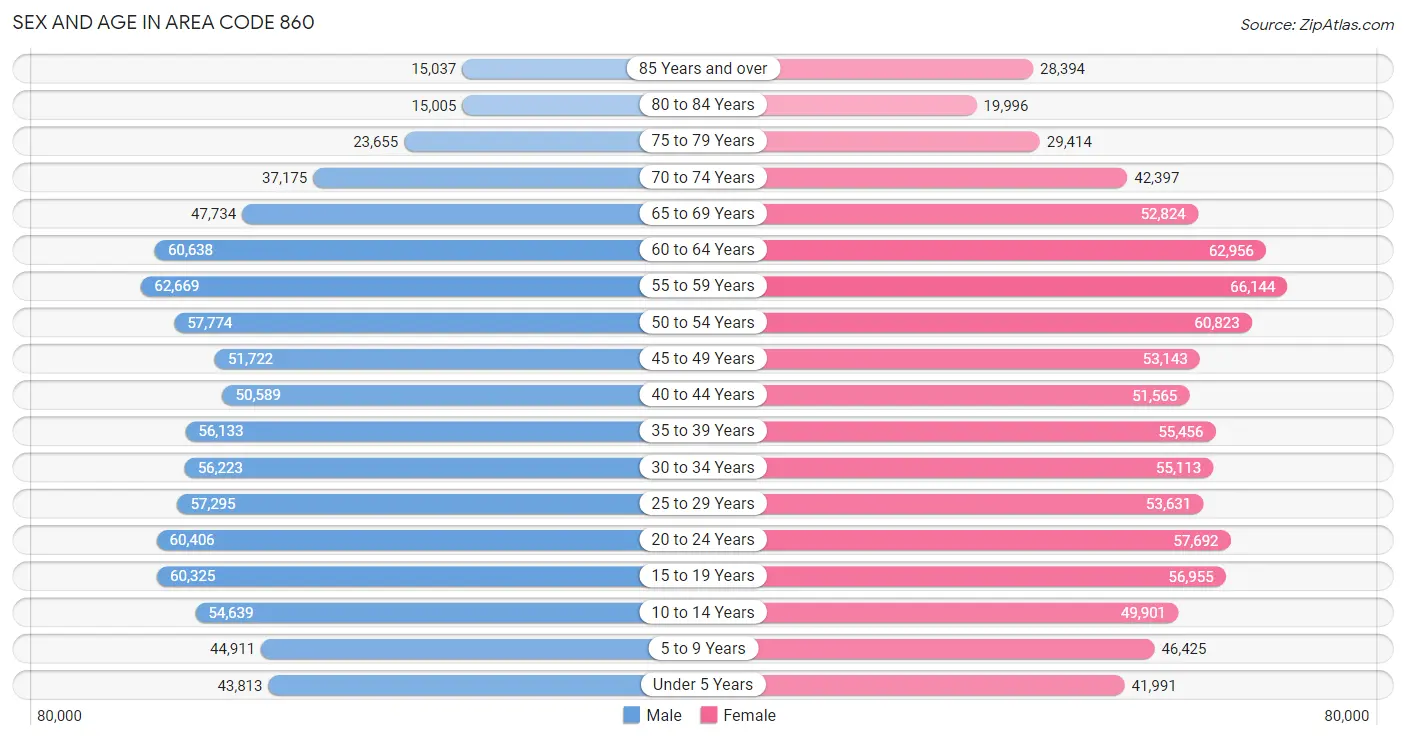
Sex and Age in Area Code 860
Sex and Age in Area Code 860
The most populous age groups in Area Code 860 are 55 to 59 Years (62,669 | 7.3%) for men and 55 to 59 Years (66,144 | 7.5%) for women.
| Age Bracket | Male | Female |
| Under 5 Years | 43,813 (5.1%) | 41,991 (4.8%) |
| 5 to 9 Years | 44,911 (5.2%) | 46,425 (5.2%) |
| 10 to 14 Years | 54,639 (6.4%) | 49,901 (5.6%) |
| 15 to 19 Years | 60,325 (7.0%) | 56,955 (6.4%) |
| 20 to 24 Years | 60,406 (7.1%) | 57,692 (6.5%) |
| 25 to 29 Years | 57,295 (6.7%) | 53,631 (6.1%) |
| 30 to 34 Years | 56,223 (6.6%) | 55,113 (6.2%) |
| 35 to 39 Years | 56,133 (6.6%) | 55,456 (6.3%) |
| 40 to 44 Years | 50,589 (5.9%) | 51,565 (5.8%) |
| 45 to 49 Years | 51,722 (6.0%) | 53,143 (6.0%) |
| 50 to 54 Years | 57,774 (6.8%) | 60,823 (6.9%) |
| 55 to 59 Years | 62,669 (7.3%) | 66,144 (7.5%) |
| 60 to 64 Years | 60,638 (7.1%) | 62,956 (7.1%) |
| 65 to 69 Years | 47,734 (5.6%) | 52,824 (6.0%) |
| 70 to 74 Years | 37,175 (4.3%) | 42,397 (4.8%) |
| 75 to 79 Years | 23,655 (2.8%) | 29,414 (3.3%) |
| 80 to 84 Years | 15,005 (1.8%) | 19,996 (2.3%) |
| 85 Years and over | 15,037 (1.8%) | 28,394 (3.2%) |
| Total | 855,743 (100.0%) | 884,820 (100.0%) |
Families and Households in Area Code 860
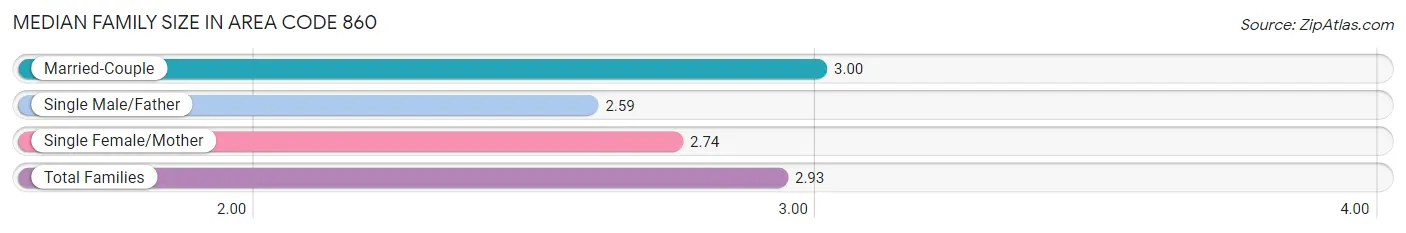
Median Family Size in Area Code 860
The median family size in Area Code 860 is 2.93 persons per family, with married-couple families (323,890 | 72.8%) accounting for the largest median family size of 3.00165 persons per family. On the other hand, single male/father families (34,503 | 7.8%) represent the smallest median family size with 2.59 persons per family.
| Family Type | # Families | Family Size |
| Married-Couple | 323,890 (72.8%) | 3.00 |
| Single Male/Father | 34,503 (7.8%) | 2.59 |
| Single Female/Mother | 86,411 (19.4%) | 2.74 |
| Total Families | 444,804 (100.0%) | 2.93 |
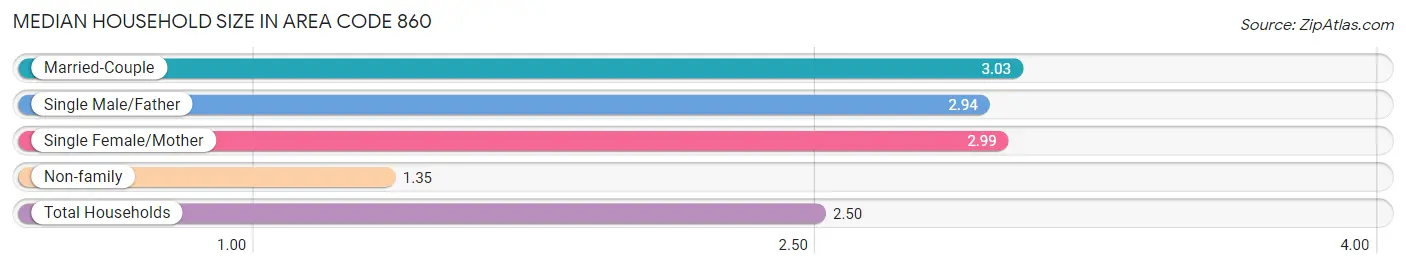
Median Household Size in Area Code 860
The median household size in Area Code 860 is 2.50 persons per household, with married-couple households (323,890 | 46.5%) accounting for the largest median household size of 3.02565 persons per household. non-family households (252,047 | 36.2%) represent the smallest median household size with 1.35 persons per household.
| Household Type | # Households | Household Size |
| Married-Couple | 323,890 (46.5%) | 3.03 |
| Single Male/Father | 34,503 (5.0%) | 2.94 |
| Single Female/Mother | 86,411 (12.4%) | 2.99 |
| Non-family | 252,047 (36.2%) | 1.35 |
| Total Households | 696,851 (100.0%) | 2.50 |
Household Size by Marriage Status in Area Code 860
Out of a total of 696,851 households in Area Code 860, 444,804 (63.8%) are family households, while 252,047 (36.2%) are nonfamily households. The most numerous type of family households are 2-person households, comprising 198,694, and the most common type of nonfamily households are 1-person households, comprising 202,269.
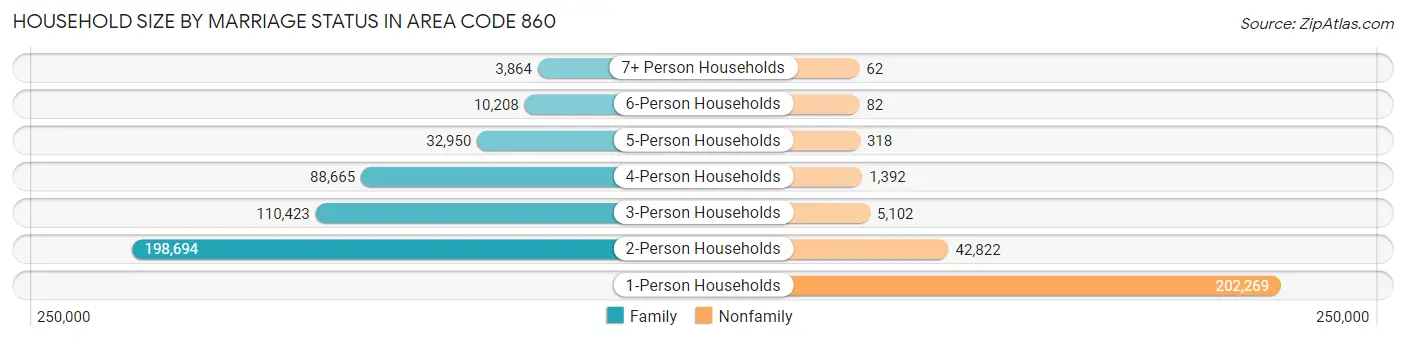
| Household Size | Family Households | Nonfamily Households |
| 1-Person Households | - | 202,269 (29.0%) |
| 2-Person Households | 198,694 (28.5%) | 42,822 (6.1%) |
| 3-Person Households | 110,423 (15.9%) | 5,102 (0.7%) |
| 4-Person Households | 88,665 (12.7%) | 1,392 (0.2%) |
| 5-Person Households | 32,950 (4.7%) | 318 (0.1%) |
| 6-Person Households | 10,208 (1.5%) | 82 (0.0%) |
| 7+ Person Households | 3,864 (0.5%) | 62 (0.0%) |
| Total | 444,804 (63.8%) | 252,047 (36.2%) |
Female Fertility in Area Code 860
Fertility by Age in Area Code 860
Average fertility rate in Area Code 860 is 47.8 births per 1,000 women. Women in the age bracket of 20 to 34 years have the highest fertility rate with 88.3 births per 1,000 women. Women in the age bracket of 20 to 34 years acount for 67.4% of all women with births.
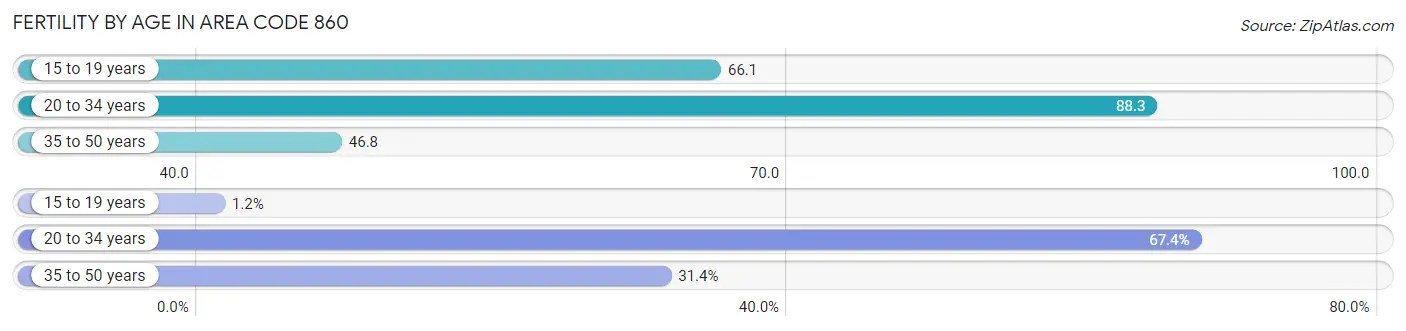
| Age Bracket | Women with Births | Births / 1,000 Women |
| 15 to 19 years | 195 (1.1%) | 66.1 |
| 20 to 34 years | 11,447 (67.4%) | 88.3 |
| 35 to 50 years | 5,339 (31.4%) | 46.8 |
| Total | 16,981 (100.0%) | 47.8 |
Fertility by Age by Marriage Status in Area Code 860
60.8% of women with births (16,981) in Area Code 860 are married. The highest percentage of unmarried women with births falls into 15 to 19 years age bracket with 100.0% of them unmarried at the time of birth, while the lowest percentage of unmarried women with births belong to 35 to 50 years age bracket with 47.7% of them unmarried.
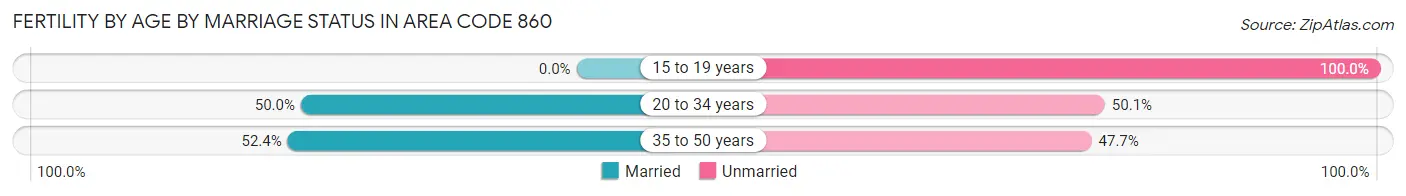
| Age Bracket | Married | Unmarried |
| 15 to 19 years | 0 (0.0%) | 195 (100.0%) |
| 20 to 34 years | 5,718 (49.9%) | 5,729 (50.0%) |
| 35 to 50 years | 2,795 (52.3%) | 2,544 (47.6%) |
| Total | 10,322 (60.8%) | 6,659 (39.2%) |
Fertility by Education in Area Code 860
Average fertility rate in Area Code 860 is 47.8 births per 1,000 women. Women with the education attainment of high school diploma have the highest fertility rate of 103.9 births per 1,000 women, while women with the education attainment of college or associate's degree have the lowest fertility at 64.4 births per 1,000 women. Women with the education attainment of college or associate's degree represent 28.5% of all women with births.
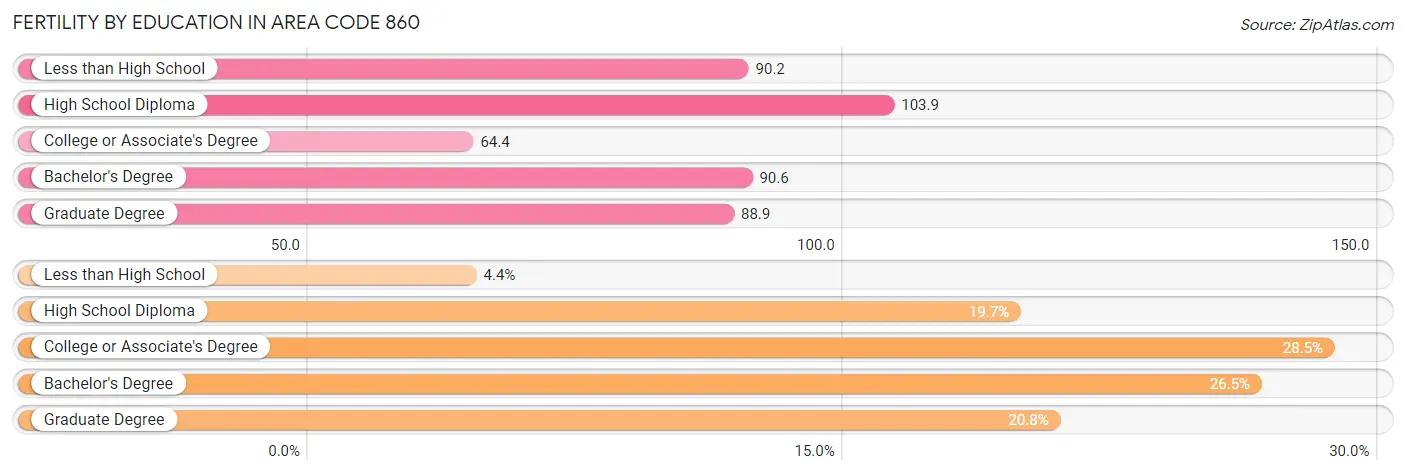
| Educational Attainment | Women with Births | Births / 1,000 Women |
| Less than High School | 751 (4.4%) | 90.2 |
| High School Diploma | 3,348 (19.7%) | 103.9 |
| College or Associate's Degree | 4,847 (28.5%) | 64.4 |
| Bachelor's Degree | 4,498 (26.5%) | 90.6 |
| Graduate Degree | 3,537 (20.8%) | 88.9 |
| Total | 16,981 (100.0%) | 47.8 |
Fertility by Education by Marriage Status in Area Code 860
39.2% of women with births in Area Code 860 are unmarried. Women with the educational attainment of bachelor's degree are most likely to be married with 53.2% of them married at childbirth, while women with the educational attainment of less than high school are least likely to be married with 89.7% of them unmarried at childbirth.
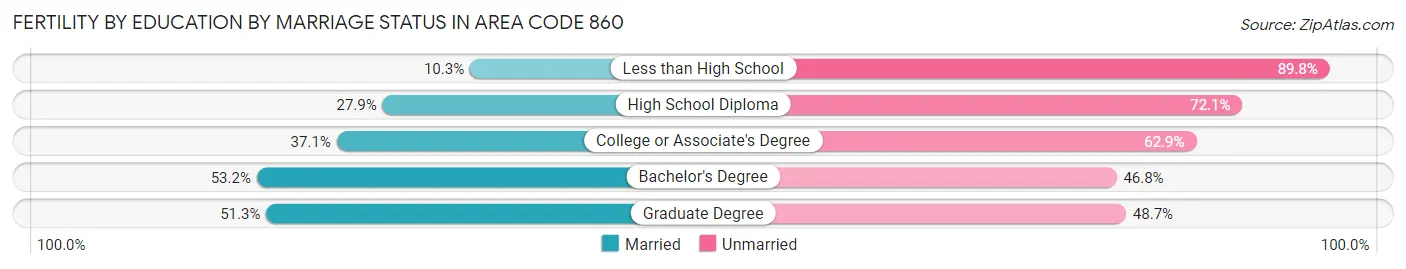
| Educational Attainment | Married | Unmarried |
| Less than High School | 77 (10.2%) | 674 (89.7%) |
| High School Diploma | 933 (27.9%) | 2,415 (72.1%) |
| College or Associate's Degree | 1,799 (37.1%) | 3,048 (62.9%) |
| Bachelor's Degree | 2,394 (53.2%) | 2,104 (46.8%) |
| Graduate Degree | 1,815 (51.3%) | 1,722 (48.7%) |
| Total | 10,322 (60.8%) | 6,659 (39.2%) |
Employment Characteristics in Area Code 860
Employment by Class of Employer in Area Code 860
Among the 872,407 employed individuals in Area Code 860, private company employees (582,724 | 66.8%), not-for-profit organizations (82,970 | 9.5%), and local government employees (66,293 | 7.6%) make up the most common classes of employment.
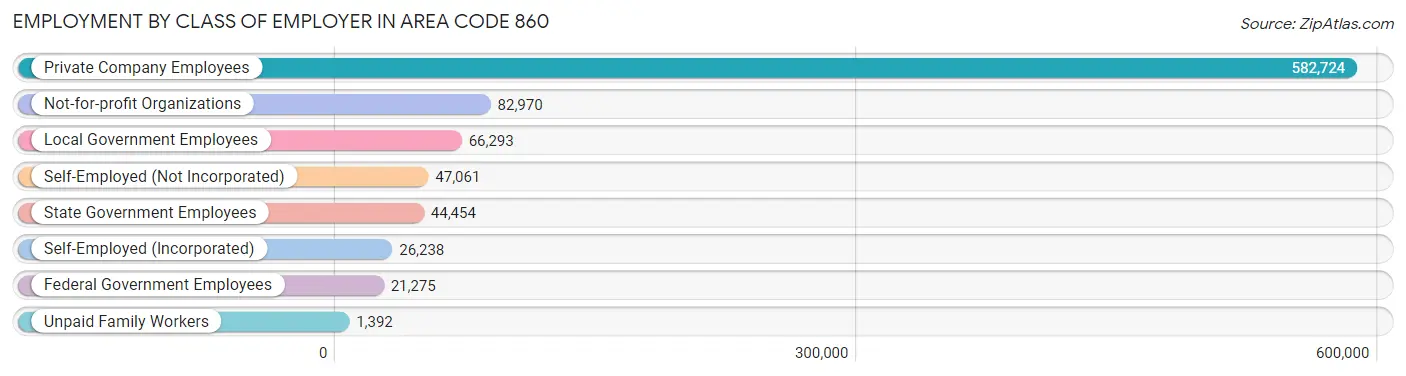
| Employer Class | # Employees | % Employees |
| Private Company Employees | 582,724 | 66.8% |
| Self-Employed (Incorporated) | 26,238 | 3.0% |
| Self-Employed (Not Incorporated) | 47,061 | 5.4% |
| Not-for-profit Organizations | 82,970 | 9.5% |
| Local Government Employees | 66,293 | 7.6% |
| State Government Employees | 44,454 | 5.1% |
| Federal Government Employees | 21,275 | 2.4% |
| Unpaid Family Workers | 1,392 | 0.2% |
| Total | 872,407 | 100.0% |
Employment Status by Age in Area Code 860
According to the labor force statistics for Area Code 860, out of the total population over 16 years of age (1,437,213), 66.2% or 951,435 individuals are in the labor force, with 6.1% or 58,133 of them unemployed. The age group with the highest labor force participation rate is 30 to 34 years, with 88.6% or 98,599 individuals in the labor force. Within the labor force, the 16 to 19 years age range has the highest percentage of unemployed individuals, with 2,417.9% or 1,084,452 of them being unemployed.
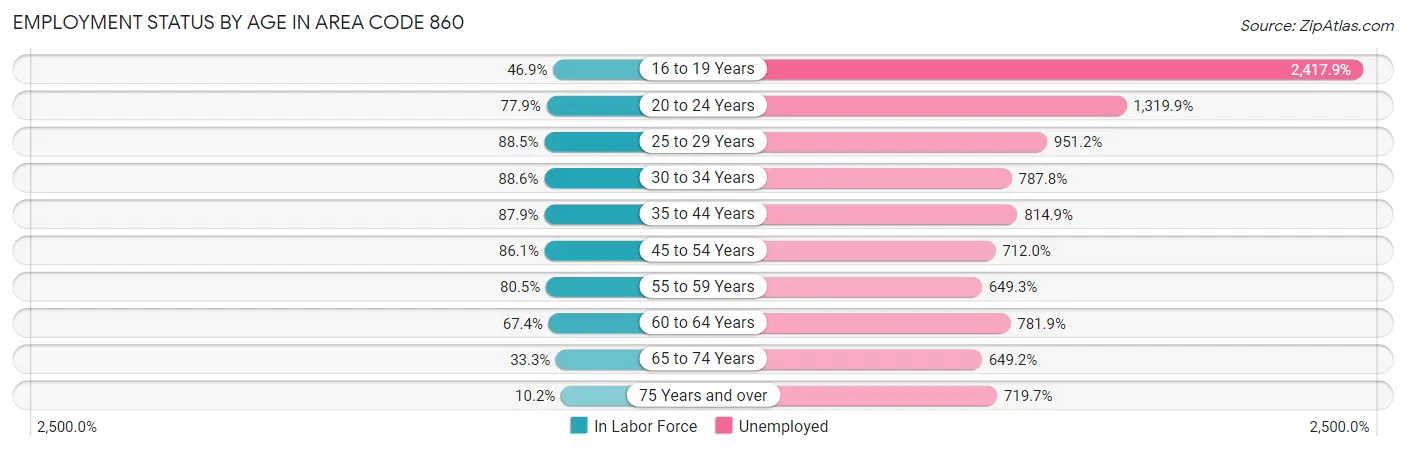
| Age Bracket | In Labor Force | Unemployed |
| 16 to 19 Years | 44,849 (46.9%) | 1,084,452 (2,417.9%) |
| 20 to 24 Years | 92,022 (77.9%) | 1,214,598 (1,319.9%) |
| 25 to 29 Years | 98,208 (88.5%) | 934,107 (951.2%) |
| 30 to 34 Years | 98,603 (88.6%) | 776,763 (787.8%) |
| 35 to 44 Years | 187,886 (87.9%) | 1,531,034 (814.9%) |
| 45 to 54 Years | 192,329 (86.1%) | 1,369,418 (712.0%) |
| 55 to 59 Years | 103,654 (80.5%) | 673,038 (649.3%) |
| 60 to 64 Years | 83,238 (67.3%) | 650,861 (781.9%) |
| 65 to 74 Years | 59,914 (33.3%) | 388,942 (649.2%) |
| 75 Years and over | 13,394 (10.2%) | 96,440 (719.7%) |
| Total | 951,467 (66.2%) | 58,130 (6.1%) |
Employment Status by Educational Attainment in Area Code 860
According to labor force statistics for Area Code 860, 82.6% of individuals (753,299) out of the total population between 25 and 64 years of age (911,874) are in the labor force, with 827.5% or 6,233,549 of them being unemployed. The group with the highest labor force participation rate are those with the educational attainment of bachelor's degree or higher, with 89.0% or 326,900 individuals in the labor force. Within the labor force, individuals with less than high school education have the highest percentage of unemployment, with 1,771.8% or 736,555 of them being unemployed.
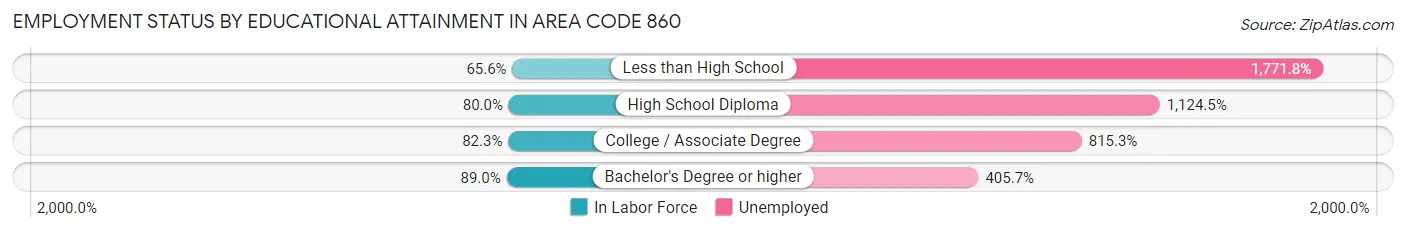
| Educational Attainment | In Labor Force | Unemployed |
| Less than High School | 41,571 (65.6%) | 1,123,481 (1,771.8%) |
| High School Diploma | 186,939 (80.0%) | 2,626,663 (1,124.5%) |
| College / Associate Degree | 203,710 (82.3%) | 2,018,495 (815.3%) |
| Bachelor's Degree or higher | 326,900 (89.0%) | 1,490,148 (405.7%) |
| Total | 753,294 (82.6%) | 7,545,757 (827.5%) |
Employment Occupations by Sex in Area Code 860
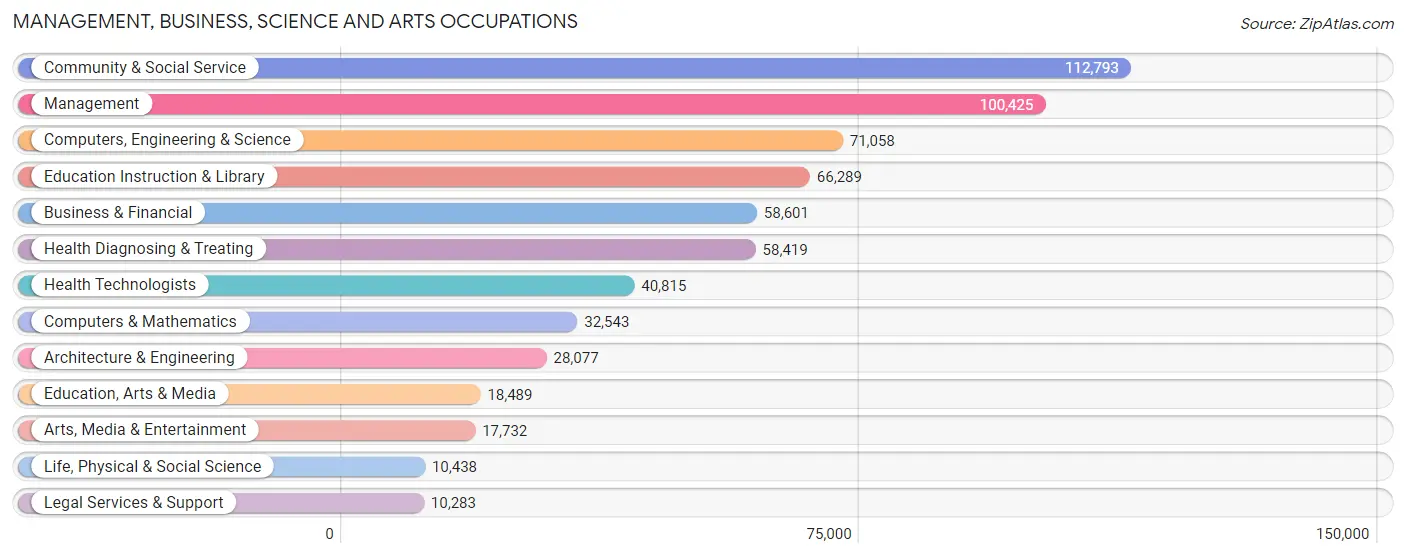
Management, Business, Science and Arts Occupations
The most common Management, Business, Science and Arts occupations in Area Code 860 are Community & Social Service (112,793 | 12.7%), Management (100,425 | 11.3%), Computers, Engineering & Science (71,058 | 8.0%), Education Instruction & Library (66,289 | 7.5%), and Business & Financial (58,601 | 6.6%).
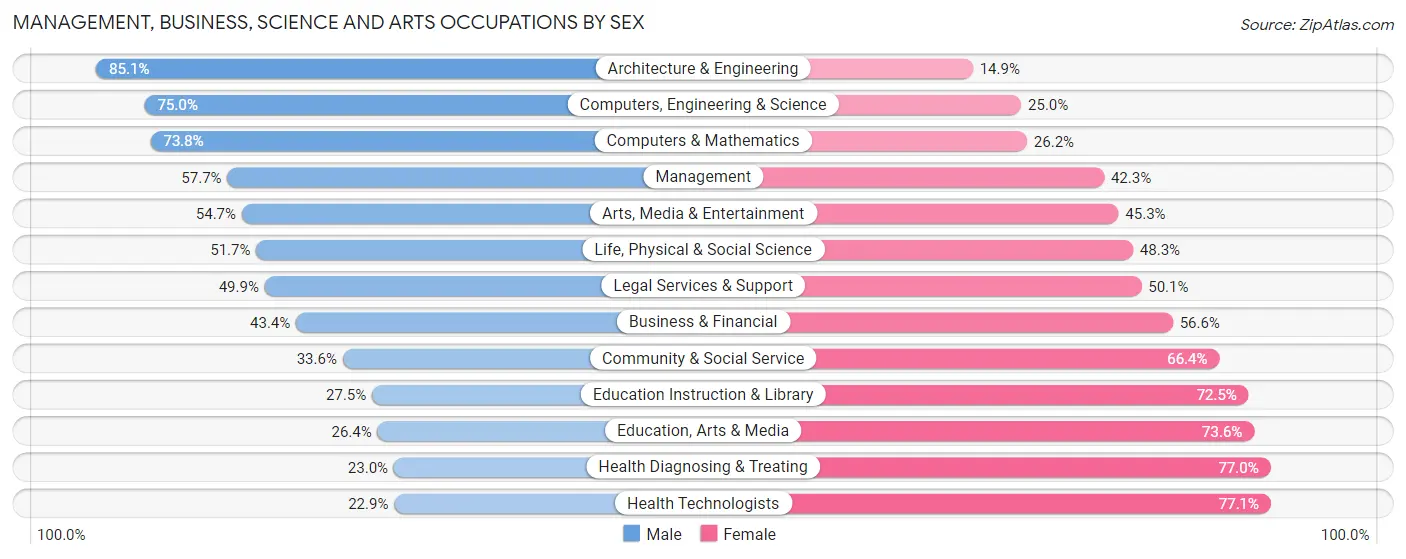
Management, Business, Science and Arts Occupations by Sex
Within the Management, Business, Science and Arts occupations in Area Code 860, the most male-oriented occupations are Architecture & Engineering (85.1%), Computers, Engineering & Science (75.0%), and Computers & Mathematics (73.8%), while the most female-oriented occupations are Health Technologists (77.1%), Health Diagnosing & Treating (77.0%), and Education, Arts & Media (73.6%).
| Occupation | Male | Female |
| Management | 57,933 (57.7%) | 42,492 (42.3%) |
| Business & Financial | 25,410 (43.4%) | 33,191 (56.6%) |
| Computers, Engineering & Science | 53,282 (75.0%) | 17,776 (25.0%) |
| Computers & Mathematics | 24,006 (73.8%) | 8,537 (26.2%) |
| Architecture & Engineering | 23,884 (85.1%) | 4,193 (14.9%) |
| Life, Physical & Social Science | 5,392 (51.7%) | 5,046 (48.3%) |
| Community & Social Service | 37,938 (33.6%) | 74,855 (66.4%) |
| Education, Arts & Media | 4,876 (26.4%) | 13,613 (73.6%) |
| Legal Services & Support | 5,132 (49.9%) | 5,151 (50.1%) |
| Education Instruction & Library | 18,234 (27.5%) | 48,055 (72.5%) |
| Arts, Media & Entertainment | 9,696 (54.7%) | 8,036 (45.3%) |
| Health Diagnosing & Treating | 13,415 (23.0%) | 45,004 (77.0%) |
| Health Technologists | 9,342 (22.9%) | 31,473 (77.1%) |
| Total (Category) | 187,978 (46.8%) | 213,318 (53.2%) |
| Total (Overall) | 456,023 (51.3%) | 432,014 (48.6%) |
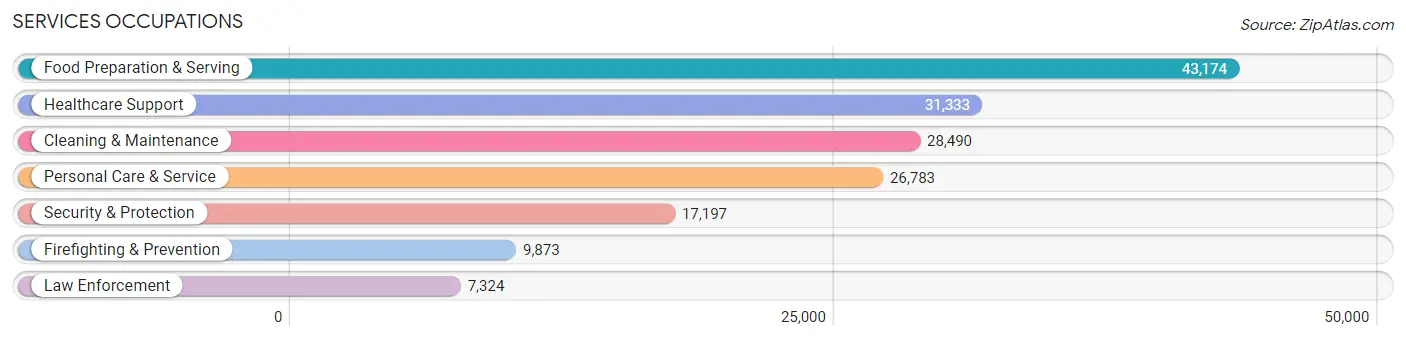
Services Occupations
The most common Services occupations in Area Code 860 are Food Preparation & Serving (43,174 | 4.9%), Healthcare Support (31,333 | 3.5%), Cleaning & Maintenance (28,490 | 3.2%), Personal Care & Service (26,783 | 3.0%), and Security & Protection (17,197 | 1.9%).
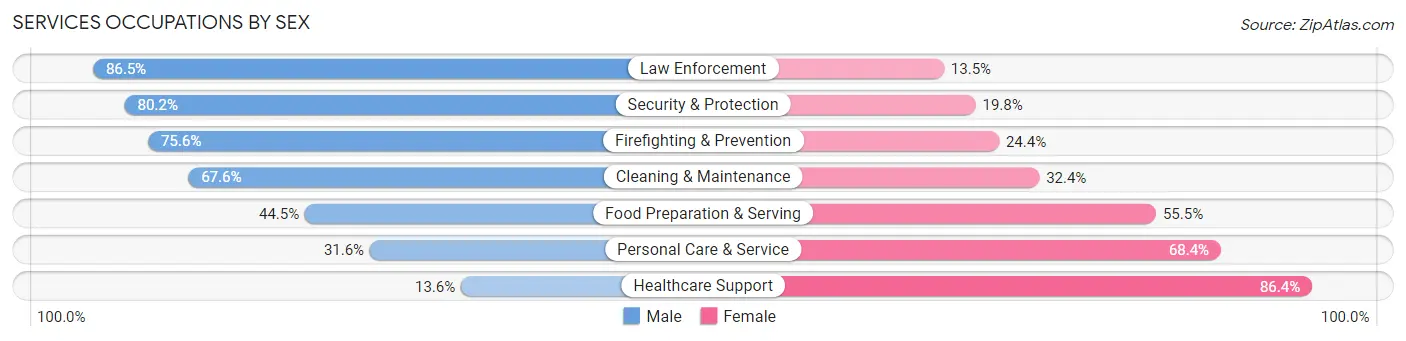
Services Occupations by Sex
Within the Services occupations in Area Code 860, the most male-oriented occupations are Law Enforcement (86.5%), Security & Protection (80.2%), and Firefighting & Prevention (75.6%), while the most female-oriented occupations are Healthcare Support (86.4%), Personal Care & Service (68.4%), and Food Preparation & Serving (55.5%).
| Occupation | Male | Female |
| Healthcare Support | 4,256 (13.6%) | 27,077 (86.4%) |
| Security & Protection | 13,792 (80.2%) | 3,405 (19.8%) |
| Firefighting & Prevention | 7,460 (75.6%) | 2,413 (24.4%) |
| Law Enforcement | 6,332 (86.5%) | 992 (13.5%) |
| Food Preparation & Serving | 19,201 (44.5%) | 23,973 (55.5%) |
| Cleaning & Maintenance | 19,255 (67.6%) | 9,235 (32.4%) |
| Personal Care & Service | 8,465 (31.6%) | 18,318 (68.4%) |
| Total (Category) | 64,969 (44.2%) | 82,008 (55.8%) |
| Total (Overall) | 456,023 (51.3%) | 432,014 (48.6%) |
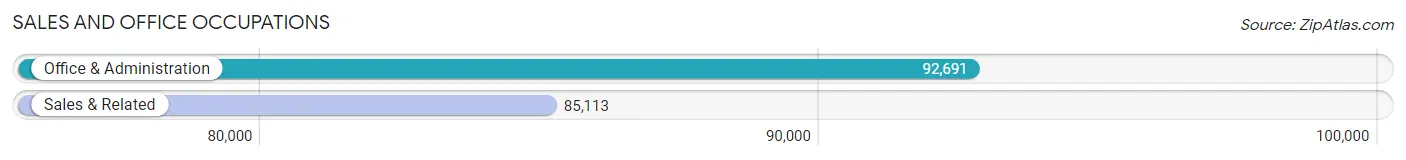
Sales and Office Occupations
The most common Sales and Office occupations in Area Code 860 are Office & Administration (92,691 | 10.4%), and Sales & Related (85,113 | 9.6%).
Sales and Office Occupations by Sex
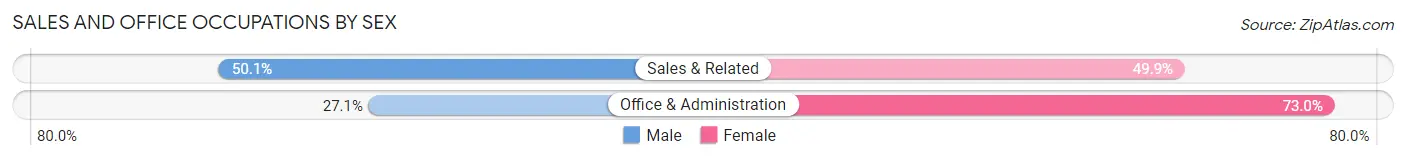
| Occupation | Male | Female |
| Sales & Related | 42,644 (50.1%) | 42,469 (49.9%) |
| Office & Administration | 25,077 (27.1%) | 67,614 (73.0%) |
| Total (Category) | 67,721 (38.1%) | 110,083 (61.9%) |
| Total (Overall) | 456,023 (51.3%) | 432,014 (48.6%) |
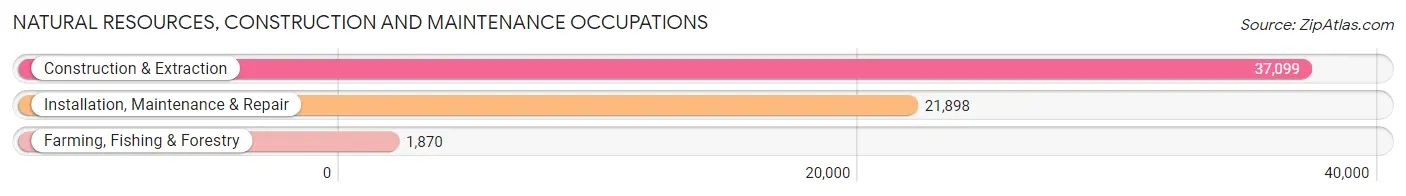
Natural Resources, Construction and Maintenance Occupations
The most common Natural Resources, Construction and Maintenance occupations in Area Code 860 are Construction & Extraction (37,099 | 4.2%), Installation, Maintenance & Repair (21,898 | 2.5%), and Farming, Fishing & Forestry (1,870 | 0.2%).
Natural Resources, Construction and Maintenance Occupations by Sex
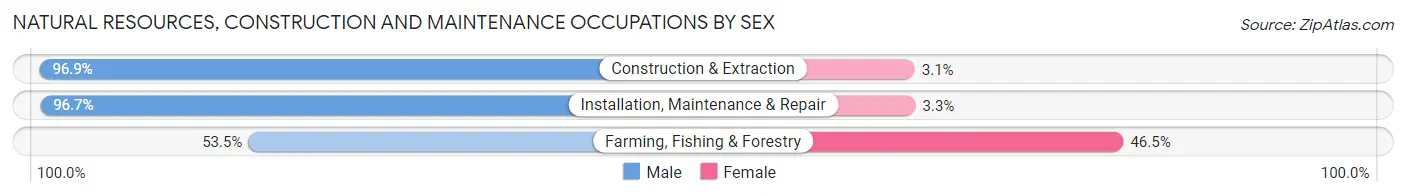
| Occupation | Male | Female |
| Farming, Fishing & Forestry | 1,000 (53.5%) | 870 (46.5%) |
| Construction & Extraction | 35,949 (96.9%) | 1,150 (3.1%) |
| Installation, Maintenance & Repair | 21,185 (96.7%) | 713 (3.3%) |
| Total (Category) | 58,134 (95.5%) | 2,733 (4.5%) |
| Total (Overall) | 456,023 (51.3%) | 432,014 (48.6%) |
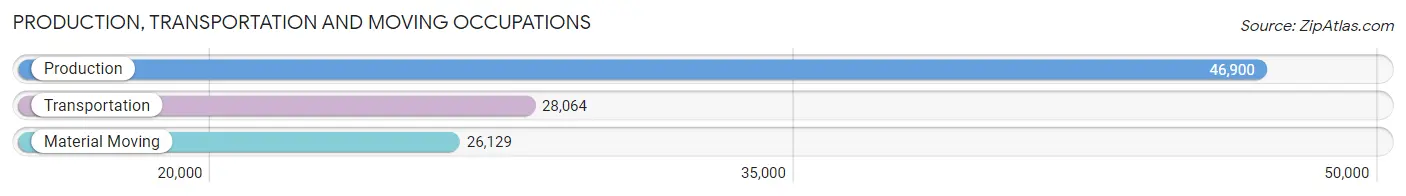
Production, Transportation and Moving Occupations
The most common Production, Transportation and Moving occupations in Area Code 860 are Production (46,900 | 5.3%), Transportation (28,064 | 3.2%), and Material Moving (26,129 | 2.9%).
Production, Transportation and Moving Occupations by Sex
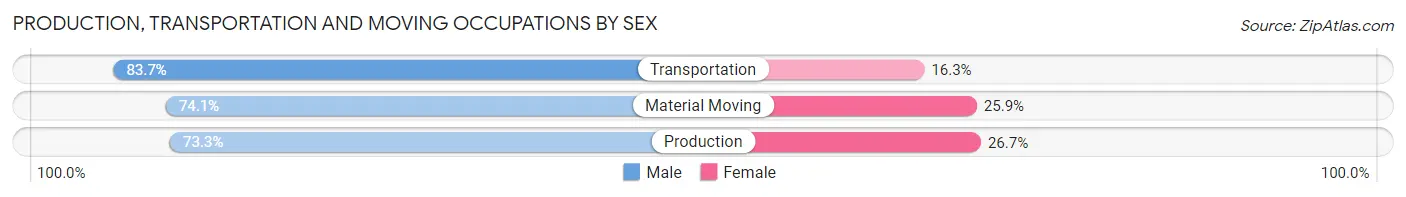
| Occupation | Male | Female |
| Production | 34,382 (73.3%) | 12,518 (26.7%) |
| Transportation | 23,488 (83.7%) | 4,576 (16.3%) |
| Material Moving | 19,351 (74.1%) | 6,778 (25.9%) |
| Total (Category) | 77,221 (76.4%) | 23,872 (23.6%) |
| Total (Overall) | 456,023 (51.3%) | 432,014 (48.6%) |
Employment Industries by Sex in Area Code 860
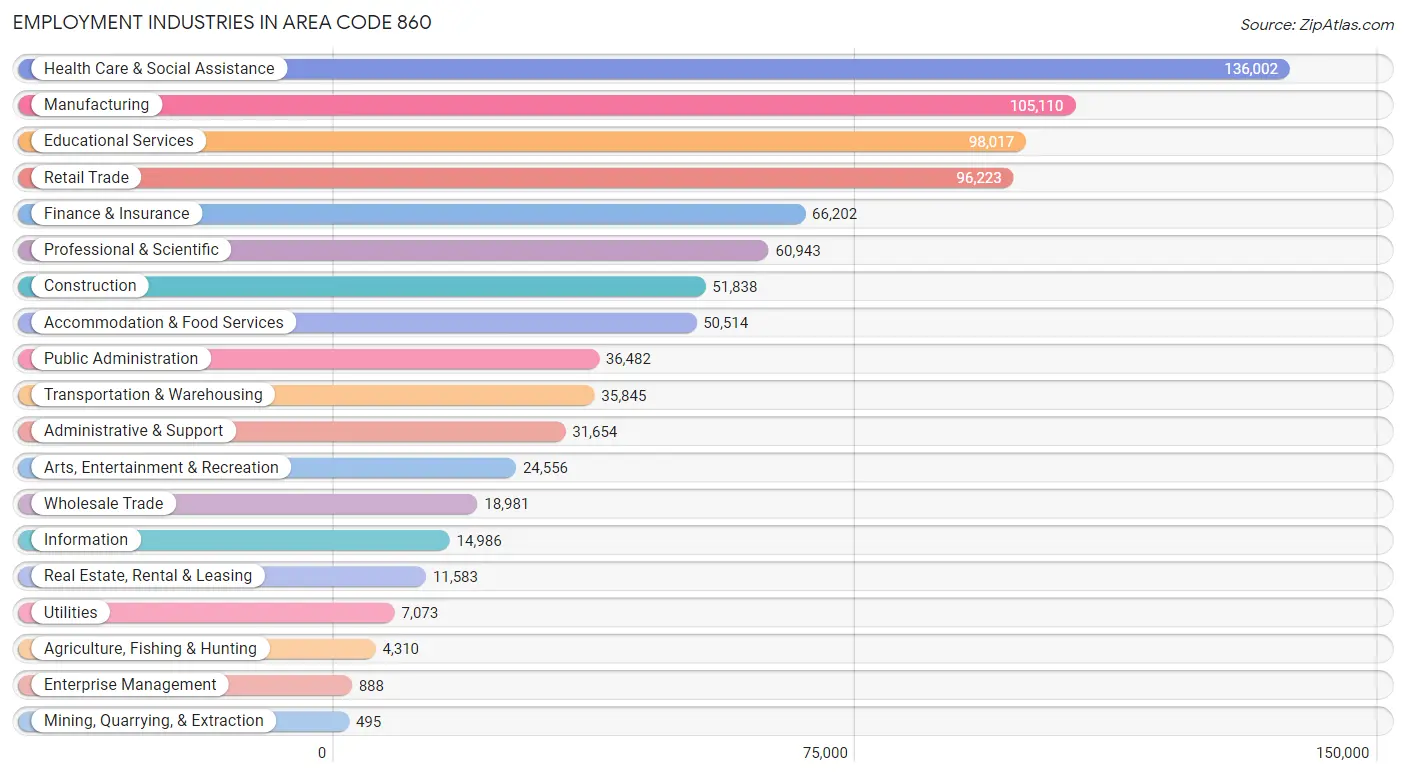
Employment Industries in Area Code 860
The major employment industries in Area Code 860 include Health Care & Social Assistance (136,002 | 15.3%), Manufacturing (105,110 | 11.8%), Educational Services (98,017 | 11.0%), Retail Trade (96,223 | 10.8%), and Finance & Insurance (66,202 | 7.4%).
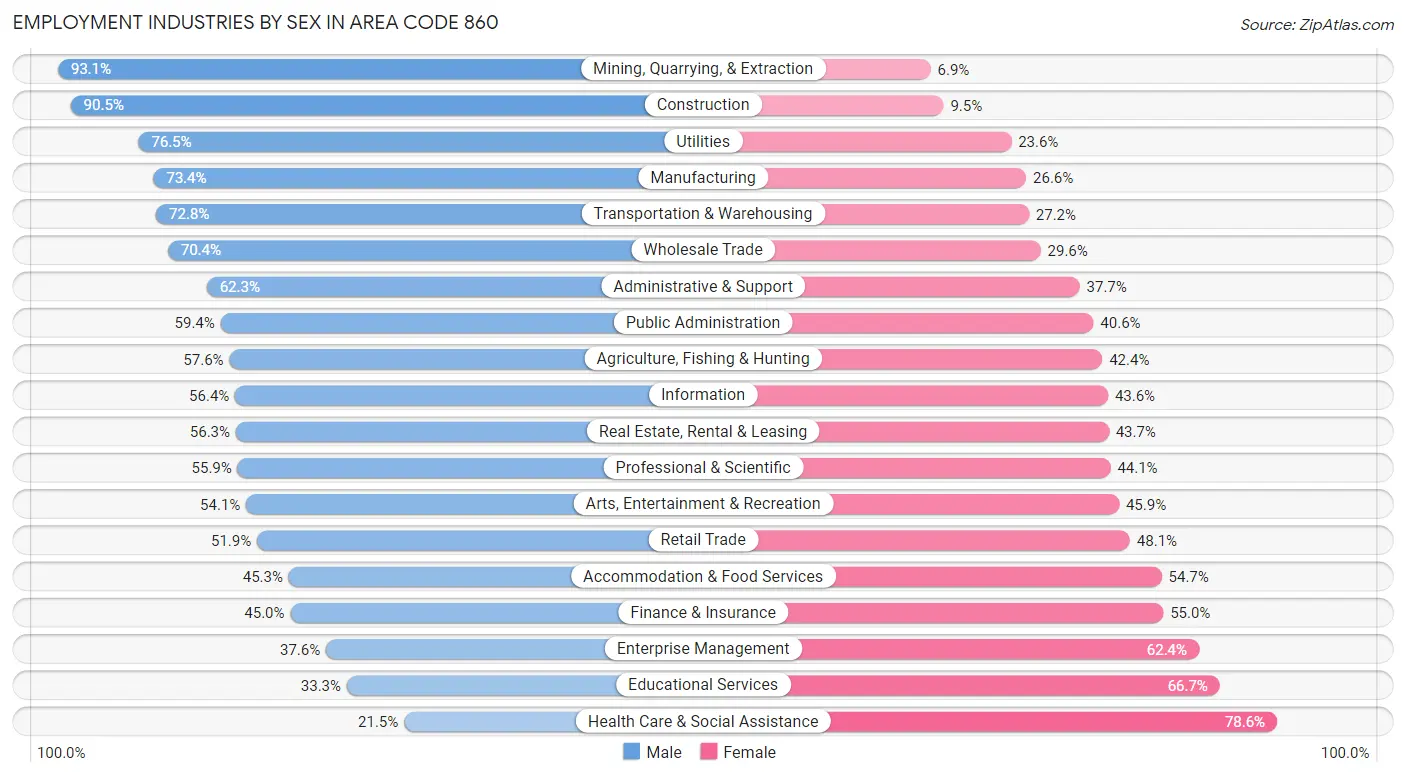
Employment Industries by Sex in Area Code 860
The Area Code 860 industries that see more men than women are Mining, Quarrying, & Extraction (93.1%), Construction (90.5%), and Utilities (76.4%), whereas the industries that tend to have a higher number of women are Health Care & Social Assistance (78.5%), Educational Services (66.7%), and Enterprise Management (62.4%).
| Industry | Male | Female |
| Agriculture, Fishing & Hunting | 2,483 (57.6%) | 1,827 (42.4%) |
| Mining, Quarrying, & Extraction | 461 (93.1%) | 34 (6.9%) |
| Construction | 46,895 (90.5%) | 4,943 (9.5%) |
| Manufacturing | 77,109 (73.4%) | 28,001 (26.6%) |
| Wholesale Trade | 13,355 (70.4%) | 5,626 (29.6%) |
| Retail Trade | 49,920 (51.9%) | 46,303 (48.1%) |
| Transportation & Warehousing | 26,091 (72.8%) | 9,754 (27.2%) |
| Utilities | 5,407 (76.4%) | 1,666 (23.5%) |
| Information | 8,455 (56.4%) | 6,531 (43.6%) |
| Finance & Insurance | 29,782 (45.0%) | 36,420 (55.0%) |
| Real Estate, Rental & Leasing | 6,518 (56.3%) | 5,065 (43.7%) |
| Professional & Scientific | 34,071 (55.9%) | 26,872 (44.1%) |
| Enterprise Management | 334 (37.6%) | 554 (62.4%) |
| Administrative & Support | 19,718 (62.3%) | 11,936 (37.7%) |
| Educational Services | 32,640 (33.3%) | 65,377 (66.7%) |
| Health Care & Social Assistance | 29,177 (21.4%) | 106,825 (78.5%) |
| Arts, Entertainment & Recreation | 13,294 (54.1%) | 11,262 (45.9%) |
| Accommodation & Food Services | 22,892 (45.3%) | 27,622 (54.7%) |
| Public Administration | 21,682 (59.4%) | 14,800 (40.6%) |
| Total | 456,023 (51.3%) | 432,014 (48.6%) |
Education in Area Code 860
School Enrollment in Area Code 860
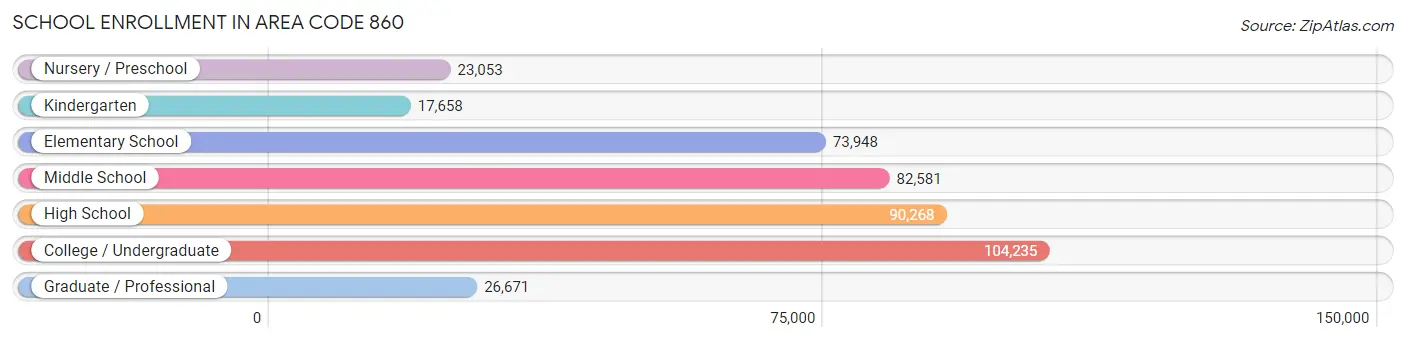
The most common levels of schooling among the 418,414 students in Area Code 860 are college / undergraduate (104,235 | 24.9%), high school (90,268 | 21.6%), and middle school (82,581 | 19.7%).
| School Level | # Students | % Students |
| Nursery / Preschool | 23,053 | 5.5% |
| Kindergarten | 17,658 | 4.2% |
| Elementary School | 73,948 | 17.7% |
| Middle School | 82,581 | 19.7% |
| High School | 90,268 | 21.6% |
| College / Undergraduate | 104,235 | 24.9% |
| Graduate / Professional | 26,671 | 6.4% |
| Total | 418,414 | 100.0% |
School Enrollment by Age by Funding Source in Area Code 860
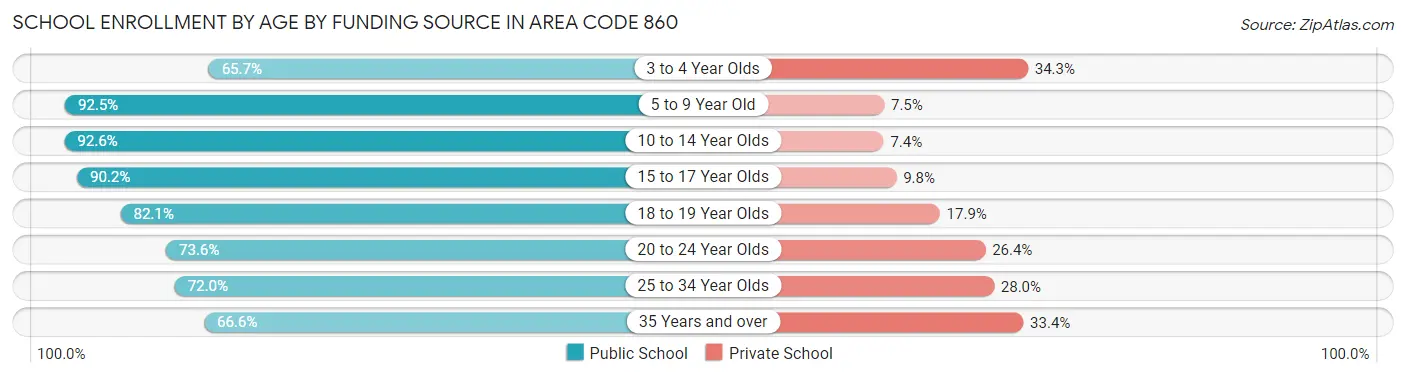
Out of a total of 418,414 students who are enrolled in schools in Area Code 860, 63,960 (15.3%) attend a private institution, while the remaining 354,454 (84.7%) are enrolled in public schools. The age group of 3 to 4 year olds has the highest likelihood of being enrolled in private schools, with 7,195 (34.3% in the age bracket) enrolled. Conversely, the age group of 10 to 14 year olds has the lowest likelihood of being enrolled in a private school, with 94,892 (92.6% in the age bracket) attending a public institution.
| Age Bracket | Public School | Private School |
| 3 to 4 Year Olds | 13,780 (65.7%) | 7,195 (34.3%) |
| 5 to 9 Year Old | 80,782 (92.5%) | 6,571 (7.5%) |
| 10 to 14 Year Olds | 94,892 (92.6%) | 7,606 (7.4%) |
| 15 to 17 Year Olds | 57,751 (90.2%) | 6,262 (9.8%) |
| 18 to 19 Year Olds | 33,742 (82.1%) | 7,346 (17.9%) |
| 20 to 24 Year Olds | 41,073 (73.6%) | 14,703 (26.4%) |
| 25 to 34 Year Olds | 17,909 (72.0%) | 6,955 (28.0%) |
| 35 Years and over | 14,544 (66.6%) | 7,303 (33.4%) |
| Total | 354,454 (84.7%) | 63,960 (15.3%) |
Educational Attainment by Field of Study in Area Code 860
Business (88,167 | 17.2%), education (53,486 | 10.4%), science & technology (49,024 | 9.6%), social sciences (46,808 | 9.1%), and engineering (44,957 | 8.8%) are the most common fields of study among 512,138 individuals in Area Code 860 who have obtained a bachelor's degree or higher.
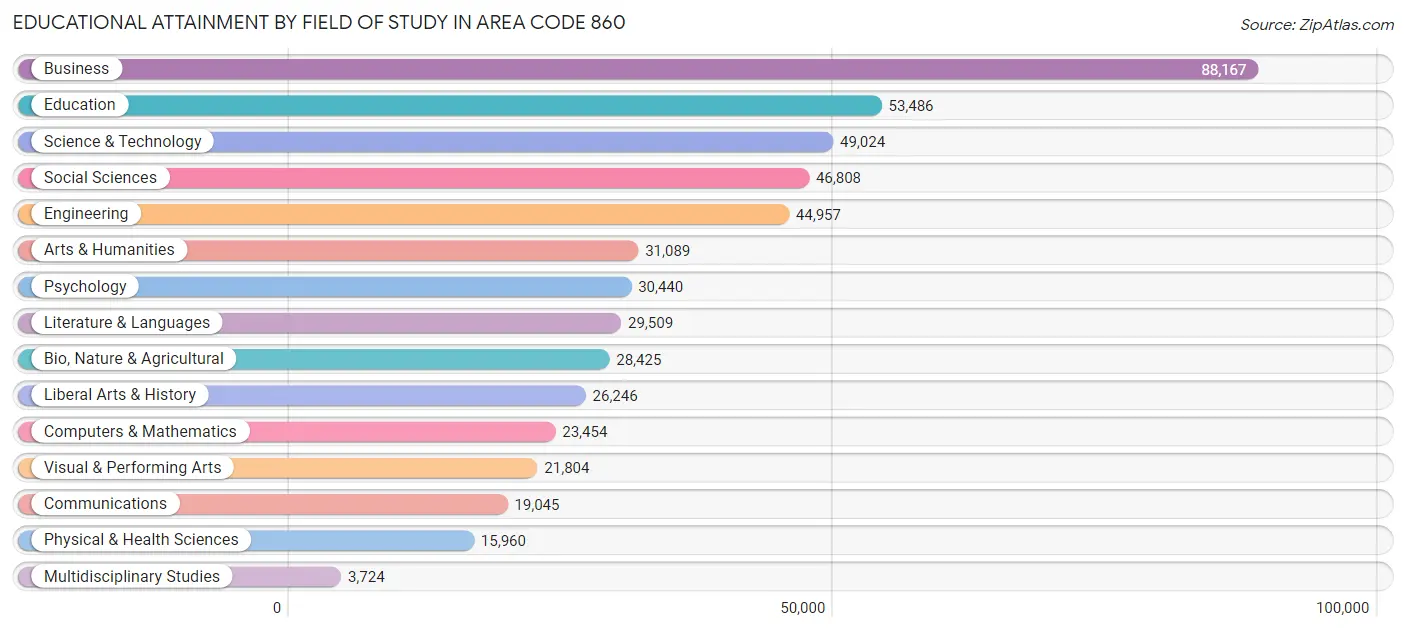
| Field of Study | # Graduates | % Graduates |
| Computers & Mathematics | 23,454 | 4.6% |
| Bio, Nature & Agricultural | 28,425 | 5.6% |
| Physical & Health Sciences | 15,960 | 3.1% |
| Psychology | 30,440 | 5.9% |
| Social Sciences | 46,808 | 9.1% |
| Engineering | 44,957 | 8.8% |
| Multidisciplinary Studies | 3,724 | 0.7% |
| Science & Technology | 49,024 | 9.6% |
| Business | 88,167 | 17.2% |
| Education | 53,486 | 10.4% |
| Literature & Languages | 29,509 | 5.8% |
| Liberal Arts & History | 26,246 | 5.1% |
| Visual & Performing Arts | 21,804 | 4.3% |
| Communications | 19,045 | 3.7% |
| Arts & Humanities | 31,089 | 6.1% |
| Total | 512,138 | 100.0% |
Transportation & Commute in Area Code 860
Vehicle Availability by Sex in Area Code 860
The most prevalent vehicle ownership categories in Area Code 860 are males with 2 vehicles (194,476, accounting for 43.7%) and females with 2 vehicles (171,016, making up 47.1%).
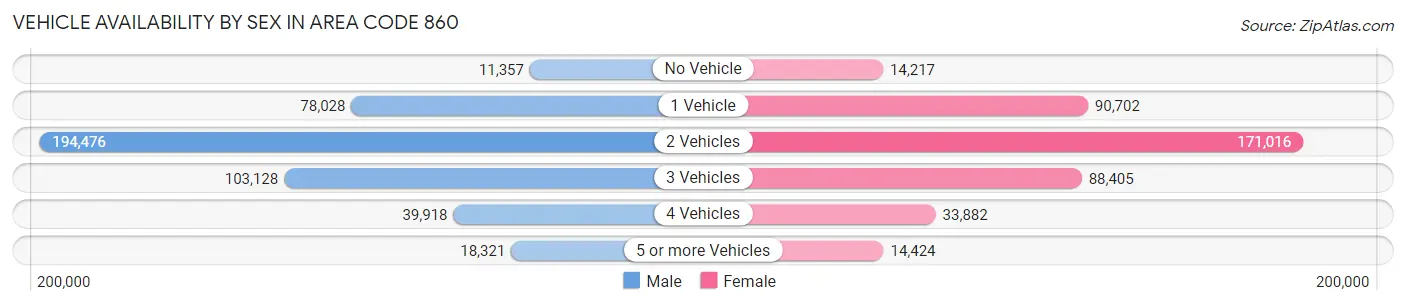
| Vehicles Available | Male | Female |
| No Vehicle | 11,357 (2.5%) | 14,217 (3.5%) |
| 1 Vehicle | 78,028 (17.5%) | 90,702 (22.0%) |
| 2 Vehicles | 194,476 (43.7%) | 171,016 (41.4%) |
| 3 Vehicles | 103,128 (23.2%) | 88,405 (21.4%) |
| 4 Vehicles | 39,918 (9.0%) | 33,882 (8.2%) |
| 5 or more Vehicles | 18,321 (4.1%) | 14,424 (3.5%) |
| Total | 445,228 (100.0%) | 412,646 (100.0%) |
Commute Time in Area Code 860
The most frequently occuring commute durations in Area Code 860 are 15 to 19 minutes (124,848 commuters, 16.3%), 20 to 24 minutes (121,485 commuters, 15.9%), and 10 to 14 minutes (111,435 commuters, 14.5%).
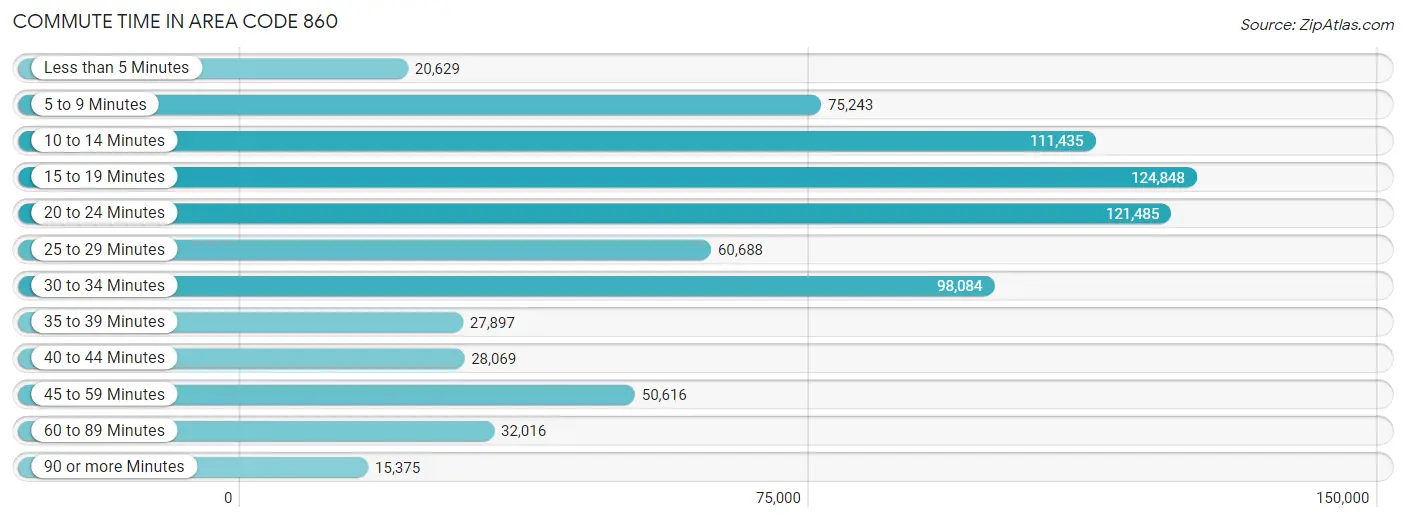
| Commute Time | # Commuters | % Commuters |
| Less than 5 Minutes | 20,629 | 2.7% |
| 5 to 9 Minutes | 75,243 | 9.8% |
| 10 to 14 Minutes | 111,435 | 14.5% |
| 15 to 19 Minutes | 124,848 | 16.3% |
| 20 to 24 Minutes | 121,485 | 15.9% |
| 25 to 29 Minutes | 60,688 | 7.9% |
| 30 to 34 Minutes | 98,084 | 12.8% |
| 35 to 39 Minutes | 27,897 | 3.6% |
| 40 to 44 Minutes | 28,069 | 3.7% |
| 45 to 59 Minutes | 50,616 | 6.6% |
| 60 to 89 Minutes | 32,016 | 4.2% |
| 90 or more Minutes | 15,375 | 2.0% |
Commute Time by Sex in Area Code 860
The most common commute times in Area Code 860 are 20 to 24 minutes (63,860 commuters, 15.9%) for males and 15 to 19 minutes (62,101 commuters, 17.0%) for females.
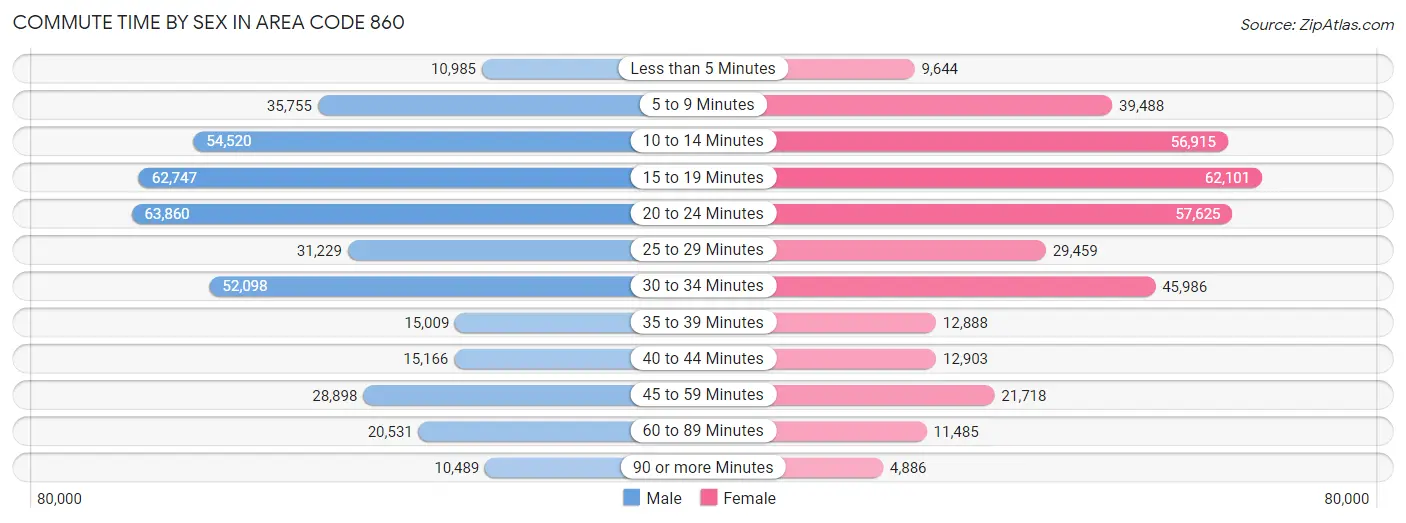
| Commute Time | Male | Female |
| Less than 5 Minutes | 10,985 (2.7%) | 9,644 (2.6%) |
| 5 to 9 Minutes | 35,755 (8.9%) | 39,488 (10.8%) |
| 10 to 14 Minutes | 54,520 (13.6%) | 56,915 (15.6%) |
| 15 to 19 Minutes | 62,747 (15.6%) | 62,101 (17.0%) |
| 20 to 24 Minutes | 63,860 (15.9%) | 57,625 (15.8%) |
| 25 to 29 Minutes | 31,229 (7.8%) | 29,459 (8.1%) |
| 30 to 34 Minutes | 52,098 (13.0%) | 45,986 (12.6%) |
| 35 to 39 Minutes | 15,009 (3.7%) | 12,888 (3.5%) |
| 40 to 44 Minutes | 15,166 (3.8%) | 12,903 (3.5%) |
| 45 to 59 Minutes | 28,898 (7.2%) | 21,718 (5.9%) |
| 60 to 89 Minutes | 20,531 (5.1%) | 11,485 (3.2%) |
| 90 or more Minutes | 10,489 (2.6%) | 4,886 (1.3%) |
Time of Departure to Work by Sex in Area Code 860
The most frequent times of departure to work in Area Code 860 are 7:00 AM to 7:29 AM (55,209, 13.8%) for males and 7:30 AM to 7:59 AM (54,820, 15.0%) for females.
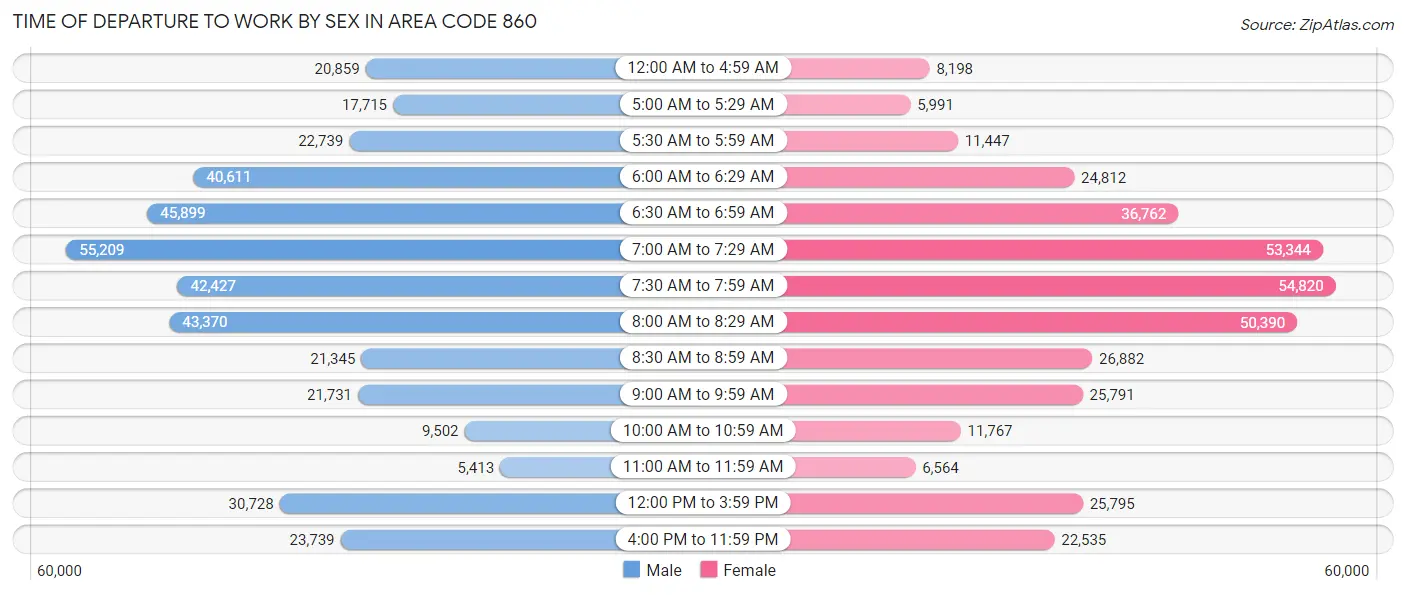
| Time of Departure | Male | Female |
| 12:00 AM to 4:59 AM | 20,859 (5.2%) | 8,198 (2.2%) |
| 5:00 AM to 5:29 AM | 17,715 (4.4%) | 5,991 (1.6%) |
| 5:30 AM to 5:59 AM | 22,739 (5.7%) | 11,447 (3.1%) |
| 6:00 AM to 6:29 AM | 40,611 (10.1%) | 24,812 (6.8%) |
| 6:30 AM to 6:59 AM | 45,899 (11.4%) | 36,762 (10.1%) |
| 7:00 AM to 7:29 AM | 55,209 (13.8%) | 53,344 (14.6%) |
| 7:30 AM to 7:59 AM | 42,427 (10.6%) | 54,820 (15.0%) |
| 8:00 AM to 8:29 AM | 43,370 (10.8%) | 50,390 (13.8%) |
| 8:30 AM to 8:59 AM | 21,345 (5.3%) | 26,882 (7.4%) |
| 9:00 AM to 9:59 AM | 21,731 (5.4%) | 25,791 (7.1%) |
| 10:00 AM to 10:59 AM | 9,502 (2.4%) | 11,767 (3.2%) |
| 11:00 AM to 11:59 AM | 5,413 (1.3%) | 6,564 (1.8%) |
| 12:00 PM to 3:59 PM | 30,728 (7.7%) | 25,795 (7.1%) |
| 4:00 PM to 11:59 PM | 23,739 (5.9%) | 22,535 (6.2%) |
| Total | 401,287 (100.0%) | 365,098 (100.0%) |
Housing Occupancy in Area Code 860
Occupancy by Ownership in Area Code 860
Of the total 696,851 dwellings in Area Code 860, owner-occupied units account for 472,220 (67.8%), while renter-occupied units make up 224,631 (32.2%).
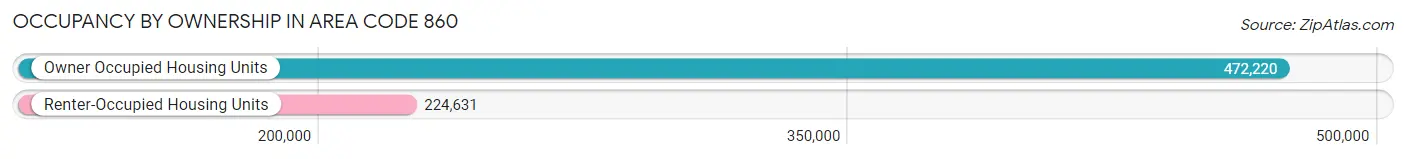
| Occupancy | # Housing Units | % Housing Units |
| Owner Occupied Housing Units | 472,220 | 67.8% |
| Renter-Occupied Housing Units | 224,631 | 32.2% |
| Total Occupied Housing Units | 696,851 | 100.0% |
Occupancy by Household Size in Area Code 860

| Household Size | # Housing Units | % Housing Units |
| 1-Person Household | 202,269 | 29.0% |
| 2-Person Household | 241,516 | 34.7% |
| 3-Person Household | 115,525 | 16.6% |
| 4+ Person Household | 137,541 | 19.7% |
| Total Housing Units | 696,851 | 100.0% |
Occupancy by Ownership by Household Size in Area Code 860
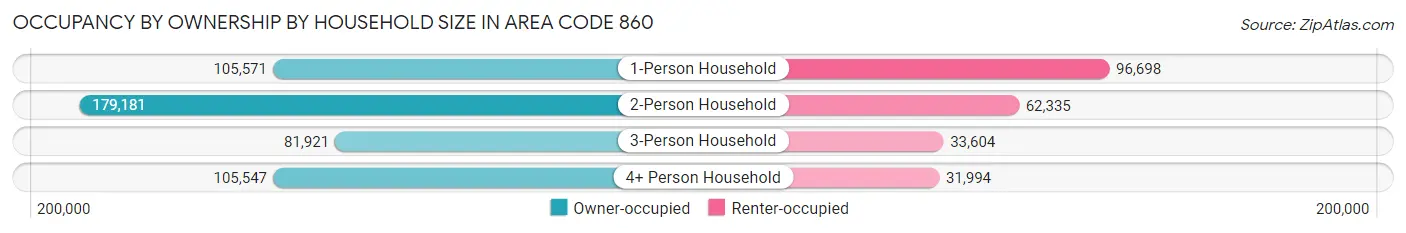
| Household Size | Owner-occupied | Renter-occupied |
| 1-Person Household | 105,571 (52.2%) | 96,698 (47.8%) |
| 2-Person Household | 179,181 (74.2%) | 62,335 (25.8%) |
| 3-Person Household | 81,921 (70.9%) | 33,604 (29.1%) |
| 4+ Person Household | 105,547 (76.7%) | 31,994 (23.3%) |
| Total Housing Units | 472,220 (67.8%) | 224,631 (32.2%) |
Occupancy by Educational Attainment in Area Code 860
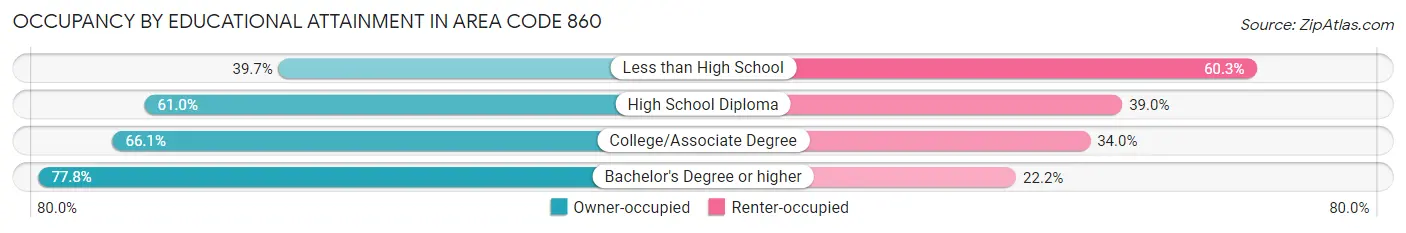
| Household Size | Owner-occupied | Renter-occupied |
| Less than High School | 19,068 (39.7%) | 28,936 (60.3%) |
| High School Diploma | 104,247 (61.0%) | 66,729 (39.0%) |
| College/Associate Degree | 128,530 (66.0%) | 66,077 (34.0%) |
| Bachelor's Degree or higher | 220,375 (77.8%) | 62,889 (22.2%) |
Occupancy by Age of Householder in Area Code 860
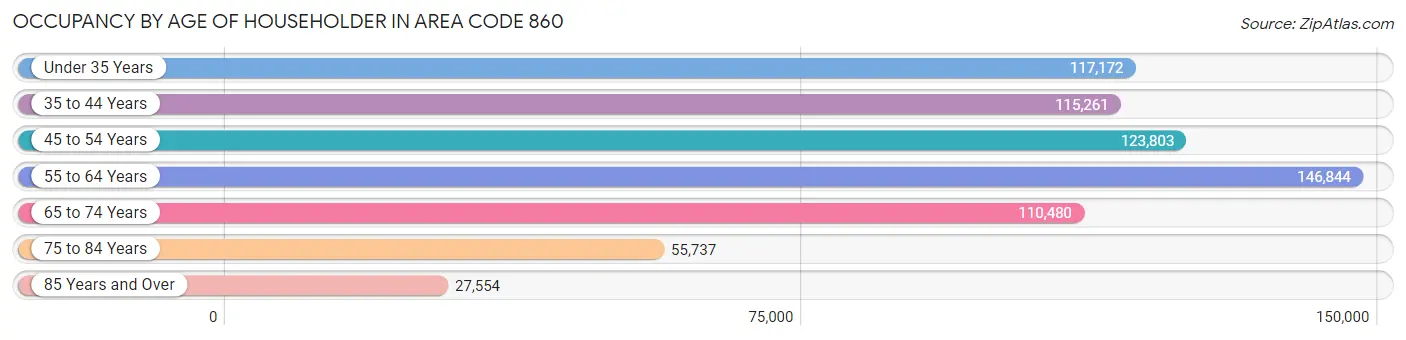
| Age Bracket | # Households | % Households |
| Under 35 Years | 117,172 | 16.8% |
| 35 to 44 Years | 115,261 | 16.5% |
| 45 to 54 Years | 123,803 | 17.8% |
| 55 to 64 Years | 146,844 | 21.1% |
| 65 to 74 Years | 110,480 | 15.9% |
| 75 to 84 Years | 55,737 | 8.0% |
| 85 Years and Over | 27,554 | 4.0% |
| Total | 696,851 | 100.0% |
Housing Finances in Area Code 860
Median Income by Occupancy in Area Code 860
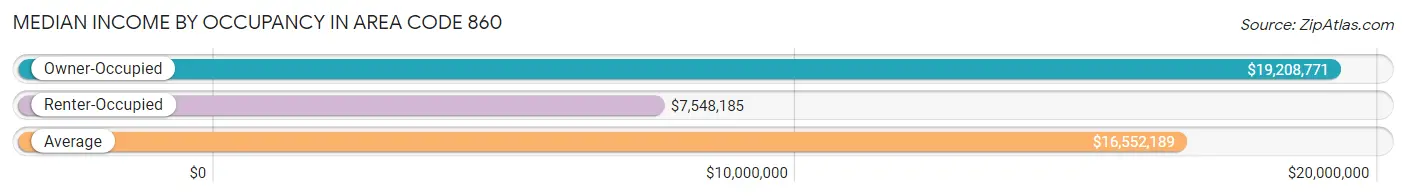
| Occupancy Type | # Households | Median Income |
| Owner-Occupied | 472,220 (67.8%) | $19,208,771 |
| Renter-Occupied | 224,631 (32.2%) | $7,548,185 |
| Average | 696,851 (100.0%) | $16,552,189 |
Occupancy by Householder Income Bracket in Area Code 860
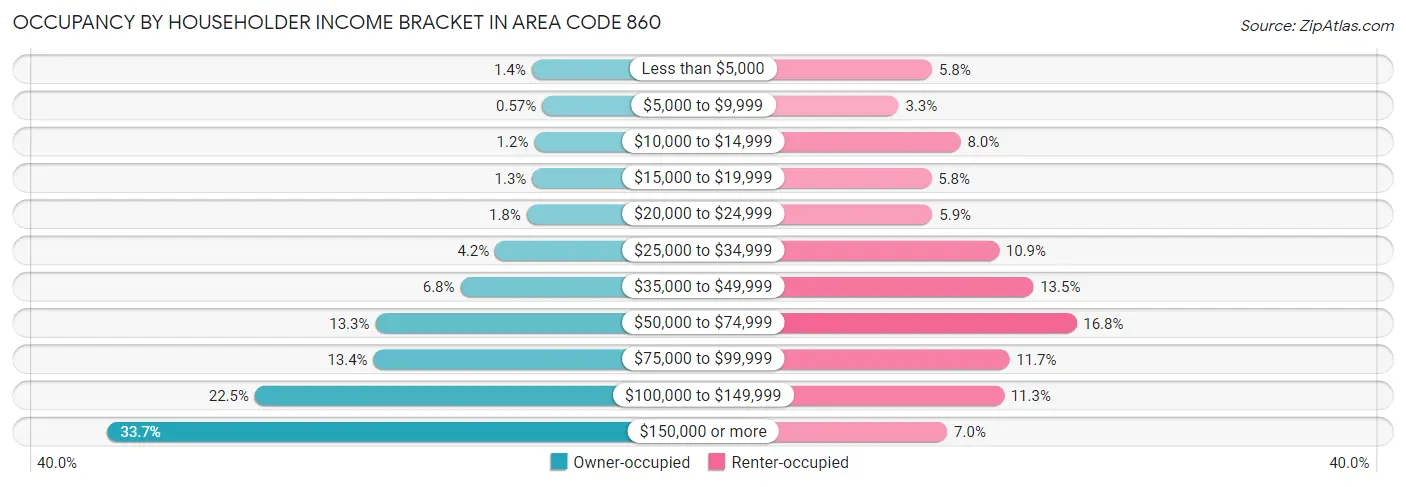
| Income Bracket | Owner-occupied | Renter-occupied |
| Less than $5,000 | 6,493 (1.4%) | 13,103 (5.8%) |
| $5,000 to $9,999 | 2,703 (0.6%) | 7,354 (3.3%) |
| $10,000 to $14,999 | 5,513 (1.2%) | 17,978 (8.0%) |
| $15,000 to $19,999 | 6,295 (1.3%) | 12,959 (5.8%) |
| $20,000 to $24,999 | 8,261 (1.8%) | 13,138 (5.9%) |
| $25,000 to $34,999 | 19,606 (4.2%) | 24,521 (10.9%) |
| $35,000 to $49,999 | 32,132 (6.8%) | 30,425 (13.5%) |
| $50,000 to $74,999 | 62,729 (13.3%) | 37,789 (16.8%) |
| $75,000 to $99,999 | 63,351 (13.4%) | 26,322 (11.7%) |
| $100,000 to $149,999 | 106,060 (22.5%) | 25,370 (11.3%) |
| $150,000 or more | 159,077 (33.7%) | 15,672 (7.0%) |
| Total | 472,220 (100.0%) | 224,631 (100.0%) |
Monthly Housing Cost Tiers in Area Code 860
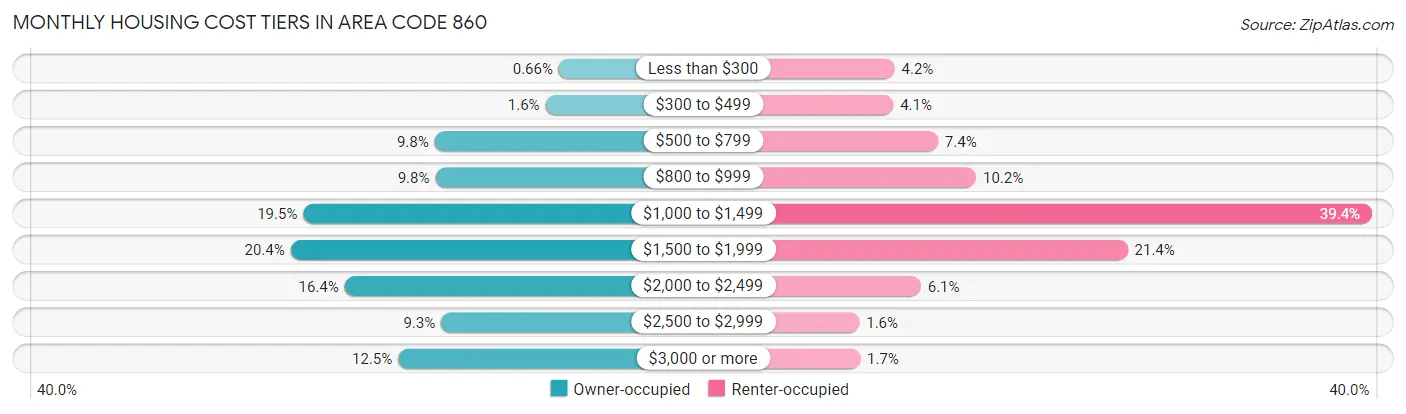
| Monthly Cost | Owner-occupied | Renter-occupied |
| Less than $300 | 3,116 (0.7%) | 9,467 (4.2%) |
| $300 to $499 | 7,747 (1.6%) | 9,224 (4.1%) |
| $500 to $799 | 46,313 (9.8%) | 16,615 (7.4%) |
| $800 to $999 | 46,063 (9.8%) | 22,930 (10.2%) |
| $1,000 to $1,499 | 91,979 (19.5%) | 88,412 (39.4%) |
| $1,500 to $1,999 | 96,370 (20.4%) | 48,014 (21.4%) |
| $2,000 to $2,499 | 77,603 (16.4%) | 13,788 (6.1%) |
| $2,500 to $2,999 | 44,052 (9.3%) | 3,609 (1.6%) |
| $3,000 or more | 58,977 (12.5%) | 3,761 (1.7%) |
| Total | 472,220 (100.0%) | 224,631 (100.0%) |
Physical Housing Characteristics in Area Code 860
Housing Structures in Area Code 860
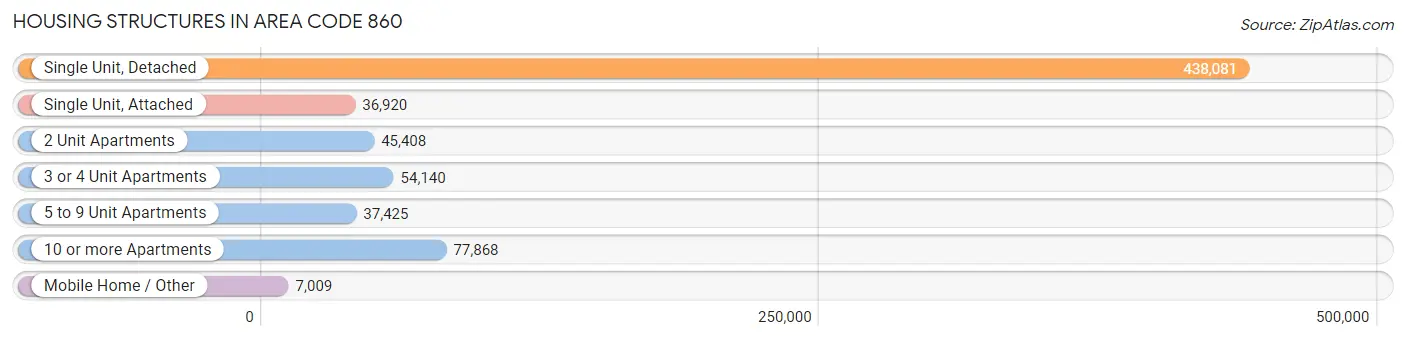
| Structure Type | # Housing Units | % Housing Units |
| Single Unit, Detached | 438,081 | 62.9% |
| Single Unit, Attached | 36,920 | 5.3% |
| 2 Unit Apartments | 45,408 | 6.5% |
| 3 or 4 Unit Apartments | 54,140 | 7.8% |
| 5 to 9 Unit Apartments | 37,425 | 5.4% |
| 10 or more Apartments | 77,868 | 11.2% |
| Mobile Home / Other | 7,009 | 1.0% |
| Total | 696,851 | 100.0% |
Housing Structures by Occupancy in Area Code 860
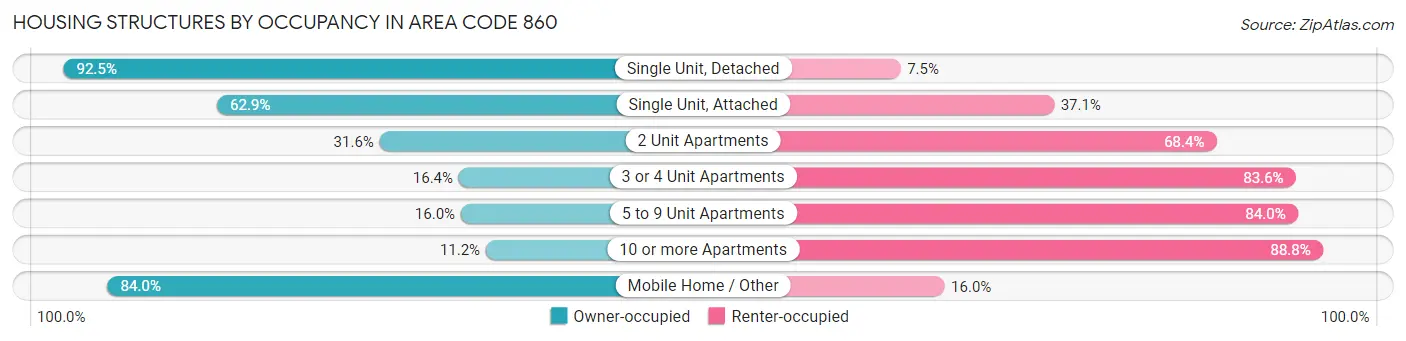
| Structure Type | Owner-occupied | Renter-occupied |
| Single Unit, Detached | 405,179 (92.5%) | 32,902 (7.5%) |
| Single Unit, Attached | 23,232 (62.9%) | 13,688 (37.1%) |
| 2 Unit Apartments | 14,369 (31.6%) | 31,039 (68.4%) |
| 3 or 4 Unit Apartments | 8,871 (16.4%) | 45,269 (83.6%) |
| 5 to 9 Unit Apartments | 5,983 (16.0%) | 31,442 (84.0%) |
| 10 or more Apartments | 8,697 (11.2%) | 69,171 (88.8%) |
| Mobile Home / Other | 5,889 (84.0%) | 1,120 (16.0%) |
| Total | 472,220 (67.8%) | 224,631 (32.2%) |
Housing Structures by Number of Rooms in Area Code 860
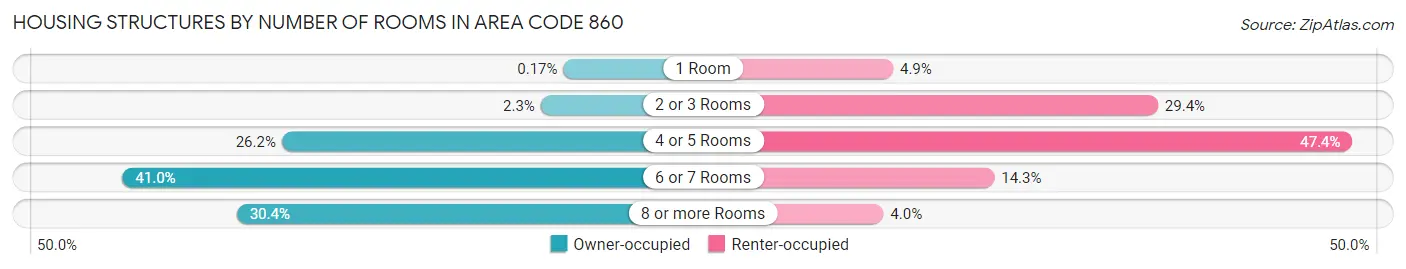
| Number of Rooms | Owner-occupied | Renter-occupied |
| 1 Room | 820 (0.2%) | 11,040 (4.9%) |
| 2 or 3 Rooms | 10,721 (2.3%) | 66,060 (29.4%) |
| 4 or 5 Rooms | 123,833 (26.2%) | 106,443 (47.4%) |
| 6 or 7 Rooms | 193,387 (40.9%) | 32,067 (14.3%) |
| 8 or more Rooms | 143,459 (30.4%) | 9,021 (4.0%) |
| Total | 472,220 (100.0%) | 224,631 (100.0%) |
Housing Structure by Heating Type in Area Code 860
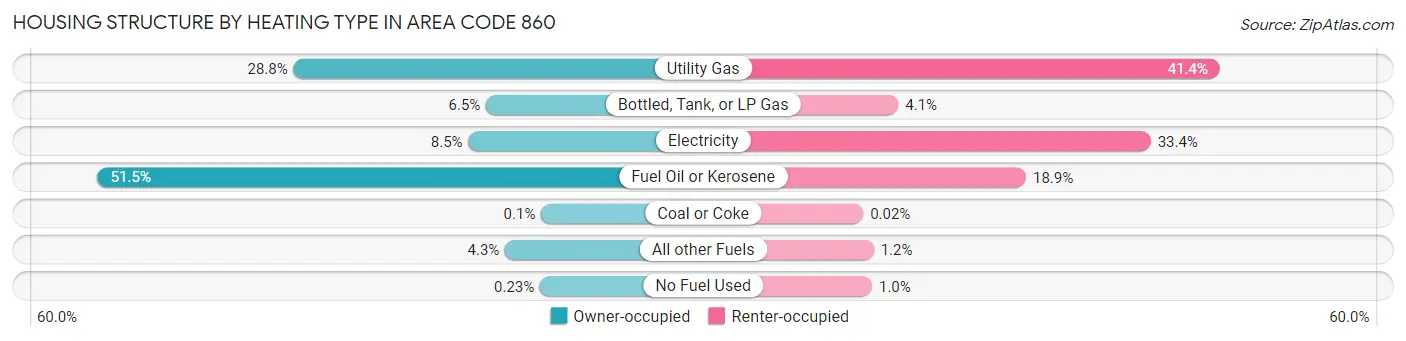
| Heating Type | Owner-occupied | Renter-occupied |
| Utility Gas | 136,111 (28.8%) | 92,912 (41.4%) |
| Bottled, Tank, or LP Gas | 30,597 (6.5%) | 9,196 (4.1%) |
| Electricity | 40,346 (8.5%) | 74,917 (33.4%) |
| Fuel Oil or Kerosene | 243,381 (51.5%) | 42,447 (18.9%) |
| Coal or Coke | 487 (0.1%) | 41 (0.0%) |
| All other Fuels | 20,212 (4.3%) | 2,790 (1.2%) |
| No Fuel Used | 1,086 (0.2%) | 2,328 (1.0%) |
| Total | 472,220 (100.0%) | 224,631 (100.0%) |
Household Vehicle Usage in Area Code 860
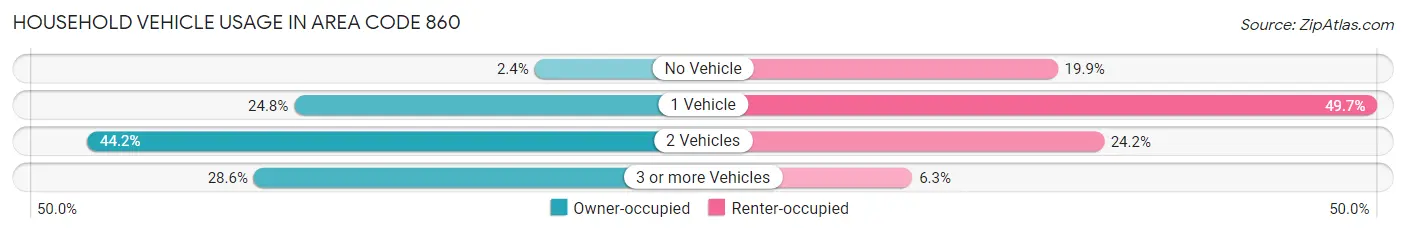
| Vehicles per Household | Owner-occupied | Renter-occupied |
| No Vehicle | 11,325 (2.4%) | 44,604 (19.9%) |
| 1 Vehicle | 117,288 (24.8%) | 111,628 (49.7%) |
| 2 Vehicles | 208,514 (44.2%) | 54,282 (24.2%) |
| 3 or more Vehicles | 135,093 (28.6%) | 14,117 (6.3%) |
| Total | 472,220 (100.0%) | 224,631 (100.0%) |
Real Estate & Mortgages in Area Code 860
Real Estate and Mortgage Overview in Area Code 860
| Characteristic | Without Mortgage | With Mortgage |
| Housing Units | 161,575 | 310,645 |
| Median Property Value | $48,375,300 | $54,253,200 |
| Median Household Income | $14,267,725 | $118,699 |
| Monthly Housing Costs | $148,743 | $57,528 |
| Real Estate Taxes | $905,804 | $2,965 |
Property Value by Mortgage Status in Area Code 860
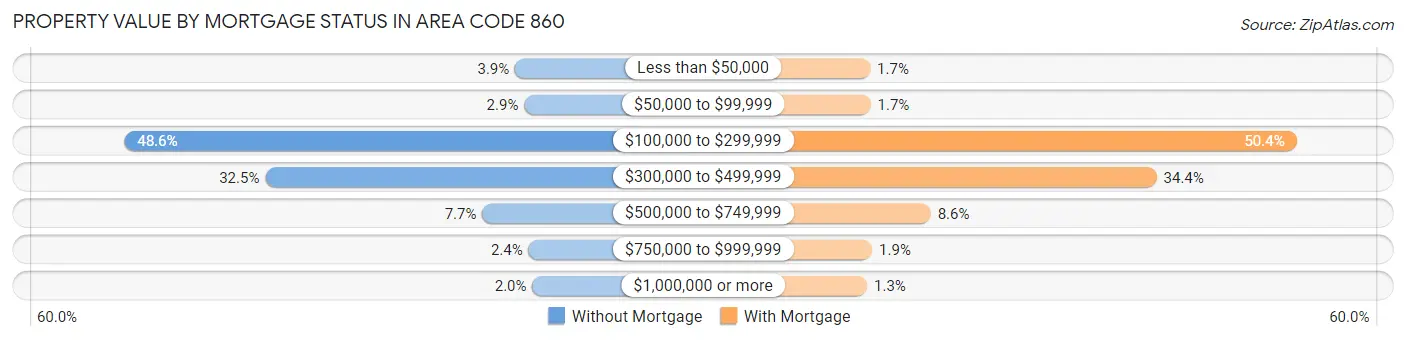
| Property Value | Without Mortgage | With Mortgage |
| Less than $50,000 | 6,359 (3.9%) | 5,195 (1.7%) |
| $50,000 to $99,999 | 4,679 (2.9%) | 5,349 (1.7%) |
| $100,000 to $299,999 | 78,533 (48.6%) | 156,530 (50.4%) |
| $300,000 to $499,999 | 52,504 (32.5%) | 106,882 (34.4%) |
| $500,000 to $749,999 | 12,429 (7.7%) | 26,685 (8.6%) |
| $750,000 to $999,999 | 3,893 (2.4%) | 5,892 (1.9%) |
| $1,000,000 or more | 3,178 (2.0%) | 4,112 (1.3%) |
| Total | 161,575 (100.0%) | 310,645 (100.0%) |
Household Income by Mortgage Status in Area Code 860
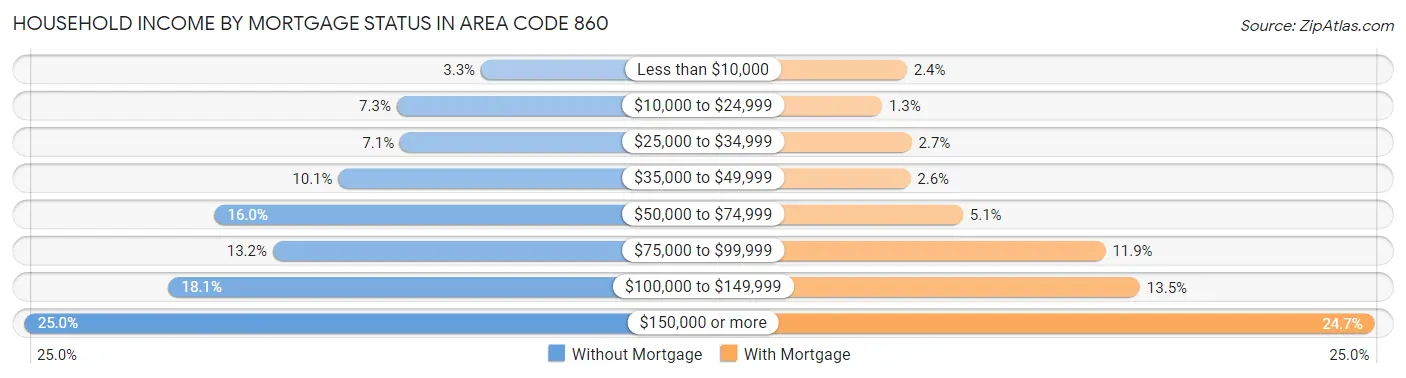
| Household Income | Without Mortgage | With Mortgage |
| Less than $10,000 | 5,288 (3.3%) | 7,567 (2.4%) |
| $10,000 to $24,999 | 11,768 (7.3%) | 3,908 (1.3%) |
| $25,000 to $34,999 | 11,510 (7.1%) | 8,301 (2.7%) |
| $35,000 to $49,999 | 16,249 (10.1%) | 8,096 (2.6%) |
| $50,000 to $74,999 | 25,774 (16.0%) | 15,883 (5.1%) |
| $75,000 to $99,999 | 21,297 (13.2%) | 36,955 (11.9%) |
| $100,000 to $149,999 | 29,311 (18.1%) | 42,054 (13.5%) |
| $150,000 or more | 40,378 (25.0%) | 76,749 (24.7%) |
| Total | 161,575 (100.0%) | 310,645 (100.0%) |
Property Value to Household Income Ratio in Area Code 860
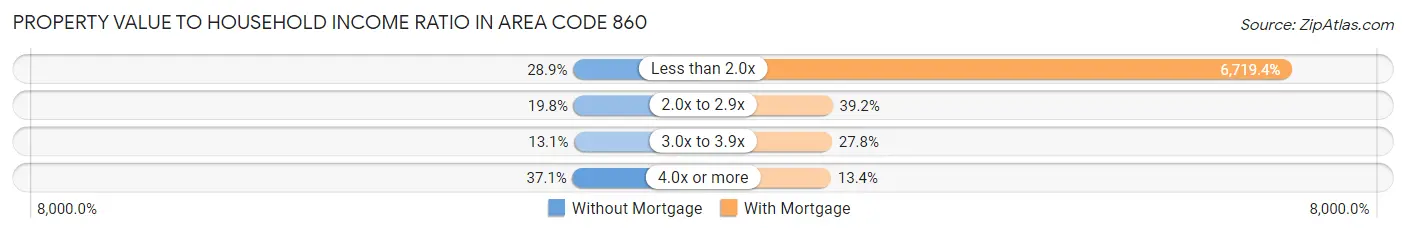
| Value-to-Income Ratio | Without Mortgage | With Mortgage |
| Less than 2.0x | 46,710 (28.9%) | 20,873,471 (6,719.4%) |
| 2.0x to 2.9x | 32,034 (19.8%) | 121,723 (39.2%) |
| 3.0x to 3.9x | 21,131 (13.1%) | 86,288 (27.8%) |
| 4.0x or more | 59,953 (37.1%) | 41,694 (13.4%) |
| Total | 161,575 (100.0%) | 310,645 (100.0%) |
Real Estate Taxes by Mortgage Status in Area Code 860
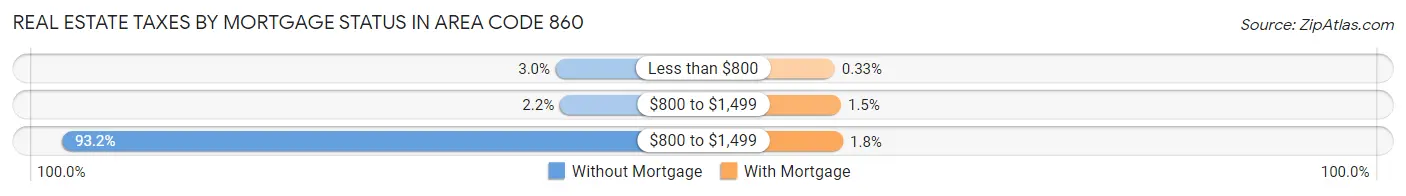
| Property Taxes | Without Mortgage | With Mortgage |
| Less than $800 | 4,802 (3.0%) | 1,026 (0.3%) |
| $800 to $1,499 | 3,565 (2.2%) | 4,532 (1.5%) |
| $800 to $1,499 | 150,524 (93.2%) | 5,708 (1.8%) |
| Total | 161,575 (100.0%) | 310,645 (100.0%) |
Health & Disability in Area Code 860
Health Insurance Coverage by Age in Area Code 860
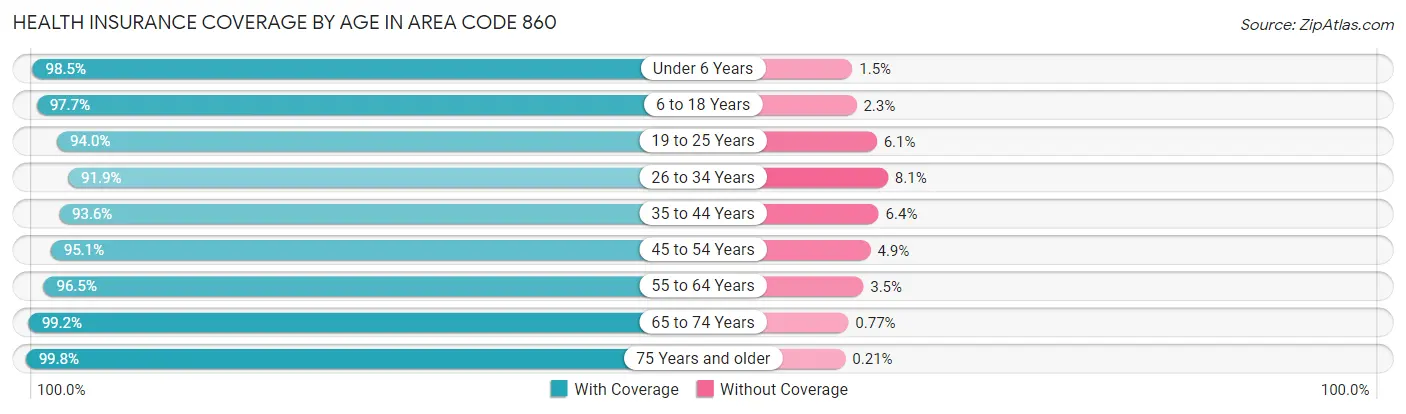
| Age Bracket | With Coverage | Without Coverage |
| Under 6 Years | 101,195 (98.5%) | 1,544 (1.5%) |
| 6 to 18 Years | 263,210 (97.7%) | 6,117 (2.3%) |
| 19 to 25 Years | 152,102 (94.0%) | 9,792 (6.0%) |
| 26 to 34 Years | 179,389 (91.9%) | 15,867 (8.1%) |
| 35 to 44 Years | 197,053 (93.6%) | 13,505 (6.4%) |
| 45 to 54 Years | 210,635 (95.1%) | 10,820 (4.9%) |
| 55 to 64 Years | 241,270 (96.5%) | 8,843 (3.5%) |
| 65 to 74 Years | 176,272 (99.2%) | 1,361 (0.8%) |
| 75 Years and older | 123,136 (99.8%) | 259 (0.2%) |
| Total | 1,644,262 (96.0%) | 68,108 (4.0%) |
Health Insurance Coverage by Citizenship Status in Area Code 860
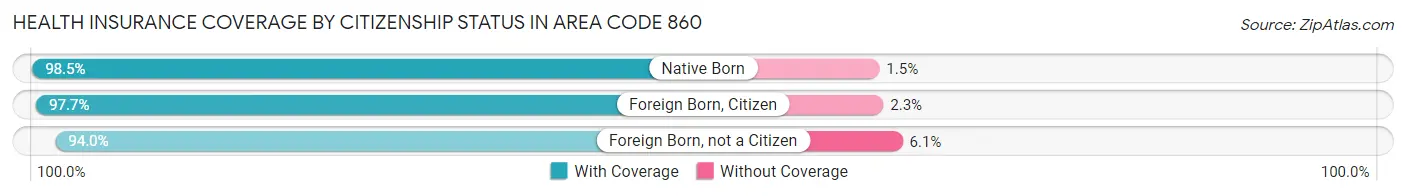
| Citizenship Status | With Coverage | Without Coverage |
| Native Born | 101,195 (98.5%) | 1,544 (1.5%) |
| Foreign Born, Citizen | 263,210 (97.7%) | 6,117 (2.3%) |
| Foreign Born, not a Citizen | 152,102 (94.0%) | 9,792 (6.0%) |
Health Insurance Coverage by Household Income in Area Code 860
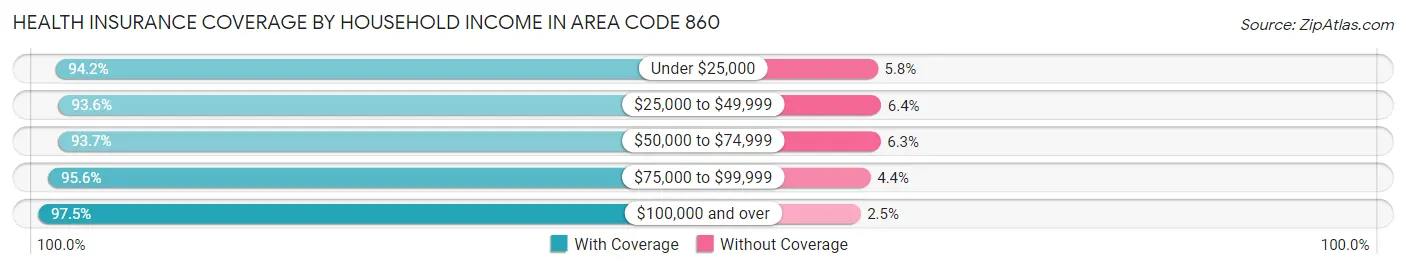
| Household Income | With Coverage | Without Coverage |
| Under $25,000 | 144,030 (94.2%) | 8,802 (5.8%) |
| $25,000 to $49,999 | 188,074 (93.6%) | 12,812 (6.4%) |
| $50,000 to $74,999 | 203,370 (93.7%) | 13,602 (6.3%) |
| $75,000 to $99,999 | 203,315 (95.6%) | 9,358 (4.4%) |
| $100,000 and over | 866,799 (97.5%) | 22,335 (2.5%) |
Public vs Private Health Insurance Coverage by Age in Area Code 860
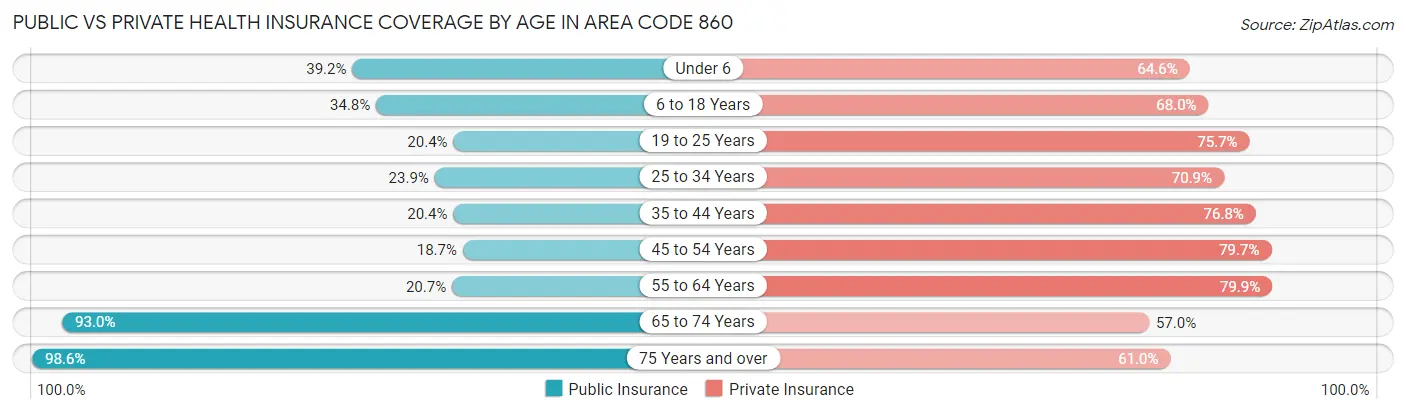
| Age Bracket | Public Insurance | Private Insurance |
| Under 6 | 40,253 (39.2%) | 66,323 (64.5%) |
| 6 to 18 Years | 93,590 (34.7%) | 183,261 (68.0%) |
| 19 to 25 Years | 33,047 (20.4%) | 122,482 (75.7%) |
| 25 to 34 Years | 46,648 (23.9%) | 138,452 (70.9%) |
| 35 to 44 Years | 43,016 (20.4%) | 161,720 (76.8%) |
| 45 to 54 Years | 41,324 (18.7%) | 176,497 (79.7%) |
| 55 to 64 Years | 51,688 (20.7%) | 199,707 (79.8%) |
| 65 to 74 Years | 165,248 (93.0%) | 101,294 (57.0%) |
| 75 Years and over | 121,680 (98.6%) | 75,234 (61.0%) |
| Total | 636,494 (37.2%) | 1,224,970 (71.5%) |
Disability Status by Sex by Age in Area Code 860
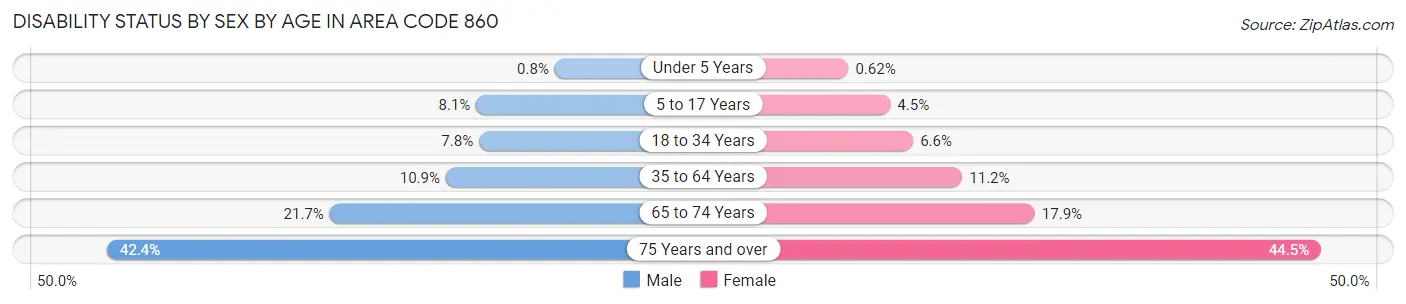
| Age Bracket | Male | Female |
| Under 5 Years | 349 (0.8%) | 261 (0.6%) |
| 5 to 17 Years | 10,761 (8.1%) | 5,782 (4.5%) |
| 18 to 34 Years | 15,063 (7.8%) | 12,590 (6.6%) |
| 35 to 64 Years | 36,377 (10.9%) | 39,031 (11.2%) |
| 65 to 74 Years | 18,116 (21.7%) | 16,865 (17.9%) |
| 75 Years and over | 21,864 (42.4%) | 31,921 (44.5%) |
Disability Class by Sex by Age in Area Code 860
Disability Class: Hearing Difficulty
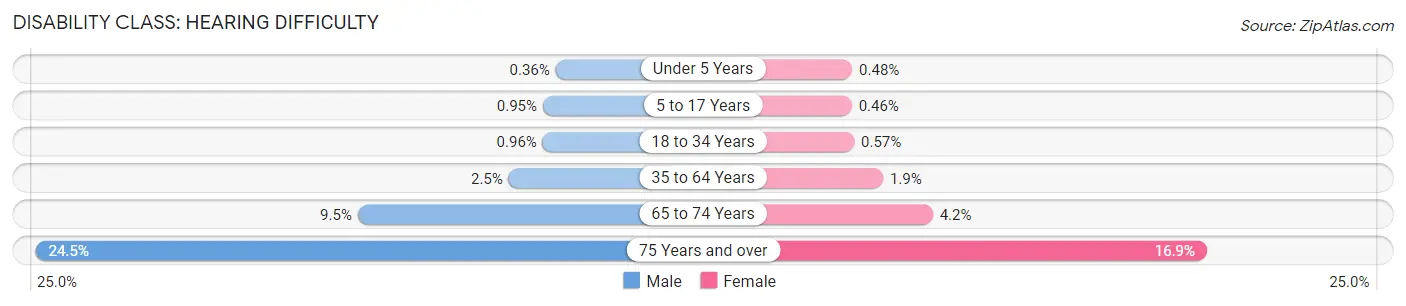
| Age Bracket | Male | Female |
| Under 5 Years | 159 (0.4%) | 203 (0.5%) |
| 5 to 17 Years | 1,268 (0.9%) | 595 (0.5%) |
| 18 to 34 Years | 1,845 (1.0%) | 1,076 (0.6%) |
| 35 to 64 Years | 8,483 (2.5%) | 6,667 (1.9%) |
| 65 to 74 Years | 7,970 (9.5%) | 3,968 (4.2%) |
| 75 Years and over | 12,639 (24.5%) | 12,160 (16.9%) |
Disability Class: Vision Difficulty
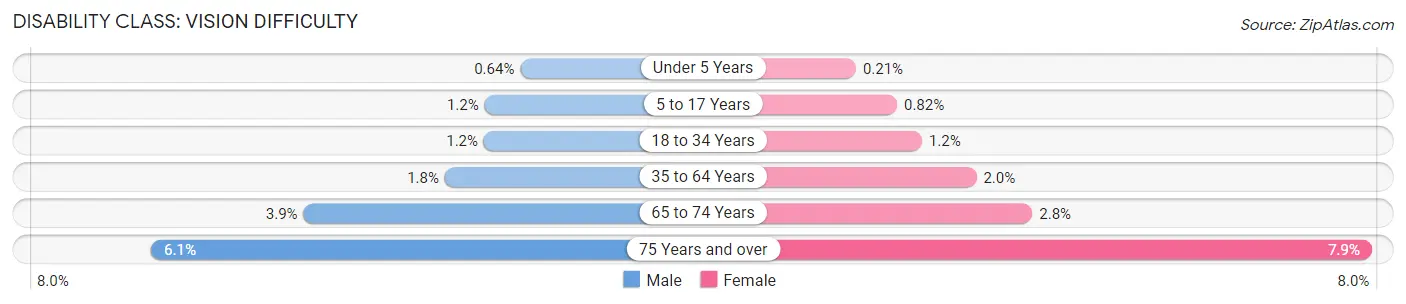
| Age Bracket | Male | Female |
| Under 5 Years | 280 (0.6%) | 90 (0.2%) |
| 5 to 17 Years | 1,556 (1.2%) | 1,053 (0.8%) |
| 18 to 34 Years | 2,268 (1.2%) | 2,262 (1.2%) |
| 35 to 64 Years | 5,883 (1.8%) | 6,958 (2.0%) |
| 65 to 74 Years | 3,226 (3.9%) | 2,660 (2.8%) |
| 75 Years and over | 3,160 (6.1%) | 5,647 (7.9%) |
Disability Class: Cognitive Difficulty
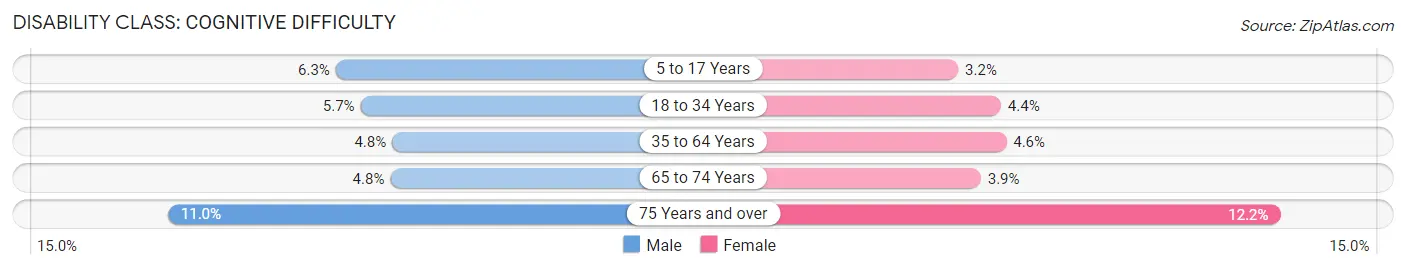
| Age Bracket | Male | Female |
| 5 to 17 Years | 8,434 (6.3%) | 4,156 (3.2%) |
| 18 to 34 Years | 10,877 (5.7%) | 8,406 (4.4%) |
| 35 to 64 Years | 15,908 (4.8%) | 15,952 (4.6%) |
| 65 to 74 Years | 4,026 (4.8%) | 3,638 (3.9%) |
| 75 Years and over | 5,684 (11.0%) | 8,767 (12.2%) |
Disability Class: Ambulatory Difficulty
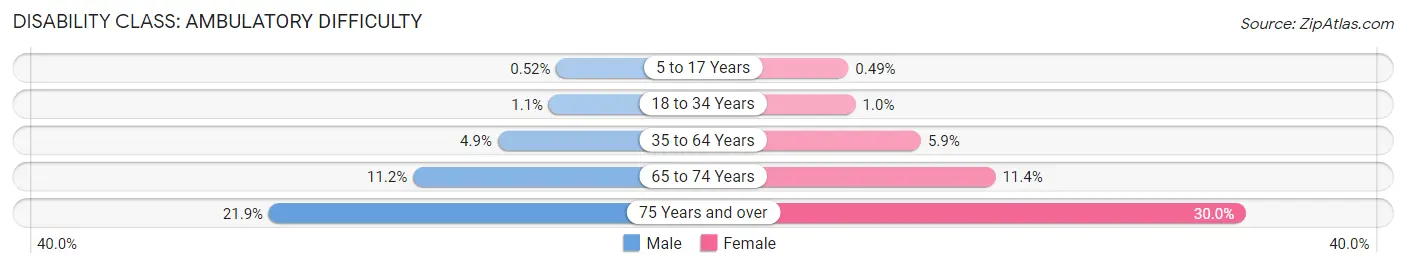
| Age Bracket | Male | Female |
| 5 to 17 Years | 690 (0.5%) | 627 (0.5%) |
| 18 to 34 Years | 2,065 (1.1%) | 1,956 (1.0%) |
| 35 to 64 Years | 16,231 (4.9%) | 20,488 (5.9%) |
| 65 to 74 Years | 9,324 (11.2%) | 10,742 (11.4%) |
| 75 Years and over | 11,284 (21.9%) | 21,541 (30.0%) |
Disability Class: Self-Care Difficulty
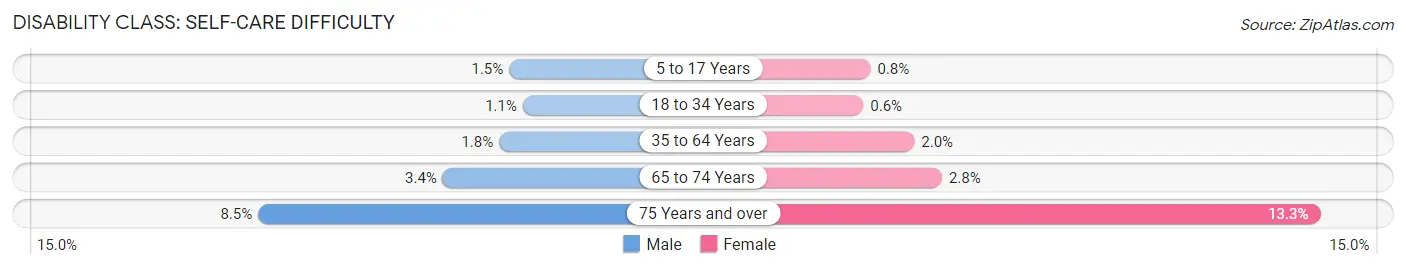
| Age Bracket | Male | Female |
| 5 to 17 Years | 2,008 (1.5%) | 1,028 (0.8%) |
| 18 to 34 Years | 2,175 (1.1%) | 1,142 (0.6%) |
| 35 to 64 Years | 5,977 (1.8%) | 7,033 (2.0%) |
| 65 to 74 Years | 2,809 (3.4%) | 2,624 (2.8%) |
| 75 Years and over | 4,386 (8.5%) | 9,559 (13.3%) |
Technology Access in Area Code 860
Computing Device Access in Area Code 860
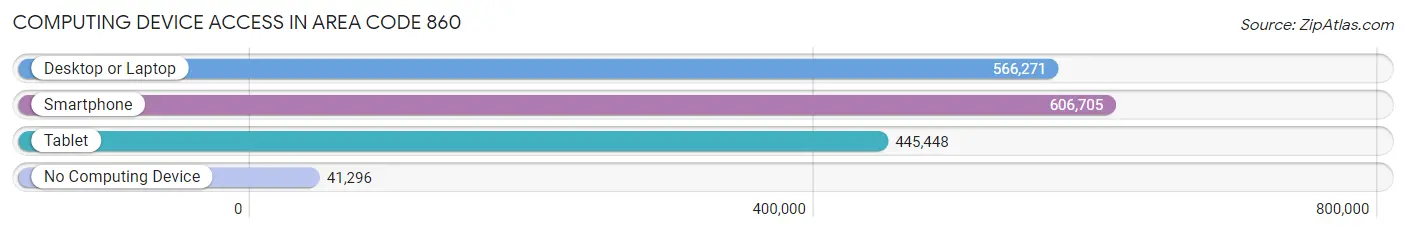
| Device Type | # Households | % Households |
| Desktop or Laptop | 566,271 | 81.3% |
| Smartphone | 606,705 | 87.1% |
| Tablet | 445,448 | 63.9% |
| No Computing Device | 41,296 | 5.9% |
| Total | 696,851 | 100.0% |
Internet Access in Area Code 860
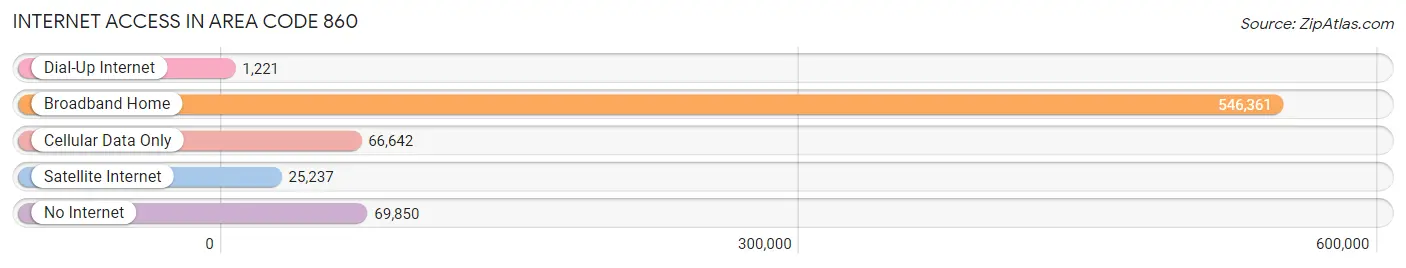
| Internet Type | # Households | % Households |
| Dial-Up Internet | 1,221 | 0.2% |
| Broadband Home | 546,361 | 78.4% |
| Cellular Data Only | 66,642 | 9.6% |
| Satellite Internet | 25,237 | 3.6% |
| No Internet | 69,850 | 10.0% |
| Total | 696,851 | 100.0% |
Area Code 860 Summary
Geography
Area code 860 is located in the state of Connecticut. It covers the entire state, including the cities of Hartford, New Haven, and Bridgeport. It is bordered by the states of Massachusetts, Rhode Island, and New York.
Social
Area code 860 is home to a diverse population of people from all walks of life. The area is known for its vibrant arts and culture scene, with many museums, galleries, and theaters. It is also home to several universities and colleges, making it a great place for students to pursue their studies.
Economics
Area code 860 is a major economic hub in the state of Connecticut. It is home to several Fortune 500 companies, including United Technologies, Aetna, and The Hartford. The area is also home to a thriving tourism industry, with many attractions and activities for visitors to enjoy.
Demographics
Area code 860 is home to a population of over 1.7 million people. The population is diverse, with a mix of races and ethnicities. The median household income is around $70,000, and the unemployment rate is around 4%. The area is also home to a large number of immigrants, with over 20% of the population being foreign-born.
Common Questions
What is Per Capita Income in Area Code 860?
Per Capita income in Area Code 860 is $51,764.
What is the Median Family Income in Area Code 860?
Median Family Income in Area Code 860 is $121,142.
What is the Median Household income in Area Code 860?
Median Household Income in Area Code 860 is $99,712.
What is Income or Wage Gap in Area Code 860?
Income or Wage Gap in Area Code 860 is 28.8%.
Women in Area Code 860 earn 71.2 cents for every dollar earned by a man.
What is Family Income Deficit in Area Code 860?
Family Income Deficit in Area Code 860 is $10,439.
Families that are below poverty line in Area Code 860 earn $10,439 less on average than the poverty threshold level.
What is Inequality or Gini Index in Area Code 860?
Inequality or Gini Index in Area Code 860 is 72.53.
What is the Total Population of Area Code 860?
Total Population of Area Code 860 is 1,740,563.
What is the Total Male Population of Area Code 860?
Total Male Population of Area Code 860 is 855,743.
What is the Total Female Population of Area Code 860?
Total Female Population of Area Code 860 is 884,820.
What is the Ratio of Males per 100 Females in Area Code 860?
There are 96.71 Males per 100 Females in Area Code 860.
What is the Ratio of Females per 100 Males in Area Code 860?
There are 103.40 Females per 100 Males in Area Code 860.
What is the Median Population Age in Area Code 860?
Median Population Age in Area Code 860 is 43.6 Years.
What is the Average Family Size in Area Code 860
Average Family Size in Area Code 860 is 2.9 People.
What is the Average Household Size in Area Code 860
Average Household Size in Area Code 860 is 2.5 People.
How Large is the Labor Force in Area Code 860?
There are 951,467 People in the Labor Forcein in Area Code 860.
What is the Percentage of People in the Labor Force in Area Code 860?
66.2% of People are in the Labor Force in Area Code 860.
What is the Unemployment Rate in Area Code 860?
Unemployment Rate in Area Code 860 is 6.1%.