North Haven, CT Map & Demographics
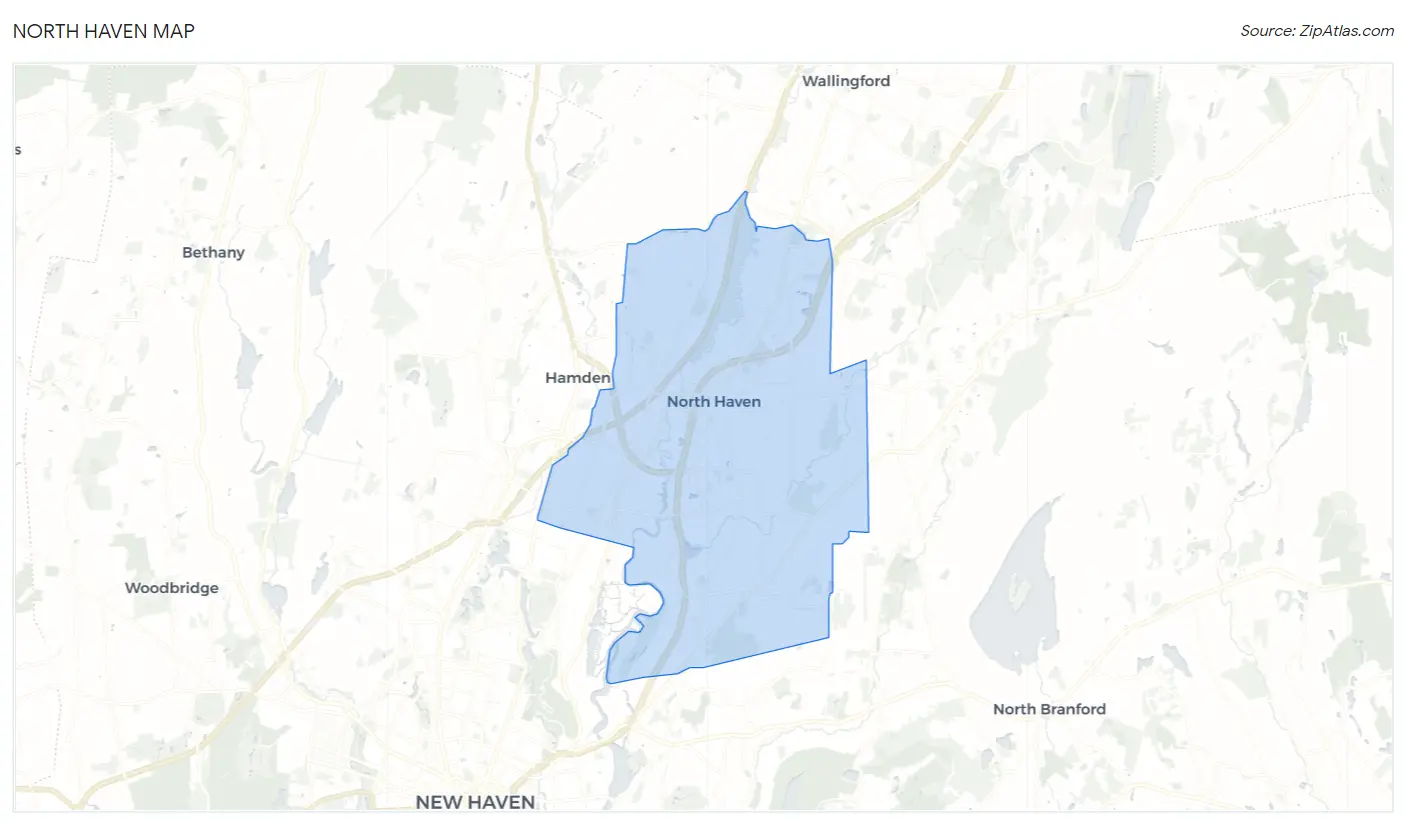
North Haven Map
North Haven Overview
$58,801
PER CAPITA INCOME
$137,978
AVG FAMILY INCOME
$121,250
AVG HOUSEHOLD INCOME
27.2%
WAGE / INCOME GAP [ % ]
72.8¢/ $1
WAGE / INCOME GAP [ $ ]
0.42
INEQUALITY / GINI INDEX
24,179
TOTAL POPULATION
12,079
MALE POPULATION
12,100
FEMALE POPULATION
99.83
MALES / 100 FEMALES
100.17
FEMALES / 100 MALES
46.1
MEDIAN AGE
3.0
AVG FAMILY SIZE
2.5
AVG HOUSEHOLD SIZE
13,279
LABOR FORCE [ PEOPLE ]
66.8%
PERCENT IN LABOR FORCE
3.4%
UNEMPLOYMENT RATE
North Haven Zip Codes
North Haven Area Codes
Income in North Haven
Income Overview in North Haven
Per Capita Income in North Haven is $58,801, while median incomes of families and households are $137,978 and $121,250 respectively.
| Characteristic | Number | Measure |
| Per Capita Income | 24,179 | $58,801 |
| Median Family Income | 6,800 | $137,978 |
| Mean Family Income | 6,800 | $163,513 |
| Median Household Income | 9,559 | $121,250 |
| Mean Household Income | 9,559 | $147,069 |
| Income Deficit | 6,800 | $0 |
| Wage / Income Gap (%) | 24,179 | 27.21% |
| Wage / Income Gap ($) | 24,179 | 72.79¢ per $1 |
| Gini / Inequality Index | 24,179 | 0.42 |
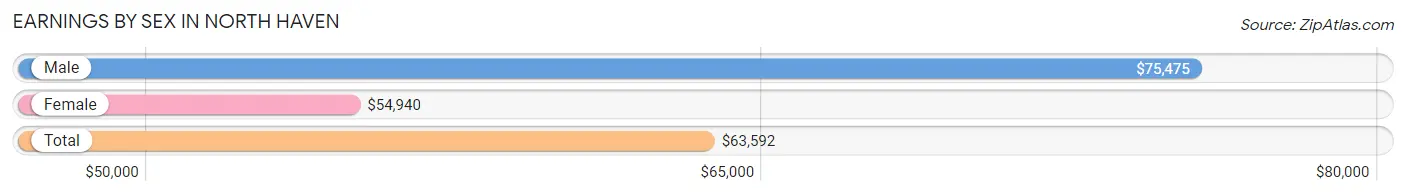
Earnings by Sex in North Haven
Average Earnings in North Haven are $63,592, $75,475 for men and $54,940 for women, a difference of 27.2%.
| Sex | Number | Average Earnings |
| Male | 7,027 (50.7%) | $75,475 |
| Female | 6,844 (49.3%) | $54,940 |
| Total | 13,871 (100.0%) | $63,592 |
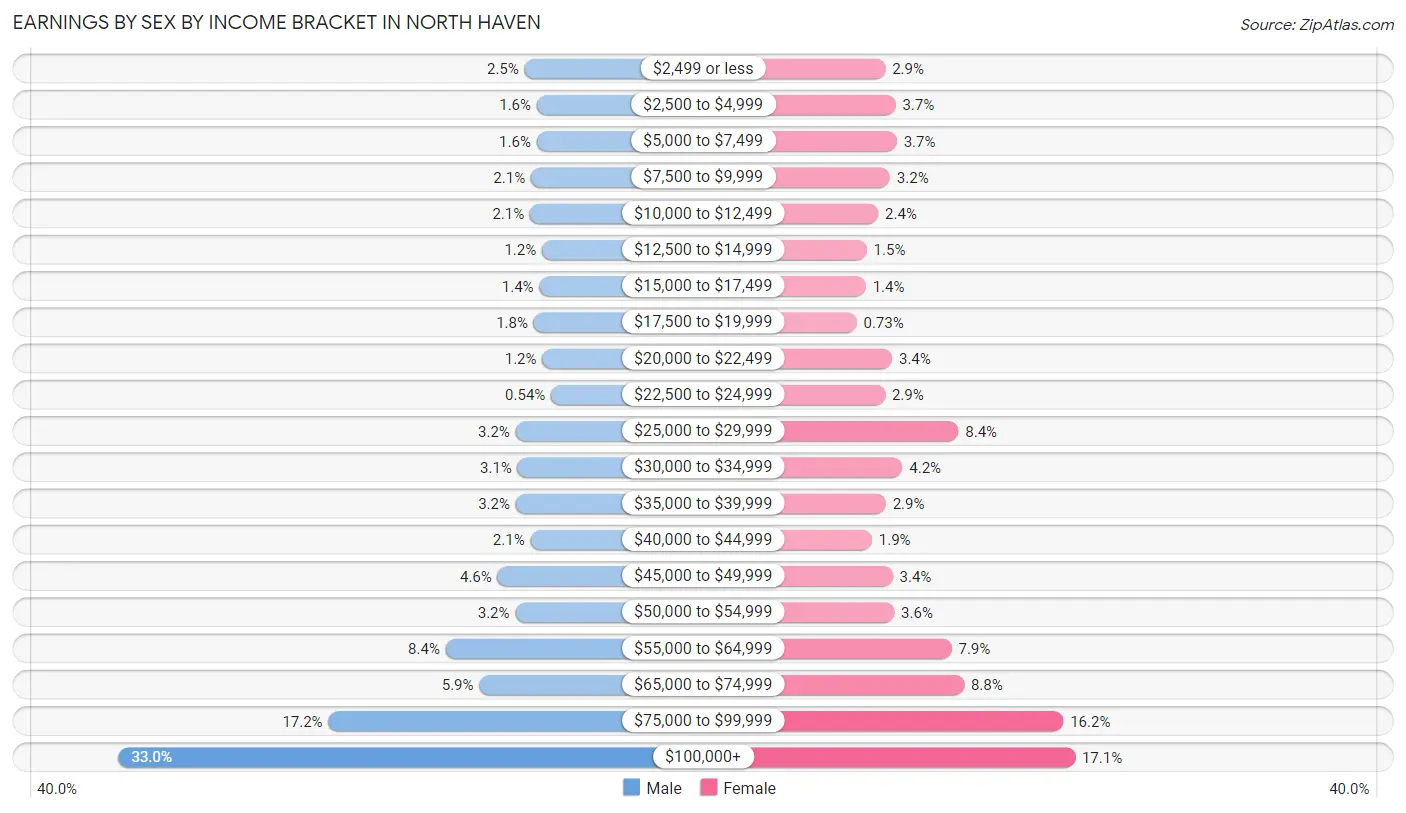
Earnings by Sex by Income Bracket in North Haven
The most common earnings brackets in North Haven are $100,000+ for men (2,316 | 33.0%) and $100,000+ for women (1,170 | 17.1%).
| Income | Male | Female |
| $2,499 or less | 178 (2.5%) | 197 (2.9%) |
| $2,500 to $4,999 | 113 (1.6%) | 250 (3.6%) |
| $5,000 to $7,499 | 114 (1.6%) | 256 (3.7%) |
| $7,500 to $9,999 | 144 (2.1%) | 221 (3.2%) |
| $10,000 to $12,499 | 149 (2.1%) | 161 (2.4%) |
| $12,500 to $14,999 | 86 (1.2%) | 102 (1.5%) |
| $15,000 to $17,499 | 100 (1.4%) | 97 (1.4%) |
| $17,500 to $19,999 | 129 (1.8%) | 50 (0.7%) |
| $20,000 to $22,499 | 84 (1.2%) | 232 (3.4%) |
| $22,500 to $24,999 | 38 (0.5%) | 196 (2.9%) |
| $25,000 to $29,999 | 225 (3.2%) | 572 (8.4%) |
| $30,000 to $34,999 | 214 (3.0%) | 285 (4.2%) |
| $35,000 to $39,999 | 224 (3.2%) | 200 (2.9%) |
| $40,000 to $44,999 | 147 (2.1%) | 129 (1.9%) |
| $45,000 to $49,999 | 320 (4.5%) | 235 (3.4%) |
| $50,000 to $54,999 | 226 (3.2%) | 243 (3.5%) |
| $55,000 to $64,999 | 593 (8.4%) | 537 (7.9%) |
| $65,000 to $74,999 | 416 (5.9%) | 601 (8.8%) |
| $75,000 to $99,999 | 1,211 (17.2%) | 1,110 (16.2%) |
| $100,000+ | 2,316 (33.0%) | 1,170 (17.1%) |
| Total | 7,027 (100.0%) | 6,844 (100.0%) |
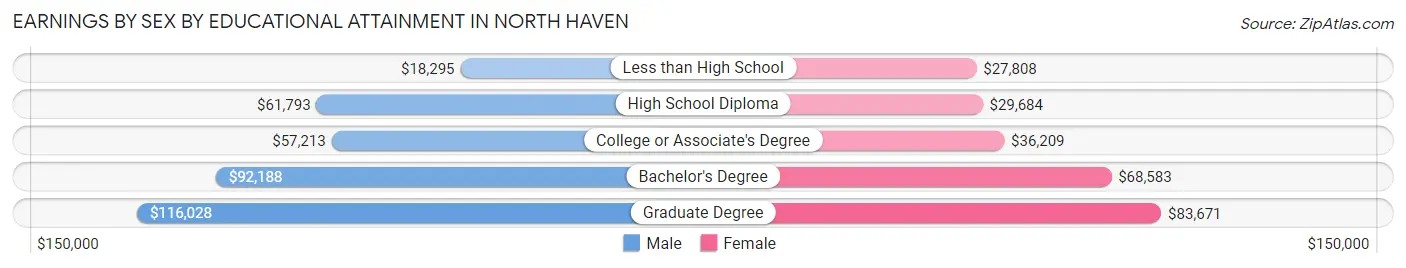
Earnings by Sex by Educational Attainment in North Haven
Average earnings in North Haven are $79,135 for men and $59,598 for women, a difference of 24.7%. Men with an educational attainment of graduate degree enjoy the highest average annual earnings of $116,028, while those with less than high school education earn the least with $18,295. Women with an educational attainment of graduate degree earn the most with the average annual earnings of $83,671, while those with less than high school education have the smallest earnings of $27,808.
| Educational Attainment | Male Income | Female Income |
| Less than High School | $18,295 | $27,808 |
| High School Diploma | $61,793 | $29,684 |
| College or Associate's Degree | $57,213 | $36,209 |
| Bachelor's Degree | $92,188 | $68,583 |
| Graduate Degree | $116,028 | $83,671 |
| Total | $79,135 | $59,598 |
Family Income in North Haven
Family Income Brackets in North Haven
According to the North Haven family income data, there are 1,714 families falling into the $100,000 to $149,999 income range, which is the most common income bracket and makes up 25.2% of all families. Conversely, the $10,000 to $14,999 income bracket is the least frequent group with only 61 families (0.9%) belonging to this category.
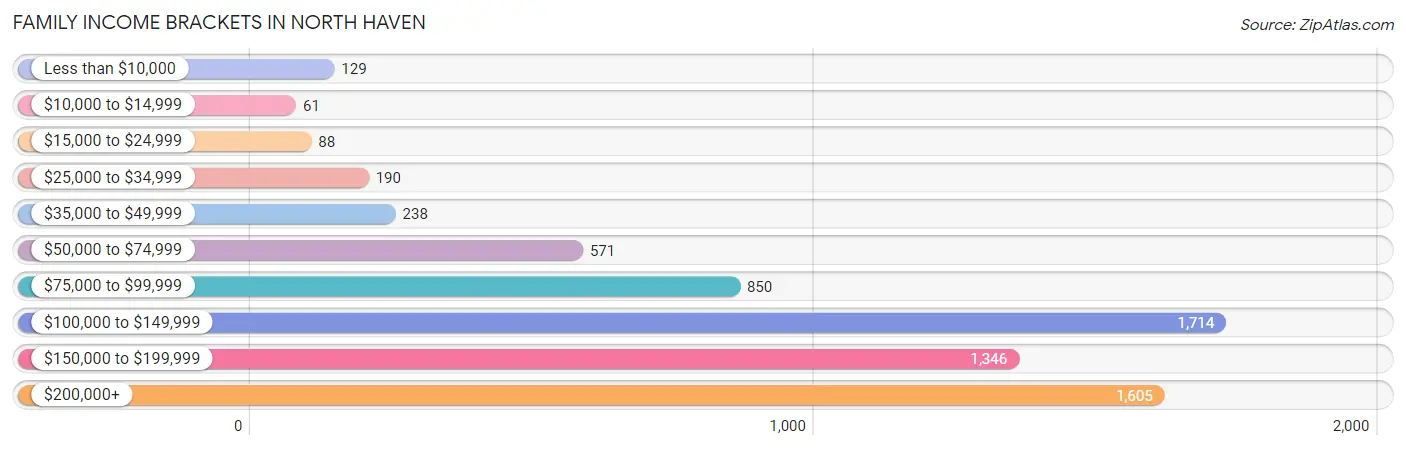
| Income Bracket | # Families | % Families |
| Less than $10,000 | 129 | 1.9% |
| $10,000 to $14,999 | 61 | 0.9% |
| $15,000 to $24,999 | 88 | 1.3% |
| $25,000 to $34,999 | 190 | 2.8% |
| $35,000 to $49,999 | 238 | 3.5% |
| $50,000 to $74,999 | 571 | 8.4% |
| $75,000 to $99,999 | 850 | 12.5% |
| $100,000 to $149,999 | 1,714 | 25.2% |
| $150,000 to $199,999 | 1,346 | 19.8% |
| $200,000+ | 1,605 | 23.6% |
Family Income by Famaliy Size in North Haven
7+ person families (65 | 1.0%) account for the highest median family income in North Haven with $200,438 per family, while 2-person families (3,415 | 50.2%) have the highest median income of $52,188 per family member.
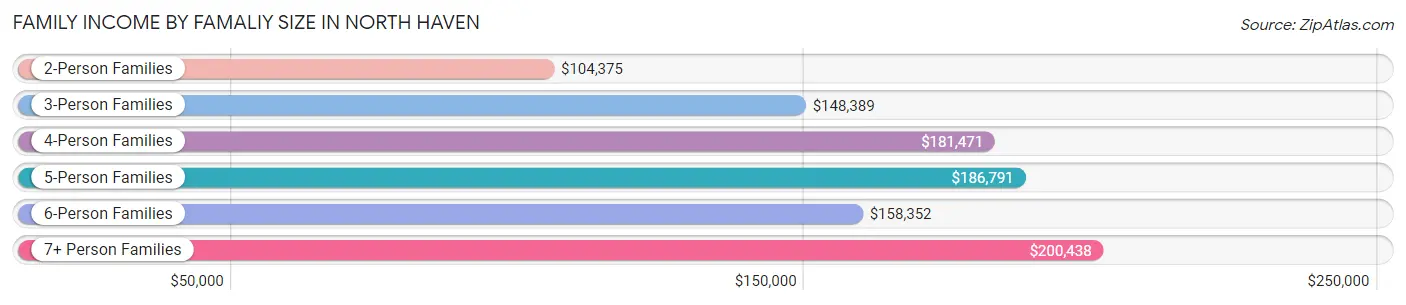
| Income Bracket | # Families | Median Income |
| 2-Person Families | 3,415 (50.2%) | $104,375 |
| 3-Person Families | 1,612 (23.7%) | $148,389 |
| 4-Person Families | 1,090 (16.0%) | $181,471 |
| 5-Person Families | 405 (6.0%) | $186,791 |
| 6-Person Families | 213 (3.1%) | $158,352 |
| 7+ Person Families | 65 (1.0%) | $200,438 |
| Total | 6,800 (100.0%) | $137,978 |
Family Income by Number of Earners in North Haven
The median family income in North Haven is $137,978, with families comprising 3+ earners (702) having the highest median family income of $186,563, while families with no earners (804) have the lowest median family income of $74,000, accounting for 10.3% and 11.8% of families, respectively.
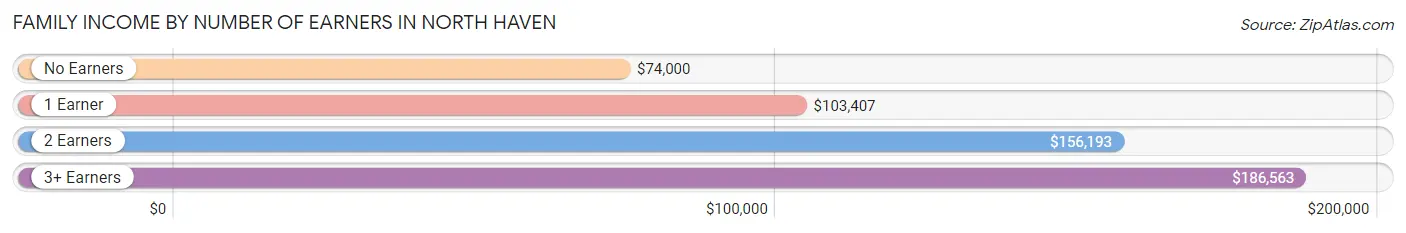
| Number of Earners | # Families | Median Income |
| No Earners | 804 (11.8%) | $74,000 |
| 1 Earner | 1,787 (26.3%) | $103,407 |
| 2 Earners | 3,507 (51.6%) | $156,193 |
| 3+ Earners | 702 (10.3%) | $186,563 |
| Total | 6,800 (100.0%) | $137,978 |
Household Income in North Haven
Household Income Brackets in North Haven
With 2,141 households falling in the category, the $100,000 to $149,999 income range is the most frequent in North Haven, accounting for 22.4% of all households. In contrast, only 191 households (2.0%) fall into the $10,000 to $14,999 income bracket, making it the least populous group.
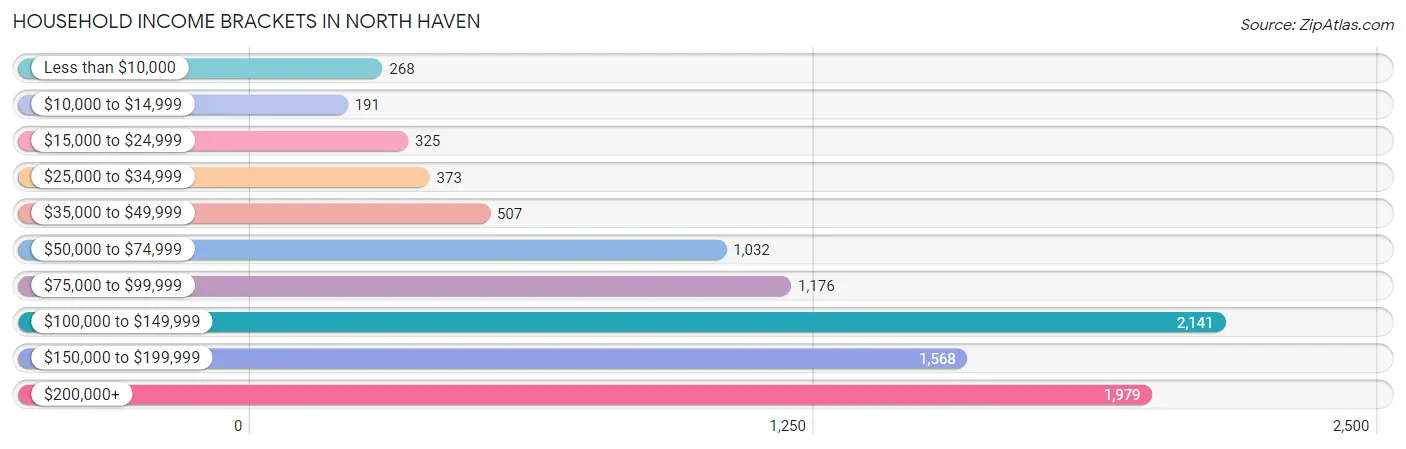
| Income Bracket | # Households | % Households |
| Less than $10,000 | 268 | 2.8% |
| $10,000 to $14,999 | 191 | 2.0% |
| $15,000 to $24,999 | 325 | 3.4% |
| $25,000 to $34,999 | 373 | 3.9% |
| $35,000 to $49,999 | 507 | 5.3% |
| $50,000 to $74,999 | 1,032 | 10.8% |
| $75,000 to $99,999 | 1,176 | 12.3% |
| $100,000 to $149,999 | 2,141 | 22.4% |
| $150,000 to $199,999 | 1,568 | 16.4% |
| $200,000+ | 1,979 | 20.7% |
Household Income by Householder Age in North Haven
The median household income in North Haven is $121,250, with the highest median household income of $153,149 found in the 45 to 64 years age bracket for the primary householder. A total of 3,818 households (39.9%) fall into this category. Meanwhile, the 15 to 24 years age bracket for the primary householder has the lowest median household income of $0, with 65 households (0.7%) in this group.
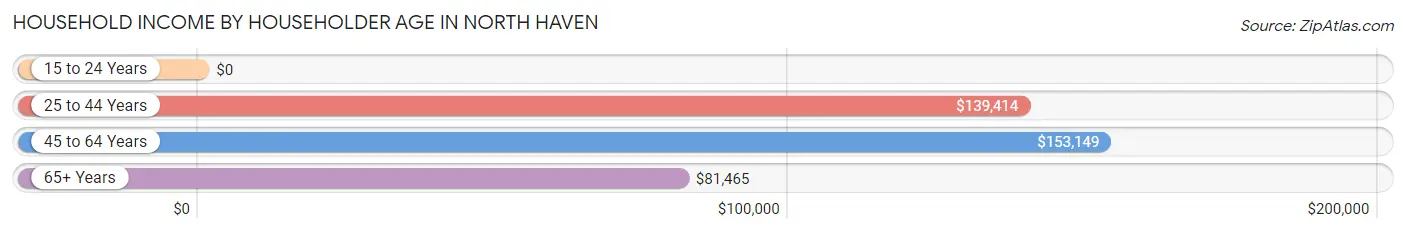
| Income Bracket | # Households | Median Income |
| 15 to 24 Years | 65 (0.7%) | $0 |
| 25 to 44 Years | 2,351 (24.6%) | $139,414 |
| 45 to 64 Years | 3,818 (39.9%) | $153,149 |
| 65+ Years | 3,325 (34.8%) | $81,465 |
| Total | 9,559 (100.0%) | $121,250 |
Poverty in North Haven
Income Below Poverty by Sex and Age in North Haven
With 6.0% poverty level for males and 6.4% for females among the residents of North Haven, 5 year old males and 15 year old females are the most vulnerable to poverty, with 17 males (36.2%) and 61 females (32.5%) in their respective age groups living below the poverty level.
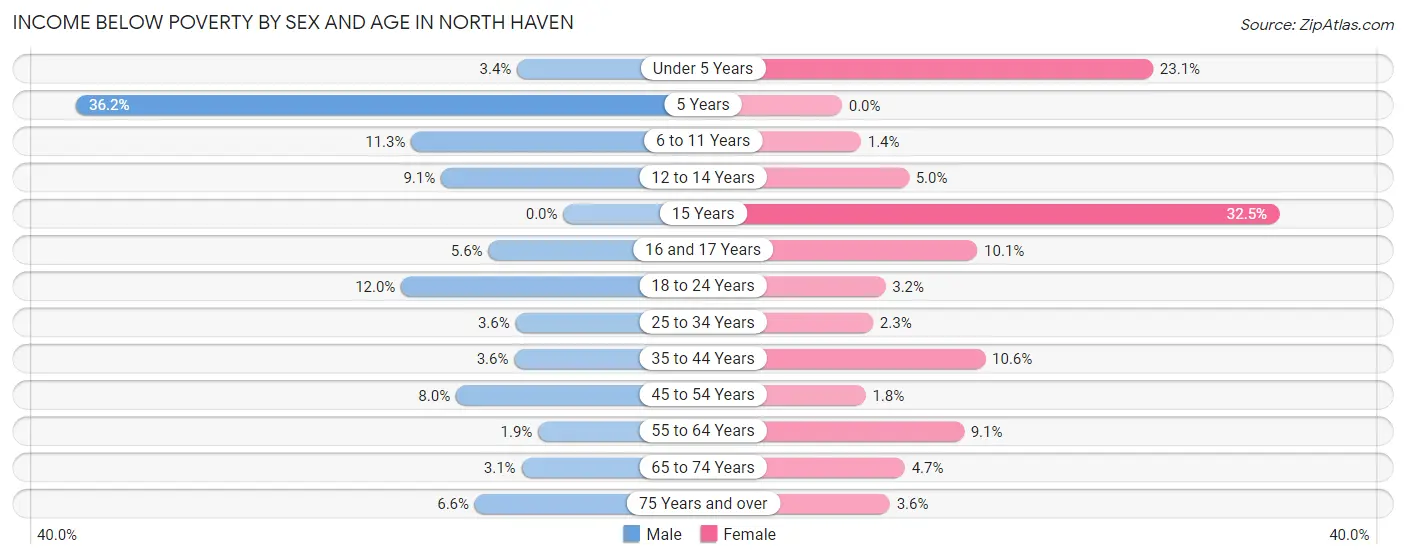
| Age Bracket | Male | Female |
| Under 5 Years | 17 (3.4%) | 88 (23.1%) |
| 5 Years | 17 (36.2%) | 0 (0.0%) |
| 6 to 11 Years | 128 (11.3%) | 9 (1.4%) |
| 12 to 14 Years | 64 (9.1%) | 25 (5.0%) |
| 15 Years | 0 (0.0%) | 61 (32.5%) |
| 16 and 17 Years | 14 (5.6%) | 40 (10.1%) |
| 18 to 24 Years | 89 (12.0%) | 20 (3.2%) |
| 25 to 34 Years | 38 (3.5%) | 25 (2.3%) |
| 35 to 44 Years | 56 (3.6%) | 179 (10.6%) |
| 45 to 54 Years | 161 (8.0%) | 26 (1.8%) |
| 55 to 64 Years | 30 (1.9%) | 164 (9.0%) |
| 65 to 74 Years | 38 (3.1%) | 80 (4.7%) |
| 75 Years and over | 74 (6.6%) | 51 (3.6%) |
| Total | 726 (6.0%) | 768 (6.4%) |
Income Above Poverty by Sex and Age in North Haven
According to the poverty statistics in North Haven, males aged 15 years and females aged 5 years are the age groups that are most secure financially, with 100.0% of males and 100.0% of females in these age groups living above the poverty line.
| Age Bracket | Male | Female |
| Under 5 Years | 479 (96.6%) | 293 (76.9%) |
| 5 Years | 30 (63.8%) | 47 (100.0%) |
| 6 to 11 Years | 1,006 (88.7%) | 628 (98.6%) |
| 12 to 14 Years | 641 (90.9%) | 478 (95.0%) |
| 15 Years | 100 (100.0%) | 127 (67.5%) |
| 16 and 17 Years | 238 (94.4%) | 358 (89.9%) |
| 18 to 24 Years | 650 (88.0%) | 600 (96.8%) |
| 25 to 34 Years | 1,033 (96.5%) | 1,059 (97.7%) |
| 35 to 44 Years | 1,483 (96.4%) | 1,504 (89.4%) |
| 45 to 54 Years | 1,859 (92.0%) | 1,448 (98.2%) |
| 55 to 64 Years | 1,571 (98.1%) | 1,649 (90.9%) |
| 65 to 74 Years | 1,185 (96.9%) | 1,633 (95.3%) |
| 75 Years and over | 1,053 (93.4%) | 1,381 (96.4%) |
| Total | 11,328 (94.0%) | 11,205 (93.6%) |
Income Below Poverty Among Married-Couple Families in North Haven
The poverty statistics for married-couple families in North Haven show that 2.7% or 148 of the total 5,526 families live below the poverty line. Families with 3 or 4 children have the highest poverty rate of 15.8%, comprising of 55 families. On the other hand, families with 1 or 2 children have the lowest poverty rate of 1.3%, which includes 24 families.
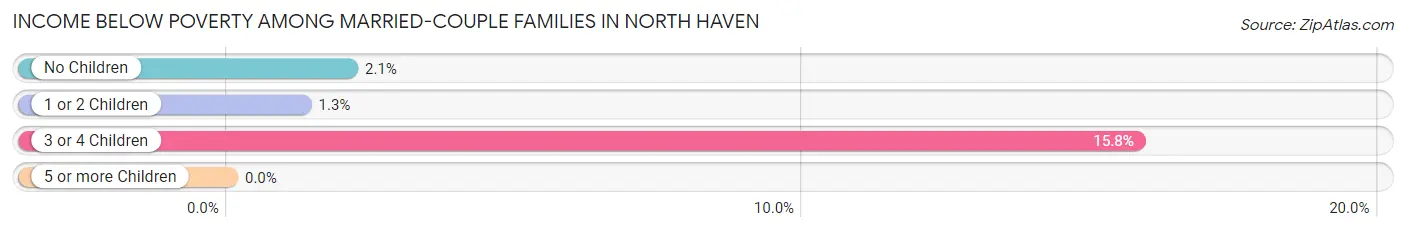
| Children | Above Poverty | Below Poverty |
| No Children | 3,231 (97.9%) | 69 (2.1%) |
| 1 or 2 Children | 1,854 (98.7%) | 24 (1.3%) |
| 3 or 4 Children | 293 (84.2%) | 55 (15.8%) |
| 5 or more Children | 0 (0.0%) | 0 (0.0%) |
| Total | 5,378 (97.3%) | 148 (2.7%) |
Income Below Poverty Among Single-Parent Households in North Haven
According to the poverty data in North Haven, 6.6% or 25 single-father households and 11.0% or 98 single-mother households are living below the poverty line. Among single-father households, those with 3 or 4 children have the highest poverty rate, with 9 households (100.0%) experiencing poverty. Likewise, among single-mother households, those with 3 or 4 children have the highest poverty rate, with 26 households (100.0%) falling below the poverty line.
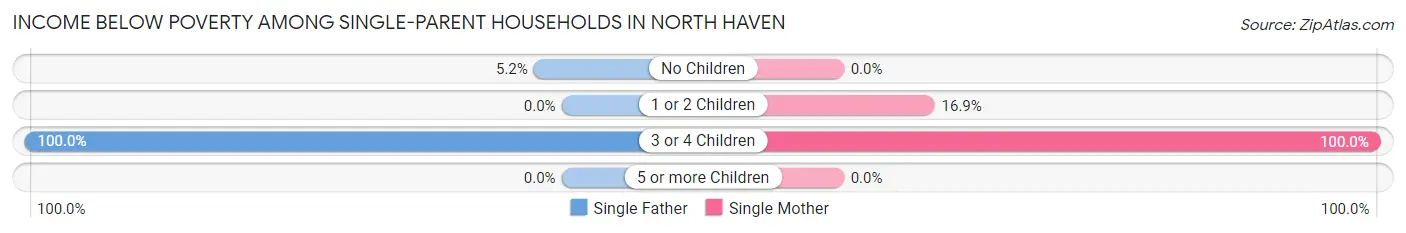
| Children | Single Father | Single Mother |
| No Children | 16 (5.2%) | 0 (0.0%) |
| 1 or 2 Children | 0 (0.0%) | 72 (16.9%) |
| 3 or 4 Children | 9 (100.0%) | 26 (100.0%) |
| 5 or more Children | 0 (0.0%) | 0 (0.0%) |
| Total | 25 (6.6%) | 98 (11.0%) |
Income Below Poverty Among Married-Couple vs Single-Parent Households in North Haven
The poverty data for North Haven shows that 148 of the married-couple family households (2.7%) and 123 of the single-parent households (9.7%) are living below the poverty level. Within the married-couple family households, those with 3 or 4 children have the highest poverty rate, with 55 households (15.8%) falling below the poverty line. Among the single-parent households, those with 3 or 4 children have the highest poverty rate, with 35 household (100.0%) living below poverty.
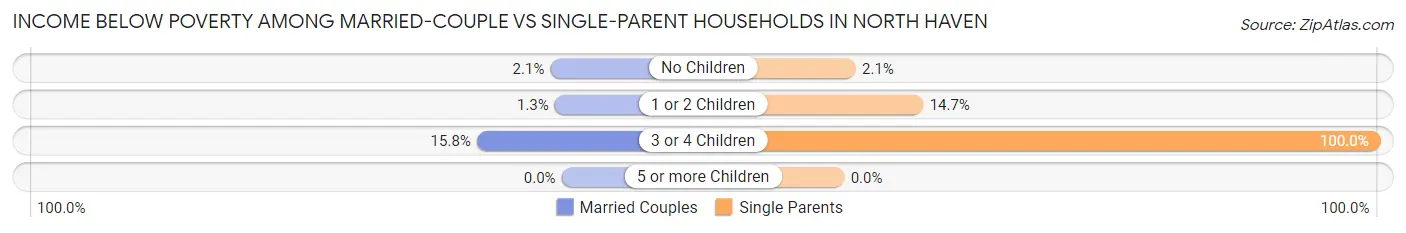
| Children | Married-Couple Families | Single-Parent Households |
| No Children | 69 (2.1%) | 16 (2.1%) |
| 1 or 2 Children | 24 (1.3%) | 72 (14.7%) |
| 3 or 4 Children | 55 (15.8%) | 35 (100.0%) |
| 5 or more Children | 0 (0.0%) | 0 (0.0%) |
| Total | 148 (2.7%) | 123 (9.7%) |
Race in North Haven
The most populous races in North Haven are White / Caucasian (20,241 | 83.7%), Hispanic or Latino (1,713 | 7.1%), and Asian (1,448 | 6.0%).
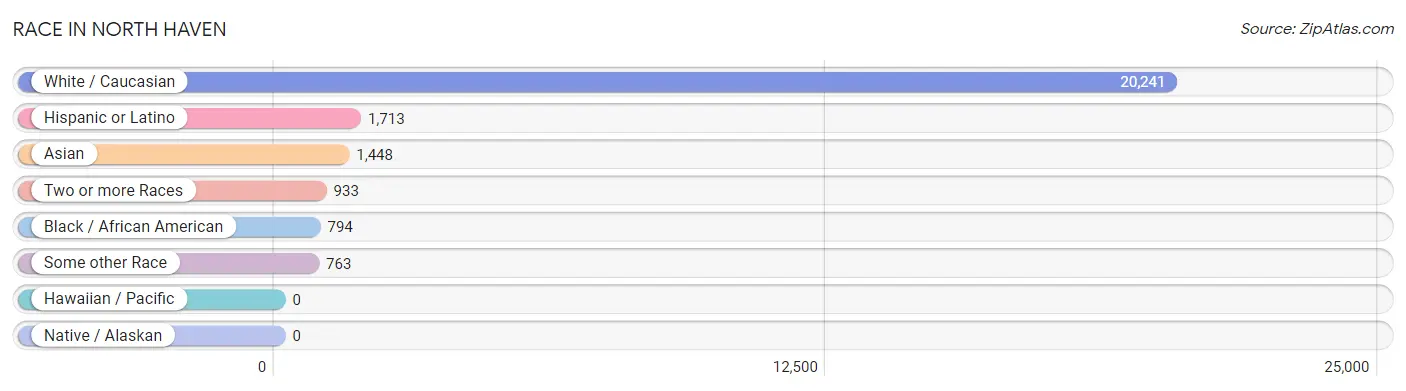
| Race | # Population | % Population |
| Asian | 1,448 | 6.0% |
| Black / African American | 794 | 3.3% |
| Hawaiian / Pacific | 0 | 0.0% |
| Hispanic or Latino | 1,713 | 7.1% |
| Native / Alaskan | 0 | 0.0% |
| White / Caucasian | 20,241 | 83.7% |
| Two or more Races | 933 | 3.9% |
| Some other Race | 763 | 3.2% |
| Total | 24,179 | 100.0% |
Ancestry in North Haven
The most populous ancestries reported in North Haven are Italian (9,656 | 39.9%), Irish (4,786 | 19.8%), German (2,110 | 8.7%), Polish (2,019 | 8.4%), and English (1,463 | 6.0%), together accounting for 82.9% of all North Haven residents.
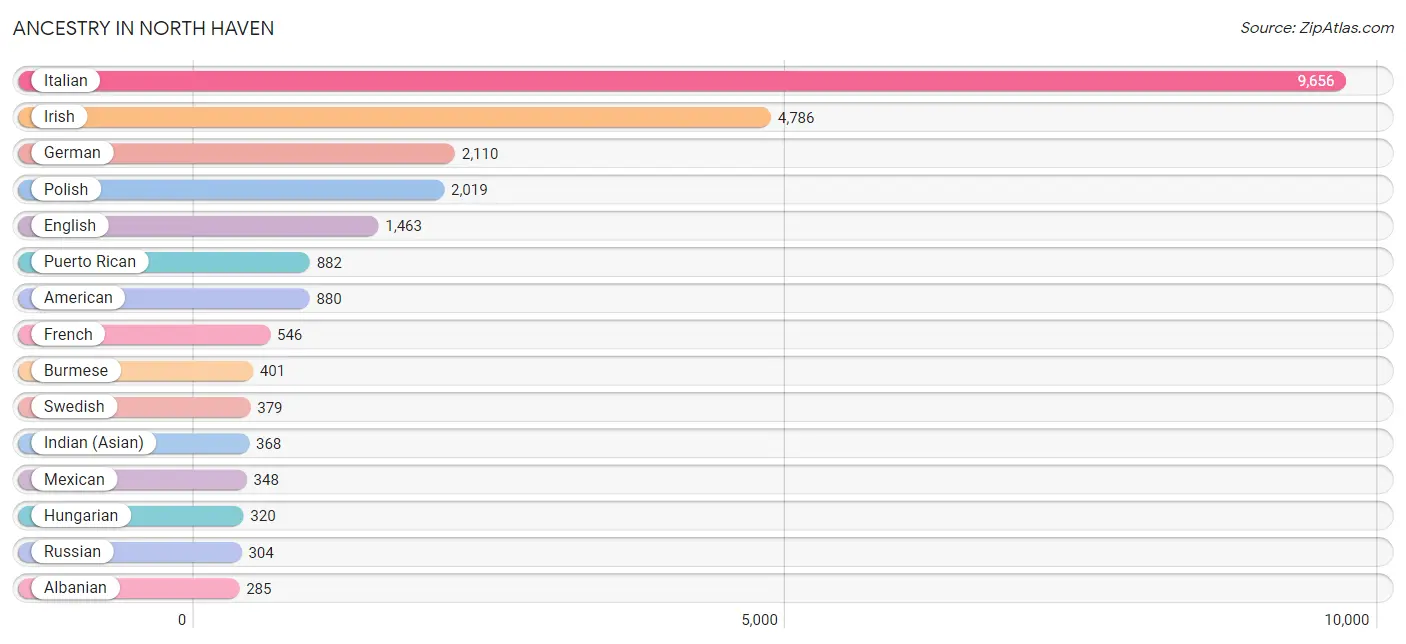
| Ancestry | # Population | % Population |
| African | 28 | 0.1% |
| Albanian | 285 | 1.2% |
| American | 880 | 3.6% |
| Arab | 31 | 0.1% |
| Argentinean | 58 | 0.2% |
| Armenian | 53 | 0.2% |
| Australian | 43 | 0.2% |
| Austrian | 81 | 0.3% |
| Belgian | 28 | 0.1% |
| Bhutanese | 39 | 0.2% |
| British | 122 | 0.5% |
| British West Indian | 11 | 0.1% |
| Burmese | 401 | 1.7% |
| Canadian | 77 | 0.3% |
| Cape Verdean | 1 | 0.0% |
| Celtic | 15 | 0.1% |
| Central American | 213 | 0.9% |
| Cherokee | 22 | 0.1% |
| Colombian | 74 | 0.3% |
| Croatian | 30 | 0.1% |
| Cuban | 24 | 0.1% |
| Czech | 39 | 0.2% |
| Danish | 44 | 0.2% |
| Dutch | 37 | 0.2% |
| Eastern European | 19 | 0.1% |
| English | 1,463 | 6.0% |
| European | 177 | 0.7% |
| Filipino | 23 | 0.1% |
| Finnish | 36 | 0.2% |
| French | 546 | 2.3% |
| French Canadian | 147 | 0.6% |
| German | 2,110 | 8.7% |
| Greek | 278 | 1.1% |
| Guatemalan | 56 | 0.2% |
| Honduran | 83 | 0.3% |
| Hungarian | 320 | 1.3% |
| Icelander | 9 | 0.0% |
| Indian (Asian) | 368 | 1.5% |
| Irish | 4,786 | 19.8% |
| Israeli | 14 | 0.1% |
| Italian | 9,656 | 39.9% |
| Japanese | 21 | 0.1% |
| Korean | 233 | 1.0% |
| Laotian | 13 | 0.1% |
| Lebanese | 19 | 0.1% |
| Lithuanian | 31 | 0.1% |
| Malaysian | 164 | 0.7% |
| Mexican | 348 | 1.4% |
| Moroccan | 12 | 0.1% |
| Nigerian | 27 | 0.1% |
| Northern European | 15 | 0.1% |
| Norwegian | 72 | 0.3% |
| Pakistani | 9 | 0.0% |
| Polish | 2,019 | 8.4% |
| Portuguese | 60 | 0.3% |
| Puerto Rican | 882 | 3.6% |
| Russian | 304 | 1.3% |
| Salvadoran | 74 | 0.3% |
| Scandinavian | 68 | 0.3% |
| Scotch-Irish | 66 | 0.3% |
| Scottish | 113 | 0.5% |
| Slovak | 51 | 0.2% |
| South American | 132 | 0.5% |
| Spaniard | 91 | 0.4% |
| Spanish | 23 | 0.1% |
| Sri Lankan | 125 | 0.5% |
| Subsaharan African | 58 | 0.2% |
| Sudanese | 2 | 0.0% |
| Swedish | 379 | 1.6% |
| Swiss | 48 | 0.2% |
| Thai | 210 | 0.9% |
| Turkish | 42 | 0.2% |
| Ukrainian | 169 | 0.7% |
| Welsh | 130 | 0.5% | View All 74 Rows |
Immigrants in North Haven
The most numerous immigrant groups reported in North Haven came from Asia (1,230 | 5.1%), Europe (760 | 3.1%), Eastern Asia (661 | 2.7%), South Eastern Asia (374 | 1.5%), and China (348 | 1.4%), together accounting for 13.9% of all North Haven residents.
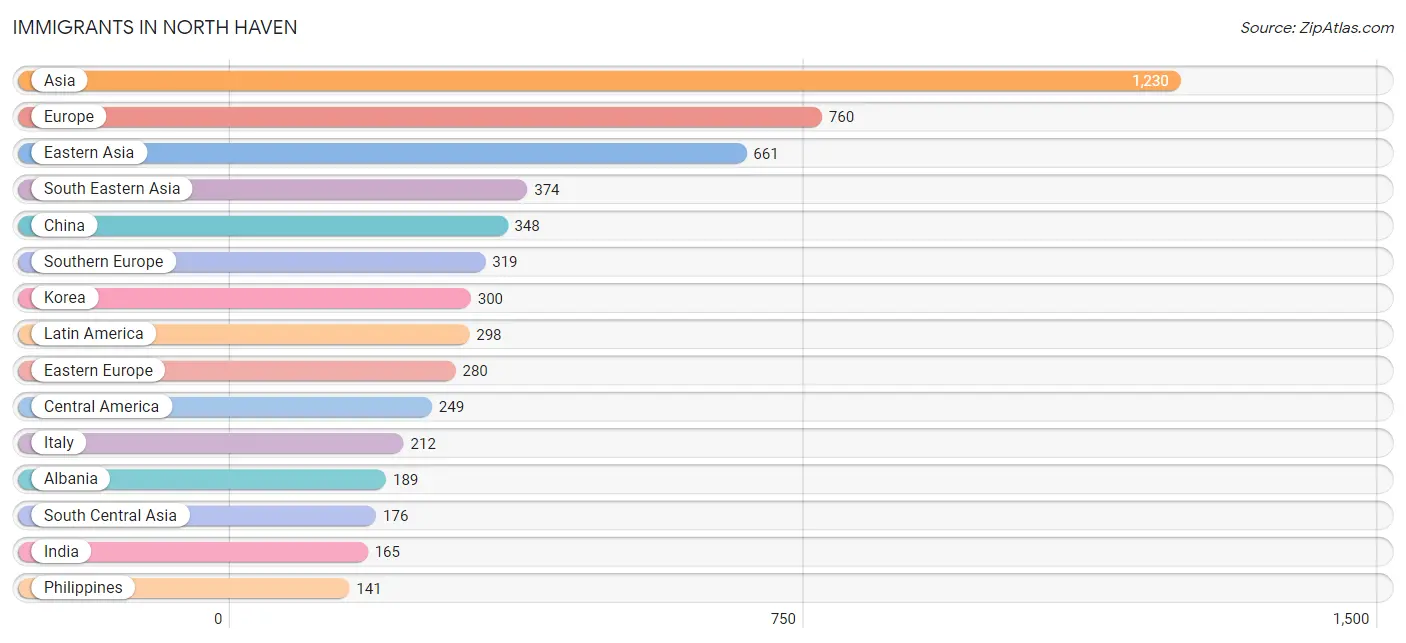
| Immigration Origin | # Population | % Population |
| Africa | 31 | 0.1% |
| Albania | 189 | 0.8% |
| Asia | 1,230 | 5.1% |
| Bosnia and Herzegovina | 11 | 0.1% |
| Brazil | 15 | 0.1% |
| Cabo Verde | 1 | 0.0% |
| Cambodia | 21 | 0.1% |
| Canada | 44 | 0.2% |
| Caribbean | 20 | 0.1% |
| Central America | 249 | 1.0% |
| China | 348 | 1.4% |
| Eastern Asia | 661 | 2.7% |
| Eastern Europe | 280 | 1.2% |
| El Salvador | 74 | 0.3% |
| England | 41 | 0.2% |
| Europe | 760 | 3.1% |
| Germany | 52 | 0.2% |
| Ghana | 13 | 0.1% |
| Greece | 18 | 0.1% |
| Guyana | 14 | 0.1% |
| Haiti | 9 | 0.0% |
| Honduras | 60 | 0.3% |
| Hungary | 10 | 0.0% |
| India | 165 | 0.7% |
| Ireland | 41 | 0.2% |
| Italy | 212 | 0.9% |
| Japan | 13 | 0.1% |
| Korea | 300 | 1.2% |
| Laos | 116 | 0.5% |
| Latin America | 298 | 1.2% |
| Mexico | 106 | 0.4% |
| Morocco | 12 | 0.1% |
| Nicaragua | 9 | 0.0% |
| Northern Africa | 17 | 0.1% |
| Northern Europe | 109 | 0.4% |
| Pakistan | 11 | 0.1% |
| Philippines | 141 | 0.6% |
| Poland | 54 | 0.2% |
| Portugal | 27 | 0.1% |
| South America | 29 | 0.1% |
| South Central Asia | 176 | 0.7% |
| South Eastern Asia | 374 | 1.5% |
| Southern Europe | 319 | 1.3% |
| Spain | 62 | 0.3% |
| Sudan | 5 | 0.0% |
| Taiwan | 51 | 0.2% |
| Turkey | 19 | 0.1% |
| Ukraine | 16 | 0.1% |
| Vietnam | 84 | 0.4% |
| Western Africa | 14 | 0.1% |
| Western Asia | 19 | 0.1% |
| Western Europe | 52 | 0.2% | View All 52 Rows |
Sex and Age in North Haven
Sex and Age in North Haven
The most populous age groups in North Haven are 10 to 14 Years (1,210 | 10.0%) for men and 65 to 69 Years (977 | 8.1%) for women.
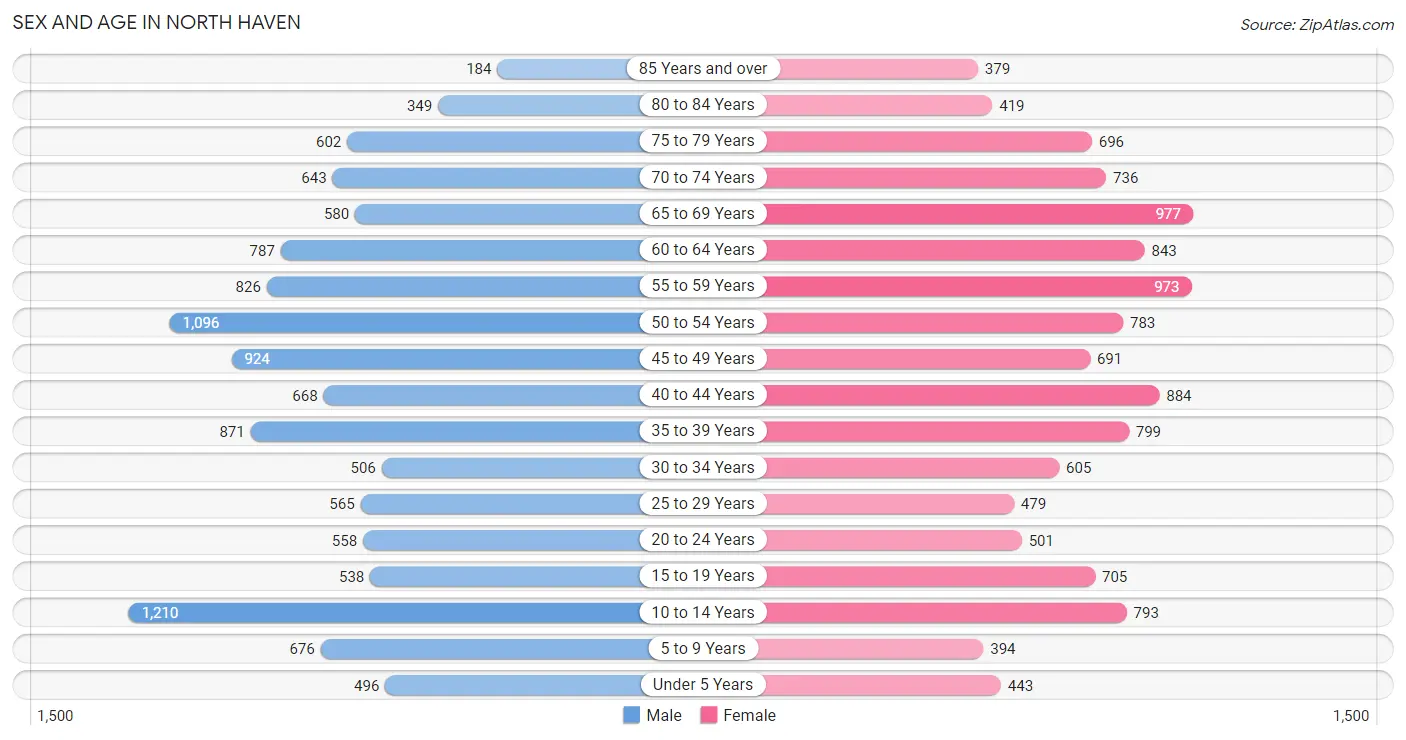
| Age Bracket | Male | Female |
| Under 5 Years | 496 (4.1%) | 443 (3.7%) |
| 5 to 9 Years | 676 (5.6%) | 394 (3.3%) |
| 10 to 14 Years | 1,210 (10.0%) | 793 (6.6%) |
| 15 to 19 Years | 538 (4.4%) | 705 (5.8%) |
| 20 to 24 Years | 558 (4.6%) | 501 (4.1%) |
| 25 to 29 Years | 565 (4.7%) | 479 (4.0%) |
| 30 to 34 Years | 506 (4.2%) | 605 (5.0%) |
| 35 to 39 Years | 871 (7.2%) | 799 (6.6%) |
| 40 to 44 Years | 668 (5.5%) | 884 (7.3%) |
| 45 to 49 Years | 924 (7.6%) | 691 (5.7%) |
| 50 to 54 Years | 1,096 (9.1%) | 783 (6.5%) |
| 55 to 59 Years | 826 (6.8%) | 973 (8.0%) |
| 60 to 64 Years | 787 (6.5%) | 843 (7.0%) |
| 65 to 69 Years | 580 (4.8%) | 977 (8.1%) |
| 70 to 74 Years | 643 (5.3%) | 736 (6.1%) |
| 75 to 79 Years | 602 (5.0%) | 696 (5.8%) |
| 80 to 84 Years | 349 (2.9%) | 419 (3.5%) |
| 85 Years and over | 184 (1.5%) | 379 (3.1%) |
| Total | 12,079 (100.0%) | 12,100 (100.0%) |
Families and Households in North Haven
Median Family Size in North Haven
The median family size in North Haven is 2.95 persons per family, with married-couple families (5,526 | 81.3%) accounting for the largest median family size of 3.03 persons per family. On the other hand, single male/father families (381 | 5.6%) represent the smallest median family size with 2.30 persons per family.
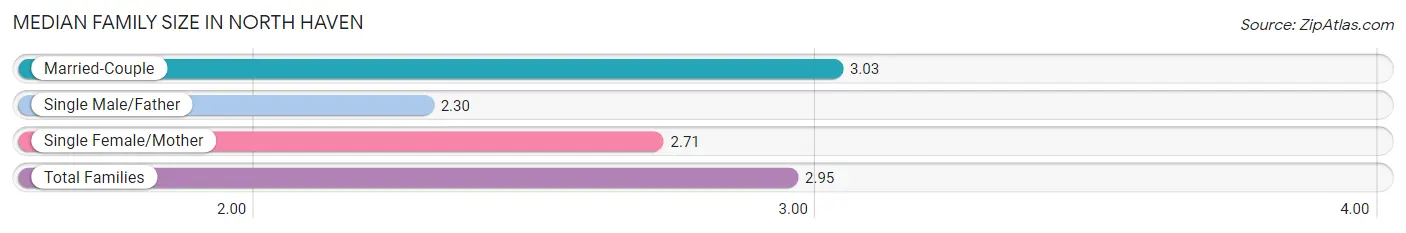
| Family Type | # Families | Family Size |
| Married-Couple | 5,526 (81.3%) | 3.03 |
| Single Male/Father | 381 (5.6%) | 2.30 |
| Single Female/Mother | 893 (13.1%) | 2.71 |
| Total Families | 6,800 (100.0%) | 2.95 |
Median Household Size in North Haven
The median household size in North Haven is 2.51 persons per household, with married-couple households (5,526 | 57.8%) accounting for the largest median household size of 3.04 persons per household. non-family households (2,759 | 28.9%) represent the smallest median household size with 1.34 persons per household.
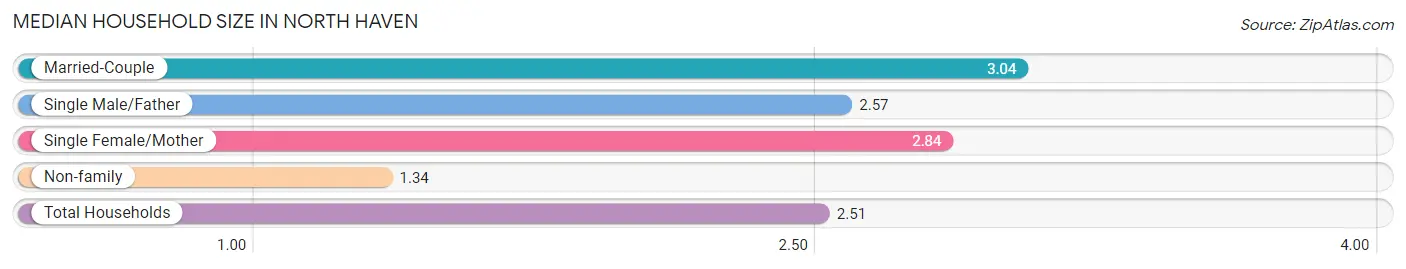
| Household Type | # Households | Household Size |
| Married-Couple | 5,526 (57.8%) | 3.04 |
| Single Male/Father | 381 (4.0%) | 2.57 |
| Single Female/Mother | 893 (9.3%) | 2.84 |
| Non-family | 2,759 (28.9%) | 1.34 |
| Total Households | 9,559 (100.0%) | 2.51 |
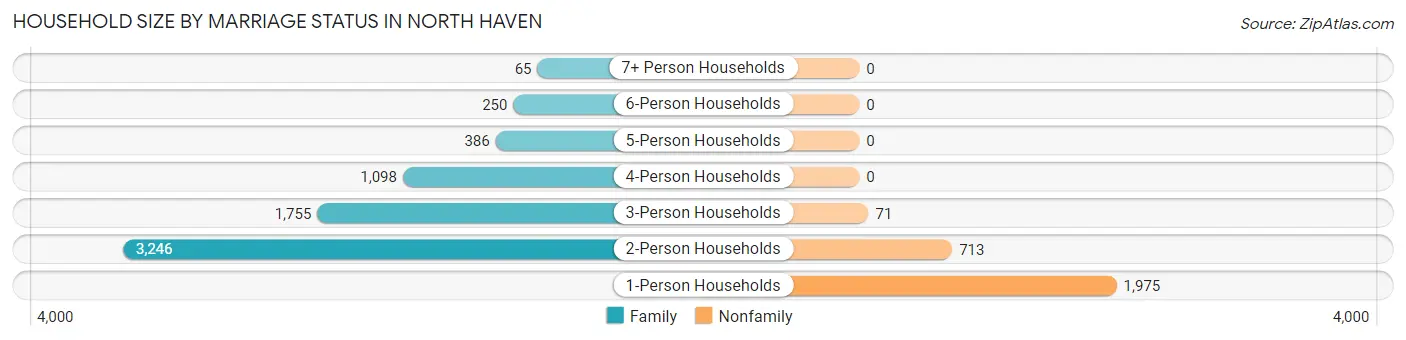
Household Size by Marriage Status in North Haven
Out of a total of 9,559 households in North Haven, 6,800 (71.1%) are family households, while 2,759 (28.9%) are nonfamily households. The most numerous type of family households are 2-person households, comprising 3,246, and the most common type of nonfamily households are 1-person households, comprising 1,975.
| Household Size | Family Households | Nonfamily Households |
| 1-Person Households | - | 1,975 (20.7%) |
| 2-Person Households | 3,246 (34.0%) | 713 (7.5%) |
| 3-Person Households | 1,755 (18.4%) | 71 (0.7%) |
| 4-Person Households | 1,098 (11.5%) | 0 (0.0%) |
| 5-Person Households | 386 (4.0%) | 0 (0.0%) |
| 6-Person Households | 250 (2.6%) | 0 (0.0%) |
| 7+ Person Households | 65 (0.7%) | 0 (0.0%) |
| Total | 6,800 (71.1%) | 2,759 (28.9%) |
Female Fertility in North Haven
Fertility by Age in North Haven
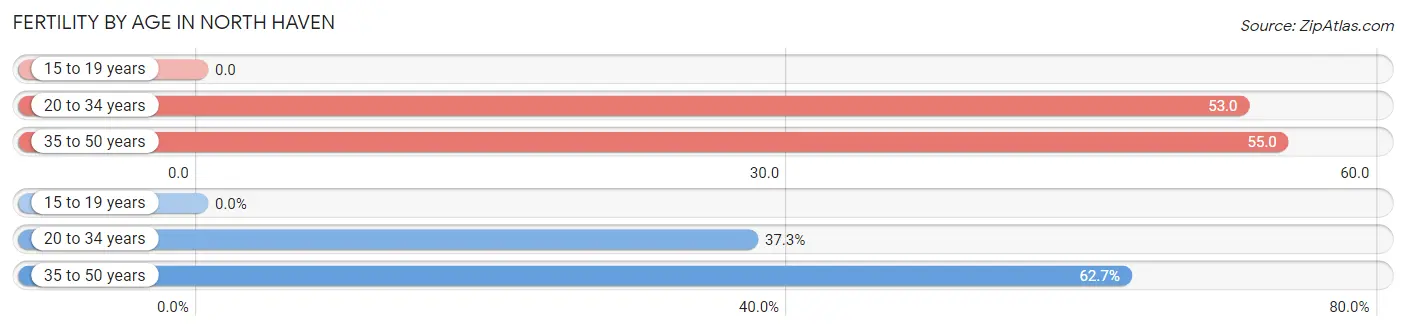
Average fertility rate in North Haven is 46.0 births per 1,000 women. Women in the age bracket of 35 to 50 years have the highest fertility rate with 55.0 births per 1,000 women. Women in the age bracket of 35 to 50 years acount for 62.7% of all women with births.
| Age Bracket | Women with Births | Births / 1,000 Women |
| 15 to 19 years | 0 (0.0%) | 0.0 |
| 20 to 34 years | 84 (37.3%) | 53.0 |
| 35 to 50 years | 141 (62.7%) | 55.0 |
| Total | 225 (100.0%) | 46.0 |
Fertility by Age by Marriage Status in North Haven
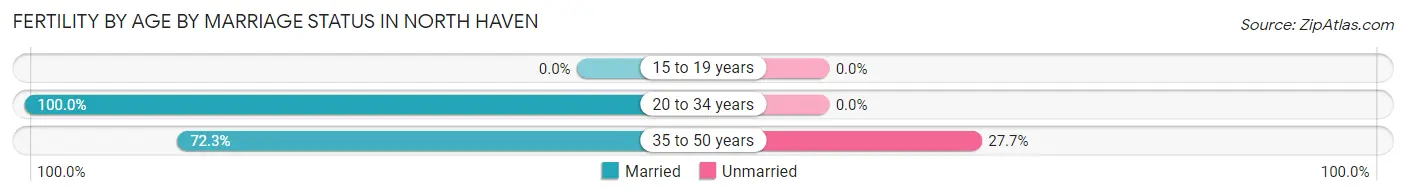
82.7% of women with births (225) in North Haven are married. The highest percentage of unmarried women with births falls into 35 to 50 years age bracket with 27.7% of them unmarried at the time of birth, while the lowest percentage of unmarried women with births belong to 20 to 34 years age bracket with 0.0% of them unmarried.
| Age Bracket | Married | Unmarried |
| 15 to 19 years | 0 (0.0%) | 0 (0.0%) |
| 20 to 34 years | 84 (100.0%) | 0 (0.0%) |
| 35 to 50 years | 102 (72.3%) | 39 (27.7%) |
| Total | 186 (82.7%) | 39 (17.3%) |
Fertility by Education in North Haven
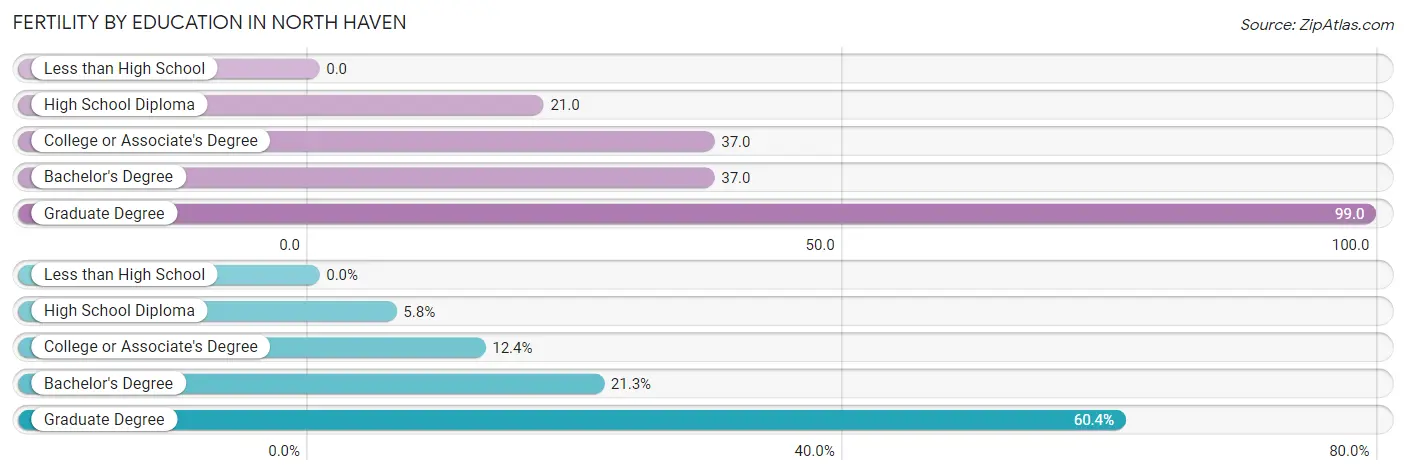
| Educational Attainment | Women with Births | Births / 1,000 Women |
| Less than High School | 0 (0.0%) | 0.0 |
| High School Diploma | 13 (5.8%) | 21.0 |
| College or Associate's Degree | 28 (12.4%) | 37.0 |
| Bachelor's Degree | 48 (21.3%) | 37.0 |
| Graduate Degree | 136 (60.4%) | 99.0 |
| Total | 225 (100.0%) | 46.0 |
Fertility by Education by Marriage Status in North Haven
17.3% of women with births in North Haven are unmarried. Women with the educational attainment of high school diploma are most likely to be married with 100.0% of them married at childbirth, while women with the educational attainment of college or associate's degree are least likely to be married with 53.6% of them unmarried at childbirth.
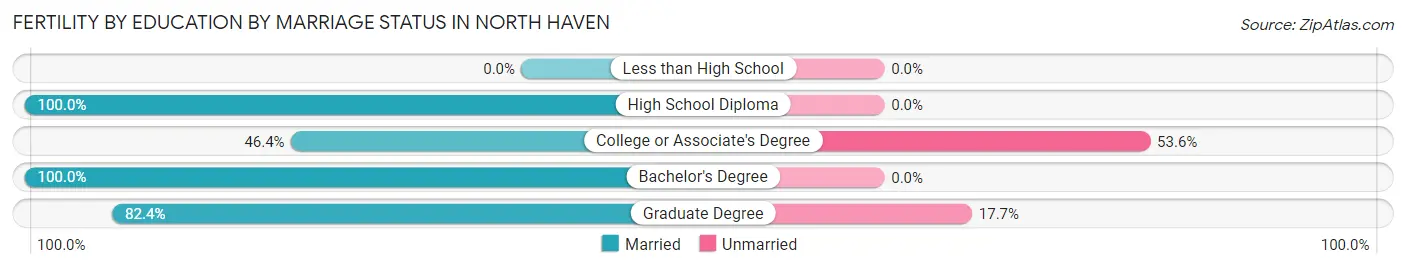
| Educational Attainment | Married | Unmarried |
| Less than High School | 0 (0.0%) | 0 (0.0%) |
| High School Diploma | 13 (100.0%) | 0 (0.0%) |
| College or Associate's Degree | 13 (46.4%) | 15 (53.6%) |
| Bachelor's Degree | 48 (100.0%) | 0 (0.0%) |
| Graduate Degree | 112 (82.4%) | 24 (17.6%) |
| Total | 186 (82.7%) | 39 (17.3%) |
Employment Characteristics in North Haven
Employment by Class of Employer in North Haven
Among the 12,737 employed individuals in North Haven, private company employees (7,374 | 57.9%), not-for-profit organizations (2,014 | 15.8%), and local government employees (1,538 | 12.1%) make up the most common classes of employment.
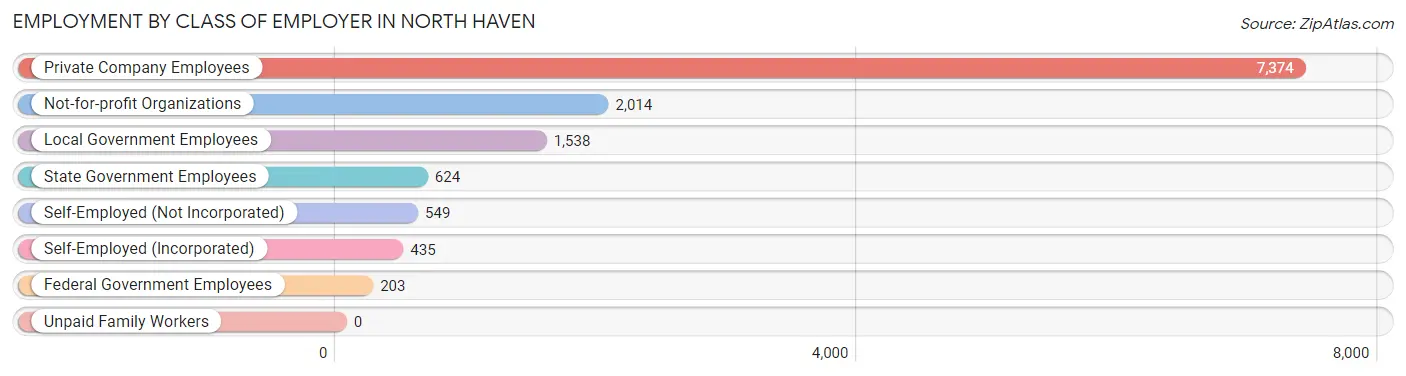
| Employer Class | # Employees | % Employees |
| Private Company Employees | 7,374 | 57.9% |
| Self-Employed (Incorporated) | 435 | 3.4% |
| Self-Employed (Not Incorporated) | 549 | 4.3% |
| Not-for-profit Organizations | 2,014 | 15.8% |
| Local Government Employees | 1,538 | 12.1% |
| State Government Employees | 624 | 4.9% |
| Federal Government Employees | 203 | 1.6% |
| Unpaid Family Workers | 0 | 0.0% |
| Total | 12,737 | 100.0% |
Employment Status by Age in North Haven
According to the labor force statistics for North Haven, out of the total population over 16 years of age (19,879), 66.8% or 13,279 individuals are in the labor force, with 3.4% or 451 of them unemployed. The age group with the highest labor force participation rate is 45 to 54 years, with 93.5% or 3,267 individuals in the labor force. Within the labor force, the 16 to 19 years age range has the highest percentage of unemployed individuals, with 13.6% or 45 of them being unemployed.
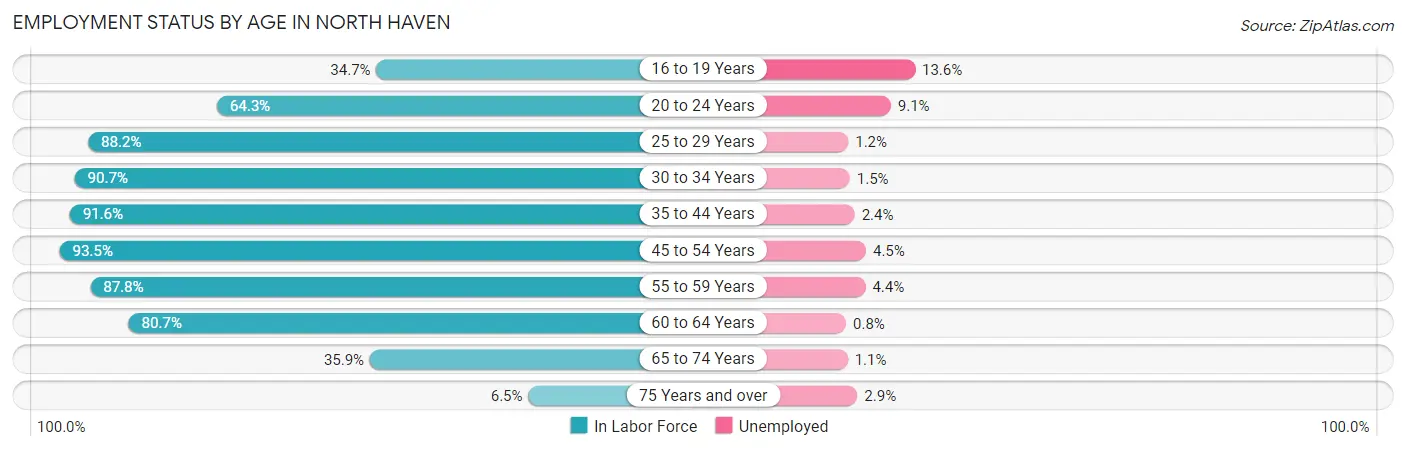
| Age Bracket | In Labor Force | Unemployed |
| 16 to 19 Years | 331 (34.7%) | 45 (13.6%) |
| 20 to 24 Years | 681 (64.3%) | 62 (9.1%) |
| 25 to 29 Years | 921 (88.2%) | 11 (1.2%) |
| 30 to 34 Years | 1,008 (90.7%) | 15 (1.5%) |
| 35 to 44 Years | 2,951 (91.6%) | 71 (2.4%) |
| 45 to 54 Years | 3,267 (93.5%) | 147 (4.5%) |
| 55 to 59 Years | 1,580 (87.8%) | 70 (4.4%) |
| 60 to 64 Years | 1,315 (80.7%) | 11 (0.8%) |
| 65 to 74 Years | 1,054 (35.9%) | 12 (1.1%) |
| 75 Years and over | 171 (6.5%) | 5 (2.9%) |
| Total | 13,279 (66.8%) | 451 (3.4%) |
Employment Status by Educational Attainment in North Haven
According to labor force statistics for North Haven, 89.8% of individuals (11,045) out of the total population between 25 and 64 years of age (12,300) are in the labor force, with 2.9% or 320 of them being unemployed. The group with the highest labor force participation rate are those with the educational attainment of bachelor's degree or higher, with 95.0% or 6,132 individuals in the labor force. Within the labor force, individuals with bachelor's degree or higher education have the highest percentage of unemployment, with 3.1% or 190 of them being unemployed.
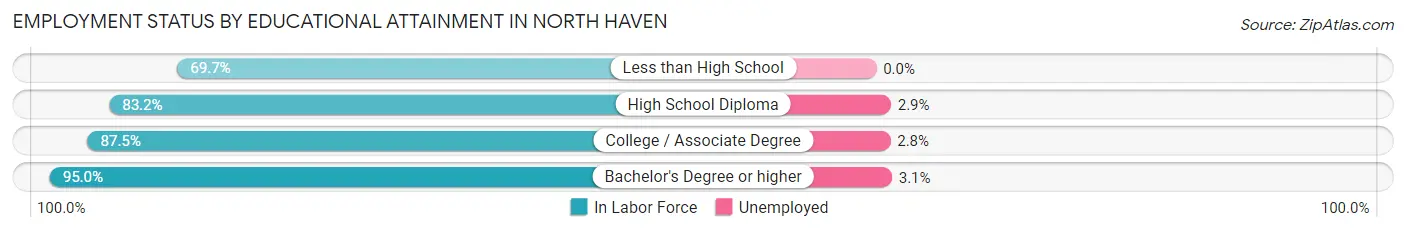
| Educational Attainment | In Labor Force | Unemployed |
| Less than High School | 326 (69.7%) | 0 (0.0%) |
| High School Diploma | 2,411 (83.2%) | 84 (2.9%) |
| College / Associate Degree | 2,169 (87.5%) | 69 (2.8%) |
| Bachelor's Degree or higher | 6,132 (95.0%) | 200 (3.1%) |
| Total | 11,045 (89.8%) | 357 (2.9%) |
Employment Occupations by Sex in North Haven
Management, Business, Science and Arts Occupations
The most common Management, Business, Science and Arts occupations in North Haven are Community & Social Service (2,227 | 17.4%), Education Instruction & Library (1,526 | 11.9%), Management (1,515 | 11.8%), Health Diagnosing & Treating (1,076 | 8.4%), and Business & Financial (938 | 7.3%).
Management, Business, Science and Arts Occupations by Sex
Within the Management, Business, Science and Arts occupations in North Haven, the most male-oriented occupations are Architecture & Engineering (86.6%), Legal Services & Support (59.4%), and Computers, Engineering & Science (57.8%), while the most female-oriented occupations are Life, Physical & Social Science (86.0%), Education Instruction & Library (79.1%), and Health Diagnosing & Treating (73.7%).
| Occupation | Male | Female |
| Management | 850 (56.1%) | 665 (43.9%) |
| Business & Financial | 494 (52.7%) | 444 (47.3%) |
| Computers, Engineering & Science | 488 (57.8%) | 356 (42.2%) |
| Computers & Mathematics | 171 (52.9%) | 152 (47.1%) |
| Architecture & Engineering | 291 (86.6%) | 45 (13.4%) |
| Life, Physical & Social Science | 26 (14.1%) | 159 (86.0%) |
| Community & Social Service | 699 (31.4%) | 1,528 (68.6%) |
| Education, Arts & Media | 120 (47.1%) | 135 (52.9%) |
| Legal Services & Support | 104 (59.4%) | 71 (40.6%) |
| Education Instruction & Library | 319 (20.9%) | 1,207 (79.1%) |
| Arts, Media & Entertainment | 156 (57.6%) | 115 (42.4%) |
| Health Diagnosing & Treating | 283 (26.3%) | 793 (73.7%) |
| Health Technologists | 259 (28.3%) | 657 (71.7%) |
| Total (Category) | 2,814 (42.6%) | 3,786 (57.4%) |
| Total (Overall) | 6,553 (51.1%) | 6,261 (48.9%) |
Services Occupations
The most common Services occupations in North Haven are Security & Protection (482 | 3.8%), Food Preparation & Serving (408 | 3.2%), Personal Care & Service (282 | 2.2%), Law Enforcement (252 | 2.0%), and Cleaning & Maintenance (233 | 1.8%).
Services Occupations by Sex
Within the Services occupations in North Haven, the most male-oriented occupations are Firefighting & Prevention (100.0%), Cleaning & Maintenance (100.0%), and Security & Protection (96.1%), while the most female-oriented occupations are Healthcare Support (75.2%), Personal Care & Service (67.7%), and Food Preparation & Serving (50.2%).
| Occupation | Male | Female |
| Healthcare Support | 36 (24.8%) | 109 (75.2%) |
| Security & Protection | 463 (96.1%) | 19 (3.9%) |
| Firefighting & Prevention | 230 (100.0%) | 0 (0.0%) |
| Law Enforcement | 233 (92.5%) | 19 (7.5%) |
| Food Preparation & Serving | 203 (49.7%) | 205 (50.2%) |
| Cleaning & Maintenance | 233 (100.0%) | 0 (0.0%) |
| Personal Care & Service | 91 (32.3%) | 191 (67.7%) |
| Total (Category) | 1,026 (66.2%) | 524 (33.8%) |
| Total (Overall) | 6,553 (51.1%) | 6,261 (48.9%) |
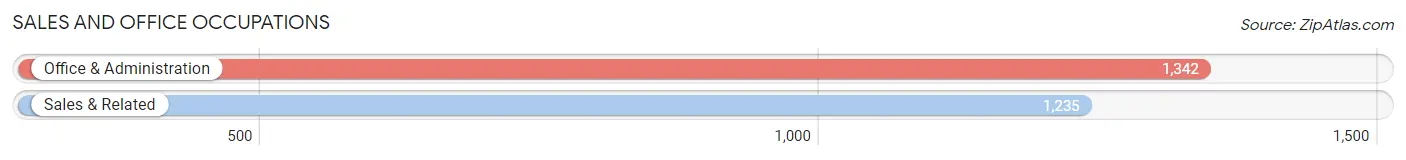
Sales and Office Occupations
The most common Sales and Office occupations in North Haven are Office & Administration (1,342 | 10.5%), and Sales & Related (1,235 | 9.6%).
Sales and Office Occupations by Sex
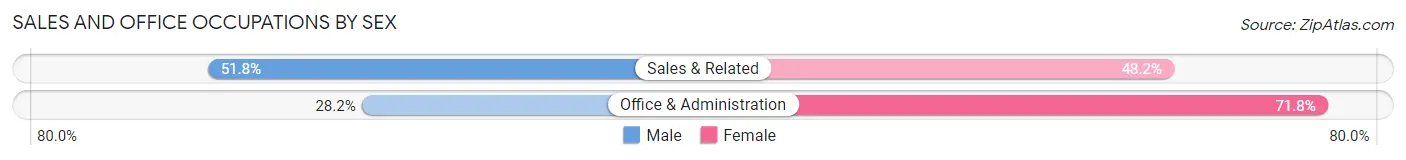
| Occupation | Male | Female |
| Sales & Related | 640 (51.8%) | 595 (48.2%) |
| Office & Administration | 378 (28.2%) | 964 (71.8%) |
| Total (Category) | 1,018 (39.5%) | 1,559 (60.5%) |
| Total (Overall) | 6,553 (51.1%) | 6,261 (48.9%) |
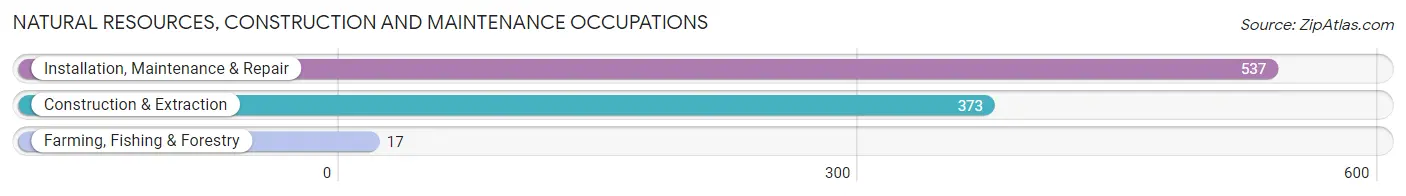
Natural Resources, Construction and Maintenance Occupations
The most common Natural Resources, Construction and Maintenance occupations in North Haven are Installation, Maintenance & Repair (537 | 4.2%), Construction & Extraction (373 | 2.9%), and Farming, Fishing & Forestry (17 | 0.1%).
Natural Resources, Construction and Maintenance Occupations by Sex
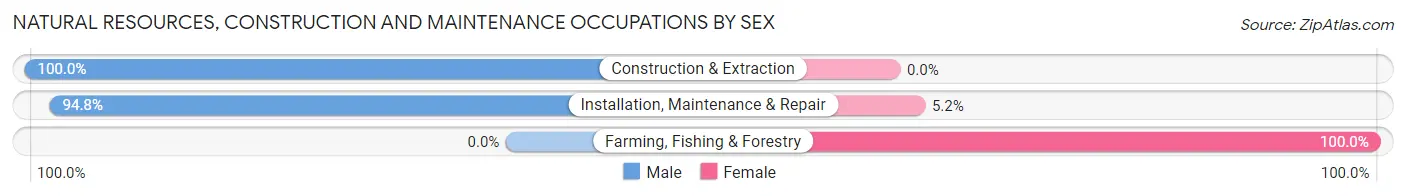
| Occupation | Male | Female |
| Farming, Fishing & Forestry | 0 (0.0%) | 17 (100.0%) |
| Construction & Extraction | 373 (100.0%) | 0 (0.0%) |
| Installation, Maintenance & Repair | 509 (94.8%) | 28 (5.2%) |
| Total (Category) | 882 (95.2%) | 45 (4.9%) |
| Total (Overall) | 6,553 (51.1%) | 6,261 (48.9%) |
Production, Transportation and Moving Occupations
The most common Production, Transportation and Moving occupations in North Haven are Production (528 | 4.1%), Transportation (440 | 3.4%), and Material Moving (192 | 1.5%).
Production, Transportation and Moving Occupations by Sex
| Occupation | Male | Female |
| Production | 286 (54.2%) | 242 (45.8%) |
| Transportation | 403 (91.6%) | 37 (8.4%) |
| Material Moving | 124 (64.6%) | 68 (35.4%) |
| Total (Category) | 813 (70.1%) | 347 (29.9%) |
| Total (Overall) | 6,553 (51.1%) | 6,261 (48.9%) |
Employment Industries by Sex in North Haven
Employment Industries in North Haven
The major employment industries in North Haven include Educational Services (2,602 | 20.3%), Health Care & Social Assistance (1,904 | 14.9%), Manufacturing (1,367 | 10.7%), Retail Trade (1,207 | 9.4%), and Public Administration (862 | 6.7%).
Employment Industries by Sex in North Haven
The North Haven industries that see more men than women are Construction (93.7%), Transportation & Warehousing (89.7%), and Wholesale Trade (81.0%), whereas the industries that tend to have a higher number of women are Agriculture, Fishing & Hunting (100.0%), Enterprise Management (100.0%), and Educational Services (72.1%).
| Industry | Male | Female |
| Agriculture, Fishing & Hunting | 0 (0.0%) | 17 (100.0%) |
| Mining, Quarrying, & Extraction | 0 (0.0%) | 0 (0.0%) |
| Construction | 401 (93.7%) | 27 (6.3%) |
| Manufacturing | 852 (62.3%) | 515 (37.7%) |
| Wholesale Trade | 98 (81.0%) | 23 (19.0%) |
| Retail Trade | 697 (57.8%) | 510 (42.2%) |
| Transportation & Warehousing | 436 (89.7%) | 50 (10.3%) |
| Utilities | 78 (47.8%) | 85 (52.1%) |
| Information | 73 (41.9%) | 101 (58.1%) |
| Finance & Insurance | 367 (49.1%) | 381 (50.9%) |
| Real Estate, Rental & Leasing | 227 (74.9%) | 76 (25.1%) |
| Professional & Scientific | 382 (49.9%) | 384 (50.1%) |
| Enterprise Management | 0 (0.0%) | 20 (100.0%) |
| Administrative & Support | 165 (63.0%) | 97 (37.0%) |
| Educational Services | 725 (27.9%) | 1,877 (72.1%) |
| Health Care & Social Assistance | 645 (33.9%) | 1,259 (66.1%) |
| Arts, Entertainment & Recreation | 63 (40.4%) | 93 (59.6%) |
| Accommodation & Food Services | 337 (60.6%) | 219 (39.4%) |
| Public Administration | 663 (76.9%) | 199 (23.1%) |
| Total | 6,553 (51.1%) | 6,261 (48.9%) |
Education in North Haven
School Enrollment in North Haven
The most common levels of schooling among the 5,333 students in North Haven are middle school (1,358 | 25.5%), high school (1,357 | 25.5%), and elementary school (1,152 | 21.6%).
| School Level | # Students | % Students |
| Nursery / Preschool | 255 | 4.8% |
| Kindergarten | 198 | 3.7% |
| Elementary School | 1,152 | 21.6% |
| Middle School | 1,358 | 25.5% |
| High School | 1,357 | 25.5% |
| College / Undergraduate | 799 | 15.0% |
| Graduate / Professional | 214 | 4.0% |
| Total | 5,333 | 100.0% |
School Enrollment by Age by Funding Source in North Haven
Out of a total of 5,333 students who are enrolled in schools in North Haven, 1,045 (19.6%) attend a private institution, while the remaining 4,288 (80.4%) are enrolled in public schools. The age group of 25 to 34 year olds has the highest likelihood of being enrolled in private schools, with 101 (54.6% in the age bracket) enrolled. Conversely, the age group of 5 to 9 year old has the lowest likelihood of being enrolled in a private school, with 977 (93.0% in the age bracket) attending a public institution.
| Age Bracket | Public School | Private School |
| 3 to 4 Year Olds | 161 (63.1%) | 94 (36.9%) |
| 5 to 9 Year Old | 977 (93.0%) | 73 (7.0%) |
| 10 to 14 Year Olds | 1,769 (90.9%) | 177 (9.1%) |
| 15 to 17 Year Olds | 738 (80.7%) | 176 (19.3%) |
| 18 to 19 Year Olds | 146 (53.3%) | 128 (46.7%) |
| 20 to 24 Year Olds | 271 (53.7%) | 234 (46.3%) |
| 25 to 34 Year Olds | 84 (45.4%) | 101 (54.6%) |
| 35 Years and over | 141 (69.1%) | 63 (30.9%) |
| Total | 4,288 (80.4%) | 1,045 (19.6%) |
Educational Attainment by Field of Study in North Haven
Business (1,711 | 19.5%), education (1,044 | 11.9%), social sciences (887 | 10.1%), science & technology (814 | 9.3%), and bio, nature & agricultural (649 | 7.4%) are the most common fields of study among 8,769 individuals in North Haven who have obtained a bachelor's degree or higher.
| Field of Study | # Graduates | % Graduates |
| Computers & Mathematics | 151 | 1.7% |
| Bio, Nature & Agricultural | 649 | 7.4% |
| Physical & Health Sciences | 272 | 3.1% |
| Psychology | 410 | 4.7% |
| Social Sciences | 887 | 10.1% |
| Engineering | 435 | 5.0% |
| Multidisciplinary Studies | 55 | 0.6% |
| Science & Technology | 814 | 9.3% |
| Business | 1,711 | 19.5% |
| Education | 1,044 | 11.9% |
| Literature & Languages | 514 | 5.9% |
| Liberal Arts & History | 534 | 6.1% |
| Visual & Performing Arts | 359 | 4.1% |
| Communications | 530 | 6.0% |
| Arts & Humanities | 404 | 4.6% |
| Total | 8,769 | 100.0% |
Transportation & Commute in North Haven
Vehicle Availability by Sex in North Haven
The most prevalent vehicle ownership categories in North Haven are males with 2 vehicles (3,676, accounting for 56.7%) and females with 2 vehicles (3,156, making up 59.0%).
| Vehicles Available | Male | Female |
| No Vehicle | 60 (0.9%) | 98 (1.6%) |
| 1 Vehicle | 663 (10.2%) | 1,119 (18.0%) |
| 2 Vehicles | 3,676 (56.7%) | 3,156 (50.6%) |
| 3 Vehicles | 1,386 (21.4%) | 1,084 (17.4%) |
| 4 Vehicles | 340 (5.2%) | 326 (5.2%) |
| 5 or more Vehicles | 357 (5.5%) | 448 (7.2%) |
| Total | 6,482 (100.0%) | 6,231 (100.0%) |
Commute Time in North Haven
The most frequently occuring commute durations in North Haven are 15 to 19 minutes (2,784 commuters, 24.4%), 20 to 24 minutes (2,183 commuters, 19.1%), and 10 to 14 minutes (1,786 commuters, 15.7%).
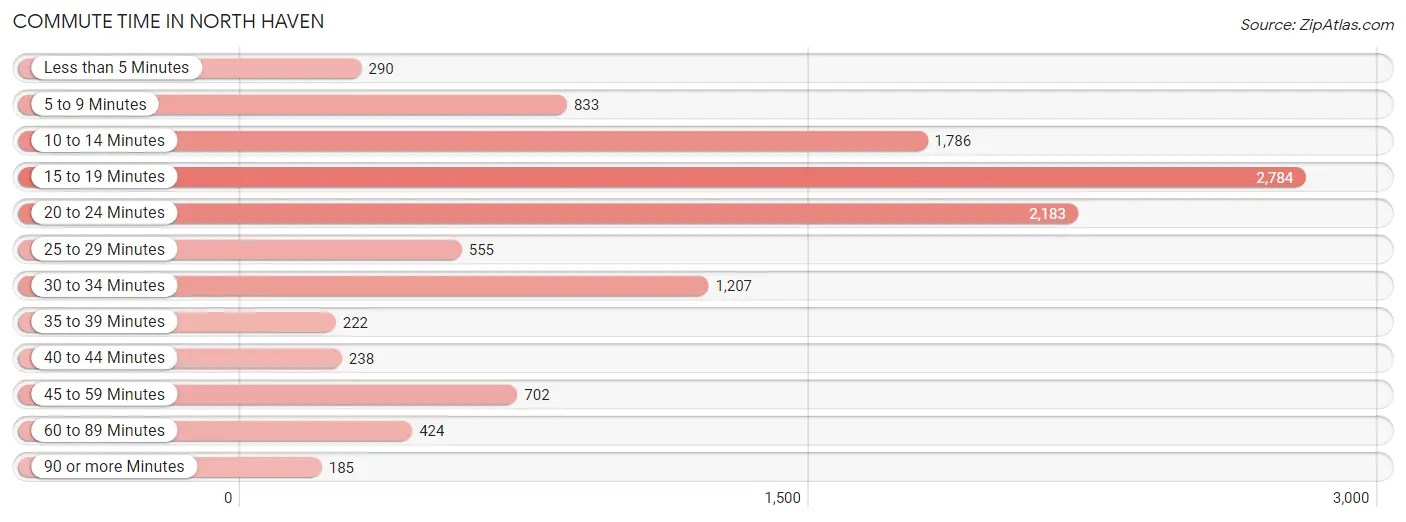
| Commute Time | # Commuters | % Commuters |
| Less than 5 Minutes | 290 | 2.5% |
| 5 to 9 Minutes | 833 | 7.3% |
| 10 to 14 Minutes | 1,786 | 15.7% |
| 15 to 19 Minutes | 2,784 | 24.4% |
| 20 to 24 Minutes | 2,183 | 19.1% |
| 25 to 29 Minutes | 555 | 4.9% |
| 30 to 34 Minutes | 1,207 | 10.6% |
| 35 to 39 Minutes | 222 | 1.9% |
| 40 to 44 Minutes | 238 | 2.1% |
| 45 to 59 Minutes | 702 | 6.1% |
| 60 to 89 Minutes | 424 | 3.7% |
| 90 or more Minutes | 185 | 1.6% |
Commute Time by Sex in North Haven
The most common commute times in North Haven are 15 to 19 minutes (1,527 commuters, 26.1%) for males and 15 to 19 minutes (1,257 commuters, 22.6%) for females.
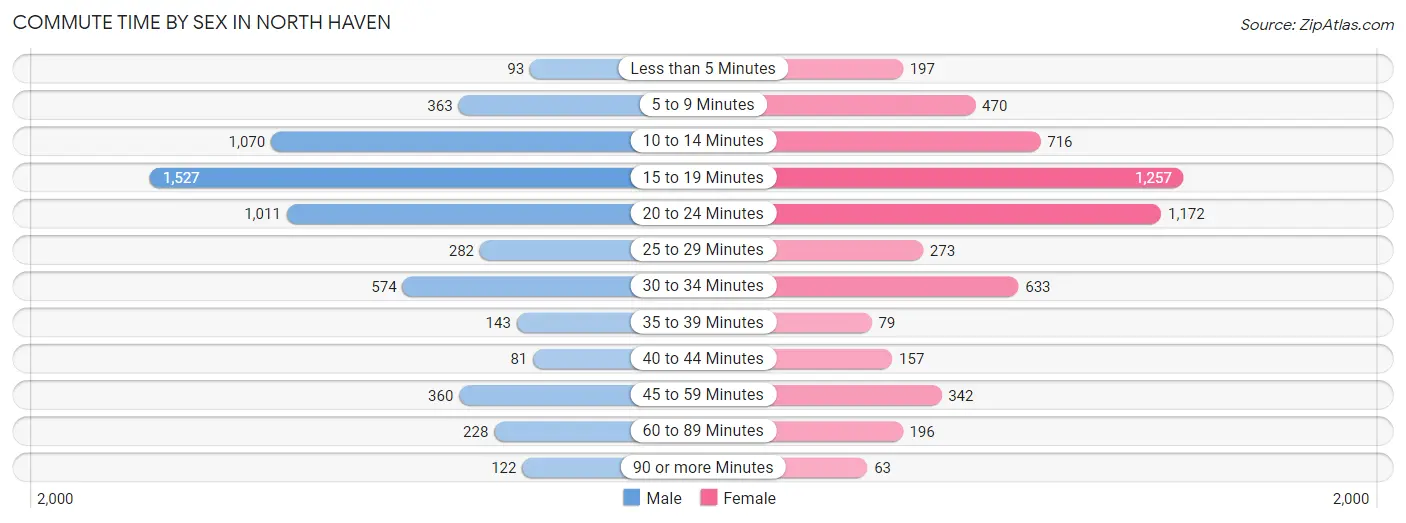
| Commute Time | Male | Female |
| Less than 5 Minutes | 93 (1.6%) | 197 (3.5%) |
| 5 to 9 Minutes | 363 (6.2%) | 470 (8.5%) |
| 10 to 14 Minutes | 1,070 (18.3%) | 716 (12.9%) |
| 15 to 19 Minutes | 1,527 (26.1%) | 1,257 (22.6%) |
| 20 to 24 Minutes | 1,011 (17.3%) | 1,172 (21.1%) |
| 25 to 29 Minutes | 282 (4.8%) | 273 (4.9%) |
| 30 to 34 Minutes | 574 (9.8%) | 633 (11.4%) |
| 35 to 39 Minutes | 143 (2.4%) | 79 (1.4%) |
| 40 to 44 Minutes | 81 (1.4%) | 157 (2.8%) |
| 45 to 59 Minutes | 360 (6.1%) | 342 (6.2%) |
| 60 to 89 Minutes | 228 (3.9%) | 196 (3.5%) |
| 90 or more Minutes | 122 (2.1%) | 63 (1.1%) |
Time of Departure to Work by Sex in North Haven
The most frequent times of departure to work in North Haven are 7:00 AM to 7:29 AM (930, 15.9%) for males and 8:00 AM to 8:29 AM (904, 16.3%) for females.
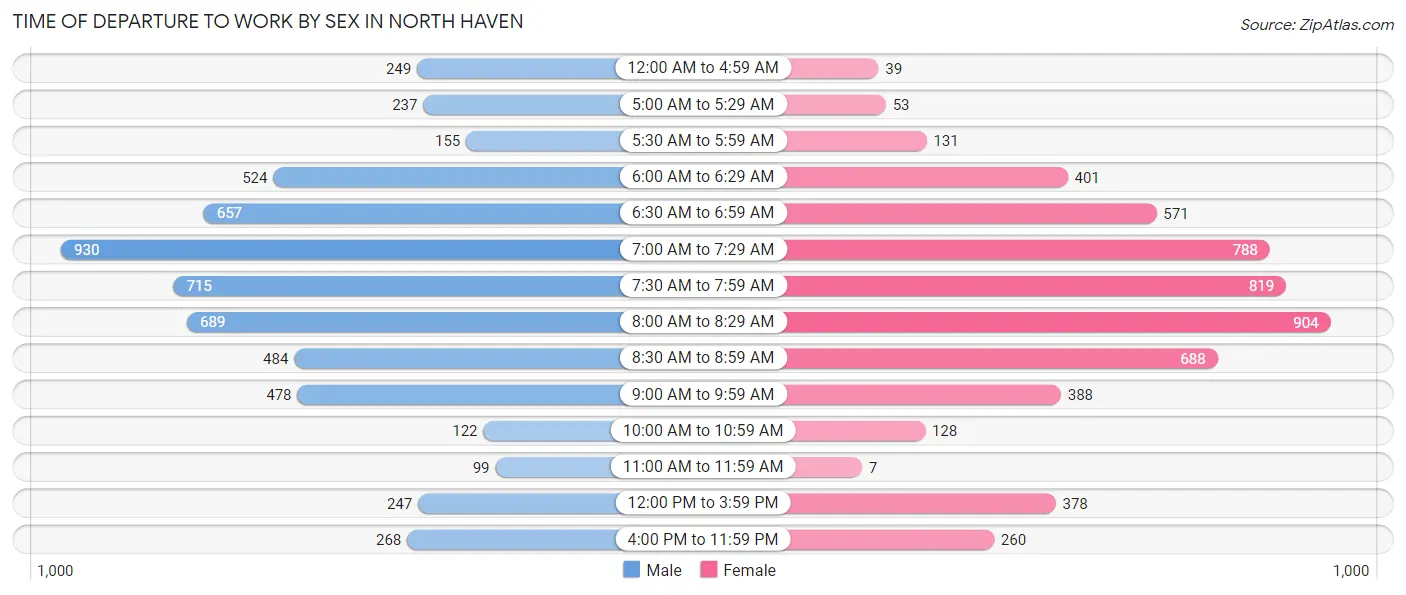
| Time of Departure | Male | Female |
| 12:00 AM to 4:59 AM | 249 (4.3%) | 39 (0.7%) |
| 5:00 AM to 5:29 AM | 237 (4.1%) | 53 (0.9%) |
| 5:30 AM to 5:59 AM | 155 (2.6%) | 131 (2.4%) |
| 6:00 AM to 6:29 AM | 524 (8.9%) | 401 (7.2%) |
| 6:30 AM to 6:59 AM | 657 (11.2%) | 571 (10.3%) |
| 7:00 AM to 7:29 AM | 930 (15.9%) | 788 (14.2%) |
| 7:30 AM to 7:59 AM | 715 (12.2%) | 819 (14.7%) |
| 8:00 AM to 8:29 AM | 689 (11.8%) | 904 (16.3%) |
| 8:30 AM to 8:59 AM | 484 (8.3%) | 688 (12.4%) |
| 9:00 AM to 9:59 AM | 478 (8.2%) | 388 (7.0%) |
| 10:00 AM to 10:59 AM | 122 (2.1%) | 128 (2.3%) |
| 11:00 AM to 11:59 AM | 99 (1.7%) | 7 (0.1%) |
| 12:00 PM to 3:59 PM | 247 (4.2%) | 378 (6.8%) |
| 4:00 PM to 11:59 PM | 268 (4.6%) | 260 (4.7%) |
| Total | 5,854 (100.0%) | 5,555 (100.0%) |
Housing Occupancy in North Haven
Occupancy by Ownership in North Haven
Of the total 9,559 dwellings in North Haven, owner-occupied units account for 7,887 (82.5%), while renter-occupied units make up 1,672 (17.5%).
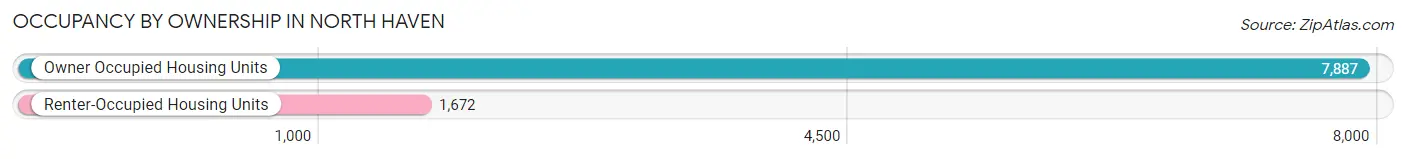
| Occupancy | # Housing Units | % Housing Units |
| Owner Occupied Housing Units | 7,887 | 82.5% |
| Renter-Occupied Housing Units | 1,672 | 17.5% |
| Total Occupied Housing Units | 9,559 | 100.0% |
Occupancy by Household Size in North Haven
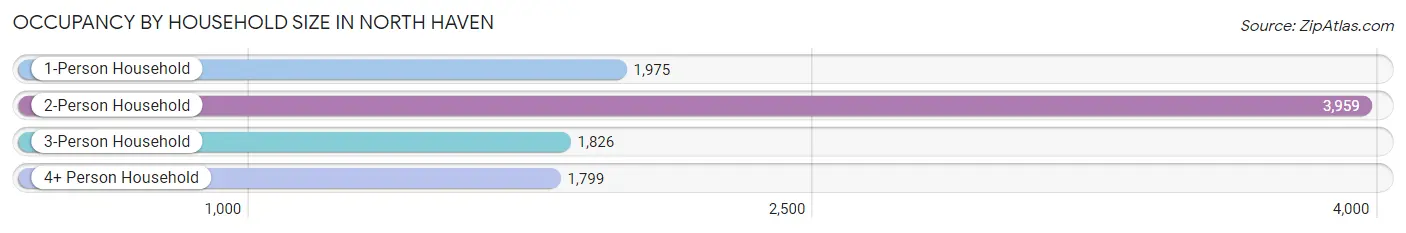
| Household Size | # Housing Units | % Housing Units |
| 1-Person Household | 1,975 | 20.7% |
| 2-Person Household | 3,959 | 41.4% |
| 3-Person Household | 1,826 | 19.1% |
| 4+ Person Household | 1,799 | 18.8% |
| Total Housing Units | 9,559 | 100.0% |
Occupancy by Ownership by Household Size in North Haven
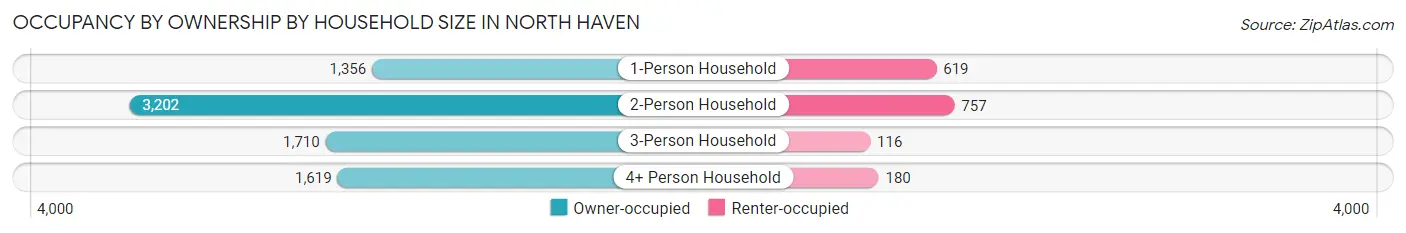
| Household Size | Owner-occupied | Renter-occupied |
| 1-Person Household | 1,356 (68.7%) | 619 (31.3%) |
| 2-Person Household | 3,202 (80.9%) | 757 (19.1%) |
| 3-Person Household | 1,710 (93.6%) | 116 (6.4%) |
| 4+ Person Household | 1,619 (90.0%) | 180 (10.0%) |
| Total Housing Units | 7,887 (82.5%) | 1,672 (17.5%) |
Occupancy by Educational Attainment in North Haven
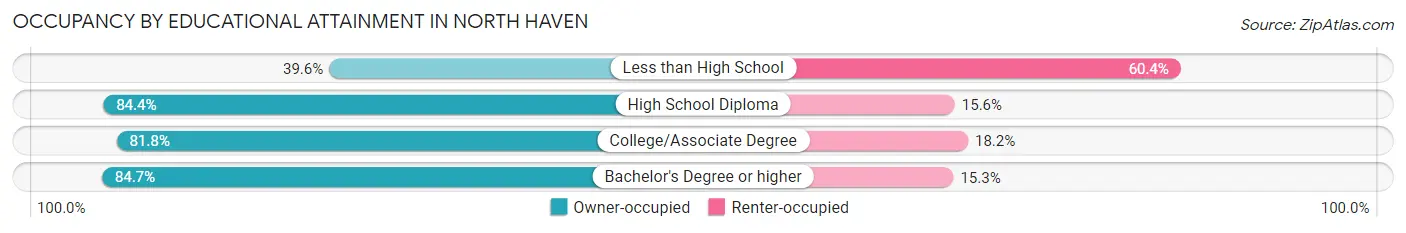
| Household Size | Owner-occupied | Renter-occupied |
| Less than High School | 128 (39.6%) | 195 (60.4%) |
| High School Diploma | 1,932 (84.4%) | 357 (15.6%) |
| College/Associate Degree | 1,562 (81.8%) | 348 (18.2%) |
| Bachelor's Degree or higher | 4,265 (84.7%) | 772 (15.3%) |
Occupancy by Age of Householder in North Haven
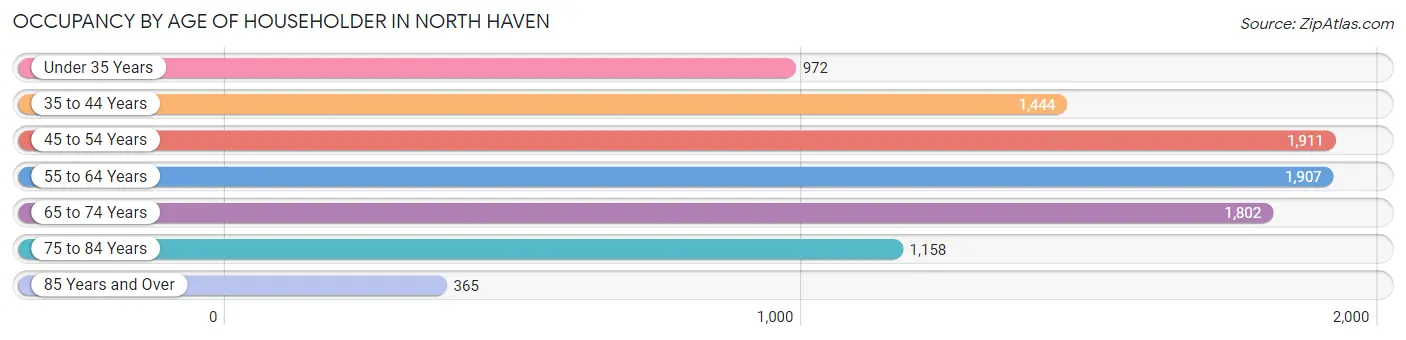
| Age Bracket | # Households | % Households |
| Under 35 Years | 972 | 10.2% |
| 35 to 44 Years | 1,444 | 15.1% |
| 45 to 54 Years | 1,911 | 20.0% |
| 55 to 64 Years | 1,907 | 20.0% |
| 65 to 74 Years | 1,802 | 18.9% |
| 75 to 84 Years | 1,158 | 12.1% |
| 85 Years and Over | 365 | 3.8% |
| Total | 9,559 | 100.0% |
Housing Finances in North Haven
Median Income by Occupancy in North Haven
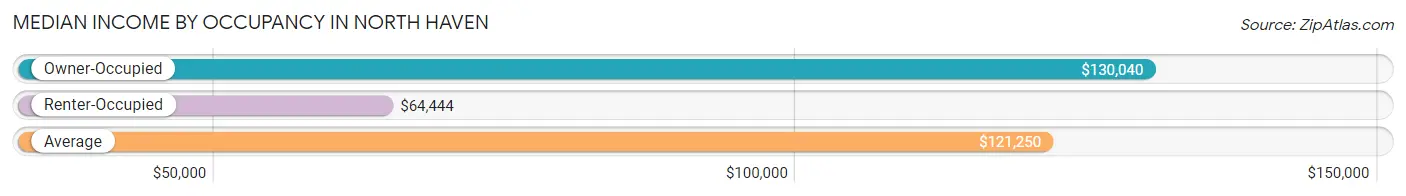
| Occupancy Type | # Households | Median Income |
| Owner-Occupied | 7,887 (82.5%) | $130,040 |
| Renter-Occupied | 1,672 (17.5%) | $64,444 |
| Average | 9,559 (100.0%) | $121,250 |
Occupancy by Householder Income Bracket in North Haven
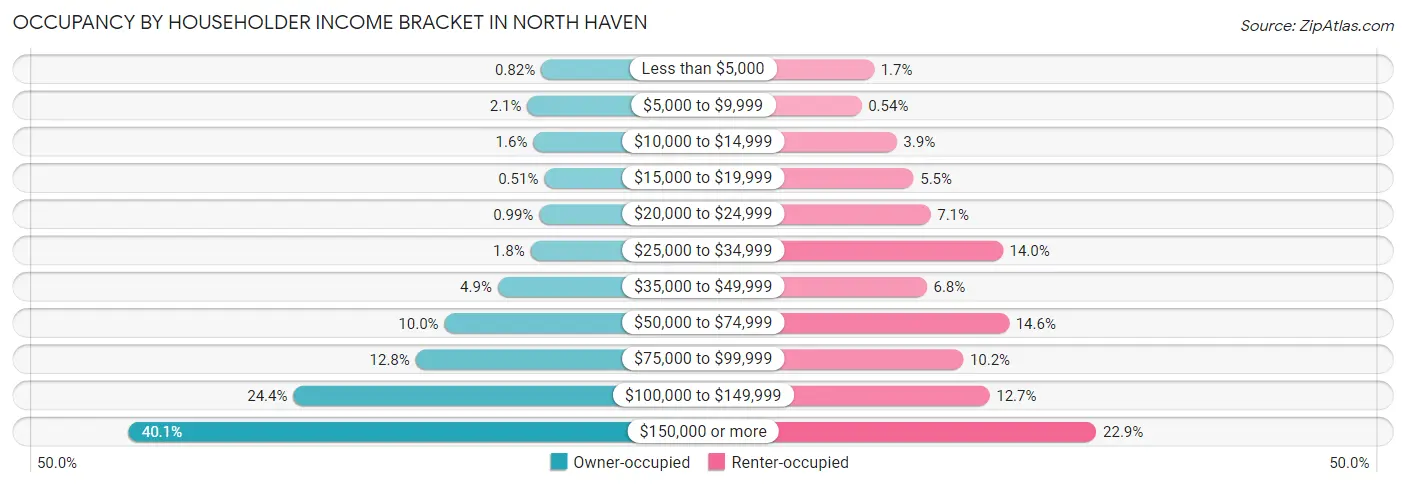
| Income Bracket | Owner-occupied | Renter-occupied |
| Less than $5,000 | 65 (0.8%) | 29 (1.7%) |
| $5,000 to $9,999 | 167 (2.1%) | 9 (0.5%) |
| $10,000 to $14,999 | 123 (1.6%) | 65 (3.9%) |
| $15,000 to $19,999 | 40 (0.5%) | 92 (5.5%) |
| $20,000 to $24,999 | 78 (1.0%) | 119 (7.1%) |
| $25,000 to $34,999 | 143 (1.8%) | 234 (14.0%) |
| $35,000 to $49,999 | 390 (4.9%) | 113 (6.8%) |
| $50,000 to $74,999 | 790 (10.0%) | 244 (14.6%) |
| $75,000 to $99,999 | 1,006 (12.8%) | 171 (10.2%) |
| $100,000 to $149,999 | 1,925 (24.4%) | 213 (12.7%) |
| $150,000 or more | 3,160 (40.1%) | 383 (22.9%) |
| Total | 7,887 (100.0%) | 1,672 (100.0%) |
Monthly Housing Cost Tiers in North Haven
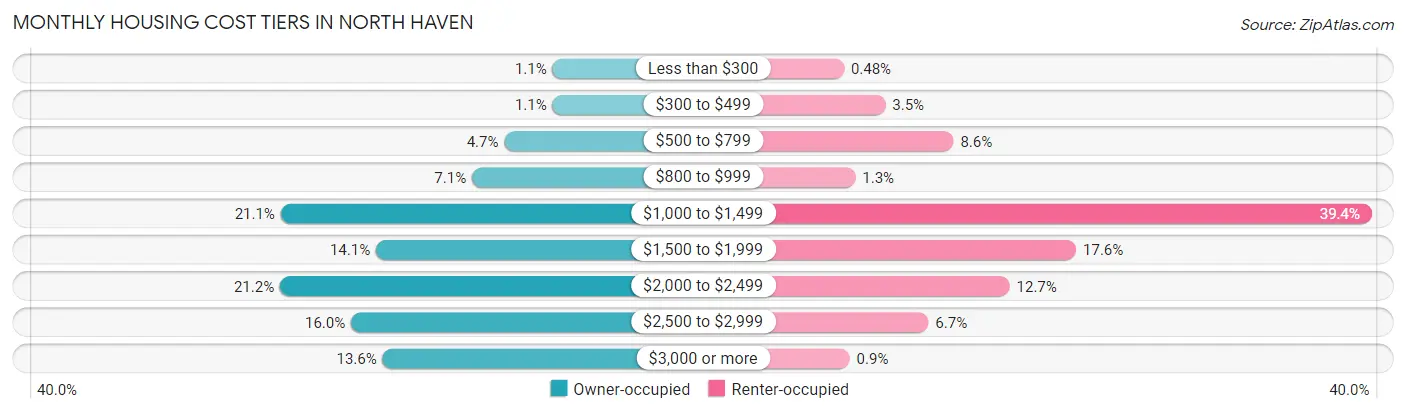
| Monthly Cost | Owner-occupied | Renter-occupied |
| Less than $300 | 88 (1.1%) | 8 (0.5%) |
| $300 to $499 | 88 (1.1%) | 59 (3.5%) |
| $500 to $799 | 368 (4.7%) | 143 (8.6%) |
| $800 to $999 | 556 (7.0%) | 22 (1.3%) |
| $1,000 to $1,499 | 1,667 (21.1%) | 658 (39.4%) |
| $1,500 to $1,999 | 1,114 (14.1%) | 294 (17.6%) |
| $2,000 to $2,499 | 1,671 (21.2%) | 212 (12.7%) |
| $2,500 to $2,999 | 1,259 (16.0%) | 112 (6.7%) |
| $3,000 or more | 1,076 (13.6%) | 15 (0.9%) |
| Total | 7,887 (100.0%) | 1,672 (100.0%) |
Physical Housing Characteristics in North Haven
Housing Structures in North Haven
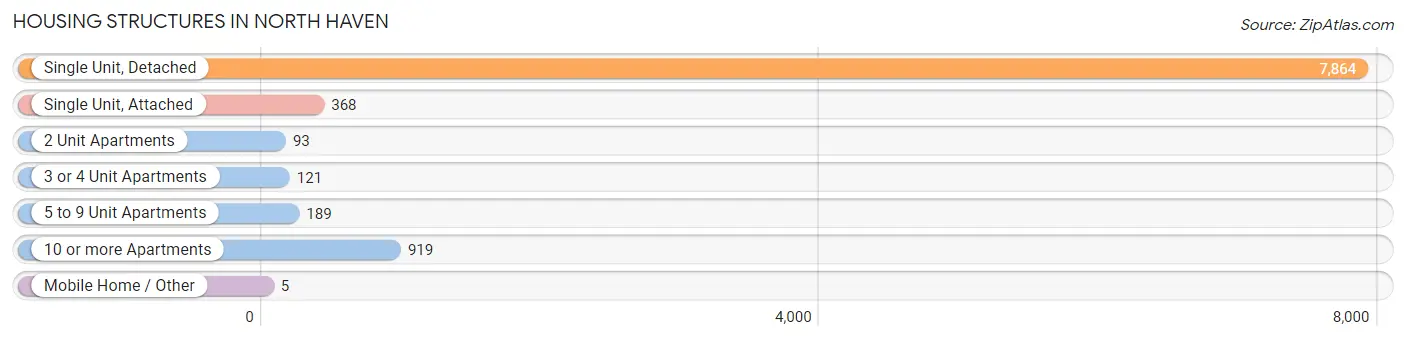
| Structure Type | # Housing Units | % Housing Units |
| Single Unit, Detached | 7,864 | 82.3% |
| Single Unit, Attached | 368 | 3.8% |
| 2 Unit Apartments | 93 | 1.0% |
| 3 or 4 Unit Apartments | 121 | 1.3% |
| 5 to 9 Unit Apartments | 189 | 2.0% |
| 10 or more Apartments | 919 | 9.6% |
| Mobile Home / Other | 5 | 0.1% |
| Total | 9,559 | 100.0% |
Housing Structures by Occupancy in North Haven
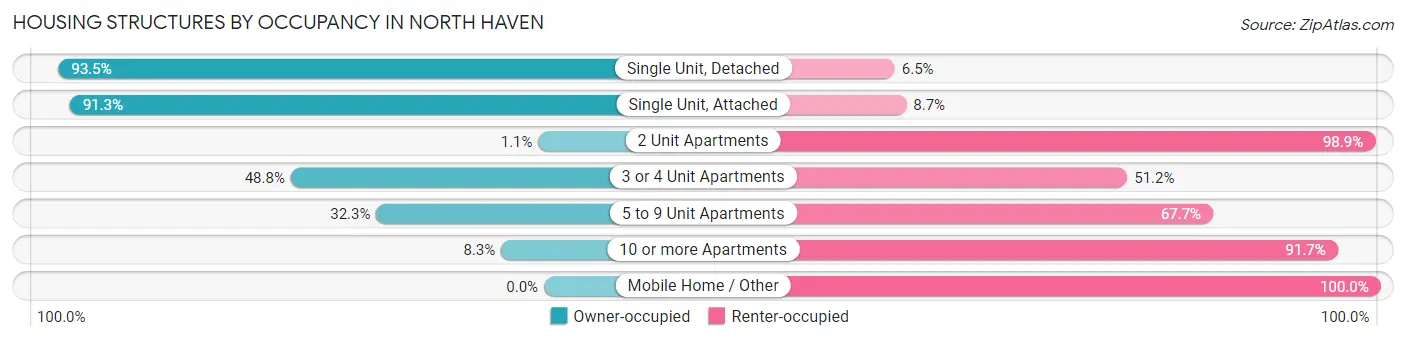
| Structure Type | Owner-occupied | Renter-occupied |
| Single Unit, Detached | 7,354 (93.5%) | 510 (6.5%) |
| Single Unit, Attached | 336 (91.3%) | 32 (8.7%) |
| 2 Unit Apartments | 1 (1.1%) | 92 (98.9%) |
| 3 or 4 Unit Apartments | 59 (48.8%) | 62 (51.2%) |
| 5 to 9 Unit Apartments | 61 (32.3%) | 128 (67.7%) |
| 10 or more Apartments | 76 (8.3%) | 843 (91.7%) |
| Mobile Home / Other | 0 (0.0%) | 5 (100.0%) |
| Total | 7,887 (82.5%) | 1,672 (17.5%) |
Housing Structures by Number of Rooms in North Haven
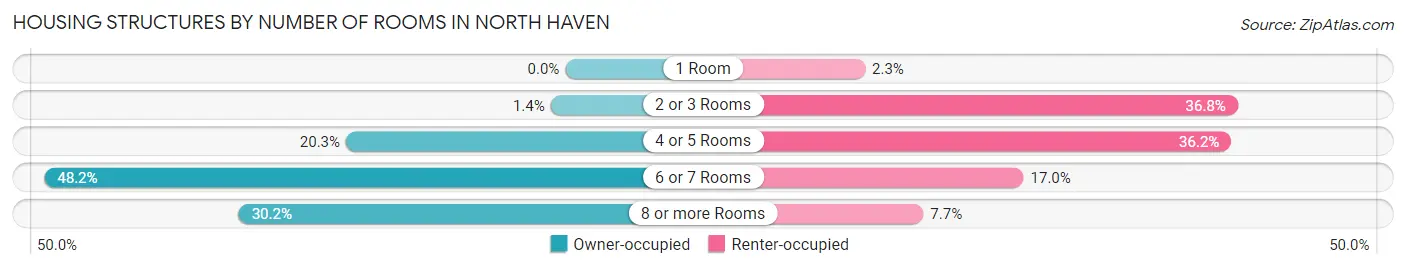
| Number of Rooms | Owner-occupied | Renter-occupied |
| 1 Room | 0 (0.0%) | 39 (2.3%) |
| 2 or 3 Rooms | 107 (1.4%) | 615 (36.8%) |
| 4 or 5 Rooms | 1,600 (20.3%) | 605 (36.2%) |
| 6 or 7 Rooms | 3,799 (48.2%) | 284 (17.0%) |
| 8 or more Rooms | 2,381 (30.2%) | 129 (7.7%) |
| Total | 7,887 (100.0%) | 1,672 (100.0%) |
Housing Structure by Heating Type in North Haven
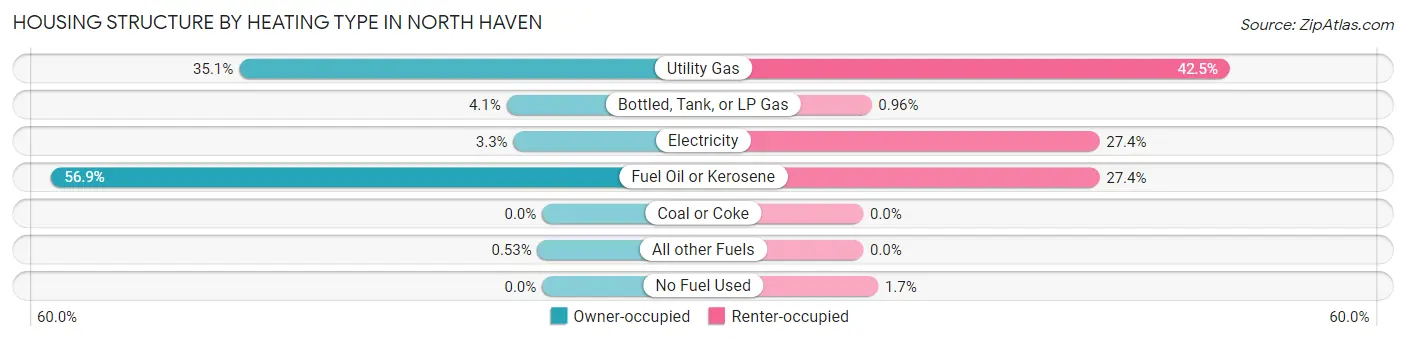
| Heating Type | Owner-occupied | Renter-occupied |
| Utility Gas | 2,771 (35.1%) | 711 (42.5%) |
| Bottled, Tank, or LP Gas | 325 (4.1%) | 16 (1.0%) |
| Electricity | 262 (3.3%) | 458 (27.4%) |
| Fuel Oil or Kerosene | 4,487 (56.9%) | 458 (27.4%) |
| Coal or Coke | 0 (0.0%) | 0 (0.0%) |
| All other Fuels | 42 (0.5%) | 0 (0.0%) |
| No Fuel Used | 0 (0.0%) | 29 (1.7%) |
| Total | 7,887 (100.0%) | 1,672 (100.0%) |
Household Vehicle Usage in North Haven
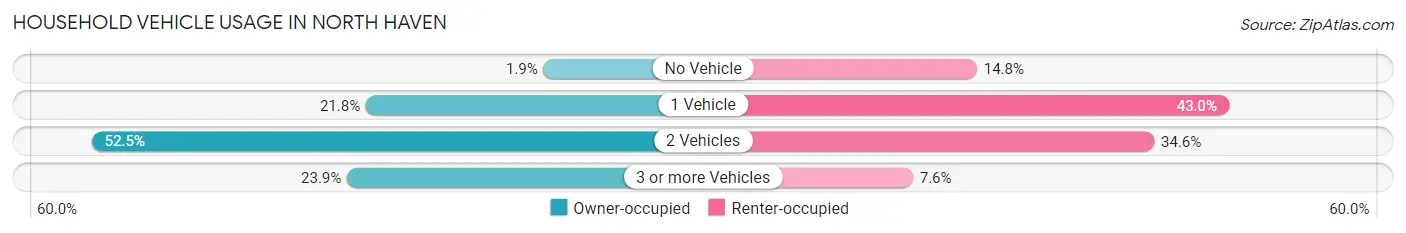
| Vehicles per Household | Owner-occupied | Renter-occupied |
| No Vehicle | 147 (1.9%) | 247 (14.8%) |
| 1 Vehicle | 1,716 (21.8%) | 719 (43.0%) |
| 2 Vehicles | 4,141 (52.5%) | 579 (34.6%) |
| 3 or more Vehicles | 1,883 (23.9%) | 127 (7.6%) |
| Total | 7,887 (100.0%) | 1,672 (100.0%) |
Real Estate & Mortgages in North Haven
Real Estate and Mortgage Overview in North Haven
| Characteristic | Without Mortgage | With Mortgage |
| Housing Units | 2,524 | 5,363 |
| Median Property Value | $346,200 | $343,700 |
| Median Household Income | $103,516 | $2,316 |
| Monthly Housing Costs | $1,082 | $1,076 |
| Real Estate Taxes | $6,788 | $0 |
Property Value by Mortgage Status in North Haven
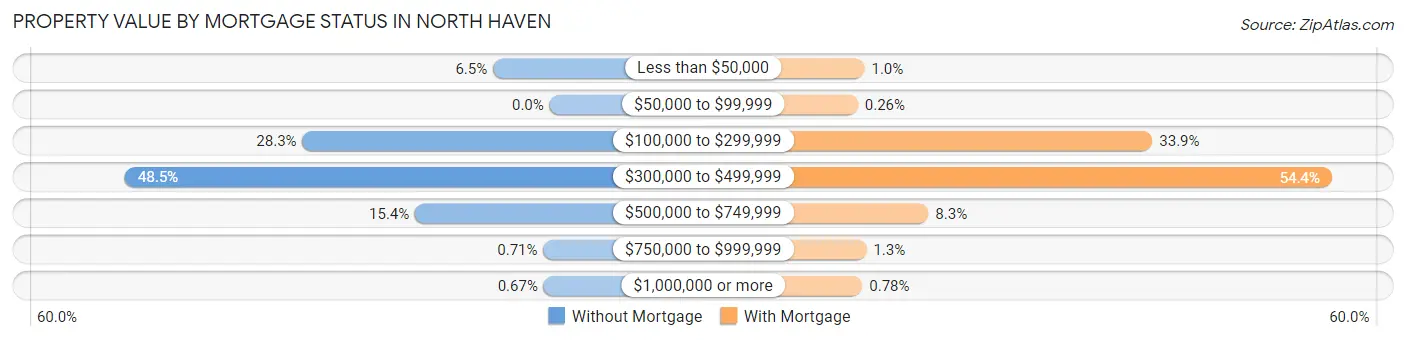
| Property Value | Without Mortgage | With Mortgage |
| Less than $50,000 | 163 (6.5%) | 55 (1.0%) |
| $50,000 to $99,999 | 0 (0.0%) | 14 (0.3%) |
| $100,000 to $299,999 | 713 (28.2%) | 1,819 (33.9%) |
| $300,000 to $499,999 | 1,225 (48.5%) | 2,919 (54.4%) |
| $500,000 to $749,999 | 388 (15.4%) | 447 (8.3%) |
| $750,000 to $999,999 | 18 (0.7%) | 67 (1.3%) |
| $1,000,000 or more | 17 (0.7%) | 42 (0.8%) |
| Total | 2,524 (100.0%) | 5,363 (100.0%) |
Household Income by Mortgage Status in North Haven
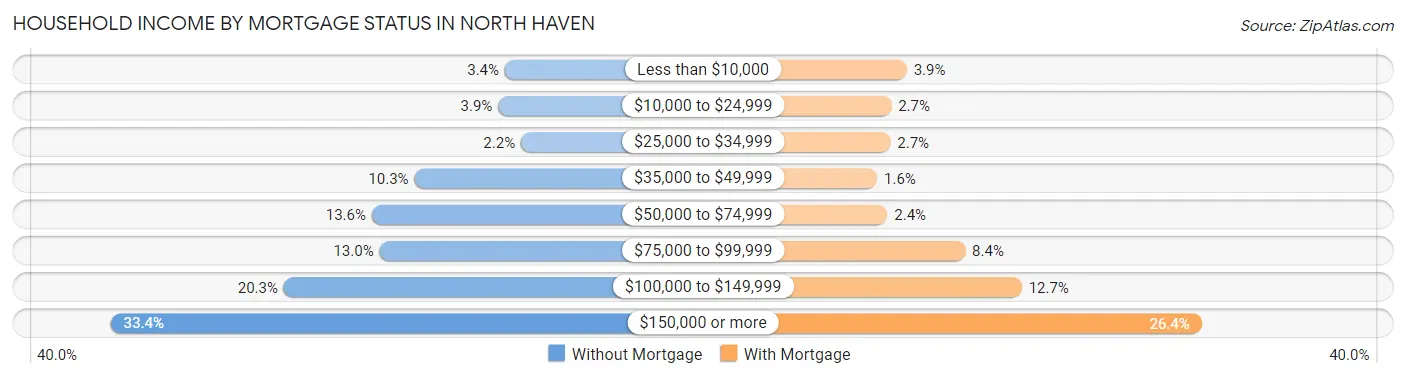
| Household Income | Without Mortgage | With Mortgage |
| Less than $10,000 | 86 (3.4%) | 209 (3.9%) |
| $10,000 to $24,999 | 99 (3.9%) | 146 (2.7%) |
| $25,000 to $34,999 | 55 (2.2%) | 142 (2.6%) |
| $35,000 to $49,999 | 260 (10.3%) | 88 (1.6%) |
| $50,000 to $74,999 | 342 (13.6%) | 130 (2.4%) |
| $75,000 to $99,999 | 327 (13.0%) | 448 (8.4%) |
| $100,000 to $149,999 | 511 (20.3%) | 679 (12.7%) |
| $150,000 or more | 844 (33.4%) | 1,414 (26.4%) |
| Total | 2,524 (100.0%) | 5,363 (100.0%) |
Property Value to Household Income Ratio in North Haven
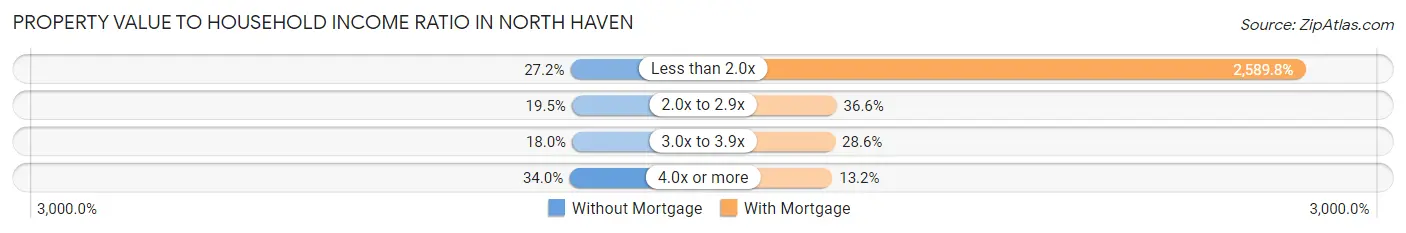
| Value-to-Income Ratio | Without Mortgage | With Mortgage |
| Less than 2.0x | 687 (27.2%) | 138,893 (2,589.8%) |
| 2.0x to 2.9x | 492 (19.5%) | 1,961 (36.6%) |
| 3.0x to 3.9x | 453 (17.9%) | 1,535 (28.6%) |
| 4.0x or more | 859 (34.0%) | 707 (13.2%) |
| Total | 2,524 (100.0%) | 5,363 (100.0%) |
Real Estate Taxes by Mortgage Status in North Haven
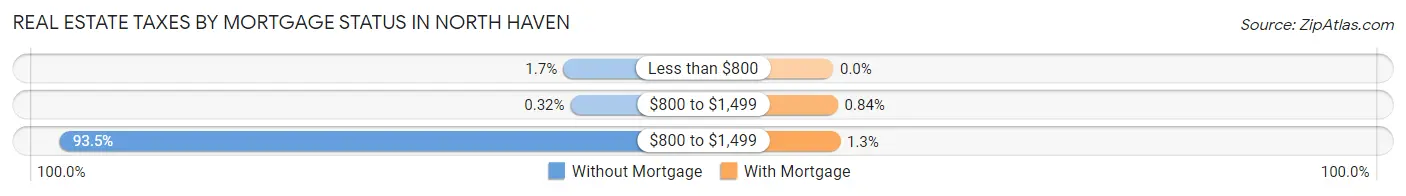
| Property Taxes | Without Mortgage | With Mortgage |
| Less than $800 | 42 (1.7%) | 0 (0.0%) |
| $800 to $1,499 | 8 (0.3%) | 45 (0.8%) |
| $800 to $1,499 | 2,361 (93.5%) | 68 (1.3%) |
| Total | 2,524 (100.0%) | 5,363 (100.0%) |
Health & Disability in North Haven
Health Insurance Coverage by Age in North Haven
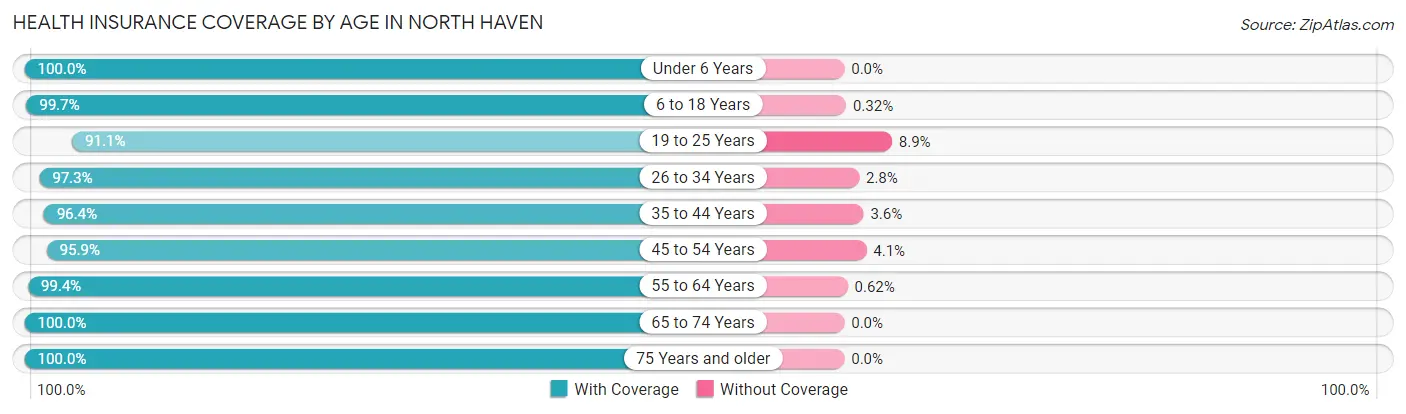
| Age Bracket | With Coverage | Without Coverage |
| Under 6 Years | 1,033 (100.0%) | 0 (0.0%) |
| 6 to 18 Years | 4,062 (99.7%) | 13 (0.3%) |
| 19 to 25 Years | 1,335 (91.1%) | 130 (8.9%) |
| 26 to 34 Years | 1,839 (97.3%) | 52 (2.8%) |
| 35 to 44 Years | 3,107 (96.4%) | 115 (3.6%) |
| 45 to 54 Years | 3,335 (95.9%) | 143 (4.1%) |
| 55 to 64 Years | 3,393 (99.4%) | 21 (0.6%) |
| 65 to 74 Years | 2,936 (100.0%) | 0 (0.0%) |
| 75 Years and older | 2,559 (100.0%) | 0 (0.0%) |
| Total | 23,599 (98.0%) | 474 (2.0%) |
Health Insurance Coverage by Citizenship Status in North Haven
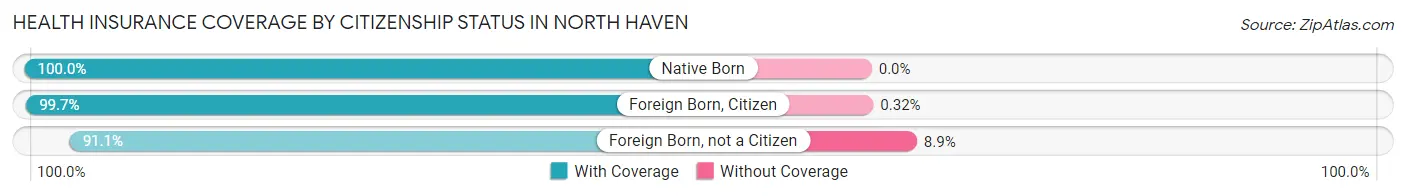
| Citizenship Status | With Coverage | Without Coverage |
| Native Born | 1,033 (100.0%) | 0 (0.0%) |
| Foreign Born, Citizen | 4,062 (99.7%) | 13 (0.3%) |
| Foreign Born, not a Citizen | 1,335 (91.1%) | 130 (8.9%) |
Health Insurance Coverage by Household Income in North Haven
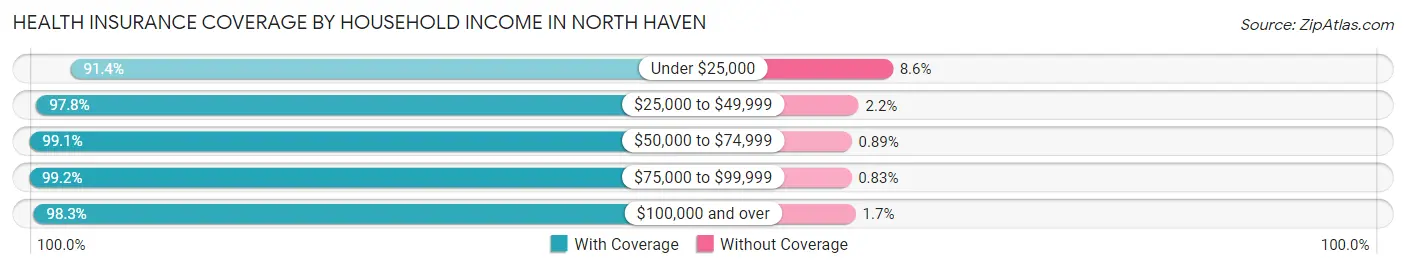
| Household Income | With Coverage | Without Coverage |
| Under $25,000 | 1,369 (91.4%) | 129 (8.6%) |
| $25,000 to $49,999 | 1,458 (97.8%) | 33 (2.2%) |
| $50,000 to $74,999 | 1,998 (99.1%) | 18 (0.9%) |
| $75,000 to $99,999 | 2,498 (99.2%) | 21 (0.8%) |
| $100,000 and over | 16,186 (98.3%) | 273 (1.7%) |
Public vs Private Health Insurance Coverage by Age in North Haven
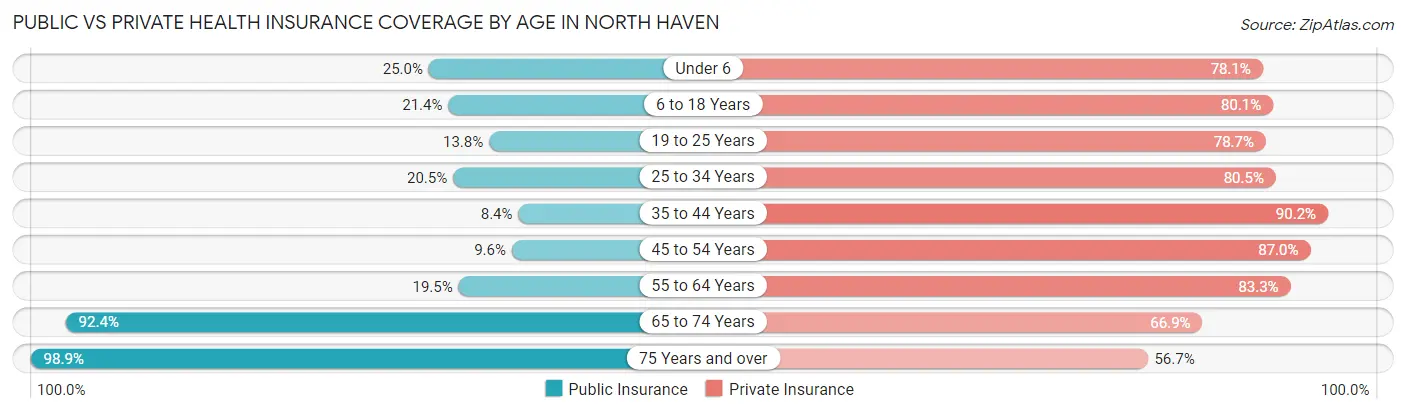
| Age Bracket | Public Insurance | Private Insurance |
| Under 6 | 258 (25.0%) | 807 (78.1%) |
| 6 to 18 Years | 870 (21.3%) | 3,262 (80.0%) |
| 19 to 25 Years | 202 (13.8%) | 1,153 (78.7%) |
| 25 to 34 Years | 387 (20.5%) | 1,523 (80.5%) |
| 35 to 44 Years | 269 (8.4%) | 2,907 (90.2%) |
| 45 to 54 Years | 333 (9.6%) | 3,024 (87.0%) |
| 55 to 64 Years | 664 (19.5%) | 2,843 (83.3%) |
| 65 to 74 Years | 2,712 (92.4%) | 1,965 (66.9%) |
| 75 Years and over | 2,530 (98.9%) | 1,452 (56.7%) |
| Total | 8,225 (34.2%) | 18,936 (78.7%) |
Disability Status by Sex by Age in North Haven
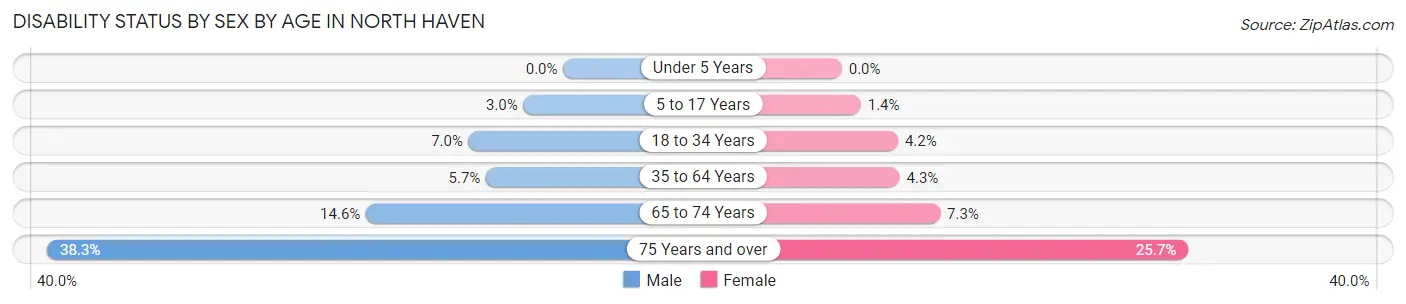
| Age Bracket | Male | Female |
| Under 5 Years | 0 (0.0%) | 0 (0.0%) |
| 5 to 17 Years | 66 (2.9%) | 25 (1.4%) |
| 18 to 34 Years | 127 (7.0%) | 71 (4.2%) |
| 35 to 64 Years | 295 (5.7%) | 213 (4.3%) |
| 65 to 74 Years | 179 (14.6%) | 125 (7.3%) |
| 75 Years and over | 432 (38.3%) | 368 (25.7%) |
Disability Class by Sex by Age in North Haven
Disability Class: Hearing Difficulty
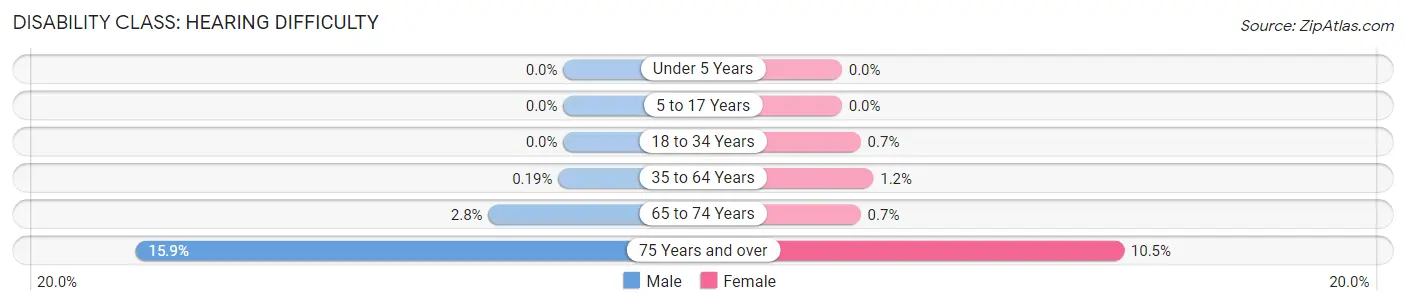
| Age Bracket | Male | Female |
| Under 5 Years | 0 (0.0%) | 0 (0.0%) |
| 5 to 17 Years | 0 (0.0%) | 0 (0.0%) |
| 18 to 34 Years | 0 (0.0%) | 12 (0.7%) |
| 35 to 64 Years | 10 (0.2%) | 58 (1.2%) |
| 65 to 74 Years | 34 (2.8%) | 12 (0.7%) |
| 75 Years and over | 179 (15.9%) | 150 (10.5%) |
Disability Class: Vision Difficulty
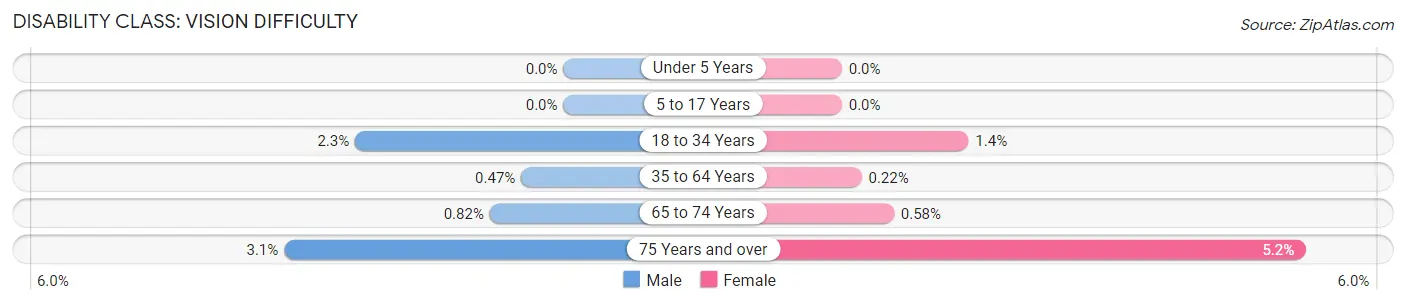
| Age Bracket | Male | Female |
| Under 5 Years | 0 (0.0%) | 0 (0.0%) |
| 5 to 17 Years | 0 (0.0%) | 0 (0.0%) |
| 18 to 34 Years | 42 (2.3%) | 24 (1.4%) |
| 35 to 64 Years | 24 (0.5%) | 11 (0.2%) |
| 65 to 74 Years | 10 (0.8%) | 10 (0.6%) |
| 75 Years and over | 35 (3.1%) | 74 (5.2%) |
Disability Class: Cognitive Difficulty
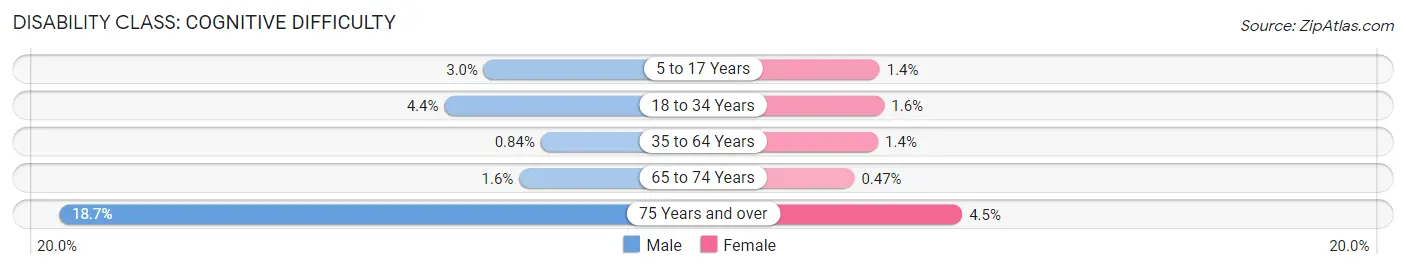
| Age Bracket | Male | Female |
| 5 to 17 Years | 66 (2.9%) | 25 (1.4%) |
| 18 to 34 Years | 80 (4.4%) | 27 (1.6%) |
| 35 to 64 Years | 43 (0.8%) | 67 (1.3%) |
| 65 to 74 Years | 20 (1.6%) | 8 (0.5%) |
| 75 Years and over | 211 (18.7%) | 64 (4.5%) |
Disability Class: Ambulatory Difficulty
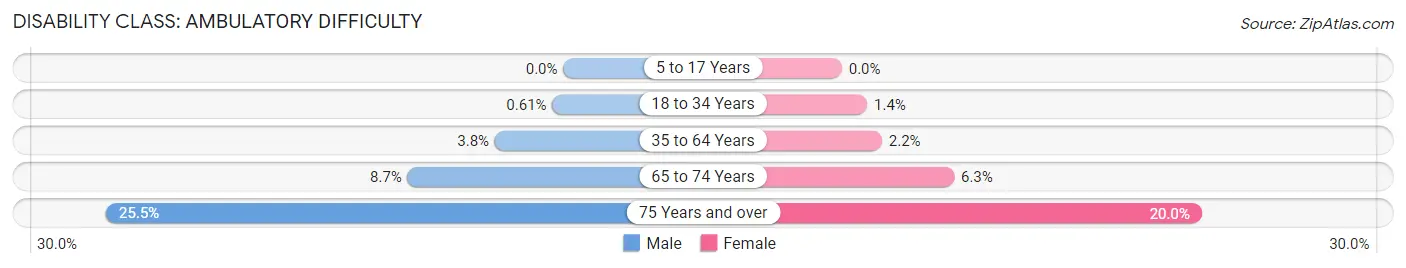
| Age Bracket | Male | Female |
| 5 to 17 Years | 0 (0.0%) | 0 (0.0%) |
| 18 to 34 Years | 11 (0.6%) | 24 (1.4%) |
| 35 to 64 Years | 196 (3.8%) | 111 (2.2%) |
| 65 to 74 Years | 106 (8.7%) | 107 (6.2%) |
| 75 Years and over | 287 (25.5%) | 287 (20.0%) |
Disability Class: Self-Care Difficulty
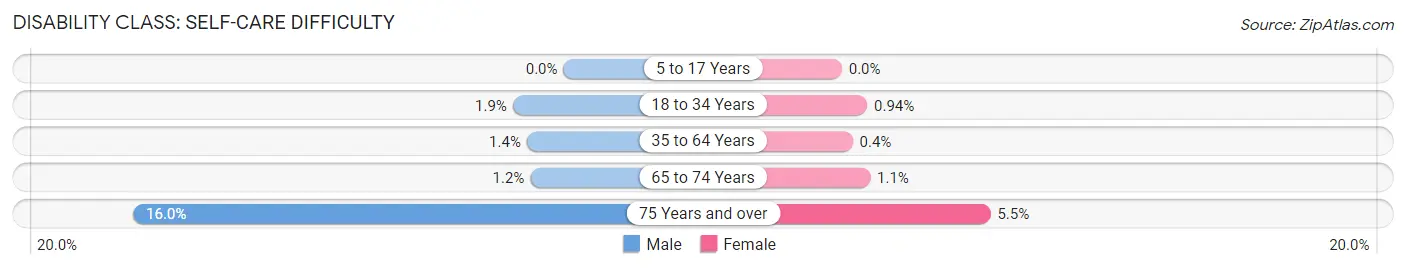
| Age Bracket | Male | Female |
| 5 to 17 Years | 0 (0.0%) | 0 (0.0%) |
| 18 to 34 Years | 34 (1.9%) | 16 (0.9%) |
| 35 to 64 Years | 70 (1.4%) | 20 (0.4%) |
| 65 to 74 Years | 15 (1.2%) | 18 (1.1%) |
| 75 Years and over | 180 (16.0%) | 79 (5.5%) |
Technology Access in North Haven
Computing Device Access in North Haven
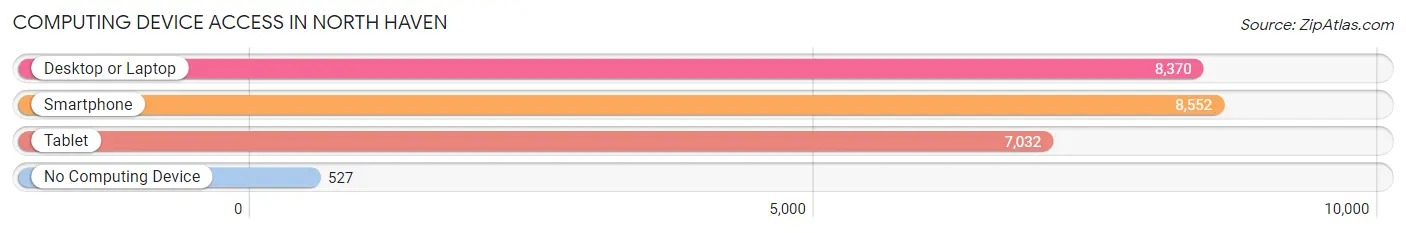
| Device Type | # Households | % Households |
| Desktop or Laptop | 8,370 | 87.6% |
| Smartphone | 8,552 | 89.5% |
| Tablet | 7,032 | 73.6% |
| No Computing Device | 527 | 5.5% |
| Total | 9,559 | 100.0% |
Internet Access in North Haven
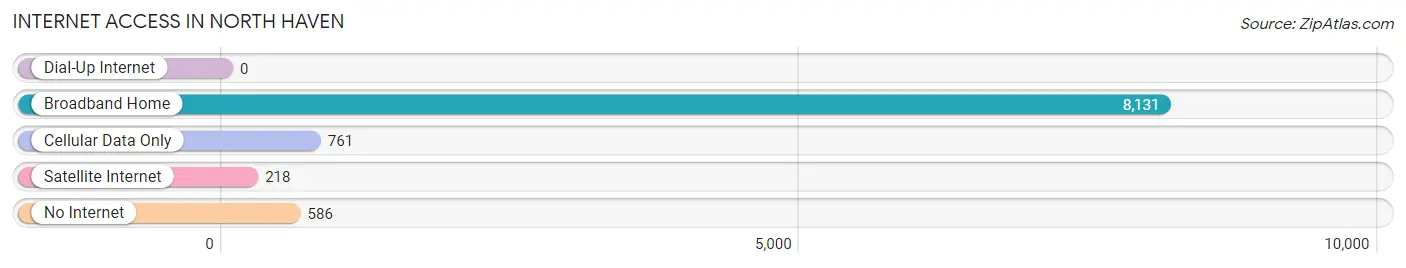
| Internet Type | # Households | % Households |
| Dial-Up Internet | 0 | 0.0% |
| Broadband Home | 8,131 | 85.1% |
| Cellular Data Only | 761 | 8.0% |
| Satellite Internet | 218 | 2.3% |
| No Internet | 586 | 6.1% |
| Total | 9,559 | 100.0% |
North Haven Summary
History
North Haven is a town located in New Haven County, Connecticut. It was first settled in 1680 and was officially incorporated in 1786. The town was originally part of the New Haven Colony and was known as North Parish. The town was named after the Haven River, which runs through the town.
The town was originally a farming community, with the main crops being corn, wheat, and hay. The town also had a number of mills, including a grist mill, a saw mill, and a paper mill. The town was also home to a number of small businesses, including a blacksmith, a tannery, and a shoe factory.
In the late 19th century, the town began to grow and develop. The railroad came to town in 1871, and the town began to attract more businesses and industry. The town also began to attract more people, and the population grew from 1,000 in 1880 to over 4,000 by 1900.
The town continued to grow and develop in the 20th century. The town was home to a number of factories, including a rubber factory, a brass foundry, and a machine shop. The town also had a number of stores and businesses, including a movie theater, a bowling alley, and a number of restaurants.
The town has continued to grow and develop in the 21st century. The town is now home to a number of businesses, including a number of technology companies. The town also has a number of parks and recreational facilities, including a golf course, a swimming pool, and a number of hiking trails.
Geography
North Haven is located in New Haven County, Connecticut. The town is bordered by the towns of Wallingford to the north, Hamden to the east, East Haven to the south, and Cheshire to the west. The town is located on the Quinnipiac River, which runs through the town.
The town has a total area of 16.3 square miles, of which 16.2 square miles is land and 0.1 square miles is water. The town is located in the foothills of the Berkshire Mountains, and the highest point in the town is the summit of East Rock, which is 860 feet above sea level.
Economy
North Haven has a diverse economy, with a number of businesses and industries located in the town. The town is home to a number of technology companies, including a number of software companies and a number of medical device companies. The town is also home to a number of manufacturing companies, including a number of metalworking companies and a number of plastics companies.
The town is also home to a number of retail stores, including a number of clothing stores, a number of grocery stores, and a number of restaurants. The town is also home to a number of service businesses, including a number of medical offices, a number of law offices, and a number of financial services companies.
Demographics
As of the 2010 census, the town had a population of 24,093. The racial makeup of the town was 90.2% White, 3.3% African American, 0.3% Native American, 3.2% Asian, 0.1% Pacific Islander, and 2.9% from other races. Hispanic or Latino of any race were 6.2% of the population.
The median household income in the town was $76,837, and the median family income was $90,945. The per capita income in the town was $35,945. About 3.2% of families and 4.7% of the population were below the poverty line.
Common Questions
What is Per Capita Income in North Haven?
Per Capita income in North Haven is $58,801.
What is the Median Family Income in North Haven?
Median Family Income in North Haven is $137,978.
What is the Median Household income in North Haven?
Median Household Income in North Haven is $121,250.
What is Income or Wage Gap in North Haven?
Income or Wage Gap in North Haven is 27.2%.
Women in North Haven earn 72.8 cents for every dollar earned by a man.
What is Inequality or Gini Index in North Haven?
Inequality or Gini Index in North Haven is 0.42.
What is the Total Population of North Haven?
Total Population of North Haven is 24,179.
What is the Total Male Population of North Haven?
Total Male Population of North Haven is 12,079.
What is the Total Female Population of North Haven?
Total Female Population of North Haven is 12,100.
What is the Ratio of Males per 100 Females in North Haven?
There are 99.83 Males per 100 Females in North Haven.
What is the Ratio of Females per 100 Males in North Haven?
There are 100.17 Females per 100 Males in North Haven.
What is the Median Population Age in North Haven?
Median Population Age in North Haven is 46.1 Years.
What is the Average Family Size in North Haven
Average Family Size in North Haven is 3.0 People.
What is the Average Household Size in North Haven
Average Household Size in North Haven is 2.5 People.
How Large is the Labor Force in North Haven?
There are 13,279 People in the Labor Forcein in North Haven.
What is the Percentage of People in the Labor Force in North Haven?
66.8% of People are in the Labor Force in North Haven.
What is the Unemployment Rate in North Haven?
Unemployment Rate in North Haven is 3.4%.