Cities with the Highest Percentage of Households with Income Above $100,000 in South Dakota
RELATED REPORTS & OPTIONS
Household Income | $100k+
South Dakota
Compare Cities
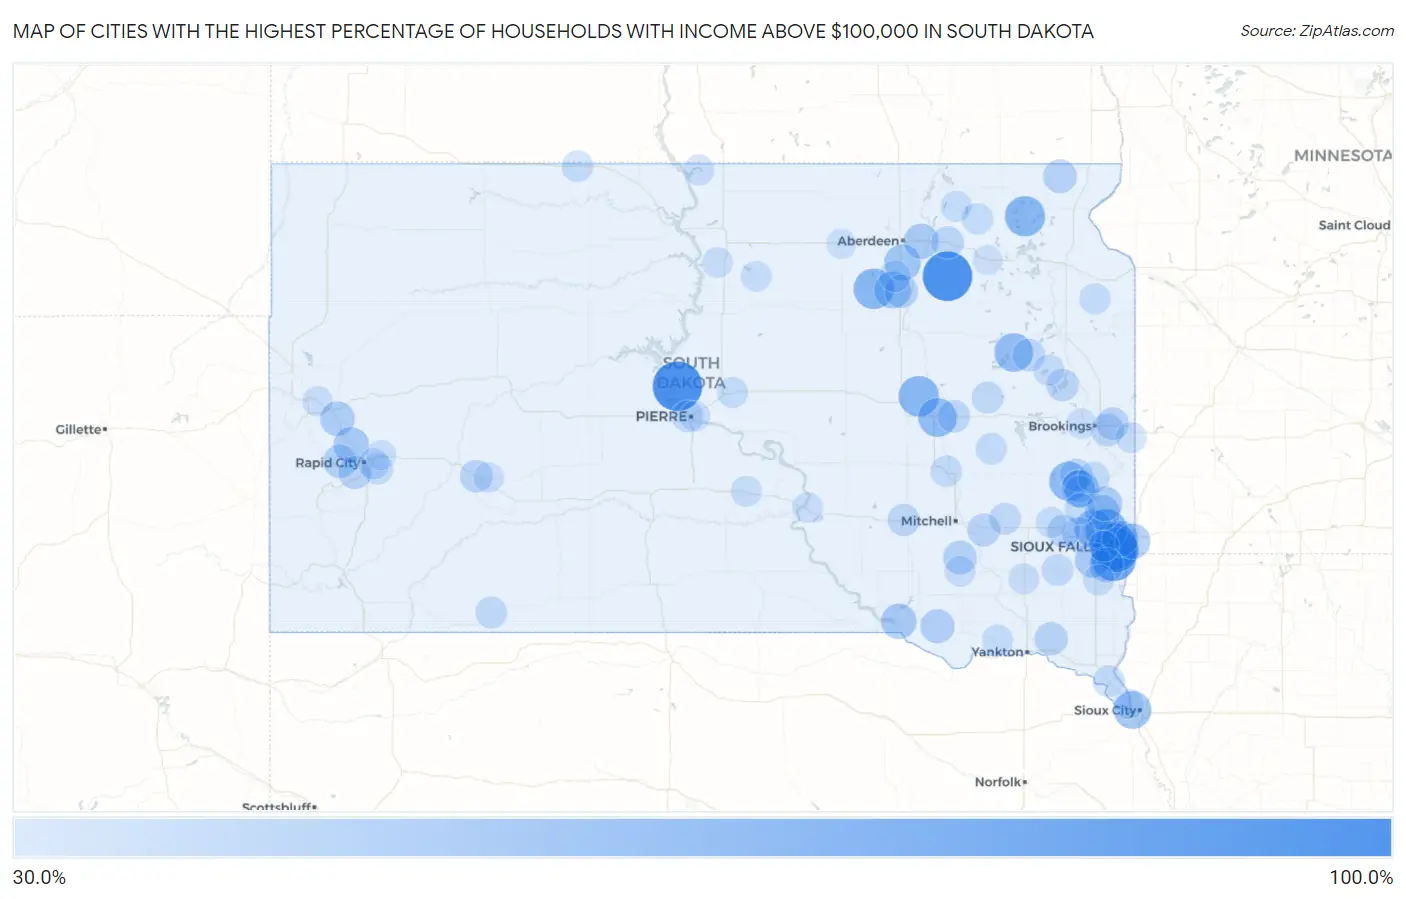
Map of Cities with the Highest Percentage of Households with Income Above $100,000 in South Dakota
0.0%
100.0%
Cities with the Highest Percentage of Households with Income Above $100,000 in South Dakota
| City | Households with Income > $100k | vs State | vs National | |
| 1. | Crook | 100.0% | 31.5%(+68.5)#1 | 37.3%(+62.7)#44 |
| 2. | Lyons | 100.0% | 31.5%(+68.5)#2 | 37.3%(+62.7)#78 |
| 3. | Cow Creek | 100.0% | 31.5%(+68.5)#3 | 37.3%(+62.7)#86 |
| 4. | Orland Colony | 100.0% | 31.5%(+68.5)#4 | 37.3%(+62.7)#122 |
| 5. | Shannon Colony | 100.0% | 31.5%(+68.5)#5 | 37.3%(+62.7)#144 |
| 6. | Verdon | 100.0% | 31.5%(+68.5)#6 | 37.3%(+62.7)#194 |
| 7. | Pine Lakes Addition | 89.1% | 31.5%(+57.6)#7 | 37.3%(+51.8)#273 |
| 8. | Shindler | 82.0% | 31.5%(+50.5)#8 | 37.3%(+44.7)#460 |
| 9. | Anderson | 80.9% | 31.5%(+49.4)#9 | 37.3%(+43.6)#507 |
| 10. | Prairiewood | 78.0% | 31.5%(+46.5)#10 | 37.3%(+40.7)#684 |
| 11. | Glendale Colony | 76.5% | 31.5%(+45.0)#11 | 37.3%(+39.2)#793 |
| 12. | Angostura | 76.4% | 31.5%(+44.9)#12 | 37.3%(+39.1)#795 |
| 13. | Mountain Plains | 73.2% | 31.5%(+41.7)#13 | 37.3%(+35.9)#1,055 |
| 14. | Renner Corner | 72.0% | 31.5%(+40.5)#14 | 37.3%(+34.7)#1,164 |
| 15. | Rowena | 67.5% | 31.5%(+36.0)#15 | 37.3%(+30.2)#1,634 |
| 16. | Chelsea | 66.7% | 31.5%(+35.2)#16 | 37.3%(+29.4)#1,723 |
| 17. | Broadland | 66.7% | 31.5%(+35.2)#17 | 37.3%(+29.4)#1,729 |
| 18. | Eden | 66.2% | 31.5%(+34.7)#18 | 37.3%(+28.9)#1,801 |
| 19. | Lake Madison | 62.0% | 31.5%(+30.5)#19 | 37.3%(+24.7)#2,393 |
| 20. | Morningside | 60.0% | 31.5%(+28.5)#20 | 37.3%(+22.7)#2,735 |
| 21. | Naples | 60.0% | 31.5%(+28.5)#21 | 37.3%(+22.7)#2,737 |
| 22. | Millerdale Colony | 58.6% | 31.5%(+27.1)#22 | 37.3%(+21.3)#2,984 |
| 23. | Crooks | 58.0% | 31.5%(+26.5)#23 | 37.3%(+20.7)#3,075 |
| 24. | Brant Lake South | 56.8% | 31.5%(+25.3)#24 | 37.3%(+19.5)#3,280 |
| 25. | Dakota Dunes | 56.5% | 31.5%(+25.0)#25 | 37.3%(+19.2)#3,328 |
| 26. | Smithwick | 55.6% | 31.5%(+24.1)#26 | 37.3%(+18.3)#3,500 |
| 27. | Northville | 53.8% | 31.5%(+22.3)#27 | 37.3%(+16.5)#3,860 |
| 28. | Warner | 51.9% | 31.5%(+20.4)#28 | 37.3%(+14.6)#4,279 |
| 29. | Brandon | 51.4% | 31.5%(+19.9)#29 | 37.3%(+14.1)#4,384 |
| 30. | Summerset | 49.3% | 31.5%(+17.8)#30 | 37.3%(+12.0)#4,933 |
| 31. | Mina | 49.0% | 31.5%(+17.5)#31 | 37.3%(+11.7)#5,012 |
| 32. | Pickstown | 49.0% | 31.5%(+17.5)#32 | 37.3%(+11.7)#5,018 |
| 33. | Valley Springs | 48.8% | 31.5%(+17.3)#33 | 37.3%(+11.5)#5,059 |
| 34. | Tea | 48.4% | 31.5%(+16.9)#34 | 37.3%(+11.1)#5,148 |
| 35. | Bath Corner | 47.8% | 31.5%(+16.3)#35 | 37.3%(+10.5)#5,316 |
| 36. | Baltic | 47.2% | 31.5%(+15.7)#36 | 37.3%(+9.90)#5,487 |
| 37. | Blucksberg Mountain | 46.2% | 31.5%(+14.7)#37 | 37.3%(+8.90)#5,784 |
| 38. | Dell Rapids | 45.8% | 31.5%(+14.3)#38 | 37.3%(+8.50)#5,882 |
| 39. | Harrisburg | 45.5% | 31.5%(+14.0)#39 | 37.3%(+8.20)#5,969 |
| 40. | Dante | 44.0% | 31.5%(+12.5)#40 | 37.3%(+6.70)#6,421 |
| 41. | Dimock | 42.8% | 31.5%(+11.3)#41 | 37.3%(+5.50)#6,808 |
| 42. | Johnson Siding | 42.6% | 31.5%(+11.1)#42 | 37.3%(+5.30)#6,867 |
| 43. | Claire City | 42.5% | 31.5%(+11.0)#43 | 37.3%(+5.20)#6,902 |
| 44. | Mellette | 41.9% | 31.5%(+10.4)#44 | 37.3%(+4.60)#7,087 |
| 45. | Hartford | 41.2% | 31.5%(+9.70)#45 | 37.3%(+3.90)#7,307 |
| 46. | Colonial Pine Hills | 40.6% | 31.5%(+9.10)#46 | 37.3%(+3.30)#7,504 |
| 47. | Volin | 40.6% | 31.5%(+9.10)#47 | 37.3%(+3.30)#7,514 |
| 48. | Alexandria | 39.9% | 31.5%(+8.40)#48 | 37.3%(+2.60)#7,783 |
| 49. | Humboldt | 39.7% | 31.5%(+8.20)#49 | 37.3%(+2.40)#7,839 |
| 50. | Aurora | 39.5% | 31.5%(+8.00)#50 | 37.3%(+2.20)#7,900 |
| 51. | Wall | 39.3% | 31.5%(+7.80)#51 | 37.3%(+2.00)#7,958 |
| 52. | Bushnell | 39.1% | 31.5%(+7.60)#52 | 37.3%(+1.80)#8,049 |
| 53. | Wentworth | 39.0% | 31.5%(+7.50)#53 | 37.3%(+1.70)#8,093 |
| 54. | Hazel | 39.0% | 31.5%(+7.50)#54 | 37.3%(+1.70)#8,096 |
| 55. | Cavour | 38.5% | 31.5%(+7.00)#55 | 37.3%(+1.20)#8,302 |
| 56. | Lake Poinsett | 38.4% | 31.5%(+6.90)#56 | 37.3%(+1.10)#8,346 |
| 57. | Groton | 38.3% | 31.5%(+6.80)#57 | 37.3%(+1.000)#8,369 |
| 58. | Brant Lake | 38.2% | 31.5%(+6.70)#58 | 37.3%(+0.900)#8,415 |
| 59. | Plankinton | 37.6% | 31.5%(+6.10)#59 | 37.3%(+0.300)#8,618 |
| 60. | Spencer | 36.5% | 31.5%(+5.00)#60 | 37.3%(-0.800)#9,066 |
| 61. | Fort Pierre | 36.1% | 31.5%(+4.60)#61 | 37.3%(-1.20)#9,213 |
| 62. | Batesland | 36.0% | 31.5%(+4.50)#62 | 37.3%(-1.30)#9,295 |
| 63. | Chester | 35.9% | 31.5%(+4.40)#63 | 37.3%(-1.40)#9,331 |
| 64. | Parker | 35.8% | 31.5%(+4.30)#64 | 37.3%(-1.50)#9,359 |
| 65. | Mansfield | 35.7% | 31.5%(+4.20)#65 | 37.3%(-1.60)#9,406 |
| 66. | Bancroft | 35.7% | 31.5%(+4.20)#66 | 37.3%(-1.60)#9,408 |
| 67. | Forestburg | 35.0% | 31.5%(+3.50)#67 | 37.3%(-2.30)#9,715 |
| 68. | Elk Point | 34.9% | 31.5%(+3.40)#68 | 37.3%(-2.40)#9,740 |
| 69. | Carthage | 34.8% | 31.5%(+3.30)#69 | 37.3%(-2.50)#9,812 |
| 70. | Colman | 34.7% | 31.5%(+3.20)#70 | 37.3%(-2.60)#9,840 |
| 71. | Mcintosh | 34.7% | 31.5%(+3.20)#71 | 37.3%(-2.60)#9,862 |
| 72. | Green Valley | 34.6% | 31.5%(+3.10)#72 | 37.3%(-2.70)#9,890 |
| 73. | Stockholm | 34.0% | 31.5%(+2.50)#73 | 37.3%(-3.30)#10,196 |
| 74. | Langford | 33.9% | 31.5%(+2.40)#74 | 37.3%(-3.40)#10,233 |
| 75. | Rapid Valley | 33.6% | 31.5%(+2.10)#75 | 37.3%(-3.70)#10,329 |
| 76. | Colton | 33.6% | 31.5%(+2.10)#76 | 37.3%(-3.70)#10,348 |
| 77. | Worthing | 33.5% | 31.5%(+2.00)#77 | 37.3%(-3.80)#10,386 |
| 78. | Montrose | 33.5% | 31.5%(+2.00)#78 | 37.3%(-3.80)#10,395 |
| 79. | Tabor | 33.5% | 31.5%(+2.00)#79 | 37.3%(-3.80)#10,399 |
| 80. | Hayti | 33.5% | 31.5%(+2.00)#80 | 37.3%(-3.80)#10,400 |
| 81. | Blunt | 33.3% | 31.5%(+1.80)#81 | 37.3%(-4.00)#10,494 |
| 82. | Claremont | 33.3% | 31.5%(+1.80)#82 | 37.3%(-4.00)#10,518 |
| 83. | Sioux Falls | 33.2% | 31.5%(+1.70)#83 | 37.3%(-4.10)#10,549 |
| 84. | Freeman | 32.8% | 31.5%(+1.30)#84 | 37.3%(-4.50)#10,756 |
| 85. | Kennebec | 32.8% | 31.5%(+1.30)#85 | 37.3%(-4.50)#10,776 |
| 86. | Pollock | 32.8% | 31.5%(+1.30)#86 | 37.3%(-4.50)#10,782 |
| 87. | Parkston | 32.5% | 31.5%(+1.00)#87 | 37.3%(-4.80)#10,893 |
| 88. | Elkton | 32.5% | 31.5%(+1.00)#88 | 37.3%(-4.80)#10,900 |
| 89. | Akaska | 32.4% | 31.5%(+0.900)#89 | 37.3%(-4.90)#10,976 |
| 90. | Hoven | 32.1% | 31.5%(+0.600)#90 | 37.3%(-5.20)#11,117 |
| 91. | Volga | 32.0% | 31.5%(+0.500)#91 | 37.3%(-5.30)#11,146 |
| 92. | Quinn | 31.6% | 31.5%(+0.100)#92 | 37.3%(-5.70)#11,361 |
| 93. | Lantry | 31.6% | 31.5%(+0.100)#93 | 37.3%(-5.70)#11,365 |
| 94. | Pierre | 31.5% | 31.5%(=0.000)#94 | 37.3%(-5.80)#11,371 |
| 95. | Chamberlain | 31.5% | 31.5%(=0.000)#95 | 37.3%(-5.80)#11,377 |
| 96. | Whitewood | 31.3% | 31.5%(-0.200)#96 | 37.3%(-6.00)#11,481 |
| 97. | Box Elder | 30.6% | 31.5%(-0.900)#97 | 37.3%(-6.70)#11,838 |
| 98. | Ipswich | 30.4% | 31.5%(-1.10)#98 | 37.3%(-6.90)#11,951 |
| 99. | Bristol | 30.4% | 31.5%(-1.10)#99 | 37.3%(-6.90)#11,968 |
| 100. | North Sioux City | 30.3% | 31.5%(-1.20)#100 | 37.3%(-7.00)#12,006 |
Common Questions
What are the Top 10 Cities with the Highest Percentage of Households with Income Above $100,000 in South Dakota?
Top 10 Cities with the Highest Percentage of Households with Income Above $100,000 in South Dakota are:
#1
100.0%
#2
100.0%
#3
89.1%
#4
82.0%
#5
80.9%
#6
72.0%
#7
66.7%
#8
66.7%
#9
66.2%
#10
62.0%
What city has the Highest Percentage of Households with Income Above $100,000 in South Dakota?
Cow Creek has the Highest Percentage of Households with Income Above $100,000 in South Dakota with 100.0%.
What is the Percentage of Households with Income Above $100,000 in the State of South Dakota?
Percentage of Households with Income Above $100,000 in South Dakota is 31.5%.
What is the Percentage of Households with Income Above $100,000 in the United States?
Percentage of Households with Income Above $100,000 in the United States is 37.3%.