Cities with the Highest Percentage of Households with Income Above $100,000 in Maryland
RELATED REPORTS & OPTIONS
Household Income | $100k+
Maryland
Compare Cities
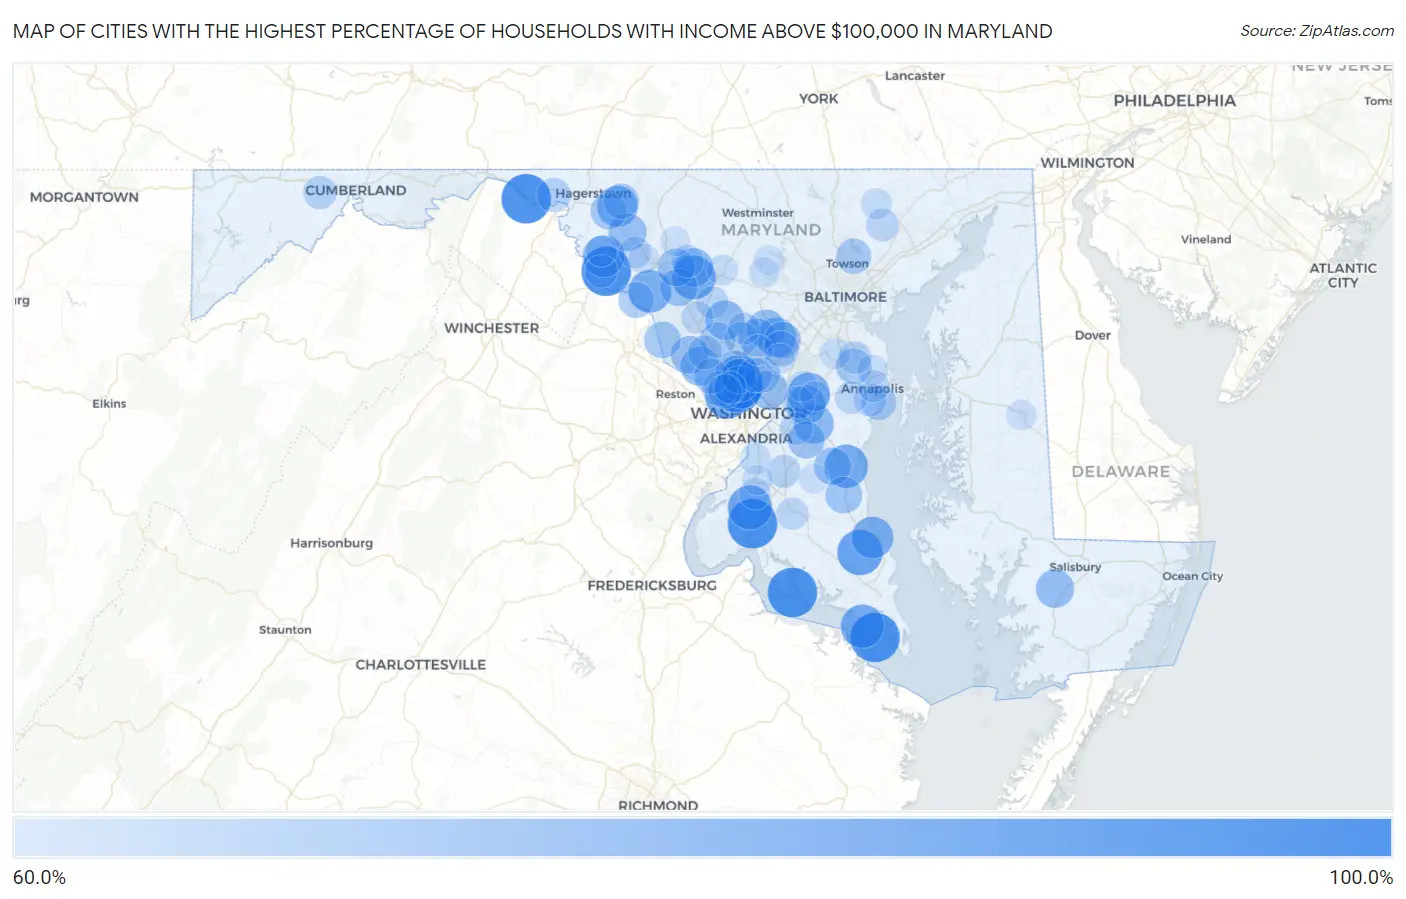
Map of Cities with the Highest Percentage of Households with Income Above $100,000 in Maryland
0.0%
100.0%
Cities with the Highest Percentage of Households with Income Above $100,000 in Maryland
| City | Households with Income > $100k | vs State | vs National | |
| 1. | St George Island | 100.0% | 49.3%(+50.7)#1 | 37.3%(+62.7)#22 |
| 2. | Rock Point | 100.0% | 49.3%(+50.7)#2 | 37.3%(+62.7)#79 |
| 3. | Lisbon | 100.0% | 49.3%(+50.7)#3 | 37.3%(+62.7)#94 |
| 4. | Big Pool | 100.0% | 49.3%(+50.7)#4 | 37.3%(+62.7)#120 |
| 5. | Brownsville | 100.0% | 49.3%(+50.7)#5 | 37.3%(+62.7)#176 |
| 6. | Port Tobacco Village | 100.0% | 49.3%(+50.7)#6 | 37.3%(+62.7)#199 |
| 7. | Chevy Chase Section Five | 94.1% | 49.3%(+44.8)#7 | 37.3%(+56.8)#208 |
| 8. | Broomes Island | 93.2% | 49.3%(+43.9)#8 | 37.3%(+55.9)#215 |
| 9. | Brookmont | 92.2% | 49.3%(+42.9)#9 | 37.3%(+54.9)#223 |
| 10. | North Chevy Chase | 91.6% | 49.3%(+42.3)#10 | 37.3%(+54.3)#229 |
| 11. | Pomfret | 91.2% | 49.3%(+41.9)#11 | 37.3%(+53.9)#236 |
| 12. | Chevy Chase Section Three | 90.7% | 49.3%(+41.4)#12 | 37.3%(+53.4)#240 |
| 13. | Monrovia | 90.6% | 49.3%(+41.3)#13 | 37.3%(+53.3)#242 |
| 14. | Chevy Chase Village | 90.1% | 49.3%(+40.8)#14 | 37.3%(+52.8)#250 |
| 15. | Tall Timbers | 90.0% | 49.3%(+40.7)#15 | 37.3%(+52.7)#253 |
| 16. | Owings | 89.8% | 49.3%(+40.5)#16 | 37.3%(+52.5)#258 |
| 17. | Adamstown | 88.7% | 49.3%(+39.4)#17 | 37.3%(+51.4)#278 |
| 18. | Fairwood | 88.1% | 49.3%(+38.8)#18 | 37.3%(+50.8)#286 |
| 19. | Chevy Chase View | 87.7% | 49.3%(+38.4)#19 | 37.3%(+50.4)#294 |
| 20. | Somerset | 87.5% | 49.3%(+38.2)#20 | 37.3%(+50.2)#295 |
| 21. | Martin S Additions | 87.5% | 49.3%(+38.2)#21 | 37.3%(+50.2)#296 |
| 22. | Trego Rohrersville Station | 87.5% | 49.3%(+38.2)#22 | 37.3%(+50.2)#297 |
| 23. | St Leonard | 87.4% | 49.3%(+38.1)#23 | 37.3%(+50.1)#299 |
| 24. | Mount Aetna | 86.0% | 49.3%(+36.7)#24 | 37.3%(+48.7)#323 |
| 25. | Garrett Park | 85.5% | 49.3%(+36.2)#25 | 37.3%(+48.2)#332 |
| 26. | Brock Hall | 84.2% | 49.3%(+34.9)#26 | 37.3%(+46.9)#363 |
| 27. | Fulton | 84.1% | 49.3%(+34.8)#27 | 37.3%(+46.8)#367 |
| 28. | Woodmore | 83.3% | 49.3%(+34.0)#28 | 37.3%(+46.0)#397 |
| 29. | Laytonsville | 83.0% | 49.3%(+33.7)#29 | 37.3%(+45.7)#418 |
| 30. | Travilah | 82.8% | 49.3%(+33.5)#30 | 37.3%(+45.5)#423 |
| 31. | New Market | 82.7% | 49.3%(+33.4)#31 | 37.3%(+45.4)#435 |
| 32. | Highland | 82.0% | 49.3%(+32.7)#32 | 37.3%(+44.7)#459 |
| 33. | University Park | 81.9% | 49.3%(+32.6)#33 | 37.3%(+44.6)#462 |
| 34. | Allen | 81.5% | 49.3%(+32.2)#34 | 37.3%(+44.2)#480 |
| 35. | Ashton Sandy Spring | 81.3% | 49.3%(+32.0)#35 | 37.3%(+44.0)#486 |
| 36. | Darnestown | 81.1% | 49.3%(+31.8)#36 | 37.3%(+43.8)#496 |
| 37. | Myersville | 81.1% | 49.3%(+31.8)#37 | 37.3%(+43.8)#498 |
| 38. | Green Valley | 80.9% | 49.3%(+31.6)#38 | 37.3%(+43.6)#506 |
| 39. | Urbana | 80.2% | 49.3%(+30.9)#39 | 37.3%(+42.9)#535 |
| 40. | Bartonsville | 80.2% | 49.3%(+30.9)#40 | 37.3%(+42.9)#537 |
| 41. | Dunkirk | 80.0% | 49.3%(+30.7)#41 | 37.3%(+42.7)#552 |
| 42. | Queensland | 79.5% | 49.3%(+30.2)#42 | 37.3%(+42.2)#583 |
| 43. | Huntingtown | 79.3% | 49.3%(+30.0)#43 | 37.3%(+42.0)#592 |
| 44. | Poolesville | 79.0% | 49.3%(+29.7)#44 | 37.3%(+41.7)#611 |
| 45. | Scaggsville | 78.9% | 49.3%(+29.6)#45 | 37.3%(+41.6)#617 |
| 46. | Beaver Creek | 78.2% | 49.3%(+28.9)#46 | 37.3%(+40.9)#668 |
| 47. | Chevy Chase | 78.1% | 49.3%(+28.8)#47 | 37.3%(+40.8)#671 |
| 48. | Point Of Rocks | 77.6% | 49.3%(+28.3)#48 | 37.3%(+40.3)#718 |
| 49. | Herald Harbor | 77.4% | 49.3%(+28.1)#49 | 37.3%(+40.1)#735 |
| 50. | Washington Grove | 77.2% | 49.3%(+27.9)#50 | 37.3%(+39.9)#749 |
| 51. | Hillandale | 77.1% | 49.3%(+27.8)#51 | 37.3%(+39.8)#753 |
| 52. | West Laurel | 77.1% | 49.3%(+27.8)#52 | 37.3%(+39.8)#754 |
| 53. | Cabin John | 77.1% | 49.3%(+27.8)#53 | 37.3%(+39.8)#760 |
| 54. | Jugtown | 77.1% | 49.3%(+27.8)#54 | 37.3%(+39.8)#762 |
| 55. | Hampton | 76.8% | 49.3%(+27.5)#55 | 37.3%(+39.5)#776 |
| 56. | Potomac | 76.5% | 49.3%(+27.2)#56 | 37.3%(+39.2)#788 |
| 57. | Highland Beach | 76.4% | 49.3%(+27.1)#57 | 37.3%(+39.1)#796 |
| 58. | South Kensington | 76.3% | 49.3%(+27.0)#58 | 37.3%(+39.0)#798 |
| 59. | Four Corners | 75.8% | 49.3%(+26.5)#59 | 37.3%(+38.5)#830 |
| 60. | Charlton | 75.0% | 49.3%(+25.7)#60 | 37.3%(+37.7)#898 |
| 61. | North Potomac | 74.9% | 49.3%(+25.6)#61 | 37.3%(+37.6)#912 |
| 62. | Glen Echo | 74.7% | 49.3%(+25.4)#62 | 37.3%(+37.4)#924 |
| 63. | Olney | 74.3% | 49.3%(+25.0)#63 | 37.3%(+37.0)#951 |
| 64. | Grahamtown | 73.8% | 49.3%(+24.5)#64 | 37.3%(+36.5)#1,003 |
| 65. | Brandywine | 73.3% | 49.3%(+24.0)#65 | 37.3%(+36.0)#1,045 |
| 66. | Westphalia | 73.0% | 49.3%(+23.7)#66 | 37.3%(+35.7)#1,066 |
| 67. | Annapolis Neck | 72.9% | 49.3%(+23.6)#67 | 37.3%(+35.6)#1,075 |
| 68. | Fallston | 72.8% | 49.3%(+23.5)#68 | 37.3%(+35.5)#1,082 |
| 69. | Severna Park | 72.7% | 49.3%(+23.4)#69 | 37.3%(+35.4)#1,088 |
| 70. | Yarrowsburg | 72.7% | 49.3%(+23.4)#70 | 37.3%(+35.4)#1,102 |
| 71. | Riva | 72.6% | 49.3%(+23.3)#71 | 37.3%(+35.3)#1,107 |
| 72. | Linganore | 72.5% | 49.3%(+23.2)#72 | 37.3%(+35.2)#1,111 |
| 73. | Callaway | 72.4% | 49.3%(+23.1)#73 | 37.3%(+35.1)#1,121 |
| 74. | Damascus | 72.2% | 49.3%(+22.9)#74 | 37.3%(+34.9)#1,132 |
| 75. | Clarksburg | 72.1% | 49.3%(+22.8)#75 | 37.3%(+34.8)#1,141 |
| 76. | Bethesda | 72.0% | 49.3%(+22.7)#76 | 37.3%(+34.7)#1,151 |
| 77. | Bryantown | 72.0% | 49.3%(+22.7)#77 | 37.3%(+34.7)#1,162 |
| 78. | Mitchellville | 71.8% | 49.3%(+22.5)#78 | 37.3%(+34.5)#1,175 |
| 79. | Brookeville | 71.7% | 49.3%(+22.4)#79 | 37.3%(+34.4)#1,191 |
| 80. | Middletown | 71.6% | 49.3%(+22.3)#80 | 37.3%(+34.3)#1,196 |
| 81. | Naval Academy | 71.6% | 49.3%(+22.3)#81 | 37.3%(+34.3)#1,198 |
| 82. | Burnt Mills | 71.0% | 49.3%(+21.7)#82 | 37.3%(+33.7)#1,249 |
| 83. | Bensville | 70.9% | 49.3%(+21.6)#83 | 37.3%(+33.6)#1,258 |
| 84. | Fort Washington | 70.7% | 49.3%(+21.4)#84 | 37.3%(+33.4)#1,269 |
| 85. | Gambrills | 70.4% | 49.3%(+21.1)#85 | 37.3%(+33.1)#1,301 |
| 86. | Mount Airy | 70.2% | 49.3%(+20.9)#86 | 37.3%(+32.9)#1,312 |
| 87. | Jarrettsville | 70.1% | 49.3%(+20.8)#87 | 37.3%(+32.8)#1,326 |
| 88. | Arnold | 69.8% | 49.3%(+20.5)#88 | 37.3%(+32.5)#1,345 |
| 89. | Braddock Heights | 69.8% | 49.3%(+20.5)#89 | 37.3%(+32.5)#1,351 |
| 90. | Glenn Dale | 69.7% | 49.3%(+20.4)#90 | 37.3%(+32.4)#1,355 |
| 91. | Mount Briar | 69.7% | 49.3%(+20.4)#91 | 37.3%(+32.4)#1,363 |
| 92. | Cloverly | 69.6% | 49.3%(+20.3)#92 | 37.3%(+32.3)#1,368 |
| 93. | West Denton | 69.2% | 49.3%(+19.9)#93 | 37.3%(+31.9)#1,422 |
| 94. | Sykesville | 69.1% | 49.3%(+19.8)#94 | 37.3%(+31.8)#1,428 |
| 95. | Konterra | 69.1% | 49.3%(+19.8)#95 | 37.3%(+31.8)#1,430 |
| 96. | Bowie | 69.0% | 49.3%(+19.7)#96 | 37.3%(+31.7)#1,438 |
| 97. | Accokeek | 69.0% | 49.3%(+19.7)#97 | 37.3%(+31.7)#1,443 |
| 98. | Eldersburg | 68.7% | 49.3%(+19.4)#98 | 37.3%(+31.4)#1,473 |
| 99. | Walkersville | 68.7% | 49.3%(+19.4)#99 | 37.3%(+31.4)#1,476 |
| 100. | Baden | 68.7% | 49.3%(+19.4)#100 | 37.3%(+31.4)#1,480 |
Common Questions
What are the Top 10 Cities with the Highest Percentage of Households with Income Above $100,000 in Maryland?
Top 10 Cities with the Highest Percentage of Households with Income Above $100,000 in Maryland are:
#1
100.0%
#2
100.0%
#3
100.0%
#4
100.0%
#5
100.0%
#6
94.1%
#7
93.2%
#8
92.2%
#9
91.6%
#10
91.2%
What city has the Highest Percentage of Households with Income Above $100,000 in Maryland?
St George Island has the Highest Percentage of Households with Income Above $100,000 in Maryland with 100.0%.
What is the Percentage of Households with Income Above $100,000 in the State of Maryland?
Percentage of Households with Income Above $100,000 in Maryland is 49.3%.
What is the Percentage of Households with Income Above $100,000 in the United States?
Percentage of Households with Income Above $100,000 in the United States is 37.3%.