Cities with the Highest Percentage of Households with Income Above $100,000 in Michigan
RELATED REPORTS & OPTIONS
Household Income | $100k+
Michigan
Compare Cities
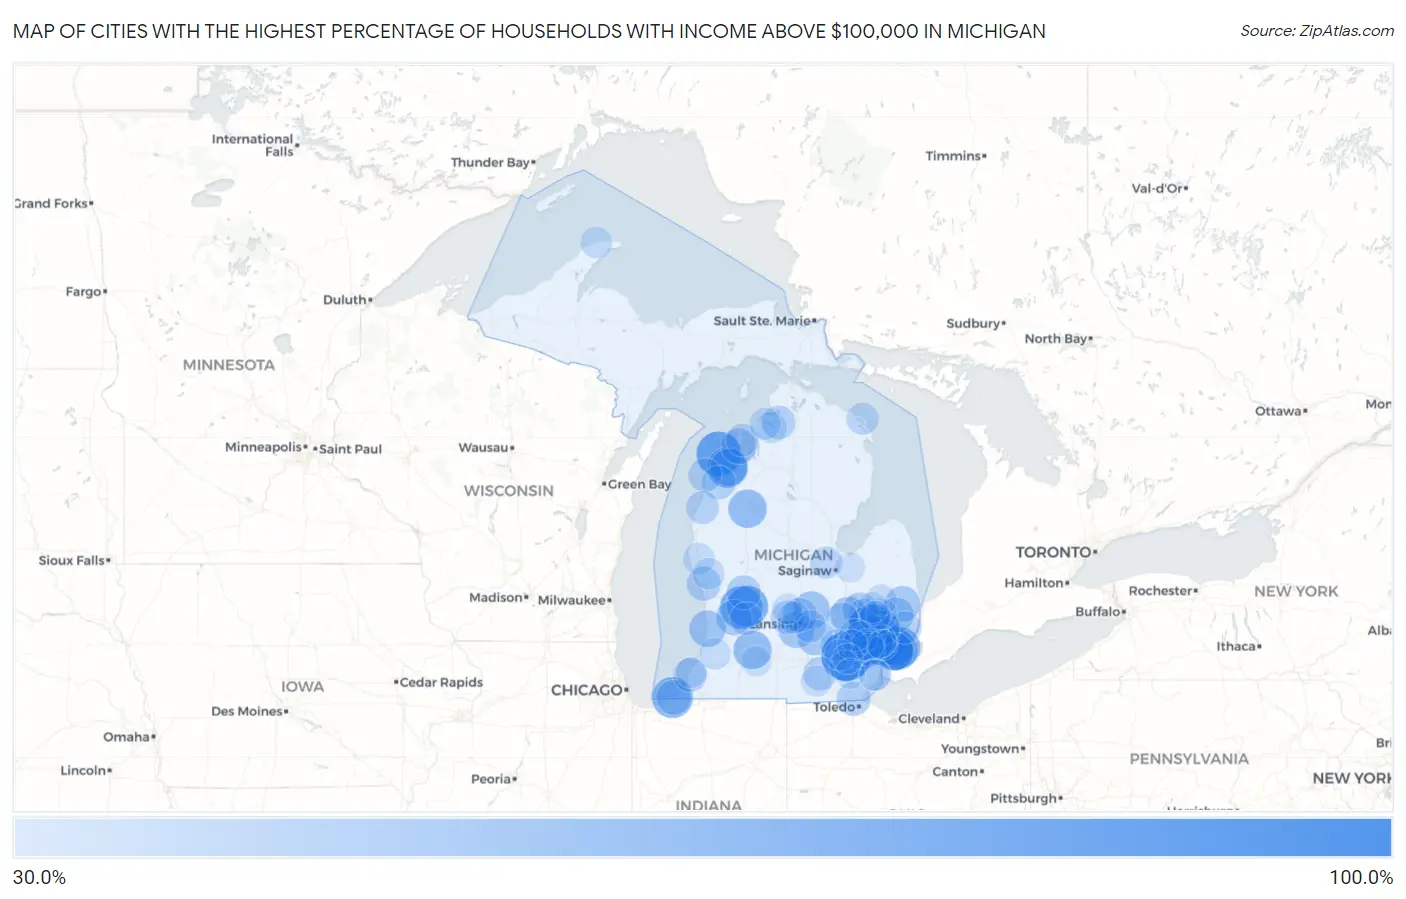
Map of Cities with the Highest Percentage of Households with Income Above $100,000 in Michigan
0.0%
100.0%
Cities with the Highest Percentage of Households with Income Above $100,000 in Michigan
| City | Households with Income > $100k | vs State | vs National | |
| 1. | Barton Hills | 92.5% | 32.5%(+60.0)#1 | 37.3%(+55.2)#219 |
| 2. | Huntington Woods | 79.1% | 32.5%(+46.6)#2 | 37.3%(+41.8)#605 |
| 3. | Franklin | 79.1% | 32.5%(+46.6)#3 | 37.3%(+41.8)#607 |
| 4. | Glen Arbor | 78.9% | 32.5%(+46.4)#4 | 37.3%(+41.6)#621 |
| 5. | Lake Angelus | 75.9% | 32.5%(+43.4)#5 | 37.3%(+38.6)#824 |
| 6. | Bingham Farms | 75.8% | 32.5%(+43.3)#6 | 37.3%(+38.5)#833 |
| 7. | Bloomfield Hills | 74.7% | 32.5%(+42.2)#7 | 37.3%(+37.4)#921 |
| 8. | Orchard Lake Village | 74.7% | 32.5%(+42.2)#8 | 37.3%(+37.4)#923 |
| 9. | East Grand Rapids | 73.3% | 32.5%(+40.8)#9 | 37.3%(+36.0)#1,044 |
| 10. | Pleasant Ridge | 71.8% | 32.5%(+39.3)#10 | 37.3%(+34.5)#1,179 |
| 11. | Beverly Hills | 70.2% | 32.5%(+37.7)#11 | 37.3%(+32.9)#1,311 |
| 12. | Forest Hills | 69.5% | 32.5%(+37.0)#12 | 37.3%(+32.2)#1,374 |
| 13. | Michiana | 68.5% | 32.5%(+36.0)#13 | 37.3%(+31.2)#1,515 |
| 14. | Maple Grove | 68.0% | 32.5%(+35.5)#14 | 37.3%(+30.7)#1,578 |
| 15. | Village Of Grosse Pointe Shores | 67.9% | 32.5%(+35.4)#15 | 37.3%(+30.6)#1,591 |
| 16. | Grosse Pointe Farms | 66.5% | 32.5%(+34.0)#16 | 37.3%(+29.2)#1,745 |
| 17. | Lamont | 64.6% | 32.5%(+32.1)#17 | 37.3%(+27.3)#1,984 |
| 18. | Birmingham | 64.4% | 32.5%(+31.9)#18 | 37.3%(+27.1)#2,010 |
| 19. | Northville | 62.2% | 32.5%(+29.7)#19 | 37.3%(+24.9)#2,350 |
| 20. | Grosse Pointe Woods | 61.9% | 32.5%(+29.4)#20 | 37.3%(+24.6)#2,398 |
| 21. | Grosse Pointe Park | 61.9% | 32.5%(+29.4)#21 | 37.3%(+24.6)#2,401 |
| 22. | Wedgewood | 61.5% | 32.5%(+29.0)#22 | 37.3%(+24.2)#2,474 |
| 23. | South Gull Lake | 61.3% | 32.5%(+28.8)#23 | 37.3%(+24.0)#2,515 |
| 24. | Grosse Pointe | 61.0% | 32.5%(+28.5)#24 | 37.3%(+23.7)#2,566 |
| 25. | Hardwood Acres | 58.7% | 32.5%(+26.2)#25 | 37.3%(+21.4)#2,965 |
| 26. | Lake Victoria | 58.6% | 32.5%(+26.1)#26 | 37.3%(+21.3)#2,981 |
| 27. | Rochester Hills | 58.3% | 32.5%(+25.8)#27 | 37.3%(+21.0)#3,022 |
| 28. | Troy | 57.4% | 32.5%(+24.9)#28 | 37.3%(+20.1)#3,163 |
| 29. | Saugatuck | 56.8% | 32.5%(+24.3)#29 | 37.3%(+19.5)#3,277 |
| 30. | Lake Fenton | 56.7% | 32.5%(+24.2)#30 | 37.3%(+19.4)#3,291 |
| 31. | Plymouth | 55.7% | 32.5%(+23.2)#31 | 37.3%(+18.4)#3,474 |
| 32. | Dimondale | 54.6% | 32.5%(+22.1)#32 | 37.3%(+17.3)#3,697 |
| 33. | Dansville | 54.5% | 32.5%(+22.0)#33 | 37.3%(+17.2)#3,714 |
| 34. | Berkley | 54.4% | 32.5%(+21.9)#34 | 37.3%(+17.1)#3,728 |
| 35. | Suttons Bay | 54.2% | 32.5%(+21.7)#35 | 37.3%(+16.9)#3,781 |
| 36. | Novi | 54.1% | 32.5%(+21.6)#36 | 37.3%(+16.8)#3,789 |
| 37. | Byron Center | 54.1% | 32.5%(+21.6)#37 | 37.3%(+16.8)#3,793 |
| 38. | Emmett | 53.8% | 32.5%(+21.3)#38 | 37.3%(+16.5)#3,857 |
| 39. | Armada | 52.7% | 32.5%(+20.2)#39 | 37.3%(+15.4)#4,085 |
| 40. | Goodrich | 52.2% | 32.5%(+19.7)#40 | 37.3%(+14.9)#4,205 |
| 41. | Grand Beach | 52.2% | 32.5%(+19.7)#41 | 37.3%(+14.9)#4,213 |
| 42. | Rochester | 51.2% | 32.5%(+18.7)#42 | 37.3%(+13.9)#4,428 |
| 43. | Hartland | 51.1% | 32.5%(+18.6)#43 | 37.3%(+13.8)#4,461 |
| 44. | Farmington Hills | 50.8% | 32.5%(+18.3)#44 | 37.3%(+13.5)#4,512 |
| 45. | Rockford | 50.2% | 32.5%(+17.7)#45 | 37.3%(+12.9)#4,638 |
| 46. | Lambertville | 50.1% | 32.5%(+17.6)#46 | 37.3%(+12.8)#4,662 |
| 47. | Dewitt | 50.0% | 32.5%(+17.5)#47 | 37.3%(+12.7)#4,691 |
| 48. | North Muskegon | 49.9% | 32.5%(+17.4)#48 | 37.3%(+12.6)#4,780 |
| 49. | Lathrup Village | 49.4% | 32.5%(+16.9)#49 | 37.3%(+12.1)#4,904 |
| 50. | Ida | 49.4% | 32.5%(+16.9)#50 | 37.3%(+12.1)#4,911 |
| 51. | Shoreham | 49.1% | 32.5%(+16.6)#51 | 37.3%(+11.8)#4,987 |
| 52. | Walloon Lake | 49.0% | 32.5%(+16.5)#52 | 37.3%(+11.7)#5,016 |
| 53. | Crystal Mountain | 49.0% | 32.5%(+16.5)#53 | 37.3%(+11.7)#5,020 |
| 54. | Vineyard Lake | 48.7% | 32.5%(+16.2)#54 | 37.3%(+11.4)#5,082 |
| 55. | Elberta | 48.6% | 32.5%(+16.1)#55 | 37.3%(+11.3)#5,112 |
| 56. | Eagle | 48.6% | 32.5%(+16.1)#56 | 37.3%(+11.3)#5,116 |
| 57. | Sylvan Lake | 47.6% | 32.5%(+15.1)#57 | 37.3%(+10.3)#5,370 |
| 58. | Filer City | 47.4% | 32.5%(+14.9)#58 | 37.3%(+10.1)#5,436 |
| 59. | Caledonia | 47.1% | 32.5%(+14.6)#59 | 37.3%(+9.80)#5,515 |
| 60. | Village Of Clarkston | 47.0% | 32.5%(+14.5)#60 | 37.3%(+9.70)#5,550 |
| 61. | Omena | 46.9% | 32.5%(+14.4)#61 | 37.3%(+9.60)#5,587 |
| 62. | Lake Orion | 46.8% | 32.5%(+14.3)#62 | 37.3%(+9.50)#5,602 |
| 63. | Ortonville | 46.3% | 32.5%(+13.8)#63 | 37.3%(+9.00)#5,748 |
| 64. | Royal Oak | 46.2% | 32.5%(+13.7)#64 | 37.3%(+8.90)#5,764 |
| 65. | New Baltimore | 46.2% | 32.5%(+13.7)#65 | 37.3%(+8.90)#5,768 |
| 66. | Three Lakes | 46.2% | 32.5%(+13.7)#66 | 37.3%(+8.90)#5,789 |
| 67. | Argentine | 46.0% | 32.5%(+13.5)#67 | 37.3%(+8.70)#5,836 |
| 68. | Okemos | 45.7% | 32.5%(+13.2)#68 | 37.3%(+8.40)#5,899 |
| 69. | Wolverine Lake | 45.7% | 32.5%(+13.2)#69 | 37.3%(+8.40)#5,909 |
| 70. | Livonia | 45.5% | 32.5%(+13.0)#70 | 37.3%(+8.20)#5,960 |
| 71. | Farmington | 45.1% | 32.5%(+12.6)#71 | 37.3%(+7.80)#6,075 |
| 72. | Milford | 45.1% | 32.5%(+12.6)#72 | 37.3%(+7.80)#6,077 |
| 73. | Presque Isle Harbor | 45.0% | 32.5%(+12.5)#73 | 37.3%(+7.70)#6,128 |
| 74. | Wacousta | 44.8% | 32.5%(+12.3)#74 | 37.3%(+7.50)#6,177 |
| 75. | Freeland | 44.7% | 32.5%(+12.2)#75 | 37.3%(+7.40)#6,206 |
| 76. | Rockwood | 44.4% | 32.5%(+11.9)#76 | 37.3%(+7.10)#6,296 |
| 77. | Pinckney | 43.8% | 32.5%(+11.3)#77 | 37.3%(+6.50)#6,472 |
| 78. | New Era | 43.6% | 32.5%(+11.1)#78 | 37.3%(+6.30)#6,545 |
| 79. | Twin Lake | 43.4% | 32.5%(+10.9)#79 | 37.3%(+6.10)#6,606 |
| 80. | Advance | 43.3% | 32.5%(+10.8)#80 | 37.3%(+6.00)#6,647 |
| 81. | Ironton | 43.3% | 32.5%(+10.8)#81 | 37.3%(+6.00)#6,652 |
| 82. | Eagle Harbor | 43.3% | 32.5%(+10.8)#82 | 37.3%(+6.00)#6,655 |
| 83. | Skanee | 42.9% | 32.5%(+10.4)#83 | 37.3%(+5.60)#6,766 |
| 84. | Breedsville | 42.7% | 32.5%(+10.2)#84 | 37.3%(+5.40)#6,835 |
| 85. | Attica | 42.4% | 32.5%(+9.90)#85 | 37.3%(+5.10)#6,924 |
| 86. | Leonard | 42.4% | 32.5%(+9.90)#86 | 37.3%(+5.10)#6,933 |
| 87. | Saline | 42.3% | 32.5%(+9.80)#87 | 37.3%(+5.00)#6,948 |
| 88. | Dexter | 42.3% | 32.5%(+9.80)#88 | 37.3%(+5.00)#6,952 |
| 89. | South Rockwood | 42.1% | 32.5%(+9.60)#89 | 37.3%(+4.80)#7,019 |
| 90. | South Lyon | 41.4% | 32.5%(+8.90)#90 | 37.3%(+4.10)#7,225 |
| 91. | Metamora | 41.4% | 32.5%(+8.90)#91 | 37.3%(+4.10)#7,242 |
| 92. | St Joseph | 41.3% | 32.5%(+8.80)#92 | 37.3%(+4.00)#7,255 |
| 93. | Oxford | 41.3% | 32.5%(+8.80)#93 | 37.3%(+4.00)#7,263 |
| 94. | Manitou Beach Devils Lake | 41.3% | 32.5%(+8.80)#94 | 37.3%(+4.00)#7,269 |
| 95. | Milan | 40.6% | 32.5%(+8.10)#95 | 37.3%(+3.30)#7,497 |
| 96. | Ann Arbor | 40.4% | 32.5%(+7.90)#96 | 37.3%(+3.10)#7,561 |
| 97. | Westphalia | 40.4% | 32.5%(+7.90)#97 | 37.3%(+3.10)#7,592 |
| 98. | Climax | 40.2% | 32.5%(+7.70)#98 | 37.3%(+2.90)#7,663 |
| 99. | Reese | 39.9% | 32.5%(+7.40)#99 | 37.3%(+2.60)#7,780 |
| 100. | Ferndale | 39.7% | 32.5%(+7.20)#100 | 37.3%(+2.40)#7,824 |
Common Questions
What are the Top 10 Cities with the Highest Percentage of Households with Income Above $100,000 in Michigan?
Top 10 Cities with the Highest Percentage of Households with Income Above $100,000 in Michigan are:
#1
92.5%
#2
79.1%
#3
79.1%
#4
78.9%
#5
75.9%
#6
75.8%
#7
74.7%
#8
74.7%
#9
73.3%
#10
71.8%
What city has the Highest Percentage of Households with Income Above $100,000 in Michigan?
Barton Hills has the Highest Percentage of Households with Income Above $100,000 in Michigan with 92.5%.
What is the Percentage of Households with Income Above $100,000 in the State of Michigan?
Percentage of Households with Income Above $100,000 in Michigan is 32.5%.
What is the Percentage of Households with Income Above $100,000 in the United States?
Percentage of Households with Income Above $100,000 in the United States is 37.3%.