Cities with the Highest Percentage of Households with Income Above $100,000 in Wyoming
RELATED REPORTS & OPTIONS
Household Income | $100k+
Wyoming
Compare Cities
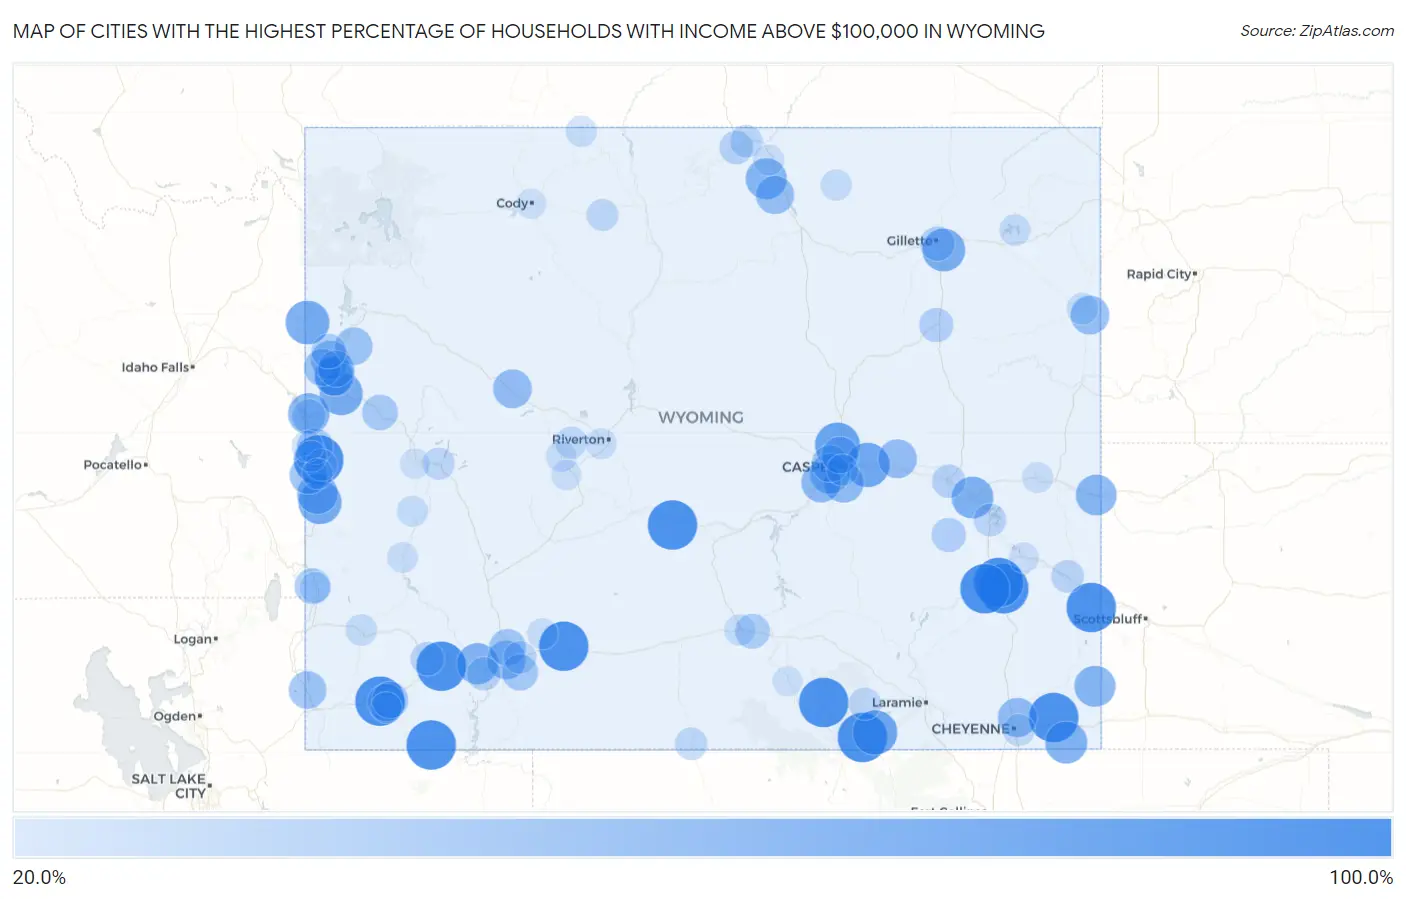
Map of Cities with the Highest Percentage of Households with Income Above $100,000 in Wyoming
0.0%
100.0%
Cities with the Highest Percentage of Households with Income Above $100,000 in Wyoming
| City | Households with Income > $100k | vs State | vs National | |
| 1. | Bedford | 100.0% | 34.6%(+65.4)#1 | 37.3%(+62.7)#15 |
| 2. | Fort Bridger | 100.0% | 34.6%(+65.4)#2 | 37.3%(+62.7)#30 |
| 3. | Chugcreek | 100.0% | 34.6%(+65.4)#3 | 37.3%(+62.7)#75 |
| 4. | Lakeview North | 100.0% | 34.6%(+65.4)#4 | 37.3%(+62.7)#76 |
| 5. | Mckinnon | 100.0% | 34.6%(+65.4)#5 | 37.3%(+62.7)#84 |
| 6. | Point Of Rocks | 100.0% | 34.6%(+65.4)#6 | 37.3%(+62.7)#89 |
| 7. | Westview Circle | 100.0% | 34.6%(+65.4)#7 | 37.3%(+62.7)#92 |
| 8. | Jeffrey City | 100.0% | 34.6%(+65.4)#8 | 37.3%(+62.7)#133 |
| 9. | Hillsdale | 100.0% | 34.6%(+65.4)#9 | 37.3%(+62.7)#137 |
| 10. | Ryan Park | 100.0% | 34.6%(+65.4)#10 | 37.3%(+62.7)#141 |
| 11. | Little America | 100.0% | 34.6%(+65.4)#11 | 37.3%(+62.7)#154 |
| 12. | Huntley | 100.0% | 34.6%(+65.4)#12 | 37.3%(+62.7)#174 |
| 13. | Fox Park | 100.0% | 34.6%(+65.4)#13 | 37.3%(+62.7)#187 |
| 14. | Homa Hills | 82.8% | 34.6%(+48.2)#14 | 37.3%(+45.5)#430 |
| 15. | Woods Landing Jelm | 81.0% | 34.6%(+46.4)#15 | 37.3%(+43.7)#504 |
| 16. | Meadow Acres | 80.0% | 34.6%(+45.4)#16 | 37.3%(+42.7)#555 |
| 17. | Alta | 77.7% | 34.6%(+43.1)#17 | 37.3%(+40.4)#711 |
| 18. | Smoot | 75.9% | 34.6%(+41.3)#18 | 37.3%(+38.6)#821 |
| 19. | Hoback | 75.0% | 34.6%(+40.4)#19 | 37.3%(+37.7)#894 |
| 20. | Sleepy Hollow | 74.6% | 34.6%(+40.0)#20 | 37.3%(+37.3)#930 |
| 21. | Carpenter | 71.7% | 34.6%(+37.1)#21 | 37.3%(+34.4)#1,190 |
| 22. | Orin | 71.0% | 34.6%(+36.4)#22 | 37.3%(+33.7)#1,255 |
| 23. | James Town | 69.1% | 34.6%(+34.5)#23 | 37.3%(+31.8)#1,435 |
| 24. | Alpine Northeast | 68.8% | 34.6%(+34.2)#24 | 37.3%(+31.5)#1,467 |
| 25. | Albin | 68.0% | 34.6%(+33.4)#25 | 37.3%(+30.7)#1,577 |
| 26. | Big Horn | 68.0% | 34.6%(+33.4)#26 | 37.3%(+30.7)#1,579 |
| 27. | Van Tassell | 66.7% | 34.6%(+32.1)#27 | 37.3%(+29.4)#1,728 |
| 28. | Powder Horn | 66.5% | 34.6%(+31.9)#28 | 37.3%(+29.2)#1,757 |
| 29. | Osmond | 66.4% | 34.6%(+31.8)#29 | 37.3%(+29.1)#1,775 |
| 30. | Casper Mountain | 64.6% | 34.6%(+30.0)#30 | 37.3%(+27.3)#1,985 |
| 31. | Red Butte | 64.0% | 34.6%(+29.4)#31 | 37.3%(+26.7)#2,072 |
| 32. | Bessemer Bend | 63.1% | 34.6%(+28.5)#32 | 37.3%(+25.8)#2,201 |
| 33. | Rafter J Ranch | 62.0% | 34.6%(+27.4)#33 | 37.3%(+24.7)#2,390 |
| 34. | Ranchettes | 61.3% | 34.6%(+26.7)#34 | 37.3%(+24.0)#2,510 |
| 35. | Rolling Hills | 59.7% | 34.6%(+25.1)#35 | 37.3%(+22.4)#2,799 |
| 36. | Clearview Acres | 59.6% | 34.6%(+25.0)#36 | 37.3%(+22.3)#2,822 |
| 37. | Crowheart | 59.5% | 34.6%(+24.9)#37 | 37.3%(+22.2)#2,839 |
| 38. | South Park | 59.4% | 34.6%(+24.8)#38 | 37.3%(+22.1)#2,855 |
| 39. | Hill View Heights | 59.1% | 34.6%(+24.5)#39 | 37.3%(+21.8)#2,909 |
| 40. | Story | 57.9% | 34.6%(+23.3)#40 | 37.3%(+20.6)#3,090 |
| 41. | Auburn | 57.5% | 34.6%(+22.9)#41 | 37.3%(+20.2)#3,162 |
| 42. | Moose Wilson Road | 57.2% | 34.6%(+22.6)#42 | 37.3%(+19.9)#3,208 |
| 43. | Kelly | 55.0% | 34.6%(+20.4)#43 | 37.3%(+17.7)#3,614 |
| 44. | Bear River | 54.9% | 34.6%(+20.3)#44 | 37.3%(+17.6)#3,634 |
| 45. | Urie | 54.4% | 34.6%(+19.8)#45 | 37.3%(+17.1)#3,739 |
| 46. | Wilson | 52.7% | 34.6%(+18.1)#46 | 37.3%(+15.4)#4,087 |
| 47. | North Rock Springs | 52.4% | 34.6%(+17.8)#47 | 37.3%(+15.1)#4,147 |
| 48. | Vista West | 52.1% | 34.6%(+17.5)#48 | 37.3%(+14.8)#4,238 |
| 49. | Bar Nunn | 51.6% | 34.6%(+17.0)#49 | 37.3%(+14.3)#4,339 |
| 50. | Lyman | 50.6% | 34.6%(+16.0)#50 | 37.3%(+13.3)#4,570 |
| 51. | Jackson | 50.5% | 34.6%(+15.9)#51 | 37.3%(+13.2)#4,581 |
| 52. | Arrowhead Springs | 50.0% | 34.6%(+15.4)#52 | 37.3%(+12.7)#4,730 |
| 53. | Taylor | 49.1% | 34.6%(+14.5)#53 | 37.3%(+11.8)#4,991 |
| 54. | Star Valley Ranch | 48.3% | 34.6%(+13.7)#54 | 37.3%(+11.0)#5,179 |
| 55. | Bondurant | 47.9% | 34.6%(+13.3)#55 | 37.3%(+10.6)#5,288 |
| 56. | Sinclair | 44.7% | 34.6%(+10.1)#56 | 37.3%(+7.40)#6,220 |
| 57. | Teton Village | 44.3% | 34.6%(+9.70)#57 | 37.3%(+7.00)#6,332 |
| 58. | Gillette | 44.2% | 34.6%(+9.60)#58 | 37.3%(+6.90)#6,344 |
| 59. | Esterbrook | 42.9% | 34.6%(+8.30)#59 | 37.3%(+5.60)#6,770 |
| 60. | Wright | 42.6% | 34.6%(+8.00)#60 | 37.3%(+5.30)#6,862 |
| 61. | Alpine | 41.9% | 34.6%(+7.30)#61 | 37.3%(+4.60)#7,078 |
| 62. | Granger | 40.5% | 34.6%(+5.90)#62 | 37.3%(+3.20)#7,558 |
| 63. | Dayton | 40.1% | 34.6%(+5.50)#63 | 37.3%(+2.80)#7,688 |
| 64. | Douglas | 39.9% | 34.6%(+5.30)#64 | 37.3%(+2.60)#7,769 |
| 65. | Green River | 39.7% | 34.6%(+5.10)#65 | 37.3%(+2.40)#7,826 |
| 66. | Lingle | 37.5% | 34.6%(+2.90)#66 | 37.3%(+0.200)#8,672 |
| 67. | Rock Springs | 37.1% | 34.6%(+2.50)#67 | 37.3%(-0.200)#8,820 |
| 68. | Glendo | 37.1% | 34.6%(+2.50)#68 | 37.3%(-0.200)#8,862 |
| 69. | Ranchester | 36.7% | 34.6%(+2.10)#69 | 37.3%(-0.600)#8,987 |
| 70. | Baggs | 36.5% | 34.6%(+1.90)#70 | 37.3%(-0.800)#9,058 |
| 71. | Centennial | 35.7% | 34.6%(+1.10)#71 | 37.3%(-1.60)#9,402 |
| 72. | Pinedale | 35.2% | 34.6%(+0.600)#72 | 37.3%(-2.10)#9,614 |
| 73. | Burlington | 34.7% | 34.6%(+0.100)#73 | 37.3%(-2.60)#9,855 |
| 74. | Cheyenne | 34.4% | 34.6%(-0.200)#74 | 37.3%(-2.90)#9,968 |
| 75. | Ethete | 34.3% | 34.6%(-0.300)#75 | 37.3%(-3.00)#10,040 |
| 76. | Turnerville | 33.6% | 34.6%(-1.00)#76 | 37.3%(-3.70)#10,361 |
| 77. | Newcastle | 33.0% | 34.6%(-1.60)#77 | 37.3%(-4.30)#10,656 |
| 78. | Pine Haven | 32.8% | 34.6%(-1.80)#78 | 37.3%(-4.50)#10,771 |
| 79. | Casper | 32.6% | 34.6%(-2.00)#79 | 37.3%(-4.70)#10,825 |
| 80. | Kemmerer | 32.6% | 34.6%(-2.00)#80 | 37.3%(-4.70)#10,842 |
| 81. | Freedom | 32.5% | 34.6%(-2.10)#81 | 37.3%(-4.80)#10,920 |
| 82. | Rawlins | 32.2% | 34.6%(-2.40)#82 | 37.3%(-5.10)#11,031 |
| 83. | Frannie | 32.0% | 34.6%(-2.60)#83 | 37.3%(-5.30)#11,169 |
| 84. | Clearmont | 31.8% | 34.6%(-2.80)#84 | 37.3%(-5.50)#11,255 |
| 85. | Cokeville | 31.7% | 34.6%(-2.90)#85 | 37.3%(-5.60)#11,295 |
| 86. | Marbleton | 31.2% | 34.6%(-3.40)#86 | 37.3%(-6.10)#11,527 |
| 87. | Arapahoe | 31.0% | 34.6%(-3.60)#87 | 37.3%(-6.30)#11,619 |
| 88. | Thayne | 30.9% | 34.6%(-3.70)#88 | 37.3%(-6.40)#11,688 |
| 89. | Manville | 30.9% | 34.6%(-3.70)#89 | 37.3%(-6.40)#11,709 |
| 90. | Sheridan | 30.7% | 34.6%(-3.90)#90 | 37.3%(-6.60)#11,795 |
| 91. | Superior | 30.7% | 34.6%(-3.90)#91 | 37.3%(-6.60)#11,834 |
| 92. | Boulder Flats | 30.6% | 34.6%(-4.00)#92 | 37.3%(-6.70)#11,873 |
| 93. | La Barge | 30.3% | 34.6%(-4.30)#93 | 37.3%(-7.00)#12,035 |
| 94. | Mountain View | 30.1% | 34.6%(-4.50)#94 | 37.3%(-7.20)#12,131 |
| 95. | Grover | 29.7% | 34.6%(-4.90)#95 | 37.3%(-7.60)#12,373 |
| 96. | Lander | 28.9% | 34.6%(-5.70)#96 | 37.3%(-8.40)#12,791 |
| 97. | Guernsey | 28.9% | 34.6%(-5.70)#97 | 37.3%(-8.40)#12,811 |
| 98. | Daniel | 28.6% | 34.6%(-6.00)#98 | 37.3%(-8.70)#13,033 |
| 99. | Saratoga | 28.4% | 34.6%(-6.20)#99 | 37.3%(-8.90)#13,165 |
| 100. | Cody | 28.1% | 34.6%(-6.50)#100 | 37.3%(-9.20)#13,335 |
1
2Common Questions
What are the Top 10 Cities with the Highest Percentage of Households with Income Above $100,000 in Wyoming?
Top 10 Cities with the Highest Percentage of Households with Income Above $100,000 in Wyoming are:
#1
100.0%
#2
100.0%
#3
100.0%
#4
100.0%
#5
100.0%
#6
100.0%
#7
100.0%
#8
100.0%
#9
100.0%
#10
100.0%
What city has the Highest Percentage of Households with Income Above $100,000 in Wyoming?
Bedford has the Highest Percentage of Households with Income Above $100,000 in Wyoming with 100.0%.
What is the Percentage of Households with Income Above $100,000 in the State of Wyoming?
Percentage of Households with Income Above $100,000 in Wyoming is 34.6%.
What is the Percentage of Households with Income Above $100,000 in the United States?
Percentage of Households with Income Above $100,000 in the United States is 37.3%.