Cities with the Highest Percentage of Households with Income Above $100,000 in Illinois
RELATED REPORTS & OPTIONS
Household Income | $100k+
Illinois
Compare Cities
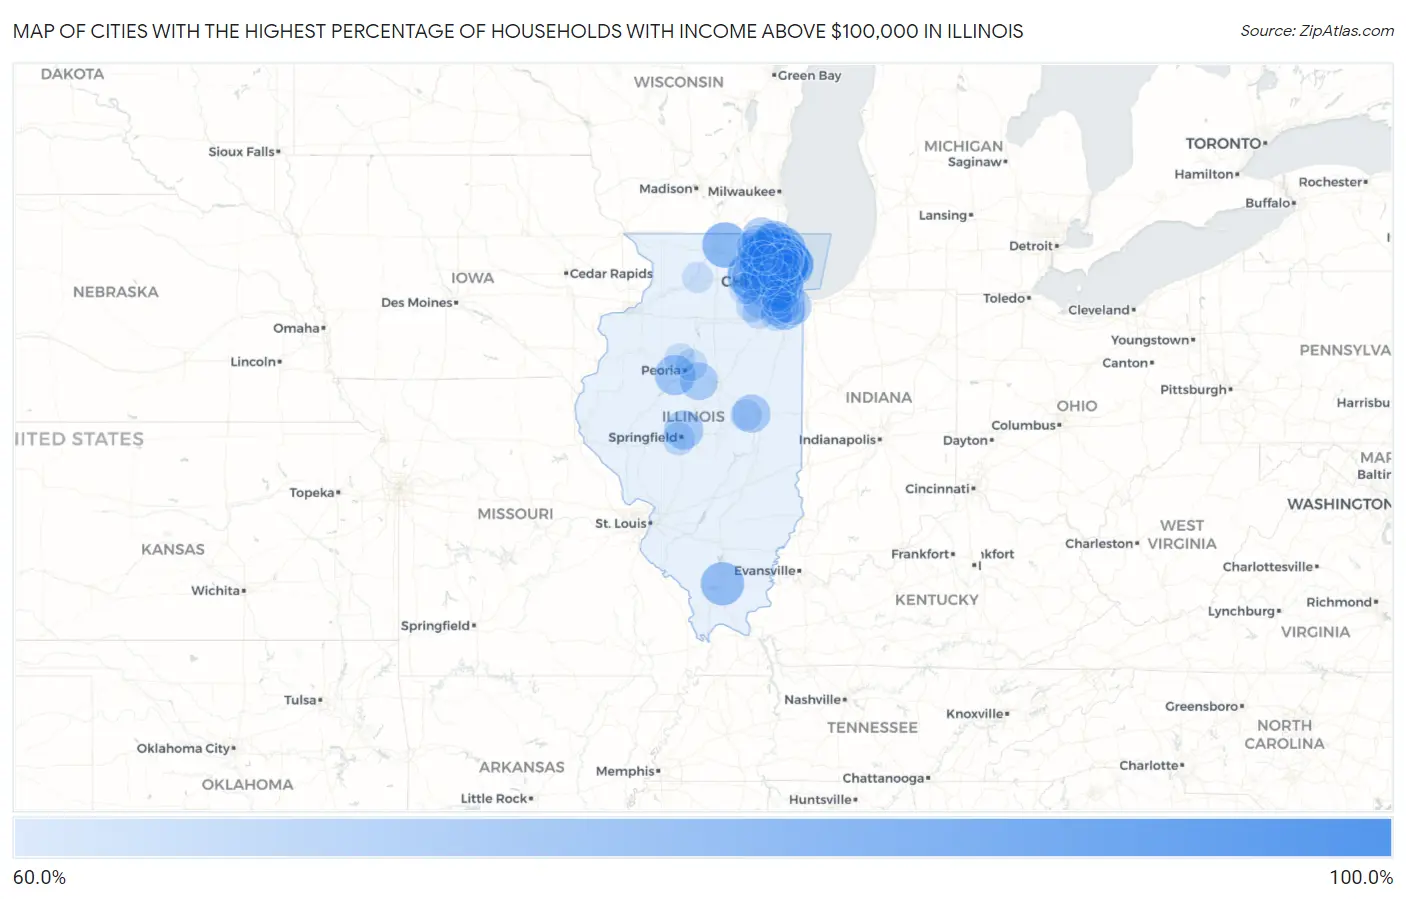
Map of Cities with the Highest Percentage of Households with Income Above $100,000 in Illinois
0.0%
100.0%
Cities with the Highest Percentage of Households with Income Above $100,000 in Illinois
| City | Households with Income > $100k | vs State | vs National | |
| 1. | Bloomfield | 100.0% | 39.1%(+60.9)#1 | 37.3%(+62.7)#65 |
| 2. | Lynn Center | 100.0% | 39.1%(+60.9)#2 | 37.3%(+62.7)#149 |
| 3. | Long Grove | 85.5% | 39.1%(+46.4)#3 | 37.3%(+48.2)#331 |
| 4. | Riverwoods | 83.1% | 39.1%(+44.0)#4 | 37.3%(+45.8)#409 |
| 5. | Smithville | 83.1% | 39.1%(+44.0)#5 | 37.3%(+45.8)#411 |
| 6. | Campton Hills | 83.0% | 39.1%(+43.9)#6 | 37.3%(+45.7)#414 |
| 7. | Kildeer | 82.8% | 39.1%(+43.7)#7 | 37.3%(+45.5)#425 |
| 8. | Triumph | 82.6% | 39.1%(+43.5)#8 | 37.3%(+45.3)#441 |
| 9. | South Barrington | 80.3% | 39.1%(+41.2)#9 | 37.3%(+43.0)#531 |
| 10. | Timberlane | 80.1% | 39.1%(+41.0)#10 | 37.3%(+42.8)#543 |
| 11. | Indian Creek | 80.1% | 39.1%(+41.0)#11 | 37.3%(+42.8)#546 |
| 12. | Winnetka | 80.0% | 39.1%(+40.9)#12 | 37.3%(+42.7)#549 |
| 13. | North Barrington | 80.0% | 39.1%(+40.9)#13 | 37.3%(+42.7)#551 |
| 14. | Trout Valley | 79.6% | 39.1%(+40.5)#14 | 37.3%(+42.3)#573 |
| 15. | Kenilworth | 79.5% | 39.1%(+40.4)#15 | 37.3%(+42.2)#581 |
| 16. | Hinsdale | 79.1% | 39.1%(+40.0)#16 | 37.3%(+41.8)#603 |
| 17. | Western Springs | 79.1% | 39.1%(+40.0)#17 | 37.3%(+41.8)#604 |
| 18. | Hawthorn Woods | 78.7% | 39.1%(+39.6)#18 | 37.3%(+41.4)#632 |
| 19. | Glencoe | 78.5% | 39.1%(+39.4)#19 | 37.3%(+41.2)#642 |
| 20. | Plum Valley | 78.5% | 39.1%(+39.4)#20 | 37.3%(+41.2)#645 |
| 21. | Golf | 78.3% | 39.1%(+39.2)#21 | 37.3%(+41.0)#658 |
| 22. | Inverness | 77.8% | 39.1%(+38.7)#22 | 37.3%(+40.5)#697 |
| 23. | Third Lake | 77.8% | 39.1%(+38.7)#23 | 37.3%(+40.5)#702 |
| 24. | Lake Bluff | 77.7% | 39.1%(+38.6)#24 | 37.3%(+40.4)#708 |
| 25. | Barrington Hills | 77.7% | 39.1%(+38.6)#25 | 37.3%(+40.4)#709 |
| 26. | Whiteash | 77.5% | 39.1%(+38.4)#26 | 37.3%(+40.2)#730 |
| 27. | Deer Park | 77.2% | 39.1%(+38.1)#27 | 37.3%(+39.9)#746 |
| 28. | Lake Camelot | 73.9% | 39.1%(+34.8)#28 | 37.3%(+36.6)#990 |
| 29. | Ridgefield | 73.8% | 39.1%(+34.7)#29 | 37.3%(+36.5)#1,002 |
| 30. | Deerfield | 73.7% | 39.1%(+34.6)#30 | 37.3%(+36.4)#1,006 |
| 31. | Frankfort | 73.4% | 39.1%(+34.3)#31 | 37.3%(+36.1)#1,032 |
| 32. | Sherman | 72.1% | 39.1%(+33.0)#32 | 37.3%(+34.8)#1,147 |
| 33. | Mettawa | 72.1% | 39.1%(+33.0)#33 | 37.3%(+34.8)#1,148 |
| 34. | Lake Forest | 71.8% | 39.1%(+32.7)#34 | 37.3%(+34.5)#1,174 |
| 35. | Custer Park | 71.8% | 39.1%(+32.7)#35 | 37.3%(+34.5)#1,185 |
| 36. | Wayne | 71.2% | 39.1%(+32.1)#36 | 37.3%(+33.9)#1,232 |
| 37. | Dundas | 71.1% | 39.1%(+32.0)#37 | 37.3%(+33.8)#1,245 |
| 38. | Seymour | 70.9% | 39.1%(+31.8)#38 | 37.3%(+33.6)#1,261 |
| 39. | Libertyville | 70.7% | 39.1%(+31.6)#39 | 37.3%(+33.4)#1,270 |
| 40. | Heritage Lake | 70.5% | 39.1%(+31.4)#40 | 37.3%(+33.2)#1,288 |
| 41. | Port Barrington | 70.5% | 39.1%(+31.4)#41 | 37.3%(+33.2)#1,289 |
| 42. | Flossmoor | 70.4% | 39.1%(+31.3)#42 | 37.3%(+33.1)#1,298 |
| 43. | Spring Grove | 70.2% | 39.1%(+31.1)#43 | 37.3%(+32.9)#1,314 |
| 44. | Westlake | 69.9% | 39.1%(+30.8)#44 | 37.3%(+32.6)#1,343 |
| 45. | Wilmette | 69.5% | 39.1%(+30.4)#45 | 37.3%(+32.2)#1,375 |
| 46. | Plainfield | 69.4% | 39.1%(+30.3)#46 | 37.3%(+32.1)#1,389 |
| 47. | East Lynn | 69.4% | 39.1%(+30.3)#47 | 37.3%(+32.1)#1,396 |
| 48. | Sleepy Hollow | 69.2% | 39.1%(+30.1)#48 | 37.3%(+31.9)#1,417 |
| 49. | Lake Zurich | 69.0% | 39.1%(+29.9)#49 | 37.3%(+31.7)#1,440 |
| 50. | Prairie Grove | 68.4% | 39.1%(+29.3)#50 | 37.3%(+31.1)#1,521 |
| 51. | Riverside | 68.0% | 39.1%(+28.9)#51 | 37.3%(+30.7)#1,568 |
| 52. | Lincolnshire | 68.0% | 39.1%(+28.9)#52 | 37.3%(+30.7)#1,569 |
| 53. | Alexander | 68.0% | 39.1%(+28.9)#53 | 37.3%(+30.7)#1,576 |
| 54. | Burr Ridge | 67.9% | 39.1%(+28.8)#54 | 37.3%(+30.6)#1,586 |
| 55. | Volo | 67.9% | 39.1%(+28.8)#55 | 37.3%(+30.6)#1,589 |
| 56. | Solon Mills | 67.7% | 39.1%(+28.6)#56 | 37.3%(+30.4)#1,620 |
| 57. | Gilberts | 67.1% | 39.1%(+28.0)#57 | 37.3%(+29.8)#1,665 |
| 58. | Highland Park | 66.8% | 39.1%(+27.7)#58 | 37.3%(+29.5)#1,683 |
| 59. | Lindenhurst | 66.8% | 39.1%(+27.7)#59 | 37.3%(+29.5)#1,685 |
| 60. | Prestbury | 66.6% | 39.1%(+27.5)#60 | 37.3%(+29.3)#1,739 |
| 61. | Tower Lakes | 66.5% | 39.1%(+27.4)#61 | 37.3%(+29.2)#1,756 |
| 62. | Naperville | 66.4% | 39.1%(+27.3)#62 | 37.3%(+29.1)#1,762 |
| 63. | Bull Valley | 66.3% | 39.1%(+27.2)#63 | 37.3%(+29.0)#1,783 |
| 64. | New Lenox | 66.2% | 39.1%(+27.1)#64 | 37.3%(+28.9)#1,790 |
| 65. | Oak Brook | 65.8% | 39.1%(+26.7)#65 | 37.3%(+28.5)#1,838 |
| 66. | Northbrook | 65.7% | 39.1%(+26.6)#66 | 37.3%(+28.4)#1,850 |
| 67. | Leland Grove | 64.5% | 39.1%(+25.4)#67 | 37.3%(+27.2)#1,999 |
| 68. | Bannockburn | 64.5% | 39.1%(+25.4)#68 | 37.3%(+27.2)#2,001 |
| 69. | Lily Lake | 64.4% | 39.1%(+25.3)#69 | 37.3%(+27.1)#2,019 |
| 70. | Minooka | 64.3% | 39.1%(+25.2)#70 | 37.3%(+27.0)#2,026 |
| 71. | La Grange | 64.2% | 39.1%(+25.1)#71 | 37.3%(+26.9)#2,036 |
| 72. | Geneva | 64.0% | 39.1%(+24.9)#72 | 37.3%(+26.7)#2,066 |
| 73. | Mokena | 64.0% | 39.1%(+24.9)#73 | 37.3%(+26.7)#2,067 |
| 74. | Plattville | 64.0% | 39.1%(+24.9)#74 | 37.3%(+26.7)#2,075 |
| 75. | Algonquin | 63.9% | 39.1%(+24.8)#75 | 37.3%(+26.6)#2,080 |
| 76. | Argyle | 63.9% | 39.1%(+24.8)#76 | 37.3%(+26.6)#2,090 |
| 77. | Elmhurst | 63.7% | 39.1%(+24.6)#77 | 37.3%(+26.4)#2,100 |
| 78. | Ringwood | 63.7% | 39.1%(+24.6)#78 | 37.3%(+26.4)#2,110 |
| 79. | Palos Park | 63.6% | 39.1%(+24.5)#79 | 37.3%(+26.3)#2,120 |
| 80. | River Forest | 63.5% | 39.1%(+24.4)#80 | 37.3%(+26.2)#2,133 |
| 81. | Bartlett | 63.3% | 39.1%(+24.2)#81 | 37.3%(+26.0)#2,153 |
| 82. | Germantown Hills | 63.3% | 39.1%(+24.2)#82 | 37.3%(+26.0)#2,157 |
| 83. | Manhattan | 63.2% | 39.1%(+24.1)#83 | 37.3%(+25.9)#2,170 |
| 84. | Prairietown | 63.0% | 39.1%(+23.9)#84 | 37.3%(+25.7)#2,227 |
| 85. | White Heath | 62.9% | 39.1%(+23.8)#85 | 37.3%(+25.6)#2,245 |
| 86. | Big Rock | 62.6% | 39.1%(+23.5)#86 | 37.3%(+25.3)#2,280 |
| 87. | Park Ridge | 62.4% | 39.1%(+23.3)#87 | 37.3%(+25.1)#2,305 |
| 88. | Dunlap | 62.3% | 39.1%(+23.2)#88 | 37.3%(+25.0)#2,333 |
| 89. | Lemont | 62.2% | 39.1%(+23.1)#89 | 37.3%(+24.9)#2,345 |
| 90. | Winfield | 62.2% | 39.1%(+23.1)#90 | 37.3%(+24.9)#2,348 |
| 91. | Lost Nation | 61.8% | 39.1%(+22.7)#91 | 37.3%(+24.5)#2,424 |
| 92. | Lake Villa | 61.7% | 39.1%(+22.6)#92 | 37.3%(+24.4)#2,433 |
| 93. | Glenview | 61.6% | 39.1%(+22.5)#93 | 37.3%(+24.3)#2,451 |
| 94. | Buffalo Grove | 61.5% | 39.1%(+22.4)#94 | 37.3%(+24.2)#2,459 |
| 95. | Homer Glen | 61.4% | 39.1%(+22.3)#95 | 37.3%(+24.1)#2,486 |
| 96. | Northfield | 61.4% | 39.1%(+22.3)#96 | 37.3%(+24.1)#2,492 |
| 97. | Itasca | 61.2% | 39.1%(+22.1)#97 | 37.3%(+23.9)#2,527 |
| 98. | Frankfort Square | 61.2% | 39.1%(+22.1)#98 | 37.3%(+23.9)#2,528 |
| 99. | Fox River Grove | 61.2% | 39.1%(+22.1)#99 | 37.3%(+23.9)#2,529 |
| 100. | Barrington | 60.7% | 39.1%(+21.6)#100 | 37.3%(+23.4)#2,611 |
Common Questions
What are the Top 10 Cities with the Highest Percentage of Households with Income Above $100,000 in Illinois?
Top 10 Cities with the Highest Percentage of Households with Income Above $100,000 in Illinois are:
#1
85.5%
#2
83.1%
#3
83.0%
#4
82.8%
#5
80.3%
#6
80.1%
#7
80.1%
#8
80.0%
#9
80.0%
#10
79.6%
What city has the Highest Percentage of Households with Income Above $100,000 in Illinois?
Long Grove has the Highest Percentage of Households with Income Above $100,000 in Illinois with 85.5%.
What is the Percentage of Households with Income Above $100,000 in the State of Illinois?
Percentage of Households with Income Above $100,000 in Illinois is 39.1%.
What is the Percentage of Households with Income Above $100,000 in the United States?
Percentage of Households with Income Above $100,000 in the United States is 37.3%.