Cities with the Highest Percentage of Households with Income Above $100,000 in Kansas
RELATED REPORTS & OPTIONS
Household Income | $100k+
Kansas
Compare Cities
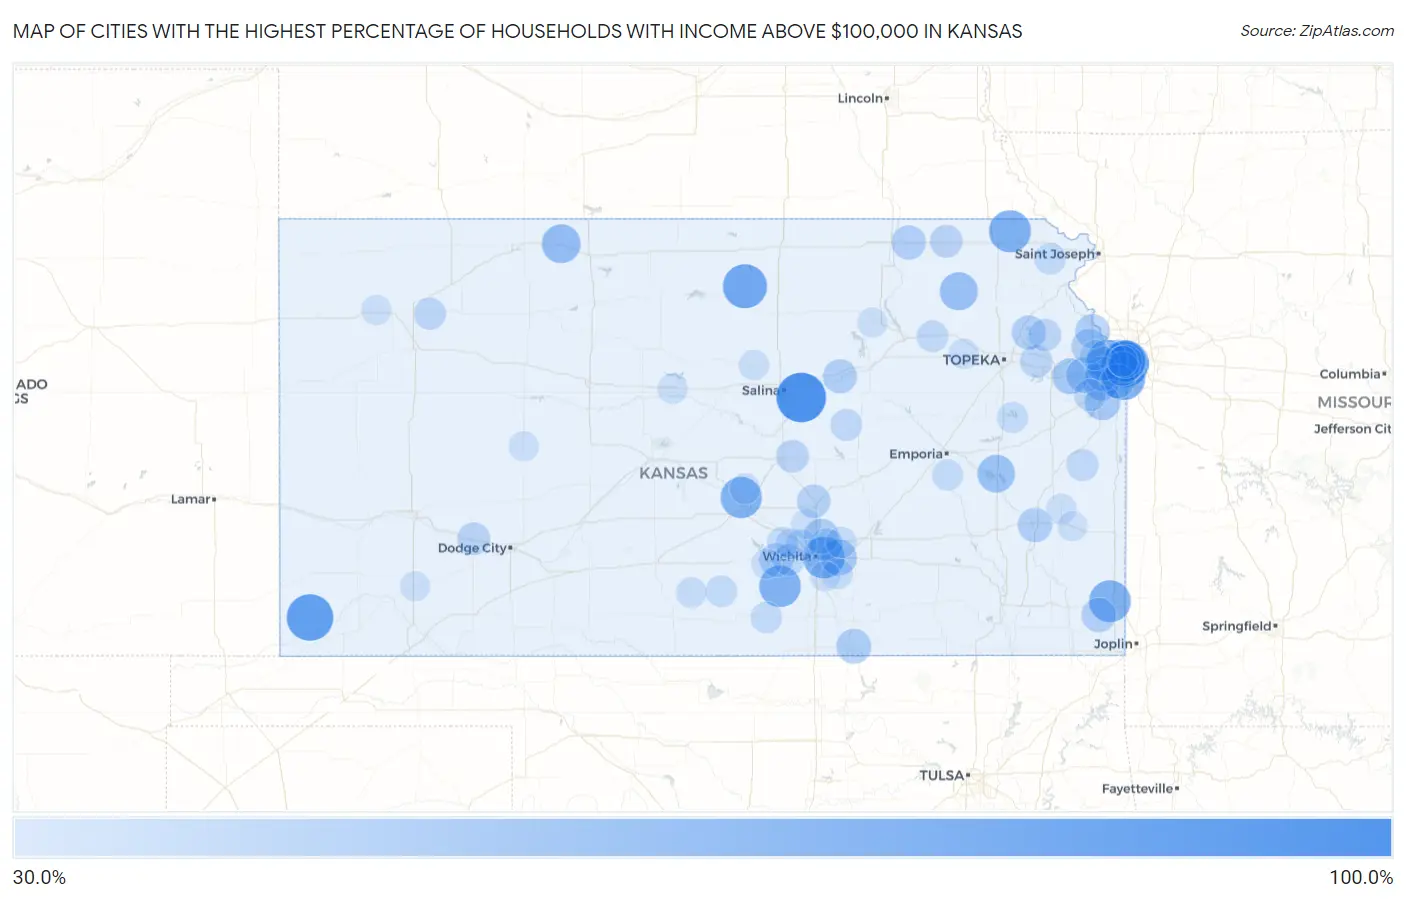
Map of Cities with the Highest Percentage of Households with Income Above $100,000 in Kansas
0.0%
100.0%
Cities with the Highest Percentage of Households with Income Above $100,000 in Kansas
| City | Households with Income > $100k | vs State | vs National | |
| 1. | Kipp | 100.0% | 33.0%(+67.0)#1 | 37.3%(+62.7)#74 |
| 2. | Devon | 100.0% | 33.0%(+67.0)#2 | 37.3%(+62.7)#111 |
| 3. | Idana | 100.0% | 33.0%(+67.0)#3 | 37.3%(+62.7)#132 |
| 4. | St. Benedict | 100.0% | 33.0%(+67.0)#4 | 37.3%(+62.7)#134 |
| 5. | Mont Ida | 100.0% | 33.0%(+67.0)#5 | 37.3%(+62.7)#143 |
| 6. | Big Bow | 100.0% | 33.0%(+67.0)#6 | 37.3%(+62.7)#161 |
| 7. | Ogallah | 100.0% | 33.0%(+67.0)#7 | 37.3%(+62.7)#175 |
| 8. | Woodruff | 100.0% | 33.0%(+67.0)#8 | 37.3%(+62.7)#196 |
| 9. | Mission Hills | 91.4% | 33.0%(+58.4)#9 | 37.3%(+54.1)#231 |
| 10. | Richfield | 90.0% | 33.0%(+57.0)#10 | 37.3%(+52.7)#255 |
| 11. | Elyria | 89.5% | 33.0%(+56.5)#11 | 37.3%(+52.2)#266 |
| 12. | Sycamore | 88.4% | 33.0%(+55.4)#12 | 37.3%(+51.1)#282 |
| 13. | Piedmont | 83.7% | 33.0%(+50.7)#13 | 37.3%(+46.4)#381 |
| 14. | Scottsville | 81.8% | 33.0%(+48.8)#14 | 37.3%(+44.5)#468 |
| 15. | Leawood | 77.0% | 33.0%(+44.0)#15 | 37.3%(+39.7)#766 |
| 16. | Mission Woods | 75.4% | 33.0%(+42.4)#16 | 37.3%(+38.1)#866 |
| 17. | Hamlin | 75.0% | 33.0%(+42.0)#17 | 37.3%(+37.7)#909 |
| 18. | Chicopee | 74.1% | 33.0%(+41.1)#18 | 37.3%(+36.8)#974 |
| 19. | Eastborough | 73.9% | 33.0%(+40.9)#19 | 37.3%(+36.6)#992 |
| 20. | Viola | 73.5% | 33.0%(+40.5)#20 | 37.3%(+36.2)#1,031 |
| 21. | Willowbrook | 72.3% | 33.0%(+39.3)#21 | 37.3%(+35.0)#1,130 |
| 22. | Fairway | 71.5% | 33.0%(+38.5)#22 | 37.3%(+34.2)#1,201 |
| 23. | Westwood Hills | 71.4% | 33.0%(+38.4)#23 | 37.3%(+34.1)#1,216 |
| 24. | South Mound | 70.6% | 33.0%(+37.6)#24 | 37.3%(+33.3)#1,284 |
| 25. | Hallowell | 70.5% | 33.0%(+37.5)#25 | 37.3%(+33.2)#1,293 |
| 26. | Lake Quivira | 69.3% | 33.0%(+36.3)#26 | 37.3%(+32.0)#1,411 |
| 27. | Furley | 68.0% | 33.0%(+35.0)#27 | 37.3%(+30.7)#1,580 |
| 28. | Croweburg | 65.6% | 33.0%(+32.6)#28 | 37.3%(+28.3)#1,869 |
| 29. | Prairie View | 64.1% | 33.0%(+31.1)#29 | 37.3%(+26.8)#2,063 |
| 30. | Neal | 64.0% | 33.0%(+31.0)#30 | 37.3%(+26.7)#2,078 |
| 31. | Havensville | 61.9% | 33.0%(+28.9)#31 | 37.3%(+24.6)#2,413 |
| 32. | New Strawn | 60.6% | 33.0%(+27.6)#32 | 37.3%(+23.3)#2,635 |
| 33. | Newbury | 58.8% | 33.0%(+25.8)#33 | 37.3%(+21.5)#2,956 |
| 34. | Yale | 56.5% | 33.0%(+23.5)#34 | 37.3%(+19.2)#3,341 |
| 35. | Andover | 55.9% | 33.0%(+22.9)#35 | 37.3%(+18.6)#3,428 |
| 36. | Bremen | 55.2% | 33.0%(+22.2)#36 | 37.3%(+17.9)#3,577 |
| 37. | Olathe | 54.6% | 33.0%(+21.6)#37 | 37.3%(+17.3)#3,680 |
| 38. | Eudora | 54.6% | 33.0%(+21.6)#38 | 37.3%(+17.3)#3,684 |
| 39. | Spring Hill | 53.4% | 33.0%(+20.4)#39 | 37.3%(+16.1)#3,928 |
| 40. | De Soto | 53.3% | 33.0%(+20.3)#40 | 37.3%(+16.0)#3,959 |
| 41. | Kechi | 52.1% | 33.0%(+19.1)#41 | 37.3%(+14.8)#4,232 |
| 42. | Monument | 52.0% | 33.0%(+19.0)#42 | 37.3%(+14.7)#4,264 |
| 43. | Parkerfield | 51.6% | 33.0%(+18.6)#43 | 37.3%(+14.3)#4,349 |
| 44. | Shawnee | 50.7% | 33.0%(+17.7)#44 | 37.3%(+13.4)#4,531 |
| 45. | Lenexa | 50.7% | 33.0%(+17.7)#45 | 37.3%(+13.4)#4,532 |
| 46. | Basehor | 50.6% | 33.0%(+17.6)#46 | 37.3%(+13.3)#4,562 |
| 47. | Overland Park | 50.4% | 33.0%(+17.4)#47 | 37.3%(+13.1)#4,590 |
| 48. | Lansing | 50.4% | 33.0%(+17.4)#48 | 37.3%(+13.1)#4,597 |
| 49. | Radley | 50.0% | 33.0%(+17.0)#49 | 37.3%(+12.7)#4,723 |
| 50. | Home | 50.0% | 33.0%(+17.0)#50 | 37.3%(+12.7)#4,736 |
| 51. | Roseland | 50.0% | 33.0%(+17.0)#51 | 37.3%(+12.7)#4,746 |
| 52. | Bassett | 50.0% | 33.0%(+17.0)#52 | 37.3%(+12.7)#4,754 |
| 53. | Prairie Village | 49.8% | 33.0%(+16.8)#53 | 37.3%(+12.5)#4,795 |
| 54. | Ozawkie | 49.2% | 33.0%(+16.2)#54 | 37.3%(+11.9)#4,955 |
| 55. | Detroit | 49.1% | 33.0%(+16.1)#55 | 37.3%(+11.8)#4,992 |
| 56. | Garden Plain | 48.7% | 33.0%(+15.7)#56 | 37.3%(+11.4)#5,081 |
| 57. | Pilsen | 47.6% | 33.0%(+14.6)#57 | 37.3%(+10.3)#5,379 |
| 58. | Westwood | 47.3% | 33.0%(+14.3)#58 | 37.3%(+10.00)#5,462 |
| 59. | Bel Aire | 47.2% | 33.0%(+14.2)#59 | 37.3%(+9.90)#5,478 |
| 60. | North Newton | 47.2% | 33.0%(+14.2)#60 | 37.3%(+9.90)#5,485 |
| 61. | Peck | 46.4% | 33.0%(+13.4)#61 | 37.3%(+9.10)#5,729 |
| 62. | Cimarron | 45.2% | 33.0%(+12.2)#62 | 37.3%(+7.90)#6,061 |
| 63. | Galva | 45.1% | 33.0%(+12.1)#63 | 37.3%(+7.80)#6,089 |
| 64. | Keats | 45.0% | 33.0%(+12.0)#64 | 37.3%(+7.70)#6,131 |
| 65. | Baileyville | 45.0% | 33.0%(+12.0)#65 | 37.3%(+7.70)#6,133 |
| 66. | Lecompton | 44.6% | 33.0%(+11.6)#66 | 37.3%(+7.30)#6,246 |
| 67. | Oskaloosa | 43.4% | 33.0%(+10.4)#67 | 37.3%(+6.10)#6,608 |
| 68. | Gardner | 43.2% | 33.0%(+10.2)#68 | 37.3%(+5.90)#6,659 |
| 69. | Menlo | 42.8% | 33.0%(+9.80)#69 | 37.3%(+5.50)#6,810 |
| 70. | Parker | 42.5% | 33.0%(+9.50)#70 | 37.3%(+5.20)#6,894 |
| 71. | Ramona | 42.4% | 33.0%(+9.40)#71 | 37.3%(+5.10)#6,941 |
| 72. | Goddard | 42.2% | 33.0%(+9.20)#72 | 37.3%(+4.90)#6,985 |
| 73. | Wamego | 41.9% | 33.0%(+8.90)#73 | 37.3%(+4.60)#7,072 |
| 74. | Spivey | 41.4% | 33.0%(+8.40)#74 | 37.3%(+4.10)#7,249 |
| 75. | Denton | 41.3% | 33.0%(+8.30)#75 | 37.3%(+4.00)#7,288 |
| 76. | Beaumont | 41.2% | 33.0%(+8.20)#76 | 37.3%(+3.90)#7,326 |
| 77. | Argonia | 40.7% | 33.0%(+7.70)#77 | 37.3%(+3.40)#7,470 |
| 78. | Maize | 40.4% | 33.0%(+7.40)#78 | 37.3%(+3.10)#7,572 |
| 79. | Andale | 40.4% | 33.0%(+7.40)#79 | 37.3%(+3.10)#7,590 |
| 80. | Benton | 40.3% | 33.0%(+7.30)#80 | 37.3%(+3.00)#7,628 |
| 81. | Olpe | 40.3% | 33.0%(+7.30)#81 | 37.3%(+3.00)#7,631 |
| 82. | Vassar | 40.1% | 33.0%(+7.10)#82 | 37.3%(+2.80)#7,687 |
| 83. | Rose Hill | 39.4% | 33.0%(+6.40)#83 | 37.3%(+2.10)#7,926 |
| 84. | Colwich | 39.2% | 33.0%(+6.20)#84 | 37.3%(+1.90)#7,991 |
| 85. | Nashville | 39.1% | 33.0%(+6.10)#85 | 37.3%(+1.80)#8,050 |
| 86. | The Highlands | 38.7% | 33.0%(+5.70)#86 | 37.3%(+1.40)#8,207 |
| 87. | Roeland Park | 38.0% | 33.0%(+5.00)#87 | 37.3%(+0.700)#8,460 |
| 88. | Maple Hill | 37.6% | 33.0%(+4.60)#88 | 37.3%(+0.300)#8,619 |
| 89. | Tescott | 37.6% | 33.0%(+4.60)#89 | 37.3%(+0.300)#8,628 |
| 90. | Derby | 37.5% | 33.0%(+4.50)#90 | 37.3%(+0.200)#8,638 |
| 91. | Sedgwick | 37.5% | 33.0%(+4.50)#91 | 37.3%(+0.200)#8,657 |
| 92. | Mildred | 37.5% | 33.0%(+4.50)#92 | 37.3%(+0.200)#8,691 |
| 93. | Bonner Springs | 37.4% | 33.0%(+4.40)#93 | 37.3%(+0.100)#8,702 |
| 94. | Ness City | 37.3% | 33.0%(+4.30)#94 | 37.3%(=0.000)#8,754 |
| 95. | Dorrance | 37.3% | 33.0%(+4.30)#95 | 37.3%(=0.000)#8,767 |
| 96. | Riley | 37.2% | 33.0%(+4.20)#96 | 37.3%(-0.100)#8,795 |
| 97. | Levant | 37.2% | 33.0%(+4.20)#97 | 37.3%(-0.100)#8,816 |
| 98. | Cheney | 37.1% | 33.0%(+4.10)#98 | 37.3%(-0.200)#8,838 |
| 99. | Sublette | 37.1% | 33.0%(+4.10)#99 | 37.3%(-0.200)#8,842 |
| 100. | Bronson | 37.0% | 33.0%(+4.00)#100 | 37.3%(-0.300)#8,887 |
Common Questions
What are the Top 10 Cities with the Highest Percentage of Households with Income Above $100,000 in Kansas?
Top 10 Cities with the Highest Percentage of Households with Income Above $100,000 in Kansas are:
#1
100.0%
#2
91.4%
#3
90.0%
#4
81.8%
#5
77.0%
#6
75.4%
#7
75.0%
#8
74.1%
#9
73.9%
#10
73.5%
What city has the Highest Percentage of Households with Income Above $100,000 in Kansas?
Kipp has the Highest Percentage of Households with Income Above $100,000 in Kansas with 100.0%.
What is the Percentage of Households with Income Above $100,000 in the State of Kansas?
Percentage of Households with Income Above $100,000 in Kansas is 33.0%.
What is the Percentage of Households with Income Above $100,000 in the United States?
Percentage of Households with Income Above $100,000 in the United States is 37.3%.