Cities with the Highest Percentage of Households with Income Above $100,000 in Utah
RELATED REPORTS & OPTIONS
Household Income | $100k+
Utah
Compare Cities
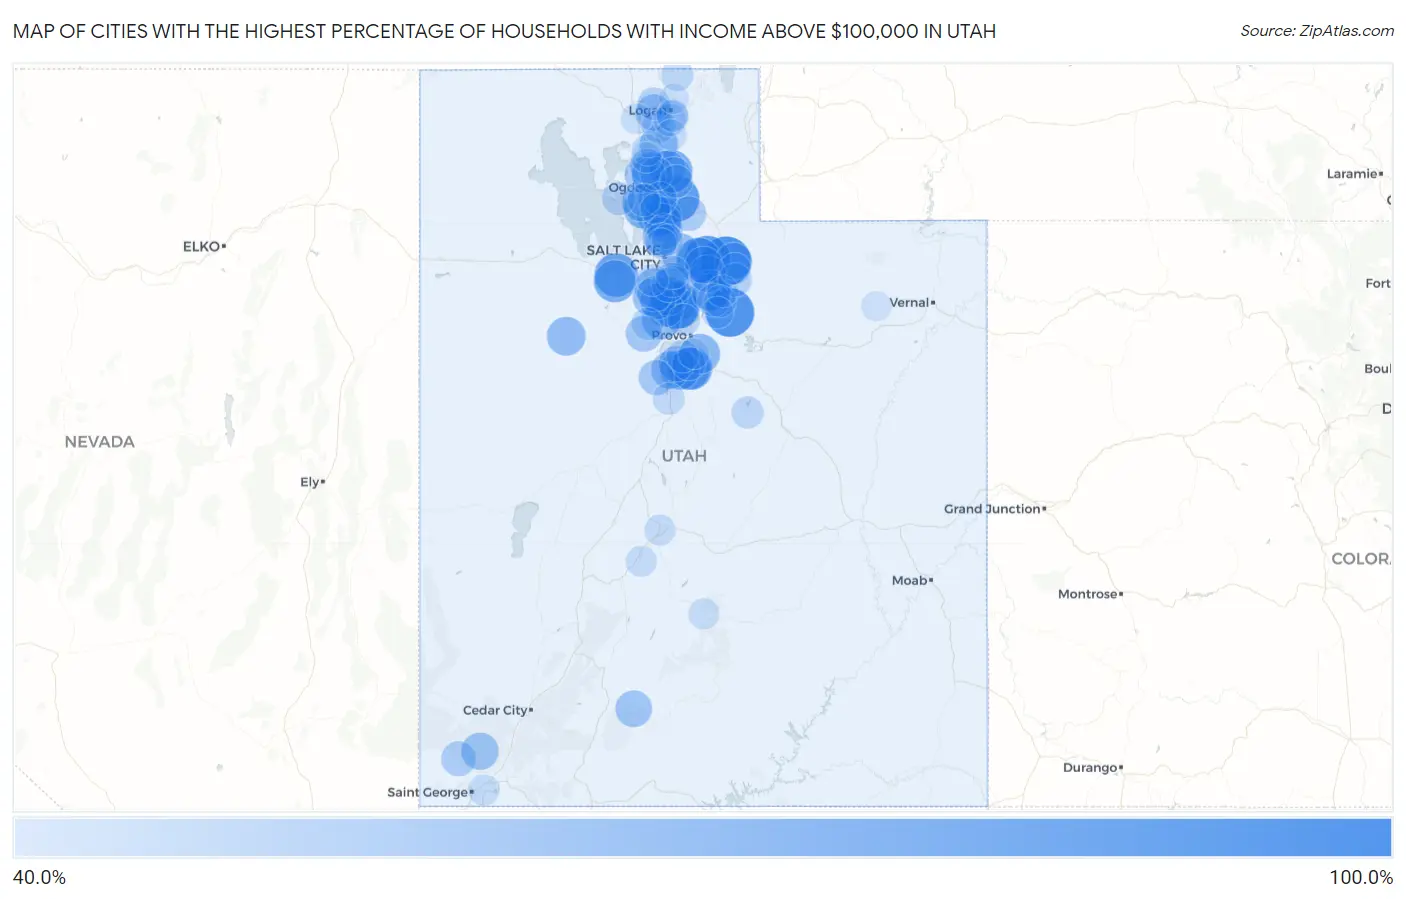
Map of Cities with the Highest Percentage of Households with Income Above $100,000 in Utah
0.0%
100.0%
Cities with the Highest Percentage of Households with Income Above $100,000 in Utah
| City | Households with Income > $100k | vs State | vs National | |
| 1. | Peoa | 84.9% | 42.6%(+42.3)#1 | 37.3%(+47.6)#347 |
| 2. | Independence | 82.8% | 42.6%(+40.2)#2 | 37.3%(+45.5)#431 |
| 3. | Mountain Green | 78.2% | 42.6%(+35.6)#3 | 37.3%(+40.9)#664 |
| 4. | East Basin | 77.9% | 42.6%(+35.3)#4 | 37.3%(+40.6)#688 |
| 5. | Silver Summit | 77.2% | 42.6%(+34.6)#5 | 37.3%(+39.9)#748 |
| 6. | Highland | 76.7% | 42.6%(+34.1)#6 | 37.3%(+39.4)#778 |
| 7. | Sundance | 75.0% | 42.6%(+32.4)#7 | 37.3%(+37.7)#908 |
| 8. | Summit Park | 74.6% | 42.6%(+32.0)#8 | 37.3%(+37.3)#926 |
| 9. | Brighton | 73.8% | 42.6%(+31.2)#9 | 37.3%(+36.5)#1,004 |
| 10. | Stansbury Park | 72.7% | 42.6%(+30.1)#10 | 37.3%(+35.4)#1,091 |
| 11. | Wolf Creek | 70.6% | 42.6%(+28.0)#11 | 37.3%(+33.3)#1,281 |
| 12. | Erda | 69.8% | 42.6%(+27.2)#12 | 37.3%(+32.5)#1,350 |
| 13. | Elk Ridge | 69.5% | 42.6%(+26.9)#13 | 37.3%(+32.2)#1,381 |
| 14. | Woodland Hills | 69.3% | 42.6%(+26.7)#14 | 37.3%(+32.0)#1,409 |
| 15. | Hobble Creek | 67.8% | 42.6%(+25.2)#15 | 37.3%(+30.5)#1,610 |
| 16. | Kaysville | 66.2% | 42.6%(+23.6)#16 | 37.3%(+28.9)#1,789 |
| 17. | Alpine | 66.1% | 42.6%(+23.5)#17 | 37.3%(+28.8)#1,805 |
| 18. | Mapleton | 65.5% | 42.6%(+22.9)#18 | 37.3%(+28.2)#1,874 |
| 19. | Syracuse | 65.4% | 42.6%(+22.8)#19 | 37.3%(+28.1)#1,884 |
| 20. | Interlaken | 65.3% | 42.6%(+22.7)#20 | 37.3%(+28.0)#1,902 |
| 21. | Spring Lake | 64.4% | 42.6%(+21.8)#21 | 37.3%(+27.1)#2,020 |
| 22. | Pleasant View | 63.9% | 42.6%(+21.3)#22 | 37.3%(+26.6)#2,083 |
| 23. | Cedar Hills | 63.9% | 42.6%(+21.3)#23 | 37.3%(+26.6)#2,084 |
| 24. | Saratoga Springs | 63.0% | 42.6%(+20.4)#24 | 37.3%(+25.7)#2,204 |
| 25. | South Weber | 63.0% | 42.6%(+20.4)#25 | 37.3%(+25.7)#2,211 |
| 26. | Midway | 62.9% | 42.6%(+20.3)#26 | 37.3%(+25.6)#2,240 |
| 27. | Dugway | 62.9% | 42.6%(+20.3)#27 | 37.3%(+25.6)#2,244 |
| 28. | Mantua | 62.5% | 42.6%(+19.9)#28 | 37.3%(+25.2)#2,291 |
| 29. | Emigration Canyon | 62.4% | 42.6%(+19.8)#29 | 37.3%(+25.1)#2,320 |
| 30. | Draper | 62.2% | 42.6%(+19.6)#30 | 37.3%(+24.9)#2,341 |
| 31. | South Jordan | 62.0% | 42.6%(+19.4)#31 | 37.3%(+24.7)#2,374 |
| 32. | Fruit Heights | 61.8% | 42.6%(+19.2)#32 | 37.3%(+24.5)#2,418 |
| 33. | Farmington | 61.2% | 42.6%(+18.6)#33 | 37.3%(+23.9)#2,524 |
| 34. | West Point | 61.2% | 42.6%(+18.6)#34 | 37.3%(+23.9)#2,526 |
| 35. | Granite | 61.0% | 42.6%(+18.4)#35 | 37.3%(+23.7)#2,576 |
| 36. | Genola | 60.8% | 42.6%(+18.2)#36 | 37.3%(+23.5)#2,602 |
| 37. | West Bountiful | 60.0% | 42.6%(+17.4)#37 | 37.3%(+22.7)#2,729 |
| 38. | Oakley | 59.8% | 42.6%(+17.2)#38 | 37.3%(+22.5)#2,773 |
| 39. | Pine Valley | 59.8% | 42.6%(+17.2)#39 | 37.3%(+22.5)#2,783 |
| 40. | Lehi | 59.7% | 42.6%(+17.1)#40 | 37.3%(+22.4)#2,784 |
| 41. | Herriman | 59.6% | 42.6%(+17.0)#41 | 37.3%(+22.3)#2,805 |
| 42. | Park City | 59.6% | 42.6%(+17.0)#42 | 37.3%(+22.3)#2,809 |
| 43. | Snyderville | 59.5% | 42.6%(+16.9)#43 | 37.3%(+22.2)#2,832 |
| 44. | Bryce Canyon City | 58.8% | 42.6%(+16.2)#44 | 37.3%(+21.5)#2,950 |
| 45. | Liberty | 58.5% | 42.6%(+15.9)#45 | 37.3%(+21.2)#2,996 |
| 46. | Mendon | 58.2% | 42.6%(+15.6)#46 | 37.3%(+20.9)#3,044 |
| 47. | Bluffdale | 57.9% | 42.6%(+15.3)#47 | 37.3%(+20.6)#3,080 |
| 48. | Fairfield | 57.6% | 42.6%(+15.0)#48 | 37.3%(+20.3)#3,143 |
| 49. | Eden | 57.3% | 42.6%(+14.7)#49 | 37.3%(+20.0)#3,193 |
| 50. | Plain City | 57.0% | 42.6%(+14.4)#50 | 37.3%(+19.7)#3,241 |
| 51. | Riverton | 56.7% | 42.6%(+14.1)#51 | 37.3%(+19.4)#3,284 |
| 52. | West Mountain | 56.6% | 42.6%(+14.0)#52 | 37.3%(+19.3)#3,313 |
| 53. | Elberta | 56.3% | 42.6%(+13.7)#53 | 37.3%(+19.0)#3,374 |
| 54. | Centerville | 56.2% | 42.6%(+13.6)#54 | 37.3%(+18.9)#3,377 |
| 55. | South Willard | 55.9% | 42.6%(+13.3)#55 | 37.3%(+18.6)#3,438 |
| 56. | Veyo | 55.3% | 42.6%(+12.7)#56 | 37.3%(+18.0)#3,557 |
| 57. | Morgan | 54.9% | 42.6%(+12.3)#57 | 37.3%(+17.6)#3,625 |
| 58. | Cottonwood Heights | 54.3% | 42.6%(+11.7)#58 | 37.3%(+17.0)#3,744 |
| 59. | Sandy | 54.2% | 42.6%(+11.6)#59 | 37.3%(+16.9)#3,764 |
| 60. | Farr West | 54.0% | 42.6%(+11.4)#60 | 37.3%(+16.7)#3,810 |
| 61. | Woods Cross | 53.3% | 42.6%(+10.7)#61 | 37.3%(+16.0)#3,953 |
| 62. | Uintah | 53.0% | 42.6%(+10.4)#62 | 37.3%(+15.7)#4,015 |
| 63. | Francis | 52.9% | 42.6%(+10.3)#63 | 37.3%(+15.6)#4,043 |
| 64. | Holladay | 52.3% | 42.6%(+9.70)#64 | 37.3%(+15.0)#4,161 |
| 65. | North Ogden | 52.3% | 42.6%(+9.70)#65 | 37.3%(+15.0)#4,166 |
| 66. | Salem | 52.1% | 42.6%(+9.50)#66 | 37.3%(+14.8)#4,225 |
| 67. | Hooper | 52.0% | 42.6%(+9.40)#67 | 37.3%(+14.7)#4,249 |
| 68. | Wellsville | 51.5% | 42.6%(+8.90)#68 | 37.3%(+14.2)#4,363 |
| 69. | Huntsville | 51.2% | 42.6%(+8.60)#69 | 37.3%(+13.9)#4,440 |
| 70. | Charleston | 51.2% | 42.6%(+8.60)#70 | 37.3%(+13.9)#4,442 |
| 71. | Peter | 51.1% | 42.6%(+8.50)#71 | 37.3%(+13.8)#4,464 |
| 72. | Benjamin | 50.7% | 42.6%(+8.10)#72 | 37.3%(+13.4)#4,545 |
| 73. | Eagle Mountain | 50.6% | 42.6%(+8.00)#73 | 37.3%(+13.3)#4,555 |
| 74. | Clinton | 50.6% | 42.6%(+8.00)#74 | 37.3%(+13.3)#4,557 |
| 75. | Lindon | 50.2% | 42.6%(+7.60)#75 | 37.3%(+12.9)#4,633 |
| 76. | Nibley | 50.2% | 42.6%(+7.60)#76 | 37.3%(+12.9)#4,635 |
| 77. | Cove | 50.0% | 42.6%(+7.40)#77 | 37.3%(+12.7)#4,706 |
| 78. | Scofield | 50.0% | 42.6%(+7.40)#78 | 37.3%(+12.7)#4,741 |
| 79. | Daniel | 49.6% | 42.6%(+7.00)#79 | 37.3%(+12.3)#4,863 |
| 80. | Heber | 49.4% | 42.6%(+6.80)#80 | 37.3%(+12.1)#4,898 |
| 81. | West Jordan | 49.3% | 42.6%(+6.70)#81 | 37.3%(+12.0)#4,918 |
| 82. | Marion | 49.2% | 42.6%(+6.60)#82 | 37.3%(+11.9)#4,956 |
| 83. | Providence | 49.1% | 42.6%(+6.50)#83 | 37.3%(+11.8)#4,972 |
| 84. | Mona | 49.1% | 42.6%(+6.50)#84 | 37.3%(+11.8)#4,982 |
| 85. | Wallsburg | 48.9% | 42.6%(+6.30)#85 | 37.3%(+11.6)#5,038 |
| 86. | Millville | 48.8% | 42.6%(+6.20)#86 | 37.3%(+11.5)#5,056 |
| 87. | Perry | 48.5% | 42.6%(+5.90)#87 | 37.3%(+11.2)#5,124 |
| 88. | Bountiful | 48.3% | 42.6%(+5.70)#88 | 37.3%(+11.0)#5,167 |
| 89. | Washington | 48.3% | 42.6%(+5.70)#89 | 37.3%(+11.0)#5,169 |
| 90. | Paradise | 48.3% | 42.6%(+5.70)#90 | 37.3%(+11.0)#5,184 |
| 91. | Aurora | 47.9% | 42.6%(+5.30)#91 | 37.3%(+10.6)#5,282 |
| 92. | Central Valley | 47.8% | 42.6%(+5.20)#92 | 37.3%(+10.5)#5,311 |
| 93. | Bicknell | 47.7% | 42.6%(+5.10)#93 | 37.3%(+10.4)#5,341 |
| 94. | North Salt Lake | 47.6% | 42.6%(+5.00)#94 | 37.3%(+10.3)#5,354 |
| 95. | Elwood | 47.4% | 42.6%(+4.80)#95 | 37.3%(+10.1)#5,422 |
| 96. | Spanish Fork | 47.2% | 42.6%(+4.60)#96 | 37.3%(+9.90)#5,476 |
| 97. | Willard | 46.9% | 42.6%(+4.30)#97 | 37.3%(+9.60)#5,576 |
| 98. | Layton | 46.1% | 42.6%(+3.50)#98 | 37.3%(+8.80)#5,795 |
| 99. | Hyde Park | 46.1% | 42.6%(+3.50)#99 | 37.3%(+8.80)#5,805 |
| 100. | Neola | 46.1% | 42.6%(+3.50)#100 | 37.3%(+8.80)#5,820 |
Common Questions
What are the Top 10 Cities with the Highest Percentage of Households with Income Above $100,000 in Utah?
Top 10 Cities with the Highest Percentage of Households with Income Above $100,000 in Utah are:
#1
84.9%
#2
82.8%
#3
78.2%
#4
77.2%
#5
76.7%
#6
74.6%
#7
72.7%
#8
70.6%
#9
69.8%
#10
69.5%
What city has the Highest Percentage of Households with Income Above $100,000 in Utah?
Peoa has the Highest Percentage of Households with Income Above $100,000 in Utah with 84.9%.
What is the Percentage of Households with Income Above $100,000 in the State of Utah?
Percentage of Households with Income Above $100,000 in Utah is 42.6%.
What is the Percentage of Households with Income Above $100,000 in the United States?
Percentage of Households with Income Above $100,000 in the United States is 37.3%.