Cities with the Highest Percentage of Households with Income Above $100,000 in Alabama
RELATED REPORTS & OPTIONS
Household Income | $100k+
Alabama
Compare Cities
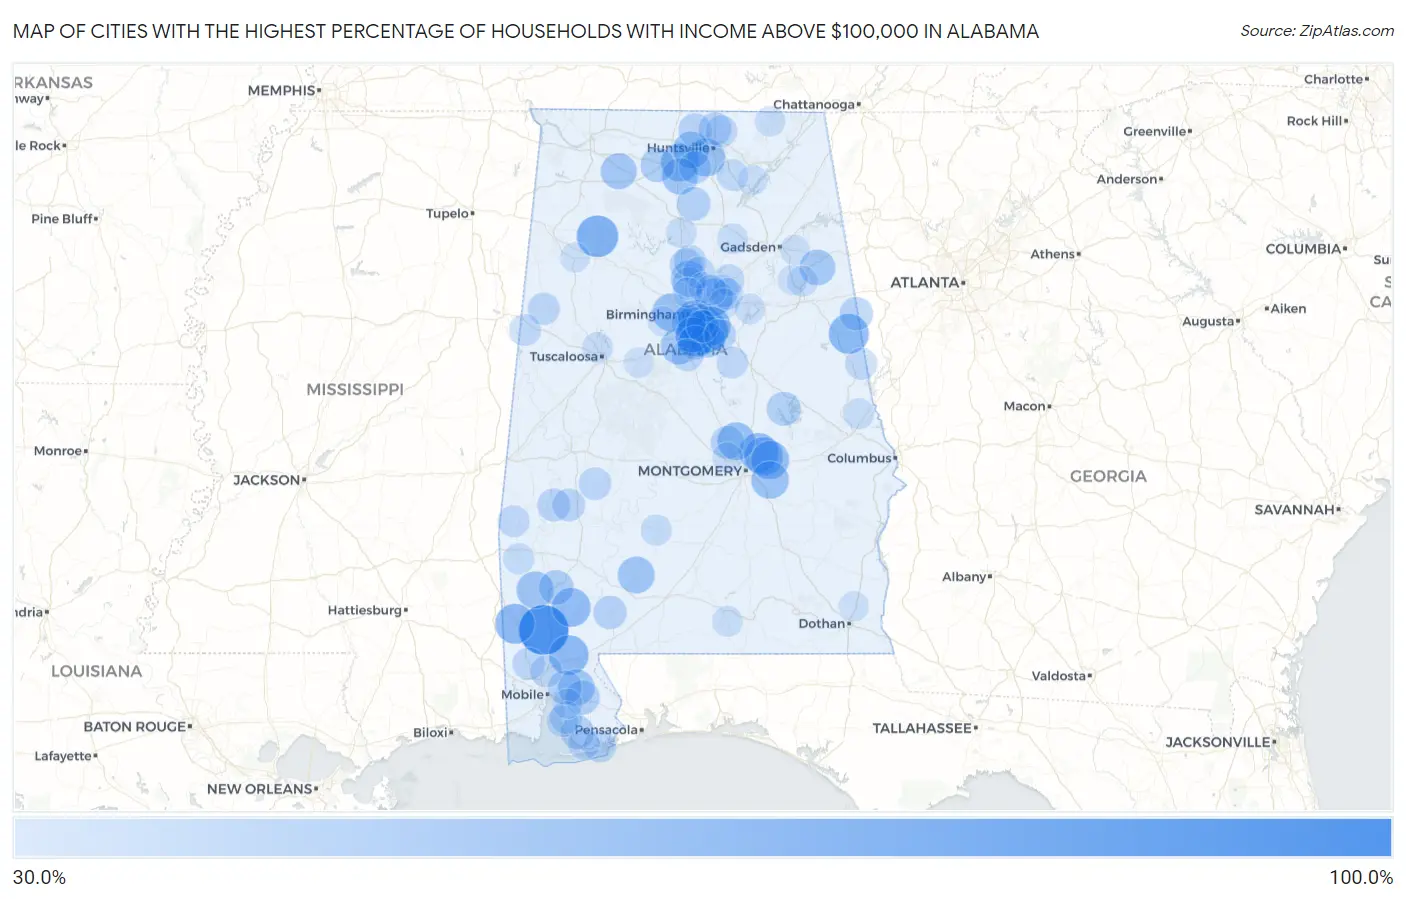
Map of Cities with the Highest Percentage of Households with Income Above $100,000 in Alabama
0.0%
100.0%
Cities with the Highest Percentage of Households with Income Above $100,000 in Alabama
| City | Households with Income > $100k | vs State | vs National | |
| 1. | Fairford | 100.0% | 27.9%(+72.1)#1 | 37.3%(+62.7)#26 |
| 2. | Highland Lakes | 76.7% | 27.9%(+48.8)#2 | 37.3%(+39.4)#780 |
| 3. | Natural Bridge | 72.7% | 27.9%(+44.8)#3 | 37.3%(+35.4)#1,103 |
| 4. | Eagle Point | 70.6% | 27.9%(+42.7)#4 | 37.3%(+33.3)#1,279 |
| 5. | Meadowbrook | 70.3% | 27.9%(+42.4)#5 | 37.3%(+33.0)#1,307 |
| 6. | Mountain Brook | 69.6% | 27.9%(+41.7)#6 | 37.3%(+32.3)#1,367 |
| 7. | Indian Springs Village | 68.8% | 27.9%(+40.9)#7 | 37.3%(+31.5)#1,464 |
| 8. | Woodland | 67.3% | 27.9%(+39.4)#8 | 37.3%(+30.0)#1,650 |
| 9. | Deer Park | 66.7% | 27.9%(+38.8)#9 | 37.3%(+29.4)#1,720 |
| 10. | Stockton | 66.1% | 27.9%(+38.2)#10 | 37.3%(+28.8)#1,813 |
| 11. | Shoal Creek | 64.3% | 27.9%(+36.4)#11 | 37.3%(+27.0)#2,030 |
| 12. | Blue Ridge | 63.5% | 27.9%(+35.6)#12 | 37.3%(+26.2)#2,140 |
| 13. | Carlton | 63.2% | 27.9%(+35.3)#13 | 37.3%(+25.9)#2,180 |
| 14. | Hanover | 62.1% | 27.9%(+34.2)#14 | 37.3%(+24.8)#2,372 |
| 15. | Redland | 61.8% | 27.9%(+33.9)#15 | 37.3%(+24.5)#2,419 |
| 16. | Mooresville | 61.1% | 27.9%(+33.2)#16 | 37.3%(+23.8)#2,557 |
| 17. | Emerald Mountain | 60.9% | 27.9%(+33.0)#17 | 37.3%(+23.6)#2,586 |
| 18. | Redstone Arsenal | 60.6% | 27.9%(+32.7)#18 | 37.3%(+23.3)#2,633 |
| 19. | Edgewater | 60.6% | 27.9%(+32.7)#19 | 37.3%(+23.3)#2,634 |
| 20. | Vestavia Hills | 59.7% | 27.9%(+31.8)#20 | 37.3%(+22.4)#2,785 |
| 21. | Trussville | 59.6% | 27.9%(+31.7)#21 | 37.3%(+22.3)#2,806 |
| 22. | Deatsville | 59.6% | 27.9%(+31.7)#22 | 37.3%(+22.3)#2,817 |
| 23. | Pike Road | 59.4% | 27.9%(+31.5)#23 | 37.3%(+22.1)#2,847 |
| 24. | Hobson | 57.8% | 27.9%(+29.9)#24 | 37.3%(+20.5)#3,109 |
| 25. | Peterman | 57.1% | 27.9%(+29.2)#25 | 37.3%(+19.8)#3,228 |
| 26. | Madison | 56.3% | 27.9%(+28.4)#26 | 37.3%(+19.0)#3,362 |
| 27. | Stapleton | 56.1% | 27.9%(+28.2)#27 | 37.3%(+18.8)#3,403 |
| 28. | Priceville | 55.3% | 27.9%(+27.4)#28 | 37.3%(+18.0)#3,548 |
| 29. | Helena | 55.1% | 27.9%(+27.2)#29 | 37.3%(+17.8)#3,581 |
| 30. | Hatton | 54.3% | 27.9%(+26.4)#30 | 37.3%(+17.0)#3,758 |
| 31. | Kimberly | 54.0% | 27.9%(+26.1)#31 | 37.3%(+16.7)#3,815 |
| 32. | Nances Creek | 53.5% | 27.9%(+25.6)#32 | 37.3%(+16.2)#3,922 |
| 33. | Chelsea | 51.8% | 27.9%(+23.9)#33 | 37.3%(+14.5)#4,283 |
| 34. | Hoover | 50.8% | 27.9%(+22.9)#34 | 37.3%(+13.5)#4,511 |
| 35. | Leroy | 50.0% | 27.9%(+22.1)#35 | 37.3%(+12.7)#4,700 |
| 36. | Homewood | 49.8% | 27.9%(+21.9)#36 | 37.3%(+12.5)#4,793 |
| 37. | Trinity | 49.2% | 27.9%(+21.3)#37 | 37.3%(+11.9)#4,951 |
| 38. | Loxley | 48.6% | 27.9%(+20.7)#38 | 37.3%(+11.3)#5,103 |
| 39. | Spanish Fort | 47.8% | 27.9%(+19.9)#39 | 37.3%(+10.5)#5,297 |
| 40. | Our Town | 47.6% | 27.9%(+19.7)#40 | 37.3%(+10.3)#5,373 |
| 41. | Pelham | 47.5% | 27.9%(+19.6)#41 | 37.3%(+10.2)#5,382 |
| 42. | Eva | 46.8% | 27.9%(+18.9)#42 | 37.3%(+9.50)#5,609 |
| 43. | Uriah | 46.0% | 27.9%(+18.1)#43 | 37.3%(+8.70)#5,844 |
| 44. | Ranburne | 45.8% | 27.9%(+17.9)#44 | 37.3%(+8.50)#5,890 |
| 45. | Magnolia Springs | 45.7% | 27.9%(+17.8)#45 | 37.3%(+8.40)#5,919 |
| 46. | Pine Level | 45.6% | 27.9%(+17.7)#46 | 37.3%(+8.30)#5,943 |
| 47. | Harvest | 45.0% | 27.9%(+17.1)#47 | 37.3%(+7.70)#6,117 |
| 48. | Smoke Rise | 44.9% | 27.9%(+17.0)#48 | 37.3%(+7.60)#6,155 |
| 49. | Meridianville | 44.7% | 27.9%(+16.8)#49 | 37.3%(+7.40)#6,203 |
| 50. | Nanafalia | 44.4% | 27.9%(+16.5)#50 | 37.3%(+7.10)#6,314 |
| 51. | Morris | 44.1% | 27.9%(+16.2)#51 | 37.3%(+6.80)#6,379 |
| 52. | Sweet Water | 44.1% | 27.9%(+16.2)#52 | 37.3%(+6.80)#6,394 |
| 53. | Mount Olive Cdp Jefferson County | 44.0% | 27.9%(+16.1)#53 | 37.3%(+6.70)#6,412 |
| 54. | Alabaster | 43.1% | 27.9%(+15.2)#54 | 37.3%(+5.80)#6,685 |
| 55. | Thomaston | 43.0% | 27.9%(+15.1)#55 | 37.3%(+5.70)#6,730 |
| 56. | Triana | 42.9% | 27.9%(+15.0)#56 | 37.3%(+5.60)#6,751 |
| 57. | Orange Beach | 42.8% | 27.9%(+14.9)#57 | 37.3%(+5.50)#6,787 |
| 58. | Chunchula | 42.8% | 27.9%(+14.9)#58 | 37.3%(+5.50)#6,805 |
| 59. | Fairhope | 42.6% | 27.9%(+14.7)#59 | 37.3%(+5.30)#6,842 |
| 60. | Brook Highland | 42.6% | 27.9%(+14.7)#60 | 37.3%(+5.30)#6,852 |
| 61. | Millport | 42.2% | 27.9%(+14.3)#61 | 37.3%(+4.90)#6,988 |
| 62. | Satsuma | 41.8% | 27.9%(+13.9)#62 | 37.3%(+4.50)#7,098 |
| 63. | Argo | 41.8% | 27.9%(+13.9)#63 | 37.3%(+4.50)#7,100 |
| 64. | Hayden | 41.8% | 27.9%(+13.9)#64 | 37.3%(+4.50)#7,105 |
| 65. | Westover | 41.3% | 27.9%(+13.4)#65 | 37.3%(+4.00)#7,268 |
| 66. | Moores Mill | 41.1% | 27.9%(+13.2)#66 | 37.3%(+3.80)#7,338 |
| 67. | Rock Mills | 41.1% | 27.9%(+13.2)#67 | 37.3%(+3.80)#7,352 |
| 68. | County Line | 40.9% | 27.9%(+13.0)#68 | 37.3%(+3.60)#7,411 |
| 69. | Needham | 40.7% | 27.9%(+12.8)#69 | 37.3%(+3.40)#7,479 |
| 70. | Bon Secour | 40.4% | 27.9%(+12.5)#70 | 37.3%(+3.10)#7,579 |
| 71. | Fayetteville | 40.4% | 27.9%(+12.5)#71 | 37.3%(+3.10)#7,589 |
| 72. | Macedonia | 40.4% | 27.9%(+12.5)#72 | 37.3%(+3.10)#7,602 |
| 73. | Springville | 40.2% | 27.9%(+12.3)#73 | 37.3%(+2.90)#7,650 |
| 74. | Point Clear | 39.7% | 27.9%(+11.8)#74 | 37.3%(+2.40)#7,835 |
| 75. | New Hope | 39.3% | 27.9%(+11.4)#75 | 37.3%(+2.00)#7,949 |
| 76. | Mccalla | 39.2% | 27.9%(+11.3)#76 | 37.3%(+1.90)#7,978 |
| 77. | Margaret | 39.1% | 27.9%(+11.2)#77 | 37.3%(+1.80)#8,021 |
| 78. | Cullomburg | 38.9% | 27.9%(+11.0)#78 | 37.3%(+1.60)#8,130 |
| 79. | Oak Hill | 38.5% | 27.9%(+10.6)#79 | 37.3%(+1.20)#8,311 |
| 80. | Cusseta | 37.6% | 27.9%(+9.70)#80 | 37.3%(+0.300)#8,631 |
| 81. | Weaver | 37.5% | 27.9%(+9.60)#81 | 37.3%(+0.200)#8,652 |
| 82. | Northport | 37.4% | 27.9%(+9.50)#82 | 37.3%(+0.100)#8,692 |
| 83. | Good Hope | 37.4% | 27.9%(+9.50)#83 | 37.3%(+0.100)#8,711 |
| 84. | Susan Moore | 37.2% | 27.9%(+9.30)#84 | 37.3%(-0.100)#8,788 |
| 85. | Libertyville | 37.2% | 27.9%(+9.30)#85 | 37.3%(-0.100)#8,813 |
| 86. | Pinson | 37.1% | 27.9%(+9.20)#86 | 37.3%(-0.200)#8,830 |
| 87. | Moody | 36.9% | 27.9%(+9.00)#87 | 37.3%(-0.400)#8,901 |
| 88. | Clay | 36.9% | 27.9%(+9.00)#88 | 37.3%(-0.400)#8,902 |
| 89. | Prattville | 36.0% | 27.9%(+8.10)#89 | 37.3%(-1.30)#9,251 |
| 90. | Hytop | 36.0% | 27.9%(+8.10)#90 | 37.3%(-1.30)#9,280 |
| 91. | Pell City | 35.9% | 27.9%(+8.00)#91 | 37.3%(-1.40)#9,305 |
| 92. | Alexandria | 35.8% | 27.9%(+7.90)#92 | 37.3%(-1.50)#9,346 |
| 93. | Grant | 35.8% | 27.9%(+7.90)#93 | 37.3%(-1.50)#9,354 |
| 94. | Vance | 35.8% | 27.9%(+7.90)#94 | 37.3%(-1.50)#9,355 |
| 95. | Gardendale | 35.7% | 27.9%(+7.80)#95 | 37.3%(-1.60)#9,379 |
| 96. | Headland | 35.6% | 27.9%(+7.70)#96 | 37.3%(-1.70)#9,418 |
| 97. | Daphne | 35.5% | 27.9%(+7.60)#97 | 37.3%(-1.80)#9,451 |
| 98. | Concord | 35.5% | 27.9%(+7.60)#98 | 37.3%(-1.80)#9,471 |
| 99. | Hokes Bluff | 35.4% | 27.9%(+7.50)#99 | 37.3%(-1.90)#9,504 |
| 100. | Winfield | 35.3% | 27.9%(+7.40)#100 | 37.3%(-2.00)#9,564 |
Common Questions
What are the Top 10 Cities with the Highest Percentage of Households with Income Above $100,000 in Alabama?
Top 10 Cities with the Highest Percentage of Households with Income Above $100,000 in Alabama are:
#1
100.0%
#2
76.7%
#3
72.7%
#4
70.3%
#5
69.6%
#6
68.8%
#7
67.3%
#8
66.7%
#9
66.1%
#10
64.3%
What city has the Highest Percentage of Households with Income Above $100,000 in Alabama?
Fairford has the Highest Percentage of Households with Income Above $100,000 in Alabama with 100.0%.
What is the Percentage of Households with Income Above $100,000 in the State of Alabama?
Percentage of Households with Income Above $100,000 in Alabama is 27.9%.
What is the Percentage of Households with Income Above $100,000 in the United States?
Percentage of Households with Income Above $100,000 in the United States is 37.3%.