Cities with the Highest Percentage of Households with Income Above $100,000 in Mississippi
RELATED REPORTS & OPTIONS
Household Income | $100k+
Mississippi
Compare Cities
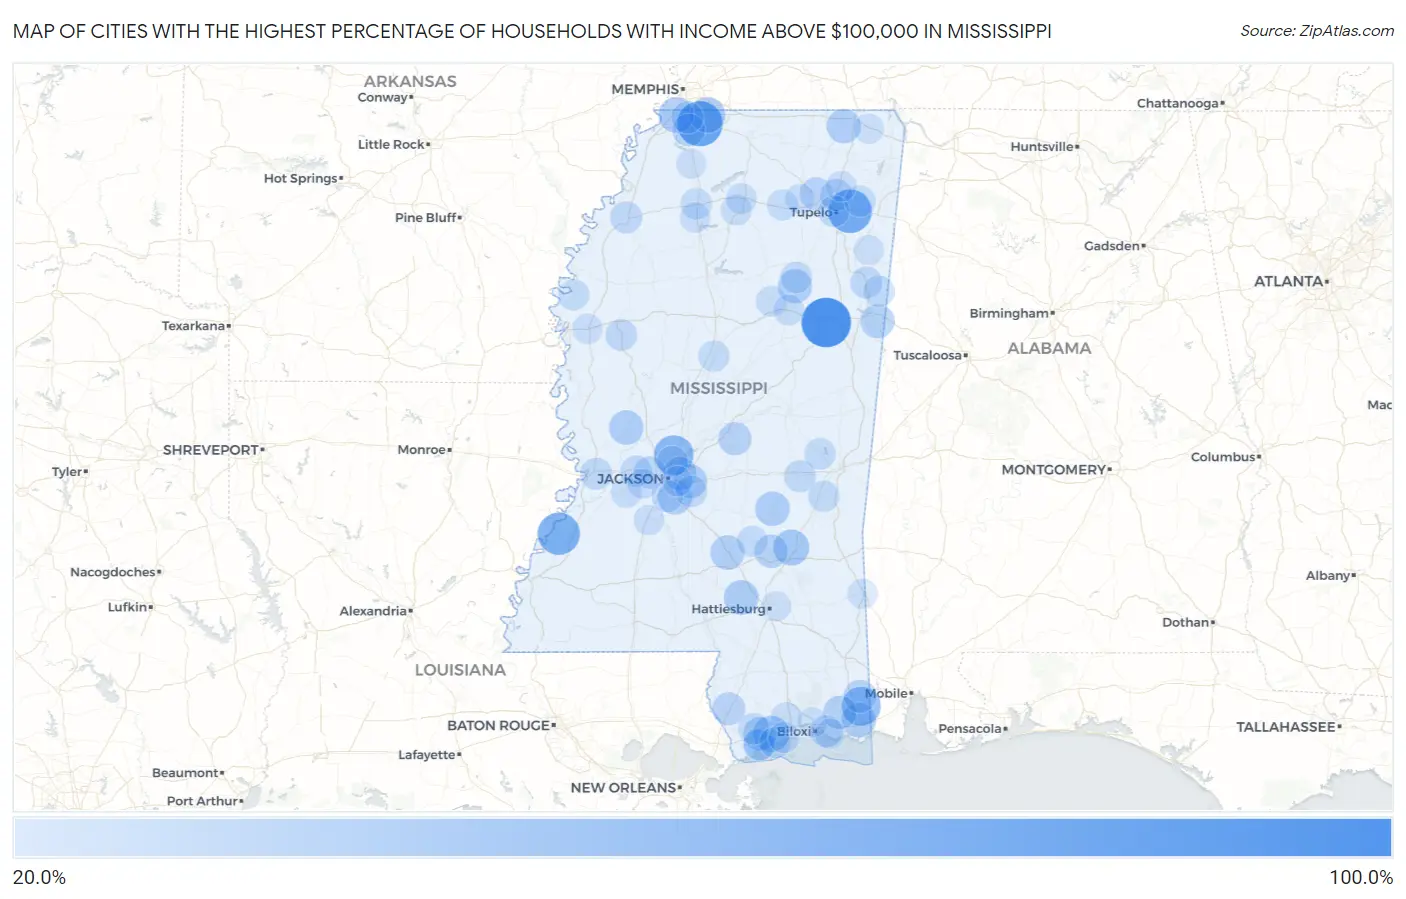
Map of Cities with the Highest Percentage of Households with Income Above $100,000 in Mississippi
0.0%
100.0%
Cities with the Highest Percentage of Households with Income Above $100,000 in Mississippi
| City | Households with Income > $100k | vs State | vs National | |
| 1. | Mississippi State | 100.0% | 23.5%(+76.5)#1 | 37.3%(+62.7)#2 |
| 2. | Ovett | 100.0% | 23.5%(+76.5)#2 | 37.3%(+62.7)#57 |
| 3. | Bolivar | 100.0% | 23.5%(+76.5)#3 | 37.3%(+62.7)#108 |
| 4. | Red Banks | 100.0% | 23.5%(+76.5)#4 | 37.3%(+62.7)#117 |
| 5. | Scott | 100.0% | 23.5%(+76.5)#5 | 37.3%(+62.7)#125 |
| 6. | Longview | 93.9% | 23.5%(+70.4)#6 | 37.3%(+56.6)#211 |
| 7. | Bridgetown | 83.1% | 23.5%(+59.6)#7 | 37.3%(+45.8)#410 |
| 8. | Mooreville | 76.9% | 23.5%(+53.4)#8 | 37.3%(+39.6)#773 |
| 9. | New Site | 74.3% | 23.5%(+50.8)#9 | 37.3%(+37.0)#957 |
| 10. | Alcorn State University | 71.4% | 23.5%(+47.9)#10 | 37.3%(+34.1)#1,213 |
| 11. | Bogue Chitto Cdp Kemper And Neshoba Counties | 63.1% | 23.5%(+39.6)#11 | 37.3%(+25.8)#2,199 |
| 12. | Madison | 61.1% | 23.5%(+37.6)#12 | 37.3%(+23.8)#2,541 |
| 13. | Big Point | 58.6% | 23.5%(+35.1)#13 | 37.3%(+21.3)#2,982 |
| 14. | Bogue Chitto | 56.0% | 23.5%(+32.5)#14 | 37.3%(+18.7)#3,421 |
| 15. | Bobo | 53.1% | 23.5%(+29.6)#15 | 37.3%(+15.8)#4,000 |
| 16. | Grace | 52.8% | 23.5%(+29.3)#16 | 37.3%(+15.5)#4,066 |
| 17. | Runnelstown | 51.4% | 23.5%(+27.9)#17 | 37.3%(+14.1)#4,399 |
| 18. | Gluckstadt | 48.8% | 23.5%(+25.3)#18 | 37.3%(+11.5)#5,053 |
| 19. | Delisle | 47.9% | 23.5%(+24.4)#19 | 37.3%(+10.6)#5,279 |
| 20. | Independence | 47.3% | 23.5%(+23.8)#20 | 37.3%(+10.00)#5,474 |
| 21. | Sharon | 47.2% | 23.5%(+23.7)#21 | 37.3%(+9.90)#5,486 |
| 22. | Olive Branch | 46.1% | 23.5%(+22.6)#22 | 37.3%(+8.80)#5,796 |
| 23. | Victoria | 45.5% | 23.5%(+22.0)#23 | 37.3%(+8.20)#5,981 |
| 24. | Lynchburg | 45.2% | 23.5%(+21.7)#24 | 37.3%(+7.90)#6,060 |
| 25. | Wheeler | 44.3% | 23.5%(+20.8)#25 | 37.3%(+7.00)#6,334 |
| 26. | Helena | 42.6% | 23.5%(+19.1)#26 | 37.3%(+5.30)#6,866 |
| 27. | Sumrall | 42.5% | 23.5%(+19.0)#27 | 37.3%(+5.20)#6,882 |
| 28. | Satartia | 41.7% | 23.5%(+18.2)#28 | 37.3%(+4.40)#7,150 |
| 29. | Louin | 41.4% | 23.5%(+17.9)#29 | 37.3%(+4.10)#7,244 |
| 30. | Mount Olive | 41.0% | 23.5%(+17.5)#30 | 37.3%(+3.70)#7,370 |
| 31. | Kossuth | 40.8% | 23.5%(+17.3)#31 | 37.3%(+3.50)#7,441 |
| 32. | Florence | 40.7% | 23.5%(+17.2)#32 | 37.3%(+3.40)#7,453 |
| 33. | Brandon | 40.2% | 23.5%(+16.7)#33 | 37.3%(+2.90)#7,638 |
| 34. | Mantee | 40.1% | 23.5%(+16.6)#34 | 37.3%(+2.80)#7,694 |
| 35. | Flowood | 40.0% | 23.5%(+16.5)#35 | 37.3%(+2.70)#7,707 |
| 36. | New Hope | 39.8% | 23.5%(+16.3)#36 | 37.3%(+2.50)#7,800 |
| 37. | Diamondhead | 38.2% | 23.5%(+14.7)#37 | 37.3%(+0.900)#8,395 |
| 38. | Vancleave | 38.0% | 23.5%(+14.5)#38 | 37.3%(+0.700)#8,465 |
| 39. | Soso | 37.5% | 23.5%(+14.0)#39 | 37.3%(+0.200)#8,669 |
| 40. | Stewart | 37.5% | 23.5%(+14.0)#40 | 37.3%(+0.200)#8,677 |
| 41. | Rena Lara | 37.1% | 23.5%(+13.6)#41 | 37.3%(-0.200)#8,860 |
| 42. | Lena | 36.9% | 23.5%(+13.4)#42 | 37.3%(-0.400)#8,931 |
| 43. | Hide A Way Lake | 36.2% | 23.5%(+12.7)#43 | 37.3%(-1.10)#9,171 |
| 44. | Hurley | 36.2% | 23.5%(+12.7)#44 | 37.3%(-1.10)#9,179 |
| 45. | Blue Springs | 35.6% | 23.5%(+12.1)#45 | 37.3%(-1.70)#9,444 |
| 46. | Hernando | 35.3% | 23.5%(+11.8)#46 | 37.3%(-2.00)#9,555 |
| 47. | Eastabuchie | 34.8% | 23.5%(+11.3)#47 | 37.3%(-2.50)#9,814 |
| 48. | Clinton | 34.0% | 23.5%(+10.5)#48 | 37.3%(-3.30)#10,157 |
| 49. | Bay St Louis | 33.9% | 23.5%(+10.4)#49 | 37.3%(-3.40)#10,206 |
| 50. | Ocean Springs | 33.5% | 23.5%(+10.0)#50 | 37.3%(-3.80)#10,370 |
| 51. | Saltillo | 33.2% | 23.5%(+9.70)#51 | 37.3%(-4.10)#10,566 |
| 52. | Southaven | 32.9% | 23.5%(+9.40)#52 | 37.3%(-4.40)#10,688 |
| 53. | Beechwood | 32.5% | 23.5%(+9.00)#53 | 37.3%(-4.80)#10,888 |
| 54. | Lyon | 32.5% | 23.5%(+9.00)#54 | 37.3%(-4.80)#10,912 |
| 55. | Hickory | 32.4% | 23.5%(+8.90)#55 | 37.3%(-4.90)#10,962 |
| 56. | New Hamilton | 32.3% | 23.5%(+8.80)#56 | 37.3%(-5.00)#11,004 |
| 57. | Cleary | 31.5% | 23.5%(+8.00)#57 | 37.3%(-5.80)#11,379 |
| 58. | Robinhood | 31.4% | 23.5%(+7.90)#58 | 37.3%(-5.90)#11,434 |
| 59. | Inverness | 31.4% | 23.5%(+7.90)#59 | 37.3%(-5.90)#11,438 |
| 60. | Bolton | 31.4% | 23.5%(+7.90)#60 | 37.3%(-5.90)#11,439 |
| 61. | Arkabutla | 31.4% | 23.5%(+7.90)#61 | 37.3%(-5.90)#11,450 |
| 62. | Tupelo | 31.0% | 23.5%(+7.50)#62 | 37.3%(-6.30)#11,597 |
| 63. | Collinsville | 30.6% | 23.5%(+7.10)#63 | 37.3%(-6.70)#11,849 |
| 64. | Waveland | 30.5% | 23.5%(+7.00)#64 | 37.3%(-6.80)#11,893 |
| 65. | Kiln | 30.5% | 23.5%(+7.00)#65 | 37.3%(-6.80)#11,904 |
| 66. | Oak Grove | 30.5% | 23.5%(+7.00)#66 | 37.3%(-6.80)#11,908 |
| 67. | Pass Christian | 30.4% | 23.5%(+6.90)#67 | 37.3%(-6.90)#11,937 |
| 68. | Woodland | 30.4% | 23.5%(+6.90)#68 | 37.3%(-6.90)#11,973 |
| 69. | Caledonia | 30.2% | 23.5%(+6.70)#69 | 37.3%(-7.10)#12,069 |
| 70. | Enterprise | 30.2% | 23.5%(+6.70)#70 | 37.3%(-7.10)#12,083 |
| 71. | Mantachie | 30.0% | 23.5%(+6.50)#71 | 37.3%(-7.30)#12,171 |
| 72. | Bond | 30.0% | 23.5%(+6.50)#72 | 37.3%(-7.30)#12,212 |
| 73. | Batesville | 29.8% | 23.5%(+6.30)#73 | 37.3%(-7.50)#12,296 |
| 74. | West | 29.8% | 23.5%(+6.30)#74 | 37.3%(-7.50)#12,337 |
| 75. | Benoit | 29.3% | 23.5%(+5.80)#75 | 37.3%(-8.00)#12,597 |
| 76. | Taylorsville | 29.2% | 23.5%(+5.70)#76 | 37.3%(-8.10)#12,632 |
| 77. | Agricola | 29.1% | 23.5%(+5.60)#77 | 37.3%(-8.20)#12,697 |
| 78. | Long Beach | 29.0% | 23.5%(+5.50)#78 | 37.3%(-8.30)#12,718 |
| 79. | Thaxton | 29.0% | 23.5%(+5.50)#79 | 37.3%(-8.30)#12,760 |
| 80. | Taylor | 28.7% | 23.5%(+5.20)#80 | 37.3%(-8.60)#12,975 |
| 81. | Oxford | 28.5% | 23.5%(+5.00)#81 | 37.3%(-8.80)#13,071 |
| 82. | Ridgeland | 28.3% | 23.5%(+4.80)#82 | 37.3%(-9.00)#13,204 |
| 83. | Walthall | 28.3% | 23.5%(+4.80)#83 | 37.3%(-9.00)#13,254 |
| 84. | Lyman | 28.0% | 23.5%(+4.50)#84 | 37.3%(-9.30)#13,408 |
| 85. | Learned | 28.0% | 23.5%(+4.50)#85 | 37.3%(-9.30)#13,450 |
| 86. | Mathiston | 27.8% | 23.5%(+4.30)#86 | 37.3%(-9.50)#13,549 |
| 87. | Guntown | 27.5% | 23.5%(+4.00)#87 | 37.3%(-9.80)#13,723 |
| 88. | Pope | 27.3% | 23.5%(+3.80)#88 | 37.3%(-10.00)#13,878 |
| 89. | Leland | 27.2% | 23.5%(+3.70)#89 | 37.3%(-10.1)#13,920 |
| 90. | Pearl | 27.1% | 23.5%(+3.60)#90 | 37.3%(-10.2)#13,973 |
| 91. | Crystal Springs | 27.0% | 23.5%(+3.50)#91 | 37.3%(-10.3)#14,052 |
| 92. | Raymond | 26.8% | 23.5%(+3.30)#92 | 37.3%(-10.5)#14,214 |
| 93. | Glen | 26.3% | 23.5%(+2.80)#93 | 37.3%(-11.0)#14,561 |
| 94. | Hatley | 26.2% | 23.5%(+2.70)#94 | 37.3%(-11.1)#14,625 |
| 95. | D Iberville | 26.1% | 23.5%(+2.60)#95 | 37.3%(-11.2)#14,659 |
| 96. | Petal | 26.1% | 23.5%(+2.60)#96 | 37.3%(-11.2)#14,661 |
| 97. | Senatobia | 26.0% | 23.5%(+2.50)#97 | 37.3%(-11.3)#14,737 |
| 98. | State Line | 26.0% | 23.5%(+2.50)#98 | 37.3%(-11.3)#14,764 |
| 99. | Gulf Park Estates | 25.9% | 23.5%(+2.40)#99 | 37.3%(-11.4)#14,813 |
| 100. | Ecru | 25.8% | 23.5%(+2.30)#100 | 37.3%(-11.5)#14,901 |
Common Questions
What are the Top 10 Cities with the Highest Percentage of Households with Income Above $100,000 in Mississippi?
Top 10 Cities with the Highest Percentage of Households with Income Above $100,000 in Mississippi are:
#1
100.0%
#2
83.1%
#3
76.9%
#4
71.4%
#5
61.1%
#6
58.6%
#7
47.9%
#8
47.2%
#9
46.1%
#10
45.2%
What city has the Highest Percentage of Households with Income Above $100,000 in Mississippi?
Mississippi State has the Highest Percentage of Households with Income Above $100,000 in Mississippi with 100.0%.
What is the Percentage of Households with Income Above $100,000 in the State of Mississippi?
Percentage of Households with Income Above $100,000 in Mississippi is 23.5%.
What is the Percentage of Households with Income Above $100,000 in the United States?
Percentage of Households with Income Above $100,000 in the United States is 37.3%.