Cities with the Highest Percentage of Households with Income Above $100,000 in New Jersey
RELATED REPORTS & OPTIONS
Household Income | $100k+
New Jersey
Compare Cities
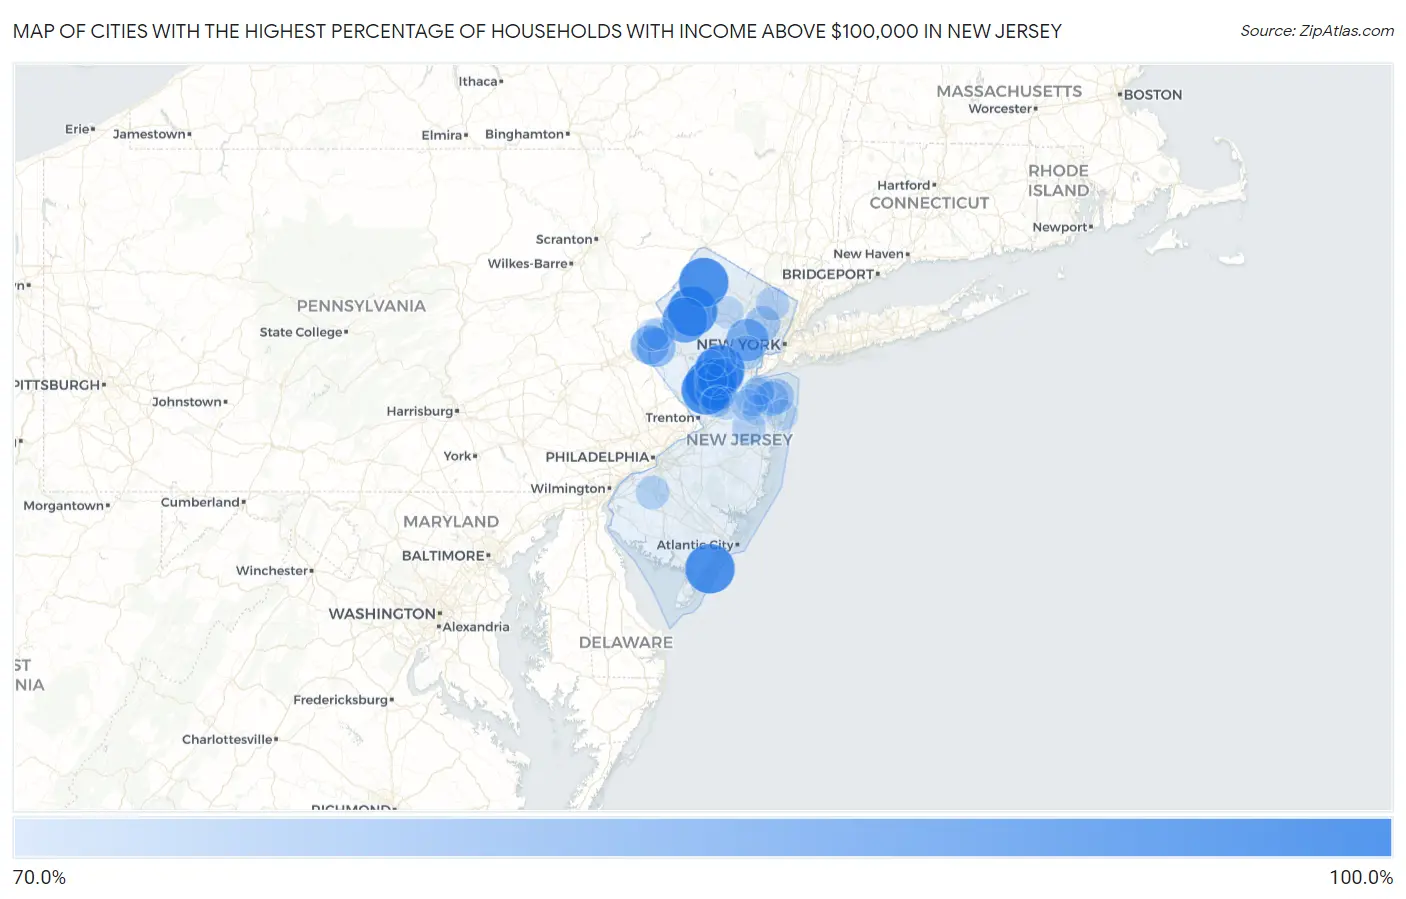
Map of Cities with the Highest Percentage of Households with Income Above $100,000 in New Jersey
0.0%
100.0%
Cities with the Highest Percentage of Households with Income Above $100,000 in New Jersey
| City | Households with Income > $100k | vs State | vs National | |
| 1. | Harlingen | 100.0% | 48.7%(+51.3)#1 | 37.3%(+62.7)#9 |
| 2. | Lamington | 100.0% | 48.7%(+51.3)#2 | 37.3%(+62.7)#20 |
| 3. | Strathmere | 100.0% | 48.7%(+51.3)#3 | 37.3%(+62.7)#48 |
| 4. | Blawenburg | 100.0% | 48.7%(+51.3)#4 | 37.3%(+62.7)#53 |
| 5. | Allamuchy | 100.0% | 48.7%(+51.3)#5 | 37.3%(+62.7)#61 |
| 6. | Leeds Point | 100.0% | 48.7%(+51.3)#6 | 37.3%(+62.7)#83 |
| 7. | Zarephath | 100.0% | 48.7%(+51.3)#7 | 37.3%(+62.7)#85 |
| 8. | Ross Corner | 100.0% | 48.7%(+51.3)#8 | 37.3%(+62.7)#90 |
| 9. | Tavistock Borough | 100.0% | 48.7%(+51.3)#9 | 37.3%(+62.7)#181 |
| 10. | Vienna | 93.8% | 48.7%(+45.1)#10 | 37.3%(+56.5)#212 |
| 11. | Forsgate | 90.7% | 48.7%(+42.0)#11 | 37.3%(+53.4)#239 |
| 12. | Short Hills | 89.4% | 48.7%(+40.7)#12 | 37.3%(+52.1)#267 |
| 13. | Washington Crossing | 89.1% | 48.7%(+40.4)#13 | 37.3%(+51.8)#272 |
| 14. | East Rocky Hill | 88.0% | 48.7%(+39.3)#14 | 37.3%(+50.7)#288 |
| 15. | Blackwells Mills | 86.8% | 48.7%(+38.1)#15 | 37.3%(+49.5)#307 |
| 16. | Glen Ridge Borough | 85.7% | 48.7%(+37.0)#16 | 37.3%(+48.4)#326 |
| 17. | Nesco | 85.4% | 48.7%(+36.7)#17 | 37.3%(+48.1)#336 |
| 18. | Fair Haven Borough | 85.0% | 48.7%(+36.3)#18 | 37.3%(+47.7)#342 |
| 19. | North Caldwell Borough | 84.6% | 48.7%(+35.9)#19 | 37.3%(+47.3)#353 |
| 20. | Ho Ho Kus Borough | 84.5% | 48.7%(+35.8)#20 | 37.3%(+47.2)#357 |
| 21. | Greenwich | 84.2% | 48.7%(+35.5)#21 | 37.3%(+46.9)#365 |
| 22. | Delaware Park | 84.1% | 48.7%(+35.4)#22 | 37.3%(+46.8)#370 |
| 23. | Flagtown | 84.0% | 48.7%(+35.3)#23 | 37.3%(+46.7)#372 |
| 24. | Lyons | 83.8% | 48.7%(+35.1)#24 | 37.3%(+46.5)#376 |
| 25. | Upper Saddle River Borough | 83.4% | 48.7%(+34.7)#25 | 37.3%(+46.1)#391 |
| 26. | Mountain Lakes Borough | 83.4% | 48.7%(+34.7)#26 | 37.3%(+46.1)#392 |
| 27. | Marshallville | 83.0% | 48.7%(+34.3)#27 | 37.3%(+45.7)#420 |
| 28. | Haworth Borough | 82.0% | 48.7%(+33.3)#28 | 37.3%(+44.7)#456 |
| 29. | Packanack Lake | 81.8% | 48.7%(+33.1)#29 | 37.3%(+44.5)#465 |
| 30. | Essex Fells Borough | 81.8% | 48.7%(+33.1)#30 | 37.3%(+44.5)#466 |
| 31. | Middlebush | 81.7% | 48.7%(+33.0)#31 | 37.3%(+44.4)#470 |
| 32. | Rumson Borough | 81.6% | 48.7%(+32.9)#32 | 37.3%(+44.3)#472 |
| 33. | Glen Rock Borough | 81.2% | 48.7%(+32.5)#33 | 37.3%(+43.9)#490 |
| 34. | Tenafly Borough | 80.9% | 48.7%(+32.2)#34 | 37.3%(+43.6)#505 |
| 35. | Auburn | 80.6% | 48.7%(+31.9)#35 | 37.3%(+43.3)#522 |
| 36. | Liberty Corner | 80.1% | 48.7%(+31.4)#36 | 37.3%(+42.8)#542 |
| 37. | Llewellyn Park | 80.1% | 48.7%(+31.4)#37 | 37.3%(+42.8)#545 |
| 38. | Upper Montclair | 79.7% | 48.7%(+31.0)#38 | 37.3%(+42.4)#563 |
| 39. | Fairview | 79.5% | 48.7%(+30.8)#39 | 37.3%(+42.2)#578 |
| 40. | Sea Girt Borough | 79.3% | 48.7%(+30.6)#40 | 37.3%(+42.0)#593 |
| 41. | Port Elizabeth | 79.2% | 48.7%(+30.5)#41 | 37.3%(+41.9)#600 |
| 42. | Old Tappan Borough | 79.0% | 48.7%(+30.3)#42 | 37.3%(+41.7)#610 |
| 43. | Neshanic Station | 78.9% | 48.7%(+30.2)#43 | 37.3%(+41.6)#618 |
| 44. | Lincroft | 78.7% | 48.7%(+30.0)#44 | 37.3%(+41.4)#633 |
| 45. | Mantoloking Borough | 78.6% | 48.7%(+29.9)#45 | 37.3%(+41.3)#640 |
| 46. | Chatham Borough | 78.4% | 48.7%(+29.7)#46 | 37.3%(+41.1)#649 |
| 47. | Millington | 78.4% | 48.7%(+29.7)#47 | 37.3%(+41.1)#651 |
| 48. | Little Silver Borough | 78.3% | 48.7%(+29.6)#48 | 37.3%(+41.0)#654 |
| 49. | Pottersville | 78.3% | 48.7%(+29.6)#49 | 37.3%(+41.0)#659 |
| 50. | Troy Hills | 78.2% | 48.7%(+29.5)#50 | 37.3%(+40.9)#663 |
| 51. | Alpine Borough | 78.2% | 48.7%(+29.5)#51 | 37.3%(+40.9)#665 |
| 52. | Rockleigh Borough | 78.2% | 48.7%(+29.5)#52 | 37.3%(+40.9)#667 |
| 53. | Pine Brook | 78.1% | 48.7%(+29.4)#53 | 37.3%(+40.8)#672 |
| 54. | Morganville | 78.0% | 48.7%(+29.3)#54 | 37.3%(+40.7)#681 |
| 55. | Brookside | 78.0% | 48.7%(+29.3)#55 | 37.3%(+40.7)#683 |
| 56. | Newfoundland | 77.9% | 48.7%(+29.2)#56 | 37.3%(+40.6)#692 |
| 57. | Mendham Borough | 77.8% | 48.7%(+29.1)#57 | 37.3%(+40.5)#698 |
| 58. | Millstone Borough | 77.8% | 48.7%(+29.1)#58 | 37.3%(+40.5)#703 |
| 59. | Westfield | 77.6% | 48.7%(+28.9)#59 | 37.3%(+40.3)#713 |
| 60. | Hewitt | 77.6% | 48.7%(+28.9)#60 | 37.3%(+40.3)#717 |
| 61. | Haddonfield Borough | 77.2% | 48.7%(+28.5)#61 | 37.3%(+39.9)#744 |
| 62. | Richwood | 77.1% | 48.7%(+28.4)#62 | 37.3%(+39.8)#756 |
| 63. | Pines Lake | 77.1% | 48.7%(+28.4)#63 | 37.3%(+39.8)#758 |
| 64. | Ridgewood | 77.0% | 48.7%(+28.3)#64 | 37.3%(+39.7)#767 |
| 65. | Vista Center | 76.8% | 48.7%(+28.1)#65 | 37.3%(+39.5)#777 |
| 66. | Martinsville | 75.8% | 48.7%(+27.1)#66 | 37.3%(+38.5)#828 |
| 67. | Franklin Lakes Borough | 75.8% | 48.7%(+27.1)#67 | 37.3%(+38.5)#829 |
| 68. | Woodcliff Lake Borough | 75.8% | 48.7%(+27.1)#68 | 37.3%(+38.5)#832 |
| 69. | Belle Mead | 75.6% | 48.7%(+26.9)#69 | 37.3%(+38.3)#843 |
| 70. | Oradell Borough | 75.4% | 48.7%(+26.7)#70 | 37.3%(+38.1)#860 |
| 71. | Robertsville | 75.1% | 48.7%(+26.4)#71 | 37.3%(+37.8)#881 |
| 72. | Brainards | 75.0% | 48.7%(+26.3)#72 | 37.3%(+37.7)#899 |
| 73. | Hutchinson | 75.0% | 48.7%(+26.3)#73 | 37.3%(+37.7)#901 |
| 74. | White Meadow Lake | 74.9% | 48.7%(+26.2)#74 | 37.3%(+37.6)#914 |
| 75. | Fanwood Borough | 74.6% | 48.7%(+25.9)#75 | 37.3%(+37.3)#927 |
| 76. | Cranbury | 74.6% | 48.7%(+25.9)#76 | 37.3%(+37.3)#929 |
| 77. | Deans | 74.3% | 48.7%(+25.6)#77 | 37.3%(+37.0)#955 |
| 78. | Bernardsville Borough | 74.2% | 48.7%(+25.5)#78 | 37.3%(+36.9)#961 |
| 79. | Yorketown | 74.1% | 48.7%(+25.4)#79 | 37.3%(+36.8)#967 |
| 80. | Great Notch | 74.0% | 48.7%(+25.3)#80 | 37.3%(+36.7)#977 |
| 81. | Plainsboro Center | 74.0% | 48.7%(+25.3)#81 | 37.3%(+36.7)#979 |
| 82. | East Freehold | 73.8% | 48.7%(+25.1)#82 | 37.3%(+36.5)#997 |
| 83. | Harrington Park Borough | 73.8% | 48.7%(+25.1)#83 | 37.3%(+36.5)#998 |
| 84. | Wanamassa | 73.7% | 48.7%(+25.0)#84 | 37.3%(+36.4)#1,010 |
| 85. | Stirling | 73.7% | 48.7%(+25.0)#85 | 37.3%(+36.4)#1,011 |
| 86. | New Providence Borough | 73.5% | 48.7%(+24.8)#86 | 37.3%(+36.2)#1,023 |
| 87. | Allendale Borough | 73.1% | 48.7%(+24.4)#87 | 37.3%(+35.8)#1,057 |
| 88. | Oceanville | 72.9% | 48.7%(+24.2)#88 | 37.3%(+35.6)#1,079 |
| 89. | Wenonah Borough | 72.8% | 48.7%(+24.1)#89 | 37.3%(+35.5)#1,084 |
| 90. | Morris Plains Borough | 72.7% | 48.7%(+24.0)#90 | 37.3%(+35.4)#1,092 |
| 91. | Saddle River Borough | 72.7% | 48.7%(+24.0)#91 | 37.3%(+35.4)#1,094 |
| 92. | Monroe Manor | 72.7% | 48.7%(+24.0)#92 | 37.3%(+35.4)#1,096 |
| 93. | Bridgewater Center | 72.6% | 48.7%(+23.9)#93 | 37.3%(+35.3)#1,106 |
| 94. | Strathmore | 72.3% | 48.7%(+23.6)#94 | 37.3%(+35.0)#1,124 |
| 95. | Basking Ridge | 72.2% | 48.7%(+23.5)#95 | 37.3%(+34.9)#1,136 |
| 96. | Germania | 72.2% | 48.7%(+23.5)#96 | 37.3%(+34.9)#1,137 |
| 97. | Bradley Gardens | 72.1% | 48.7%(+23.4)#97 | 37.3%(+34.8)#1,144 |
| 98. | Englewood Cliffs Borough | 72.1% | 48.7%(+23.4)#98 | 37.3%(+34.8)#1,146 |
| 99. | Demarest Borough | 72.0% | 48.7%(+23.3)#99 | 37.3%(+34.7)#1,154 |
| 100. | Princeton Junction | 72.0% | 48.7%(+23.3)#100 | 37.3%(+34.7)#1,158 |
Common Questions
What are the Top 10 Cities with the Highest Percentage of Households with Income Above $100,000 in New Jersey?
Top 10 Cities with the Highest Percentage of Households with Income Above $100,000 in New Jersey are:
#1
100.0%
#2
100.0%
#3
100.0%
#4
100.0%
#5
100.0%
#6
100.0%
#7
93.8%
#8
89.4%
#9
88.0%
#10
86.8%
What city has the Highest Percentage of Households with Income Above $100,000 in New Jersey?
Harlingen has the Highest Percentage of Households with Income Above $100,000 in New Jersey with 100.0%.
What is the Percentage of Households with Income Above $100,000 in the State of New Jersey?
Percentage of Households with Income Above $100,000 in New Jersey is 48.7%.
What is the Percentage of Households with Income Above $100,000 in the United States?
Percentage of Households with Income Above $100,000 in the United States is 37.3%.