Cities with the Highest Percentage of Households with Income Above $100,000 in Iowa
RELATED REPORTS & OPTIONS
Household Income | $100k+
Iowa
Compare Cities
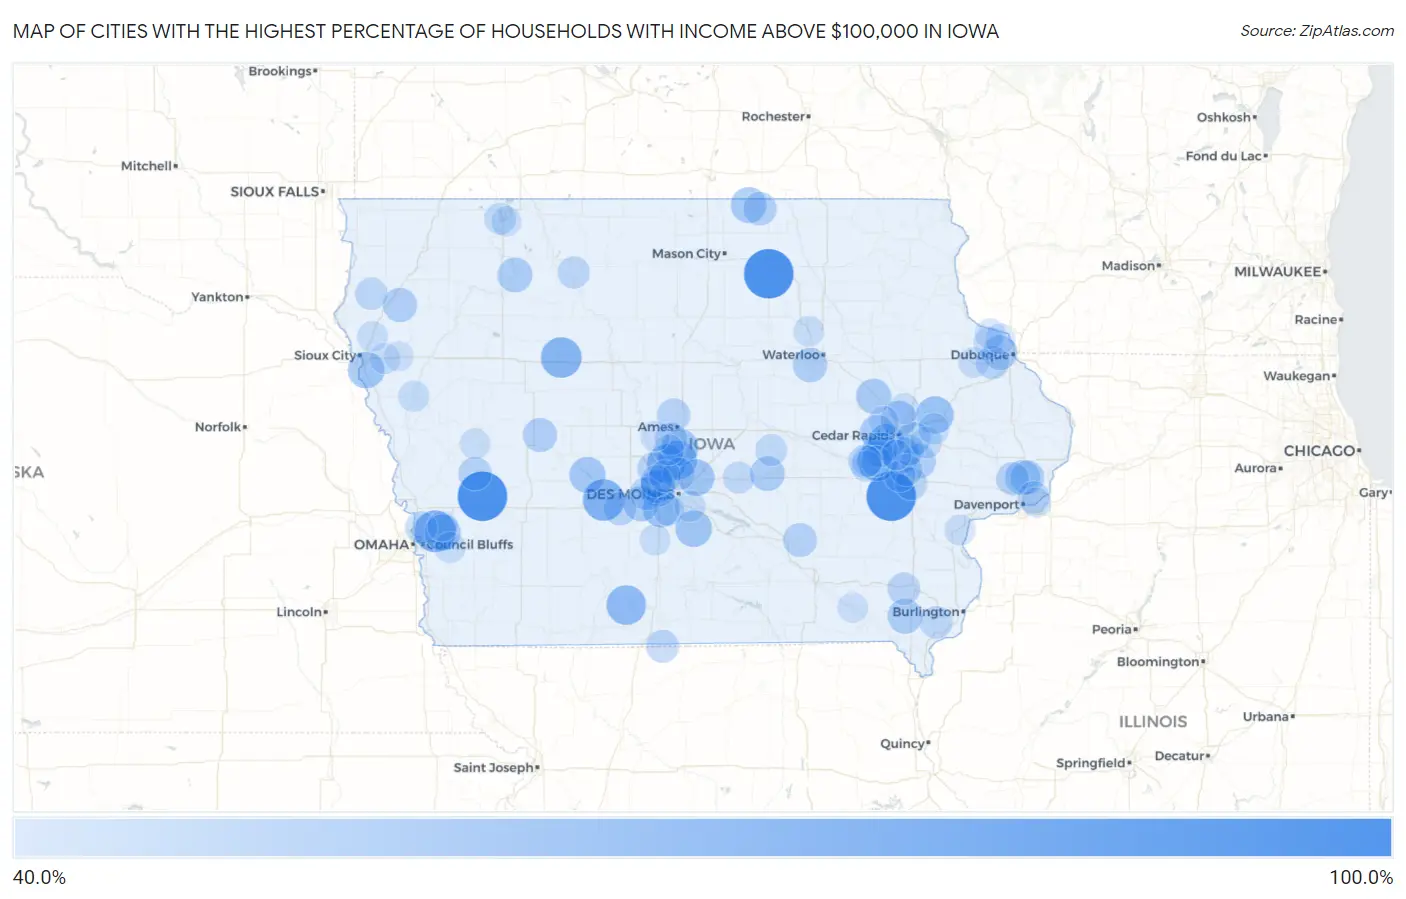
Map of Cities with the Highest Percentage of Households with Income Above $100,000 in Iowa
0.0%
100.0%
Cities with the Highest Percentage of Households with Income Above $100,000 in Iowa
| City | Households with Income > $100k | vs State | vs National | |
| 1. | Frytown | 100.0% | 32.9%(+67.1)#1 | 37.3%(+62.7)#131 |
| 2. | Roseville | 100.0% | 32.9%(+67.1)#2 | 37.3%(+62.7)#177 |
| 3. | Plainview | 100.0% | 32.9%(+67.1)#3 | 37.3%(+62.7)#183 |
| 4. | Corley | 100.0% | 32.9%(+67.1)#4 | 37.3%(+62.7)#189 |
| 5. | Weston | 77.1% | 32.9%(+44.2)#5 | 37.3%(+39.8)#763 |
| 6. | Diamondhead Lake | 76.5% | 32.9%(+43.6)#6 | 37.3%(+39.2)#791 |
| 7. | Twin Lakes | 73.9% | 32.9%(+41.0)#7 | 37.3%(+36.6)#993 |
| 8. | Kent Estates | 71.6% | 32.9%(+38.7)#8 | 37.3%(+34.3)#1,197 |
| 9. | East Amana | 71.4% | 32.9%(+38.5)#9 | 37.3%(+34.1)#1,217 |
| 10. | Oak Hills | 71.1% | 32.9%(+38.2)#10 | 37.3%(+33.8)#1,246 |
| 11. | Sun Valley Lake | 70.5% | 32.9%(+37.6)#11 | 37.3%(+33.2)#1,291 |
| 12. | Alleman | 69.2% | 32.9%(+36.3)#12 | 37.3%(+31.9)#1,420 |
| 13. | Polk City | 67.8% | 32.9%(+34.9)#13 | 37.3%(+30.5)#1,604 |
| 14. | Stone City | 64.3% | 32.9%(+31.4)#14 | 37.3%(+27.0)#2,034 |
| 15. | Cumming | 63.6% | 32.9%(+30.7)#15 | 37.3%(+26.3)#2,125 |
| 16. | Huxley | 63.2% | 32.9%(+30.3)#16 | 37.3%(+25.9)#2,176 |
| 17. | Sergeant Bluff | 62.5% | 32.9%(+29.6)#17 | 37.3%(+25.2)#2,286 |
| 18. | Bondurant | 62.3% | 32.9%(+29.4)#18 | 37.3%(+25.0)#2,328 |
| 19. | Shueyville | 62.2% | 32.9%(+29.3)#19 | 37.3%(+24.9)#2,357 |
| 20. | Ackworth | 61.8% | 32.9%(+28.9)#20 | 37.3%(+24.5)#2,428 |
| 21. | Fairfax | 61.7% | 32.9%(+28.8)#21 | 37.3%(+24.4)#2,438 |
| 22. | Mcclelland | 61.3% | 32.9%(+28.4)#22 | 37.3%(+24.0)#2,520 |
| 23. | Lake Panorama | 60.8% | 32.9%(+27.9)#23 | 37.3%(+23.5)#2,604 |
| 24. | Clive | 60.1% | 32.9%(+27.2)#24 | 37.3%(+22.8)#2,712 |
| 25. | Otranto | 60.0% | 32.9%(+27.1)#25 | 37.3%(+22.7)#2,742 |
| 26. | Robins | 59.6% | 32.9%(+26.7)#26 | 37.3%(+22.3)#2,815 |
| 27. | Urbana | 58.4% | 32.9%(+25.5)#27 | 37.3%(+21.1)#3,017 |
| 28. | Van Meter | 58.4% | 32.9%(+25.5)#28 | 37.3%(+21.1)#3,018 |
| 29. | Atkins | 58.0% | 32.9%(+25.1)#29 | 37.3%(+20.7)#3,073 |
| 30. | Walford | 57.8% | 32.9%(+24.9)#30 | 37.3%(+20.5)#3,102 |
| 31. | Long Grove | 57.6% | 32.9%(+24.7)#31 | 37.3%(+20.3)#3,139 |
| 32. | Houghton | 57.6% | 32.9%(+24.7)#32 | 37.3%(+20.3)#3,144 |
| 33. | Gillett Grove | 57.1% | 32.9%(+24.2)#33 | 37.3%(+19.8)#3,227 |
| 34. | Oakland Acres | 56.8% | 32.9%(+23.9)#34 | 37.3%(+19.5)#3,281 |
| 35. | Asbury | 56.3% | 32.9%(+23.4)#35 | 37.3%(+19.0)#3,368 |
| 36. | Solon | 56.2% | 32.9%(+23.3)#36 | 37.3%(+18.9)#3,381 |
| 37. | Hudson | 55.9% | 32.9%(+23.0)#37 | 37.3%(+18.6)#3,437 |
| 38. | Oyens | 55.8% | 32.9%(+22.9)#38 | 37.3%(+18.5)#3,469 |
| 39. | Urbandale | 55.5% | 32.9%(+22.6)#39 | 37.3%(+18.2)#3,504 |
| 40. | Willey | 55.0% | 32.9%(+22.1)#40 | 37.3%(+17.7)#3,616 |
| 41. | Keomah Village | 54.7% | 32.9%(+21.8)#41 | 37.3%(+17.4)#3,679 |
| 42. | Park View | 54.5% | 32.9%(+21.6)#42 | 37.3%(+17.2)#3,710 |
| 43. | Bertram | 54.1% | 32.9%(+21.2)#43 | 37.3%(+16.8)#3,802 |
| 44. | Westphalia | 53.3% | 32.9%(+20.4)#44 | 37.3%(+16.0)#3,971 |
| 45. | Toeterville | 53.3% | 32.9%(+20.4)#45 | 37.3%(+16.0)#3,974 |
| 46. | Peosta | 53.0% | 32.9%(+20.1)#46 | 37.3%(+15.7)#4,013 |
| 47. | Gilbert | 52.8% | 32.9%(+19.9)#47 | 37.3%(+15.5)#4,064 |
| 48. | Granger | 52.6% | 32.9%(+19.7)#48 | 37.3%(+15.3)#4,103 |
| 49. | Waukee | 52.5% | 32.9%(+19.6)#49 | 37.3%(+15.2)#4,111 |
| 50. | Earlham | 52.5% | 32.9%(+19.6)#50 | 37.3%(+15.2)#4,126 |
| 51. | Donahue | 52.5% | 32.9%(+19.6)#51 | 37.3%(+15.2)#4,130 |
| 52. | West Amana | 52.5% | 32.9%(+19.6)#52 | 37.3%(+15.2)#4,132 |
| 53. | Pleasanton | 51.7% | 32.9%(+18.8)#53 | 37.3%(+14.4)#4,326 |
| 54. | Westwood | 51.2% | 32.9%(+18.3)#54 | 37.3%(+13.9)#4,447 |
| 55. | University Heights | 51.1% | 32.9%(+18.2)#55 | 37.3%(+13.8)#4,458 |
| 56. | Denmark | 51.0% | 32.9%(+18.1)#56 | 37.3%(+13.7)#4,482 |
| 57. | Kelley | 50.9% | 32.9%(+18.0)#57 | 37.3%(+13.6)#4,509 |
| 58. | Ankeny | 50.7% | 32.9%(+17.8)#58 | 37.3%(+13.4)#4,530 |
| 59. | Bettendorf | 50.3% | 32.9%(+17.4)#59 | 37.3%(+13.0)#4,610 |
| 60. | North Liberty | 50.2% | 32.9%(+17.3)#60 | 37.3%(+12.9)#4,631 |
| 61. | Crescent | 50.1% | 32.9%(+17.2)#61 | 37.3%(+12.8)#4,679 |
| 62. | Grimes | 50.0% | 32.9%(+17.1)#62 | 37.3%(+12.7)#4,685 |
| 63. | Craig | 50.0% | 32.9%(+17.1)#63 | 37.3%(+12.7)#4,732 |
| 64. | Rodman | 50.0% | 32.9%(+17.1)#64 | 37.3%(+12.7)#4,760 |
| 65. | Johnston | 49.4% | 32.9%(+16.5)#65 | 37.3%(+12.1)#4,895 |
| 66. | Gilman | 49.0% | 32.9%(+16.1)#66 | 37.3%(+11.7)#5,014 |
| 67. | Lambs Grove | 49.0% | 32.9%(+16.1)#67 | 37.3%(+11.7)#5,017 |
| 68. | Wahpeton | 48.4% | 32.9%(+15.5)#68 | 37.3%(+11.1)#5,157 |
| 69. | Mount Vernon | 48.1% | 32.9%(+15.2)#69 | 37.3%(+10.8)#5,216 |
| 70. | Norwalk | 47.8% | 32.9%(+14.9)#70 | 37.3%(+10.5)#5,294 |
| 71. | Tiffin | 47.8% | 32.9%(+14.9)#71 | 37.3%(+10.5)#5,300 |
| 72. | Carlisle | 47.1% | 32.9%(+14.2)#72 | 37.3%(+9.80)#5,513 |
| 73. | Smithland | 47.1% | 32.9%(+14.2)#73 | 37.3%(+9.80)#5,527 |
| 74. | Ely | 46.9% | 32.9%(+14.0)#74 | 37.3%(+9.60)#5,571 |
| 75. | Treynor | 46.8% | 32.9%(+13.9)#75 | 37.3%(+9.50)#5,606 |
| 76. | South Amana | 46.8% | 32.9%(+13.9)#76 | 37.3%(+9.50)#5,616 |
| 77. | Amana | 46.7% | 32.9%(+13.8)#77 | 37.3%(+9.40)#5,640 |
| 78. | Martelle | 46.7% | 32.9%(+13.8)#78 | 37.3%(+9.40)#5,643 |
| 79. | St Charles | 46.5% | 32.9%(+13.6)#79 | 37.3%(+9.20)#5,695 |
| 80. | Fruitland | 46.4% | 32.9%(+13.5)#80 | 37.3%(+9.10)#5,715 |
| 81. | Alburnett | 46.4% | 32.9%(+13.5)#81 | 37.3%(+9.10)#5,719 |
| 82. | Buck Grove | 46.2% | 32.9%(+13.3)#82 | 37.3%(+8.90)#5,793 |
| 83. | Janesville | 45.9% | 32.9%(+13.0)#83 | 37.3%(+8.60)#5,862 |
| 84. | Farley | 45.7% | 32.9%(+12.8)#84 | 37.3%(+8.40)#5,915 |
| 85. | Slater | 45.7% | 32.9%(+12.8)#85 | 37.3%(+8.40)#5,918 |
| 86. | Lawton | 45.7% | 32.9%(+12.8)#86 | 37.3%(+8.40)#5,922 |
| 87. | High Amana | 45.7% | 32.9%(+12.8)#87 | 37.3%(+8.40)#5,930 |
| 88. | Hinton | 45.6% | 32.9%(+12.7)#88 | 37.3%(+8.30)#5,953 |
| 89. | Rickardsville | 45.6% | 32.9%(+12.7)#89 | 37.3%(+8.30)#5,958 |
| 90. | Douds | 45.5% | 32.9%(+12.6)#90 | 37.3%(+8.20)#5,986 |
| 91. | Balltown | 45.5% | 32.9%(+12.6)#91 | 37.3%(+8.20)#5,987 |
| 92. | Arnolds Park | 45.1% | 32.9%(+12.2)#92 | 37.3%(+7.80)#6,090 |
| 93. | Sherrill | 45.1% | 32.9%(+12.2)#93 | 37.3%(+7.80)#6,099 |
| 94. | Palo | 45.0% | 32.9%(+12.1)#94 | 37.3%(+7.70)#6,123 |
| 95. | Swisher | 45.0% | 32.9%(+12.1)#95 | 37.3%(+7.70)#6,124 |
| 96. | Luther | 45.0% | 32.9%(+12.1)#96 | 37.3%(+7.70)#6,132 |
| 97. | Lowell | 45.0% | 32.9%(+12.1)#97 | 37.3%(+7.70)#6,134 |
| 98. | Underwood | 44.8% | 32.9%(+11.9)#98 | 37.3%(+7.50)#6,180 |
| 99. | Moville | 44.2% | 32.9%(+11.3)#99 | 37.3%(+6.90)#6,356 |
| 100. | Riverdale | 44.2% | 32.9%(+11.3)#100 | 37.3%(+6.90)#6,362 |
Common Questions
What are the Top 10 Cities with the Highest Percentage of Households with Income Above $100,000 in Iowa?
Top 10 Cities with the Highest Percentage of Households with Income Above $100,000 in Iowa are:
#1
100.0%
#2
100.0%
#3
100.0%
#4
77.1%
#5
76.5%
#6
73.9%
#7
71.4%
#8
70.5%
#9
69.2%
#10
67.8%
What city has the Highest Percentage of Households with Income Above $100,000 in Iowa?
Frytown has the Highest Percentage of Households with Income Above $100,000 in Iowa with 100.0%.
What is the Percentage of Households with Income Above $100,000 in the State of Iowa?
Percentage of Households with Income Above $100,000 in Iowa is 32.9%.
What is the Percentage of Households with Income Above $100,000 in the United States?
Percentage of Households with Income Above $100,000 in the United States is 37.3%.